Article

Planting Rice at Monsoon Onset Could Mitigate the Impact of Temperature Stress on Rice–Wheat Systems of Bihar, India

1
International Maize and Wheat Improvement Center (CIMMYT), Texcoco 56237, Mexico
2
International Maize and Wheat Improvement Center (CIMMYT), Kathmandu 44700, Nepal
3
Adaptive Cropping Systems Laboratory, USDA-Agricultural Research Service, Beltsville, MD 20705, USA
4
Department of Primary Industries and Regional Development, Northam 6401, Australia
*
Author to whom correspondence should be addressed.
Atmosphere 2023, 14(1), 40; https://doi.org/10.3390/atmos14010040
Submission received: 1 November 2022 / Revised: 14 December 2022 / Accepted: 21 December 2022 / Published: 26 December 2022

Abstract

:
The rice–wheat rotation is the dominant cropping system in Bihar, where food security of the rural population depends heavily on the production of rice and wheat. In Bihar, farmers plant rice after the first significant rains, and climatic shocks induced by low temperatures and terminal heat stress at the end of the corresponding season can significantly affect rice and wheat yields. The present work evaluates the benefit of using an earlier date for planting rice, following the monsoon onset, in reducing thermal stress on rice–wheat systems. High-resolution gridded crop simulations using the APSIM model were performed to simulate potential yields using the monsoon onset and the farmers’ practice as planting dates. The monsoon onset was calculated using an agronomic definition, and farmers’ practice dates were estimated using satellite data. The results were analyzed in terms of planting dates, yields, and the incidence of temperature stress on rice and wheat by means of the APSIM yields limiting factors. The results show that the rice planting and harvest dates using the monsoon onset are, in general, 20–30 days earlier, which translates into higher and more stable potential yields, which can be up to 50% higher in wheat and 29% in rice. The incidence of thermal stress can be, on average, 12% lower in rice and 25% in wheat. These results can help design mitigation strategies for the impacts of temperature-induced shock events in the context of the advances in sub-seasonal and seasonal forecasting, targeting climate services for farmers in Bihar.

1. Introduction

Agriculture is a vitally important sector for the dominant rural population of North India and in general over the Indo-Gangetic Plains (IGP) of South Asia, sustaining the local economy, employment, and livelihoods. This region is a major food supply for India, being extremely important for food security, providing staples such as rice and wheat to the rest of the country, among other cereals and vegetables [1]. However, the steady population increase and the existing environmental stressors impose multiple challenges to the sustainable food production and security in South Asia [2]. Rice–wheat corresponds to the main cropping system in the IGP, which is grown in a crop rotation that begins with the rice seedlings sown in seedbeds, which are subsequently planted in the field (transplanting) after the arrival of the monsoon rains (kharif season). Rice is followed by wheat cultivation during the dry season in winter (rabi season). A total area of about 13.5 million of hectares sustain this system, corresponding to about 50% of all grains produced in India [3]. However, a slowdown in the increase in productivity of the rice–wheat systems has been observed in the last decades, which has generated concern for the food security in the region, so new strategies to counteract this decline in productivity seem necessary [4].
Important differences exist between the West, Central, and East area of the Indian IGP in terms of climate [5] and soil [6], as well as socioeconomic features such as rural livelihoods [7]. As a consequence of lower access to relevant inputs such as irrigation and fertilizers, these differences translate into a higher wheat and rice yield gaps over the Eastern IGP [7,8]. This is the case for the state of Bihar, where poverty and malnutrition prevail on the dominant smallholder rural population, to which agriculture provides employment to near 54% of the total workforce [1]. The dominant rice–wheat cropping system reached a total 5.4 million hectares in 2017–2018 in Bihar, producing a total of 14.2 million tons [3]. However, the growth of the agricultural sector of Bihar has been lower than the rest of the country [1], and factors such as smaller farm sizes, lower crop intensity, and less access to irrigation and agricultural inputs have led to higher yield gaps [8]. In addition, recurring climate-related adverse events such as droughts, floods, and thermal stress due to low and high temperatures during sensitive plant stages have led to high volatility in the productivity of smallholder farmers [1]. The latter is highly relevant given the condition of staple food of rice and wheat and the regional susceptibility to adverse events leading to crop production losses. In this sense, multiple sources of uncertainty and factors affecting crop yields threaten food production, where climate variability and change [9], groundwater depletion [10], and air pollution [11], are major concerns for food security and population.
Much attention has been paid to summer monsoon rains and mean temperature variability over the IGP as determinants of crop productivity [5,12]. However, less emphasis has been placed on the impacts of adverse temperatures on rice–wheat systems and on the development of adaptation strategies based on management decisions. In this regard, relatively low and high temperatures negatively impact the productivity of rice and wheat by affecting multiple physiological processes [13]. For instance, a late onset of the rainy season and the consequent delayed rice planting may lead to rice yield losses due to spikelet sterility induced by low temperatures at the end of the rainy season [14]. Similarly, a delayed wheat harvest due to a late sowing exposes the spikes to high temperatures during the grain filling stage, reducing yields due to the terminal heat stress [15]. Studies performed in the IGP show that earlier wheat sowing can reduce the impact of terminal heat stress [15]; however, to date, regional-scale studies have not been performed in Bihar in order to evaluate the benefits of shifting planting and sowing dates on reducing thermal stresses and the impacts on yields [16].
Previous studies have shown the impact of anomalously low and high temperatures on rice and wheat productivity in Bihar [17], suggesting that adaptation strategies are necessary, since climate change projections over the region show an increase in thermal stress conditions for crops [18]. In this regard, adaptation strategies range from breeding for more tolerant cultivars, the use of short-duration cultivars, irrigation and water management, and the rescheduling of planting dates [15]. The use of irrigation is often adopted to mitigate the impact of thermal stresses, preventing both the strong drop in temperature during sensitive stages of rice, and to maintain relatively low temperatures to avoid terminal heat stress in wheat [13]. Following the latter, this work aims at evaluating the shifting of rice planting date, a practice that farmers can relatively easily adopt, as a strategy to mitigate the impact of temperature-related stress on rice–wheat systems [14]. Earlier rice planting and wheat sowing dates have been recommended to reduce the damage by low temperatures in rice [13] and heat stress on wheat [15], respectively. In the Eastern IGP, the seedbed preparation for rice begins at the time of the first monsoon rains, and seedlings are transplanted to the puddles 20–30 days later. Therefore, a delay in the onset of the monsoon rains can lead to a delay in the planting and harvesting of rice, and, consequently, in the sowing and harvesting of wheat, thus exposing rice to low temperatures [14] and wheat to terminal heat stress during grain filling [15].
In view of the need of regional strategies to adapt rice–wheat systems to climate variability and change over areas of high social and environmental vulnerability, this study aims to assess the use of the monsoon onset as a criterion for rice planting date and its potential benefit in mitigating the impact of climatic shocks due to low and high temperatures stress in rice and wheat, respectively. The study is based on the use of a gridded crop modeling approach to evaluate two rice planting date scenarios: the farmers’ practice, estimated from satellite data, and the monsoon onset, calculated using an agriculturally relevant definition. The two planting scenarios are evaluated in terms of the occurrence of thermal stress conditions and the implications for yields in rice–wheat systems.

2. Materials and Methods
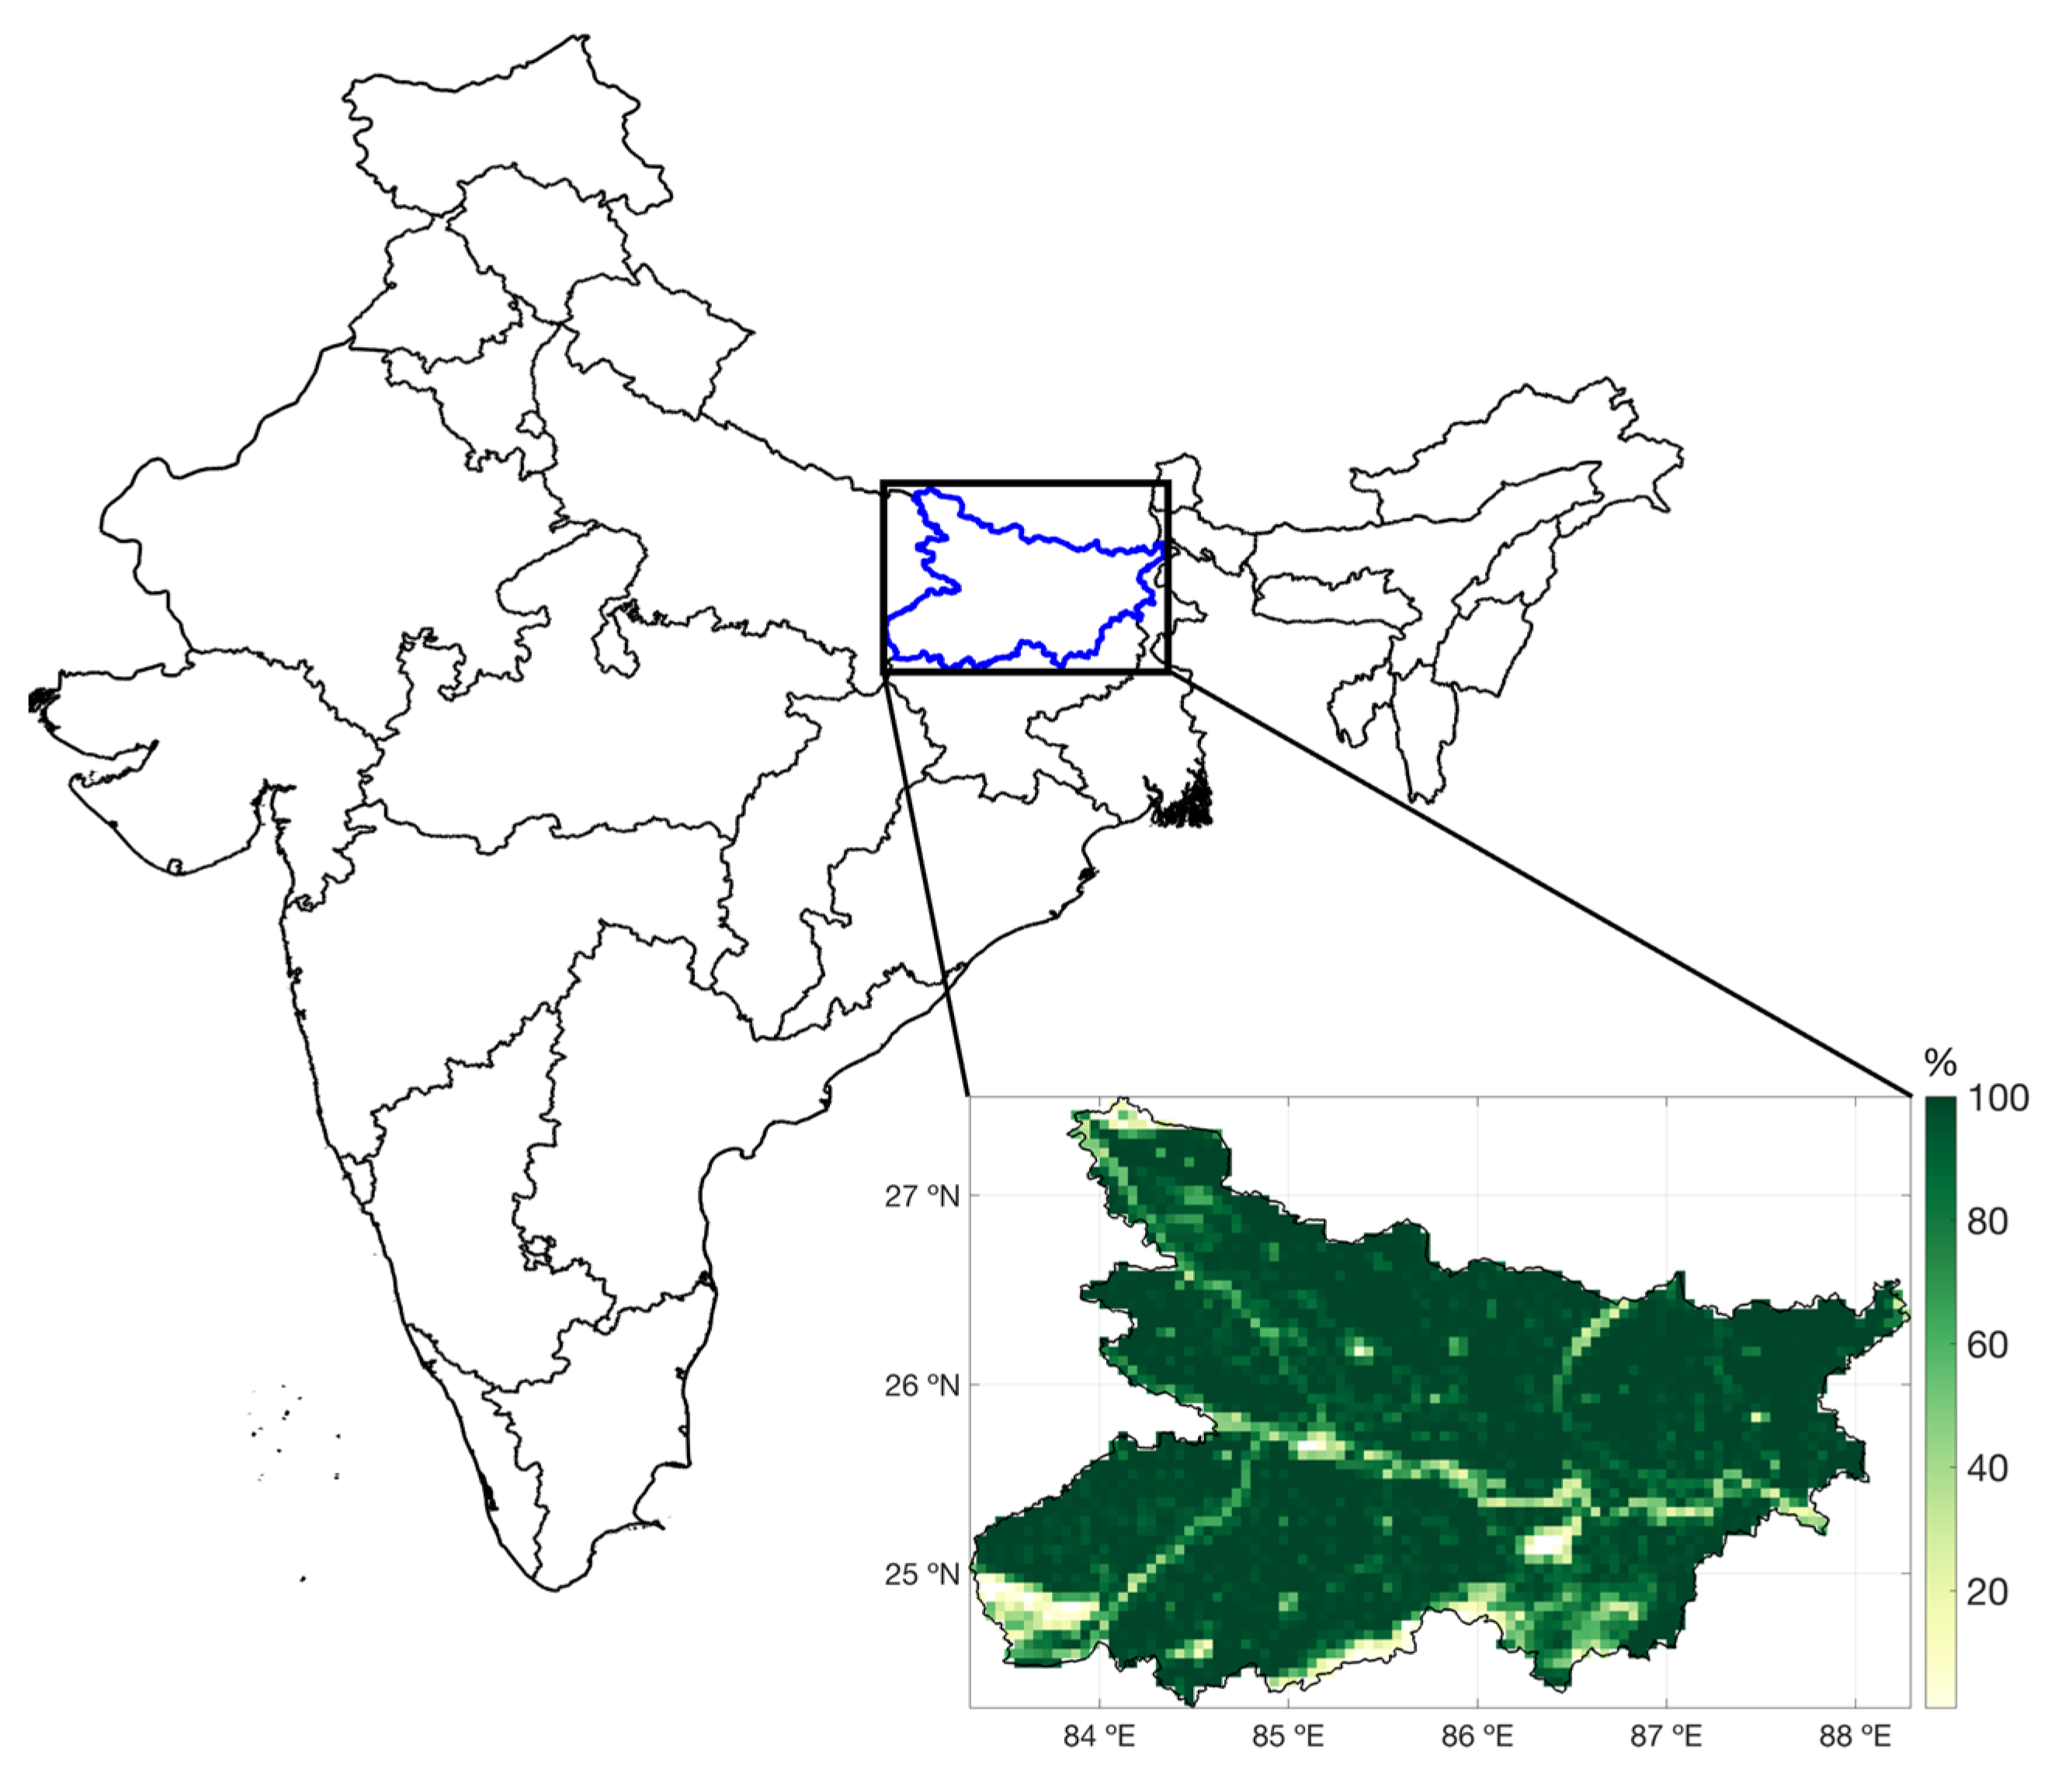
2.1. Study Area

The study area corresponds to the state of Bihar in North India (Figure 1). Located in the eastern IGP, Bihar is a densely populated area where agriculture is the main economic activity and 54.4% of the population lives below the poverty line [3]. Although agriculture in Bihar is diverse, the main cropping system corresponds to the rice–wheat rotation, with cereals being the main staple food. Rice is cultivated over 3.28 million hectares in 2017–2018 [3] during the monsoon or kharif season (June–October), and wheat over 2.04 million hectares in the winter or rabi season (October–April) [3]. In 2017–2018, Bihar produced 7.91 million tons of rice and 5.74 million tons of wheat [3]. Other crops such as maize, oilseeds, and potato are also grown.
The climate in Bihar is characterized monsoon rains in summer that concentrate typically from mid-June to late-September. Climate variability and seasonality are major determinants of agricultural productivity in Bihar. Given the dominant rainfed conditions of rice–wheat systems, though the productivity of the dominant kharif rice is highly determined by anomalies in monsoon rains, temperatures strongly determine the productivity of wheat in winter [12,17]. Although Bihar has a monsoonal climate with well-defined wet and dry seasons, at least three climatic zones have been described: the Northwest, Northeast, and South. These areas differ mainly by the annual amount of rainfall, ranging from 1040 to 1450 mm in the Northwest, from 1200 to 1700 in the Northeast, and from 990 to 1300 in the South [9].

2.2. Datasets

2.2.1. Satellite Normalized Difference Vegetation Index

The Advanced Very High-Resolution Radiometer (AVHRR) Global Inventory Modelling and Mapping Studies (GIMMS) Normalized Difference Vegetation Index (NDVI) NDVI3g v1 product for the period 1982 through 2015 was used to extract phenological records [19]. In the present work, the onset of the growing season was extracted, as explained below. NDVI3g has been widely used in multiple vegetation studies, including trends in greening and phenology [20] and land-use classifications [21]. NDVI3g is generated from AVHRR by incorporating corrections and normalizations to account for atmospheric effects, sensor calibration issues, and orbital drift. Its spatial resolution is 1/12° (~8 km), and it is provided as biweekly (15-days) composites. In this work, the original 1/12° resolution was bilinearly reprojected to a 0.05° grid to match the resolution of the meteorological data, presented below.

2.2.2. Meteorological Data

Daily weather data necessary to run APSIM were extracted from two sources. First, daily precipitation for the period 1982 through 2015 from the Climate Hazards Group Infrared Precipitation with Station data (CHIRPS) [22] V.2 were used. Developed by the Santa Barbara Climate Hazards Group at the University of California, CHIRPS V.2 corresponds to the high-resolution (0.05° × 0.05°) satellite-derived daily rainfall dataset available from 1981 to present. CHIRPS is generated by combining multiple sources, including the Tropical Rainfall Measuring Mission (TRMM) [23] and ground measurements.
Along with CHIRPS, daily meteorological data from the last generation ERA5 atmospheric reanalysis were used. ERA5 is developed by the European Centre for Medium-Range Weather Forecasts (ECMWF) and provides data both at an hourly and monthly time scale with a horizontal resolution of 0.25° × 0.25° (~31 km) for the period 1979 to present, and for single (surface) and multiple vertical levels [24]. In this work, daily maximum and minimum air temperature (2-m above ground) and daily solar radiation data were used, which were aggregated from hourly ERA5 data.

2.2.3. Soil Data

Data from the Global Soil Dataset for use in Earth System Models (GSDE) [25] and the SoilGrids product [26], along with the Harmonized World Soil Database [27], were used. These datasets provide static information on soil physical (textures, bulk density) and chemical properties (total N, organic C), among other parameters necessary for crop modeling. A full list of soil parameters for APSIM simulations is provided in Table S1.

2.3. Rice Planting Date Scenarios

Two rice planting date scenarios were evaluated. First, the common farmers’ rice planting date (hereafter farmers’ practice) was estimated using NDVI3g data. The date of the monsoon onset was used as a second scenario. The monsoon onset was calculated using an agronomic local definition, which was then used as a date parameter for rice planting and crop simulations. Details on how these dates ware obtained are presented below.

2.3.1. Farmers’ Practice Rice Planting Date

Farmers’ practice rice planting dates over Bihar were estimated using the NDVI3g time series (Section 2.2.1) and the TIMESAT Savitzky–Golay smoothing method [28]. The start of the season parameter was calculated for the monsoon onset transition period from the smoothed NDVI3g time series using the TIMESAT software package. An increase in NDVI of 20% of the seasonal amplitude was considered as the start of a season, starting from its minimum during the dry season to the maximum green-up during the wet period in summer. The rice planting date was assumed to occur 20 days before the start of the season calculated from TIMESAT [29].

2.3.2. Monsoon Onset-Based Rice Planting Date

Multiple definitions have been developed to establish the onset of the monsoon season. These definitions vary from local to regional, in which the variables considered may be rainfall, wind direction, or atmospheric circulation [30]. Previous studies have used and compared monsoon onset definitions in South Asia and over the Eastern IGP, describing the main features in the regional monsoon timing patterns and variability [31,32,33]. In this work, the local agronomic onset definition of Marteau et al. [34] was used, which was developed for agricultural applications. This method defines the monsoon onset as the first wet day (1 mm of rain) of one or two consecutive days with daily rainfall at least 20 mm without a 7-day dry spell of less than 5 mm of rain during the 20 days from the onset. A post-onset dry spell allows the identification of false onsets. This method has been previously used for monsoon timing studies in South Asia and other monsoon regions [30,35]. In this work, the monsoon onset in Bihar was calculated using daily CHIRPS rainfall data for the period 1982 through 2015. Subsequently, the calculated monsoon onset dates were used as rice planting dates, as explained below.

2.4. APSIM Gridded Crop Modeling

The Agricultural Production Systems sIMulator (APSIM) [36,37] model was used to assess the potential benefit of using the monsoon onset as a rice planting date as a climate adaptation strategy. By accounting for soil properties, climate influences, and management options, APSIM corresponds to a deterministic crop model that has been widely used and calibrated in previous studies over the IGP and Bihar to evaluate the response of crops to management [38], the impacts of climate change and adaptation options for crops [39], or the integrated assessment of yield gaps [40]. APSIM incorporates specific crop modules for rice and wheat simulations [41,42], along with soil water and nutrient balances, among other management options. A good performance simulating rice–wheat systems has been reported in previous studies in South Asia [43]. In this work, APSIM was run using 0.05° × 0.05° spatial resolution input data using the Parallel System for Integrating Impact Models and Sectors (pSIMS) [44], which is designed for high-performance computing gridded simulations.
APSIM was run using parameters for two widely cultivated varieties in Bihar (MTU7029 for rice, and PBW343 for wheat), and for which APSIM has been previously calibrated and validated under non-limiting nitrogen and water conditions [38]. The rice planting date was set according to the farmers’ practice, estimated using NDVI3g and TIMESAT, and to the monsoon onset date, calculated using the agronomic definition. Likewise, wheat was sown 25 days after rice harvest [45], and irrigation was supplied at the moment when soil water content reached the APSIM threshold for water stress conditions.

2.5. Assessing Temperature Stress on Rice and Wheat

The simulated potential yield of rice and wheat for the two rice planting date scenarios were analyzed in terms of the occurrence of temperature stress conditions at the end of the rice (low temperature stress) and wheat (terminal heat stress) growing seasons. The latter was performed by analyzing the APSIM spikelet sterility factor due to low temperatures in rice (sf1; temperature less than 22 °C), and the reduction in photosynthetic efficiency in wheat due to the exposure to heat stress (temp_stress_photo; linear reduction from 25 °C to 35 °C). sf1 and temp_stress_photo correspond to linear functions of air temperature ranging from 0 to 1, used as multiplicative factors constraining potential yields. In this way, a sf1 and temp_stress_photo factor equal to 1 means no yield reduction due to temperature stress.

3. Results

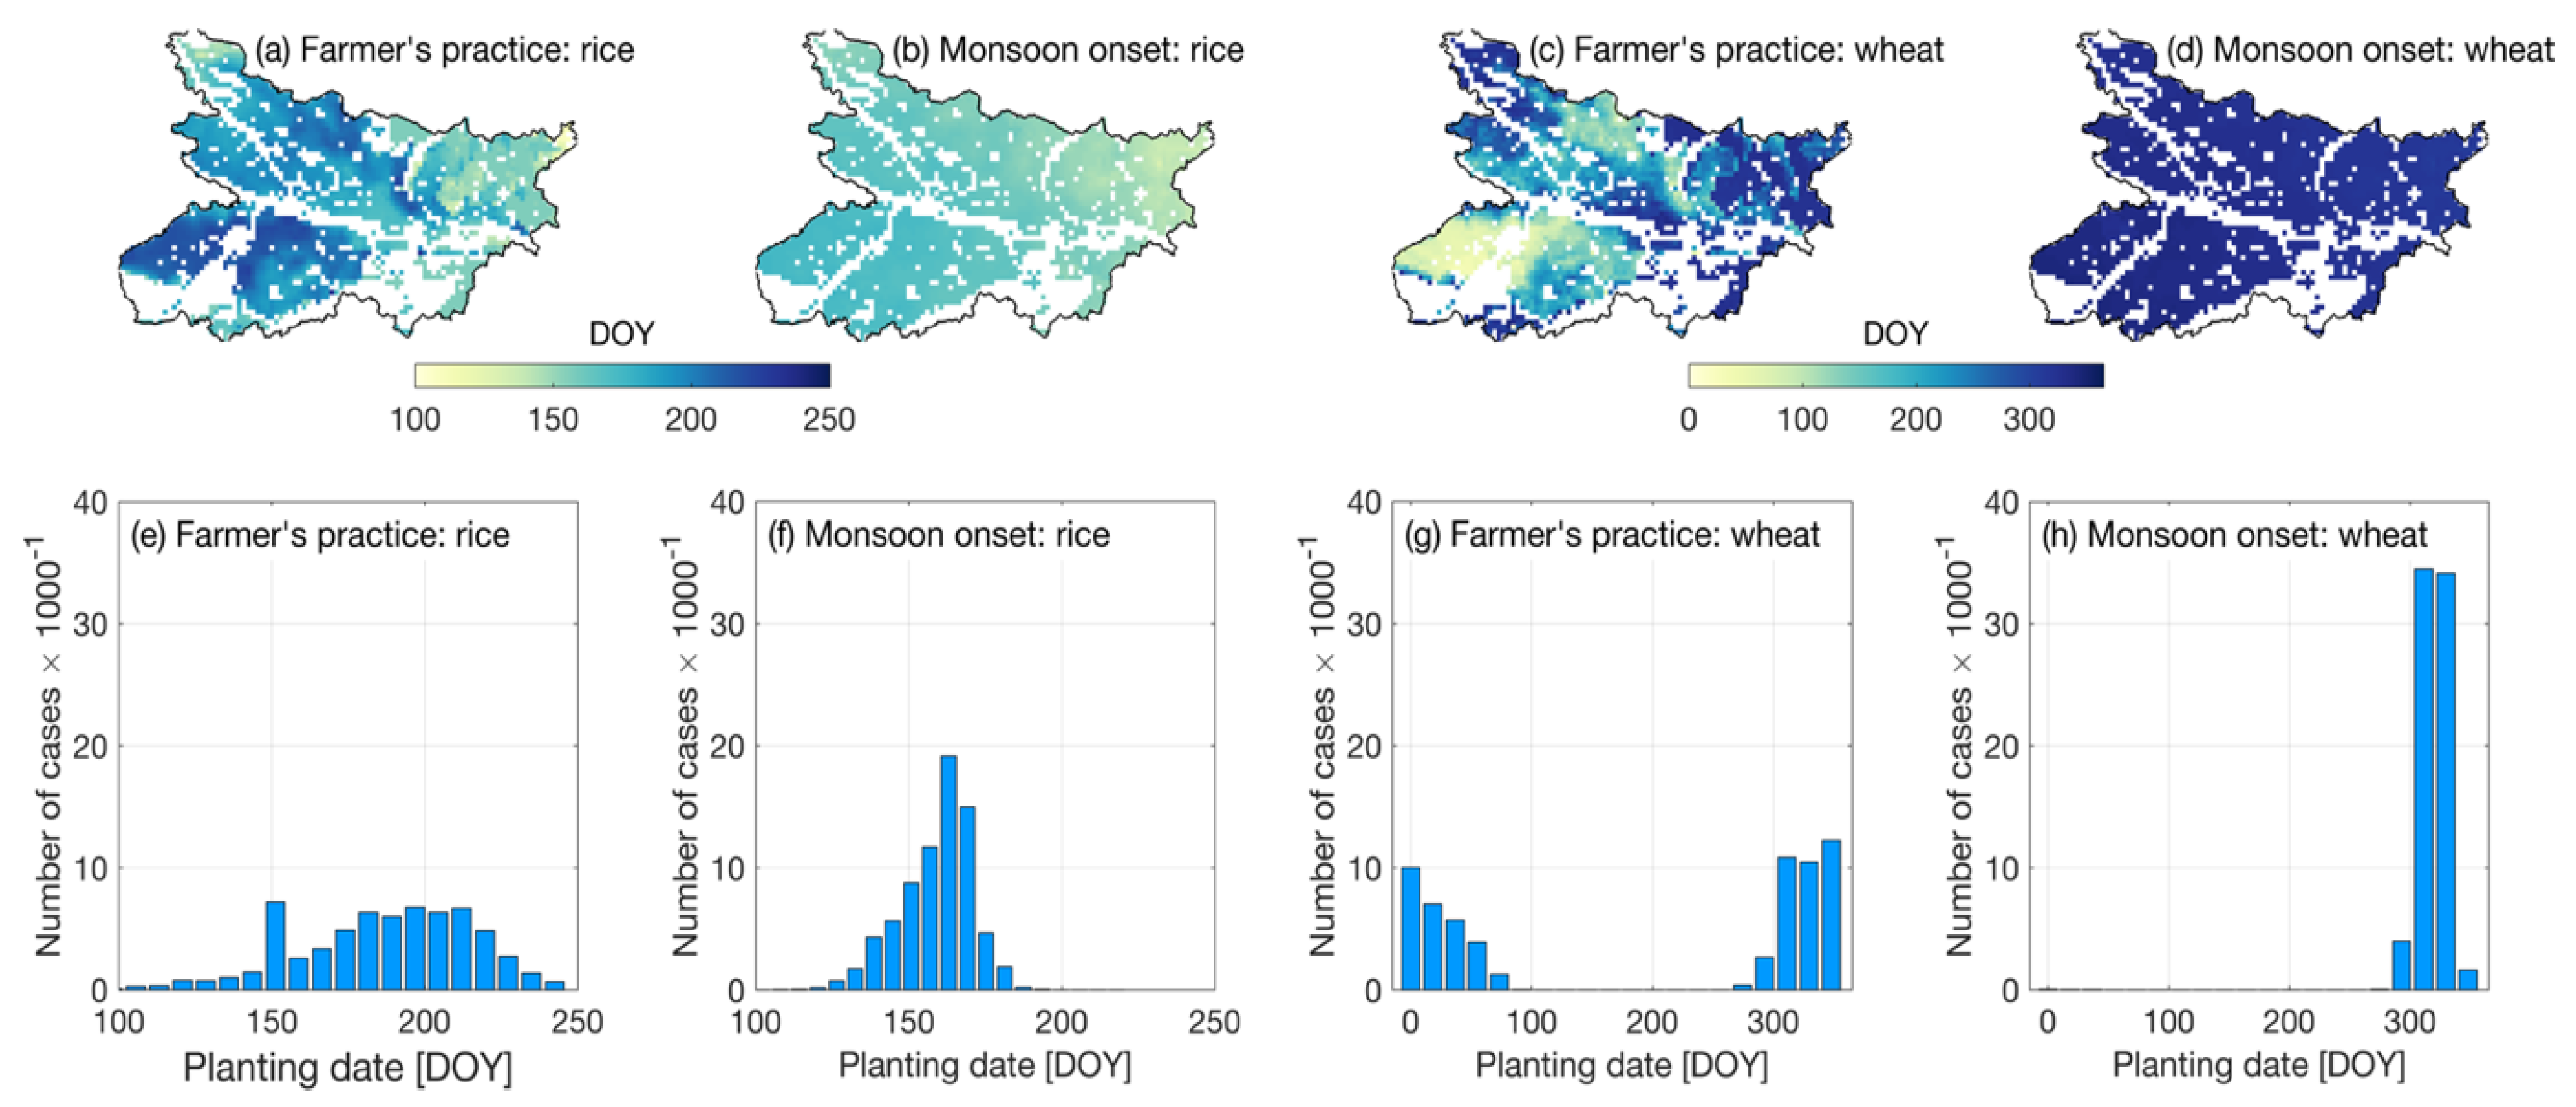
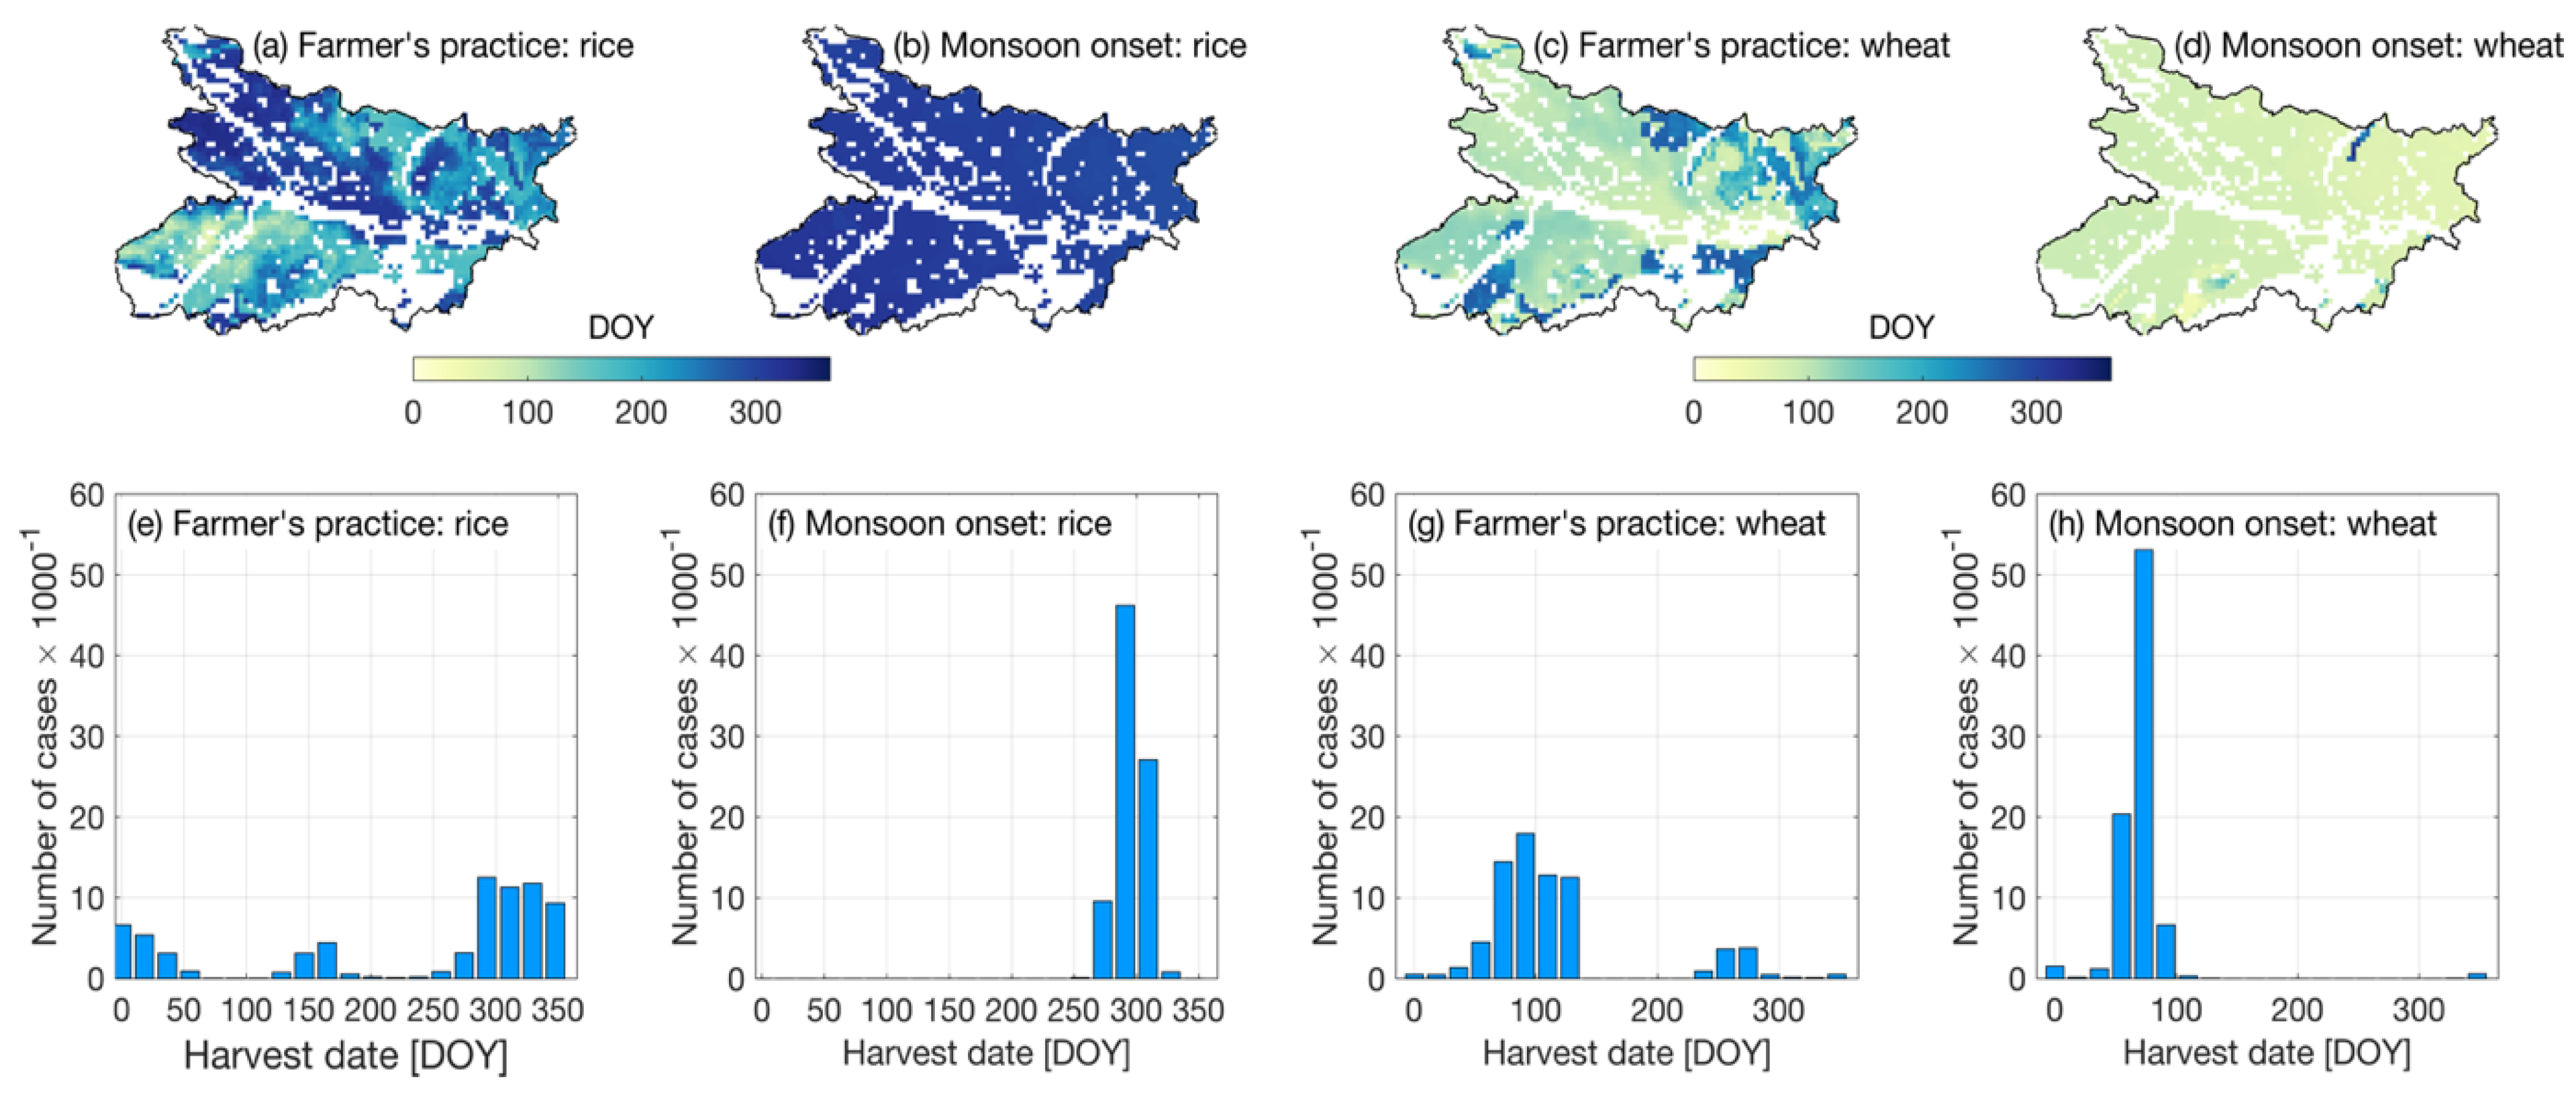
3.1. Mean Planting and Harvest Dates of Rice and Wheat in Bihar

Planting and harvest dates obtained from the two rice planting scenarios are presented. Figure 2 shows both the maps and histograms of interannual mean rice and wheat planting and harvest dates. Figure 2a,b show that, in general, the monsoon onset scenario results in earlier planting dates (mean regional day of the year DOY = 161) than the farmers’ practice (mean regional DOY = 184); the higher differences are observed over the Eastern part of Bihar. Similarly, the histogram of Figure 2e shows a higher amplitude in planting dates for the farmers’ practice scenario (regional standard deviation of 23 days) compared with monsoon onset (regional standard deviation of 10 days). On the other hand, rice planting dates at monsoon onset concentrate around the average DOY 161 (Figure 2f). The latter suggests that using the monsoon onset for rice planting leads to both earlier and also more regionally homogeneous planting dates. For the case of wheat, the map of Figure 2c shows a similar spatial pattern to rice, evidencing the later and more variable dates for the case of the farmers’ practice. In this case, later dates are dominant over Southern Bihar and over some areas to the North (areas with DOY representing dates of the following calendar year). The histogram of Figure 2g shows dates starting from around DOY 300 to 80 of the following year. A very different spatial distribution of planting dates is observed for the case of the monsoon onset scenario, which concentrate around DOY 320.
APSIM-simulated harvest dates for both rice planting dates scenarios are presented in Figure 3 as maps of interannual means and spatial histograms. Following the pattern of planting dates, the maps of rice harvest dates from the monsoon onset scenario show relatively earlier and more homogeneous dates compared to the farmers’ practices. Figure 3b,f clearly show a very homogeneous spatial pattern of harvest dates of rice. Similarly, the wheat harvest dates for the monsoon onset scenario are very homogeneous, showing earlier dates in relation to the farmers’ practice.

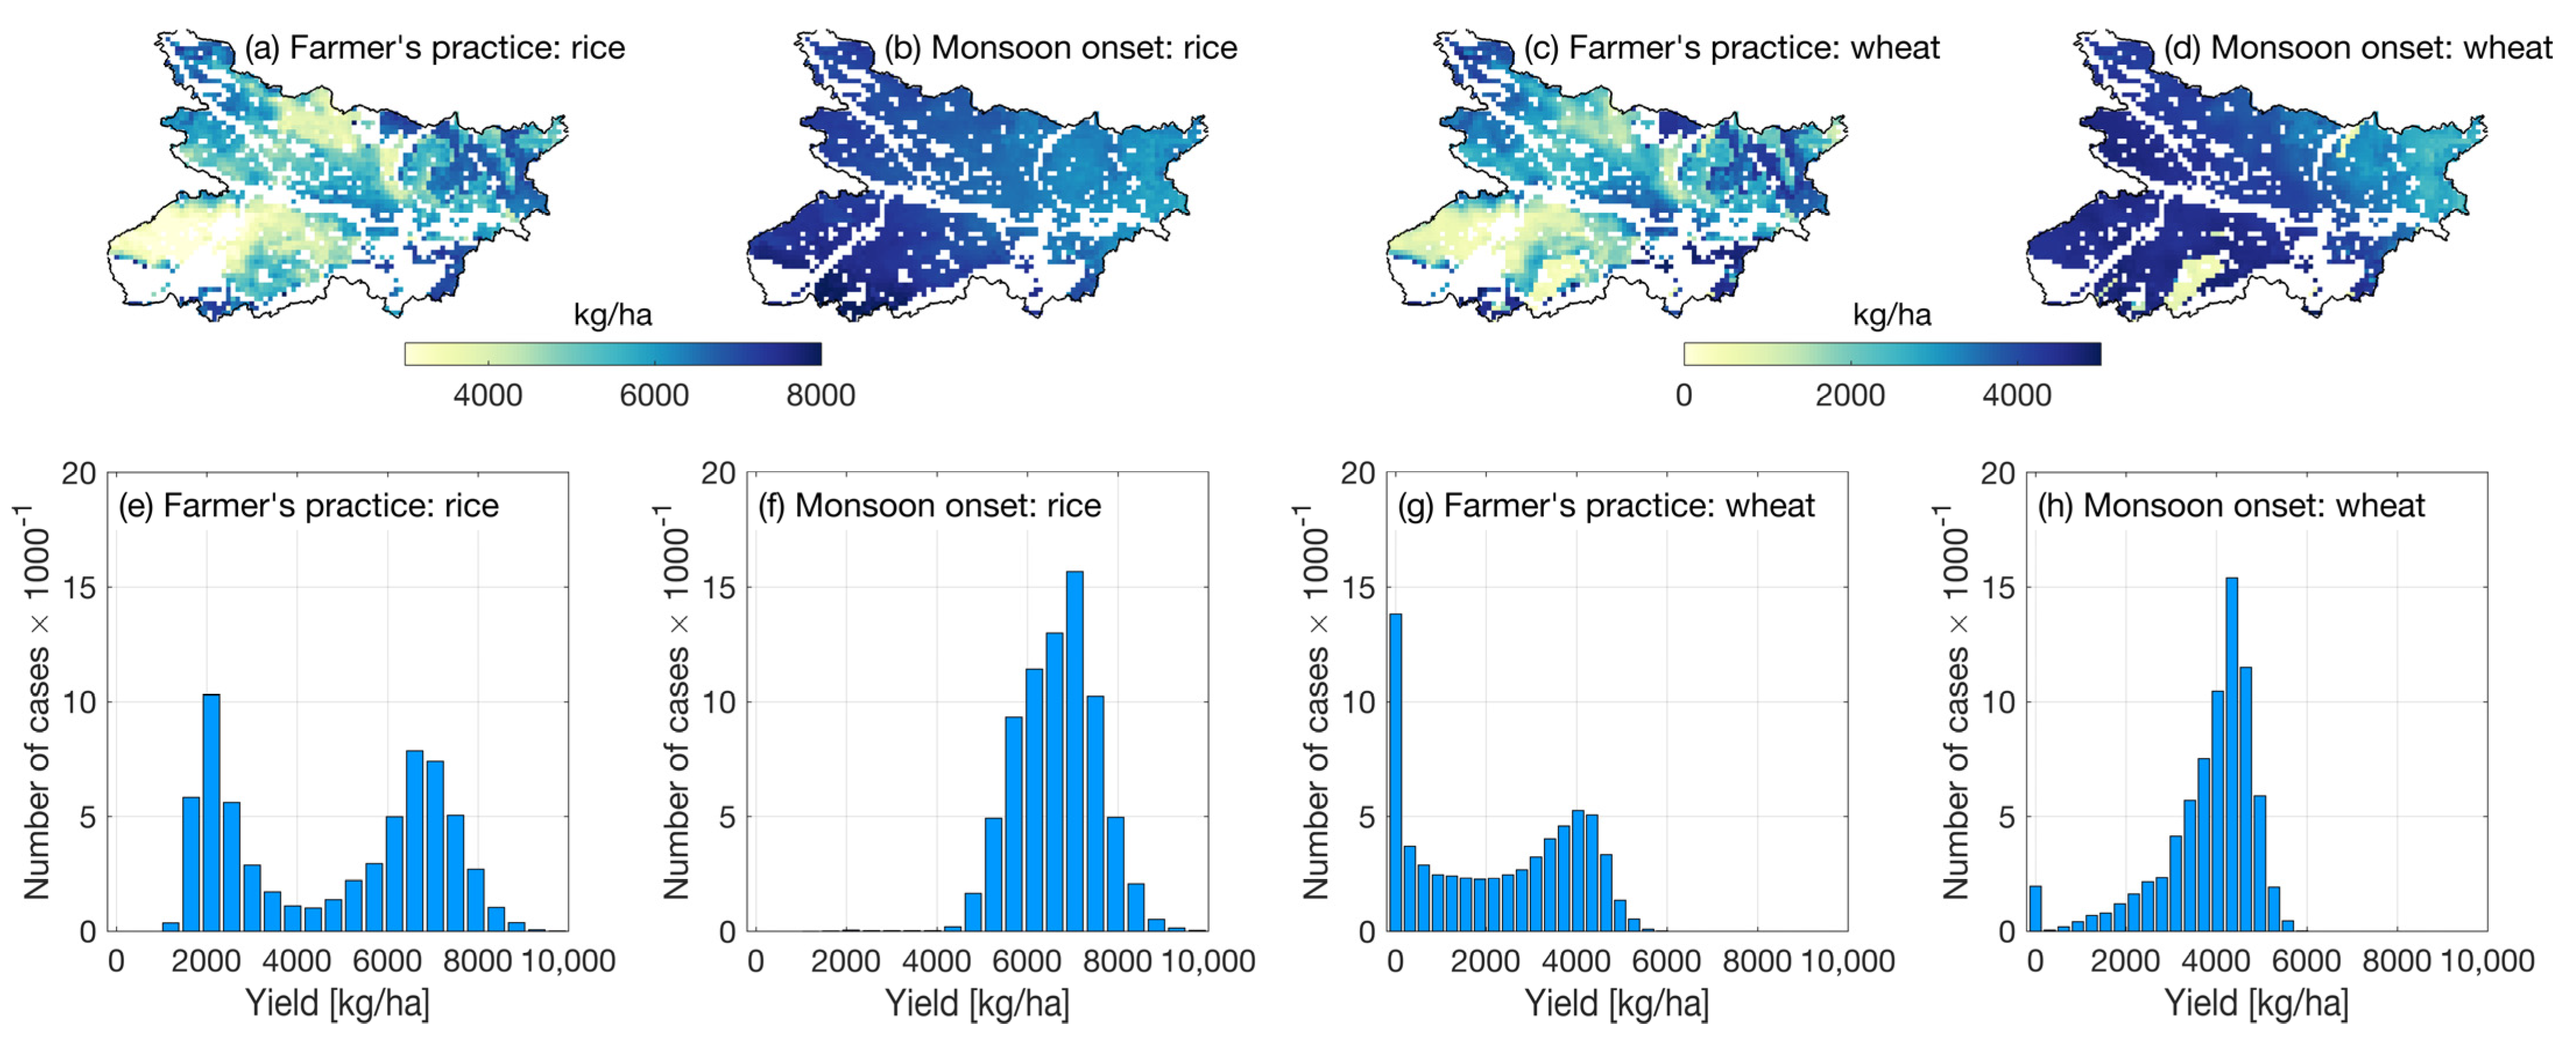
3.2. The Relationship between Yields and Planting and Harvest Dates

The simulated mean yields (1982–2015) using both rice planting dates scenarios are presented in Figure 4. The yields from the farmers’ practice scenario are more spatially variable than the monsoon onset scenario, showing lower potential yields over the Southwestern areas and parts of the North (Figure 4a). The latter results in a bimodal distribution of yields that concentrates around 2000 and 7000 kg/ha (Figure 4e). On the other hand, the monsoon onset scenario shows generalized higher and more homogeneous yields in Bihar, concentrating around 7000 kg/ha (Figure 4b,f). According to Figure 4a,b, a higher yield increase is observed over areas of lower potential yields (around 2000 kg/ha), suggesting that higher benefits from earlier rice planting would be obtained over areas of lower yields. Similarly, wheat yields for the farmers’ practices scenario show a similar spatial distribution to that of rice (Figure 4c). In this case, the planting of rice at monsoon onset again generates a positive impact on wheat yields over lower yield areas, which concentrate around 4000 kg/ha (Figure 4h).
Though increasing yields is a primary goal of most crop management strategies, improving yield stability is also important, especially in the context of climate change [46]. The interannual standard deviation of rice and wheat yields was calculated as an indicator of yield stability, which are presented in the maps of Figure 5. A decrease in the interannual yield variability in both rice and wheat is observed for the case of the monsoon onset scenario for rice planting. Large areas of Bihar show relatively unstable yields in the farmers’ practice planting date scenario (Figure 5a,c), areas that also average lower yields (Figure 4). On the other hand, the simulated yields using the monsoon onset are observed to be very stable, with some areas of relatively less stability in the case of wheat (Figure 5d).

3.3. Planting Dates and Temperature Stress Factors: Interannual Patterns

In order to explore the effect of the planting date scenarios on the incidence of thermal stress, the interannual variability in APSIM stress factors (sf1 for rice and temp_stress_photo for wheat) were compared. Figure 6 shows the time series of stress factors (1982–2015) for rice and wheat and for the two planting date scenarios. The results show that simulated potential yields for the farmers’ practice scenario experience higher restrictions associated with temperature stresses, especially for the case of wheat (Figure 6b), suggesting a greater relative reduction in stress conditions associated with terminal heat on wheat for the monsoon onset scenario. Figure 6a clearly shows values closer to unity and lower interannual variability in the case of sf1 when the monsoon onset is used (mean sf1 = 0.98; standard deviation sf1 = 0.01) compared with the farmers’ practice (mean sf1 = 0.87; standard deviation sf1 = 0.05). For wheat, the differences between both scenarios are more evident (Figure 6b), where the monsoon onset scenario shows values closer to 1 (mean temp_stress_photo = 0.88) and lower interannual variability (standard deviation temp_stress_photo = 0.03) compared with the farmers’ practice (mean temp_stress_photo = 0.66; standard deviation sf1 = 0.1). These results suggest an interannual pattern of higher stability in attainable rice and wheat yields associated with the reduction in the incidence of temperature stress.
A composite analysis was performed based on the comparison between the years of lowest and highest yields, represented by the 15th and 85th percentiles for every model grid, respectively. The maps of average yields and values of the stress factor sf1 for the rice planting date strategy are shown in Figure 7. Generally, a correspondence between maps of simulated yields (Figure 7a,b) for the farmers’ practice and sf1 (Figure 7e,f) are observed, suggesting a direct relationship of the effect of thermal stress on rice yields. In contrast, the maps of high and low rice yields for the monsoon onset scenario show a much more homogeneous spatial distribution of yields and no correspondence between the lower yields (Figure 7c) and lower values of sf1 (Figure 7g). The latter suggests that factors other than the effect of stress due to low temperatures could explain the lower yields achieved during anomalous years.
Similar results are observed for the case of simulated wheat yields (Figure 8). In the composites of farmers’ practices scenario (Figure 8a), higher yields are observed in the areas further north of Bihar, which, in general, have temp_stress_photo values closer to 1 (Figure 8e). Similar to rice, the spatial patterns of both yields and temp_stress_photo for the monsoon onset scenario do not show a clear correspondence (Figure 8c,g and Figure 8d,h), with the values of temp_stress_photo being very similar for both composites (Figure 8g,h). The latter could be indicative of a lower incidence of terminal heat stress on wheat when rice is planted earlier in the season.

4. Discussion

The main goal of this study is to assess the potential benefit of using the monsoon onset as a planting date for rice in relation to current farmers’ practices in terms of the incidence of thermal stresses and the implications for attainable yields in rice–wheat systems in Bihar. This is under the hypothesis that an earlier planting of rice in relation to current farmers’ practices and timely planting in terms of the use of rainwater allows avoiding the exposure of rice to low temperatures and, subsequently, of wheat to terminal heat stress. The literature shows that significant impacts on yields can be generated by the incidence of thermal stress on rice and wheat in Bihar, which suggests that more advances in adaptation strategies are necessary.
The results shows that planting dates at monsoon onset are around 20 days earlier than current farmers’ practice. Consequently, the simulations presented and discussed suggest that the use of the monsoon onset as a criterion for rice planting date in Bihar could improve rice–wheat yields and their stability initially by reducing the exposure of both rice to low temperature stress and wheat the terminal heat stress. However, the results of this work are based on modeling, to which multiple sources of uncertainty are associated. For instance, we used last-generation high-resolution meteorological forcing (CHIRPS, ERA5) and soil data products to run APSIM, but the use of other comparable products could lead to different results that should be evaluated [47,48]. Similarly, the soil data used correspond to a large source of uncertainty; in this regard, field measurements should be used to validate and quantify the associated errors in order to better understand the modeling results. Furthermore, other socioeconomic factors such as the timely access to seeds and other inputs, the effective irrigation, or management practices prior to planting or during the monsoon season that can affect planting and sowing dates should be assessed [49].
Although further work is needed in order to implement an operational system allowing farmers to use the monsoon onset as an option for planting rice, the results of this work seem to indicate that it would be worth exploring the options available for a potential future implementation. In this sense, the current development of sub-seasonal and seasonal forecasts at multiple lead times [50] would allow the generation of actionable information for decision-making by farmers. In this way, the meteorological departments could provide the necessary information for the development of targeted climate services in Bihar and other areas; however, this must consider the evaluation of the current subseasonal timescale forecast systems, which, although they have valuable potential applications in agriculture, are not yet skillful enough to provide reliable forecasts to implement climate services [51], especially for the case of a complex event such as the onset of the rainy season over monsoon regions, for which multiple definitions have been developed [30].
The modeling results show that the incidence of stress by low temperatures in rice and terminal heat in wheat may be relevant in Bihar. Considering current climate change and warming projections for the region, it is likely that the incidence and severity of terminal heat stress on wheat will increase in the future [17]. In this context, adaptation strategies that are relatively easy to implement by farmers, such as the one presented in this work, could become important for decision-makers. Further efforts in crop modeling should consider the specific physiological impact of low and high temperatures on processes such as grain sterility, formation, and number, which have been reported as very sensitive to thermal shocks [52].
Although the two planting dates scenarios evaluated show clear differences, they have to be interpreted with caution, since they were generated from modeling using multiple data sources, which have their own limitations and uncertainties. First, estimated farmers’ practice planting dates can be uncertain given the use of the TIMESAT algorithm, which works by smoothing the NDVI signal using a prescribed percentage of the signal amplitude to identify the onset of the season. Beyond the uncertainties associated with the quality of satellite products, a sensitivity analysis to this signal amplitude factor should be performed to better understand the results. Additionally, several methods have been developed to define the monsoon onset [30]. We have selected the agronomic onset definition since it was generated for agricultural applications, but clearly, a more complete comparison of monsoon onset definitions is necessary. Despite all the limitations, the modeling results provide insights about the potential use of the monsoon onset for rice planting over a region of high vulnerability to environmental hazards, the production of actionable climate services, and the potential impact of using climate predictions in decision making, provided that effective delivery methods are also developed in order to translate climate information into practices for adaptation and mitigation.

5. Conclusions

Multiple studies have reported the adverse effects of low temperatures on rice and terminal heat on wheat in Northern India. Although the above is widely known, the development of regional adaptation strategies based on climate services that are aligned with current efforts in adaptation to climate change is pending. In this sense, this study assessed the potential use of the monsoon onset as the planting date of rice and the consequences for the incidence of thermal stresses as an adaptation strategy for rice–wheat systems in Bihar. Although the evaluated strategy considers climate information for decision making only, the results show that differences in rice planting and wheat sowing dates translate into a lower incidence of thermal stress that could increase yields in rice–wheat systems of Bihar. Moreover, the important regional differences in planting dates and attainable yields for both rice planting scenarios could help focus efforts for developing tailored climate services for agriculture to mitigate the impact of climate shocks, and to increase resilience to projected climate change. However, the multiple sources of uncertainty and limitations associated, for example, with the input data and parameters used to run APSIM, the multiple factors influencing the gap between potential and achieved yields, or the differences in existing management decisions over the study area should be considered in future work. Notwithstanding, future efforts should focus on combining planting dates with rice–wheat field management strategies, or analyzing the potential benefit of shifting planting dates using climate change scenarios. In addition, the present study should be extended to other areas with a similar climate where rice–wheat systems are dominant, such as the neighboring states in the IGP in India, where recent studies have shown the potential for increased wheat yields by adjusting sowing dates [16]. Although projections in rainfall patterns are uncertain in South Asia, the generalized warming suggests that an earlier wheat sowing date could mitigate the impact of climatic shocks associated with high temperatures.

Supplementary Materials

The following supporting information can be downloaded at: https://www.mdpi.com/article/10.3390/atmos14010040/s1, Table S1: List of soil parameters used for APSIM simulations.

Author Contributions

Conceptualization, C.M. and A.U.; methodology, C.M. and A.U.; software, C.M. and A.U.; formal analysis, C.M., A.U., E.H. and B.-S.; data curation, C.M. and A.U.; writing—original draft preparation, C.M.; writing—review and editing, C.M., A.U., E.H. and B.-S.; visualization, C.M. All authors have read and agreed to the published version of the manuscript.

Funding

This research received no external funding.

Institutional Review Board Statement

Not applicable.

Informed Consent Statement

Not applicable.

Data Availability Statement

Not applicable.

Acknowledgments

This study was supported by the CGIAR Research Program on Climate Change, Agriculture and Food Security (CCAFS; https://ccafs.cgiar.org; accessed on 1 December 2022), by the CGIAR Regional Integrated Initiative Transforming Agrifood Systems in South Asia, or TAFSSA (https://www.cgiar.org/initiative/20-transforming-agrifood-systems-in-south-asia-tafssa/; accessed on 1 December 2022), and by the CGIAR Foresight and Metrics to Accelerate Inclusive and Sustainable Agrifood System Transformation initiative (https://www.cgiar.org/initiative/24-foresight-and-metrics-to-accelerate-inclusive-andsustainable-agrifood-system-transformation/; accessed on 1 December 2022).

Conflicts of Interest

The authors declare no conflict of interest.

References

  1. Hoda, A.; Jose, S.; Gulati, A.; Rajkhowa, P. Sources and drivers of agricultural growth in Bihar. In Revitalizing Indian Agriculture and Boosting Farmer Incomes; Gulati, A., Roy, R., Saini, S., Eds.; Springer: Singapore, 2021; pp. 211–243. [Google Scholar]
  2. Bhatt, R.; Kaur, R.; Gosh, A. Strategies to practice climate smart agriculture to improve the livelihoods under rice–wheat systems in South Asia. In Sustainable Soil and Environmental Management; Springer-Nature Publication: Singapore, 2019; pp. 29–72. [Google Scholar]
  3. Bihar Statistical Handbook 2019; Directorate of Economics and Statistics, Department of Planning and Development, Government of Bihar: Patna, India, 2019.
  4. Sekar, I.; Pal, S. Rice and wheat productivity in the Indo-Gangetic Plain of India: Changing pattern of growth and future strategies. Indian J. Agric. Econ. 2012, 67, 238–252. [Google Scholar]
  5. Bhatla, R.; Varma, P.; Verma, S.; Gosh, S. El Nino/La Nina impact on crop production over different agro-climatic zones of Indo-Gangetic Plain of India. Theor. Appl. Climatol. 2020, 142, 151–163. [Google Scholar] [CrossRef]
  6. Srivastava, P.; Pal, D.K.; Aruche, K.M.; Wani, S.P.; Sahrawat, K.L. Soils of the Indo-Gangetic Plains: A pedogenic response to landscape stability, climatic variability and anthropogenic activity during the Holocene. Earth-Sci. Rev. 2015, 140, 54–71. [Google Scholar] [CrossRef] [Green Version]
  7. Erenstein, O.; Thorpe, W. Livelihoods and agro-ecological gradients: A meso-level analysis in the Indo-Gangetic Plains, India. Agric. Syst. 2011, 104, 42–53. [Google Scholar] [CrossRef]
  8. Lopez-Ridaura, S.; Frelat, R.; van Wijk, M.T.; Valbuena, D.; Krupnik, T.J.; Jat, M.L. Climate smart agriculture, farm household typologies and food security: An ex-ante assessment from eastern India. Agric. Syst. 2018, 159, 57–68. [Google Scholar] [CrossRef] [PubMed]
  9. Tesfaye, K.; Aggarwal, P.K.; Mequanint, F.; Shirsath, P.B.; Stirling, C.M.; Khatri-Chhetri, A.; Rahut, D.B. Climate Variability and Change in Bihar, India: Challenges and Opportunities for Sustainable Crop Production. Sustainability 2017, 9, 1998. [Google Scholar] [CrossRef] [Green Version]
  10. Rodell, M.; Velicogna, I.; Famiglietti, J.S. Satellite-based estimates of groundwater depletion in India. Nature 2009, 460, 999–1002. [Google Scholar] [CrossRef] [Green Version]
  11. Kaskaoutis, D.G.; Kumar, S.; Sharma, D.; Singh, R.P.; Kharol, S.K.; Sharma, M.; Singh, A.K.; Singh, S.; Singh, A.; Singh, D. Effects of crop residue burning on aerosol properties, plume characteristics, and long-range transport over northern India. J. Geophys. Res.-Atmos. 2014, 119, 5424–5444. [Google Scholar] [CrossRef]
  12. Sahu, N.; Saini, A.; Behera, S.; Sayama, T.; Nayak, S.; Sahu, L.; Duan, W.; Avtar, R.; Yamada, M.; Singh, R.; et al. Impact of Indo-Pacific Climate Variability on Rice Productivity in Bihar, India. Sustainability 2020, 12, 7023. [Google Scholar] [CrossRef]
  13. Arshad, M.S.; Farooq, M.; Asch, F.; Krishna, J.S.; Prasad, P.V.; Siddique, K.H. Thermal stress impacts reproductive development and grain yield in rice. Plant Physiol. Biochem. 2017, 115, 57–72. [Google Scholar] [CrossRef]
  14. Nahar, K.; Hasanuzzaman, M.; Majumder, R.R. Effect of low temperature stress in transplanted aman rice varieties mediated by different transplanting dates. Acad. J. Plant Sci. 2009, 2, 132–138. [Google Scholar]
  15. Dubey, R.; Pathak, H.; Chakrabarti, B.; Singh, S.; Gupta, D.K.; Harit, R. Impact of terminal heat stress on wheat yield in India and options for adaptation. Agric. Syst. 2020, 181, 102826. [Google Scholar] [CrossRef]
  16. McDonald, A.J.; Keil, A.; Srivastava, A.; Craufurd, P.; Kishore, A.; Kumar, V.; Paudel, G.; Singh, S.; Singh, A.K.; Sohane, R.K.; et al. Time management governs climate resilience and productivity in the coupled rice-wheat cropping systems of eastern India. Nat. Food 2022, 3, 542–551. [Google Scholar] [CrossRef]
  17. Subash, N.; Singh, S.S.; Priya, N. Observed variability and trends in extreme temperature indices and rice–wheat productivity over two districts of Bihar, India-a case study. Theor. Appl. Climatol. 2012, 111, 235–250. [Google Scholar] [CrossRef]
  18. Teixeira, E.I.; Fischer, G.; van Velthuizen, H.; Walter, C.; Ewert, F. Global hot-spots of heat stress on agricultural crops due to climate change. Agric. For. Meteorol. 2013, 170, 206–215. [Google Scholar] [CrossRef]
  19. Pinzon, J.E.; Tucker, C.J. A non-stationary 1981–2012 AVHRR NDVI3g time series. Remote Sens. 2014, 6, 6929–6960. [Google Scholar] [CrossRef] [Green Version]
  20. Pan, N.; Feng, X.; Fu, B.; Wang, S.; Ji, F.; Pan, S. Increasing global vegetation browning hidden in overall vegetation greening: Insights from time-varying trends. Remote. Sens. Environ. 2018, 214, 59–72. [Google Scholar] [CrossRef]
  21. He, Y.; Lee, E.; Warner, T.A. A time series of annual land use and land cover maps of China from 1982 to 2013 generated using AVHRR GIMMS NDVI3g data. Remote Sens. Environ. 2017, 199, 201–217. [Google Scholar] [CrossRef]
  22. Funk, C.; Peterson, P.; Landsfeld, M.; Pedreros, D.; Verdin, J.; Shukla, S.; Husak, G.; Rowland, J.; Harrison, L.; Hoell, A.; et al. The climate hazards infrared precipitation with stations—A new environmental record for monitoring extremes. Sci. Data 2015, 2, 150066. [Google Scholar] [CrossRef] [Green Version]
  23. Huffman, G.J.; Bolvin, D.T.; Nelkin, E.J.; Wolff, D.B.; Adler, R.F.; Gu, G.; Hong, Y.; Bowman, K.P.; Stocker, E.F. The TRMM Multisatellite Precipitation Analysis (TMPA): Quasi-Global, Multiyear, Combined-Sensor Precipitation Estimates at Fine Scales. J. Hydrometeorol. 2007, 8, 38–55. [Google Scholar] [CrossRef]
  24. Hersbach, H.; Bell, B.; Berrisford, P.; Hirahara, S.; Horanyi, A.; Muñoz-Sabater, J.; Nicolas, J.; Peubey, C.; Radu, R.; Schepers, D.; et al. The ERA5 global reanalysis. Q. J. R. Meteorol. Soc. 2020, 146, 1999–2049. [Google Scholar] [CrossRef]
  25. Shangguan, W.; Dai, Y.; Duan, Q.; Liu, B.; Yuan, H. A global soil data set for earth system modeling. J. Adv. Model. Earth Syst. 2014, 6, 249–263. [Google Scholar] [CrossRef]
  26. Hengl, T.; De Jesus, J.M.; Heuvelink, G.B.M.; Gonzalez, M.R.; Kilibarda, M.; Blagotić, A.; Shangguan, W.; Wright, M.N.; Geng, X.; Bauer-Marschallinger, B.; et al. SoilGrids250m: Global gridded soil information based on machine learning. PLoS ONE 2017, 12, e0169748. [Google Scholar] [CrossRef] [PubMed] [Green Version]
  27. Nachtergaele, F.O.; Velthuizen, H.V.; Verelst, L.; Batjes, N.H.; Dijkshoorn, J.A.; Engelen, V.W.P.V.; Fischer, G.; Jones, A.; Mon-tanarella, L.; Petri, M.; et al. Harmonized World Soil Database (version 1.0). Food and Agric Organization of the UN (FAO); International Inst. for Applied Systems Analysis (IIASA); ISRIC-World Soil Information; Inst of Soil Science-Chinese Acad of Sciences (ISS-CAS); EC-Joint Research Centre (JRC). 2008. Available online: https://edepot.wur.nl/30776- (accessed on 10 December 2022).
  28. Jönsson, P.; Eklundh, L. TIMESAT—A program for analyzing time-series of satellite sensor data. Comput. Geosci. 2004, 30, 833–845. [Google Scholar] [CrossRef] [Green Version]
  29. Singh, B.; McDonald, A.J.; Srivastava, A.K.; Gerard, B. Tradeoffs between groundwater conservation and air pollution from agricultural fires in northwest India. Nat. Sustain. 2019, 2, 580–583. [Google Scholar] [CrossRef]
  30. Fitzpatrick, R.; Bain, C.L.; Knippertz, P.; Marsham, J.H.; Parker, D.J. The West African Monsoon Onset: A Concise Comparison of Definitions. J. Clim. 2015, 28, 8673–8694. [Google Scholar] [CrossRef]
  31. Fitzpatrick, R.G.J.; Parker, D.J.; Willetts, P.D. Assessing the level of spatial homogeneity of the agronomic Indian monsoon onset. Geophys. Res. Lett. 2016, 43, 11–867. [Google Scholar] [CrossRef]
  32. Montes, C.; Acharya, N.; Stiller-Reeve, M.A.; Kelley, C.; Hassan, S.M.Q. Interannual variability of monsoon onset and with-drawal in Bangladesh. Atmos. Sci. Lett. 2021, 22, e1069. [Google Scholar] [CrossRef]
  33. Stiller-Reeve, M.A.; Syed, A.; Spengler, T.; Spinney, J.A.; Hossain, R. Complementing Scientific Monsoon Definitions with Social Perception in Bangladesh. Bull. Am. Meteorol. Soc. 2015, 96, 49–57. [Google Scholar] [CrossRef] [Green Version]
  34. Marteau, R.; Moron, V.; Philippon, N. Spatial coherence of monsoon onset over western and central Sahel (1950–2000). J. Clim. 2009, 22, 1313–1324. [Google Scholar] [CrossRef] [Green Version]
  35. Moron, V.; Robertson, A.W. Interannual variability of Indian summer monsoon rainfall onset date at local scale. Int. J. Clim. 2014, 34, 1050–1061. [Google Scholar] [CrossRef]
  36. McCown, R.; Hammer, G.; Hargreaves, J.; Holzworth, D.; Freebairn, D. APSIM: A novel software system for model development, model testing and simulation in agricultural systems research. Agric. Syst. 1996, 50, 255–271. [Google Scholar] [CrossRef]
  37. Keating, B.A.; Carberry, P.S.; Hammer, G.L.; Probert, M.E.; Robertson, M.J.; Holzworth, D.; Huth, N.I.; Hargreaves, J.N.; Meinke, H.; Hochman, Z.; et al. An overview of APSIM, a model designed for farming systems simulation. Eur. J. Agron. 2003, 18, 267–288. [Google Scholar] [CrossRef] [Green Version]
  38. Singh, B.; Humphreys, E.; Gaydon, D.; Eberbach, P. Evaluation of the effects of mulch on optimum sowing date and irrigation management of zero till wheat in central Punjab, India using APSIM. Field Crop. Res. 2016, 197, 83–96. [Google Scholar] [CrossRef] [Green Version]
  39. Xiao, D.; Bai, H.; Liu, D.L. Impact of Future Climate Change on Wheat Production: A Simulated Case for China’s Wheat System. Sustainability 2018, 10, 1277. [Google Scholar] [CrossRef] [Green Version]
  40. Balboa, G.R.; Archontoulis, S.V.; Salvagiotti, F.; Garcia, F.O.; Stewart, W.M.; Francisco, E.; Prasad, P.V.V.; Ciampitti, I.A. A systems-level yield gap assessment of maize-soybean rotation under high- and low-management inputs in the western US corn belt wsing APSIM. Agric. Syst. 2019, 174, 145–154. [Google Scholar] [CrossRef]
  41. Gaydon, D.; Probert, M.; Buresh, R.; Meinke, H.; Suriadi, A.; Dobermann, A.; Bouman, B.; Timsina, J. Rice in cropping systems—Modelling transitions between flooded and non-flooded soil environments. Eur. J. Agron. 2012, 39, 9–24. [Google Scholar] [CrossRef]
  42. Wang, E.; van Oosterom, E.J.; Meinke, H.; Asseng, S.; Robertson, M.J.; Huth, N.I.; Keating, B.A.; Probert, M.E. The new APSIM-wheat model-performance and future improvements. In Proceedings of the 11th Australian Agronomy Conference, Geelong, Victoria, 2–6 February 2003. [Google Scholar]
  43. Gaydon, D.; Singh, B.; Wang, E.; Poulton, P.; Ahmad, B.; Ahmed, F.; Akhter, S.; Ali, I.; Amarasingha, R.; Chaki, A.; et al. Evaluation of the APSIM model in cropping systems of Asia. Field Crop. Res. 2017, 204, 52–75. [Google Scholar] [CrossRef]
  44. Elliott, J.; Kelly, D.; Chryssanthacopoulos, J.; Glotter, M.; Jhunjhnuwala, K.; Best, N.; Wilde, M.; Foster, I. The parallel system for integrating impact models and sectors (pSIMS). Environ. Model. Softw. 2014, 62, 509–516. [Google Scholar] [CrossRef] [Green Version]
  45. Singh, A.K.; Craufurd, P.; Singh, S.; Kumar, V.; Singh, B.; McDonald, A.; Singh, A.K.; Kumar, A.; Singh, R.; Singh, R.; et al. New Frontiers in Agricultural Extension-Volume II; International Maize and Wheat Improveent Center (CIMMYT): El Batán, Mexico, 2020. [Google Scholar]
  46. Calderini, D.; Slafer, G. Changes in yield and yield stability in wheat during the 20th century. Field Crop. Res. 1998, 57, 335–347. [Google Scholar] [CrossRef]
  47. Ruane, A.C.; Phillips, M.; Müller, C.; Elliott, J.; Jägermeyr, J.; Arneth, A.; Balkovic, J.; Deryng, D.; Folberth, C.; Iizumi, T.; et al. Strong regional influence of climatic forcing datasets on global crop model ensembles. Agric. For. Meteorol. 2021, 300, 108313. [Google Scholar] [CrossRef]
  48. Folberth, C.; Skalský, R.; Moltchanova, E.; Balkovic, J.; Azevedo, L.B.; Obersteiner, M.; van der Velde, M. Uncertainty in soil data can outweigh climate impact signals in global crop yield simulations. Nat. Commun. 2016, 7, 11872. [Google Scholar] [CrossRef] [PubMed]
  49. Ishtiaque, A.; Singh, S.; Lobell, D.; Singh, B.; Fishman, R.; Jain, M. Prior crop season management constrains farmer adaptation to warming temperatures: Evidence from the Indo-Gangetic Plains. Sci. Total. Environ. 2022, 807, 151671. [Google Scholar] [CrossRef] [PubMed]
  50. Becker, E.J.; Kirtman, B.P.; L’Heureux, M.; Muñoz, Á.G.; Pegion, K. A decade of the North American Multimodel Ensemble (NMME): Research, application, and future directions. Bull. Ameri. Meteorol. Soc. 2022, 103, E973–E995. [Google Scholar] [CrossRef]
  51. White, C.J.; Carlsen, H.; Robertson, A.W.; Klein, R.J.; Lazo, J.K.; Kumar, A.; Vitart, F.; de Perez, E.C.; Ray, A.J.; Murray, V.; et al. Potential applications of subseasonal-to-seasonal (S2S) predictions. Meteorol. Appl. 2017, 24, 315–325. [Google Scholar] [CrossRef] [Green Version]
  52. Barlow, K.M.; Christy, B.P.; O’leary, G.J.; Riffkin, P.A.; Nuttall, J.G. Nuttall. Simulating the impact of extreme heat and frost events on wheat crop production: A review. Field Crop. Res. 2015, 171, 109–119. [Google Scholar] [CrossRef]
Figure 1. Map of India showing the location of the state of Bihar. Black lines delimit the states. Zoomed area corresponds to the percentage of croplands in Bihar according to the MODIS MCD12Q1 product.
Atmosphere 14 00040 g001
Figure 2. (ad) Maps and (eh) histograms of interannual (1982–2015) mean planting dates (day of the year, DOY) of rice and wheat for the farmers’ practice and monsoon onset rice planting scenarios.
Atmosphere 14 00040 g002
Figure 3. (ad) Maps and (eh) histograms of interannual (1982–2015) mean harvest dates (day of the year, DOY) of rice and wheat for the farmers’ practice and monsoon onset rice planting scenarios.
Atmosphere 14 00040 g003
Figure 4. (ad) Maps and (eh) histograms of interannual (1982–2015) mean yields of rice and wheat for the farmers’ practice and monsoon onset rice planting scenarios.
Atmosphere 14 00040 g004
Figure 5. Maps of interannual variability (standard deviation) of (a,b) rice and (c,d) wheat yields for the farmers’ practice and monsoon onset rice planting scenarios.
Atmosphere 14 00040 g005
Figure 6. Time series of mean (solid lines) and standard deviation (shaded area) temperature stress factors for (a) rice (sf1) and (b) wheat (temp_stress_photo) for the farmers’ practice and monsoon onset rice planting scenarios.
Atmosphere 14 00040 g006
Figure 7. Maps of (ad) mean yields and (eh) temperature stress factors (SF) for rice (sf1) of the composites of low (percentile 15th) and high (percentile 85th) yields for farmers’ practice and monsoon onset rice planting scenarios.
Atmosphere 14 00040 g007
Figure 8. Maps of (ad) mean yields and (eh) temperature stress factors (SF) for wheat (temp_stress_photo) of the composites of low (percentile 15th) and high (percentile 85th) yields for farmers’ practice and monsoon onset rice planting scenarios.
Atmosphere 14 00040 g008
Disclaimer/Publisher’s Note: The statements, opinions and data contained in all publications are solely those of the individual author(s) and contributor(s) and not of MDPI and/or the editor(s). MDPI and/or the editor(s) disclaim responsibility for any injury to people or property resulting from any ideas, methods, instructions or products referred to in the content.

