Article

Compact, Fast Cavity Ring-Down Spectroscopy Monitor for Simultaneous Measurement of Ozone and Nitrogen Dioxide in the Atmosphere

1
School of Pharmacy, Anhui Medical University, Hefei 230032, China
2
Department of Chemical Physics, University of Science and Technology of China, Hefei 230026, China
3
Key Laboratory of Environment Optics and Technology, Anhui Institute of Optics and Fine Mechanics, Hefei Institutes of Physical Science, Chinese Academy of Sciences, Hefei 230031, China
*
Authors to whom correspondence should be addressed.
Atmosphere 2022, 13(12), 2106; https://doi.org/10.3390/atmos13122106
Submission received: 15 November 2022 / Revised: 24 November 2022 / Accepted: 13 December 2022 / Published: 15 December 2022
(This article belongs to the Section Air Quality and Human Health)

Abstract

:
A sensitive, compact detector for the simultaneous measurement of O3 and NO2 is presented in this work. There are two channels in the detector, namely the Ox channel and the NO2 channel. In the presence of excess NO, ambient O3 is converted to NO2 in the Ox measurement channel. In both channels, NO2 is directly detected via cavity ring-down spectroscopy (CRDS) at 409 nm. At a 10 s integration time, the Ox and NO2 channels have a 1σ precision of 14.5 and 13.5 pptv, respectively. The Allan deviation plot shows that the optimal sensitivity of O3 and NO2 occurs at an integration time of ~60 s, with values of 10.2 and 8.5 pptv, respectively. The accuracy is 6% for the O3 channel and 5% for the NO2 channel, and the largest uncertainty comes from the effective NO2 absorption cross-section. Intercomparison of the NO2 detection between the NO2 and Ox channels shows good agreement within their uncertainties, with an absolute shift of 0.31 ppbv, a correlation coefficient of R2 = 0.99 and a slope of 0.98. Further intercomparison for ambient O3 measurement between the O3/NO2-CRDS developed in this work and a commercial UV O3 monitor also shows excellent agreement, with linear regression slopes close to unity and an R2 value of 0.99 for 1 min averaged data. The system was deployed to measure O3 and NO2 concentrations in Hefei, China, and the observation results show obvious diurnal variation characteristics. The successful deployment of the system has demonstrated that the instrument can provide a new method for retrieving fast variations in ambient O3 and NO2.

1. Introduction

Ozone is a key atmospheric trace gas that is produced and transported in both the troposphere and stratosphere and influences atmospheric radiation and chemical processes. Ozone precursors come from natural and anthropogenic sources, such as lightning, vegetation, wildfires, and other types of biomass and fossil fuel combustion. In the troposphere, ozone is formed mainly through photochemical reactions of nitrogen oxides and volatile organic compounds, and has important effects on radiation forcing, gaseous photochemistry, and human, animal, and plant health [1,2]. It is the main source of OH free radicals and directly affects atmospheric chemical processes [3]. Tropospheric ozone is also a potent natural and anthropogenic greenhouse gas (IPCC, 2007). In view of the profound influence of ozone in the atmosphere, it is the most commonly measured trace gas in the atmosphere, which is very important in environmental monitoring.
Ozone’s widely varying ambient mixing ratios, which range from parts per billion to parts per million, and its reactivity impose constraints on the sensitivity, dynamic range, and response rate necessary for an instrument making in-situ O3 measurements.
Optical detection technology is widely used in the measurement of environmental trace gases [4,5,6]. A number of different techniques are commonly used for in-situ O3 measurements in environmental research, including UV absorption [7], chemiluminescence [8], differential optical absorption spectroscopy (DOAS) [9], long path absorption photometry [10], and cavity-enhanced spectroscopy [11,12,13]. Because of its absoluteness, overall simplicity, and reliability, the UV absorption technology (UV-O3) is the most widely used, especially in air quality monitoring networks. It uses 254 nm ultraviolet light to measure the concentration of O3, which may be interfered with by volatile organic compounds (VOCs). The detection limit is about 1 ppbv (1 min) [14]. Chemiluminescence technology (NO-CL-O3 technology) measures the chemiluminescence of the electron-excited state of NO2 generated by the reaction of NO and O3 to obtain the concentration of NO or O3, and the detection limit can reach 0.01 ppbv. The technology requires a certain concentration of NO, a vacuum system, and must be calibrated to determine the relationship between the number of photons and the concentration of O3. It has certain applicability, but it may be affected by changes in the atmospheric water vapor concentration [8]. Differential absorption spectroscopy (DOAS) has been applied to the monitoring of atmospheric ozone by Axelsson et al. [15]. Using a high-pressure xenon lamp as the light source, the average concentration of ozone in an absorption optical path of several hundred meters can be obtained by measuring the absorption spectrum in the range of 280–290 nm. Differential absorption spectroscopy has also played an important role in the monitoring of atmospheric conventional pollutants (O3, NO2, SO2) in China.
A few comparative experiments have been conducted between UV-O3 technology, NO-Cl-O3 technology, and DOAS technology in both the ambient atmosphere and the simulation chamber. Ryerson et al. conducted a comparative experiment of airborne O3 observation and found that UV-O3 technology was in good agreement with NO-Cl-O3 technology [16]. Williams et al. found that O3 concentrations measured at an urban/industrial site and onboard a ship using UV-O3 technology were consistent with those measured using NO-CL-O3 technology and DOAS technology [17]. Spicer et al. found that the UV-O3 technique was affected by the absorption of mercury vapor at 254 nm, and the deviation in ozone concentration measured per 1 pptv of mercury vapor was 1 ppbv. At the same time, Spicer et al. also found that the deviation between the conventional UV-O3 monitor and the UV-O3 monitor fitted with a water removal device was ± 4.1 ppbv during the smog season [18]. Ollison et al. found that in hot and humid weather, the deviation between the UV-O3 monitor and NO-CL-O3 monitor may be as high as 6 ppbv [19]. Leston et al. studied the interference of some aromatic compounds on the UV-O3 monitor in the simulation chamber. In mixtures containing high concentrations of toluene and C8 aromatics (o-xylene, p-xylene, and ethylbenzene), the UV-O3 monitor overestimated ozone by 15% and 38%, respectively [20].
The concentration of VOCs and other ozone precursors is very high in China, which poses a great challenge to the accurate measurement of ozone. At the same time, in situ measurements of ozone are often conducted from airborne platforms such as airplanes and balloons to describe the photochemical and dynamic processes of the atmospheric environment. High-time-resolution measurements are needed to observe changes in the ozone mixing ratio in small-scale atmospheric structures, such as power plants, biomass combustion, and the fine structure of stratospheric invasion into the troposphere.
In view of the high sensitivity and time resolution of the cavity ring-down spectroscopy (CRDS) technique, this study applies it to the detection of atmospheric O3. This paper focuses on the accurate measurement of the quantitative conversion of O3 to NO2 using CRDS technology. The composition, performance, and possible measurement interference of the dual cavity ring-down system for measuring Ox (O3 + NO2) and NO2 are further discussed. The system is applied to the actual measurement of O3 and NO2 in the ambient atmosphere, the measured results are compared with those measured using a UV-O3 monitor, and the performance of the CRDS system is analyzed.

2. Experimental Section

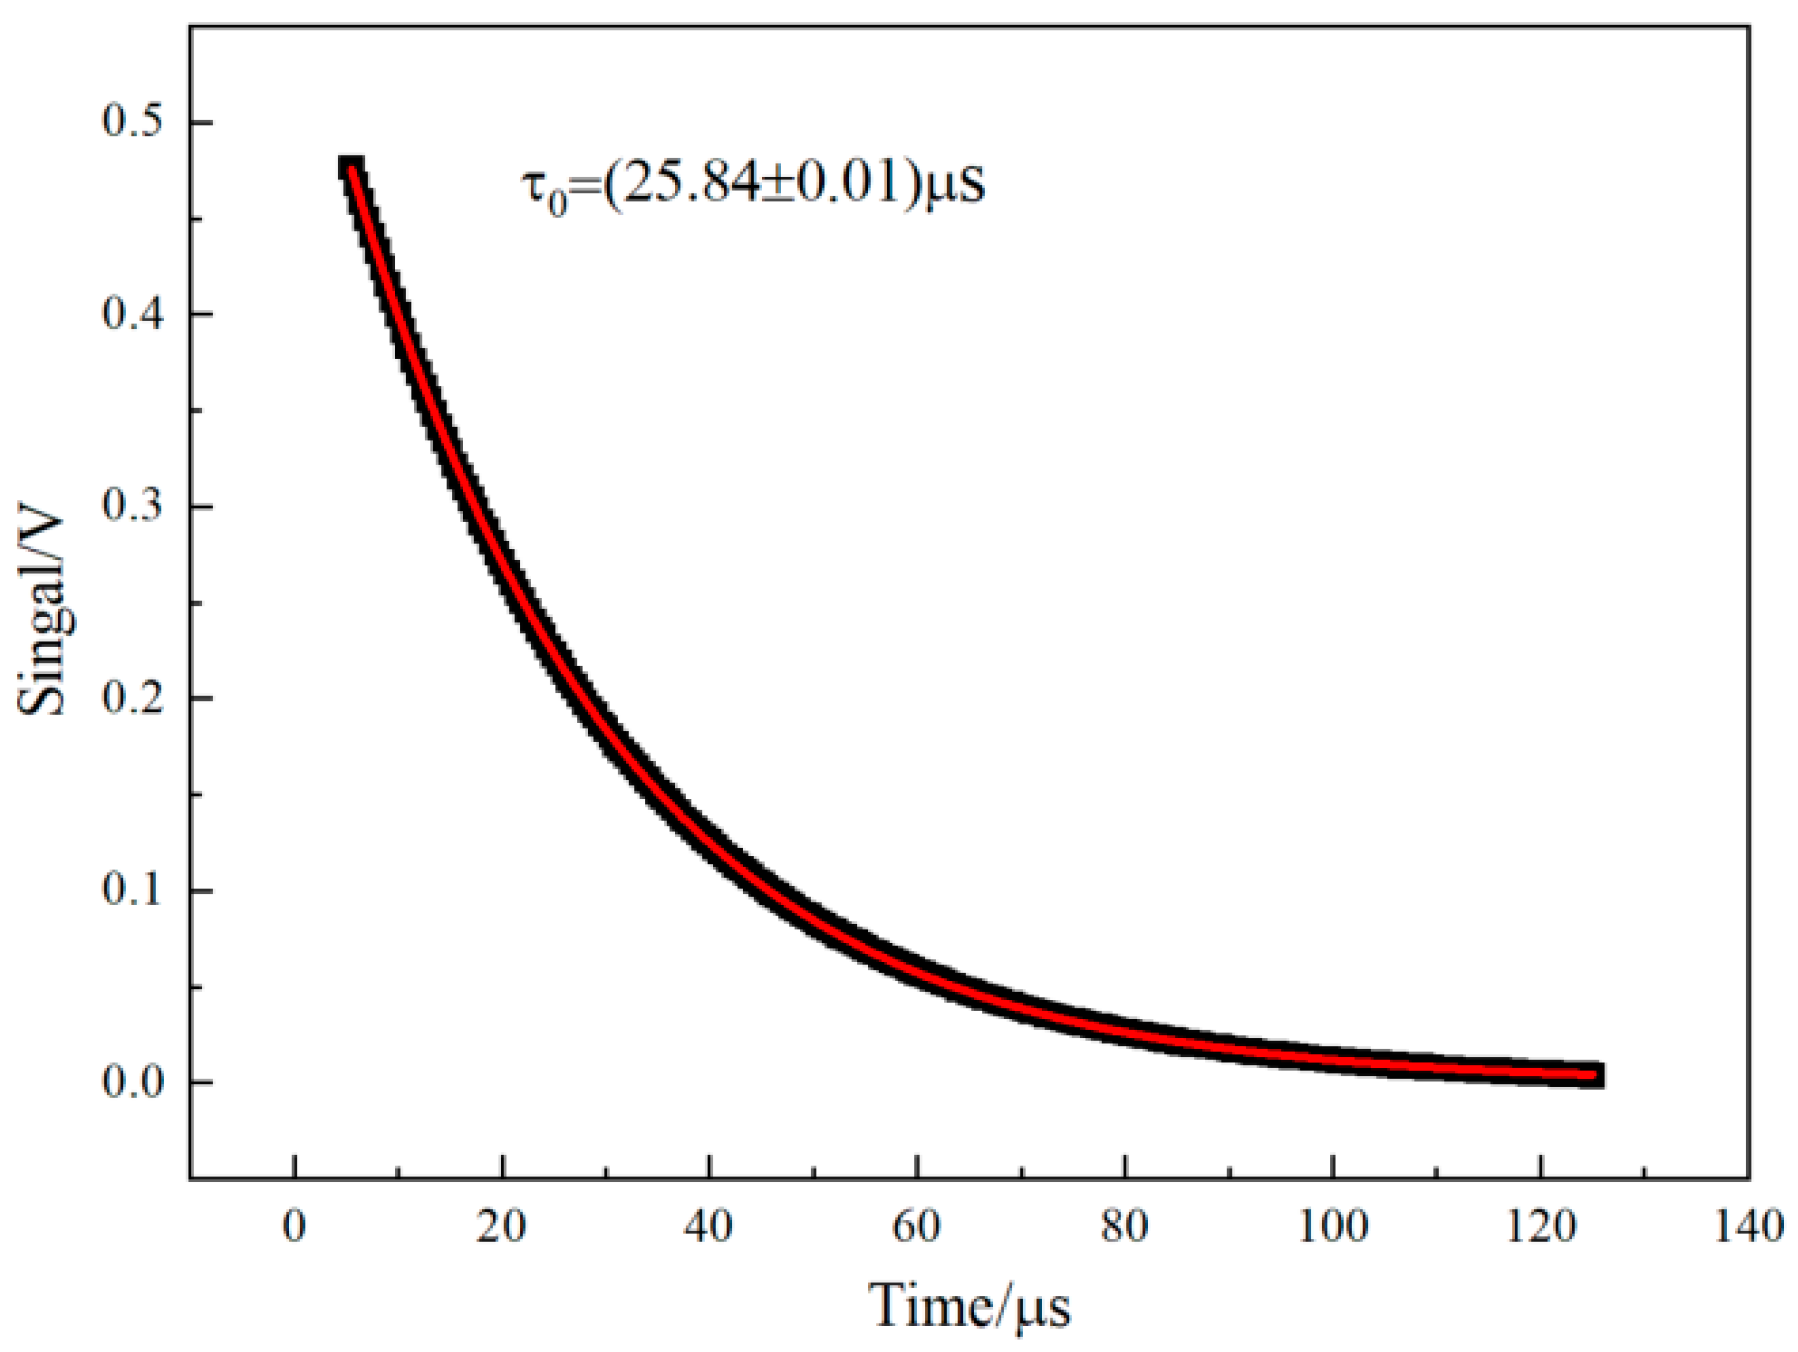
2.1. Cavity Ring-Down Spectroscopy

The CRDS measurement principle, which has been described in a previous article [21], is mainly based on the analysis of the ring-down time of the multiple reflection of light in the ring-down cavity to obtain the concentration information of the gas. The concentration of the gas to be measured in the cavity can be obtained by the following equation:
[ A ] = R L c σ ( 1 τ 1 τ 0 ) ,
In Equation (1), [A] and σ are the concentration and absorption cross-section of gas A, respectively, and c is the speed of light. R L is the ratio of the ring-down cavity length to the single absorption optical path length of the gas in the cavity. τ 0 is the background ring-down time (when there is no gas A to be measured). τ is the ring-down time (including gas A to be measured). Therefore, when the absorption cross-section of NO2 is known (it can be measured by the system τ   and   τ 0 ) , the concentration of NO2 can be calculated.

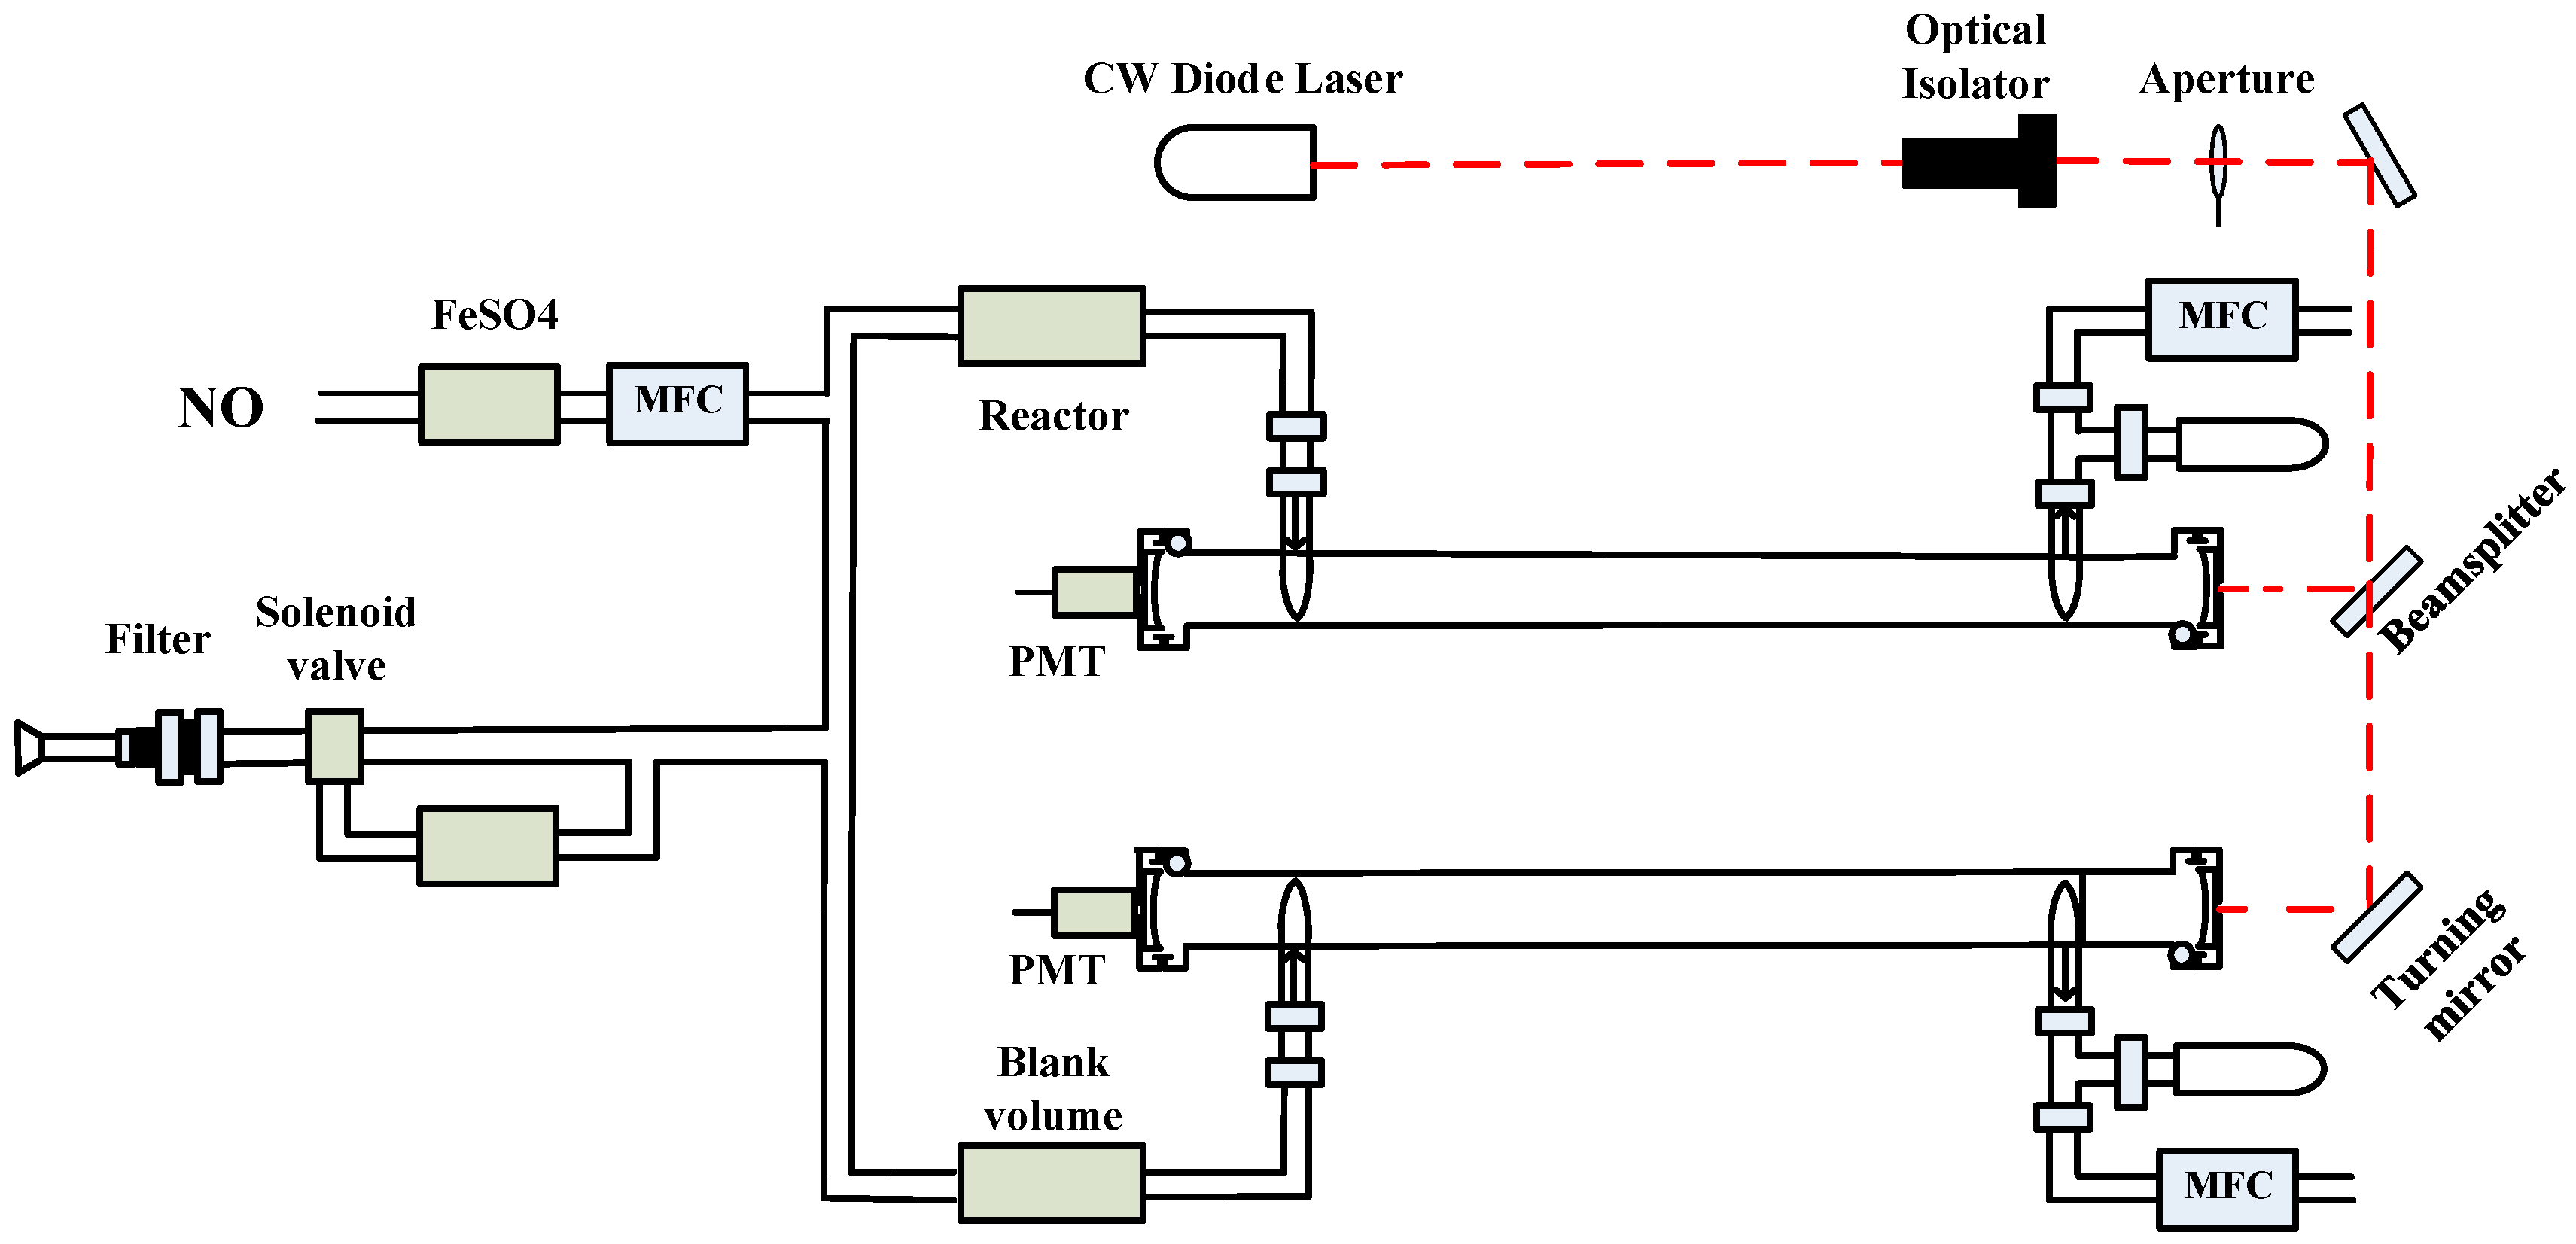
2.2. CRDS Instrument for NO2 and O3 Detection

As shown in Figure 1, the CRDS experimental system mainly includes a diode laser, timing control unit, optical isolator, diaphragm, two high-reflection cavities and two sets of high-sensitive data acquisition and processing systems. The diode laser (IQ μ, Power Technology Inc., USA) produces a continuous 409.05 nm laser with a power of 120 mW. The square wave signal with a modulation frequency of 2000 Hz and duty cycle of 50% is generated by the self-designed timing control unit to control the continuous optical diode laser and cause it to pulse the output. The laser switch response time is about 40 ns, which is far shorter than the ring-down time of the system. The laser passes through an optical isolator (IO-5-405-LP, Thorlabs) to prevent the light reflected by the high-reflection mirror from entering the diode laser and affecting the stability of the laser. After passing through a mirror, the laser is divided into two beams by a 50:50 beam splitter, each of which is directed into a ring-down cavity (along the axis of the high-reflection cavity) composed of two high-reflection mirrors (CRD Optics). Each high-reflection mirror is a 25.4 mm flat concave mirror with a curvature radius of 1 m, and the reflectivity calibrated by the manufacturer is 99.995%. To reduce the impact of the wall collision effect, perfluoroalkoxy (PFA) pipe is used to form a high-reflection cavity (cavity length: 750 mm) and air intake unit. To reduce pollution of the high-reflection mirror, high-purity N2 is used to purge the lens to ensure the stability of the system. After the modulated pulse laser enters the high-reflection cavity, the output optical signal passes through a 10 nm band-pass filter (central wavelength: 405 nm) and is received by the photomultiplier tube (PMT), then is converted into an electrical signal. The signal is averaged and fitted on the computer through the acquisition card (PCI 6132, NI) with a sampling rate of 2.5 MHz controlled by LabVIEW, and the ring-down time is obtained. The pressure in the cavity is monitored in real time through the pressure sensor (ZJ-2Y, Reborn) at the outlet of the ring-down cavity.
The air inlet of the system is mainly composed of a three-way solenoid valve controlled by the timing unit, activated carbon adsorbent, MnO2 adsorbent, and a pressure regulating valve. Once the atmosphere is sampled using the sampling pipe, the flow direction of the gas is controlled by the three-way solenoid valve. When the gas flow passes through the pressure-regulating valve, the ring-down chamber measures the ring-down time (containing absorbed NO2 converted from NO2 or O3). When the gas flow passes through the activated carbon adsorbent and MnO2 adsorbent (the activated carbon adsorbent will adsorb trace gases such as NO2 and O3, and the MnO2 adsorbent will remove any remaining O3), the ring-down cavity measures the background ring-down time (measuring zero air). Through the timing control of the three-way solenoid valve, the ring-down time and the background ring-down time are each measured. The background ring-down time is measured every 10 min to reduce the measurement error caused by small changes. The real-time concentration of NO2 (or Ox) can be calculated according to Equation (1).

3. Results and Discussion

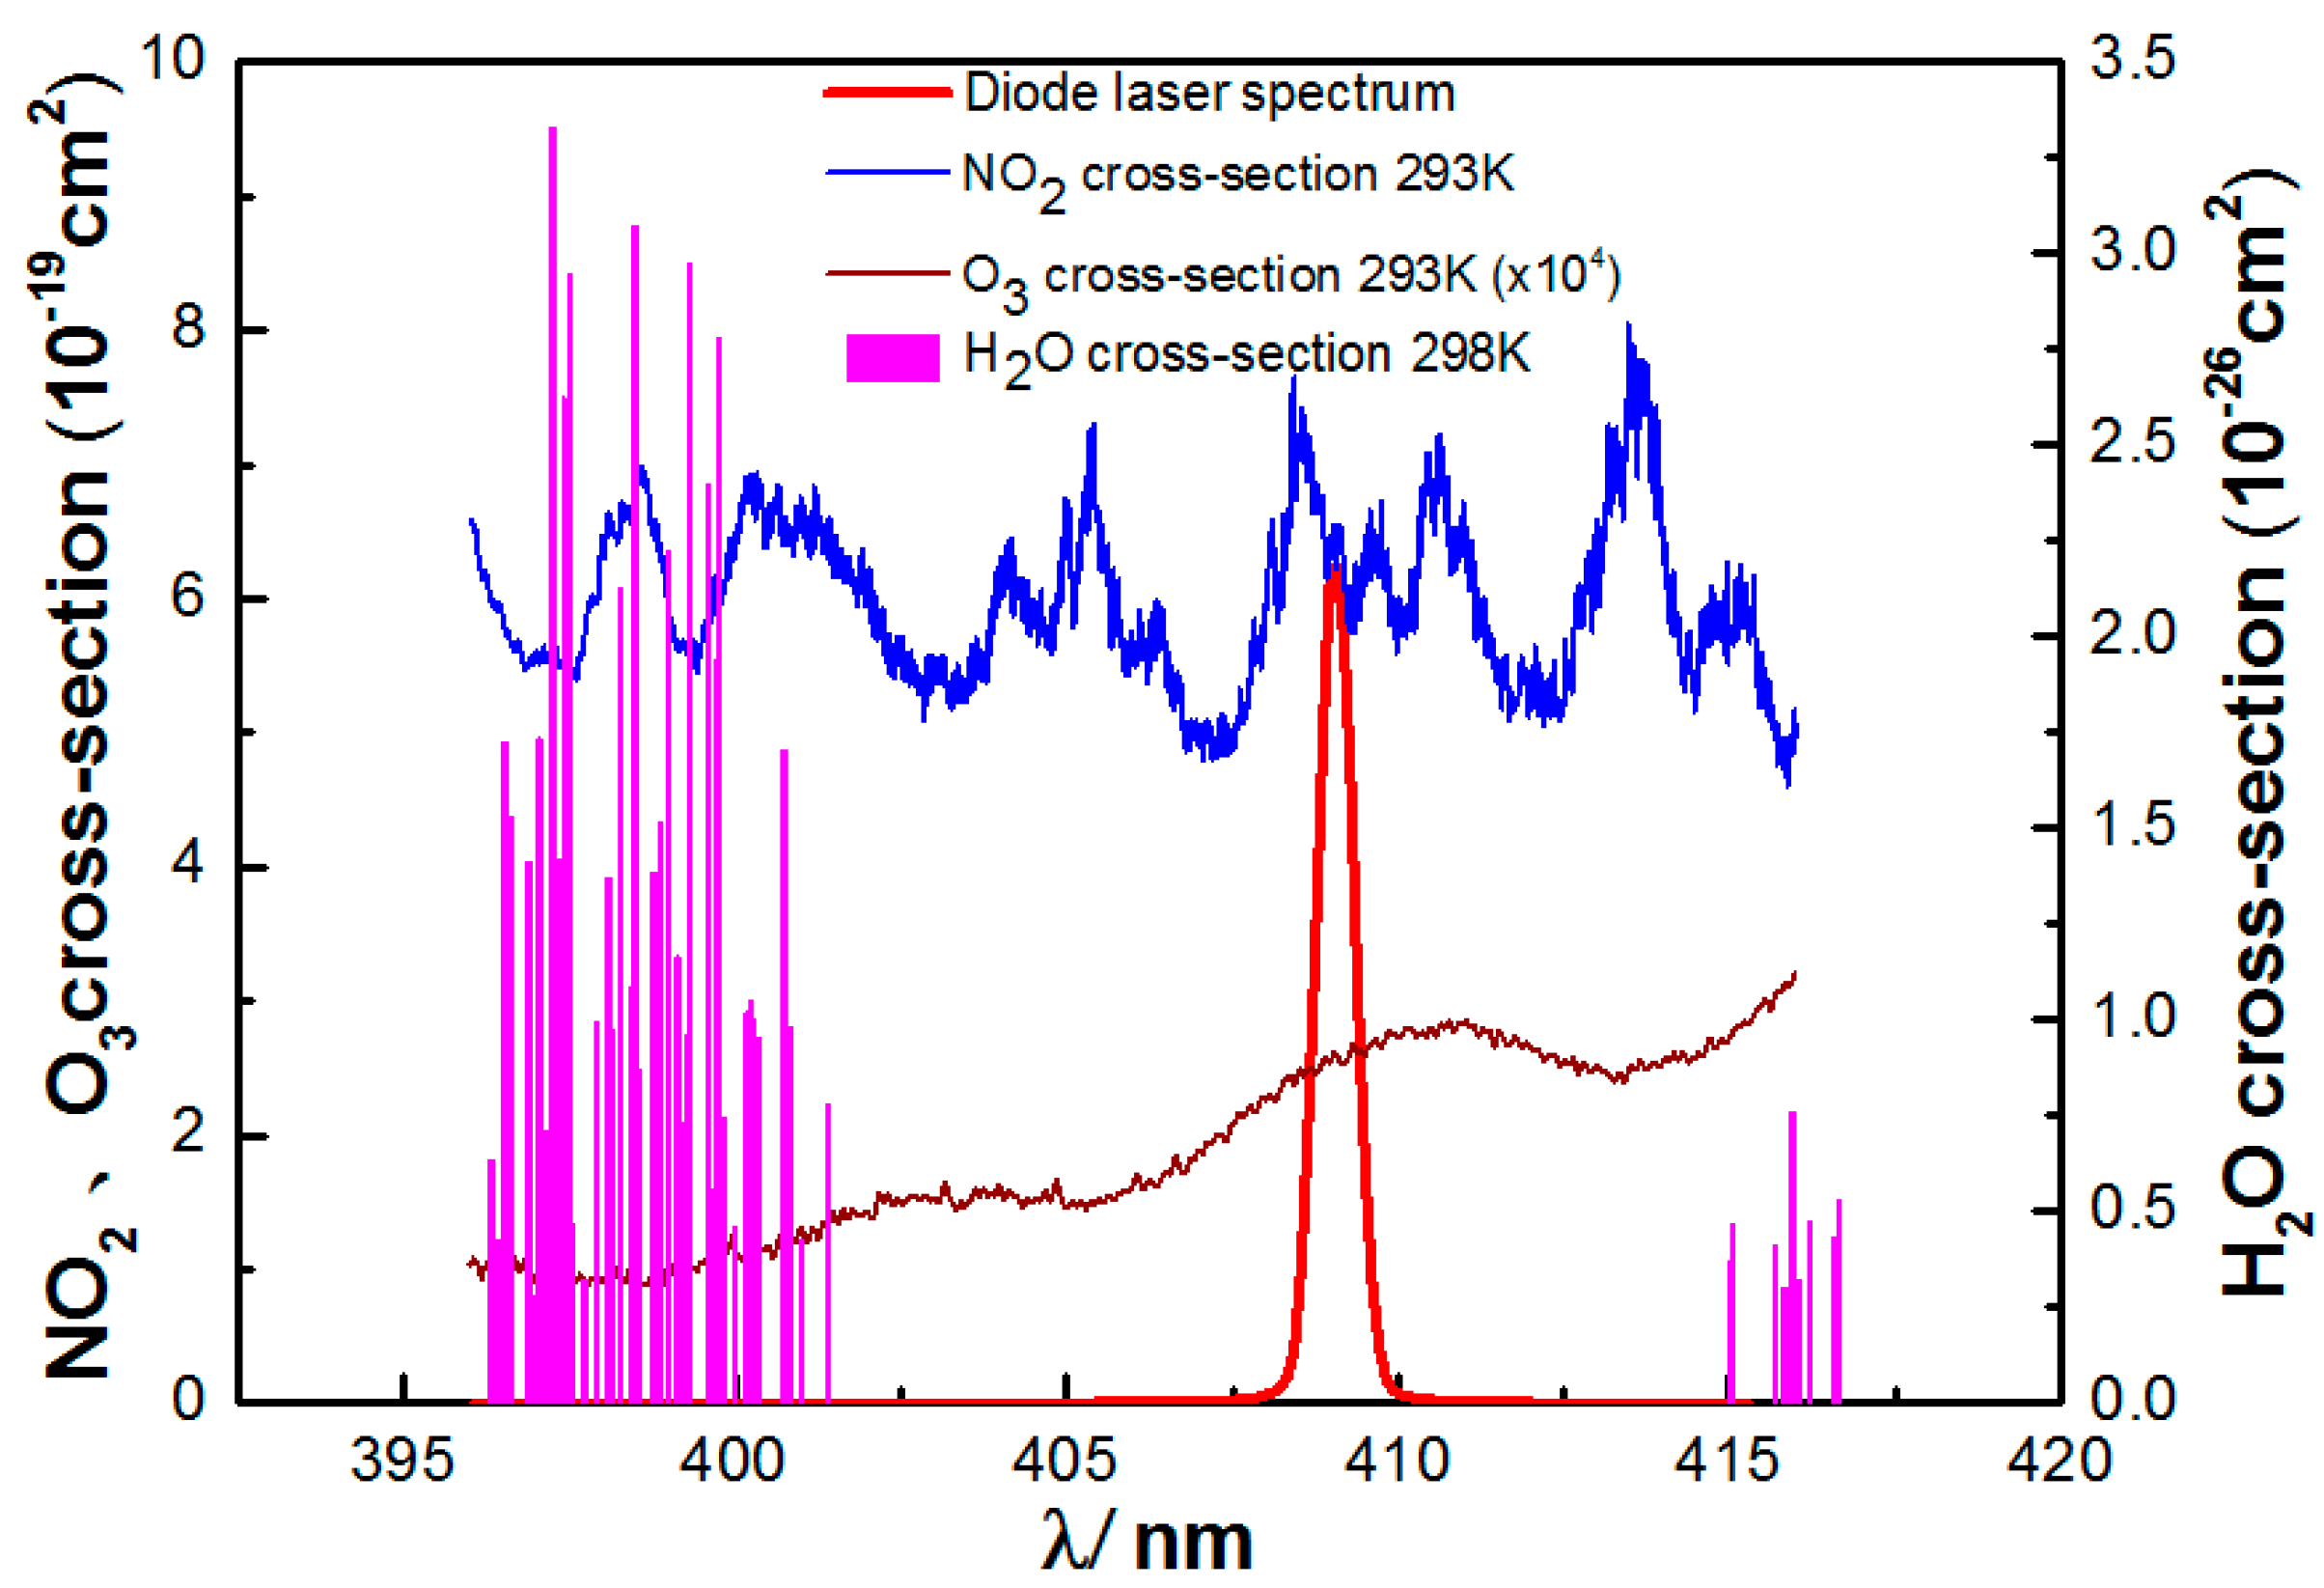
3.1. Effective NO2 absorption cross-section

It is very important to determine the effective absorption cross-section of NO2 for accurately quantifying the concentration of NO2 (or Ox). In this study, the high-resolution absorption cross-section of NO2 is convolved with the laser spectrum to obtain the effective absorption cross-section of the system. The diode laser manufacturer only provides a laser wavelength of 410.2 nm for continuous output, and NO2 has a complex absorption structure in this spectral region. Thus, a more accurate laser wavelength and its half-height linewidth are needed to determine the absorption cross-section of NO2. When the diode laser is externally modulated, its laser wavelength appears as a blue shift. In this system, the diode laser is pulse modulated using a square wave signal with a modulation frequency of 2000 Hz and duty cycle of 50%. The laser wavelength and linewidth of its output are measured using a grating spectrometer (SR303i, Andor). Figure 2 shows that the center wavelength of the modulated laser is 409.05 nm and the FWHM is 0.65 nm. In addition, the water vapor absorption spectrum [22] (as shown by the pink line in Figure 2) obtained from the HITRAN database shows that H2O is not absorbed between 402 nm and 415 nm. The laser wavelength needs to be selected within this range to avoid absorption interference by H2O. This improves the accuracy of the measurement, as there is no need to dry the sampled gas. Figure 2 also shows the absorption cross-section of NO2 [23], and the effective absorption cross-section of the system obtained when convoluting it with the measured laser spectrum is 6.22 × 10⁻¹⁹ cm2 molecule−1. The stability of the laser wavelength was studied, and it is capable of maintaining the accuracy of the effective absorption cross-section of NO2.

3.2. Zero Measurement

The background ring-down time (τ0) must be measured regularly, considering the potential shift of τ0 due to changes in temperature, pressure, mirror reflectance, and the stability of the cavity. The measured background ring-down time, measured by placing zero air without NO2 directly into the sampling system, exhibits good stability. However, because of the extremely low water vapor content in the zero air, which changes the Rayleigh scattering of water vapor, there is still a certain error in the measurement of τ0. At the same time, owing to the need to carry zero air in the field measurement, the operation is not convenient. Therefore, in this system, an automatic switching air circuit was designed through the solenoid valve. Ambient air is directly introduced into the ring-down cavity after absorbing NO2 through activated carbon to measure the background ring-down time. It has very good stability, and the standard deviation of the background ring-down time (time resolution of 1 s) is less than 0.02 μs within a 10 min interval. Since the absorption of water vapor by activated carbon is very small, the influence of the Rayleigh scattering change can be ignored. The adsorption effect of activated carbon was tested in the laboratory. In comparing new activated carbon and activated carbon used for 30 days, there was little difference in their adsorption effects. The background ring-down signal measured by the system is shown in Figure 3, where it shown to have good single exponential characteristics, and thus the background ring-down time can be obtained via fitting.

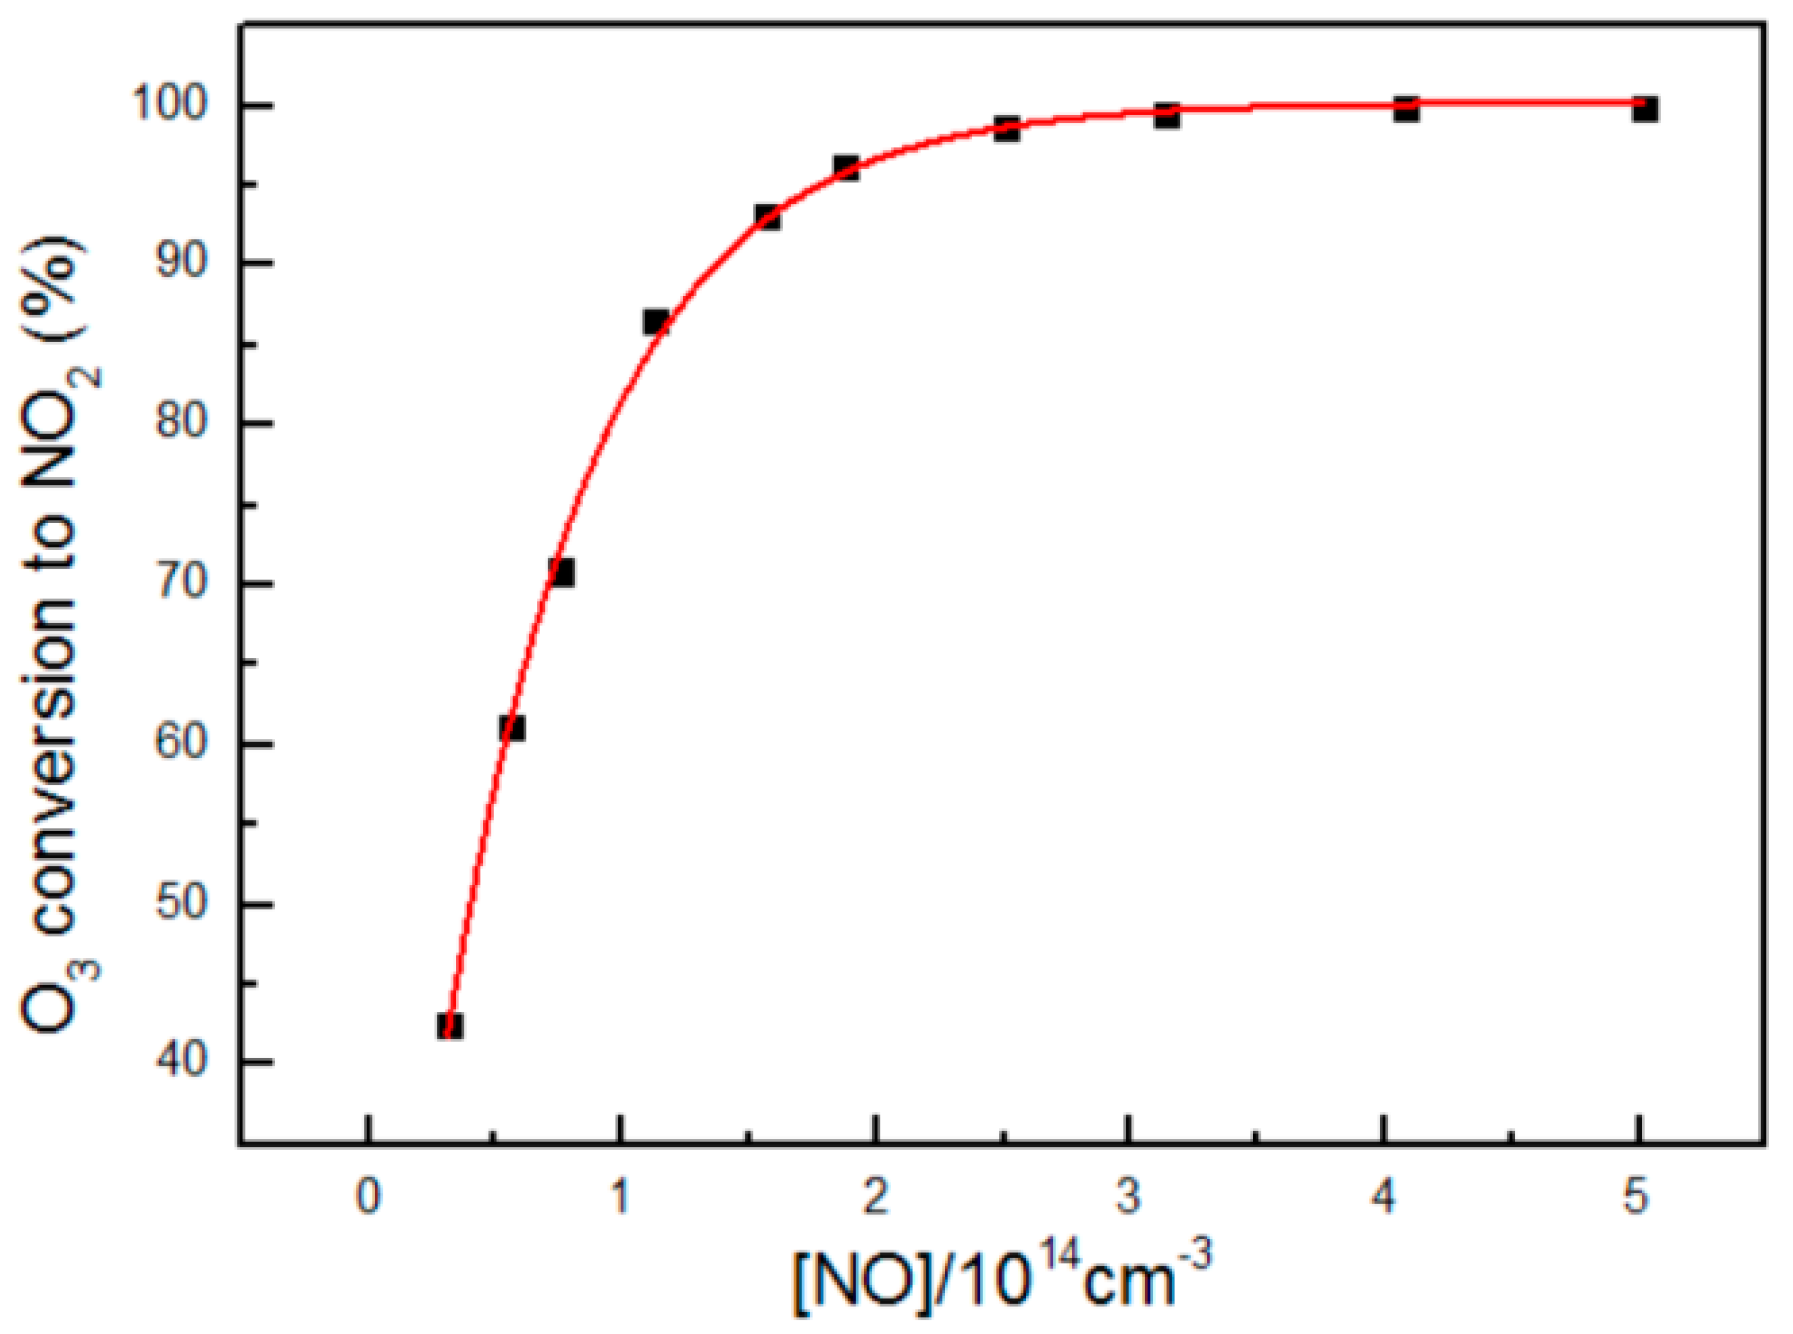
3.3. O3 conversion Efficiency

Real-time measurement of O3 requires simultaneous measurement of two ring-down cavities. One ring-down cavity measures the concentration of Ox in real time, and the other ring-down cavity measures the concentration of NO2 synchronously. The concentration of O3 can be calculated via the differences between the measurement results of the two ring-down cavities. Therefore, the premise of accurately measuring O3 concentration is to determine the conversion rate of O3 to NO2 according to the following reaction:
NO + O 3 NO 2 + O 2 ,
The reaction rate of (2) is k = 3.0 × 10⁻¹²exp(−1500 K/T), that is, at 298 K, k = 2 × 10⁻¹⁴ cm3 molecule−1 s−1 [24]. NO cylinder gas (502 ppmv, Nanjing special gas) is injected into the sampling gas path through the solenoid valve, and its flow is controlled using a flowmeter. The sampling gas flow of the system is 2 L/min, and the reaction time of NO and O3 in the sampling gas path is about 0.83 s. The relationship between the O3 conversion rate and NO concentration measured in the laboratory is presented in Figure 4, where it is shown to have a very good single exponential relationship. In other words, reaction (2) can be regarded as a pseudo first-order reaction (i.e., NO is completely in excess). Specifically, when the concentration of NO is 10 ppmv, the conversion rate of O3 is 98.6% in the sampling gas flow with an O3 concentration of 220 ppbv. When measuring the atmospheric O3 concentration, the difference between the Ox cavity and the NO2 cavity is corrected using the conversion rate.

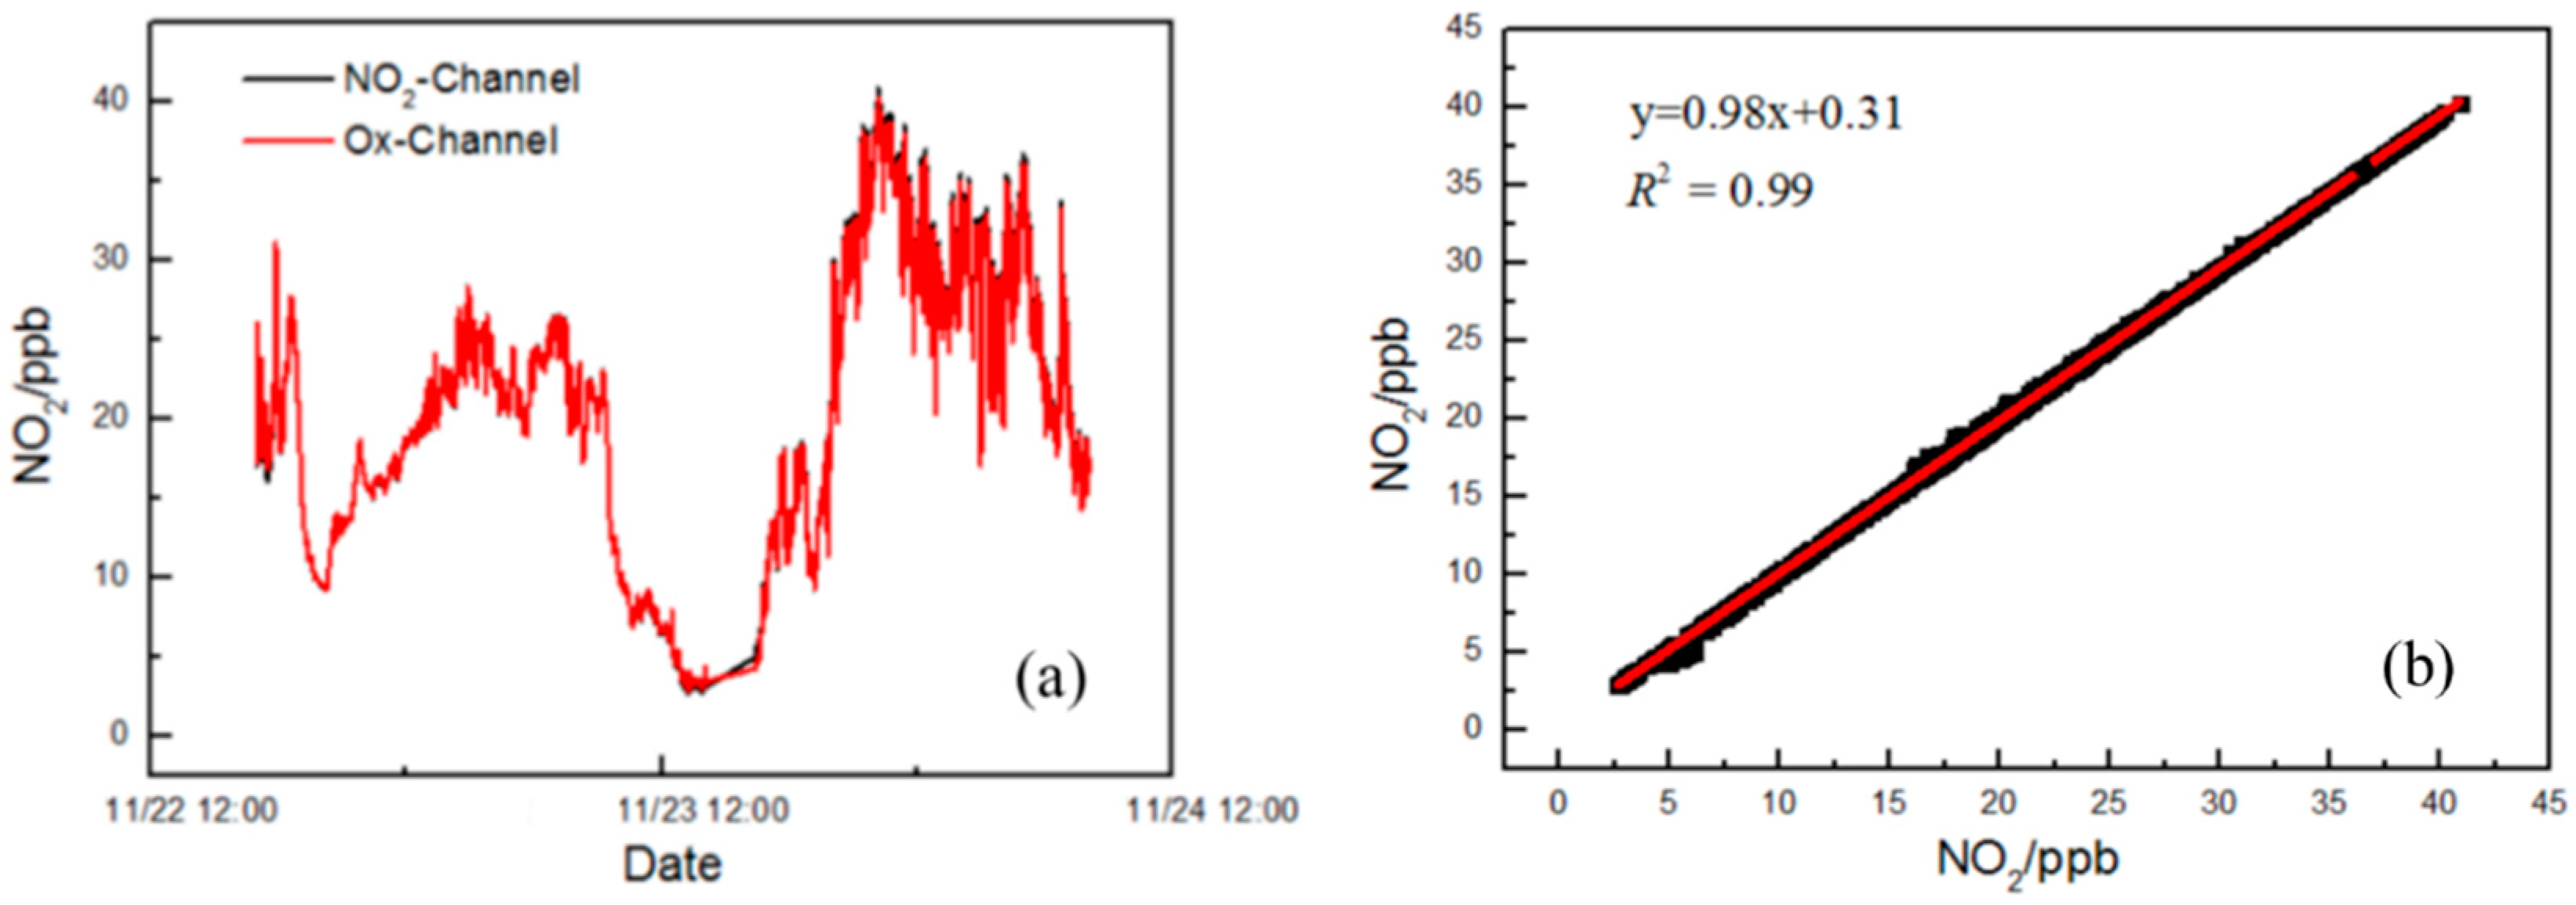
3.4. Consistency of NO2 Measurement

To accurately obtain the concentration of O3, it is necessary to ensure that the measurement of NO2 in the two ring-down cavities has very good consistency. During measurement of the actual ambient atmosphere, NO is not added to the sampling gas path, and the two ring-down cavities are both used to measure NO2. The ambient atmospheric NO2 concentration measured continuously for 39 h is shown in Figure 5. The measurement results of the two chambers are very consistent. The correlation analysis shows that the slope is 0.98 and the intercept is 0.31. The small difference between the measurements of the two ring-down cavities will be further corrected to achieve an accurate measurement of O3 concentration.

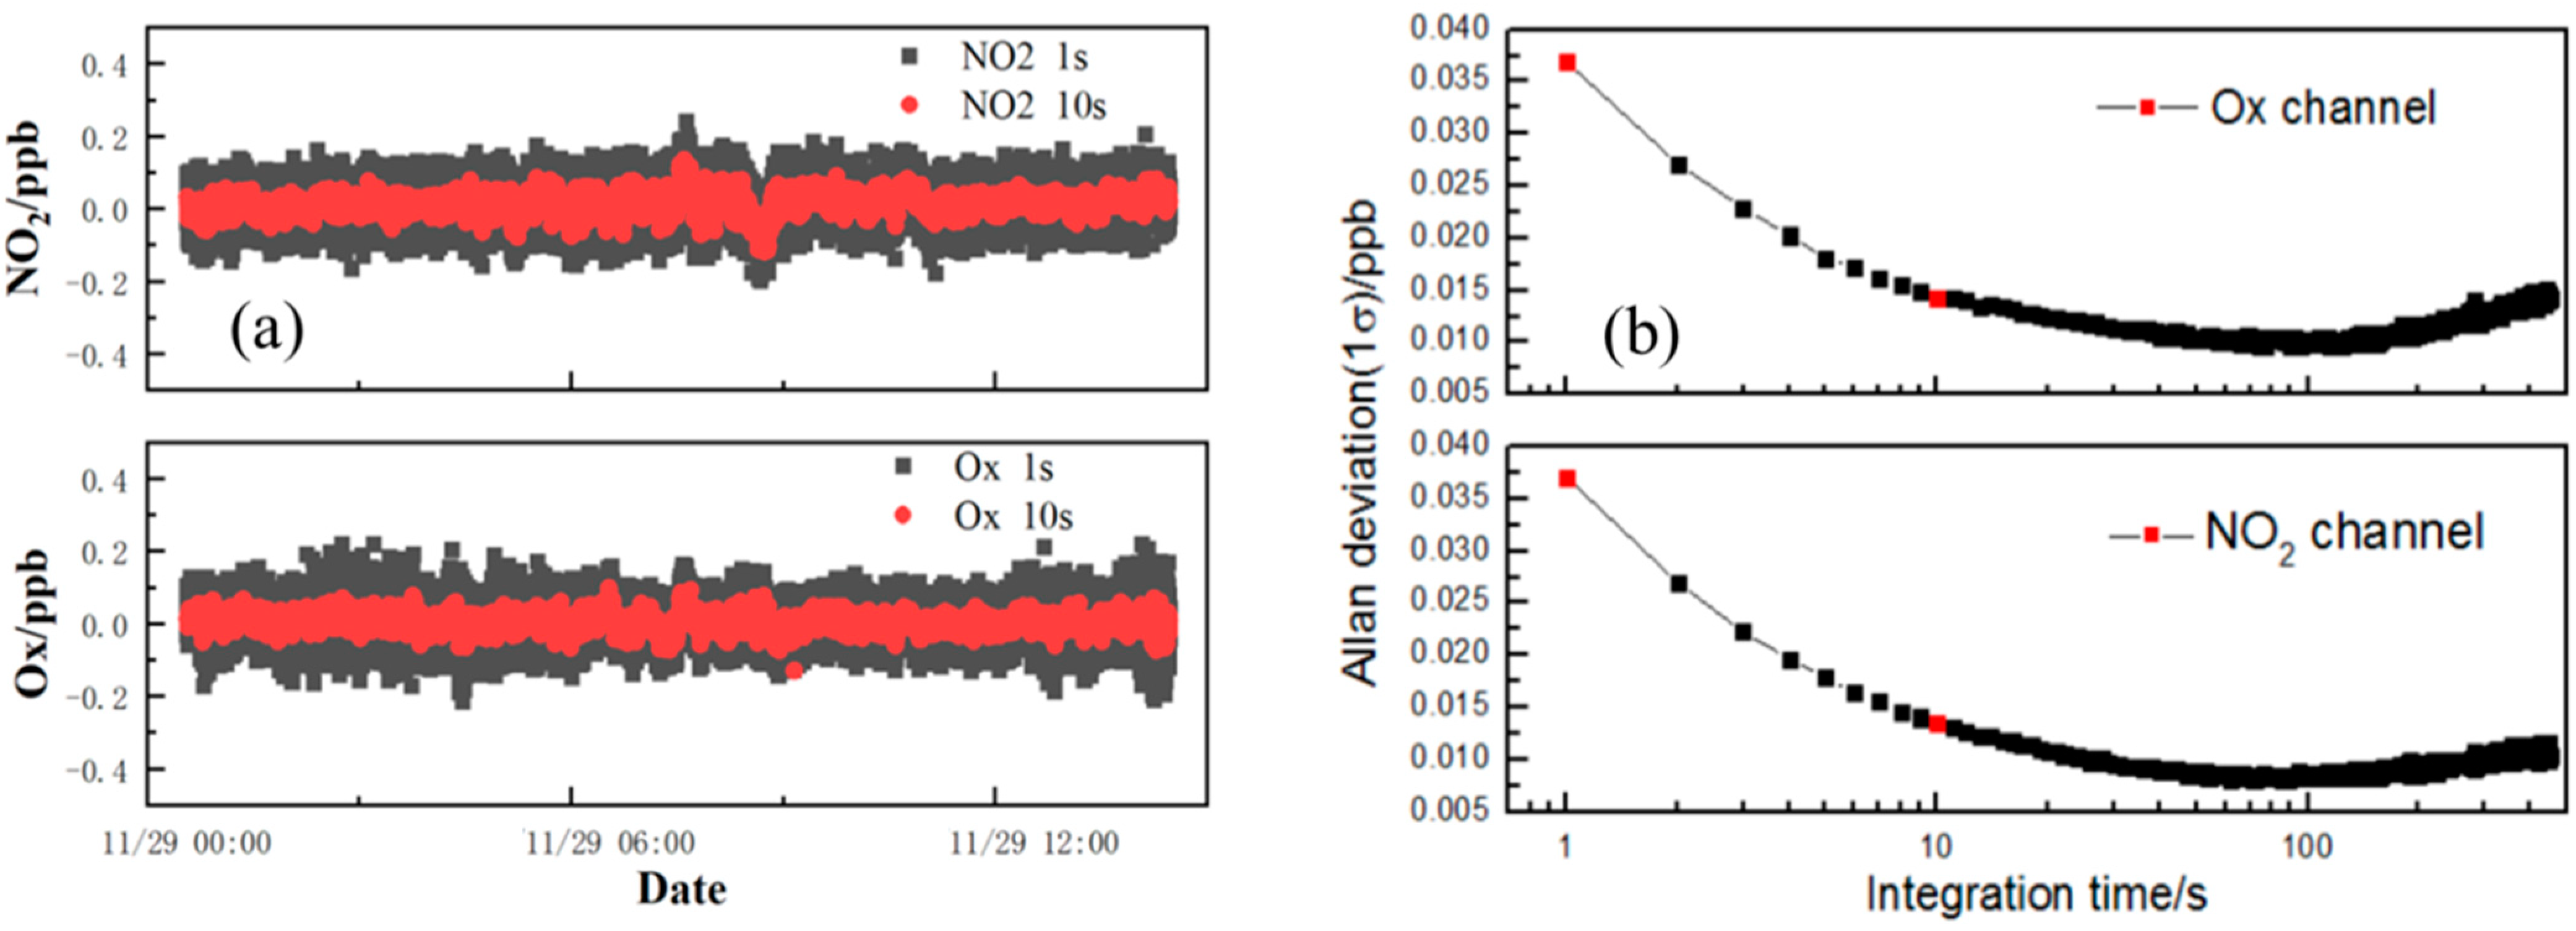
3.5. NO2 and O3 Detection Performance

The stability of the two ring-down cavities and the deviation of the measured results were investigated by directly measuring the ambient atmosphere after passing through the activated carbon adsorbent and MnO2 adsorbent. Figure 6 shows the results of continuous measurement for 15 h, with a time resolution of 1 s. The measurement results of the NO2 cavity are between −120 and 120 pptv and the measurement results of the Ox cavity range from −150 to 150 pptv (1 s).
The detection limit of the cavity ring-down system can be obtained by the following equation:
[ O x ] min = R L c σ ( τ 0 τ ) min τ 0 2 = R L c σ Δ τ τ 0 2 R L c σ 2 σ ( τ 0 ) τ 0 2 ,
where [Ox]min represents the detection limit of the Ox gas in the system;   Δ τ indicates the stability of the background ring-down time, which is generally defined as   2   σ ( τ 0 )   [25]; and RL is obtained by laboratory measurement, which is 1.09 in this system [25]. The minimum detection limits for the NO2 and Ox channels are determined as 36.9 and 37.5 pptv, respectively, at an integration time of 1 s, which are close to the values obtained from the Allan variance analysis described below. Allan variance analysis was performed to further explore the detection performance of the system, and the results are shown in Figure 6b. The detection limits are 13.5 and 14.5 pptv (10 s) for the NO2 and Ox channels, respectively. The minima in the Allan plots indicate that the optimum average time for optimum detection performance is about 60 s. With a 60 s integration time, the detection limits are 8.5 and 10.2 pptv for the NO2 and Ox channels, respectively, which are more suitable for measuring the background area.
A comparison of detection performance between this system and other O3 instruments is presented in Table 1.
Considering that the error of the NO2 absorption cross-section is about 4% [25], the measurement error of the RL value is about 3%, and other errors (e.g., pressure, temperature) are about 1%, then the total uncertainty of NO2 and O3 measurement via CRDS is estimated to be 5% and 6%, respectively.

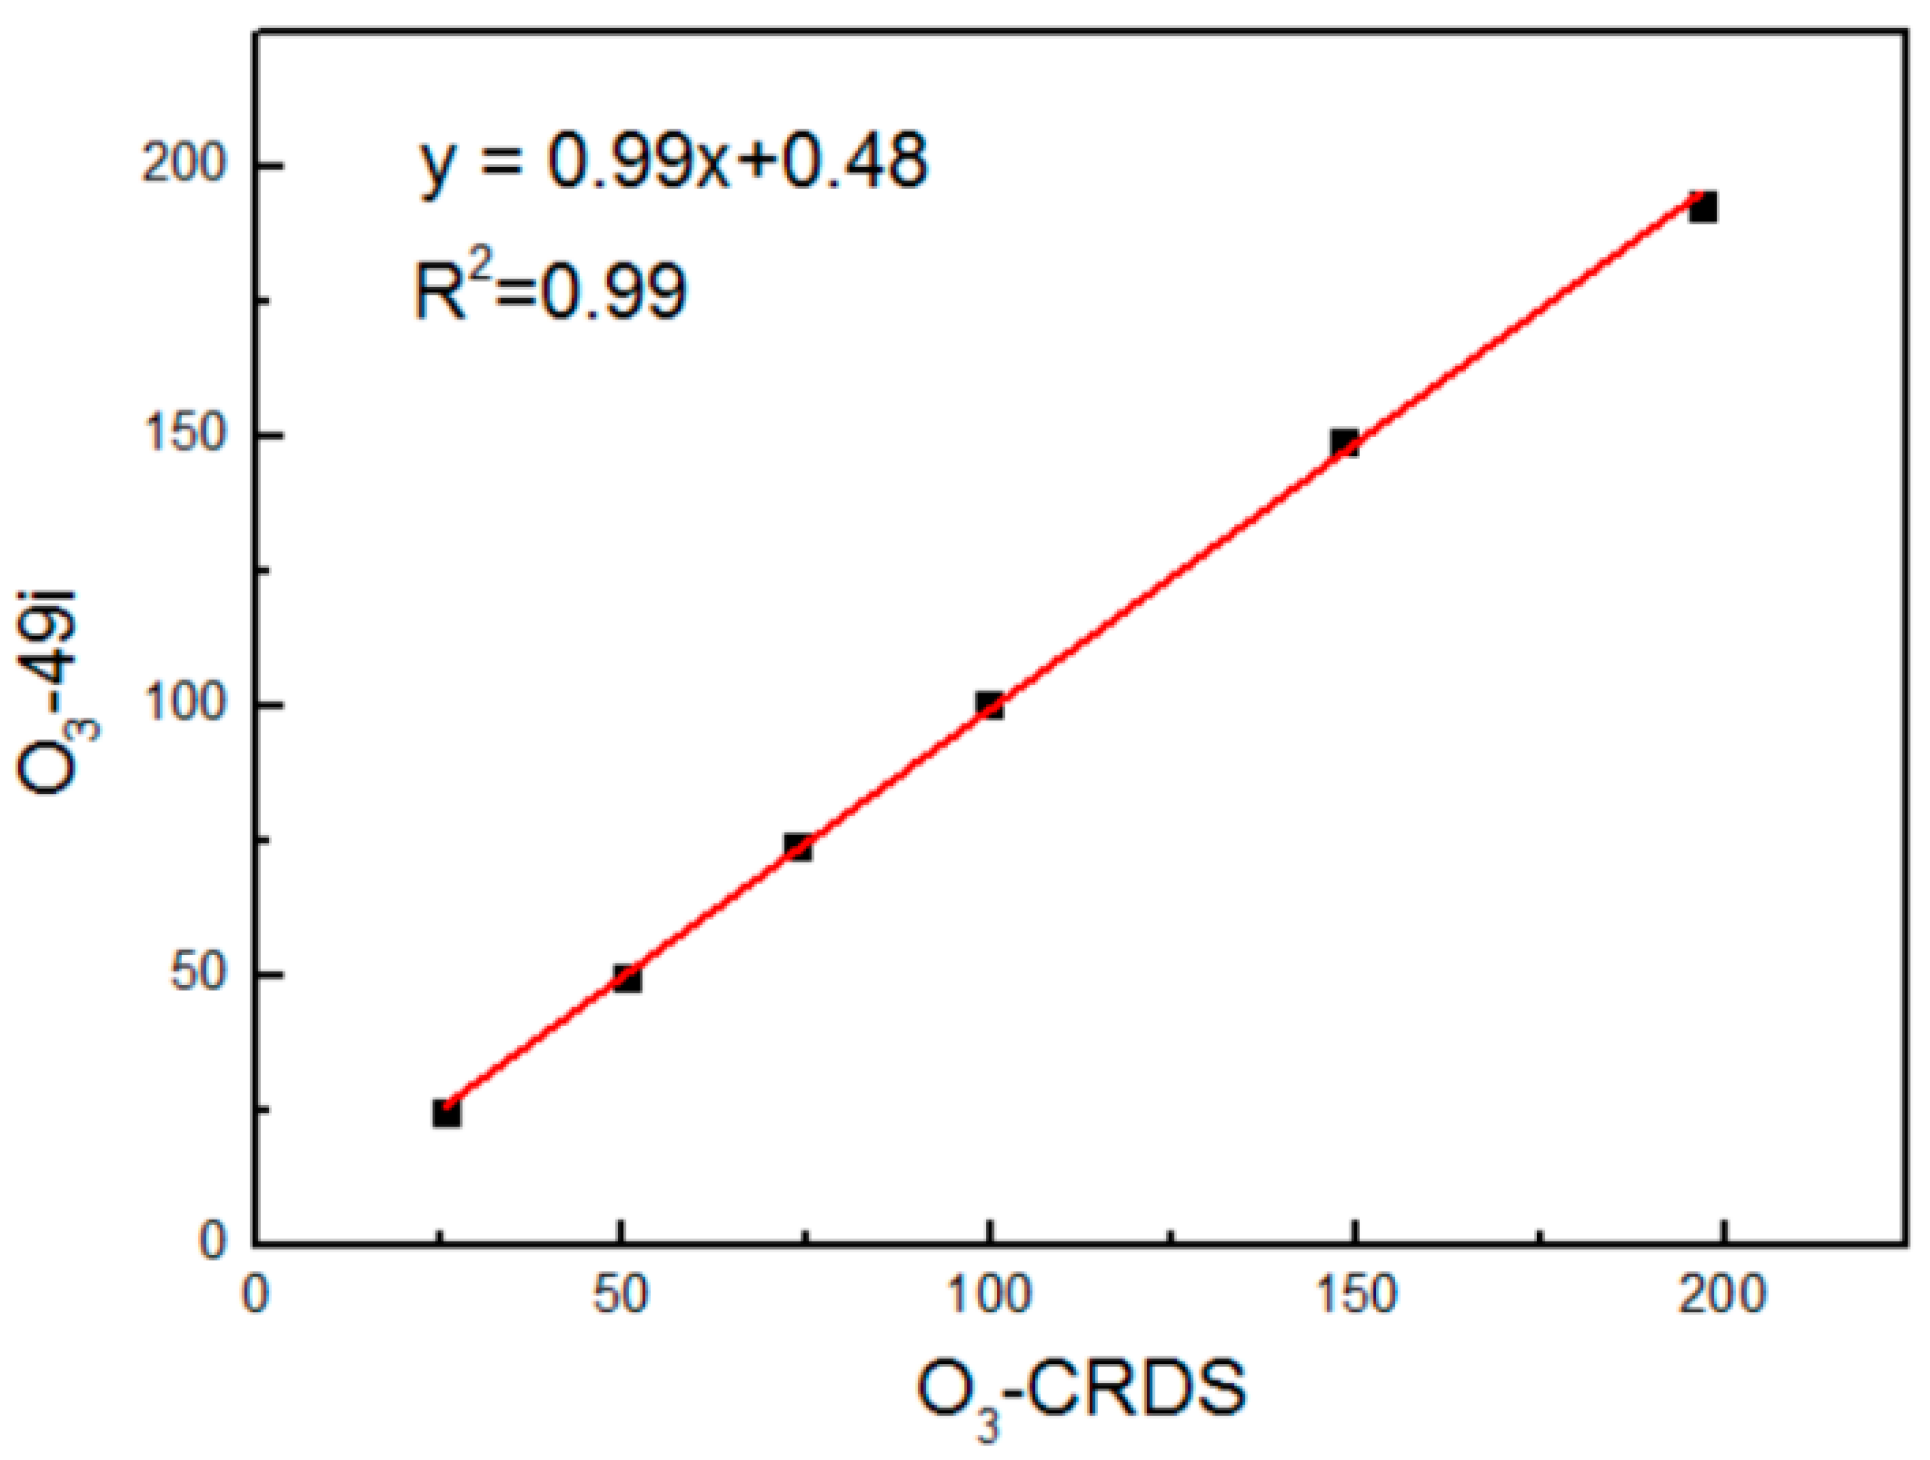
3.6. Assessment of O3/NO2-CRDS Measurement Accuracy

The accurate measurement of NO2 was achieved based on cavity ring-down technology, but to determine the measurement accuracy of the O3/NO2-CRDS system, it was necessary to conduct a comparison of O3 measurements in the laboratory. Ozone at a concentration of 500 ppbv was produced using an ozone generator, and two flowmeters were used to control the flows of ozone and N2, resulting in an ozone concentration range of 20 to 200 ppbv. Because the concentration deviation of O3 produced by the ozone generator is relatively large, and in addition there is a certain error associated with obtaining different concentrations of ozone via the dilution method, here the accuracy of the O3/NO2-CRDS measurement was determined by comparing to the measurement of an ozone analyzer. Specifically, the diluted O3 was sampled through a sampling gas path and then divided between the O3/NO2-CRDS and ozone analyzer (Thermo Electron Scientific 49i) for synchronous detection. The measurement results are shown in Figure 7. The results of the two systems have good consistency, with a slope of 0.99, an intercept of only 0.48 ppbv, and a linear correlation of 0.99. The results show that O3/NO2-CRDS has good detection performance, and the calibration of the ozone conversion rate of the system is also very accurate. Furthermore, these results also indicate that this system is suitable for the monitoring of O3 in the ambient atmosphere.

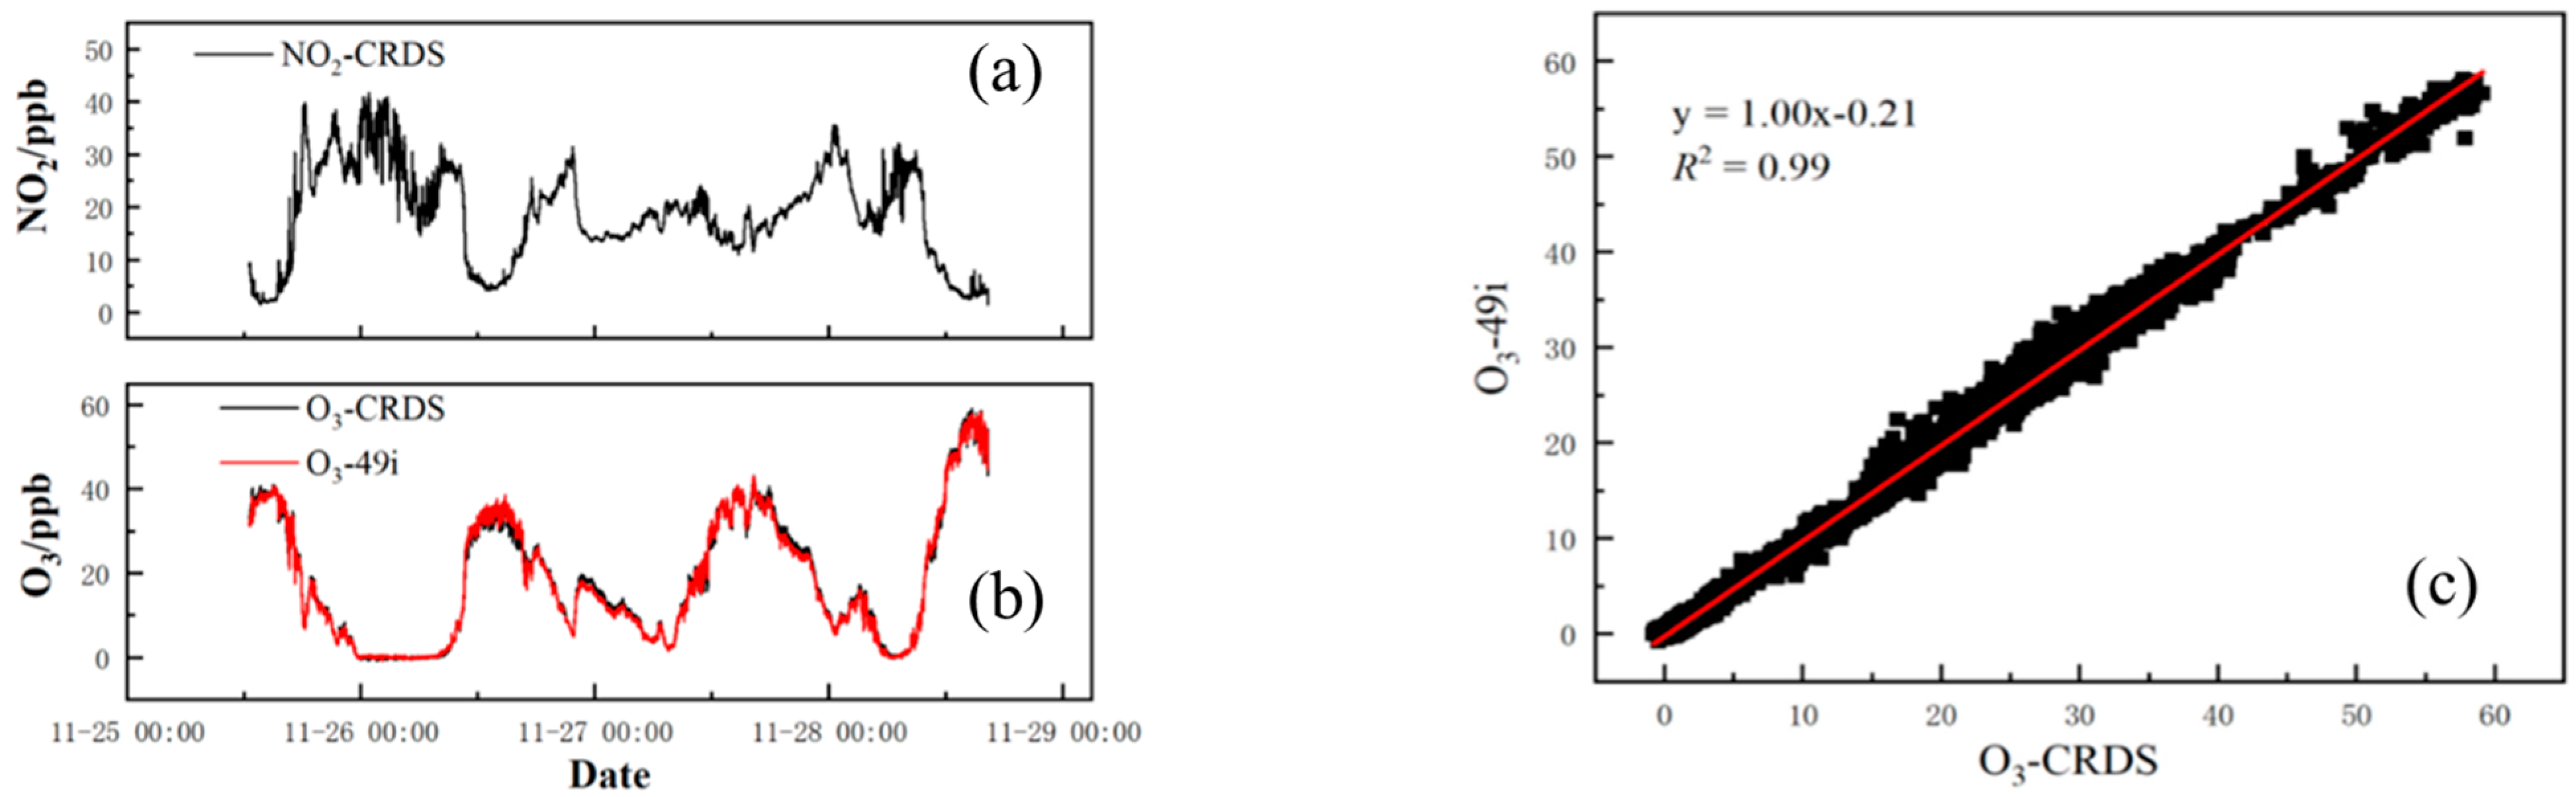
3.7. Field Measurement and Intercomparison

To further verify the field detection performance of the O3/NO2-CRDS, the online measurement of ambient atmospheric O3 and NO2 was conducted at Hefei Science Island in November 2021. Science Island is located in the northwest suburb of Hefei, about 12 km away from the city center. The ambient air was sampled at the top of the laboratory building (28 m tall). A polytetrafluoroethylene (PTFE) filter with a pore size of 0.22 μm (Millipore, 47 mm diameter) was installed at the top of the sampling tube to remove particles that can cause large laser light scattering. The length of the PTFE tube (inner diameter 4.6 mm) from the sampling point to the cavity was 3 m. The ambient air was aspirated through the tube with a diaphragm pump (KNF, N86KNE) at a rate of 2 L min−1. Figure 8 shows the results of the simultaneous measurement of ambient NO2 and O3 for 76 h. The NO2 concentrations in the daytime are relatively lower than those in the nighttime. Photodissociation of NO2 by sunlight and convective mixing in the boundary layer can account for the relatively low level of NO2 in the daytime. The NO2 photodissociation produces the O(3P) atom, which is followed by O3 formation through the recombination reaction. Therefore, the concentration of ozone is high during the day and low at night. NO2 and O3 have obvious diurnal variation characteristics. To further explore the accuracy of the atmospheric O3 measurement, the concentration of O3 in the sample air was simultaneously measured with the ozone analyzer 49i (Figure 8, red line). The ozone concentrations measured using the O3/NO2-CRDS and 49i exhibit very good consistency. The correlation analysis shows that the slope is 1, the intercept is −0.21 ppbv, and the linear correlation is 0.99. The O3/NO2-CRDS system has better field detection ability. Compared with the ultraviolet absorption method (49i), it has a better detection limit and time resolution, and is more suitable for ground-based, vehicle-mounted, airborne, and other multi-platform applications.

4. Conclusions

A cavity ring-down spectrometer with adequate selectivity and sensitivity for in situ simultaneous measurements of O3 and NO2 in the troposphere was developed. It offers accuracy comparable to commercial UV absorption instruments, but with substantially improved sensitivity and time response. The instrument described here demonstrates an accuracy of 6%, detection sensitivity of 14.5 pptv in ambient air after absorption by the activated carbon adsorbent and MnO2 adsorbent, and a 10 s time resolution. The O3/NO2-CRDS instrument was compared in the laboratory and in the field with an 49i ozone analyzer under a variety of sampling conditions. The O3/NO2-CRDS and 49i O3 measurements were highly correlated over wide concentration ranges of O3 and were within the combined stated measurement uncertainties. The combination of simultaneous NO2 and O3 measurements offers additional advantages in convenience and accuracy over existing instruments. Commercial UV absorbance instruments do not offer NO2 measurements. Thus, this instrument represents a simple, robust, and potentially low-cost method for these two related measurements.

Author Contributions

Conceptualization, X.L., Y.C. and R.H.; methodology, X.L. and R.H.; formal analysis, X.L. and R.H.; investigation, X.L., H.T., H.X. and Z.H.; resources, R.H.; writing—original draft preparation, X.L.; writing—review and editing, Y.C. and R.H.; All authors have read and agreed to the published version of the manuscript.

Funding

This research was funded by the National Natural Science Foundation of China (61905003, 62275250), the Natural Science Foundation of Anhui Province (No. 2008085J20), the Anhui Provincial Key R&D Program (2022l07020022) and the National Key R&D Program of China (2017YFC0209401).

Institutional Review Board Statement

This is not applicable.

Informed Consent Statement

This is not applicable.

Data Availability Statement

The data used in this research are available upon request from the corresponding authors.

Acknowledgments

The authors would like to thank the anonymous reviewers for providing invaluable comments on the original manuscript.

Conflicts of Interest

The authors declare no conflict of interest.

References

  1. Ashmore, M.R. Assessing the future global impacts of ozone on vegetation. Plant Cell Environ. 2005, 28, 949–964. [Google Scholar] [CrossRef]
  2. Mudway, I.S.; Kelly, F.J. Ozone and the lung: A sensitive issue. Mol. Asp. Med. 2000, 21, 1–48. [Google Scholar] [CrossRef] [PubMed]
  3. Levy, H. Normal atmosphere: Large radical and formaldehyde concentrations predicted. Science 1971, 173, 141–143. [Google Scholar] [CrossRef]
  4. Qiao, S.D.; Sampaolo, A.; Patimisco, P.; Spagnolo, V.; Ma, Y.F. Ultra-highly sensitive HCl-LITES sensor based on a low-frequency quartz tuning fork and a fiber-coupled multi-pass cell. Photoacoustics 2022, 27, 100381. [Google Scholar] [CrossRef] [PubMed]
  5. Wang, F.Y.; Hu, R.Z.; Chen, H.; Xie, P.H.; Wang, Y.H.; Li, Z.Y.; Jin, H.W.; Liu, J.G.; Liu, W.Q. Development of a field system for measurement of tropospheric OH radical using laser-induced fluorescence technique. Opt. Express 2019, 27, A419–A435. [Google Scholar] [CrossRef] [PubMed]
  6. Liu, X.N.; Ma, Y.F. Tunable Diode Laser Absorption Spectroscopy Based Temperature Measurement with a Single Diode Laser Near 1.4 m. Sensors 2022, 22, 6095. [Google Scholar] [CrossRef]
  7. Dunlea, E.J.; Herndon, S.C.; Nelson, D.D.; Volkamer, R.M.; Lamb, B.K.; Allwine, E.J.; Grutter, M.; Ramos Villegas, C.R.; Marquez, C.; Blanco, S.; et al. Technical note: Evaluation of standard ultraviolet absorption ozone monitors in a polluted urban environment. Atmos. Chem. Phys. 2006, 6, 3163–3180. [Google Scholar] [CrossRef] [Green Version]
  8. Ridley, B.A.; Grahek, F.E.; Walega, J.G. A small, high-sensitivity, medium-response ozone detector suitable for measurements from light aircraft. J. Atmos. Oceanic Technol. 1992, 9, 142–148. [Google Scholar] [CrossRef]
  9. Li, Y.L.; Zhang, X.X.; Li, X.; Cui, Z.L.; Xiao, H. Detection of Ozone and Nitric Oxide in Decomposition Products of Air-Insulated Switchgear Using Ultraviolet Differential Optical Absorption Spectroscopy (UV-DOAS). Appl. Spectrosc. 2018, 72, 1244–1251. [Google Scholar] [CrossRef]
  10. Peters, S.; Bejan, I.; Kurtenbach, R.; Liedtke, S.; Villena, G.; Wiesen, P.; Kleffmann, J. Development of a new LOPAP instrument for the detection of O3 in the atmosphere. Atmos. Environ. 2013, 67, 112–119. [Google Scholar] [CrossRef]
  11. Hannun, R.A.; Swanson, A.K.; Bailey, S.A.; Hanisco, T.F.; Bui, T.P.; Bourgeois, I.; Peischl, J.; Ryerson, T.B. A cavity-enhanced ultraviolet absorption instrument for high-precision, fast-time-response ozone measurements. Atmos. Meas. Tech. 2020, 13, 6877–6887. [Google Scholar] [CrossRef]
  12. Gomez, A.L.; Rosen, E.P. Fast response cavity enhanced ozone monitor. Atmos. Meas. Tech. 2013, 6, 487–494. [Google Scholar] [CrossRef] [Green Version]
  13. Washenfelder, R.A.; Wagner, N.L.; Dub´e, W.P.; Brown, S.S. Measurement of Atmospheric Ozone by Cavity Ring-down Spectroscopy. Environ. Sci. Technol. 2011, 45, 2938–2944. [Google Scholar] [CrossRef]
  14. Clemitshaw, K.C. A review of instrumentation and measurement techniques for ground-based and airborne field studies of gas-phase tropospheric chemistry. Crit. Rev. Environ. Sci. Technol. 2004, 34, 1–108. [Google Scholar] [CrossRef]
  15. Axelsson, H.; Edner, H.; Galle, B.; Ragnarson, P.; Rudin, M. Differential optical-absorption spectroscopy (DOAS) measurements of ozone in the 280–290 nm wavelength region. Appl. Spectrosc. 1990, 44, 1654–1658. [Google Scholar] [CrossRef] [Green Version]
  16. Ryerson, T.B.; Buhr, M.P.; Frost, G.J.; Goldan, P.D.; Holloway, J.S.; Hübler, G.; Jobson, B.T.; Kuster, W.C.; McKeen, S.A.; Parrish, D.D.; et al. Emissions lifetimes and ozone formation in power plant plumes. J. Geophys. Res. Atmos. 1998, 103, 22569–22583. [Google Scholar] [CrossRef]
  17. Williams, E.J.; Fehsenfeld, F.C.; Jobson, B.T.; Kuster, W.C.; Goldan, P.D.; Stutz, J.; Mcclenny, W.A. Comparison of Ultraviolet Absorbance, Chemiluminescence, and DOAS Instruments for Ambient Ozone Monitoring. Environ. Sci. Technol. 2006, 40, 5755–5762. [Google Scholar]
  18. Spicer, C.W.; Joseph, D.W.; Ollison, W.M. A Re-Examination of ambient air ozone monitor interferences. J. Air Waste Manag. Assoc. 2010, 60, 1353–1364. [Google Scholar] [CrossRef] [Green Version]
  19. Ollison, W.M.; Crow, W.; Spicer, C.W. Field testing of new-technology ambient air ozone monitors. J. Air Waste Manag. Assoc. 2013, 63, 855–863. [Google Scholar] [CrossRef] [PubMed]
  20. Leston, A.R.; Ollison, W.M.; Spicer, C.W.; Satola, J. Potential interference bias in ozone standard compliance monitoring. J. Air Waste Manag. Assoc. 2005, 55, 1464–1472. [Google Scholar] [CrossRef] [Green Version]
  21. Li, Z.Y.; Hu, R.Z.; Xie, P.H.; Chen, H.; Wu, S.Y.; Wang, F.Y.; Wang, Y.H.; Ling, L.Y.; Liu, J.G.; Liu, W.Q. Development of a portable cavity ring down spectroscopy instrument for simultaneous, in situ measurement of NO3 and N2O5. Opt. Express 2018, 26, A433–A449. [Google Scholar] [CrossRef] [PubMed]
  22. Rothman, L.S.; Gordon, I.E.; Barber, R.J.; Dothe, H.; Gamache, R.R.; Goldman, A.; Perevalov, V.I.; Tashkun, S.A.; Tennyson, J. HITEMP, the high-temperature molecular spectroscopic database. J. Quant. Spectrosc. Radiat. Transf. 2010, 111, 2139–2150. [Google Scholar] [CrossRef]
  23. Voigt, S.; Orphal, J.; Burrows, J.P. The temperature and pressure dependence of the absorption cross-sections of NO2 in the 250–800 nm region measured by Fourier-transform spectroscopy. J. Photochem. Photobiol. A Chem. 2002, 149, 1–7. [Google Scholar] [CrossRef]
  24. Sander, S.P.; Friedl, R.R.; Ravishankara, A.R.; Golden, D.M.; Kolb, C.E.; Kurylo, M.J.; Molina, M.J.; Moortgat, G.K.; Keller-Rudek, H.; Finlayson-Pitts, B.J.; et al. Chemical Kinetics and Photochemical Data for Use in Atmospheric Studies; NASA Jet Propulsion Laboratory: Pasadena, CA, USA, 2006. [Google Scholar]
  25. Li, Z.Y.; Hu, R.Z.; Xie, P.H.; Chen, H.; Liu, X.Y.; Liang, S.X.; Wang, D.; Wang, F.Y.; Wang, Y.H.; Lin, C.; et al. Simultaneous measurement of NO and NO2 by a dual-channel cavity ring-down spectroscopy technique. Atmos. Meas. Tech. 2019, 12, 3223–3236. [Google Scholar] [CrossRef] [Green Version]
  26. Kalnajs, L.E.; Avallone, L.M. A Novel Lightweight Low-Power Dual-Beam Ozone Photometer Utilizing Solid-State Optoelectronics. J. Atmos. Ocean. Technol. 2009, 27, 869–880. [Google Scholar] [CrossRef]
  27. Gao, R.S.; Ballard, J.; Watts, L.A.; Thornberry, T.D.; Ciciora, S.J.; McLaughlin, R.J.; Fahey, D.W. A compact, fast UV photometer for measurement of ozone from research aircraft. Atmos. Meas. Tech. 2012, 5, 2201–2210. [Google Scholar] [CrossRef] [Green Version]
  28. Darby, S.B.; Smith, P.D.; Venables, D.S. Cavity-enhanced absorption using an atomic line source: Application to deep-UV measurements. Analyst 2012, 137, 2318–2321. [Google Scholar] [CrossRef]
Figure 1. Schematic diagram of the CRDS−Ox/NO2 system.
Atmosphere 13 02106 g001
Figure 2. Absorption cross−section of NO2, O3, and water vapor and typical diode laser spectrum.
Atmosphere 13 02106 g002
Figure 3. Cavity ring−down signal and fitting results.
Atmosphere 13 02106 g003
Figure 4. Conversion efficiency of 220 ppbv O3 to NO2 as a function of NO concentration.
Atmosphere 13 02106 g004
Figure 5. (a) Time series of ambient atmospheric NO2 concentration sampled using the CRDS instrument in two channels. The time resolution is 1 s. (b) Correlation plot between the data from the two channels.
Atmosphere 13 02106 g005
Figure 6. (a) Continuous time series measurement of ambient air after absorption by activated carbon, averaged to 1 s for the NO2 and Ox channels (black dots); the red dots show the data averaged to 10 s. (b) Allan deviation plots for NO2 concentration in two channels. The minimum value equals the optimum integration time.
Atmosphere 13 02106 g006
Figure 7. Correlation plot comparing O3 measurements acquired by CRDS and the 49i ozone analyzer.
Atmosphere 13 02106 g007
Figure 8. (a) NO2 mixing ratios via CRDS (1 min average). (b) O3 mixing ratios via CRDS and 49i (1 min average). (c) Scatter plots for the O3 dataset from CRDS and the 49i ozone analyzer. The red lines illustrate the linear regression.
Atmosphere 13 02106 g008
Table 1. Performance comparison of ozone instruments.
MethodSensitivityTime resolutionReference
UV absorption1 ppbv1 s[26]
UV absorption0.4 ppbv0.5 s[27]
CEAS31 pptv1 s[11]
CRDS26 pptv1 s[13]
CEAS8 ppbv10 s[28]
CEAS1 ppbv0.1 s[12]
CRDS14.5 pptv10 sThis work
Publisher’s Note: MDPI stays neutral with regard to jurisdictional claims in published maps and institutional affiliations.

