Article

Optimal Solar Farm Site Selection in the George Town Conurbation Using GIS-Based Multi-Criteria Decision Making (MCDM) and NASA POWER Data

by
Puteri Nur Atiqah Bandira
1,
Mou Leong Tan
1,*,
Su Yean Teh
2,
Narimah Samat
1,
Shazlyn Milleana Shaharudin
3,
Mohd Amirul Mahamud
1,
Fredolin Tangang
4,
Liew Juneng
4,
Jing Xiang Chung
5 and
Mohd Saiful Samsudin
6
1
GeoInformatic Unit, Geography Section, School of Humanities, Universiti Sains Malaysia, Penang 11800, Malaysia
2
School of Mathematical Sciences, Universiti Sains Malaysia, Penang 11800, Malaysia
3
Department of Mathematics, Faculty of Science and Mathematics, Universiti Pendidikan Sultan Idris, Tanjong Malim 35950, Malaysia
4
Department of Earth Sciences and Environment, Faculty of Science and Technology, Universiti Kebangsaan Malaysia, Bandar Baru Bangi 43600, Malaysia
5
Faculty of Science and Marine Environment, Universiti Malaysia Terengganu, Kuala Terengganu 21030, Malaysia
6
Environmental Technology Division, School of Industrial Technology, Universiti Sains Malaysia, Penang 11800, Malaysia
*
Author to whom correspondence should be addressed.
Atmosphere 2022, 13(12), 2105; https://doi.org/10.3390/atmos13122105
Submission received: 27 October 2022 / Revised: 12 December 2022 / Accepted: 13 December 2022 / Published: 15 December 2022

Abstract

:
Many countries are committed to boosting renewable energy in their national energy mix by 2030 through the support and incentives for solar energy harnessing. However, the observed solar data limitation may result in ineffective decision making, regarding solar farm locations. Therefore, the aim of this study is to utilise GIS-based multi criteria decision making (MCDM) and NASA POWER data to identify the optimal locations for solar farm installations, with the George Town Conurbation as a case study. Although NASA POWER is tailored for the application, at least, on the regional level, the information it provided on the solar radiation and the maximum and minimum temperatures are deemed useful for the initial solar mapping attempt at the local level, especially in the absence or lack of local data. The performance of the GIS-based MCDM model is categorized as good in identifying solar farms. There are no significant differences in the area under the curve (AUC) values between the map of the NASA POWER data and ground-measured data. This indicates the potential of using the NASA POWER data for generating the much-needed initial insights for the local optimal solar farm site selection. The stakeholders can benefit from the suitability map generated to effectively target the locations that have the highest potential to generate solar energy efficiently and sustainably.

1. Introduction

With the increase of 1.1 °C in the global average temperature since the pre-industrial age, the evidence for climate change is now visible [1]. One of the main anthropogenic activities responsible for global warming is the electricity generation via burning fossil fuels, contributing to almost 75% of worldwide carbon emissions [2]. To combat global warming, Goal 7 of the Sustainable Development Goals (SDGs) focuses on the renewable energy development, focusing on considerably boosting the portion of renewable energy in the global energy mix. About 17.5% of the worldwide energy demand is supplied by renewable energy [3]. Hence, the energy sectors in every nation are forced to ramp up the use of renewable energy in the electricity generation. Wind and solar power are the most well-known, due to their mature technologies which are environmentally friendly and economically efficient [4,5,6].
Zooming into Malaysia, the primary sources of power generation in the country are coal, natural gas, and hydropower [7]. In agreement with the SDGs, the Malaysian government is committed to reducing Malaysia’s dependency on the conventional energy sector while safeguarding the development of reliable and affordable energy resources, as reflected in the Twelfth Malaysia Plan (2021–2025) [8]. One of the targets regarding renewable energy in the Eleventh Malaysia Plan is the approximate 30% increase of the renewable energy portion in its national energy mix, by 2030 [9]. The strategy to reach this target is to increase the renewable energy capacity in the country, which currently stands at 7995 megawatts (MW), up to 18,000 MW, by 2035 [10]. To encourage the key players in the electricity sector to invest in renewable energy, the Malaysian government embarked on several initiatives, one of which is the Energy Commission (EC), Malaysia’s competitive bidding program, which helps reduce the levelized cost of energy (LCOE) for the development of large-scale photovoltaic (LSS) plants.
The main reason for Malaysia to focus on solar energy is that the nation has been blessed with a high potential for harnessing solar power, due to its location near the equator. The location is considered strategic due to the high level of solar radiation that Malaysia receives all year round, which is estimated to be 400–600 MJ/m2 per month [11]. During August and November, the country receives the greatest amount of solar energy, approximated to be 6.8 kWh/m2 while the lowest is in December, at 0.61 kWh/m2 [7]. Having the third-highest solar energy capacity in the region of Southeast Asia, reaching 438 MW in 2018 [12], it is evident that Malaysia has a highly promising potential in harnessing solar power. However, the solar radiation received varies from one site to another. Hence, prior to the establishment of a solar farm, identifying the location that receives high solar radiation is crucial as inconsistencies and variabilities will affect the potential of harnessing solar power [4].
However, in reality, the site selection problem is not as simple as selecting a location with a high solar radiation. There are several aspects, such as economic, social, environment and political aspects, that need to be considered in order to define the suitability of a location and ensure a cost-effective solar farm while minimizing land occupation. The involvement of a large number of criteria may result in a contradicting objective. Hence, a more structured and systematic approach needs to be used to result in a good decision. Although there are quite a number of tools used in the site selection task, the most commonly used worldwide is the geographic information system (GIS) based multi-criteria decision making (MCDM) [13]. The GIS-based MCDM is a method that integrates two powerful decision-making tools, namely GIS and MCDM, to allow the consideration of numerous criteria. The GIS contributes to the physical suitability analysis with a capability in handling the spatial data while the MCE incorporates the decision maker’s value and preferences [14]. The integration of these tools provides the prospect of combining the judgment of professionals and other stake holders through pairwise comparisons of numerous criteria, which then can be put to use in the GIS environment for any particular goals, such as site suitability for the solar farm establishment [15].
The GIS-MCDM approach is widely and commonly used in many studies globally. Table 1 lists some previous studies that researched the optimal sites for renewable energy harnessing using several approaches, including GIS-MCDM. Despite the climate conditions—tropical, dry, temperate or continental—of the study area, the GIS-MCDM approach can be used in the identification of the optimal sites for any renewable energy harnessing. Notably, the application of GIS-MCDM in a tropical climate country was demonstrated by Doorga et al. [16] and Nguyen et al. [17]. Doorga et al. [16] identified the northern region of Mauritius as the optimal location for ground-mounted PV power plant because of its suitable microclimate regimes, and the land morphology, which is near the voltage lines and road system. In Nguyen et al. [17], several suitable locations for a solar farm development were identified in South-Central Vietnam, using the GIS-MCDM approach. Their study also revealed that two out of ten installed solar farms are located in unsuitable locations. It is highlighted in the work that the investors failed to consider the land surface temperature and the distance from infrastructure prior to the establishment of the solar farm. This clearly underlined the needs to consider multiple vital criteria and the applicability of the GIS-MCDM approach in determining the promising locations for solar energy harnessing, to guarantee a high return on investment.
One of the main obstacles in performing the GIS-MCDM approach in the site selection lies in the data availability, as the data required are expensive to obtain and collect, and sometimes inaccessible to the public user, owing to the data sharing policy [46]. On top of that, the ground-based data collected by weather stations usually comes with some particularities, for instance, the data contain missing values for a certain period, some stations report time delays, and sparsely distributed meteorological stations can affect the quality of the data [47,48]. Finn and McKenzie [38] have highlighted that the integration of sparse data in the site selection problem would yield a generalized result by distorting the overlay results and omitting areas of suitability. Alhammad et al. [30] highlighted that, in the solar farm site selection problem, it is preferable to incorporate several climatic factors that affect the solar radiation, such as temperature, rainfall, and sunshine hours. However, due to the data availability, only solar irradiance is focused on in [30]. Another option for researchers is to make use of open-source satellite-based datasets which support the near-real-time monitoring or forecasting [49]. The examples of open-source satellite-based data used in previous studies focusing on solar variables are Solargis, WorldClim, Global Solar Atlas, and the NASA Prediction of Worldwide Energy Resource (POWER) data. The NASA POWER data are specifically tailored for the use of photovoltaic and renewable energy industries [50]. However, the reliability of the NASA POWER data in local solar farm site selection, using GIS-MCDM, is yet to be explored.
Owing to the coarse resolution of the NASA POWER data i.e., 0.5° latitude by 0.5° longitude, the accuracy of the NASA Power data is the main concern of the end users. There are few existing studies that evaluate the performance of the NASA POWER data. A study by Rodrigues and Braga [51] proves that the NASA POWER data has a good agreement with the observed data for all parameters (maximum and minimum temperatures, solar radiation, relative humidity), except for wind speed, with a coefficient of determination (R2) higher than 0.82, while the normalized root mean square error (NRMSE) varies from 8 to 20%, and the normalized mean bias error (NMBE) ranges from −9 to 26%. Another study conducted in Egypt by Aboelkhair [52] demonstrates that the NASA POWER data and ground-measured data are significantly correlated for all temperature parameters (monthly average maximum, minimum, average, and dew point temperature) where the RMSE lower than 5 °C, is reported. In contrast, for relative humidity, the average RMSE of 11.6% signifies the failure in the accurate simulation. Their findings are in line with the study carried out by Monteiro et al. [53], in which the differences between the NASA POWER data and the Brazilian ground weather data are evaluated. Although previous studies have successfully demonstrated the feasibility of the NASA POWER data, the accuracy of the NASA POWER data on a local spatial scale, especially in the region of Southeast Asia, has yet to be explored. Therefore, before using the climate data from NASA POWER, the information on the goodness of fit and accuracy of the data, compared to the measured data are obtained.
This study, therefore, aims to identify the most suitable location for the establishment of solar farms in the George Town Conurbation region, using the GIS-MCDM approach and the NASA POWER data. The specific objectives are (1) to validate the accuracy of the NASA POWER meteorological data with the ground measured data, and (2) to compare the results for the suitable areas for the siting of solar farms in the George Town Conurbation, generated by the NASA POWER and ground measured data, using the GIS-MCDM approach. Based on the reviewed literature, several key criteria for different aspects, such as climate, topography, and location, are considered in the site selection process. The novelty of this study is the reliability assessment of the NASA-POWER data in the GIS-MCDM modelling, by comparing with the ground measured data for the identification of the optimal local location for solar farms in tropical regions. Furthermore, the findings concerning the NASA-POWER reliability will be useful for scientists from other sectors, such as hydrology, agricultural, and climate change, for their alternative climate data choices. To date, no such research has been conducted in the study area for the Malaysian region. Hence, the output of this study is very much needed by the stakeholders (i.e., planners, state government, investors) to aid them in designing and proposing effective and sustainable strategies for solar farm development in the region. Moreover, this approach ensures a huge reduction in costs as it expedites the process of location identification and comparisons between promising sites.

2. Materials and Methods

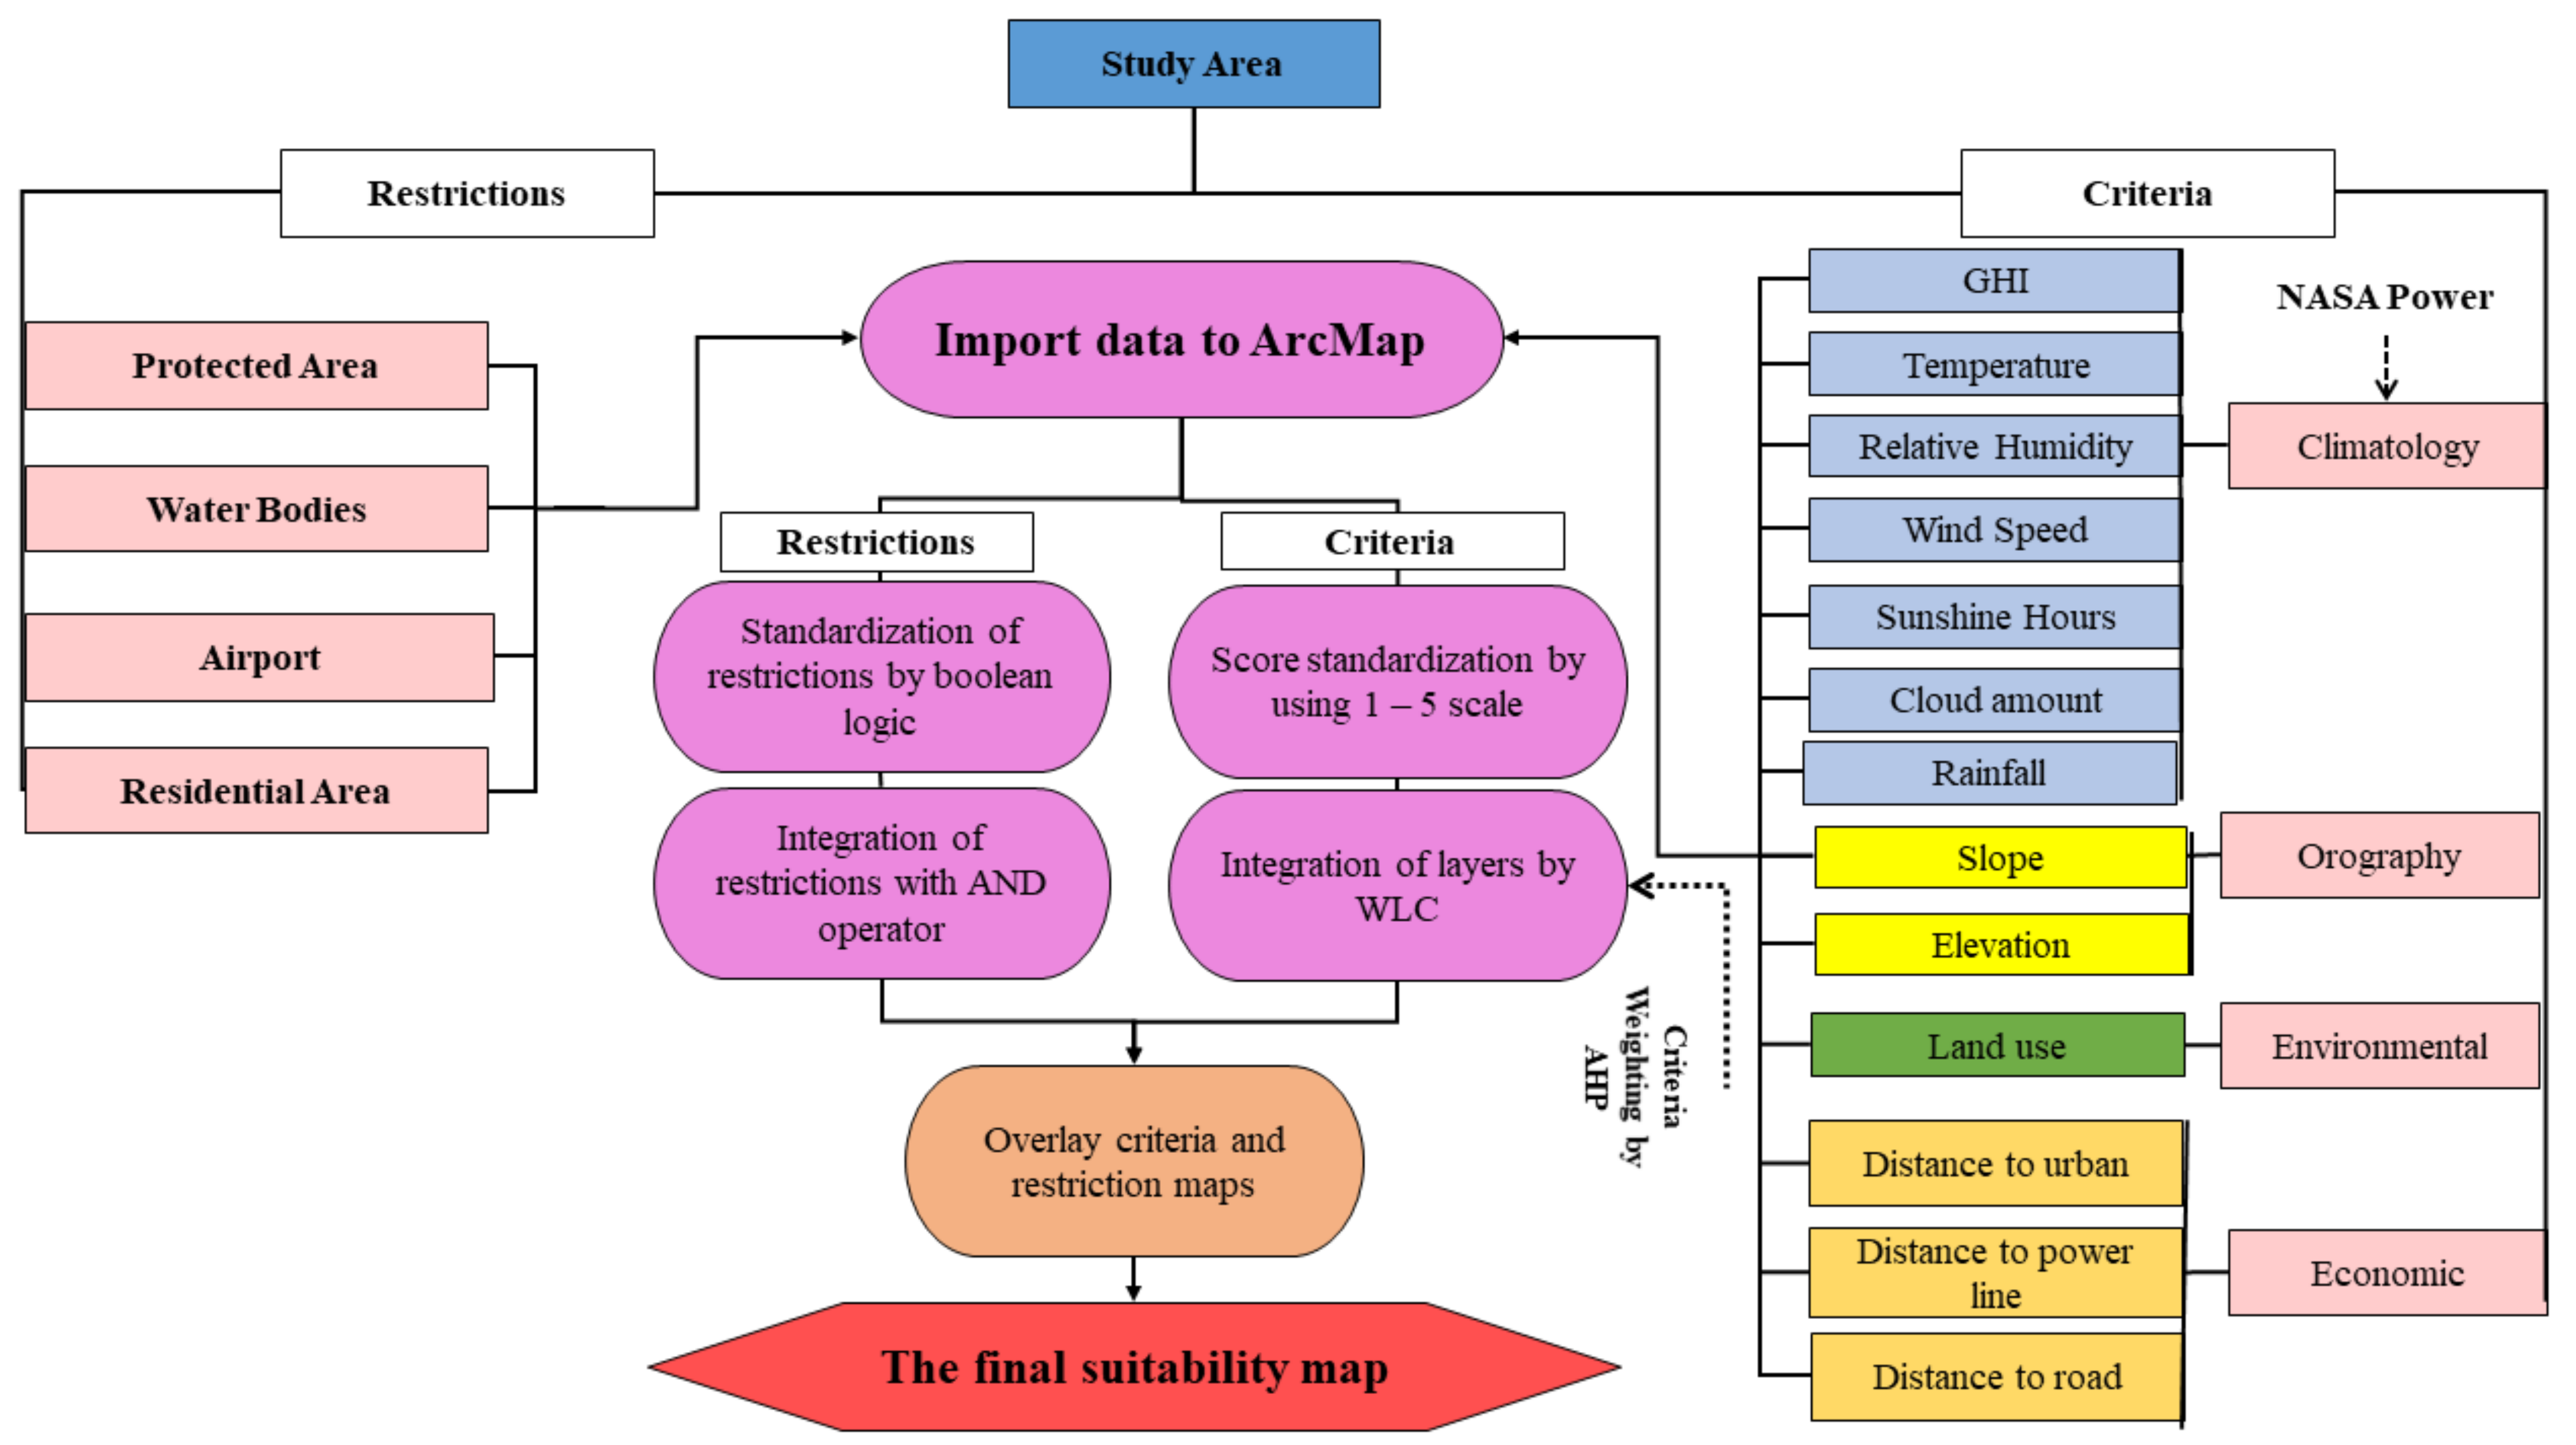
2.1. Overall Framework
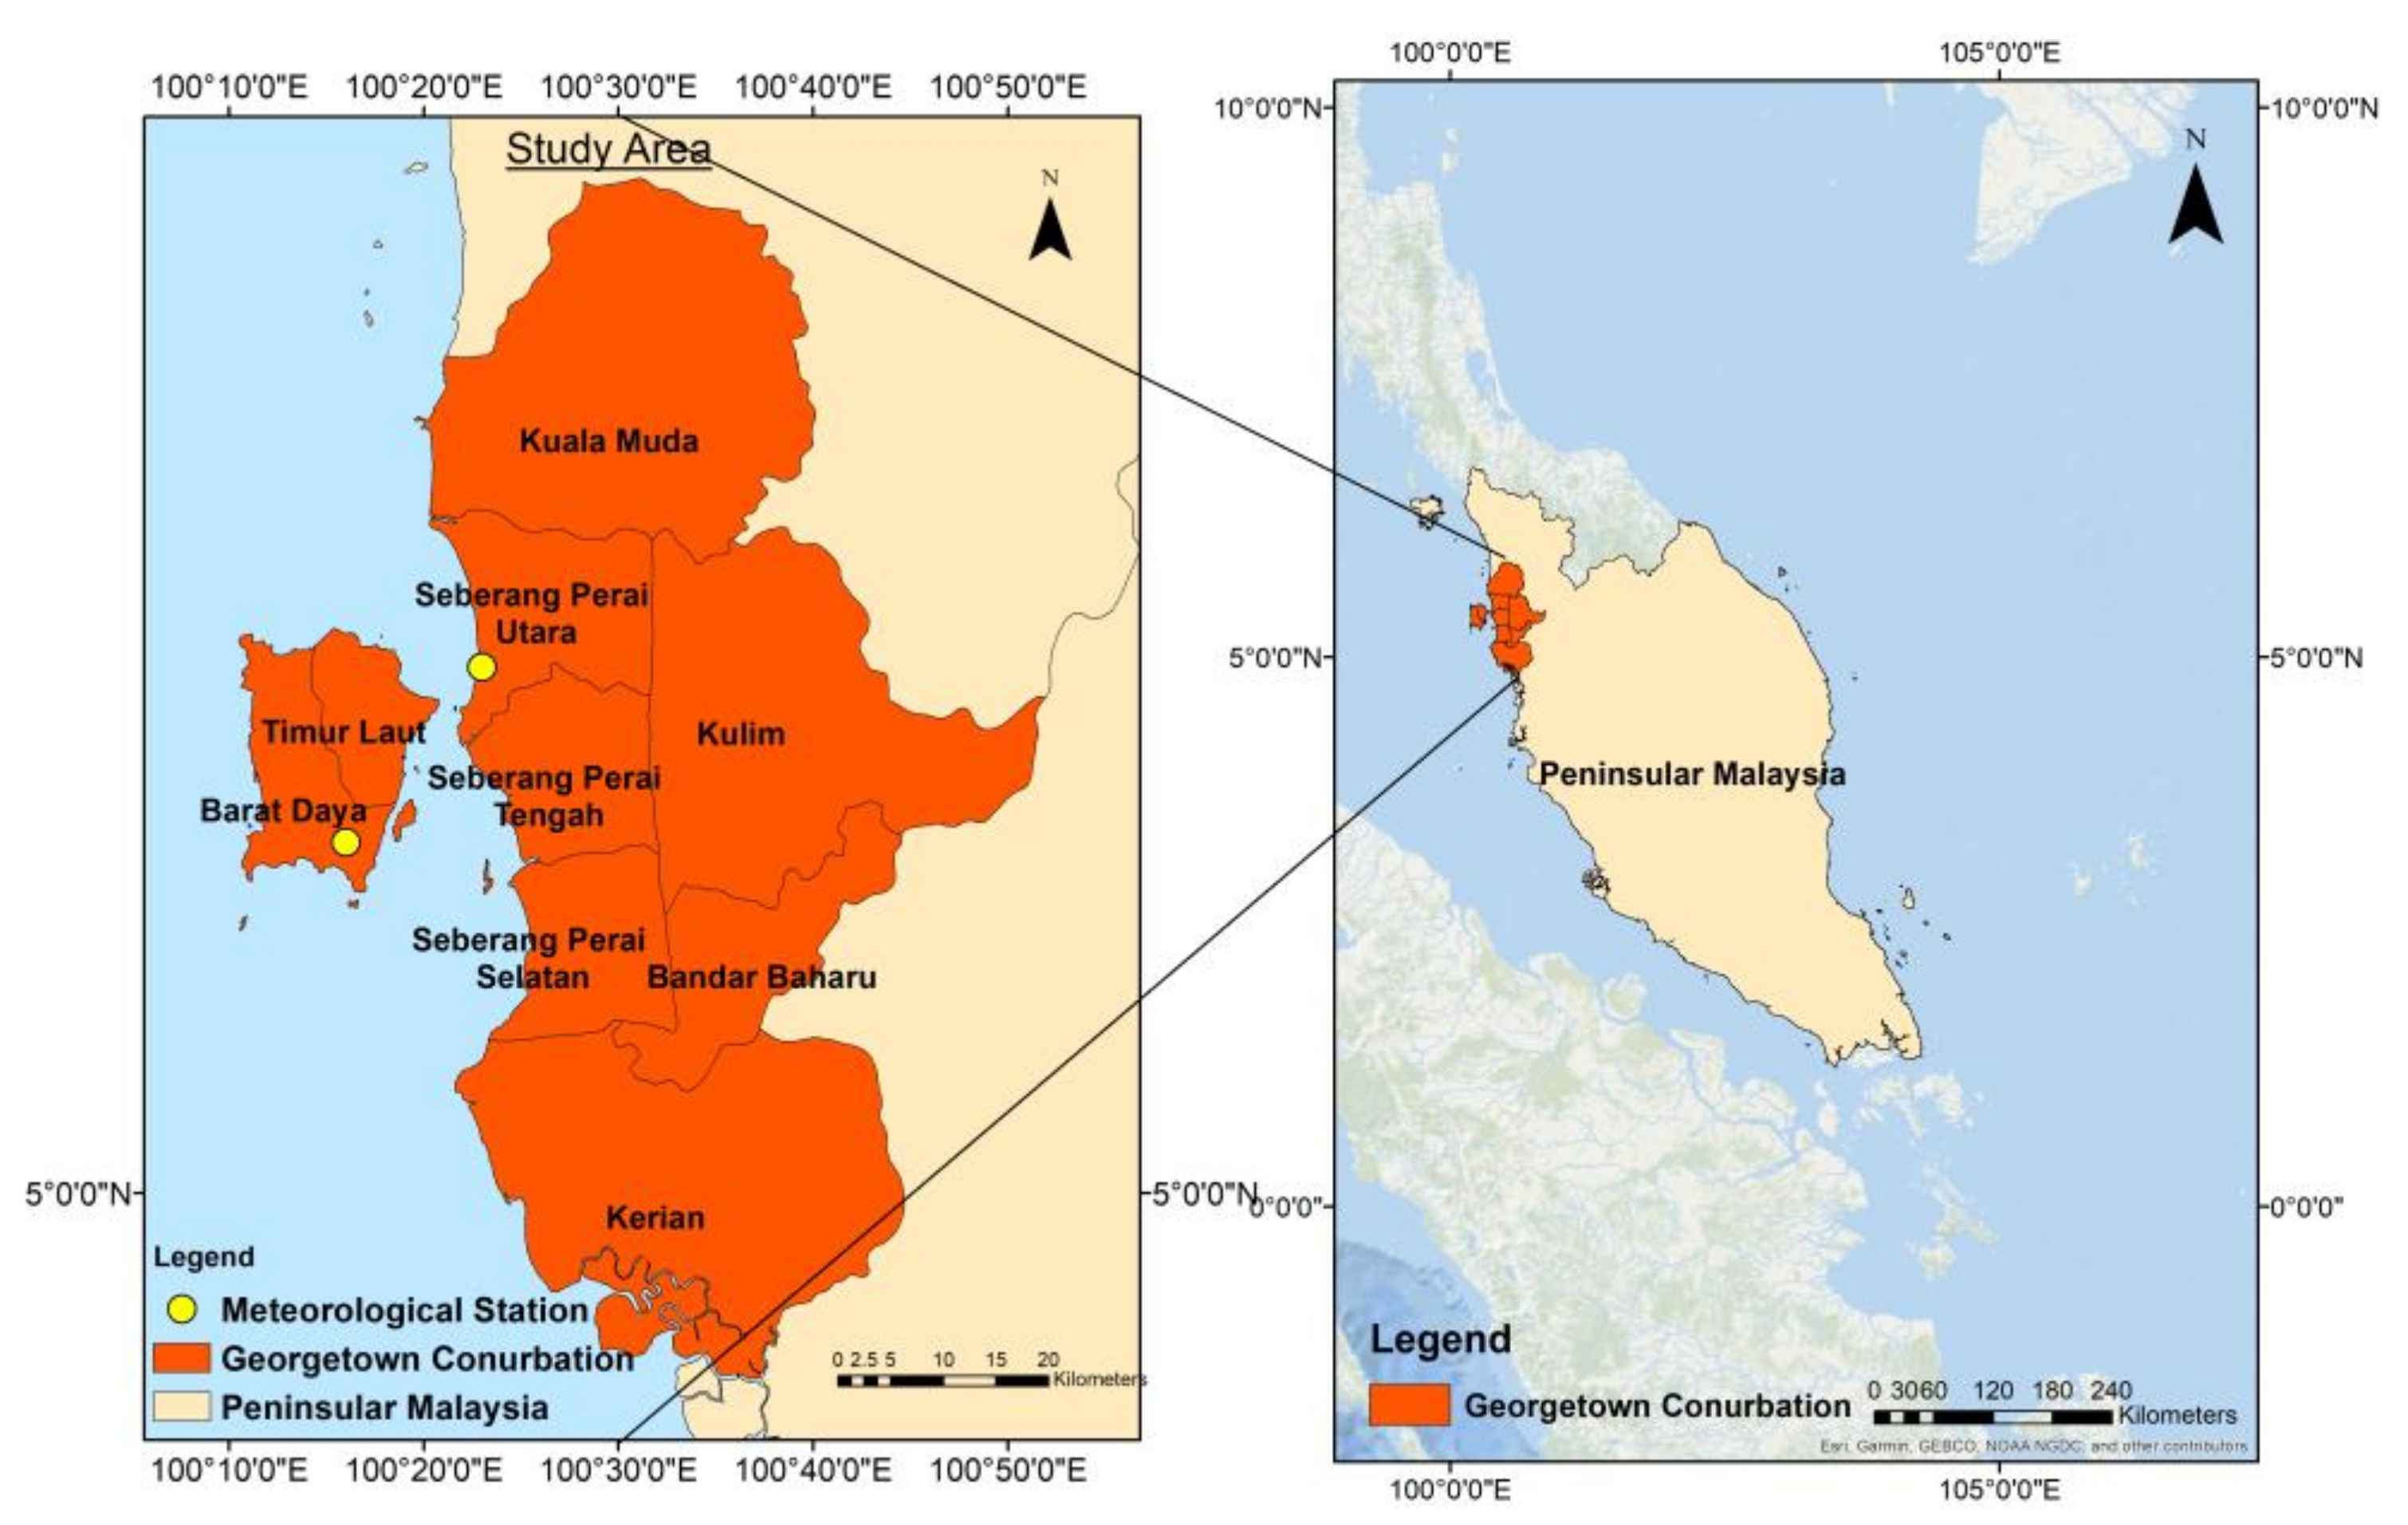
The overall framework used in this research is shown in Figure 1. The main map layer generated in this approach are the criteria map and restrictions map. The criteria map is generated using the overlay techniques of all of the criteria layers which have been standardized into a standard suitability scale of 1 to 5. The weights of each criterion are assigned through the analytical hierarchy process (AHP), where the expert’s opinion and the decision maker’s preferences are included in the site selection process. The restrictions map is integrated using the AND operator of the restriction layers, which has been standardized into a Boolean map. The combination of the restrictions and criteria maps using the overlay techniques yield the final suitability map.

2.2. Study Area

The study area chosen for this study is the George Town Conurbation, located on the northwest coast of Peninsular Malaysia, between latitude 4°50′ N–5°52′ N and longitude 100°10′ E–100°51′E. Composed of Penang State and several districts of the surrounding states, Kedah and Perak (see Figure 2), it covers an area of approximately 3938 km2. Home to more than 2 million Malaysians [54], the study area is the most populous area in the northern region of Peninsular Malaysia. Further, this study area is where the main high-technology industrial parks and free industrial zones are located. Therefore, it is an important area for the country, since the manufacturing sector plays an essential role in Malaysia’s economic transformation.
The energy consumption in the study area is increasing due to the high demands from its large population and industries. Therefore, the first reason for selecting this location is to enhance the development of the area sustainably, by including renewable energy sources in the electricity and energy generation, which is expected to reduce the area’s dependency on non-renewable sources. The study area receives solar radiation of between 15.07 MJ/m2/day and 19.88 MJ/m2/day, which can be captured and turned into energy. The second reason for choosing this study area is due to the commitment made by the Northern Corridor Implementation Authority (NCIA), to prioritize a green economy. The NCIA is a statutory body responsible for providing direction and devising policies and strategies that promote and accelerate the development of the Northern Corridor Economic Region (NCER).
The focus of a green economy is on renewable energy sources. In this regard, Penang aims to venture intensely into solar farming to push for renewable energy harnessing, while Kedah launched its green energy and renewable energy master plan in July 2019, and Perak has low energy costs along with ample land availability for a green-based economy establishment [55]. The third and final reason for selecting the George Town Conurbation is because of the data availability. Spatial modelling depends on data availability as it is time-consuming and costly to run the data collection, data input, and database creation. These datasets include the digital map datasets of roads, rivers, power lines, and land use in 2017–2018. These datasets form the primary digital sources used in the study.

2.3. Data Description

The essential element in accomplishing the objective of this study is the data required, which were obtained from a variety of sources, including satellite images, internet websites, and questionnaires. The digital elevation model (DEM) data with a spatial resolution of 30 m, used in this study were obtained from the United States Geological Survey (USGS). The climate data, consisting of the monthly average of the global horizontal irradiation (GHI), average wind speed, average temperature, relative humidity, cloud amount, sunshine hours, and rainfall data were downloaded in a gridded format from the NASA Prediction of Worldwide Energy Resource (NASA), for the period of 1985–2020, with a resolution of 0.5° × 0.5° latitude/longitude grid. The gridded format is used instead of interpolation in order to avoid bias from the irregular spatial distributions of the station-based data [56]. All data are then formatted into a geodatabase producing raster layers using GIS software, ArcMap for windows (version 10.4), developed by Environmental System Research Institute Inc., Redlands, CA, USA. The WGS 1984 coordinates projection is used for all of the map layers and meter unit of measurement is used for the distance scale in the software system.

2.3.1. Climate

Table 2 shows the average monthly solar radiation, rainfall, minimum temperature, maximum temperature, average temperature, average wind speed, and relative humidity for the study area from 1990 to 2020. The highest solar radiation that the study area receives is during the first quarter of the year, ranges from 17.25 MJ/m2/day (January) to 18.05 MJ/m2/day (April), which corresponds to the low relative humidity and rainfall. The average maximum and minimum temperatures ranged from 30.95 °C to 32.56 °C and 24.00 °C to 24.93 °C, respectively, as listed in Table 2.

2.3.2. Geospatial Data

Table 3 shows the details and descriptions of the geospatial data used in this study. All data layers are processed in 30 m × 30 m resolution, following the resolution of the DEM layers. The slope data is extracted from the DEM layers obtained from the USGS website using the slope tool in ArcMap.

2.3.3. NASA POWER Data

The POWER Project is developed by NASA as a climatology database, specifically for the photovoltaic and renewable energy industries [57]. The NASA POWER Project provides the climatic and solar information which accounts for cloud cover and sun duration and position [58]. The NASA POWER datasets are derived from simulations of numerical weather prediction models, based on a set of meteorological observations [59]. The main highlighted feature of NASA POWER is its user-friendly data access interface, and all datasets are available at four temporal levels; hourly, daily, monthly, and climatologically [60]. The resolution of the NASA POWER data is available at 0.5° latitude by 0.5° longitude. The climatic data downloaded from NASA POWER Project in CSV format include the GHI, average temperature, rainfall, relative humidity, cloud amount, sunshine hours, and average wind speed. To ensure that the climate data cover the study area, a regional dataset is downloaded. “Renewable energy” is selected in the user community selection, ensuring all essential parameters for solar energy are available to download. The downloaded data are further processed in Microsoft Excel, to ease the process of importing the data into ArcMap. The units for solar radiation provided by NASA POWER are in kWh/m2/day, while the units for the ground-measured solar radiation provided by the Malaysian Meteorological Department (MMD) are in MJ/m2/day. Therefore, to enable the data validation, the solar radiations from the MMD are converted to kWh/m2/day by dividing the values with 3.6 [61].

2.4. Validation of NASA POWER Data

This study used five statistical indicators to quantify the accuracy of the daily NASA POWER data. The statistical indicators include the coefficient of determination (R2), root mean square error (RMSE), normalized root mean square error (NRMSE), mean bias error (MBE), and normalization mean bias error (NMBE). The R2 index (see Equation (1)) measures the magnitude of variation in the ground-measured data explained by the variation in the simulated data [62]. The value of R2 ranges from zero to one, where a value close to one signifies less error variance and a good model fit. Typically, a value of R2 > 0.5 is considered acceptable [63]. The RMSE index represents the mean standard deviation of a model simulation with respect to the ground-measured data [62]. The RSME index (see Equation (2)) is a good general-purpose error metric for the numerical prediction, as it is a good measure of accuracy, in terms of comparing the forecasting errors [64]. A lower value of the RMSE and NRMSE (see Equation (3)) indicates a higher model accuracy and less residual variance [52]. The MBE and NMBE indexes are the measures of the systematic error between the two data products. They are used to assess the mean difference between the simulated and observed climatic parameters [49]. The MBE index indicates a model’s bias; that is, whether the mean is an overestimation, a positive MBE value or an underestimation, or a negative MBE value of the model [51]. Equations (4) and (5) are used to calculate the MBE and NMBE, where O i ,   O a and   S i represents the ground measured data, ground measured average, and the NASA POWER data, respectively, and n is the number of the data analyzed.
R 2 = 1 i = 1 n ( O i S i ) 2 j = 1 n ( O i O a ) 2
R S M E = i = 1 n ( O i S i ) 2 n
N R S M E = R M S E O a × 100 %
M B E = i = 1 n ( S i O i ) n  
N M B E = M B E O a × 100 %

2.5. Criteria Definition

Table 4 shows the list of criteria involved in the site selection task. The criteria used in this study area were meticulously chosen using an extensive literature review, and the national and international guidelines are used as a basis [5,19,65]. This study includes the solar panel installation for rooftops, the technical aspect of which is similar to a ground-based roof system, with an addition of the building geometry criteria [66]. The chosen criteria are further endorsed by the local experts’ opinions, as some criteria are location specific, as well as to minimize personal bias [67]. These experts are all based in Malaysia and are professional engineers who have a strong background knowledge of solar energy and the ground conditions of the study area. The criteria selected can be categorized into four different groups: climate, orography, environmental, and economic. The description of each criterion is provided in the Section 2.5.1, Section 2.5.2, Section 2.5.3 and Section 2.5.4, complementing Table 4.

2.5.1. Climatic Criteria

As mentioned above, the climatic criteria include the annual average of the GHI, relative humidity, wind speed, sunshine hours, rainfall, cloud amount, and temperature. Specific to the solar farm installation, the GHI is the most significant parameter as it determines the capacity of solar energy harnessing [34]. The relative humidity is the amount of water vapor present in the air, which will affect the solar panel’s efficiency through absorption, reflection, refraction, and collision of the solar radiation with the water vapor particles [68]. As for the rainfall and the cloud amount, it will drastically lower the production of the solar farm to between 10–25% of their optimal capacity. A higher average wind speed is preferred as wind increases the efficiency of the solar panels by up to 43%, due to the cooling effect, preventing the solar panels from overheating, which will affect their efficiency [69]. In contrast to the wind, a lower temperature is preferable as solar panels are sensitive to temperature with the efficiency of solar panels declining with the increasing temperature [70]. The required data were obtained from NASA Power and were collected, based on the location of the meteorological stations in the region. The gridded climate data (resolution of 50 km × 50 km) are imported into ArcMap.

2.5.2. Orography Criteria

The orography criteria are essential in determining the solar farm site suitability, as they have a direct consequence on the solar yield estimates. The parameters considered in this study are the slope and elevation. These two parameters have a strong correlation with the cost-effectiveness of a solar farm. Elevation is significant for both the environmental and economic criteria. A higher altitude might increase the potential of the solar panels to receive solar energy but it is also where the rare flora and fauna species are usually located. Further, the logistic challenges in transferring the equipment to these areas will increase the project expenditure [71,72]. Another parameter that falls under the criteria is the slope. A steep slope is undesirable because additional construction works, such as drilling and land grading operations, would be needed, potentially pushing the project’s cost beyond budget, thereby affecting the cost-effectiveness of the solar farm [73]. Flat terrain is undesirable because it will affect the efficiency of the solar panels while a moderate slope will help reduce the dust accumulation on the panel [74]. Additionally, Charabi et al. [75] reported that a moderate slope, at 10%, with a high elevation will increase the electricity generation potential of the solar farm because a higher altitude decreases the temperature and increases the solar radiation exposure. However, beyond the 10% slope, the overshadowing effect will take place. Hence, a slope greater than 10% and below than 2%, is excluded [34]. The slope layer is generated from the elevation map, using the slope tool in ArcMap.

2.5.3. Environmental Criteria

In the solar farm site selection, the land use of the study area plays a pivotal role because it has immediate implications on the social, economic, and environmental factors of the region. According to van de Ven et al. [76], globally, about 27–57% of the land used to install solar farms is found to indirectly displace unmanaged forests and cropland because of their flatland features and connectivity, in terms of the proximity to roads and electricity. This displacement, if not assessed carefully, will adversely affect the ecological balance, reduce the availability of land for agricultural purposes, and increase the land scarcity in the region. It should be noted that the available land in the study area is very limited. Hence, the built-up area will be included in the analysis as one of the suitable areas, considering that rooftop solar systems, which are capable of contributing up to 7.5% of the current world’s energy needs [77], can be installed in these built-up areas.

2.5.4. Economic Criteria

The inclusion of the economic criteria determines the cost-effectiveness of the solar farm [29]. The economic criteria considered in this study are the distances to the road, to the power lines, and to the major urban areas. The connectivity of the location is critical in defining the suitability of a location since having to develop new infrastructures upsurge the capital investment and the operating expenses, not to mention the destruction of the environment [34]. Furthermore, targeting locations in proximity to urban areas is essential in order to ease the transfer of the generated electricity to consumers at a minimal cost. The economic sub-criteria layers were prepared using the Euclidean distance tool in ArcMap.

2.6. Restriction Definition

In meeting the goal of a site selection task, the restriction layer is important for protecting environmentally sensitive areas and for excluding non-potential sites. The restrictions included in this study are the environmental protected areas, water bodies, the airport, and residential areas. The forest covers only a small fraction of the study area, specifically 1.28% of the total area. Hence, any economic development in this area is impermissible in an effort to protect the national biodiversity [43,44]. Another restriction is the water bodies, in order to avoid pollutants from the construction work of solar farms entering the water bodies. The airport is the third restriction because the installation of solar panels near the area contributes to the risk of glare occurring from the PV modules and the interference with the aviation communication systems [78]. The final restriction layer is the proximity to the residential areas, as the presence of solar farms nearby may have an adverse impact on the community, for instance, pollution, safety, and security during the construction work and permanent aesthetic landscape pollution [42,48]. All restriction layers are generated using the Boolean logic method. The Boolean method is the simplest zero-one method, where the output of the model is a map with two classes (0,1). The pixels with a value of zero indicate an unsuitable site and a value of one indicates a potential site. Finally, all layers are combined using the AND operator to produce the final restriction map [20].

2.7. GIS-Based Multi-Criteria Evaluation Methodology

The site selection decision-making is a complex problem, as it encompasses various criteria, sometimes conflicting with each other and with multiple objectives. The steps for the development of the GIS-based MCE model are as follows:
  • The definition of the goal, where the goal of this study is the identification of suitable sites for a cost-effective solar farm installation;
  • The identification of the essential criteria and constraints. Their layers are processed in a 30 m raster environment prior to the analysis;
  • The scoring standardization of each factor that was expressed in original units, such as meters, percentage, and hours needs to be converted into an index using the same scale, to enable the evaluation between each criterion [79]. This study uses Elboshy et al. [80] as a basis for the suitability scoring, where the value five (5) indicates the “highly suitable” pixels and the value one (1) is assigned for the “not suitable” pixels [80]. Table 4 shows the suitability rating for each criterion included in this study. The suitability score is calculated using the suitability equation, Equation (6).
S = i = 1 n w i c i ,
where S is the suitability score, w i is the weight of each criterion, c i   is the criterion score, and n is the criteria used in the problem (this study, n = 13 ). The equation enables the model to incorporate the trade-offs between the various criteria and compute the final weighted suitability score for each evaluation unit. The development of the suitability model for the solar farm site selection is performed using the ArcMap 10.4 model builder tool. The standardization allows the model to generate a suitability map for the potential solar farm’s location with pixel values ranging between 1–5 on the suitability score;
4.
In the criterion’s weightage assignment, the opinion of five local professionals is collected via a questionnaire. In controlling the quality of the response, these experts were carefully chosen from various solar energy-related businesses (i.e., solar farms, solar panel providers, and solar panel manufacturers) with a working experience of more than three years within the study area. To prevent personal bias, the opinions from the five experts are taken where the final weightage is obtained through the median method. The questionnaire was developed using the analytical hierarchy process (AHP) approach and was distributed through the survey monkey platform. The questionnaire consists of a pairwise comparison matrix, in which the experts were asked to assess the relative importance of a criterion against another using the scoring range from 1 (least important) to 9 (most important). The full range is shown in Table 5.
5.
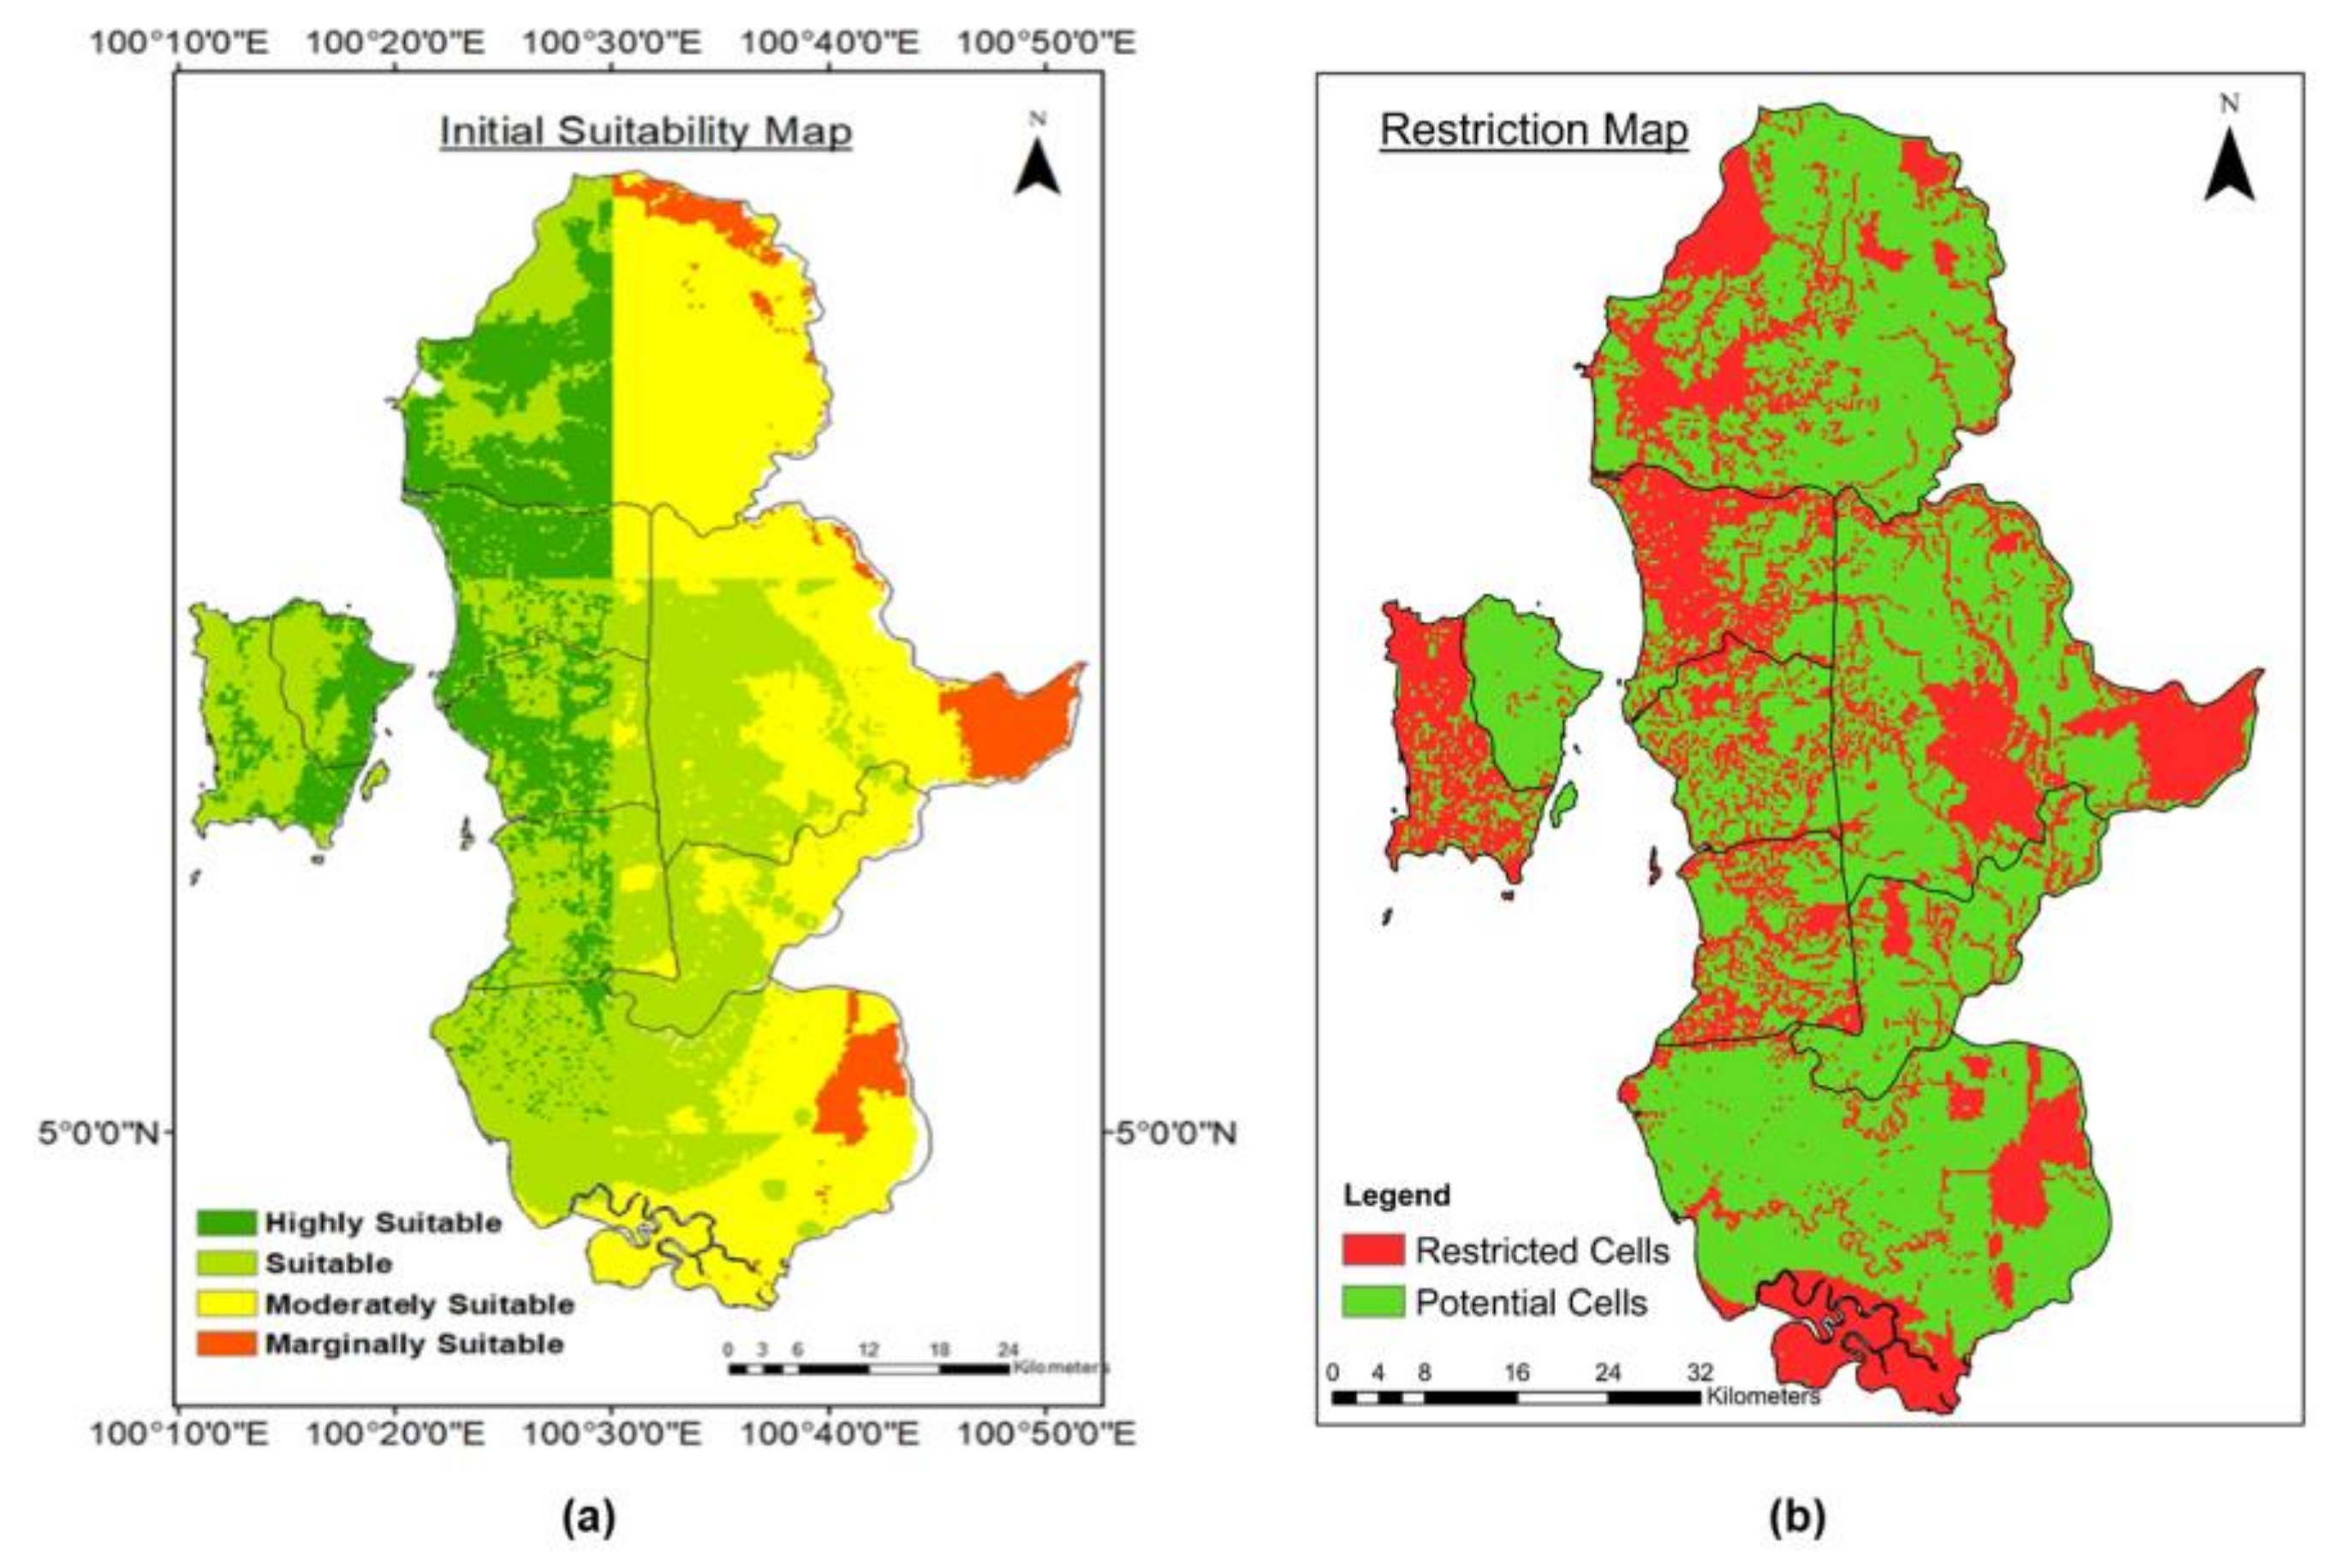
The combination of all criteria layers, according to their assigned weights, are summed in the weighted overlay process to generate the suitability map for each criteria category. Finally, the overlay techniques (6) of ArcGIS 10.4 is used to overlay the criteria maps together, generating the initial suitability map. A raster calculator is further used to combine the initial suitability map and restriction layers, producing the final suitability map and enabling the feasible locations to be identified. The highly suitable sites are further screened by the size of the suitable area. To generate 1 MW power per hour, the EC Malaysia has listed the land size requirement for a solar farm to be 2.5 acres under a high sun exposure and 5 acres under a medium sun exposure.

2.8. Model Evaluation

The data quality control and model output testing are essential in any analysis, to gain confidence in the model and to prove the model’s reliability in locating suitable locations for the solar panel installation [81]. Therefore, a model evaluation is required to evaluate the performance and reliability of the model developed. According to Qureshi et al. [82], the vital components of the model evaluation are the model verification, model validation, and sensitivity analysis. This study will evaluate the model’s performance through the validation and sensitivity analysis.

2.8.1. Model Validation

In the site selection problem, two approaches can be used for the qualitative and quantitative validations [83]. In this study, the validity of the generated suitability maps is validated using both approaches; the first approach is the visual qualitative comparison made by simply overlaying the existing solar farm layer (see Figure 3) and the “highly suitable” site layer. A raster calculator tool was used to obtain the percentages of the existing solar farm overlaps with the “highly suitable” site, where a value of more than 60% indicates that the model is acceptable [84]. For the quantitative approaches, the receiver operating characteristic (ROC) is used where the spatial coincidence between the predicted potential sites’ map and the existing solar farm is assessed and compared. Under this approach, the ArcSDM toolbox generates the ROC curve in order to calculate the area under the curve (AUC). The value of an AUC equal to 1 indicates a perfect model while an AUC equal to 0.5 indicates that the model’s prediction is random [83]. The location of existing solar plants could be the result of trade-offs among economic, social, and environmental aspects. Hence, the existing locations may not be the best possible locations. Nevertheless, comparing the model recommended locations with the existing ones helps establish the model credibility in finding feasible locations.

2.8.2. Sensitivity Analysis

A sensitivity analysis is performed to assess the robustness and stability of the model developed [85]. The sensitivity analysis reveals how the suitability index of the model would change with the different criteria’s weightage. The responsiveness demonstrates how the suitable location of the solar farm installation can vary with different points of view of the decision-makers and planners. The method executed by Guler et al. [86] is adopted, in which four different scenarios, concerning different stakeholder agendas, the environmentalist, social impact, economic cost, and the developer, are identified and tested. In the environmentalist scenario, the priority is on environmental protection, focusing on the decision with a minimal environmental impact. The social impact scenario prioritizes the social benefit of a solar farm to the local community, for instance, job opportunities. The economic cost scenario seeks a location that balances the upfront and operation costs. Finally, from the developer’s point of view, they seek to find an alternative decision that maximizes the profit to ensure a high investment return. Hypothetical decision-makers are used in the weightage assignment, and then the weights are normalized and averaged to obtain the final criteria weights (see Table 6).

3. Results

The results obtained in this study are presented in the following subsections. The NASA POWER validation results are first presented, followed by the AHP results showing the weightage for every criterion. The next part is the presentation of the output of the site selection task, where a final suitability map is generated through the approach of the GIS-based MCDM. The final part is the validation result of the final suitability map.

3.1. NASA POWER Data Validation

Table 7 shows the statistical indices and errors in regard to the comparison between the NASA POWER and ground-measured meteorological data in the study area. The performance of NASA POWER varied for the different parameters with R2, ranging from 0.12 to 0.58. The performance of NASA POWER for the minimum temperature, maximum temperature, mean temperature, and solar radiation, is satisfactory with R2 (0.45, 0.57, 0.58, and 0.55, respectively), RMSE (2.77, 2.77, 0.94, and 3.05, respectively), NRMSE (0.112, 0.087, 0.034, and 0.782), MBE (2.53, −2.55, 0.38, and 1.92, respectively), NMBE (10.27, −8.09, 1.36, and 7.21, respectively). However, the performance of NASA POWER for the wind speed mean, relative humidity, and rainfall are relatively lower with R2 (0.12, 0.24, and 0.27, respectively), RMSE (1.65, 5.88, and 16.83, respectively), NRMSE (0.889, 0.073, and 5.191, respectively), MBE (1.22, −1.29, and 2.89), and NMBE (1.22, −1.61, and 89.42, respectively).

3.2. AHP’s Pairwise Comparison Matrix
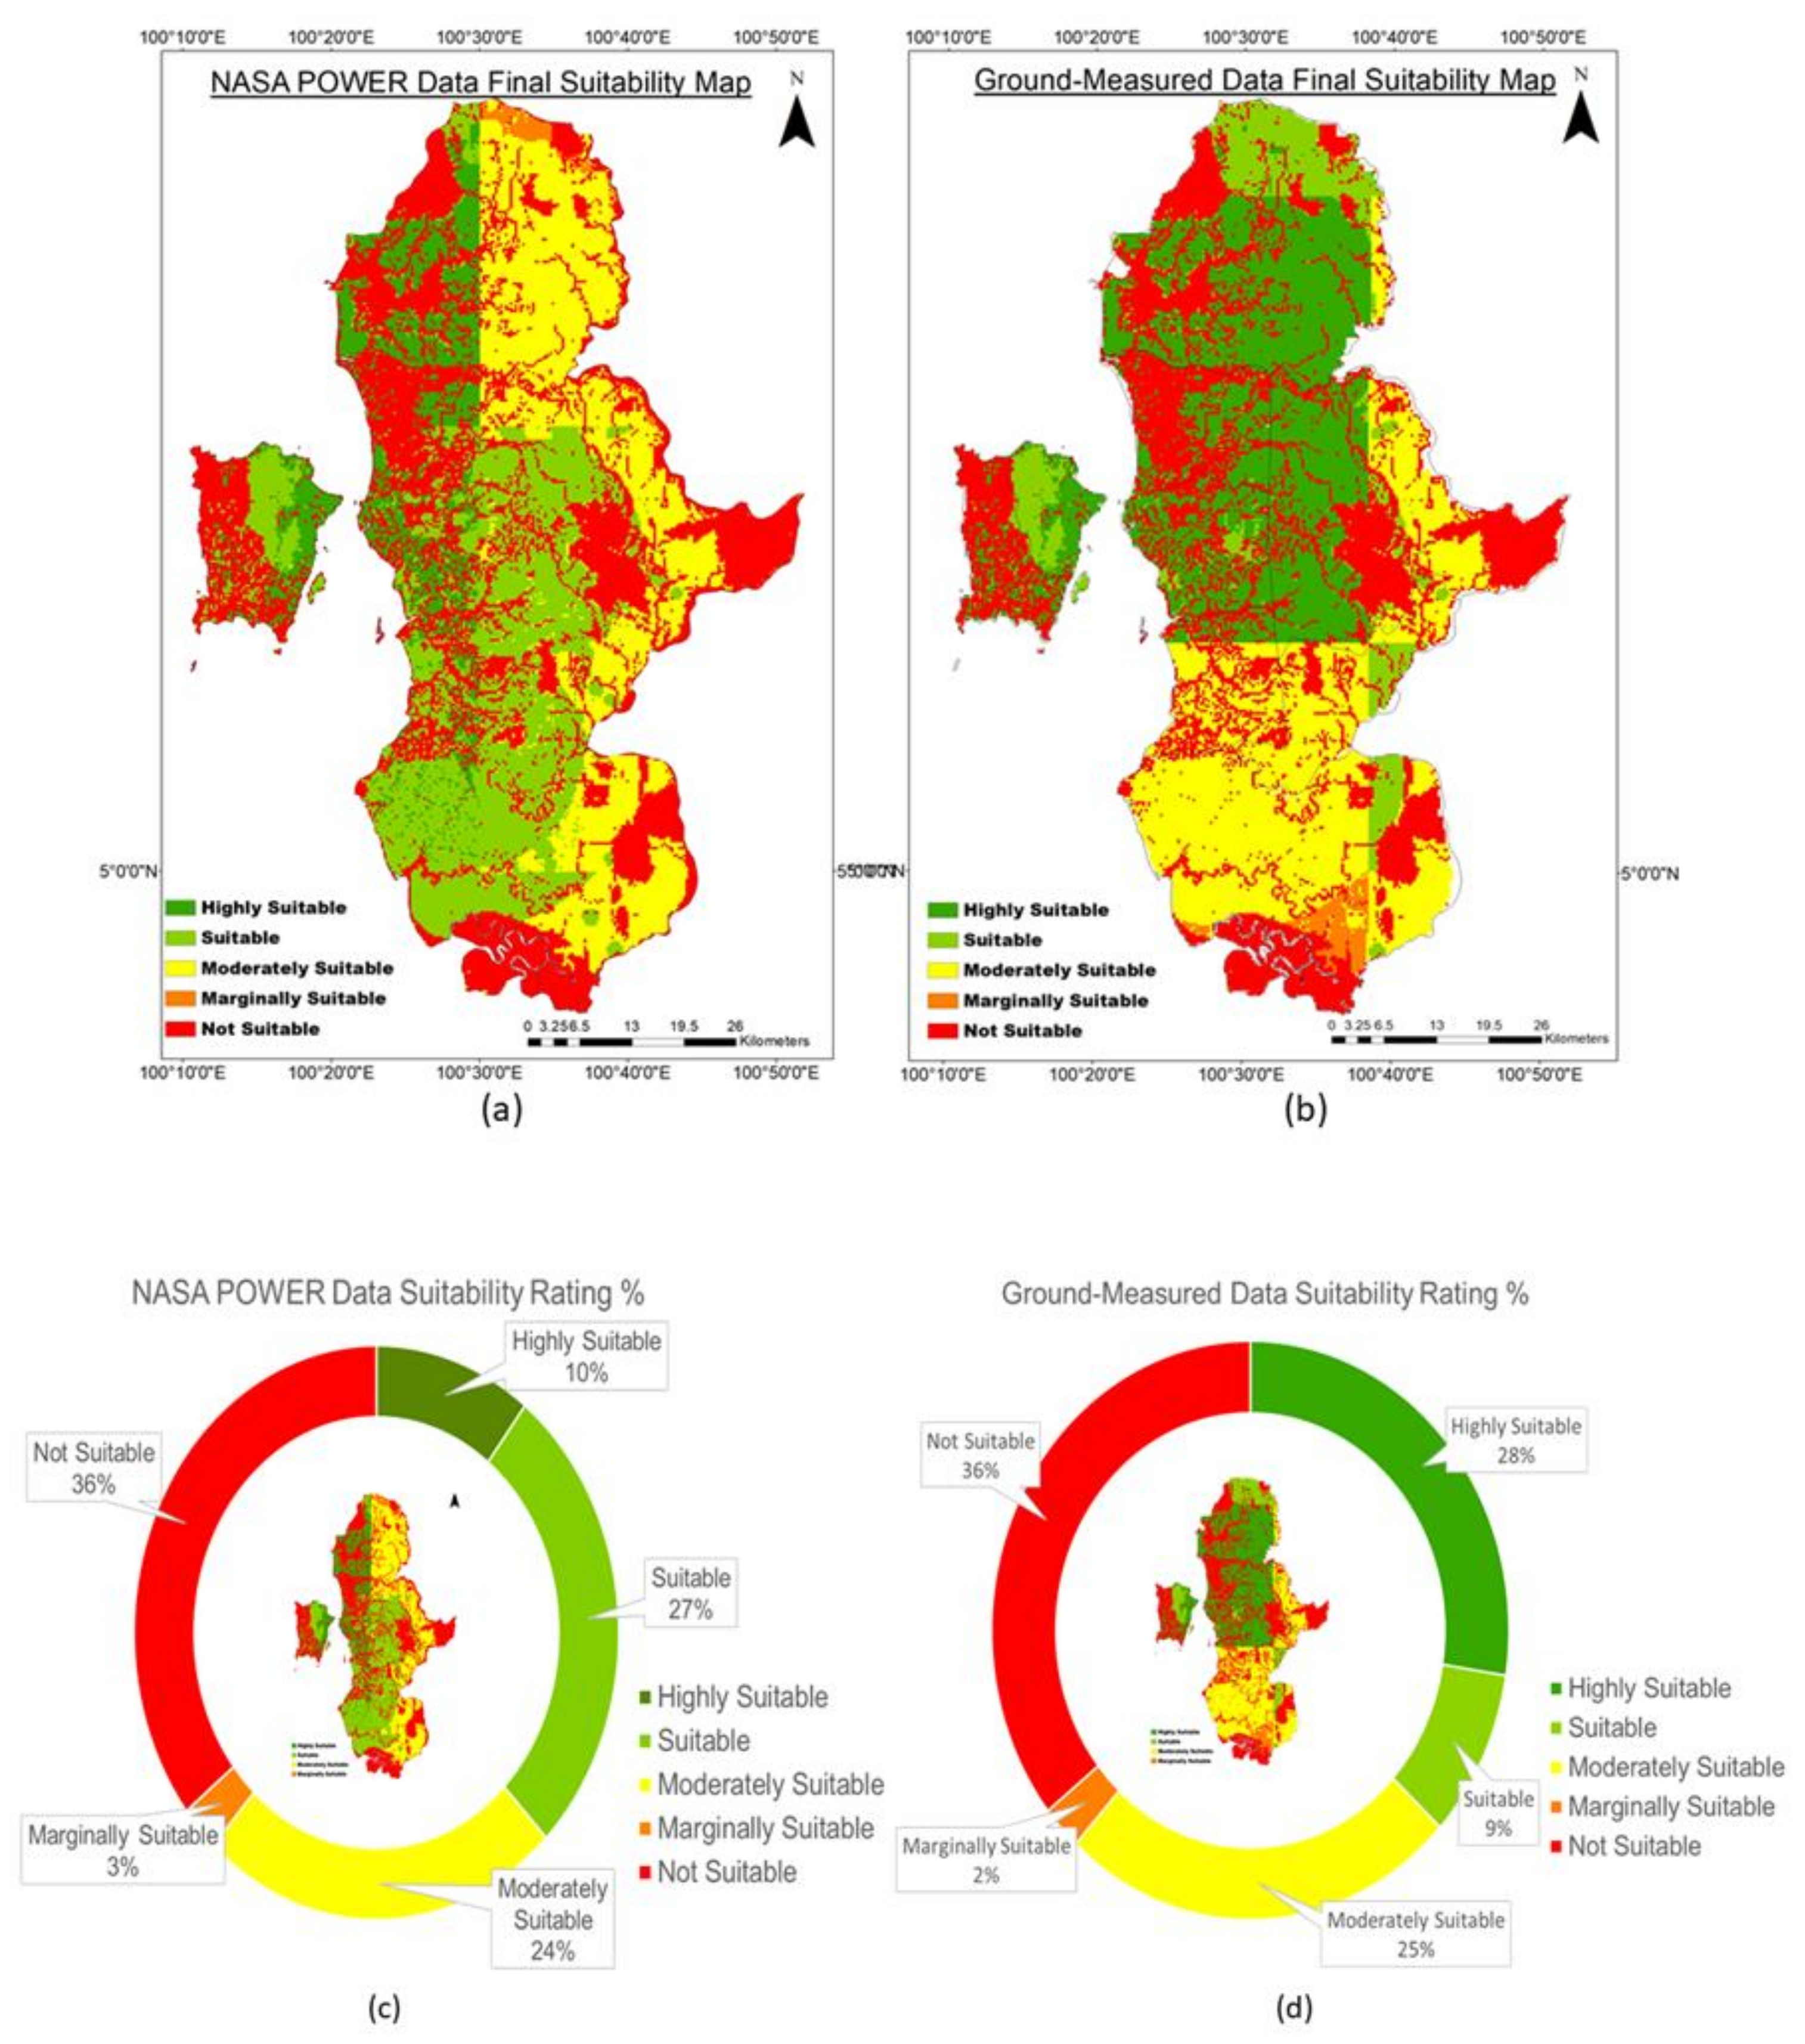
Table 8 shows the mean weightage for all criteria given by the experts. Under the climate criteria, the highest weightage is the GHI, followed by relative humidity, temperature, rainfall, wind speed, sunshine hours, and cloud amount. Under the orography criteria, elevation plays a significant role as it has a higher weightage (i.e., 0.80), relative to the slope. Under the economic criteria, the highest weightage is the distance to the road, followed by the distance to the urban area and the distance to the power line. As for the overall criteria, the climate has the highest weightage in defining the suitability location for the solar farm installation, followed by the economic, land use, and finally the orography. The climate scores the highest weightage, owing to the priority in maximizing the potential energy generation from the solar farm. Based on Saaty [87], the consistency ratio (CR) can be used to check for inconsistencies in the weightage decided by the decision-makers. A CR value less than 0.1 is preferred as a smaller value signifies a small probability that the weightage was assigned at random. The CR for climate, orography, economic, and overall are 0.1202, 0.000, 0.0872, and 0.0745, respectively. Based on Brunelli [88], in the case of more than six criteria, obtaining a CR < 0.1 is impossible. Hence, in this study, a threshold of 0.2 is set as the limit of an acceptable CR [89].

3.3. GIS-Based MCDM

The suitability map for each criterion layer prepared using the raster reclassify tool available in the ArcMap environment, are displayed in Figure 4. The reclassification tool reclassifies the value of the pixels in the suitability map into five categories: “highly suitable”, “suitable”, “moderately suitable”, “marginally suitable”, and “not suitable”. The criteria that have less than five suitability classifications are mainly the climate criteria. This is because the climate data used in the study area are of a coarse resolution with little spatial variation in climate. Figure 5a shows the initial suitability map which is generated by combining the suitability map of the climatic, orography, economic, and land use with their respective weights. The restriction map, as shown in Figure 5b, is generated by multiplying all Boolean restriction layers. The restriction map enables the exclusion of the areas prohibited for the solar farm development from the final suitability analysis. The elimination of the prohibited area is achieved by the raster calculator tool, with which the initial suitability layer is multiplied by the final restriction layer to produce the final suitability map. This tool enables the rapid elimination of the restricted areas, allowing the model to analyze only potential locations.
Figure 6 shows the final suitability map generated by the NASA POWER data and the ground-measured data. It can be seen from Figure 6c that, for the NASA POWER data map, 10% of the study area is identified as “highly suitable”, 27% of the area is “suitable”, 24% of the area is “moderately suitable”, 3% of the area is “marginally suitable”, and the rest of the study area, 36%, is “not suitable”. As for the suitability map for the ground-measured data, about 28% of the study area scores is identified as “highly suitable”, 9% of the area is “suitable”, 25% of the area is “moderately suitable”, 2% of the area is “marginally suitable”, and the rest of the study area, 36%, is “not suitable” for the installation of a solar farm.

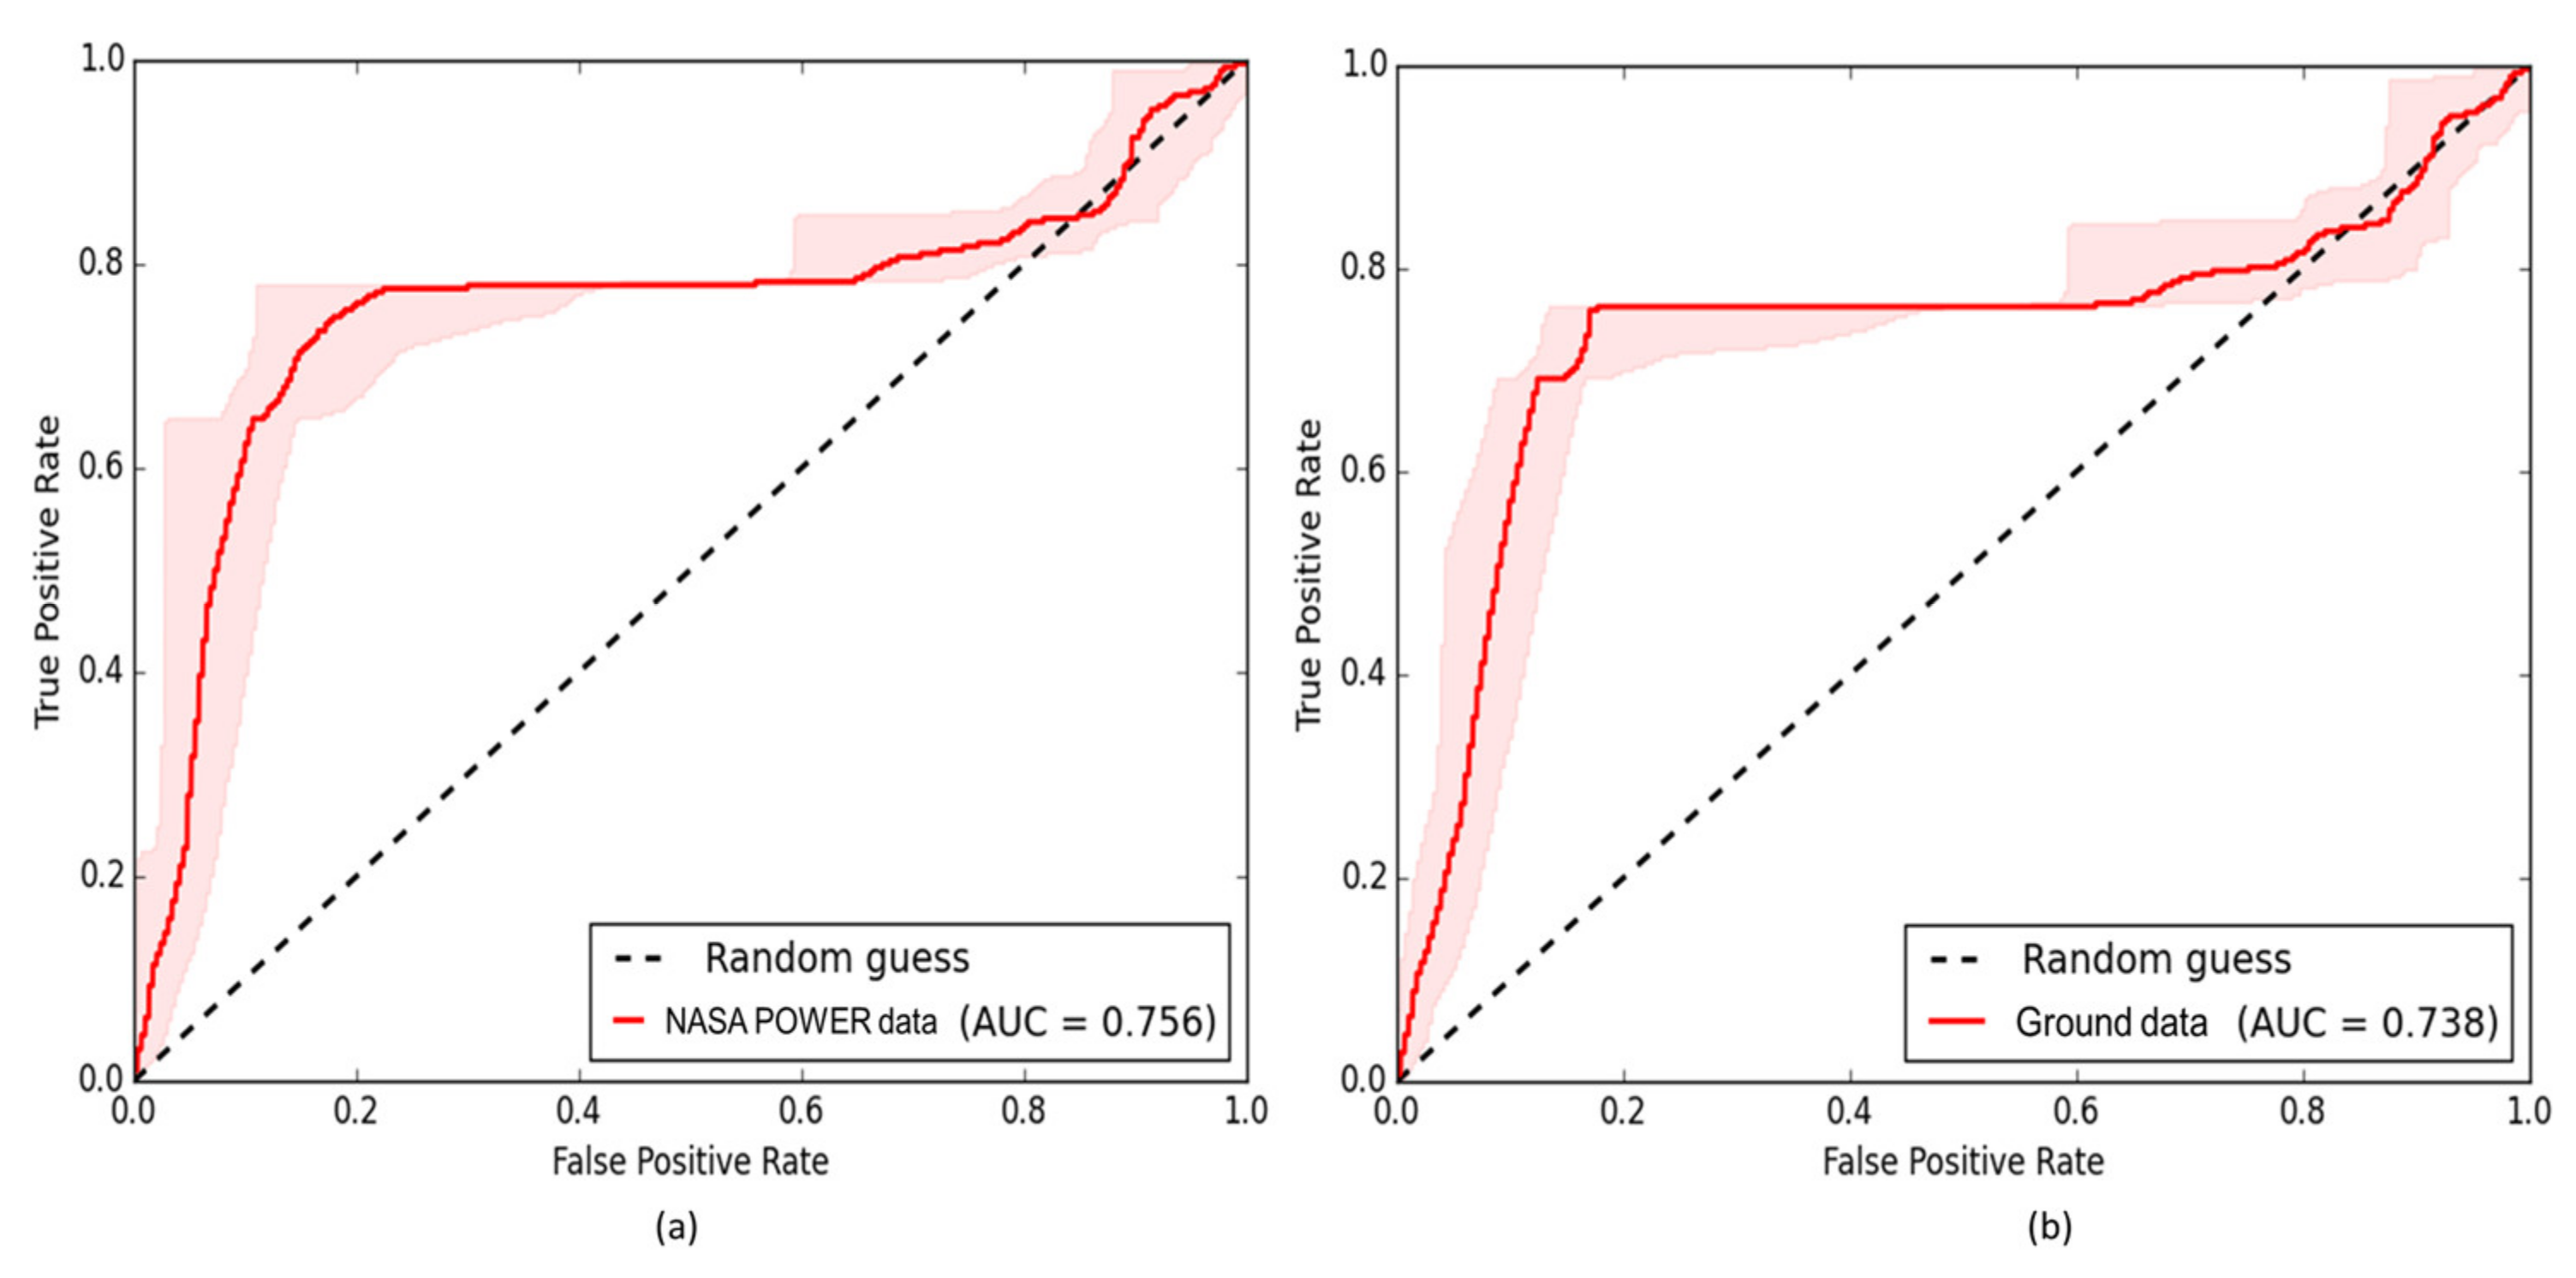
3.4. Model Evaluation

3.4.1. Model Validation

The first approach used in validating the GIS-based MCDM model in this study is the qualitative approach. Figure 7 shows the layer of the existing solar farms and the “highly suitable” site locations overlaid together, enabling a visual comparison. About 85% of the existing solar farm lies on the “highly suitable parcel” for the NASA POWER data map, while it achieves 80% for the ground-measured data. There are no significant differences between the two models, and both predicted potential sites are considered acceptable. As for the second approach, the AUC of the ROC for both the NASA POWER data map and ground-measured data map is shown in Figure 8a,b. The value of the AUC for the NASA POWER data and the ground-measured data are 0.756 and 0.738, respectively. The AUC value for each model indicates that the quality of the predicted potential sites fall under the category of “good” [90].

3.4.2. Sensitivity Analysis

The sensitivity analysis reveals the suitability results generated by a model change with varying criteria weights. From Figure 9a, there are no significant differences in the suitability results between the scenarios tested in this analysis. Figure 9b compares the suitability classification coverage in each scenario. The coverage for the “not suitable” location is the same in every scenario, as the same restriction map is used. The social impact scenario has the highest number of highly suitable pixels, followed by the economic, the developer, and the environmental scenarios. The results show that the model has a low sensitivity on the weightage, implying that the identified location is robust, concerning these criteria. However, it is worth noting that the model is still subject to respond to different agendas set by the decision-makers. Hence, the GIS-based MCDM approach should be used as a decision support tool instead of as a decision-making tool. This approach is used to identifying the feasible alternative locations for the solar farm installation to the decision-makers in a structured and scientific manner.

4. Discussion

The data covering the monthly solar radiation, average maximum, mean and minimum temperatures, from NASA POWER show a satisfactory performance. By contrast, monthly mean wind speed, relative humidity, rainfall and minimum temperature represent an unsatisfactory performance. The performance of NASA POWER in estimating the temperature and solar quantities in this study area is relatively poor, compared to the previous study. For instance, the R2 for all temperatures and solar radiation estimated in Brazil [53,91,92] and in the other parts of the world [51,52,59,93,94,95] range from 0.74 to 0.91. The reason behind the differences is mainly because of the study area’s size. The size of the George Town Conurbation is relatively small (3938 km2), compared to the study area in previous studies (more than 30,000 km2) that use the NASA POWER data. Kapica et al. [96] highlighted that the coarse spatial resolution of NASA POWER does not consider the actual spatial variability on the ground. Resulting in the accuracy reduction for estimating the local scale meteorological quantities. However, the performance of NASA POWER in estimating the mean wind speed, relative humidity, and rainfall, is in line with the previous studies, as reported by Aboelkhair et al. [52] NASA POWER fails to simulate the relative humidity accurately. One of the reasons associated with the failure in simulating the relative humidity is the sea effect on the coastal weather stations affecting the ground-measured data [97].
This research uses the GIS-based MCDM method to locate a potential area for the solar farm establishment in a limited space landscape. According to the NASA POWER’s model (see Figure 6c), about 10% of the George Town Conurbation region is highly suitable for the solar farm development, and the highly potential sites increase to 28% when using the ground-measured data. Although there are slight differences between the final suitability map generated using the NASA POWER data and the ground-measured data, the model’s validation shows no significant differences between the two outputs. The findings of this study are in good agreement with the results obtained by Sabo et al. [18] where a large part of their study area is considered suitable for a solar farm installation in their evaluation of the potential sites for solar farms in the whole of Peninsular Malaysia. In this study, approximately 36% of the area is excluded from the final analysis, hugely owing to its environmentally sensitive areas (i.e., forest and water bodies), residential areas, and airports. The exclusion of these areas allows the protection of environmentally sensitive areas while benefitting the human economic activity and maintaining the ecological balance of the area [98]. Another reason is the increasing land-use competition in the study area, due to the limited space landscape with an increasing population and a high rate of urban expansion [99].
The locations that were identified as highly suitable locations by the model are further assessed and discussed here, to find the most feasible area for a solar farm installation. Further location evaluation is based on its land use and its size. The area requirement set by the EC Malaysia is used as a basis for refining the potential site, where the capacity of a solar farm is targeted to generate about 50 MW of electricity. Finn et al. [38] estimated that 50 MW could provide electricity to about 32,500 homes per day. Using the data from Penang Institute, the total number of Penang’s households in 2019 was 448,700 [100]. Therefore, one 50 MW solar farm could power roughly about 0.7% of all households in Penang. To generate 1 MW of electricity, a land area of 2.5 acres is required. Hence, at least 125 acres of land is needed to generate 50 MW of electricity. Concerning the location’s land use, as mentioned previously, vacant land and built-up areas are rated as “highly suitable” while agricultural land is rated as “suitable”.
Figure 10a shows the identified suitable sites for the study area with a basemap as a reference to further validate the land use of each location. From Figure 10a, it can be seen that most of the potential locations in Penang Island are either mountainous forest or built-up areas. The mountainous forest is strictly avoided, to protect the forest, as it plays a vital role in the global climate change mitigation [101]. Although a study by Um [102] proves that the installation of forest-photovoltaic in the forest mountain landscape is effective in both carbon capture and energy production, the technology is still in its infancy. Therefore, it is best not to consider the mountainous forests as feasible sites for the flat solar panel installation. Figure 10b–e are the top four locations chosen as the most suitable sites for a solar farm installation, mainly because their estimated size is more than 125 acres and their suitable land use.
The land use of the sites in Figure 10b,c is the built-up areas. Thus, the best option for solar energy harvesting is to utilize the non-competing space by installing rooftop solar panels [76]. Moreover, since the energy demand of the building sector is high (i.e., 40% of the global energy consumption) the installation of rooftop solar panels contributes to the building’s carbon footprint reduction [103]. Additionally, the Malaysian government supports the implementation of rooftop solar panels by providing financing structures, which include leasing packages (zero installation capital), outright purchases, loans from financing institutions, and solar power purchase agreements (SPPAs) [9]. However, depending on the size, the height of the rooftop area, and the government policies, solar panels have different feasibilities for electricity generation, as shown by the cost-benefit analysis performed by Suparwoko et al. [104] and Shukla et al. [105]. Therefore, it is essential to further investigate and estimate the rooftop solar potential for a specific location similar to the work carried out by Cronin et al. [58], in which it was approximated, using the NASA POWER data, that the solar potential of buildings in the study area is 660 kW per building. The concept of rooftop solar panels is not foreign to the study area, for instance, the current effort made by The Universiti Sains Malaysia (USM). The USM’s solar project involved the installation of a 10.6 MWp on-site rooftop solar systems in its campus area. The project is capable of supplying 63.73% of its peak power demand and is estimated to eliminate the CO2 emissions to about 217,705 tons throughout its lifetime [106]. Figure 11a,b shows that the model has identified the whole USM campus as a “highly suitable” location for the installation of solar panels. Figure 11c,d shows the installed solar panels around the USM campus.
Alternative feasible sites are shown in Figure 10d,e, where the land use for these two sites is agricultural land. The results are in line with the agreement made by researchers and policymakers, that agricultural land seems to have a high potential for solar energy development due to its level terrain and proximity to roads, power grid, and energy users [107,108]. However, the conversion of agricultural land into solar farms is still debatable, due to the agricultural land scarcity issue currently faced by Malaysia, and the unknown long-term effect of solar farms on the soil fertility [109,110]. According to Farja et al. [111], from the farmer’s perspective, leasing their agricultural land for solar energy production provides them with a steady income rather than depending on the uncertain agriculture production. In addition to that, the location shown in Figure 10d is agricultural land located near the coastal line where the yield of the paddy field has been reported to be affected by the intrusion of saltwater. This has been a problem for the farmers located in that specific area since 2016, where they have been bearing losses of a more than 75% decrease in yield [112]. De Luna et al. [113] reported a promising economic value for a solar farm installation in their cost-benefit analysis of agricultural land conversion. The installation of solar farms on agricultural land undoubtedly provides environmental benefits, in terms of carbon footprint reduction and renewable energy generation. However, the conversion might lead to food security issues. To address this issue, Vyas [114] and Othman et al. [115] suggested agrivoltaic systems, where cultivated crops and solar panels co-exist in the same site, to reap the benefits of both energy generation and crop production.

5. Conclusions

The main objective of this study is to identify the most suitable location for establishing solar farms in the George Town Conurbation region using the GIS-MCDM approach and the NASA POWER data. The NASA POWER data was first validated for accuracy before being used in the spatial analysis. The performance of the NASA POWER data is satisfactory for the solar radiation, maximum, mean, and minimum temperatures, but relatively poorer for the relative humidity, mean wind speed, and rainfall. The AUC value for both NASA POWER and ground-measured data maps are 0.756 and 0.738, respectively. The AUC values show that both models’ performances are good in locating the suitable location for a solar farm installation and have no significant differences between the two models’ outputs. This shows that the climatic data provided by NASA POWER can potentially be used for a solar farm site selection in Malaysia. The output of the model shows the capabilities of the GIS-based MCE method in the rapid identification of the potential area for a solar farm installation while avoiding non-potential areas, enabling the focus of resources on the feasible sites. The end user can benefit from the suitability map generated to effectively target the locations that have the highest potential to generate solar energy.
As the climate has the most significant influence on the solar farm’s suitability index, it is good to run the model using future climate data. This enables a comparison of the suitable locations to be made with the current climate condition and the future climate condition. The coarse resolution of the NASA-POWER data is one of the limitations in the solar farm identification at a local scale. Similarly, a lack of weather stations in collecting solar, wind speed, and relative humidity information is also a main problem in developing countries. Therefore, further research should be carried out to integrate the NASA-POWER and weather stations data, in order to generate more accurate climate information for solar projects.

Author Contributions

Conceptualization, P.N.A.B. and M.L.T.; methodology, P.N.A.B. and M.L.T.; software, P.N.A.B.; validation, P.N.A.B., M.A.M., M.L.T., and S.Y.T.; formal analysis, P.N.A.B.; Resources, M.L.T. and N.S.; writing—original draft preparation, P.N.A.B.; writing—review and editing, M.L.T., S.Y.T., S.M.S., F.T., L.J., J.X.C. and M.S.S.; visualization, P.N.A.B.; supervision, M.L.T., N.S. and F.T.; project administration, M.L.T.; funding acquisition, M.L.T. All authors have read and agreed to the published version of the manuscript.

Funding

This research was funded by the Universiti Sains Malaysia, Research University Team (RUTeam) Grant Scheme with Project No. 1001/PHUMANITI/8580014.

Institutional Review Board Statement

Not applicable.

Informed Consent Statement

Not applicable.

Data Availability Statement

NASA POWER data is freely available at https://power.larc.nasa.gov/data-access-viewer/ (accessed on 5 May 2022). The final solar farm suitability maps are available upon request from the corresponding author.

Acknowledgments

The authors acknowledge the National Aeronautics and Space Administration (NASA) on their Prediction of Worldwide Energy Resource (POWER) Project, the United States Geological Survey, Malaysian Meteorological Department, PLANMalaysia and Malaysia Geospatial Data Infrastructure (MyGDI), for supplying the meteorological and geospatial data to this study. First author acknowledges the Graduate Fellowship Universiti Sains Malaysia (GFUSM) for the support given throughout this study.

Conflicts of Interest

The authors declare no conflict of interest.

References

  1. IEA. World Energy Balances 2021: Overview. 2021. Available online: www.iea.org/weo (accessed on 10 June 2022).
  2. IEA. World Energy Outlook 2021—Revised Version October 2021. Available online: https://www.iea.org/reports/world-energy-balances-overview/world (accessed on 10 June 2022).
  3. United Nations Statistics División. The Energy Progress Report 2021; IEA: Paris, France, 2021; pp. 158–177. Available online: https://trackingsdg7.esmap.org/data/files/download-documents/2021_tracking_sdg7_chapter_6_outlook_for_sdg7.pdf (accessed on 22 June 2022).
  4. Al Garni, H.Z.; Awasthi, A. Solar PV Power Plants Site Selection: A Review; Elsevier Inc.: Amsterdam, The Netherlands, 2018; Volume 1, ISBN 9780128132173. [Google Scholar]
  5. Ali, S.; Taweekun, J.; Techato, K.; Waewsak, J.; Gyawali, S. GIS Based site suitability assessment for wind and solar farms in Songkhla, Thailand. Renew. Energy 2019, 132, 1360–1372. [Google Scholar] [CrossRef]
  6. Khare, V.; Nema, S.; Baredar, P. Solar-wind hybrid renewable energy system: A review. Renew. Sustain. Energy Rev. 2016, 58, 23–33. [Google Scholar] [CrossRef]
  7. Ashnani, M.H.M.; Johari, A.; Hashim, H.; Hasani, E. A source of renewable energy in Malaysia, why biodiesel? Renew. Sustain. Energy Rev. 2014, 35, 244–257. [Google Scholar] [CrossRef]
  8. Ekonomi Malaysia. Eleventh Malaysia Plan, 2016–2020: Anchoring Growth on People; Economic Planning Unit; Prime Minister’s Department: Putrajaya, Malaysia, 2015; Volume 23, ISBN 9789675842085. [Google Scholar]
  9. Abdullah, W.S.W.; Osman, M.; Kadir, M.Z.A.A.; Verayiah, R. The potential and status of renewable energy development in Malaysia. Energies 2019, 12, 2437. [Google Scholar] [CrossRef] [Green Version]
  10. MIDA. Malaysia Focusing on Increasing Renewable Energy Capacity. Available online: https://www.mida.gov.my/mida-news/malaysia-focusing-on-increasing-renewable-energy-capacity/ (accessed on 15 July 2022).
  11. Mekhilef, S.; Safari, A.; Mustaffa, W.E.S.; Saidur, R.; Omar, R.; Younis, M.A.A. Solar Energy in Malaysia: Current State and Prospects. Renew. Sustain. Energy Rev. 2012, 16, 386–396. [Google Scholar] [CrossRef]
  12. Ludin, N.A.; Affandi, N.A.A.; Purvis-Roberts, K.; Ahmad, A.; Ibrahim, M.A.; Sopian, K.; Jusoh, S. Environmental impact and levelised cost of energy analysis of solar photovoltaic systems in selected Asia Pacific Region: A cradle-to-grave approach. Sustainability 2021, 13, 396. [Google Scholar] [CrossRef]
  13. Eldrandaly, K. Developing a GIS-Based MCE site selection tool in ArcGIS using COM Technology. Int. Arab. J. Inf. Technol. 2013, 10, 263–274. [Google Scholar]
  14. Eastman, J. Multi-criteria evaluation and GIS. Geogr. Inf. Syst. 1999, 1, 493–502. [Google Scholar]
  15. Aly, A.; Jensen, S.S.; Pedersen, A.B. Solar power potential of Tanzania: Identifying CSP and PV hot spots through a GIS multicriteria decision making analysis. Renew. Energy 2017, 113, 159–175. [Google Scholar] [CrossRef]
  16. Doorga, J.R.S.; Rughooputh, S.D.D.V.; Boojhawon, R. Multi-criteria GIS-based modelling technique for identifying potential solar farm sites: A case study in Mauritius. Renew. Energy 2019, 133, 1201–1219. [Google Scholar] [CrossRef]
  17. Nguyen, D.T.; Truong, M.H.; Phan, D.T. Gis-based simulation for solar farm site selection in South-Central Vietnam. GeoJournal 2021, 8, 3685–3699. [Google Scholar] [CrossRef]
  18. Sabo, M.L.; Mariun, N.; Hizam, H.; Mohd Radzi, M.A.; Zakaria, A. Spatial energy predictions from large-scale photovoltaic power plants located in optimal sites and connected to a smart grid in peninsular Malaysia. Renew. Sustain. Energy Rev. 2016, 66, 79–94. [Google Scholar] [CrossRef]
  19. Lurwan, S.M.; Idrees, M.O.; Ahmed, G.B.; Lay, U.S.; Mariun, N. GIS-based optimal site selection for installation of large-scale smart grid-connected photovoltaic (PV) power plants in Selangor, Malaysia. Am. J. Appl. Sci. 2017, 14, 174–183. [Google Scholar] [CrossRef] [Green Version]
  20. Ruiz, H.S.; Sunarso, A.; Ibrahim-Bathis, K.; Murti, S.A.; Budiarto, I. GIS-AHP multi criteria decision analysis for the optimal location of solar energy plants at Indonesia. Energy Rep. 2020, 6, 3249–3263. [Google Scholar] [CrossRef]
  21. Magalhães, I.B.; Cabral de Barros Nogueira, G.C.; Lage Alves, I.S.; Calijuri, M.L.; Lorentz, J.F.; do Carmo Alves, S. Site suitability for photovoltaic energy expansion: A Brazilian’s high demand states study case. Remote Sens. Appl. 2020, 19, 100341. [Google Scholar] [CrossRef]
  22. Yatu, G.; Sailesh, S. Modelling of potential renewable energy in Papua New Guinea. Spat. Inf. Res. 2022, 30, 355–370. [Google Scholar] [CrossRef]
  23. Piyatadsananon, P. Spatial factors consideration in site selection of ground-mounted PV power plants. Energy Procedia 2016, 100, 78–85. [Google Scholar] [CrossRef] [Green Version]
  24. Zhou, X.; Huang, Z.; Wang, H.; Yin, G.; Bao, Y.; Dong, Q.; Liu, Y. Site selection for hybrid offshore wind and wave power plants using a four-stage framework: A case study in Hainan, China. Ocean Coast. Manag. 2022, 218, 106035. [Google Scholar] [CrossRef]
  25. Khazael, S.M.; Al-Bakri, M. The optimum site selection for solar energy farms using AHP in GIS environment, a case study of Iraq. Iraqi J. Sci. 2021, 62, 4571–4587. [Google Scholar] [CrossRef]
  26. Ibrahim, G.R.F.; Hamid, A.A.; Darwesh, U.M.; Rasul, A. A GIS-Based Boolean Logic-Analytical Hierarchy Process for Solar Power Plant (Case Study: Erbil Governorate—Iraq). Environ. Dev. Sustain. 2021, 23, 6066–6083. [Google Scholar] [CrossRef]
  27. Akif Günen, M. Evaluation of GIS based ranking and AHP methods in selecting the most suitable site: A case study in Kayseri, Turkey. Environ. Sci. Pollut. Res. 2021, 28, 1–28. [Google Scholar]
  28. Akkas, O.P.; Erten, M.Y.; Cam, E.; Inanc, N. Optimal site selection for a solar power plant in the central Anatolian region of Turkey. Int. J. Photoenergy 2017, 2017, 7452715. [Google Scholar] [CrossRef] [Green Version]
  29. Hassaan, M.A.; Hassan, A.; Al-Dashti, H. GIS-based suitability analysis for siting solar power plants in Kuwait. Egypt. J. Remote Sens. Space Sci. 2021, 24, 453–461. [Google Scholar] [CrossRef]
  30. Alhammad, A.; Sun, Q.; Yaguang, T. Optimal solar plant site identification using GIS and remote. Energies 2022, 15, 312. [Google Scholar] [CrossRef]
  31. Rehman, S.; Baseer, M.A.; Alhems, L.M. GIS-based multi-criteria wind farm site selection methodology. FME Trans. 2020, 48, 855–867. [Google Scholar] [CrossRef]
  32. Hasti, F.; Mamkhezri, J.; Pezhooli, N.; McFerrin, R. Optimal Pv sites selection using Gis-based modelling techniques and assessing environmental and economic impacts: The case of Kurdistan. SSRN Electron. J. 2022. [Google Scholar] [CrossRef]
  33. Barzehkar, M.; Parnell, K.E.; Mobarghaee Dinan, N.; Brodie, G. Decision support tools for wind and solar farm site selection in Isfahan Province, Iran. Clean Technol. Environ. Policy 2021, 23, 1179–1195. [Google Scholar] [CrossRef]
  34. Noorollahi, Y.; Ghenaatpisheh Senani, A.; Fadaei, A.; Simaee, M.; Moltames, R. A Framework for GIS-based site selection and technical potential evaluation of PV solar farm using fuzzy-boolean logic and AHP multi-criteria decision-making approach. Renew. Energy 2022, 186, 89–104. [Google Scholar] [CrossRef]
  35. Zoghi, M.; Houshang Ehsani, A.; Sadat, M.; javad Amiri, M.; Karimi, S. Optimization solar site selection by fuzzy logic model and weighted linear combination method in arid and semi-arid region: A case study Isfahan-IRAN. Renew. Sustain. Energy Rev. 2017, 68, 986–996. [Google Scholar] [CrossRef]
  36. Sánchez-Lozano, J.M.; Henggeler Antunes, C.; García-Cascales, M.S.; Dias, L.C. GIS-based photovoltaic solar farms site selection using ELECTRE-TRI: Evaluating the case for Torre Pacheco, Murcia, Southeast of Spain. Renew. Energy 2014, 66, 478–494. [Google Scholar] [CrossRef]
  37. Suh, J.; Brownson, J.R.S. Solar farm suitability using geographic information system fuzzy sets and analytic hierarchy processes: Case study of Ulleung Island, Korea. Energies 2016, 9, 648. [Google Scholar] [CrossRef] [Green Version]
  38. Finn, T.; McKenzie, P. A High-resolution suitability index for solar farm location in complex landscapes. Renew. Energy 2020, 158, 520–533. [Google Scholar] [CrossRef]
  39. Chaouachi, A.; Covrig, C.F.; Ardelean, M. Multi-criteria selection of offshore wind farms: Case study for the Baltic States. Energy Policy 2017, 103, 179–192. [Google Scholar] [CrossRef]
  40. Derdouri, A.; Murayama, Y. Onshore Wind farm suitability analysis using GIS-based analytic hierarchy process: A case study of Fukushima Prefecture, Japan. Geoinformatics Geostat. 2018, 16, 2. [Google Scholar] [CrossRef]
  41. Kaymaz, Ç.K.; Çakır, Ç.; Birinci, S.; Kızılkan, Y. GIS-Fuzzy DEMATEL MCDA model in the evaluation of the areas for ecotourism development: A case study of “Uzundere”, Erzurum-Turkey. Appl. Geogr. 2021, 136, 102577. [Google Scholar] [CrossRef]
  42. Asadi, M.; Pourhossein, K. Wind and solar farms site selection using geographical information system (GIS), based on multi criteria decision making (MCDM) methods: A case-study for East-Azerbaijan. In Proceedings of the 2019 Iranian Conference on Renewable Energy and Distributed Generation, ICREDG, Tehran, Iran, 11–12 June 2019. [Google Scholar] [CrossRef]
  43. Doljak, D.; Stanojević, G. Evaluation of natural conditions for site selection of ground-mounted photovoltaic power plants in Serbia. Energy 2017, 127, 291–300. [Google Scholar] [CrossRef] [Green Version]
  44. Xu, Y.; Li, Y.; Zheng, L.; Cui, L.; Li, S.; Li, W.; Cai, Y. Site selection of wind farms using GIS and multi-criteria decision making method in Wafangdian, China. Energy 2020, 207, 118222. [Google Scholar] [CrossRef]
  45. Akhtar, R.; Azam, K.; Babar, A.R.; Khalid, Q.S.; Nawaz, R.; Ahmad, I. Site selection of solar farms deploying fuzzy analytical hierarchy process (F-AHP) a KPK based study. J. Eng. Appl. Sci. (JEAS) Univ. Eng. Technol. Peshawar 2020, 39, 14–21. [Google Scholar] [CrossRef]
  46. Beriro, D.; Nathanail, J.; Salazar, J.; Kingdon, A.; Marchant, A.; Richardson, S.; Gillet, A.; Rautenberg, S.; Hammond, E.; Beardmore, J.; et al. A decision support system to assess the feasibility of onshore renewable energy infrastructure. Renew. Sustain. Energy Rev. 2022, 168, 112771. [Google Scholar] [CrossRef]
  47. Aljawarneh, S.; Lara, J.A.; Yassein, M.B. A visual big data system for the prediction of weather-related variables: Jordan-Spain case study. Multimed. Tools Appl. 2020. [Google Scholar] [CrossRef]
  48. Bai, P.; Liu, X. Evaluation of five satellite-based precipitation products in two gauge-scarce basins on the Tibetan Plateau. Remote Sens. 2018, 10, 1316. [Google Scholar] [CrossRef] [Green Version]
  49. Ang, R.; Kinouchi, T.; Zhao, W. Evaluation of daily gridded meteorological datasets for hydrological modeling in data-sparse basins of the largest lake in Southeast Asia. J. Hydrol. Reg. Stud. 2022, 42, 101135. [Google Scholar] [CrossRef]
  50. Sayago, S.; Ovando, G.; Almorox, J.; Bocco, M. Daily solar radiation from NASA-POWER Product: Assessing its accuracy considering atmospheric transparency. Int. J. Remote Sens. 2020, 41, 897–910. [Google Scholar] [CrossRef]
  51. Rodrigues, G.C.; Braga, R.P. Estimation of daily reference evapotranspiration from nasa power reanalysis products in a hot summer Mediterranean climate. Agronomy 2021, 11, 2077. [Google Scholar] [CrossRef]
  52. Aboelkhair, H.; Morsy, M.; el Afandi, G. Assessment of agroclimatology NASA POWER reanalysis datasets for temperature types and relative humidity at 2 m against ground observations over Egypt. Adv. Space Res. 2019, 64, 129–142. [Google Scholar] [CrossRef]
  53. Monteiro, L.A.; Sentelhas, P.C.; Pedra, G.U. Assessment of NASA/POWER satellite-based weather system for Brazilian conditions and its impact on sugarcane yield simulation. Int. J. Climatol. 2018, 38, 1560–1570. [Google Scholar] [CrossRef]
  54. DOSM. Key Findings: Population and Housing Census of Malaysia 2020; Putrajaya, Malaysia, 2022; Putrajaya, Malaysia. 2022. Available online: https://cloud.stats.gov.my/index.php/s/BG11nZfaBh09RaX#pdfviewer (accessed on 2 August 2022).
  55. NCER. NCER Priority Sectors: Green Economy. Available online: https://www.ncer.com.my/invest-in-ncer/ncer-priority-sectors/green-economy/ (accessed on 25 June 2022).
  56. Sluiter, R. Interpolation Methods for Climate Data; De Bilt. 2008. Available online: https://uaf-snap.org/wp-content/uploads/2020/08/Interpolation_methods_for_climate_data.pdf (accessed on 25 August 2022).
  57. Quansah, A.D.; Dogbey, F.; Asilevi, P.J.; Boakye, P.; Darkwah, L.; Oduro-Kwarteng, S.; Sokama-Neuyam, Y.A.; Mensah, P. Assessment of solar radiation resource from the NASA-POWER reanalysis products for tropical climates in Ghana towards clean energy application. Sci. Rep. 2022, 12, 10684. [Google Scholar] [CrossRef]
  58. Cronin, E.; Fernando, A.; James, J.; Kurinchi-Vendhan, R. Estimating Solar Potential Using NASA POWER Data to Inform Renewable Energy Policy for Washington, D.C. 2021. Available online: https://ntrs.nasa.gov/citations/20220001899 (accessed on 25 May 2022).
  59. Rodrigues, G.C.; Braga, R.P. Evaluation of NASA power reanalysis products to estimate daily weather variables in a hot summer mediterranean climate. Agronomy 2021, 11, 1207. [Google Scholar] [CrossRef]
  60. NASA. NASA Power Data Access. Available online: https://power.larc.nasa.gov/data-access-viewer/ (accessed on 15 August 2021).
  61. Adeyanju, A.A.; Manohar, K. Assessment of Solar Thermal Energy Technologies in Nigeria. In Proceedings of the IEEE Green Technologies Conference (IEEE-Green), Lafayette, LA, USA, 14–15 April 2011; pp. 1–6. [Google Scholar]
  62. Piñeiro, G.; Perelman, S.; Guerschman, J.P.; Paruelo, J.M. How to evaluate models: Observed vs. predicted or predicted vs. observed? Ecol. Model. 2008, 216, 316–322. [Google Scholar] [CrossRef]
  63. Moriasi, D. Model evaluation guidelines for sytematic quantification of accuracy in watershed simulations. Trans. ASABE 2007, 50, 885–900. [Google Scholar] [CrossRef]
  64. Christie, D.; Neil, S.P. Measuring and observing the ocean renewable energy resource. In Comprehensive Renewable Energy; Springer: Berlin/Heidelberg, Germany, 2022; pp. 149–175. [Google Scholar]
  65. Noorollahi, E.; Fadai, D.; Shirazi, M.A.; Ghodsipour, S.H. Land suitability analysis for solar farms exploitation using GIS and fuzzy analytic hierarchy process (FAHP)—A case study of Iran. Energies 2016, 9, 643. [Google Scholar] [CrossRef] [Green Version]
  66. Hong, T.; Lee, M.; Koo, C.; Jeong, K.; Kim, J. Development of a method for estimating the rooftop solar photovoltaic (PV) potential by analyzing the available rooftop area using hillshade analysis. Appl. Energy 2017, 194, 320–332. [Google Scholar] [CrossRef]
  67. Grilli, G.; Balest, J.; de Meo, I.; Garegnani, G.; Paletto, A. Experts’ opinions on the effects of renewable energy development on ecosystem services in the Alpine region. J. Renew. Sustain. Energy 2016, 8, 013115. [Google Scholar] [CrossRef]
  68. Amajama, J.; Oku, D.E. Effect of relative humidity on photovoltaic panels’ output and solar illuminance/intensity. J. Sci. Eng. Res. 2016, 3, 126–130. [Google Scholar]
  69. Waterworth, D.; Armstrong, A. Southerly winds increase the electricity generated by solar photovoltaic systems. Sol. Energy 2020, 202, 123–135. [Google Scholar] [CrossRef]
  70. Omubo-Pepple, V.B.; Israel-Cookey, C.; Alaminokuma, G.I. Effects of temperature, solar flux and relative humidity on the efficient conversion of solar energy to electricity. Eur. J. Sci. Res. 2009, 35, 173–180. [Google Scholar]
  71. Giamalaki, M.; Tsoutsos, T. Sustainable siting of solar power installations in mediterranean using a GIS/AHP approach. Renew. Energy 2019, 141, 64–75. [Google Scholar] [CrossRef]
  72. Yousefi, H.; Hafeznia, H.; Yousefi-Sahzabi, A. Spatial Site Selection for Solar Power Plants Using a Gis-based boolean-fuzzy logic model: A case study of Markazi province, Iran. Energies 2018, 11, 1648. [Google Scholar] [CrossRef] [Green Version]
  73. Colak, H.E.; Memisoglu, T.; Gercek, Y. Optimal site selection for solar photovoltaic (PV) power plants using GIS and AHP: A case study of Malatya Province, Turkey. Renew. Energy 2020, 149, 565–576. [Google Scholar] [CrossRef]
  74. Saravanan, V.S.; Darvekar, S.K. Solar photovoltaic panels cleaning methods A review. Int. J. Pure Appl. Math. 2018, 118, 1–17. Available online: http://www.acadpubl.eu/hub/ (accessed on 28 August 2022).
  75. Charabi, Y.; Rhouma, M.B.H.; Gastli, A. Siting of Pv power plants on inclined terrains. Int. J. Sustain. Energy 2014, 35, 834–843. [Google Scholar] [CrossRef]
  76. Van de Ven, D.J.; Capellan-Peréz, I.; Arto, I.; Cazcarro, I.; de Castro, C.; Patel, P.; Gonzalez-Eguino, M. The potential land requirements and related land use change emissions of solar energy. Sci. Rep. 2021, 11, 2907. [Google Scholar] [CrossRef] [PubMed]
  77. Dupont, E.; Koppelaar, R.; Jeanmart, H. Global Available solar energy under physical and energy return on investment constraints. Appl. Energy 2020, 257, 113968. [Google Scholar] [CrossRef]
  78. Sreenath, S.; Sudhakar, K.; Yusop, A.F. Solar photovoltaics in airport: Risk assessment and mitigation strategies. Environ. Impact Assess. Rev. 2020, 84, 106418. [Google Scholar] [CrossRef]
  79. Paegelow, M. Multi Criteria Evaluation (MCE). In Geomatic Approaches for Modelling Land Change Scenarios; Springer: Berlin/Heidelberg, Germany, 2018; pp. 447–449. [Google Scholar] [CrossRef]
  80. Elboshy, B.; Alwetaishi, M.; Aly, R.M.H.; Zalhaf, A.S. A Suitability mapping for the PV solar farms in Egypt Based on GIS-AHP to Optimize Multi-Criteria Feasibility. Ain Shams Eng. J. 2022, 13, 101618. [Google Scholar] [CrossRef]
  81. Liu, Y.; Saitoh, S.I.; Radiarta, I.N.; Igarashi, H.; Hirawake, T. Spatiotemporal variations in suitable areas for japanese scallop aquaculture in the Dalian Coastal Area from 2003 to 2012. Aquaculture 2014, 422–423, 172–183. [Google Scholar] [CrossRef] [Green Version]
  82. Qureshi, M.E.; Harrison, S.R.; Wegener, M.K. Validation of multicriteria analysis models. Agric. Syst. 1999, 62, 105–116. Available online: https://www.sciencedirect.com/science/article/abs/pii/S0308521X99000591 (accessed on 25 September 2022). [CrossRef]
  83. Xiaolong, D.; Li, L.; Tan, Y. Validation of spatial prediction models for landslide susceptibility mapping by considering structural similarity. ISPRS Int. J. Geoinf. 2017, 6, 103. [Google Scholar] [CrossRef] [Green Version]
  84. Bandira, P.N.A.; Mahamud, M.A.; Samat, N.; Tan, M.L.; Chan, N.W. Gis-Based multi-criteria evaluation for potential inland aquaculture site selection in the George Town Conurbation, Malaysia. Land 2021, 10, 1174. [Google Scholar] [CrossRef]
  85. Alexander, E.R. Sensitivity analysis in complex decision models. J. Am. Plan. Assoc. 1989, 55, 323–333. [Google Scholar] [CrossRef]
  86. Guler, D.; Charisoulis, G.; Buttenfield, B.P.; Yomralioglu, T. Suitability modeling and sensitivity analysis for biomass energy facilities in Turkey. Clean Technol. Environ. Policy 2021, 23, 2183–2199. [Google Scholar] [CrossRef]
  87. Saaty, T.L. How to make a decision: The analytic hierarchy process. Eur. J. Oper. Res. 1990, 48, 9–26. [Google Scholar] [CrossRef]
  88. Brunelli, M. Introduction to the Analytic Hierarchy Process; SpringerBriefs: Berlin/Heidelberg, Germany, 2015; ISBN 9783319125015. [Google Scholar]
  89. Dolan, J.G. Shared decision-making—Transferring research into practice: The analytic hierarchy process (AHP). Patient Educ. Couns. 2008, 73, 418–425. [Google Scholar] [CrossRef] [PubMed] [Green Version]
  90. Chen, W.; Peng, J.; Hong, H.; Shahabi, H.; Pradhan, B.; Liu, J.; Zhu, A.X.; Pei, X.; Duan, Z. Landslide susceptibility modelling using GIS-based machine learning techniques for Chongren County, Jiangxi Province, China. Sci. Total Environ. 2018, 626, 1121–1135. [Google Scholar] [CrossRef]
  91. Duarte, Y.C.N.; Sentelhas, P.C. NASA/POWER and dailygridded weather datasets—How good they are for estimating maize yields in Brazil? Int. J. Biometeorol. 2020, 64, 319–329. [Google Scholar] [CrossRef] [PubMed]
  92. Maldonado, W.; Valeriano, T.T.B.; de Souza Rolim, G. EVAPO: A smartphone application to estimate potential evapotranspiration using cloud gridded meteorological data from NASA-POWER system. Comput. Electron. Agric. 2019, 156, 187–192. [Google Scholar] [CrossRef]
  93. White, J.W.; Hoogenboom, G.; Stackhouse, P.W.; Hoell, J.M. Evaluation of NASA satellite- and assimilation model-derived long-term daily temperature data over the continental US. Agric. For. Meteorol. 2008, 148, 1574–1584. [Google Scholar] [CrossRef] [Green Version]
  94. Al-Kilani, M.R.; Rahbeh, M.; Al-Bakri, J.; Tadesse, T.; Knutson, C. Evaluation of remotely sensed precipitation estimates from the NASA POWER project for drought detection over Jordan. Earth Syst. Environ. 2021, 5, 561–573. [Google Scholar] [CrossRef]
  95. Marzouk, O.A. Assessment of global warming in Al Buraimi, Sultanate of Oman Based on statistical analysis of NASA POWER data over 39 years, and testing the reliability of NASA POWER against meteorological measurements. Heliyon 2021, 7, e06625. [Google Scholar] [CrossRef]
  96. Kapica, J.; Canales, F.A.; Jurasz, J. Global atlas of solar and wind resources temporal complementarity. Energy Convers. Manag. 2021, 246, 114692. [Google Scholar] [CrossRef]
  97. Negm, A.; Jabro, J.; Provenzano, G. Assessing the suitability of american national aeronautics and space administration (NASA) agro-climatology archive to predict daily meteorological variables and reference evapotranspiration in Sicily, Italy. Agric. For. Meteorol. 2017, 244–245, 111–121. [Google Scholar] [CrossRef]
  98. DeGolia, A.H.; Hiroyasu, E.H.T.; Anderson, S.E. Economic Losses or Environmental Gains? Framing effects on public support for environmental management. PLoS One 2019, 14, e0220320. [Google Scholar] [CrossRef] [PubMed] [Green Version]
  99. Samat, N.; Mahamud, M.A.; Tan, M.L.; Tilaki, M.J.M.; Tew, Y.L. Modelling Land Cover Changes in Peri-Urban Areas: A case study of George Town Conurbation, Malaysia. Land 2020, 9, 373. [Google Scholar] [CrossRef]
  100. Penang Institute. Penang Economic and Development Report. 2020. Available online: https://penanginstitute.org/wp-content/uploads/2021/03/Penang-Economic-and-Development-Report-2019-2020.pdf (accessed on 31 August 2022).
  101. Mosley, F.; Hassegawa, M.; Verkerk, P.J. Forest-Based Bioeconomy and Climate Change Mitigation. Available online: https://efi.int/sites/default/files/files/publication-bank/projects/Bio-economy%202.0_final_report.pdf (accessed on 14 September 2022).
  102. Um, D.B. Exploring the operational potential of the forest—Photovoltaic utilizing the simulated solar tree. Sci. Rep. 2022, 12, 12838. [Google Scholar] [CrossRef] [PubMed]
  103. Yousuf, M.U.; Shere, S.M. A novel computational methodology to estimate solar energy on building rooftops. Environ. Prog. Sustain. Energy 2020, 39, e13385. [Google Scholar] [CrossRef]
  104. Suparwoko; Qamar, F.A. Techno-economic analysis of rooftop solar power plant implementation and policy on mosques: An Indonesian case study. Sci. Rep. 2022, 12, 4823. [Google Scholar] [CrossRef] [PubMed]
  105. Shukla, A.K.; Sudhakar, K.; Baredar, P. Simulation and Performance Analysis of 110 KWp grid-connected photovoltaic system for residential building in India: A comparative analysis of various PV technology. Energy Rep. 2016, 2, 82–88. [Google Scholar] [CrossRef] [Green Version]
  106. USM and Ditrolic Energy Sign PPA. USM Turns to Solar-Powered Electricity for Campus Use. Available online: https://news.usm.my/index.php/english-news/7371-usm-ditrolic-energy-sign-ppa-usm-turns-to-solar-powered-electricity-for-campus-use (accessed on 20 September 2022).
  107. Owley, J.; Wilson Morris, A. The new agriculture: From food farms to solar farms. Columbia J. Environ. Law 2019, 44, 409–477. [Google Scholar]
  108. Lane, A.L.; Boork, M.; Thollander, P. Barriers, driving forces and non-energy benefits for battery storage in photovoltaic (PV) systems in modern agriculture. Energies 2019, 12, 3568. [Google Scholar] [CrossRef] [Green Version]
  109. Eltayeb Elhadary, Y.A.; Samat, N.; Obeng-Odoom, F. Development at the Peri-Urban Area and its impact on agricultural activities: An example from the Seberang Perai Region, Penang State, Malaysia. Agroecol. Sustain. Food Syst. 2013, 37, 834–856. [Google Scholar] [CrossRef]
  110. Turney, D.; Fthenakis, V. Environmental impacts from the installation and operation of large-scale solar power plants. Renew. Sustain. Energy Rev. 2011, 15, 3261–3270. [Google Scholar] [CrossRef]
  111. Farja, Y.; Maciejczak, M. Economic implications of agricultural land conversion to solar power production. Energies 2021, 14, 6063. [Google Scholar] [CrossRef]
  112. Sah, S.S.; Maulud, K.N.A.; Sharil, S.; Karim, O.A.; Nahar, N.F.A. Impact of saltwater intrusion on paddy growth in Kuala Kedah, Malaysia. J. Sustain. Sci. Manag. 2021, 16, 15–30. [Google Scholar] [CrossRef]
  113. De Luna, A.D.; Pascual, C.E.B.; Principe, J.A.; Ang, M.R.C.O. Cost-benefit analysis of converting agricultural land into solar farm using Rs & Gis: Case of Tarlac Province. Int. Arch. Photogramm. Remote Sens. Spat. Inf. Sci. ISPRS Arch. 2021, 46, 133–140. [Google Scholar] [CrossRef]
  114. Vyas, K. Solar farming with agricultural land. Acta Sci. Agric. 2019, 3, 23–25. [Google Scholar] [CrossRef]
  115. Othman, N.F.; Mat Su, A.S.; Ya’Acob, M.E. Promising potentials of agrivoltaic systems for the development of Malaysia green economy. IOP Conf. Ser. Earth Environ. Sci. 2018, 146, 012002. [Google Scholar] [CrossRef]
Figure 1. Methodological framework used in the identification of the suitable locations for solar farms.
Atmosphere 13 02105 g001
Figure 2. The location of the George Town Conurbation region.
Atmosphere 13 02105 g002
Figure 3. Existing solar farm used for the validation.
Atmosphere 13 02105 g003
Figure 4. Suitability scoring for each criterion used in this study. (a) rainfall suitability, (b) road suitability, (c) distance to the urban area suitability, (d) distance to the power lines suitability, (e) relative humidity suitability, (f) mean wind speed suitability, (g) cloud cover suitability, (h) GHI suitability, (i) temperature suitability, (j) sunshine hours suitability, (k) slope suitability, (l) elevation suitability, (m) land use suitability.
Atmosphere 13 02105 g004
Figure 5. (a) The initial suitability map, (b) the restriction map.
Atmosphere 13 02105 g005
Figure 6. (a) The suitability map generated using the NASA POWER data, (b) the suitability map generated using ground-measured data, (c) the percentage of the suitability rating for the NASA POWER data map, (d) the percentage of the suitability rating for the ground-measured data map.
Atmosphere 13 02105 g006
Figure 7. Model validation (a) NASA POWER data map validation, (b) ground-measured data map validation.
Atmosphere 13 02105 g007
Figure 8. AUC graph (a) NASA POWER data, (b) ground-measured data.
Atmosphere 13 02105 g008
Figure 9. (a) The suitability maps for the different scenarios, (b) the coverage of the suitability classes for the different scenarios.
Atmosphere 13 02105 g009
Figure 10. (a) Highly suitable sites with a size greater than 125 Ha, (b) suitable parcel 1, built-up area, (c) suitable parcel 2, built-up area, (d) suitable parcel 3, agricultural land, (e) suitable parcel 4, agricultural land.
Atmosphere 13 02105 g010
Figure 11. (a) The highly suitable site with a size greater than 125 Ha, (b) the highly suitable site located in the USM, (c) rooftop solar panels installed in the USM, (d) solar carports installed in the USM.
Atmosphere 13 02105 g011
Table 1. Summary of the existing literature.
ClimateCountryMethodRenewable EnergySources
TropicalMalaysiaGIS-MCDM(AHP)Solar Energy[18,19]
Indonesia[20]
Mauritius [16]
Brazil[21]
Papua New GuineaSolar Energy and Biomass[22]
ThailandSolar and Wind Energy[5,23]
VietnamGIS-FAHPSolar Energy[17]
ChinaWind and Wave Energy[24]
AridIraqGIS-MCDM(AHP)Solar Energy[25,26]
Turkey[27,28]
Kuwait[29]
Saudi ArabiaSolar Energy[30]
Wind Energy[31]
IranSolar Energy[32,33]
GIS Fuzzy-
Boolean
Solar Energy[34]
GIS Fuzzy-WLC[35]
SpainELECTRE-TRI[36]
TemperateKoreaGIS-MCDM(AHP)Solar Energy[37]
Northern Ireland[38]
Estonia, Lithuania, LatviaWind Energy[39]
Japan[40]
ContinentalTurkeyGIS-MCDM(AHP)
Solar Energy [41]
Azerbaijan[42]
Serbia[43]
ChinaWind Energy[44]
PakistanGIS-FAHP [45]
AHP = Analytical Hierarchy Process.
Table 2. The climate information of the study area, based on the ground measured data, Bayan Lepas Meteorological Station (monthly average of the period 1990–2020).
MonthsSolar Radiation
(MJ/m2/Day)
Rainfall
(mm/Day)
Min Temp
(°C)
Max Temp
(°C)
Mean Temp
(°C)
Mean Wind Speed
(m/s)
Relative
Humidity
(%)
January 17.251.7424.1531.9227.542.3273.91
February 18.232.6224.3432.4427.902.0976.12
March 19.884.2524.5932.5628.131.8079.54
April 18.056.2824.8532.2728.191.5882.69
May 15.446.8024.9332.0328.131.4783.32
June 15.074.9924.7631.9827.981.4882.66
July 15.735.7324.3731.5627.601.6182.88
August 15.317.4724.2431.3827.411.5183.83
September 14.9610.7224.0431.0427.061.4584.83
October 14.6310.7924.0030.9526.931.4785.43
November 15.376.7124.0531.0626.981.7283.63
December 16.102.9024.2031.2727.222.3977.34
Annual 16.335.9324.3831.8727.591.7481.36
Table 3. Geospatial data sources and their description.
Data SourcesFormat/Resolution Details
Land use PLANMalaysia Shapefile/30 m × 30 m Land use of the George Town Conurbation for the year 2018
Major road or highway Google Earth Pro Shapefile/30 m × 30 m Digitized from Google Earth Pro year 2018
Major cities or towns PLANMalaysia Shapefile/30 m × 30 m Major cities or towns in the George Town Conurbation year 2018
Digital Elevation
Model (DEM)
USGS Raster/30 m × 30 m Elevation information of George Town Conurbation year 2018
Slope USGS Raster/30 m × 30 m Calculated from DEM
Table 4. The selected criteria and their suitability rating.
CriteriaSub-
Criteria
SourceHighly
Suitable
SuitableModerately SuitableMarginally SuitableExcluded
ClimateGHI (kWh/m2/day)NASA Power>5.04.5–5.04.0–4.53.5–4.0<3.5
Temperature
(°C)
NASA Power24.0–25.025.1–26.026.1–27.027.1–28.0>28.1
Relative
Humidity
(%)
NASA Power75–7677–7878–7979–80>80
Cloud Amount
(%)
NASA Power70–7273–7575–7678–80>80
Rainfall
(mm/day)
NASA Power 3.1–4.04.1–5.05.1–6.06.1–7.0>7.0
Wind Speed
(m/s)
NASA Power2.5–3.02.0–2.41.5–1.91.0–1.4<1.0 and >3.0
Sunshine Hours
(Hours)
NASA Power>11.19.0–11.08.0–8.97.0–7.9<7.0
Orography Elevation
(m)
USGS 801–1000601–800401–600201–400<200 and >1000
Slope
(%)
USGS9.1–10.07.1–9.05.1–7.02.1–5.0<2.0 and >10
EconomicalDistance to Urban (km)Google Earth Pro5–1010.1–1515.1–2020.1–25>25
Distance to Road (km)Google Earth Pro5–1010.1–1515.1–2020.1–25>25
Distance to Power Line (km)Google Earth Pro5–1010.1–1515.1–2020.1–25>25
EnvironmentalLand UsePLAN Malaysia and NCIAVacant Land,
Built-up Area
Agriculture --Forest, Water Bodies
Table 5. The relative importance of the two criteria.
Numerical RatingRelative Importance ScaleReciprocal
1Equally Importance1
2Equally to moderately importance1/2
3Moderately importance1/3
4Moderately to strongly importance1/4
5Strongly Importance1/5
6Strongly to very strongly importance1/6
7Very strong importance1/7
8Very strong to extremely importance1/8
9Extreme importance1/9
Table 6. The weights of the criteria for each scenario. The CR is consistently under 0.2. DM = Decision-maker.
CriteriaDM1DM2DM3Average Rank
Social Impact Scenario
Climate0.200.200.150.203
Orography0.100.100.050.104
Economic0.400.500.450.401
Land use0.400.200.350.302
Sum1.01.01.01.0
CR0.050.090.150.09
Economic Scenario
Climate0.270.530.330.391
Orography0.350.200.410.322
Economic0.190.110.140.153
Land use0.190.150.120.144
Sum1.01.01.01.0
CR0.110.140.090.07
Environmentalist Scenario
Climate0.310.150.310.232
Orography0.090.050.060.074
Economic0.170.100.230.163
Land use0.430.700.400.541
Sum1.01.01.01.0
CR0.090.110.130.08
Table 7. Statistical index of the NASA POWER data validation.
Parameters/
Statistical Index
Average valueR2RMSENRMSEMBENMBE
NASAGround Data
Max Temperature29.131.60.572.770.087−2.55−8.09
Min Temperature27.124.60.452.770.1122.5310.27
Mean Temperature28.127.70.580.940.0340.381.36
RH78.880.10.245.880.073−1.29−1.61
Solar5.054.900.553.050.7821.927.21
Wind Speed Mean3.11.90.121.650.8891.2265.73
Rainfall6.13.20.2716.835.1912.8989.42
Table 8. Pairwise comparison matrix.
CriteriaGHITemperatureRelative HumidityCloud AmountRainfallWind SpeedSunshine HoursWeight
Climate
Global Horizontal Irradiation1 0.30
Temperature0.251 0.15
Relative Humidity0.2551 0.20
Cloud Amount0.250.50.331 0.05
Rainfall0.2530.2521 0.15
Wind Speed0.252120.331 0.10
Sunshine Hours0.2540.20.332210.05
Consistency Ratio 0.1202
OrographyElevationSlope Weight
Elevation1 0.80
Slope0.251 0.20
Consistency Ratio0.0000
EconomicDistance to Urban AreaDistance to RoadDistance to Power Grid Weight
Distance to Urban Area1 0.2
Distance to Road41 0.6
Distance to Power Grid30.331 0.2
Consistency Ratio0.0872
OverallClimateOrographyEconomicalLand Use Weight
Climate1 0.40
Orography0.501 0.15
Economic0.500.51 0.25
Land Use0.25221 0.20
Consistency Ratio 0.0745
Publisher’s Note: MDPI stays neutral with regard to jurisdictional claims in published maps and institutional affiliations.

