
Analysis of Changes in Vegetation Index during the Rapid Urban Spatial Development Period (1990–2020) in Tehran Metropolis, Iran

 , , , and
Abstract
:1. Introduction
1.1. Background
1.2. Urban Development and Green Spaces
1.3. Remote Sensing of Vegetation Cover
1.4. Current Study
2. Methodology
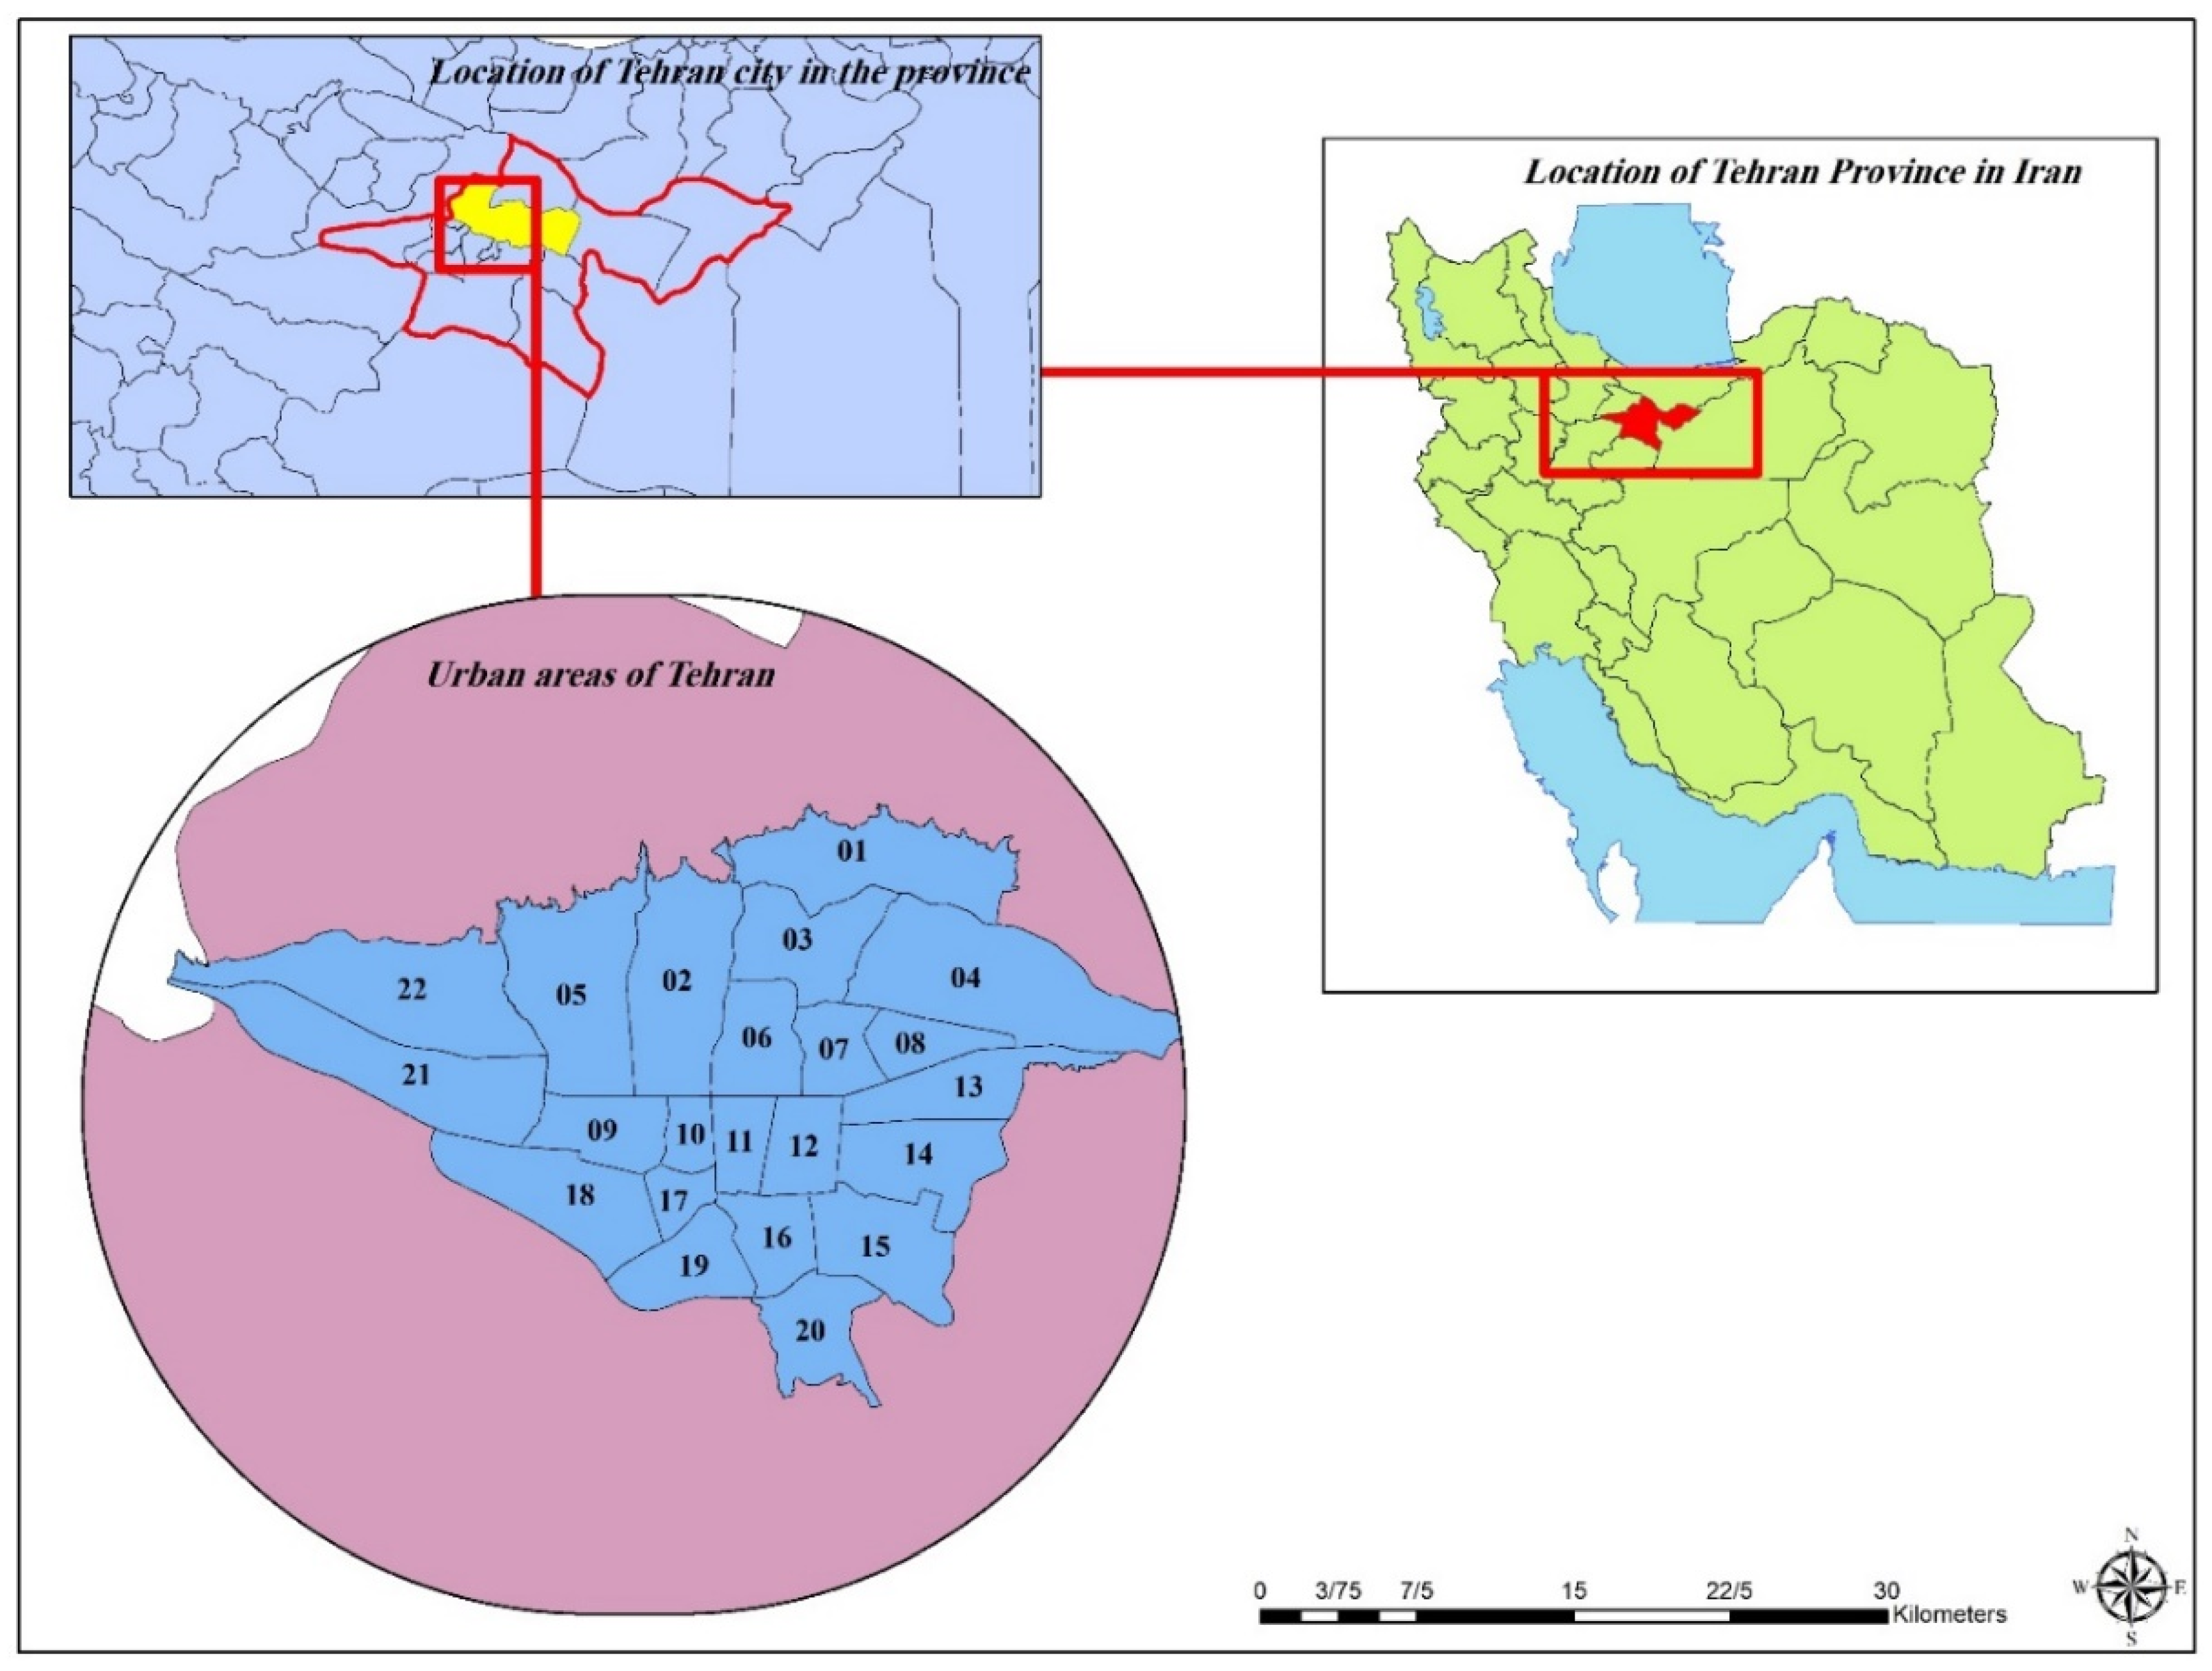
2.1. Study Area
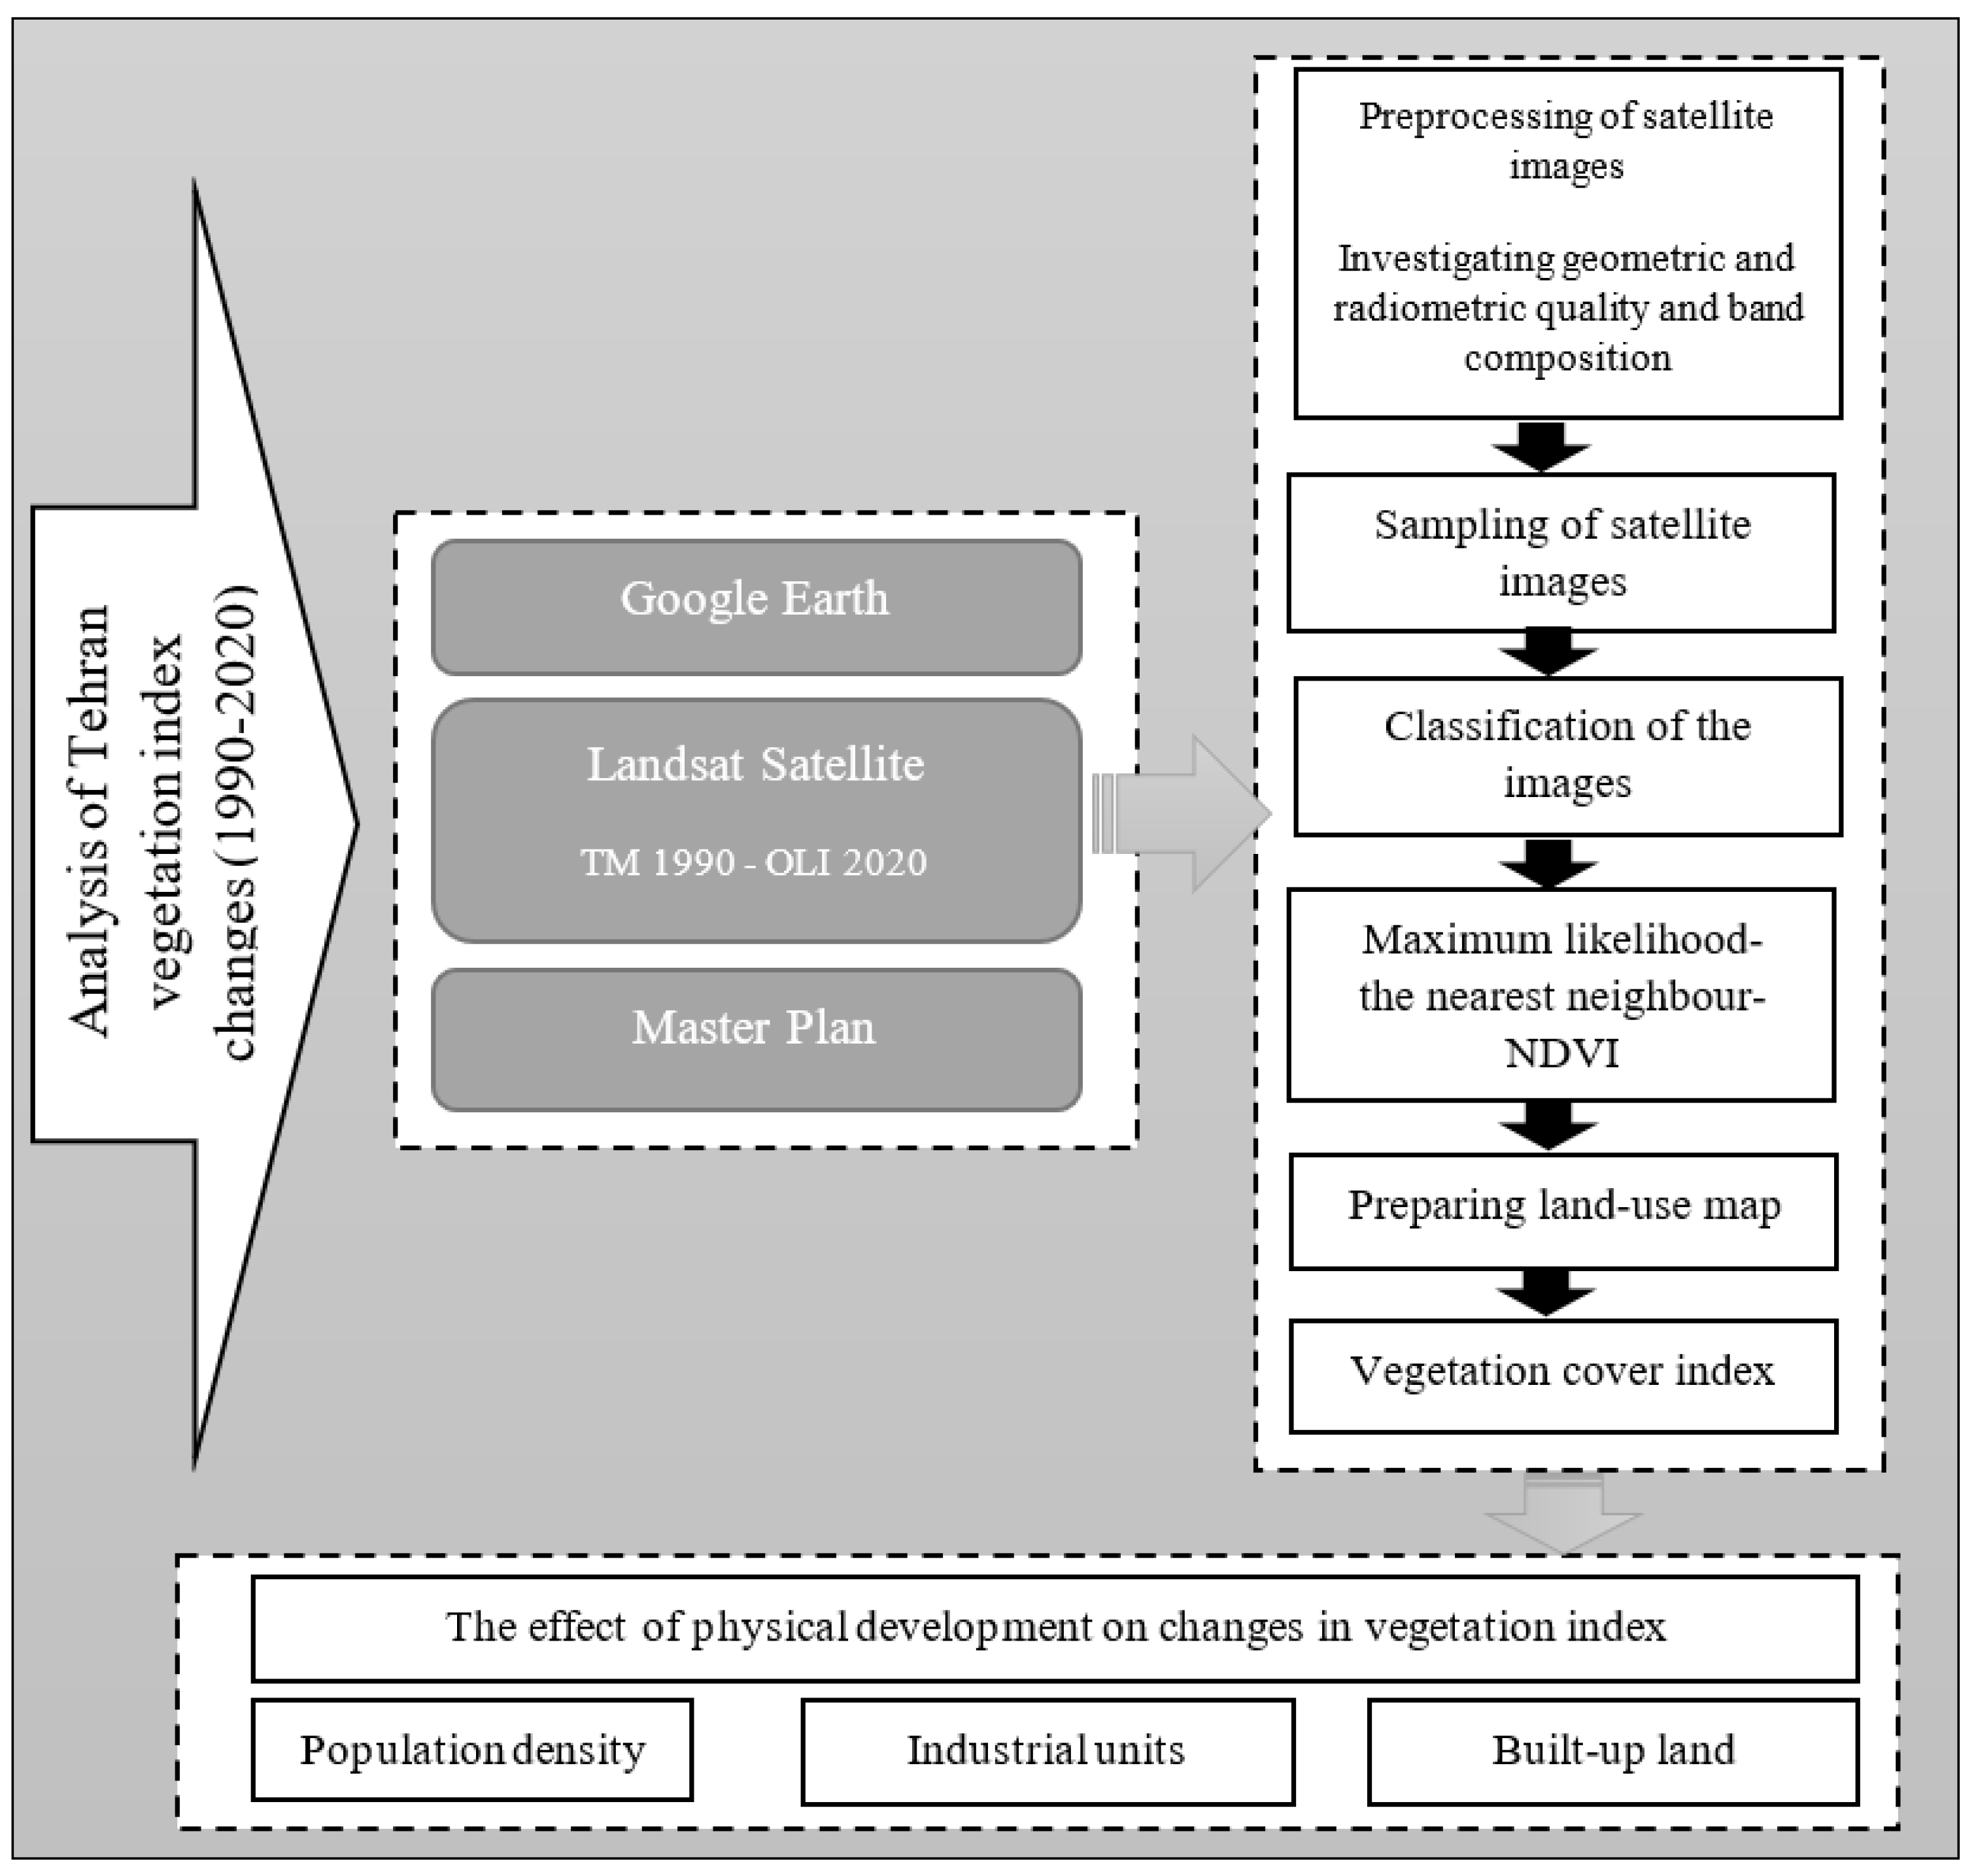
2.2. Research Methods
- Stage 1
- Stage 2
- Stage 3
3. Results
3.1. The Trend of Vegetation Index Changes in Tehran Metropolis (1990–2020)
3.2. Factors Influencing the Reduction of Vegetation Cover in Tehran Metropolis, 1990–2020
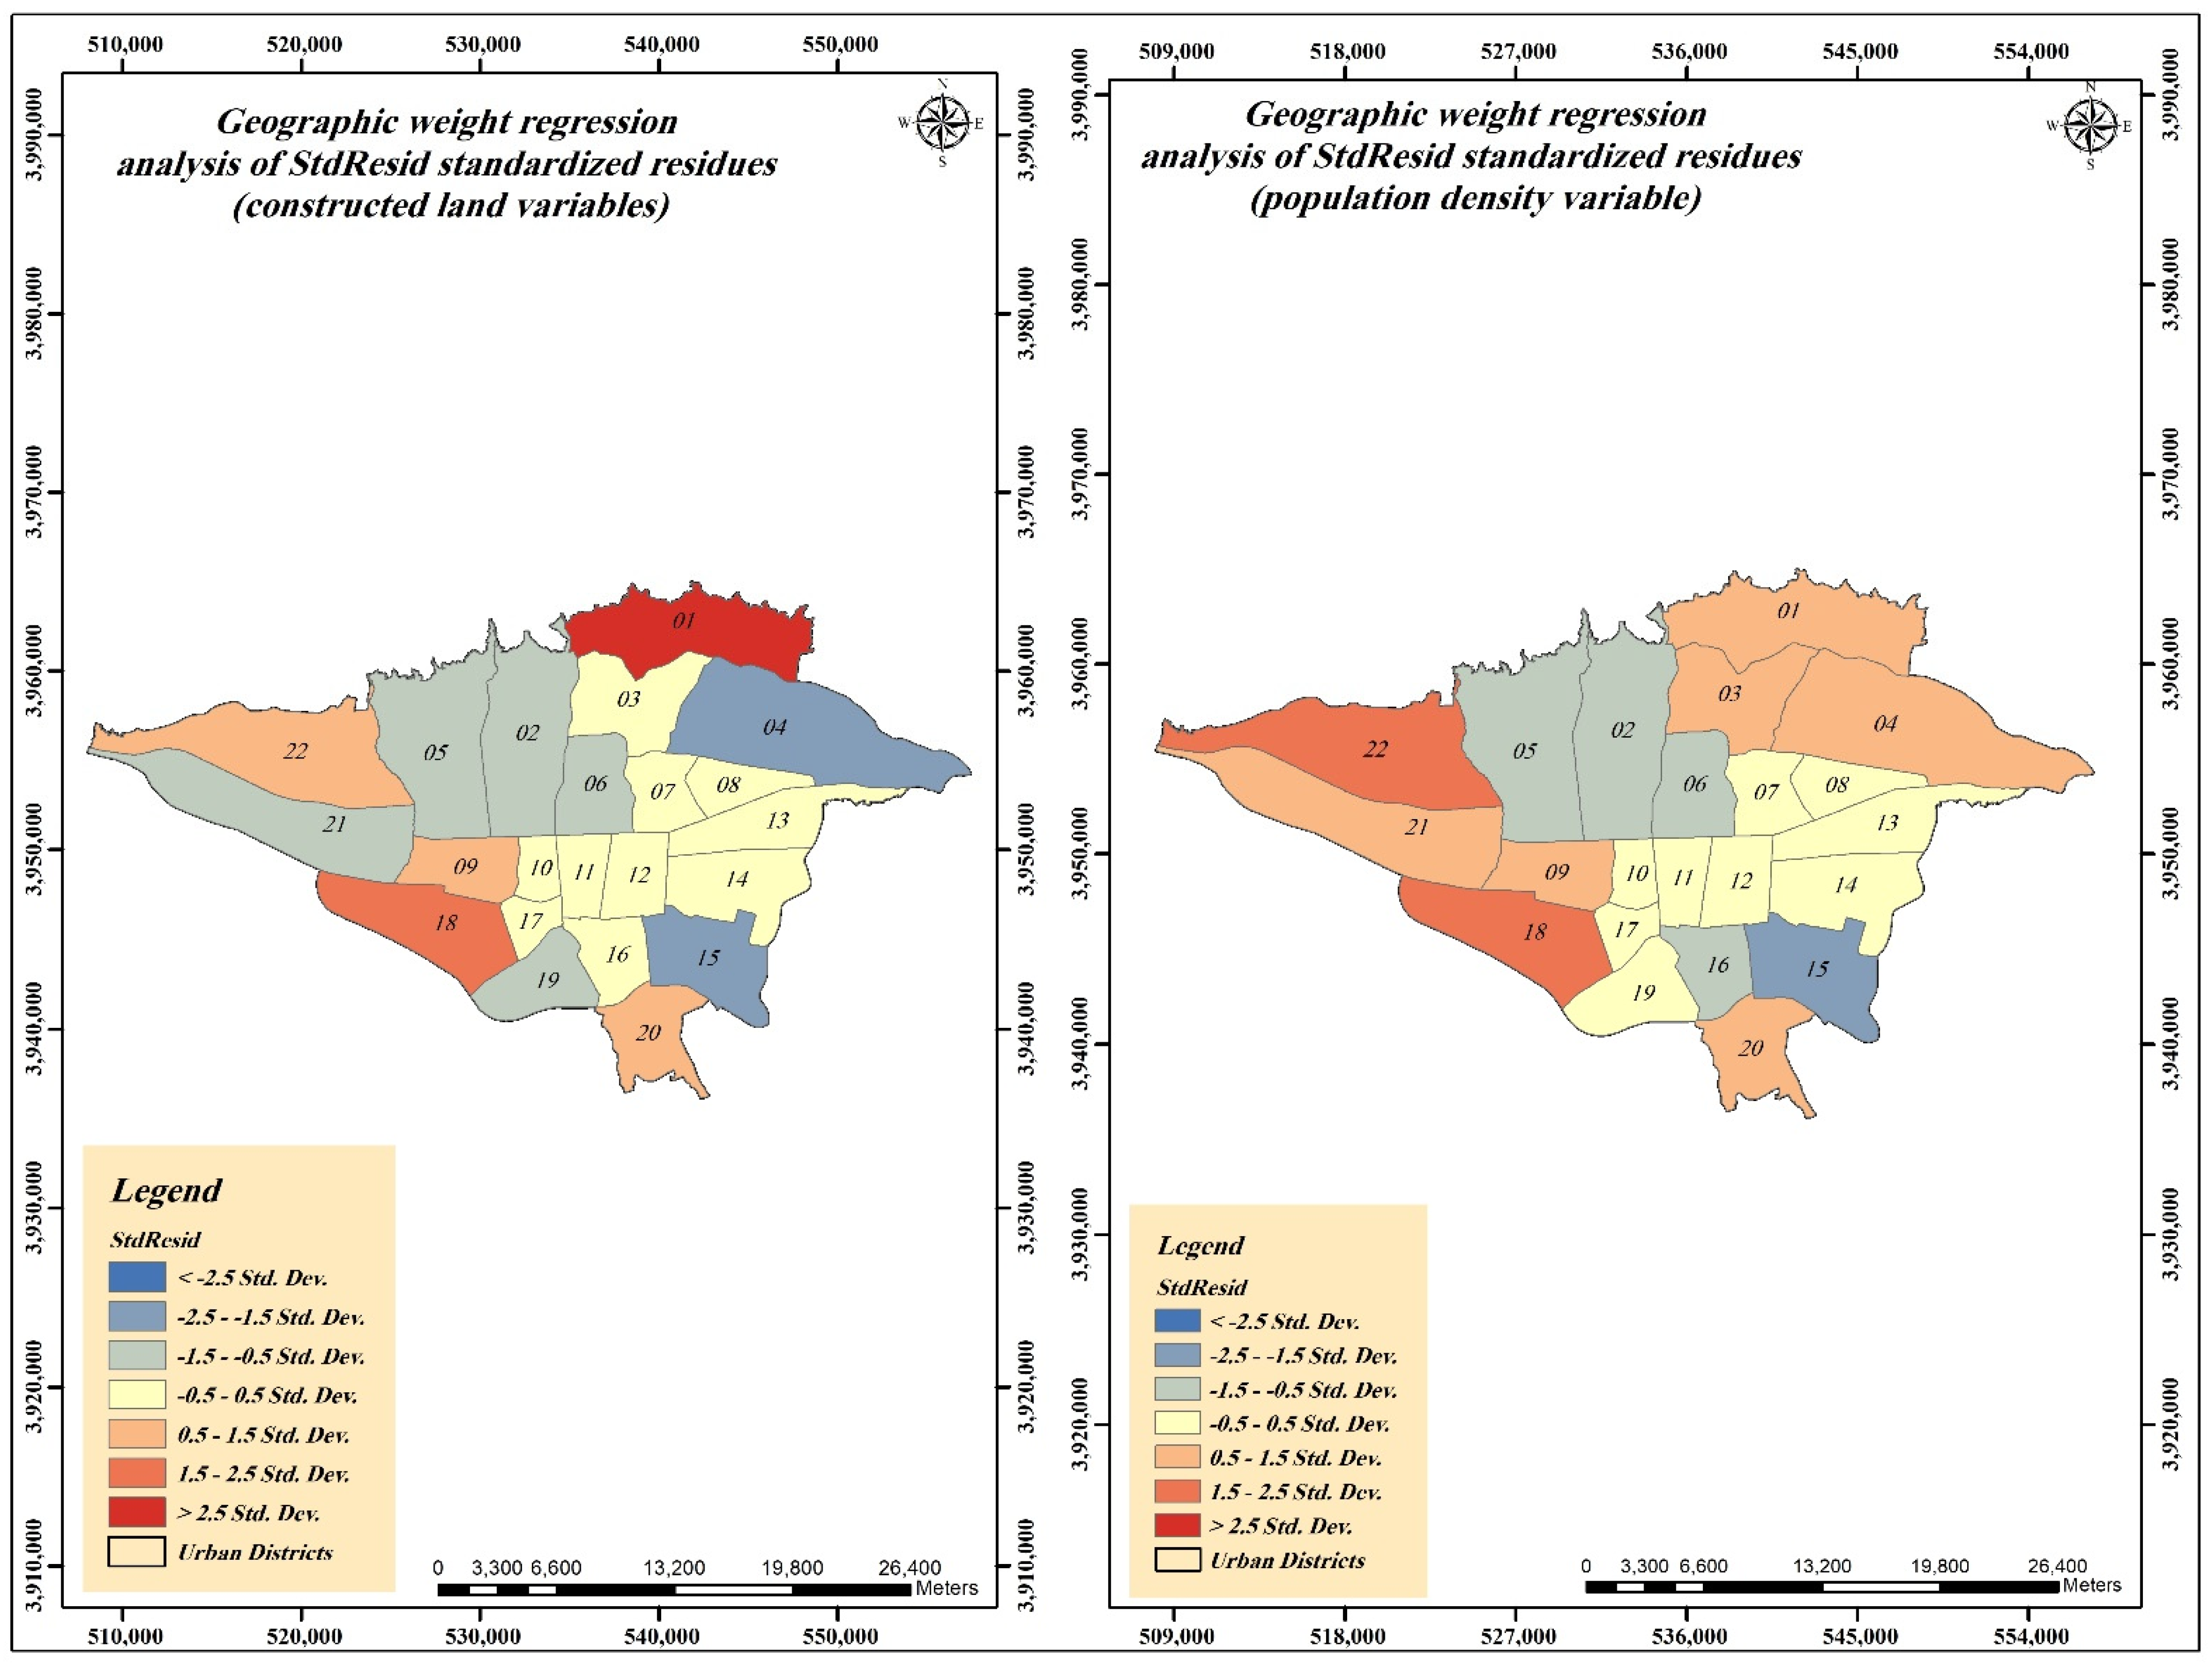
3.3. Analysing the Effects of Constructed Lands, Population Density and Industrial Units on Vegetation Cover
4. Discussion
5. Conclusions
Author Contributions
Funding
Institutional Review Board Statement
Informed Consent Statement
Data Availability Statement
Conflicts of Interest
References
- Tian, Y.; Jim, C.; Wang, H. Assessing the landscape and ecological quality of urban green spaces in a compact city. Landsc. Urban Plan. 2014, 121, 97–108. [Google Scholar] [CrossRef]
- Xu, X.; Duan, X.; Sun, H.; Sun, Q. Green space changes and planning in the capital region of China. Environ. Manag. 2011, 47, 456–467. [Google Scholar] [CrossRef] [PubMed]
- Gupta, K.; Kumar, P.; Pathan, S.K.; Sharma, K.P. Urban Neighborhood Green Index—A measure of green spaces in urban areas. Landsc. Urban Plan. 2012, 105, 325–335. [Google Scholar] [CrossRef]
- Nesbitt, L.; Hotte, N.; Barron, S.; Cowan, J.; Sheppard, S.R. The social and economic value of cultural ecosystem services provided by urban forests in North America: A review and suggestions for future research. Urban For. Urban Green. 2017, 25, 103–111. [Google Scholar] [CrossRef]
- Bondarenko, N.; Lyubimova, T.; Reshetnikova, Y. Application of the vegetation index to urban planning. E3S Web Conf. 2021, 6, 02021. [Google Scholar] [CrossRef]
- Smithers, R.J.; Doick, K.J.; Burton, A.; Sibille, R.; Steinbach, D.; Harris, R.; Groves, L.; Blicharska, M. Comparing the relative abilities of tree species to cool the urban environment. Urban Ecosyst. 2018, 21, 851–862. [Google Scholar] [CrossRef]
- Ecosystems, U.; Zafiriadis, K. The impact of park trees on microclimate in urban areas. Urban Ecosyst. 2006, 9, 195–209. [Google Scholar]
- Weber, N.; Haase, D.; Franck, U. Zooming into temperature conditions in the city of Leipzig: How do urban built and green structures influence earth surface temperatures in the city? Sci. Total Environ. 2014, 496, 289–298. [Google Scholar] [CrossRef]
- Nowak, D.J.; Hirabayashi, S.; Doyle, M.; McGovern, M.; Pasher, J. Air pollution removal by urban forests in Canada and its effect on air quality and human health. Urban For. Urban Green. 2018, 29, 40–48. [Google Scholar] [CrossRef]
- Baró, F.; Chaparro, L.; Gómez-Baggethun, E.; Langemeyer, J.; Nowak, D.J.; Terradas, J. Contribution of ecosystem services to air quality and climate change mitigation policies: The case of urban forests in Barcelona, Spain. Ambio 2014, 43, 466–479. [Google Scholar] [CrossRef] [Green Version]
- Wu, S.; Liang, Z.; Li, S. Relationships between urban development level and urban vegetation states: A global perspective. Urban For. Urban Green. 2019, 38, 215–222. [Google Scholar] [CrossRef]
- Thaiutsa, B.; Puangchit, L.; Kjelgren, R.; Arunpraparut, W. Urban green space, street tree and heritage large tree assessment in Bangkok, Thailand. Urban For. Urban Green. 2008, 7, 219–229. [Google Scholar] [CrossRef]
- Kabisch, N.; Qureshi, S.; Haase, D. Human–environment interactions in urban green spaces—A systematic review of contemporary issues and prospects for future research. Environ. Impact Assess. Rev. 2015, 50, 25–34. [Google Scholar] [CrossRef]
- Cheng, J.; Masser, I. Urban growth pattern modeling: A case study of Wuhan city, PR China. Landsc. Urban Plan. 2003, 62, 199–217. [Google Scholar] [CrossRef]
- Kim, K.-H.; Pauleit, S. Landscape character, biodiversity and land use planning: The case of Kwangju City Region, South Korea. Land Use Policy 2007, 24, 264–274. [Google Scholar] [CrossRef]
- Briber, B.M.; Hutyra, L.R.; Reinmann, A.B.; Raciti, S.M.; Dearborn, V.K.; Holden, C.E.; Dunn, A.L. Tree productivity enhanced with conversion from forest to urban land covers. PLoS ONE 2015, 10, e0136237. [Google Scholar] [CrossRef]
- Ziska, L.H.; Bunce, J.A.; Goins, E.W. Characterization of an urban-rural CO2/temperature gradient and associated changes in initial plant productivity during secondary succession. Oecologia 2004, 139, 454–458. [Google Scholar] [CrossRef]
- Gregg, J.W.; Jones, C.G.; Dawson, T.E. Urbanization effects on tree growth in the vicinity of New York City. Nature 2003, 424, 183–187. [Google Scholar] [CrossRef]
- He, Y.; Xie, H. Exploring the spatiotemporal changes of ecological carrying capacity for regional sustainable development based on GIS: A case study of Nanchang City. Technol. Forecast. Soc. Chang. 2019, 148, 119720. [Google Scholar] [CrossRef]
- Li, T.; Jiang, H.; Jing, P.; Yu, Y.; Zhang, M.; Sang, H. Mengmeng and Sang, Huiyun, A Data-Driven Study on the Impact of Land Use on Traffic Congestion Based on GWR Model. In Proceedings of the 20th COTA International Conference of Transportation Professionals, Xi’an, China, 14–16 August 2020; pp. 3051–3060. [Google Scholar]
- Nguyen, T.T.; Barber, P.; Harper, R.; Linh, T.V.; Dell, B. Vegetation trends associated with urban development: The role of golf courses. PLoS ONE 2020, 15, e0228090. [Google Scholar] [CrossRef] [Green Version]
- Meadows, D.H.; Dennis, L.; Randers, J.; Behrens, W.W. The Limits to Growth: A Report for the Club of Rome’s Project on the Predicament of Mankind. J. Politics 1973, 35, 2. [Google Scholar]
- Quigley, M.F. Franklin Park: 150 years of changing design, disturbance, and impact on tree growth. Urban Ecosyst. 2002, 6, 223–235. [Google Scholar] [CrossRef]
- Meng, X.; Gao, X.; Li, S.; Lei, J. Spatial and temporal characteristics of vegetation NDVI changes and the driving forces in Mongolia during 1982–2015. Remote Sens. 2020, 12, 603. [Google Scholar] [CrossRef] [Green Version]
- Syphard, A.D.; Clarke, K.C.; Franklin, J.; Regan, H.M.; Mcginnis, M. Forecasts of habitat loss and fragmentation due to urban growth are sensitive to source of input data. J. Environ. Manag. 2011, 92, 1882–1893. [Google Scholar] [CrossRef]
- Dutta, D.; Rahman, A.; Paul, S.K.; Kundu, A. Spatial and temporal trends of urban green spaces: An assessment using hyper-temporal NDVI datasets. Geocarto Int. 2021, 1–21. [Google Scholar] [CrossRef]
- Shao, Z.; Sumari, N.S.; Portnov, A.; Ujoh, F.; Musakwa, W.; Mandela, P.J. Urban sprawl and its impact on sustainable urban development: A combination of remote sensing and social media data. Geo-Spat. Inf. Sci. 2021, 24, 241–255. [Google Scholar] [CrossRef]
- Deyong, Y.; Hongbo, S.; Peijun, S.; Wenquan, Z.; Yaozhong, P. How does the conversion of land cover to urban use affect net primary productivity? A case study in Shenzhen city, China. Agric. For. Meteorol. 2009, 149, 2054–2060. [Google Scholar] [CrossRef]
- Bruckner, M.; Fischer, G.; Tramberend, S.; Giljum, S. Measuring telecouplings in the global land system: A review and comparative evaluation of land footprint accounting methods. Ecol. Econ. 2015, 114, 11–21. [Google Scholar] [CrossRef] [Green Version]
- Amundsen, H.; Hovelsrud, G.K.; Aall, C.; Karlsson, M.; Westskog, H. Local governments as drivers for societal transformation: Towards the 1.5 C ambition. Curr. Opin. Environ. Sustain. 2018, 31, 23–29. [Google Scholar] [CrossRef]
- Savé, R.; de Herralde, F.; Aranda, X.; Biel, C. Potential effects of global change to urban vegetation: Vulnerability and adaptations. J. Life Sci. 2012, 6, 443–450. [Google Scholar] [CrossRef]
- Dizdaroglu, D.; Yigitcanlar, T.; Dawes, L. Sustainable urban futures: An ecological approach to sustainable urban development. In Conference Proceedings of the Second Infrastructure Theme Postgraduate Conference 2009: Rethinking Sustainable Development-Planning, Infrastructure Engineering, Design and Managing Urban Infrastructure; Queensland University of Technology: Brisbane City, QLD, Australia, 2009; pp. 187–195. [Google Scholar]
- Villa, P. Mapping urban growth using Soil and Vegetation Index and Landsat data: The Milan (Italy) city area case study. Landsc. Urban Plan. 2012, 107, 245–254. [Google Scholar] [CrossRef]
- Myeong, S.; Nowak, D.J.; Hopkins, P.F.; Brock, R.H. Urban cover mapping using digital, high-spatial resolution aerial imagery. Urban Ecosyst. 2001, 5, 243–256. [Google Scholar] [CrossRef]
- Himan, S.; Baharin, B.A.; Mohammad, H.M.; Mohsen, A.Z. Detection of urban irregular development and green space destruction using normalized difference vegetation index (NDVI), principal component analysis (PCA) and post classification methods: A case study of Saqqez city. Int. J. Phys. Sci. 2012, 7, 2587–2595. [Google Scholar]
- Coppin, P.; Jonckheere, I.; Nackaerts, K.; Muys, B.; Lambin, E. Review ArticleDigital change detection methods in ecosystem monitoring: A review. Int. J. Remote Sens. 2004, 25, 1565–1596. [Google Scholar] [CrossRef]
- Gao, L.; Wang, X.; Johnson, B.A.; Tian, Q.; Wang, Y.; Verrelst, J.; Mu, X.; Gu, X. Remote sensing algorithms for estimation of fractional vegetation cover using pure vegetation index values: A review. ISPRS J. Photogramm. Remote Sens. 2020, 159, 364–377. [Google Scholar] [CrossRef]
- Harris, A.; Carr, A.; Dash, J. Remote sensing of vegetation cover dynamics and resilience across southern Africa. Int. J. Appl. Earth Obs. Geoinf. 2014, 28, 131–139. [Google Scholar] [CrossRef]
- Stow, D.A.; Weeks, J.R.; Toure, S.; Coulter, L.L.; Lippitt, C.D.; Ashcroft, E. Urban vegetation cover and vegetation change in Accra, Ghana: Connection to housing quality. Prof. Geogr. 2013, 65, 451–465. [Google Scholar] [CrossRef] [Green Version]
- Huete, A.; Didan, K.; Miura, T.; Rodriguez, E.P.; Gao, X.; Ferreira, L.G. Overview of the radiometric and biophysical performance of the MODIS vegetation indices. Remote Sens. Environ. 2002, 83, 195–213. [Google Scholar] [CrossRef]
- Shi, K.; Yu, B.; Huang, Y.; Hu, Y.; Yin, B.; Chen, Z.; Chen, L.; Wu, J. Evaluating the ability of NPP-VIIRS nighttime light data to estimate the gross domestic product and the electric power consumption of China at multiple scales: A comparison with DMSP-OLS data. Remote Sens. 2014, 6, 1705–1724. [Google Scholar] [CrossRef] [Green Version]
- Binh, T.N.; Vromant, N.; Hung, N.T.; Hens, L.; Boon, E.K. Land cover changes between 1968 and 2003 in Cai Nuoc, Ca Mau peninsula, Vietnam. Environ. Dev. Sustain. 2005, 7, 519–536. [Google Scholar] [CrossRef]
- Cârlan, I.; Haase, D.; Große-Stoltenberg, A.; Sandric, I. Mapping heat and traffic stress of urban park vegetation based on satellite imagery-A comparison of Bucharest, Romania and Leipzig, Germany. Urban Ecosyst. 2020, 20, 363–377. [Google Scholar] [CrossRef]
- Karnieli, A.; Bayarjargal, Y.; Bayasgalan, M.; Mandakh, B.; Dugarjav, C.; Burgheimer, J.; Khudulmur, S.; Bazha, S.N.; Gunin, P.D. Do vegetation indices provide a reliable indication of vegetation degradation? A case study in the Mongolian pastures. Int. J. Remote Sens. 2013, 34, 6243–6262. [Google Scholar] [CrossRef]
- Rashed, T.; Jürgens, C. Remote Sensing of Urban and Suburban Areas; Springer Science & Business Media: Berlin, Germany, 2010. [Google Scholar]
- Alavipanah, S.K. Fundamentals of Modern Remote Sensing and Interpretation of Satellite Images and Aerial Photos; University of Tehran Press: Tehran, Iran, 2016. [Google Scholar]
- Fensholt, R.; Rasmussen, K.; Nielsen, T.T.; Mbow, C. Evaluation of earth observation based long term vegetation trends—Intercomparing NDVI time series trend analysis consistency of Sahel from AVHRR GIMMS, Terra MODIS and SPOT VGT data. Remote Sens. Environ. 2009, 113, 1886–1898. [Google Scholar] [CrossRef]
- Luo, N.; Mao, D.; Wen, B.; Liu, X. Climate change affected vegetation dynamics in the northern Xinjiang of China: Evaluation by SPEI and NDVI. Land 2020, 9, 90. [Google Scholar] [CrossRef] [Green Version]
- Bento, V.A.; Gouveia, C.M.; DaCamara, C.C.; Libonati, R.; Trigo, I.F. The roles of NDVI and Land Surface Temperature when using the Vegetation Health Index over dry regions. Glob. Planet. Chang. 2020, 190, 103198. [Google Scholar] [CrossRef]
- UN. World Urbanization Prospects The 2018 Revision; Department of Economic and Social Affairs Population Division, UN: San Francisco, CA, USA, 2019. [Google Scholar]
- Studies and Planning Center of Tehran Municipality. 2006. Available online: http://rpc.tehran.ir/en (accessed on 10 March 2022).
- Statistical Center of Iran. 2019. Available online: www.amar.org.ir (accessed on 5 March 2022).
- Statistical Center of Iran. 2016. Available online: www.amar.org.ir (accessed on 5 March 2022).
- Tehran Metropolis Atlas. 2006. Available online: http://atlas.tehran.ir (accessed on 15 March 2022).
- Chander, G.; Markham, B.L.; Helder, D.L. Summary of current radiometric calibration coefficients for Landsat MSS, TM, ETM+, and EO-1 ALI sensors. Remote Sens. Environ. 2009, 113, 893–903. [Google Scholar] [CrossRef]
- San, B.T.; Suzen, M.L. Evaluation of Different Atmospheric Correction Algorithms for EO-1 Hyperion Imagery. 2010. Available online: https://www.isprs.org/proceedings/xxxviii/part8/pdf/W03C05_20100306205904.pdf (accessed on 5 March 2022).
- Adamchuk, V.I.; Perk, R.L.; Schepers, J.S. EC03-702 Precision Agriculture: Applications of Remote Sensing in Site-Specific Management. 2003. Available online: https://digitalcommons.unl.edu/extensionhist/705/ (accessed on 5 March 2022).
- Mapping Organization of Iran. 2016. Available online: https://www.scirp.org/%28S%28vtj3fa45qm1ean45vvffcz55%29%29/reference/referencespapers.aspx?referenceid=2143674 (accessed on 5 March 2022).
- Zhang, J.; Goodchild, M.F. Uncertainty in Geographical Information; CRC Press: Boca Raton, FL, USA, 2002. [Google Scholar]
- Richards, D.R.; Passy, P.; Oh, R.R. Impacts of population density and wealth on the quantity and structure of urban green space in tropical Southeast Asia. Landsc. Urban Plan. 2017, 157, 553–560. [Google Scholar] [CrossRef]
- Wardlow, B.D.; Egbert, S.L.; Kastens, J.H. Analysis of time-series MODIS 250 m vegetation index data for crop classification in the US Central Great Plains. Remote Sens. Environ. 2007, 108, 290–310. [Google Scholar] [CrossRef] [Green Version]
- Gao, J.; Liu, Y. Mapping of land degradation from space: A comparative study of Landsat ETM+ and ASTER data. Int. J. Remote Sens. 2008, 29, 4029–4043. [Google Scholar] [CrossRef]
- Kogan, F.N. Application of vegetation index and brightness temperature for drougt detection. Adv. Space Res. 1995, 15, 91–100. [Google Scholar] [CrossRef]
- Pandey, A.; Sahu, A.K. Generation of Curve Number Using Remote Sensing and Geographic Information System. 2002. Available online: https://www.geospatialworld.net/article/generation-of-curve-number-using-remote-sensing-and-geographic-information-system/ (accessed on 5 March 2022).
- Jiménez-Muñoz, J.C.; Sobrino, J.A. A generalized single-channel method for retrieving land surface temperature from remote sensing data. J. Geophys. Res. Atmos. 2003, 108, 4688. [Google Scholar] [CrossRef] [Green Version]
- Aci, M.; Inan, C.; Avci, M. A hybrid classification method of k nearest neighbor, Bayesian methods and genetic algorithm. Expert Syst. Appl. 2010, 37, 5061–5067. [Google Scholar] [CrossRef]
- Fotheringham, A.S.; Brunsdon, C.; Charlton, M. Geographically Weighted Regression: The Analysis of Spatially Varying Relationships; John Wiley & Sons: Hoboken, NJ, USA, 2003. [Google Scholar]
- Tu, J.; Xia, Z.G. Examining spatially varying relationships between land use and water quality using geographically weighted regression I: Model design and evaluation. Sci. Total Environ. 2008, 407, 358–378. [Google Scholar] [CrossRef]
- Torun, A.Ö.; Göçer, K.; Yeşiltepe, D.; Argın, G. Understanding the role of urban form in explaining transportation and recreational walking among children in a logistic GWR model: A spatial analysis in Istanbul, Turkey. J. Transp. Geogr. 2020, 82, 102–617. [Google Scholar]
- Statistics Center of Iran. 2006–2018. Available online: https://ghdx.healthdata.org/organizations/statistical-centre-iran (accessed on 5 March 2022).
- Ghorbanian, A.; Mohammadzadeh, A.; Jamali, S. Linear and non-linear vegetation trend analysis throughout Iran using two decades of MODIS NDVI imagery. Remote Sens. 2022, 14, 3683. [Google Scholar] [CrossRef]
- Faramarzi, M.; Heidarizadi, Z.; Mohamadi, A.; Heydari, M. Detection of Vegetation Changes in Relation to Normalized Difference Vegetation Index (NDVI) in Semi-Arid Rangeland in Western Iran. 2018. Available online: https://jast.modares.ac.ir/article-23-10153-en.pdf (accessed on 5 March 2022).
- AAsadzadeh, A.; Kötter, T.; Fekete, A.; Moghadas, M.; Alizadeh, M.; Zebardast, E.; Weiss, D.; Basirat, M.; Hutter, G. Urbanization, migration, and the challenges of resilience thinking in urban planning: Insights from two contrasting planning systems in Germany and Iran. Cities 2022, 125, 103–642. [Google Scholar] [CrossRef]
- Dadashpoor, H.; Alidadi, M. Towards decentralization: Spatial changes of employment and population in Tehran Metropolitan Region, Iran. Appl. Geogr. 2017, 85, 51–61. [Google Scholar] [CrossRef]
- Asgharpour, S.E.; Zanjani, H.; Taleghani, G. Impact of Urbanization on Population Changes in Metropolitan Area of Tehran, Iran. In Proceedings of the 3rd International Geography Symposium-GEOMED Symposium Proceedings, Kemer-Antalya, Turkey, 10–13 June 2013. [Google Scholar]
- Huber, J. Towards industrial ecology: Sustainable development as a concept of ecological modernization. J. Environ. Policy Plan. 2000, 2, 269–285. [Google Scholar] [CrossRef] [Green Version]
- Viki, N.H.; Al-Harithy, H. Urbanization Through a Cultural Heritage Lens: The Case of Tehran (1785–2017). Herit. Soc. 2019, 12, 57–75. [Google Scholar] [CrossRef]
- Ziari, K.; Pourahmad, A.; Mehrabani, B.F.; Hosseini, A. Environmental sustainability in cities by biophilic city approach: A case study of Tehran. Int. J. Urban Sci. 2018, 22, 486–516. [Google Scholar] [CrossRef]
- Sharifi, A.; Hosseingholizadeh, M. sThe effect of rapid population growth on urban expansion and destruction of green space in Tehran from 1972 to 2017. J. Indian Soc. Remote Sens. 2019, 47, 1063–1071. [Google Scholar] [CrossRef]
- Heynen, N.; Kaika, M.; Swyngedouw, E. Urban political ecology: Politicizing the production of urban natures. In In the Nature of Cities; Routledge: London, UK, 2006; pp. 16–35. [Google Scholar]
- Scott, A.J.; Storper, M. The nature of cities: The scope and limits of urban theory. Int. J. Urban Reg. Res. 2015, 39, 1–15. [Google Scholar] [CrossRef] [Green Version]
- Fernández, I.; Pérez-Silva, R.; Villalobos-Araya, E. Vegetation cover within and around schools in Santiago de Chile: Are schools helping to mitigate urban vegetation inequalities? Urban For. Urban Green. 2022, 70, 127–520. [Google Scholar] [CrossRef]
- Sarcheshmeh, M.H.H.; Khakpoor, B.A.; Shokuhi, M.A.; Rahnama, M.R. Analysis of economic and social indicators in optimizing the performance of urban green space management (a study of Mashhad metropolis). Geo J. Tour. Geosites 2020, 32, 1370–1375. [Google Scholar] [CrossRef]


| No | Shooting Date | Satellite | Sensor | Bands Number | Format |
|---|---|---|---|---|---|
| 1 | 22 June 1990 | L5 | TM | 8 | TIFF |
| 2 | 14 May 2020 | L8 | OIL/TIRSS | 11 | TIFF |
| SI.No | Vegetation Classes | 1990 | 2020 | ||
|---|---|---|---|---|---|
| Percentage | Number of Cells | Percentage | Number of Cells | ||
| 1 | No vegetation cover | 1.77 | 12,437 | 28.22 | 13,364 |
| 2 | Very low to low vegetation cover | 4.57 | 31,778 | 36.95 | 33,624 |
| 3 | Low to medium vegetation cover | 9.84 | 68,413 | 17.70 | 65,640 |
| 4 | Medium to high vegetation cover | 21.18 | 147,916 | 9.61 | 147,916 |
| 5 | High to very high vegetation cover | 34.46 | 235,558 | 5.00 | 235,558 |
| 6 | Abundance of vegetation cover | 28.17 | 194,776 | 2.49 | 194,776 |
| Total | 100.00 | 690,878 | 100.00 | 690,878 | |
| Vegetation Classes | Area in 1990 (Hectares) | Area in 2020 (Hectares) | Area Changes (Hectares) |
|---|---|---|---|
| No vegetation cover | 1102.81 | 17,545.7 | 16,442.89 |
| Very low to low vegetation cover | 2841.73 | 22,971.45 | 20,129.72 |
| Low to medium vegetation cover | 6121.43 | 11,009.18 | 4887.75 |
| Medium to high vegetation cover | 13,167.79 | 5976.21 | −7191.58 |
| High to very high vegetation cover | 21,424.1 | 3113.26 | −183,108 |
| Abundance of vegetation cover | 17,511.98 | 1549.97 | −15,962 |
| Districts | Area in 1990 | Area in 2020 | Difference (Hectare) | Districts | Area in 1990 | Area in 2020 | Difference (Hectare) |
|---|---|---|---|---|---|---|---|
| 1 | 364.3 | 1206.5 | 842.2 | 12 | 1502.3 | 1437.26 | −65.04 |
| 2 | 1720.3 | 2698.4 | 978.1 | 13 | 1050.2 | 1137.14 | 86.94 |
| 3 | 925.3 | 1275.6 | 350.3 | 14 | 1474.6 | 1697.7 | 223.1 |
| 4 | 2498.5 | 3478.14 | 978.54 | 15 | 1903.4 | 2098.7 | 195.3 |
| 5 | 1389.15 | 3031.15 | 1642 | 16 | 1177.5 | 1222.2 | 44.7 |
| 6 | 1564.3 | 1561.8 | −2.5 | 17 | 713.3 | 710.43 | −2.87 |
| 7 | 1343.9 | 1267.6 | −76.3 | 18 | 1624.8 | 2524.4 | 899.6 |
| 8 | 1210.4 | 1127.5 | −82.9 | 19 | 654.8 | 1307.46 | 652.66 |
| 9 | 1518.5 | 1382.4 | −136.1 | 20 | 1019.3 | 1681.6 | 662.3 |
| 10 | 769.6 | 767.9 | −1.7 | 21 | 2258.19 | 3778.7 | 1520.61 |
| 11 | 1116.5 | 1081.61 | −34.89 | 22 | 309.2 | 2627.7 | 2318.5 |
| District | Population of 2018 | Population of 2006 | Districts’ Areas (Hectare) | District | Population of 2018 | Population of 2006 | Districts’ Areas (Hectare) |
|---|---|---|---|---|---|---|---|
| 1 | 522,526 | 249,676 | 4.36 | 12 | 24,143 | 189,625 | 197.59 |
| 2 | 721,964 | 458,089 | 41.36 | 13 | 244,516 | 245,142 | 132.88 |
| 3 | 327,275 | 259,019 | 128.84 | 14 | 507,783 | 394,611 | 62.32 |
| 4 | 946,728 | 663,166 | 39.11 | 15 | 670,574 | 622,517 | 46.17 |
| 5 | 884,278 | 427,955 | 81.93 | 16 | 260,178 | 298,410 | 189.91 |
| 6 | 259,868 | 220,331 | 135.19 | 17 | 289,334 | 287,367 | 327.62 |
| 7 | 312,996 | 300,212 | 169.16 | 18 | 431,276 | 296,243 | 233.02 |
| 8 | 445,554 | 336,474 | 507.13 | 19 | 262,316 | 227,389 | 453.74 |
| 9 | 180,818 | 173,482 | 260.29 | 20 | 378,741 | 356,079 | 143.74 |
| 10 | 336,962 | 282,308 | 302.84 | 21 | 196,998 | 188,890 | 139.31 |
| 11 | 316,492 | 225,840 | 19.99 | 22 | 19,897 | 56,020 | 89.4 |
| District | Population Density (Hectare) Year 2006 | Population Density (Hectare) Year 2018 | Population Density Difference | District | Population Density (Hectare) Year 2006 | Population Density (Hectare) Year 2018 | Population Density Difference |
|---|---|---|---|---|---|---|---|
| 1 | 57,265.1 | 119,845.6 | 62,580.5 | 12 | 959.7 | 122.1 | −837.6 |
| 2 | 11,075.6 | 17,455.6 | 6380 | 13 | 1844.8 | 1840.1 | −4.7 |
| 3 | 2010.4 | 2540.16 | 529.7 | 14 | 6332.01 | 8147.8 | 1815.8 |
| 4 | 16,956.4 | 24,206.8 | 7250.4 | 15 | 13,483.1 | 14,524.01 | 1040.9 |
| 5 | 5223.4 | 10,793.07 | 5569.6 | 16 | 1571.3 | 1370 | −201.3 |
| 6 | 1629.8 | 1922.2 | 292.4 | 17 | 877.1 | 883.1 | 6 |
| 7 | 1774.7 | 1850.3 | 75.6 | 18 | 1271.3 | 1850.8 | 579.5 |
| 8 | 663.5 | 878.8 | 215.3 | 19 | 501.14 | 578.1 | 76.96 |
| 9 | 6665 | 694.7 | −5970.3 | 20 | 2477.2 | 2634.3 | 157.1 |
| 10 | 932.2 | 1112.7 | 180.5 | 21 | 13,559 | 1414.09 | −12,144.9 |
| 11 | 11,297.6 | 15,832.5 | 4534.9 | 22 | 626.6 | 222.6 | −404 |
| District | Frequency of Industrial Units | Percentage | District | Frequency of Industrial Units | Percentage |
|---|---|---|---|---|---|
| 1 | 121 | 0.98 | 12 | 3712 | 30.19 |
| 2 | 119 | 0.97 | 13 | 244 | 1.98 |
| 3 | 57 | 0.46 | 14 | 540 | 4.39 |
| 4 | 247 | 2.01 | 15 | 1587 | 12.91 |
| 5 | 162 | 1.32 | 16 | 1291 | 10.50 |
| 6 | 181 | 1.47 | 17 | 183 | 1.49 |
| 7 | 88 | 0.72 | 18 | 1091 | 8.87 |
| 8 | 1073 | 8.73 | 19 | 7 | 0.06 |
| 9 | 74 | 0.60 | 20 | 412 | 3.35 |
| 10 | 306 | 2.49 | 21 | 779 | 6.34 |
| 11 | 1 | 0.01 | 22 | 20 | 0.16 |
Publisher’s Note: MDPI stays neutral with regard to jurisdictional claims in published maps and institutional affiliations. |
© 2022 by the authors. Licensee MDPI, Basel, Switzerland. This article is an open access article distributed under the terms and conditions of the Creative Commons Attribution (CC BY) license (https://creativecommons.org/licenses/by/4.0/).
Share and Cite
Zenouzi, A.S.; Yenneti, K.; Teimouri, R.; Abbasiyan, F.; Palme, M. Analysis of Changes in Vegetation Index during the Rapid Urban Spatial Development Period (1990–2020) in Tehran Metropolis, Iran. Atmosphere 2022, 13, 2010. https://doi.org/10.3390/atmos13122010
Zenouzi AS, Yenneti K, Teimouri R, Abbasiyan F, Palme M. Analysis of Changes in Vegetation Index during the Rapid Urban Spatial Development Period (1990–2020) in Tehran Metropolis, Iran. Atmosphere. 2022; 13(12):2010. https://doi.org/10.3390/atmos13122010
Chicago/Turabian StyleZenouzi, Alizadeh Shahin, Komali Yenneti, Raziyeh Teimouri, Fatemeh Abbasiyan, and Massimo Palme. 2022. "Analysis of Changes in Vegetation Index during the Rapid Urban Spatial Development Period (1990–2020) in Tehran Metropolis, Iran" Atmosphere 13, no. 12: 2010. https://doi.org/10.3390/atmos13122010