1. Introduction
More than half of the population of the world lived in cities by the end of 2020 [
1]. The urbanization rate of the resident population of China exceeds 60% [
2]. Rapid urbanization rates lead to a heat island effect [
3,
4] and extreme heat also increases heat-related morbidity and mortality [
5]. Several studies have demonstrated that excessively hot weather can inhibit the willingness of residents to go outside [
6,
7]. Outdoor thermal comfort is considered to be the most important factor influencing the use of public spaces [
8] and creating activity spaces with a good thermal environment is conducive to enhancing the willingness of residents to be active as well as public health [
7,
9,
10,
11,
12].
Many outdoor thermal comfort studies have been conducted in tropical [
13,
14,
15], subtropical [
16,
17,
18], temperate [
19,
20,
21], and subarctic regions [
22]. Most of these studies have described the relationships between the outdoor thermal environment and the thermal comfort of residents who have different needs in different regions for thermal comfort, depending on the climatic conditions. A study in a tropical urban park showed that humidity and wind conditions are potentially critical conditions for thermal comfort in the tropics [
23]. In contrast, a study in Harbin found that in a severe cold area, the air temperature was the most influential for thermal sensation [
21]. Studies conducted in Guangzhou [
24] in the subtropical region yielded 80% and 90% acceptable temperature ranges (31.10 °C and 28.54 °C), which were significantly higher than that in Europe. Different outdoor thermal environments result in different levels of thermal comfort for residents in each climate zone. Previous studies have focused on tropical regions [
25,
26,
27]; the outdoor thermal comfort in subtropical regions is not clear.
We combined questionnaires, field observations, and meteorological field measurements in five public spaces selected from four residential areas in Changsha, China, to better understand the activities and thermal comfort of residents in subtropical China through a combination of subjective responses and physical field measurements. Our main objectives were: (1) to explore the outdoor thermal benchmarks in the residential areas of Changsha in the subtropical region; and (2) to investigate the relationship between the activities of residents and the thermal environment during the summer months.
2. Methods
2.1. Study Area
This study was carried out in Changsha (27°51′–28°41′ N, 111°53′–114°15′ E), a typical Chinese subtropical city located in central-south China and classified as a humid subtropical climatic type. It boasts hot summers and cold winters as well as abundant precipitation. According to the Hunan Statistical Yearbook [
28], the monthly average temperature of Changsha (2020) was 5.1–29.4 °C, with the highest monthly average temperatures occurring in July (27.6 °C) and August (29.4 °C) and the lowest monthly average temperatures occurring in December (6.1 °C) and January (5.1 °C).
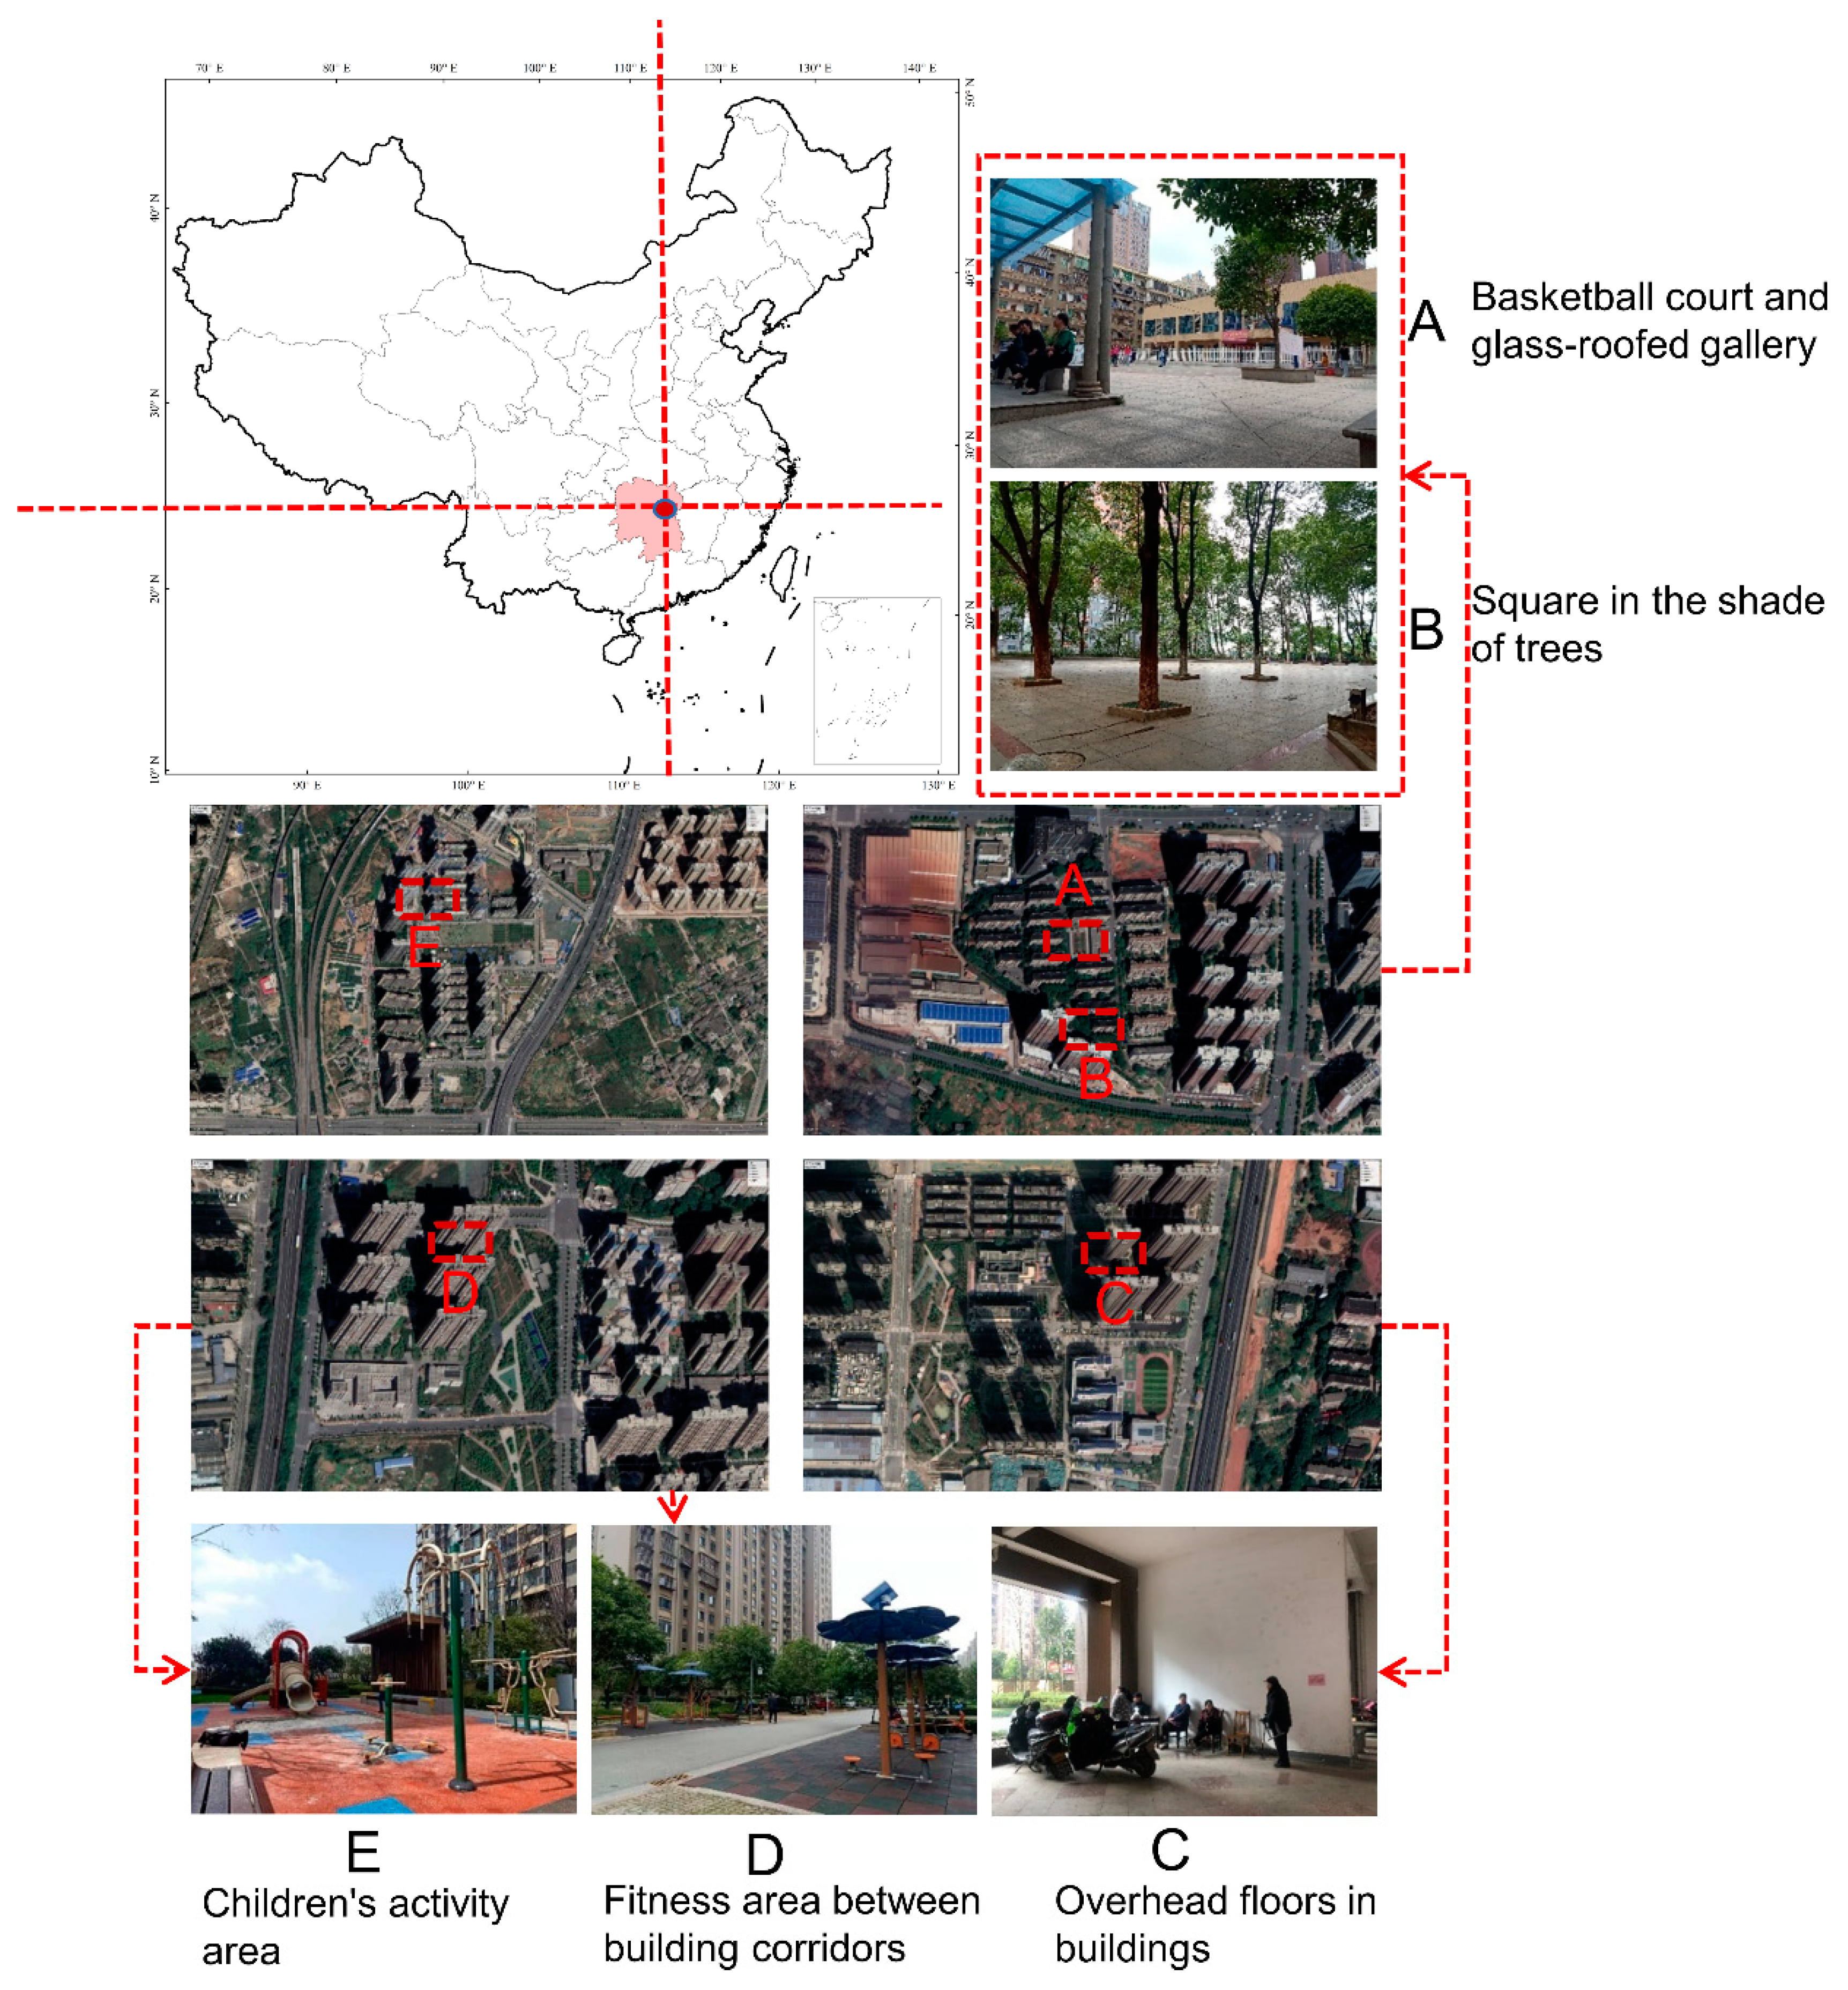
In the humid subtropical regions of China, both high-rise and low-rise residential areas are common residential construction patterns. In this study, we selected three high-rise residential areas and one low-rise residential area. The high-rise residential areas were Xin Yue Li, Dong Yi Zhu Yuan, and Dong Yi Lan Yuan. The low-rise residential area was 3614. As shown in
Figure 1, these four residential areas show the typical characteristics of residential areas in the subtropical region of China: (1) the green coverage is above 30%; (2) there are public activity spaces inside the residential areas for the daily activities of the residents; (3) the layout of the residential areas is in the form of ranks and columns; and (4) the numbers of permanent residents are all above 2000.
Field experiments were conducted in these four residential areas and, had a wide variety of plant species and activity spaces: a basketball court (Space A); a shaded square (Space B); an elevated floor (Space C); a fitness aisle (Space D); and an activity area for children (Space E). This made them ideal for studying the relationship between thermal comfort, outdoor activities, and residential space use. Five representative outdoor spaces were selected from the residential areas in Changsha. Detailed descriptions, fisheye photographs, and sky view factor (SVF) values for the five spaces are shown in
Table 1.
2.2. Experiment Design
According to previous studies, the hottest temperature in Changsha usually occurs in July. We selected 8 July–10 July 2021 as the experimental time, which included two sets of weekdays and one weekend; all were representative of sunny weather. Based on our observations, we set the observation times between 6:00–12:00 and 15:00–20:00, taking into account the summer months when residents are active for longer periods and largely unoccupied at midday.
We obtained time-by-time data on meteorological parameters such as air temperature (Ta), relative humidity (RH), globe temperature (Tg), wind speed (Va), and solar radiation (G) at the measurement points through on-site actual measurements. We obtained the demographic information of residents and data on their thermal sensations, thermal comfort, thermal preferences, and thermal acceptability of the current environment through a questionnaire survey. Combining the personal conditions of the residents from the questionnaire survey and the microclimate parameters measured on-site, the PET values were calculated by substituting them into the RayMan model. The thermal environment conditions at the measurement points and the thermal sensations and thermal comfort of the human body were comprehensively analyzed.
2.3. Questionnaire Survey
In this study, we used a questionnaire survey to collect the subjective thermal comfort evaluation characteristics of the outdoor space from residents who had been at the measurement site for more than 20 min. The questionnaire was collected between 6:00–12:00 and 15:00–20:00 and the time and location of the measurement site were recorded by the observer on the questionnaire.
The questionnaire consisted of three parts. The first part collected basic information about the residents such as gender, age, clothing, activities, and what they were doing in the first 20 min. The second part of the questionnaire recorded their thermal sensation, thermal comfort, and thermal acceptability of the outdoor environment. The thermal sensation was divided into 9 levels and each was assigned a value from +4 to −4 representing “very hot” to “very cold”. Thermal comfort had values from 0 to 3, divided into “comfortable”, “slightly uncomfortable”, “uncomfortable”, and “very uncomfortable”. The thermal environment acceptability was classified as “fully acceptable”, “just acceptable”, “just not acceptable”, and “not at all acceptable” and those four levels were assigned a value of +1, +0.01, −0.01, or −1. The third part collected the thermal preferences of the residents for the outdoor environment, including whether they wanted the thermal environment parameters such as air temperature, relative humidity, wind speed, and solar radiation to increase, stay the same, or decrease; these were assigned values from +1 to −1.
2.4. Microclimate Measurements
To better focus on user perception in the outdoor thermal environment, the height of the measurement point was determined to be 1.2 m above the ground and the measurement points were arranged in the more popular open spaces in the residential areas. Ta, RH, Tg, G, and Va were recorded at each measurement point during the period of 6:00–20:00 from 8 July to 10 July 2021. We used Kestrel 5400 (Nielsen Kellerman, PA, USA) and Tes-1333R (Tes, Taiwan, China) to record microclimate parameters. The thermal environment parameters were recorded automatically with a 1 min interval.
Table 2 lists the detailed parameters of the instruments used, all of which conformed to the ISO7726 standard [
29].
To determine the mean radiation temperature (Tmrt), the following equation was used:
where Tg is the globe temperature (°C), Va is the wind speed (m/s), Ta is the air temperature (°C), D is the diameter of the globe (m), and ε is the emissivity.
2.5. Thermal Comfort Indicators
The basic development principle of thermal comfort indicators is to relate the human body and environment to the thermal conditions. Different indicators take into account different environmental and human factors and emphasize different aspects of the thermal environment and indicator development, leading to different outputs. We used the PET as an indicator to measure outdoor thermal comfort. The PET is defined as the air temperature at which, in a typical indoor setting (without wind and solar radiation), the heat budget of the human body is balanced with the same core and skin temperature as under the complex outdoor conditions to be assessed [
30]. The RayMan model is used to calculate the PET and thus evaluate outdoor thermal comfort in urban environments [
31]. The PET is now widely used in many outdoor thermal comfort studies around the world, which provides comparisons with the results of studies in other climate zones [
32,
33].
3. Results
3.1. Descriptive Analysis
3.1.1. Attributes of the Respondents
A total of 431 questionnaires were collected and 403 of them were valid. Of the respondents, 57.8% were female and 42.2% were male; 32.0% were elderly (>60 years old), 48.9% were middle-aged (18–59 years old), 5.7% were young people (12–18 years old), and 13.4% were children (0–12 years old). All residents interviewed had lived in Changsha for more than six months and were familiar with the climatic characteristics of a subtropical region. Their life experience enabled them to adapt to the local climate through measures such as adjusting their clothing and accurately and objectively evaluating the outdoor thermal environment (
Table 3).
3.1.2. Meteorological Parameters
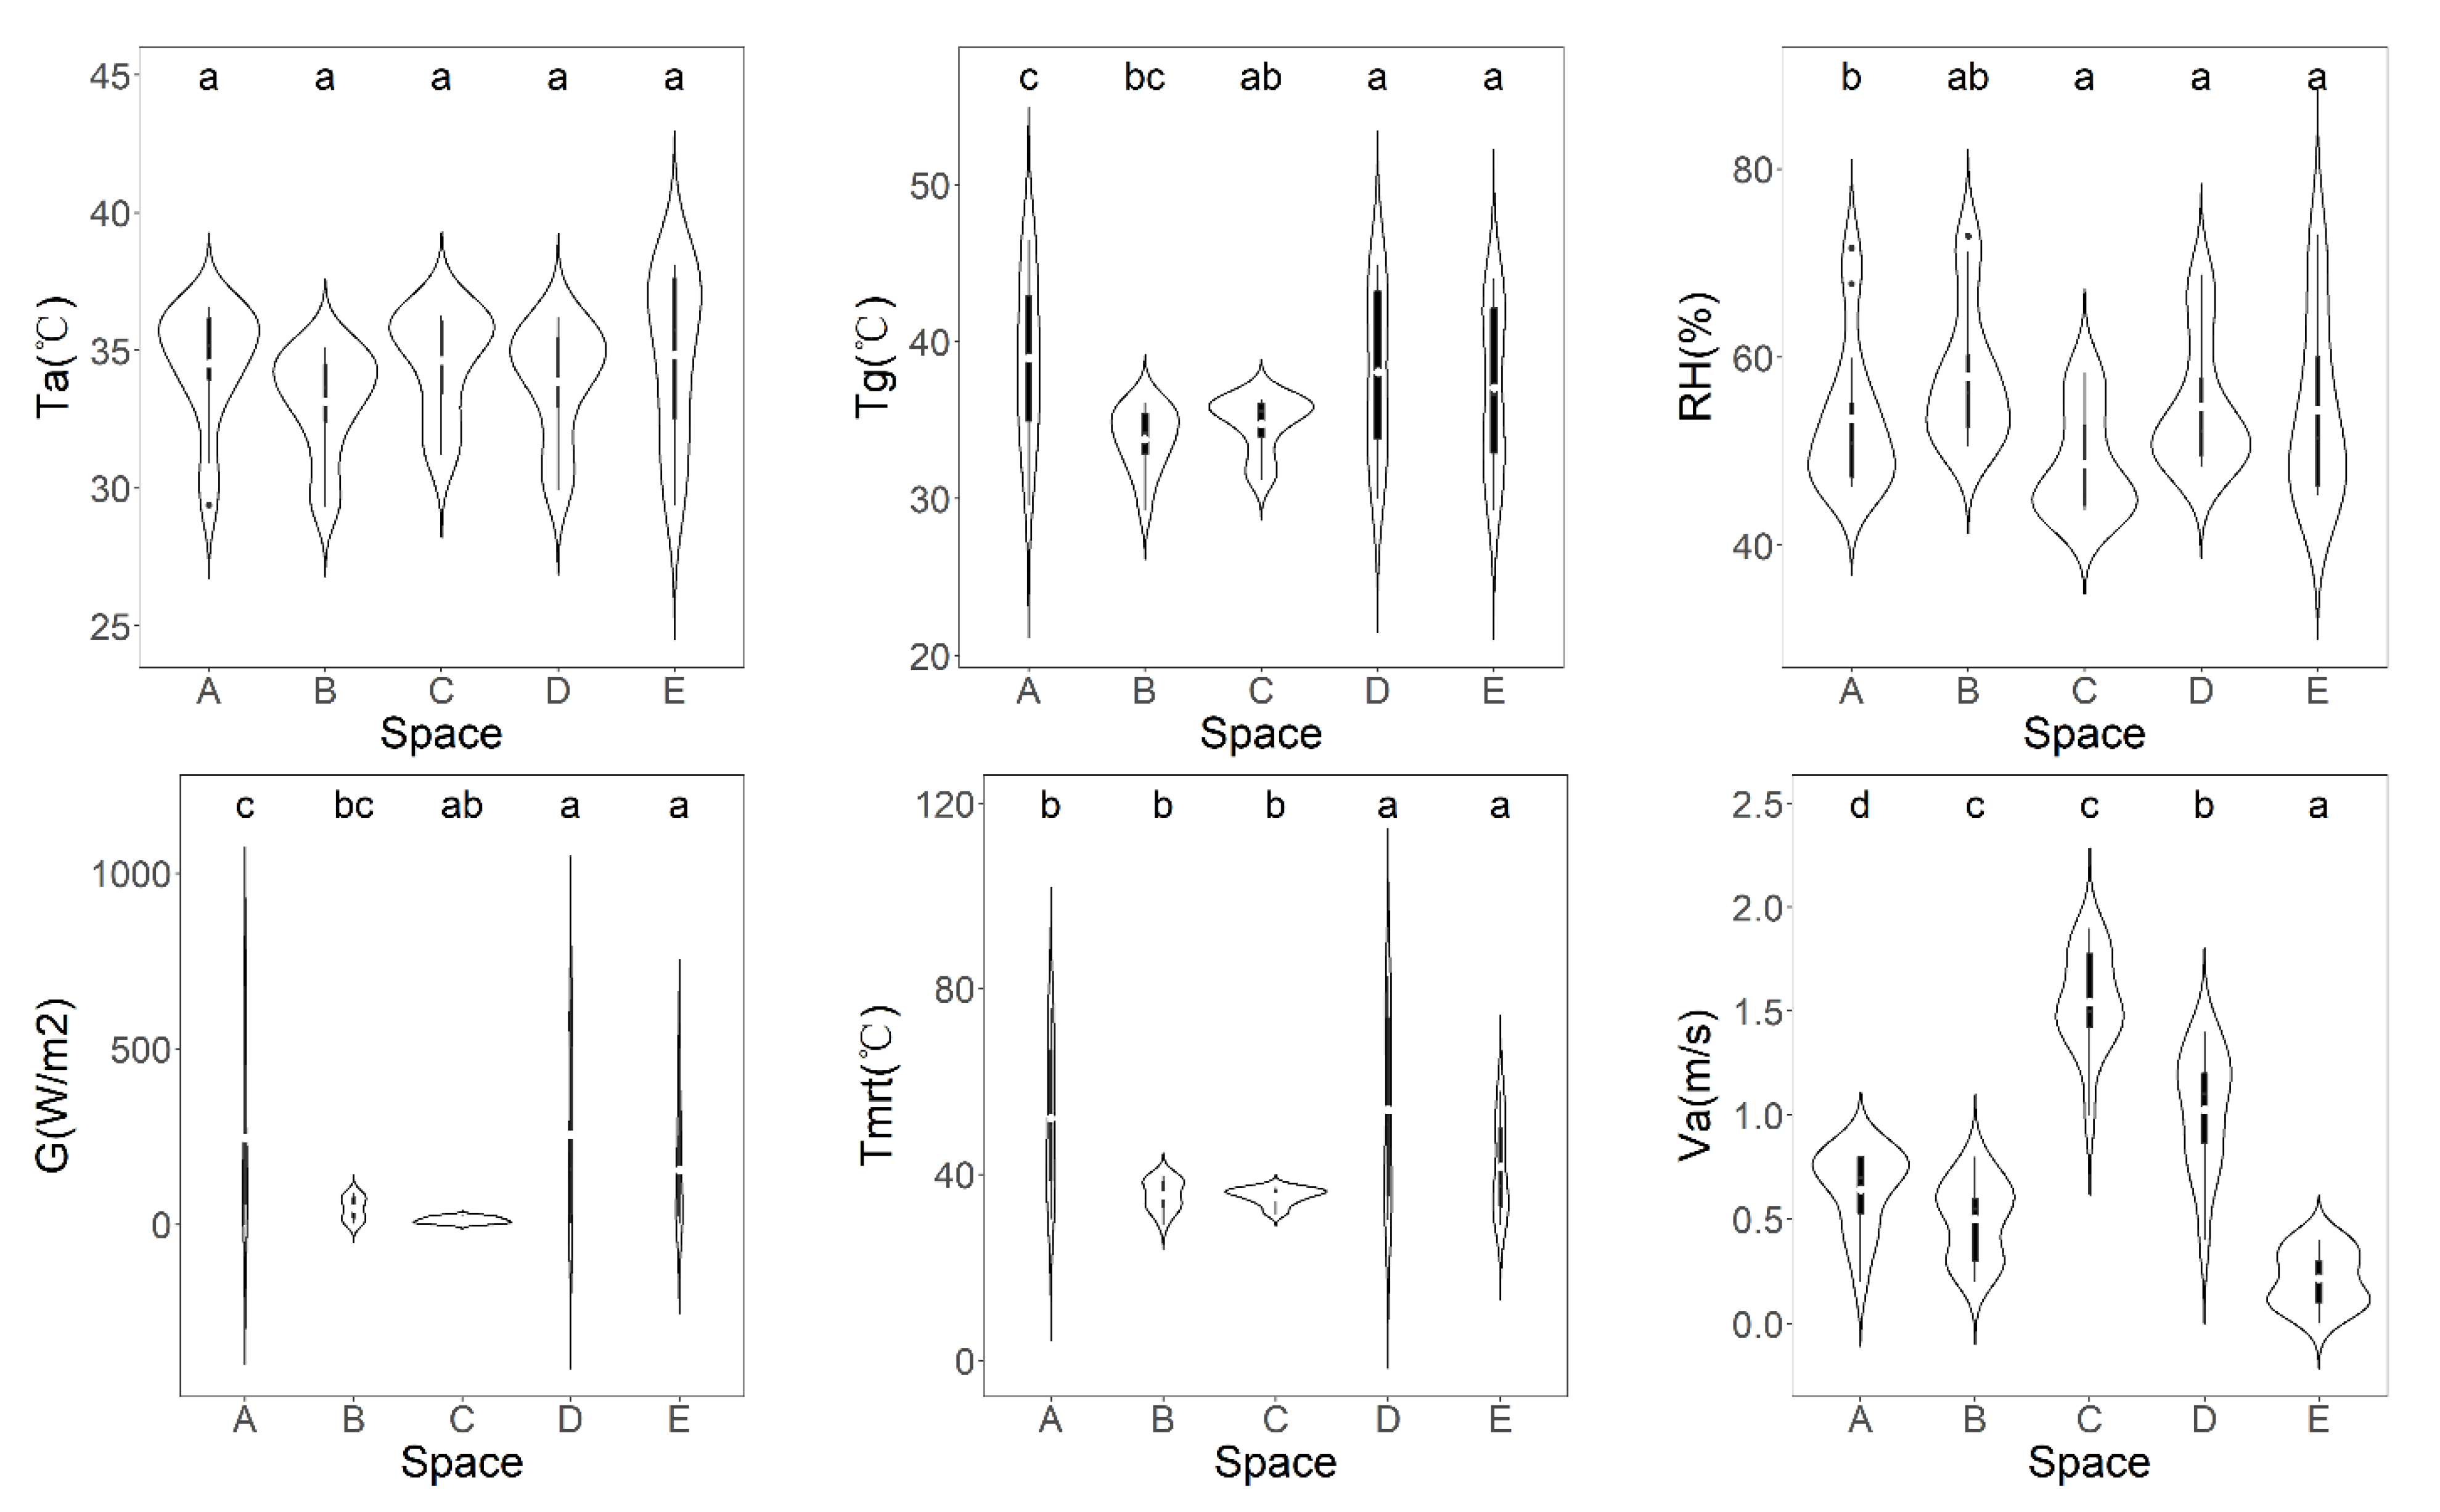
In the summer of this study, Ta showed no significant difference in these five spaces. The difference in RH was also small and the minimum value of Ta and the maximum value of RH appeared in Space B. In Spaces B and C, the SVF was small due to being in the shade of trees and buildings; therefore, G was also low and differed from the other spaces. The calculation of Tmrt was influenced by G and the variation was more similar to G. Space C had the largest Va, which may have been the reason for better ventilation there (
Figure 2).
3.1.3. Thermal Sensation Vote (TSV)
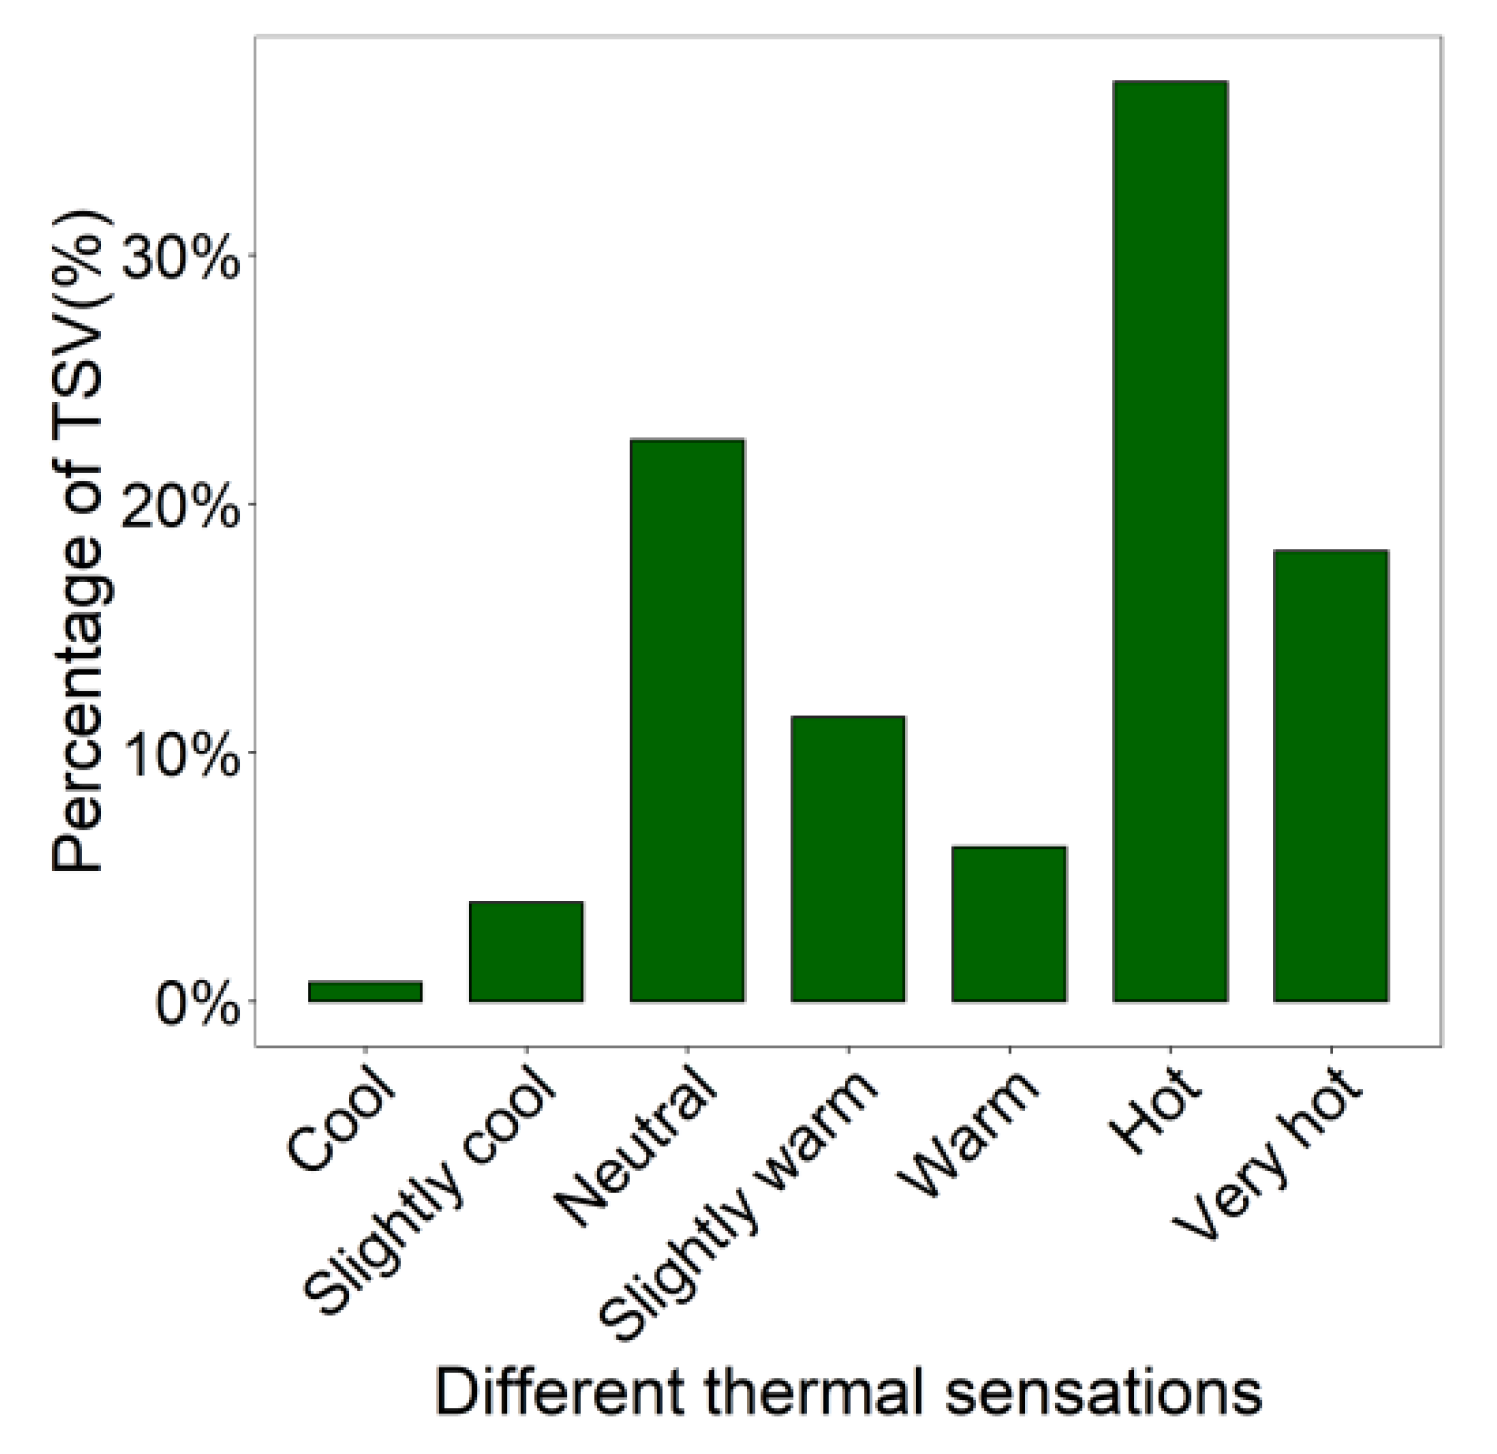
To investigate the differences in the thermal sensation of residents during the summer months, the thermal sensation votes were collated and analyzed. As shown in
Figure 3, the highest frequency of votes was for “hot” (TSV = 3) (37.0%), followed by “neutral” (TSV = 0) (22.6%) and “very hot” (TSV = 4) (18.1%). Residents generally feel hot during the summer months (
Figure 3).
3.1.4. Thermal Comfort Vote (TCV)
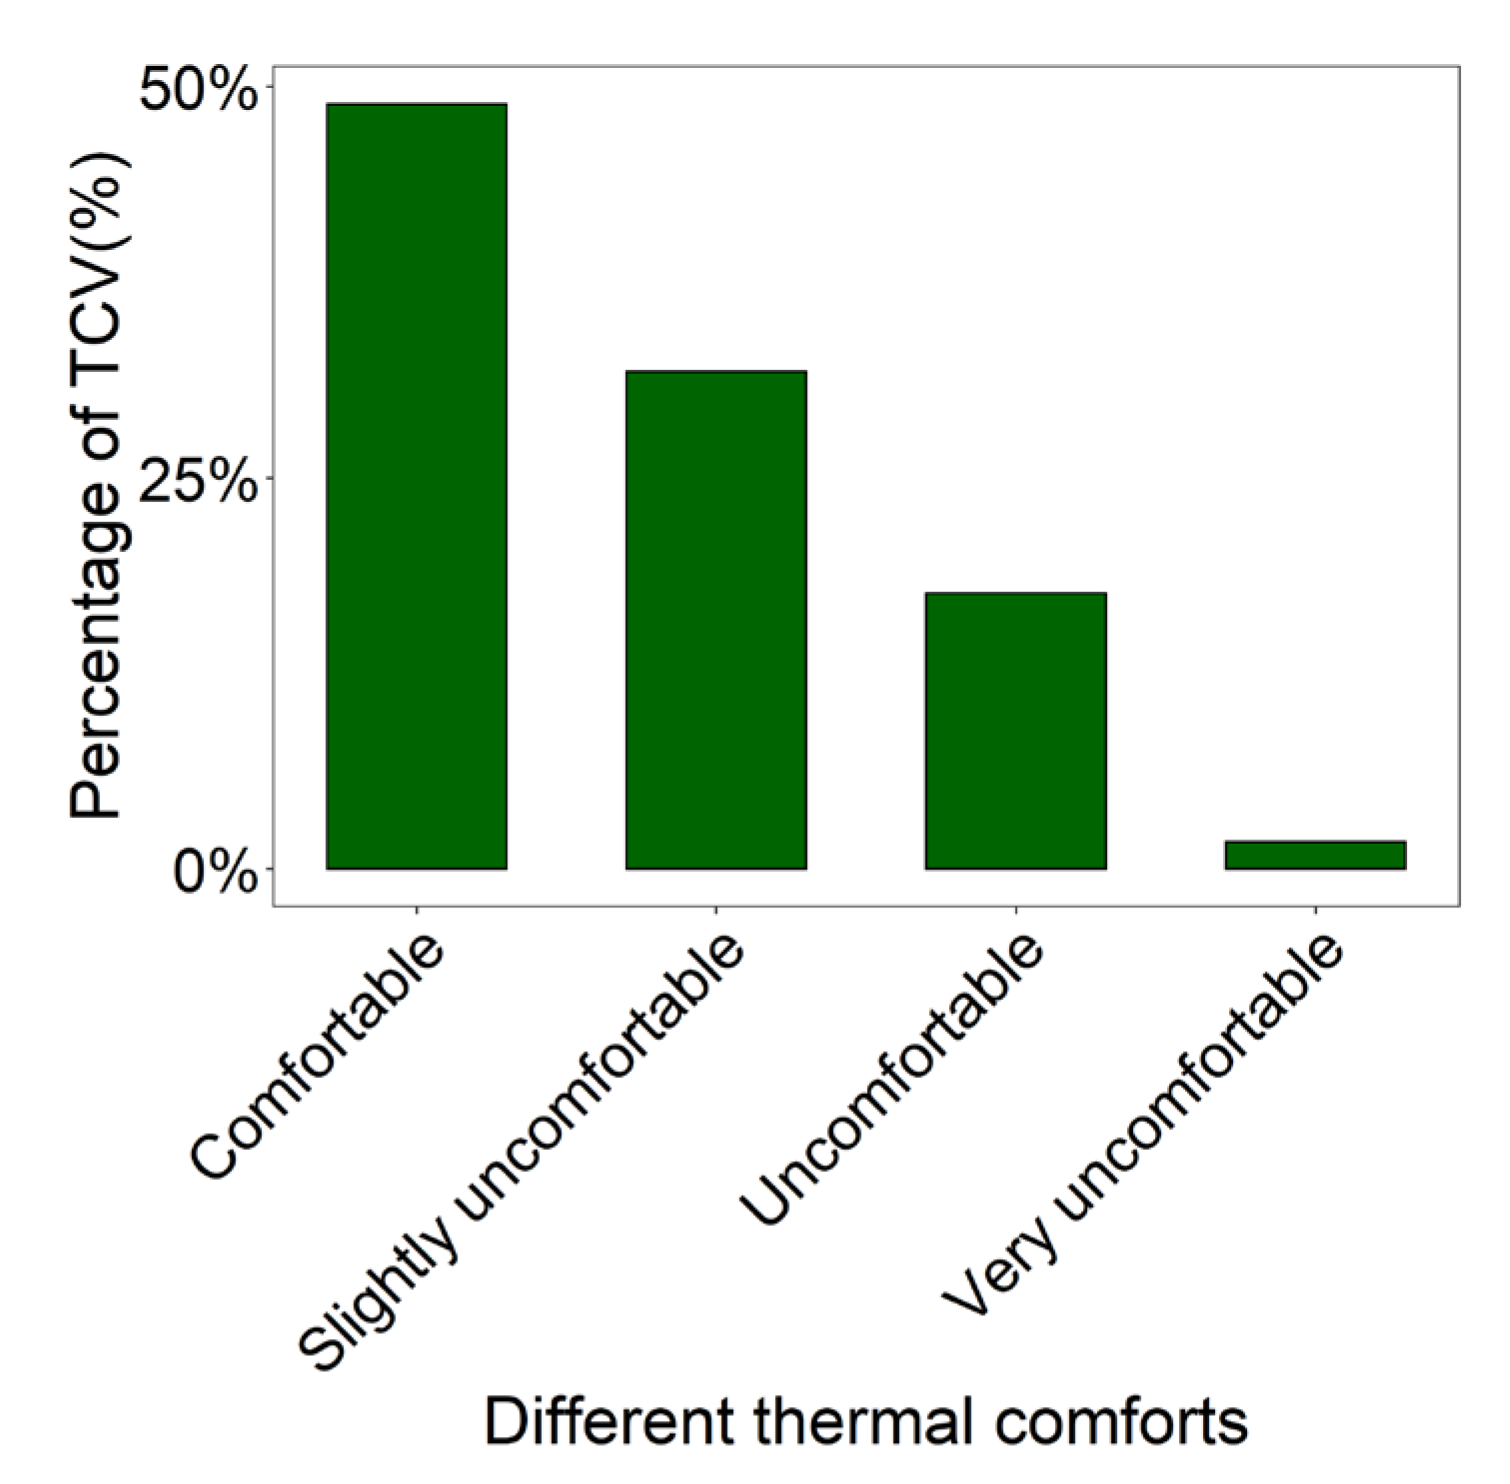
An analysis of the votes of residents on thermal comfort in the five spaces showed that residents voted for “comfortable” (TCV = 0) most frequently (48.9%), followed by “slightly uncomfortable” (TCV = 1) (31.8%) and “uncomfortable” (TCV = 2) (17.6%), with the lowest frequency of voting for “very uncomfortable” (TCV = 3) (1.7%). Overall, residents were more accepting of the summer heat (
Figure 4).
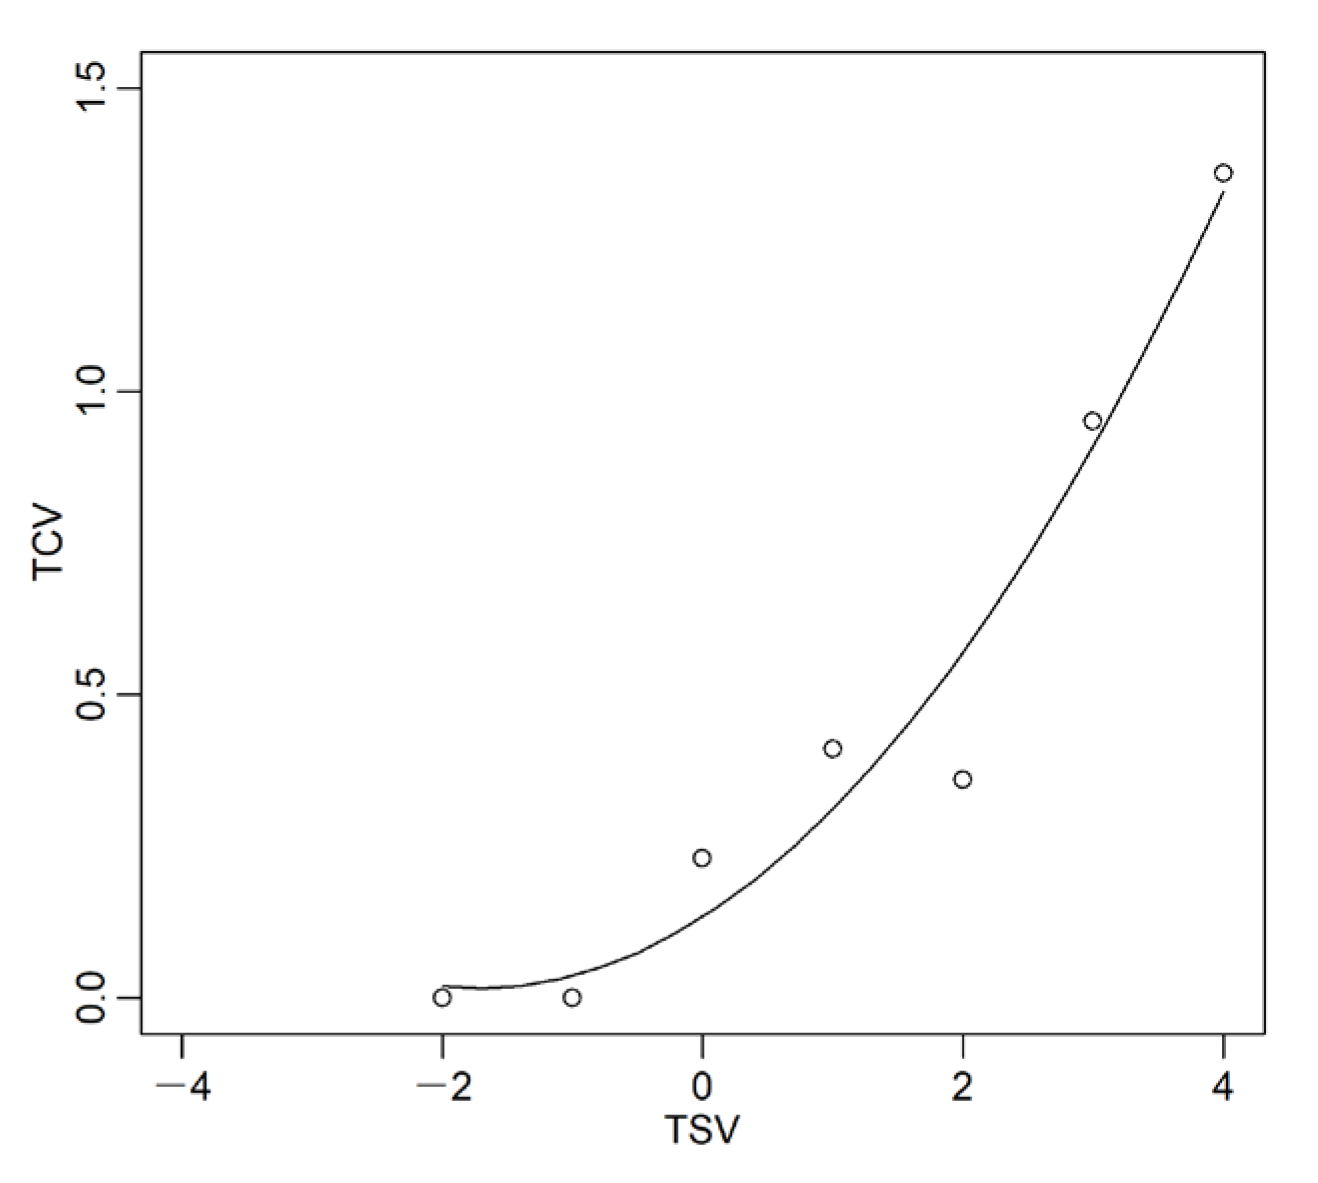
3.1.5. Correlation between the TSV and TCV
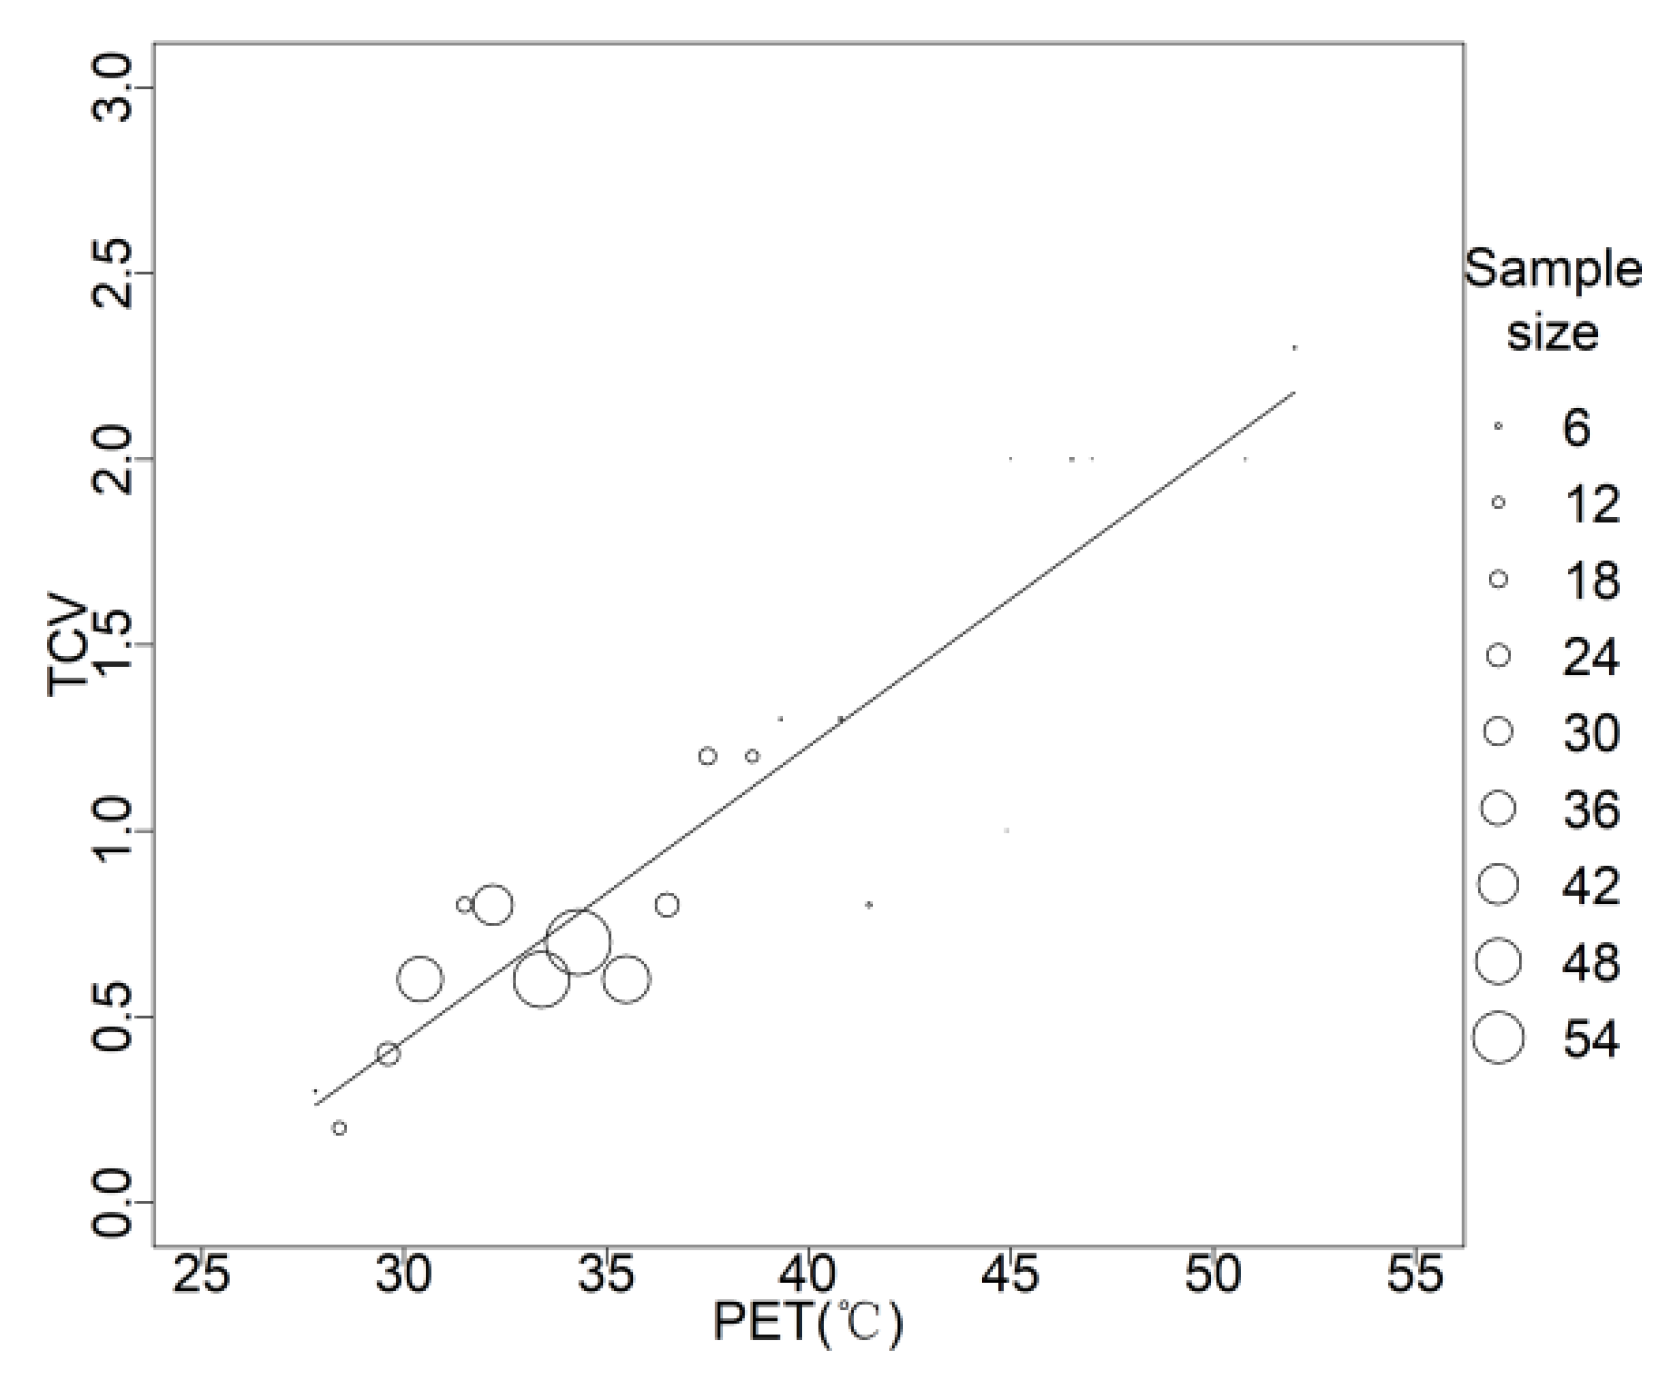
The relationship between thermal sensation and thermal comfort was established through a regression analysis; a good quadratic polynomial relationship existed between the TSV and TCV, as shown in
Figure 5. The following equation was fitted for the summer:
The results showed that the feeling of “cool” (TSV = −1.7) was most comfortable, suggesting that residents desire cooler temperatures to keep themselves comfortable in summer.
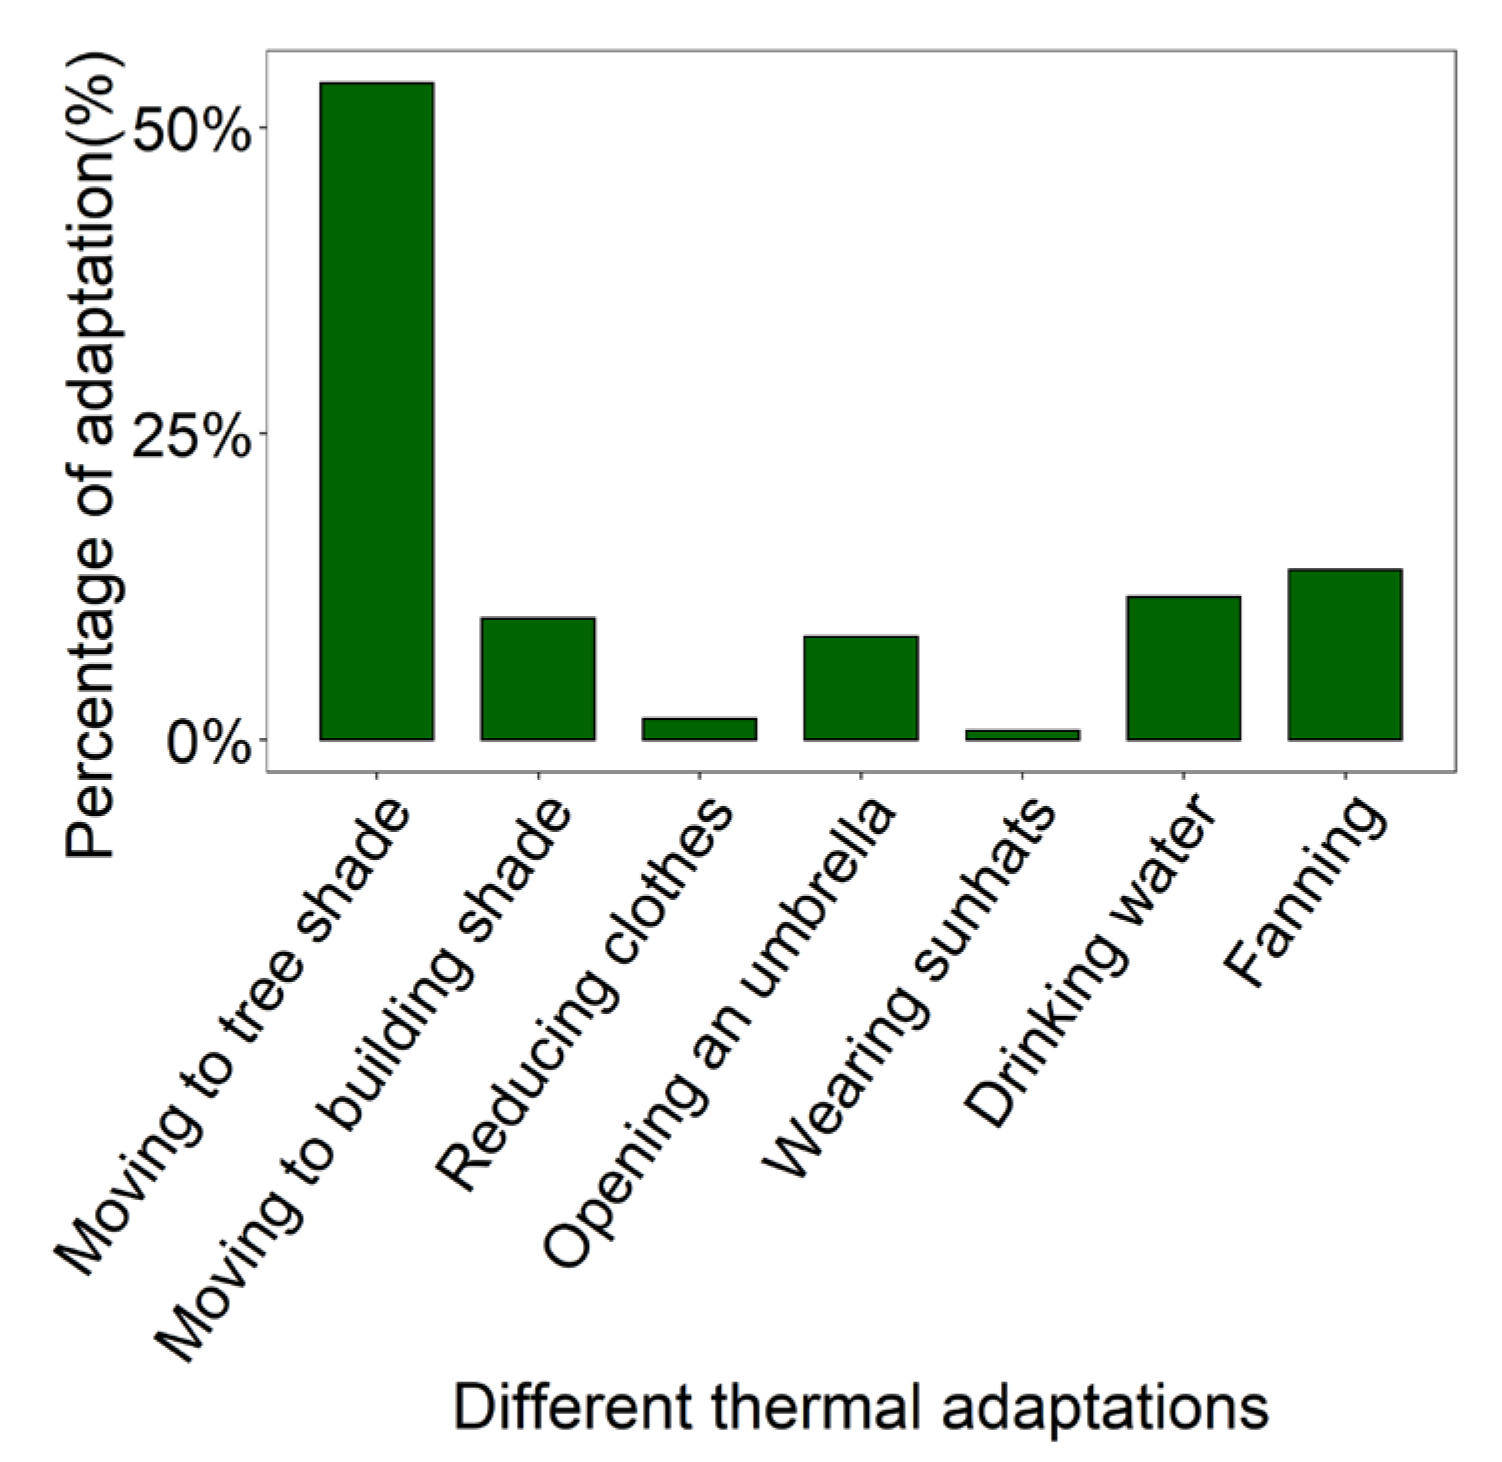
3.1.6. Thermal Adaptive Behaviors
The survey results of adaptive behaviors in summer are shown in
Figure 6, with “moving to tree shade” (53.6%) being the most frequently voted choice, followed by “fanning” (13.89%) and “drinking water” (11.66%). This showed that, in addition to creating shade, it is also necessary to create good ventilation and drinking facilities for residents. There were fewer votes for “reducing clothes” (1.74%) and “wearing sunhats” (0.74%). Residents generally dress cooler in the summer; therefore, it may not be effective to relieve thermal stress by adjusting clothing wear. In a hotter summer, residents may rely more on shade provided by the external environment than on their behavior to avoid the heat.
3.2. Thermal Comfort Benchmarks
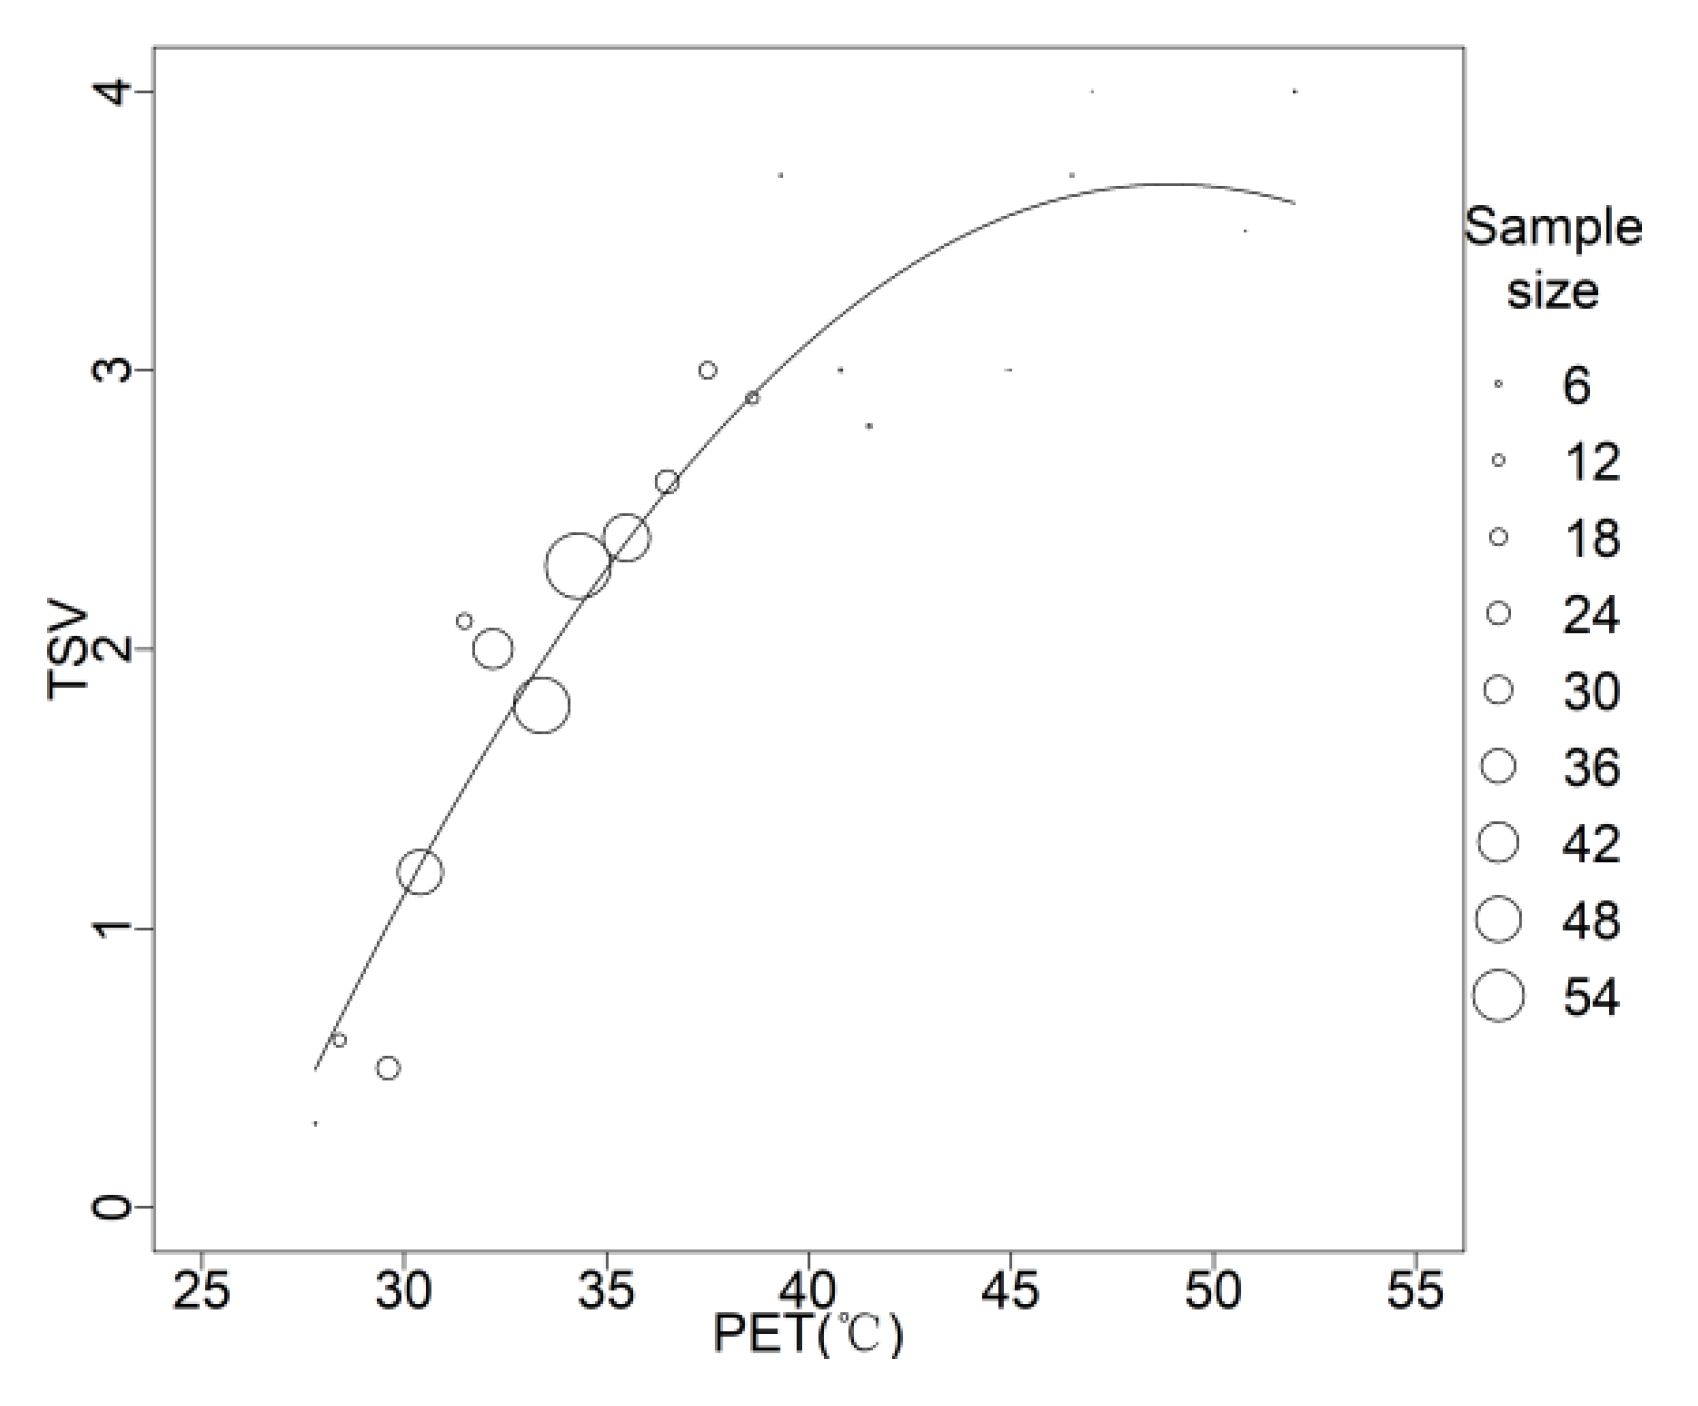
3.2.1. Neutral PET and Neutral PET Range
We calculated the weighted means of the thermal sensation vote versus a 1 °C PET change; the obtained relationship is shown in
Figure 7. When the TSV is equal to 0, a neutral temperature is obtained, which is the temperature at which inhabitants do not feel cold or hot and at which the metabolic level of the body is at its lowest value. When the TSV is in the range of −0.5 to 0.5, a neutral temperature range is obtained. The neutral temperature and neutral temperature range for this study were calculated to be 26.2 °C and 24.7–27.8 °C, respectively.
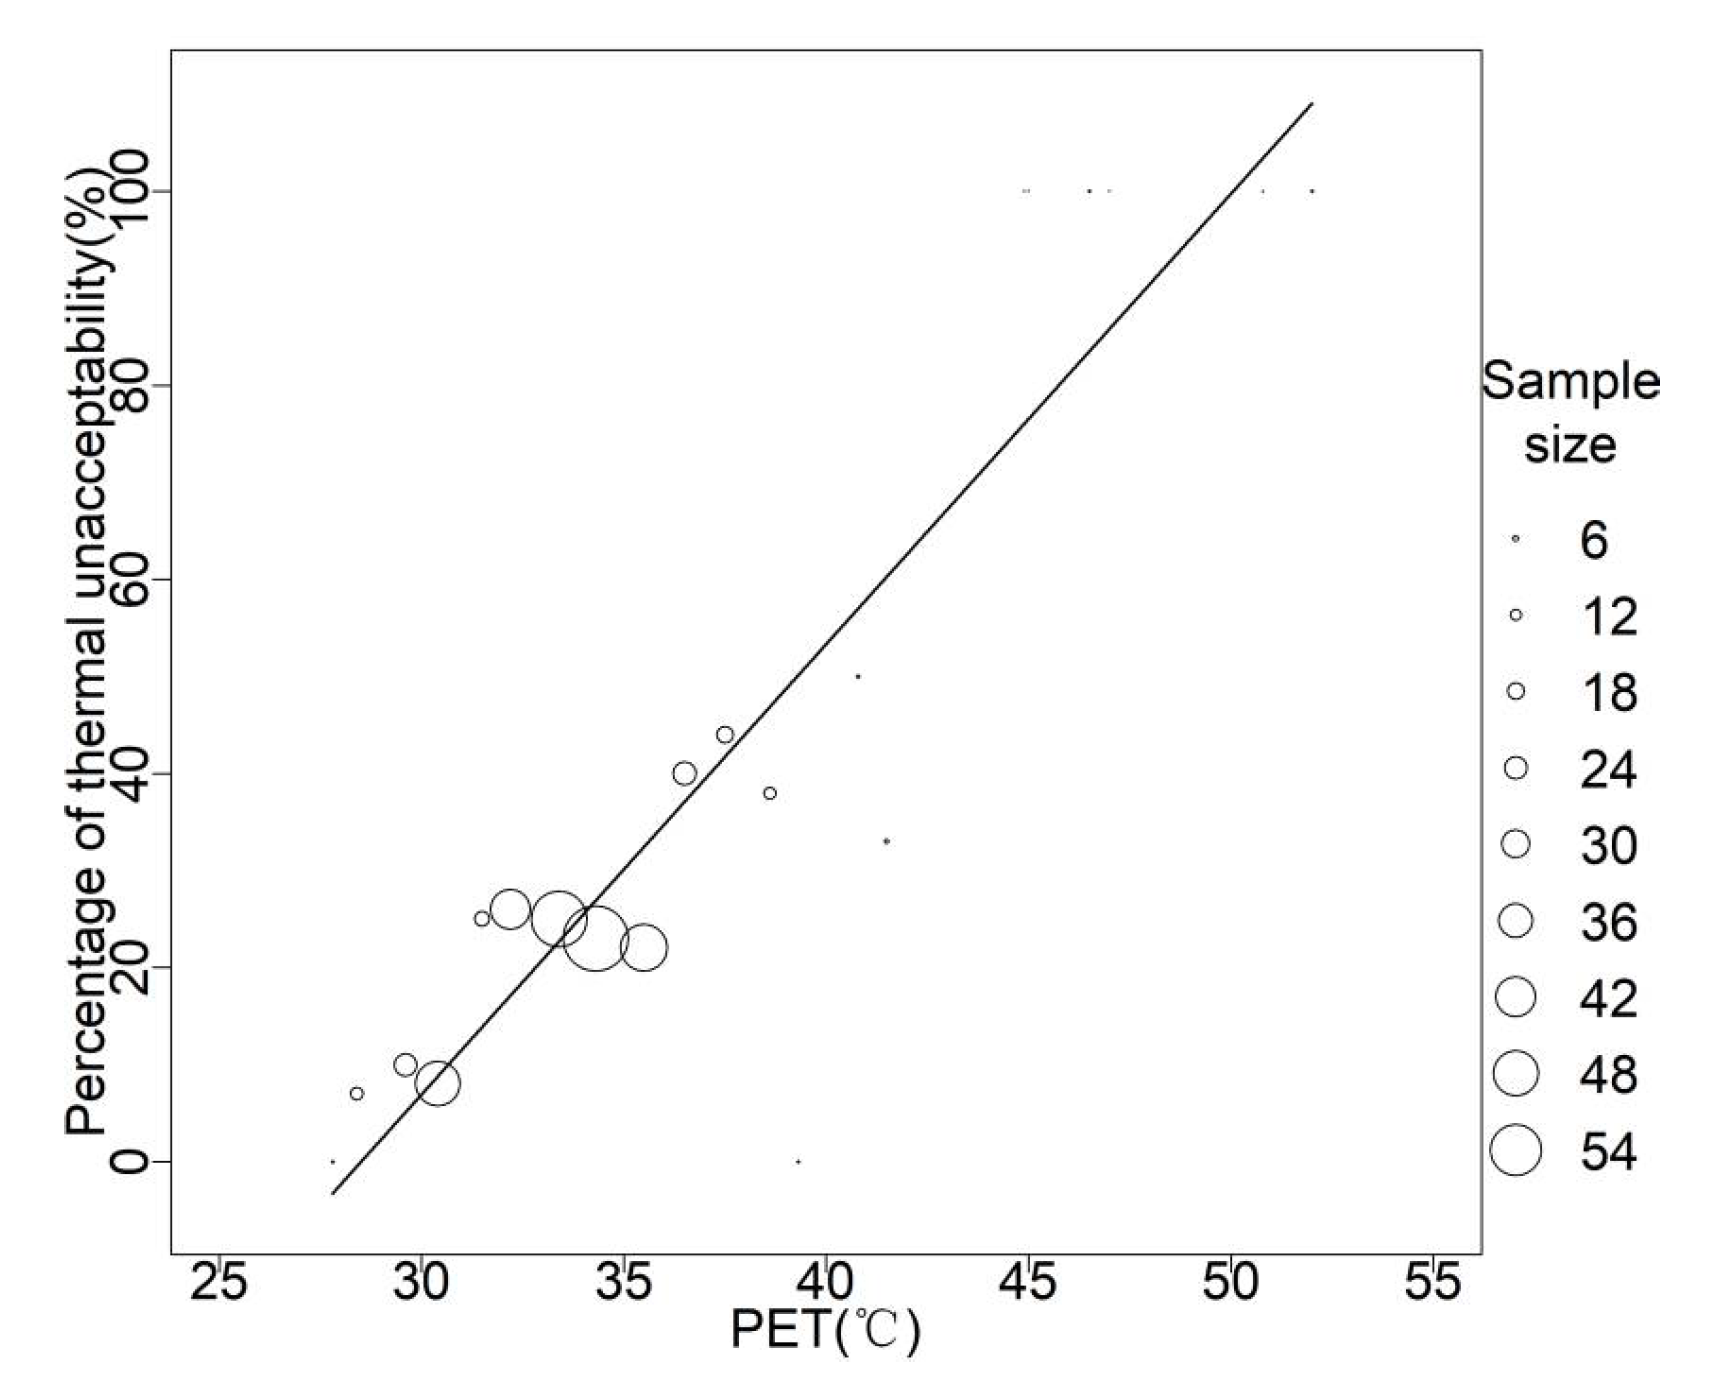
3.2.2. Thermal Acceptability Range (TAR)
Subtropical regions have long and hot summers. To better understand the thermal acceptability range of the outdoor environment for residents, a temperature range acceptable to 90% of the population was selected, according to ASHRAE Standard 55. This indicated that 10% of the residents considered the local thermal comfort range to be unacceptable. The thermal unacceptability rate for each group was calculated at a PET interval of 1 °C. The relationship is shown in
Figure 8, where the thermal unacceptability rate of the residents increased as the PET increased. The calculated 90% acceptability for the residents in summer was below 28.5 °C.
3.2.3. Thermal Comfort PET
The weighted average thermal comfort vote was calculated for each 1 °C PET and was fitted with a linear model. As shown in
Figure 9, a comfortable temperature was given as 24.5 °C when the TCV was equal to 0. The residents were likely to feel most comfortable at this temperature.
3.2.4. Physical Variables and TSV
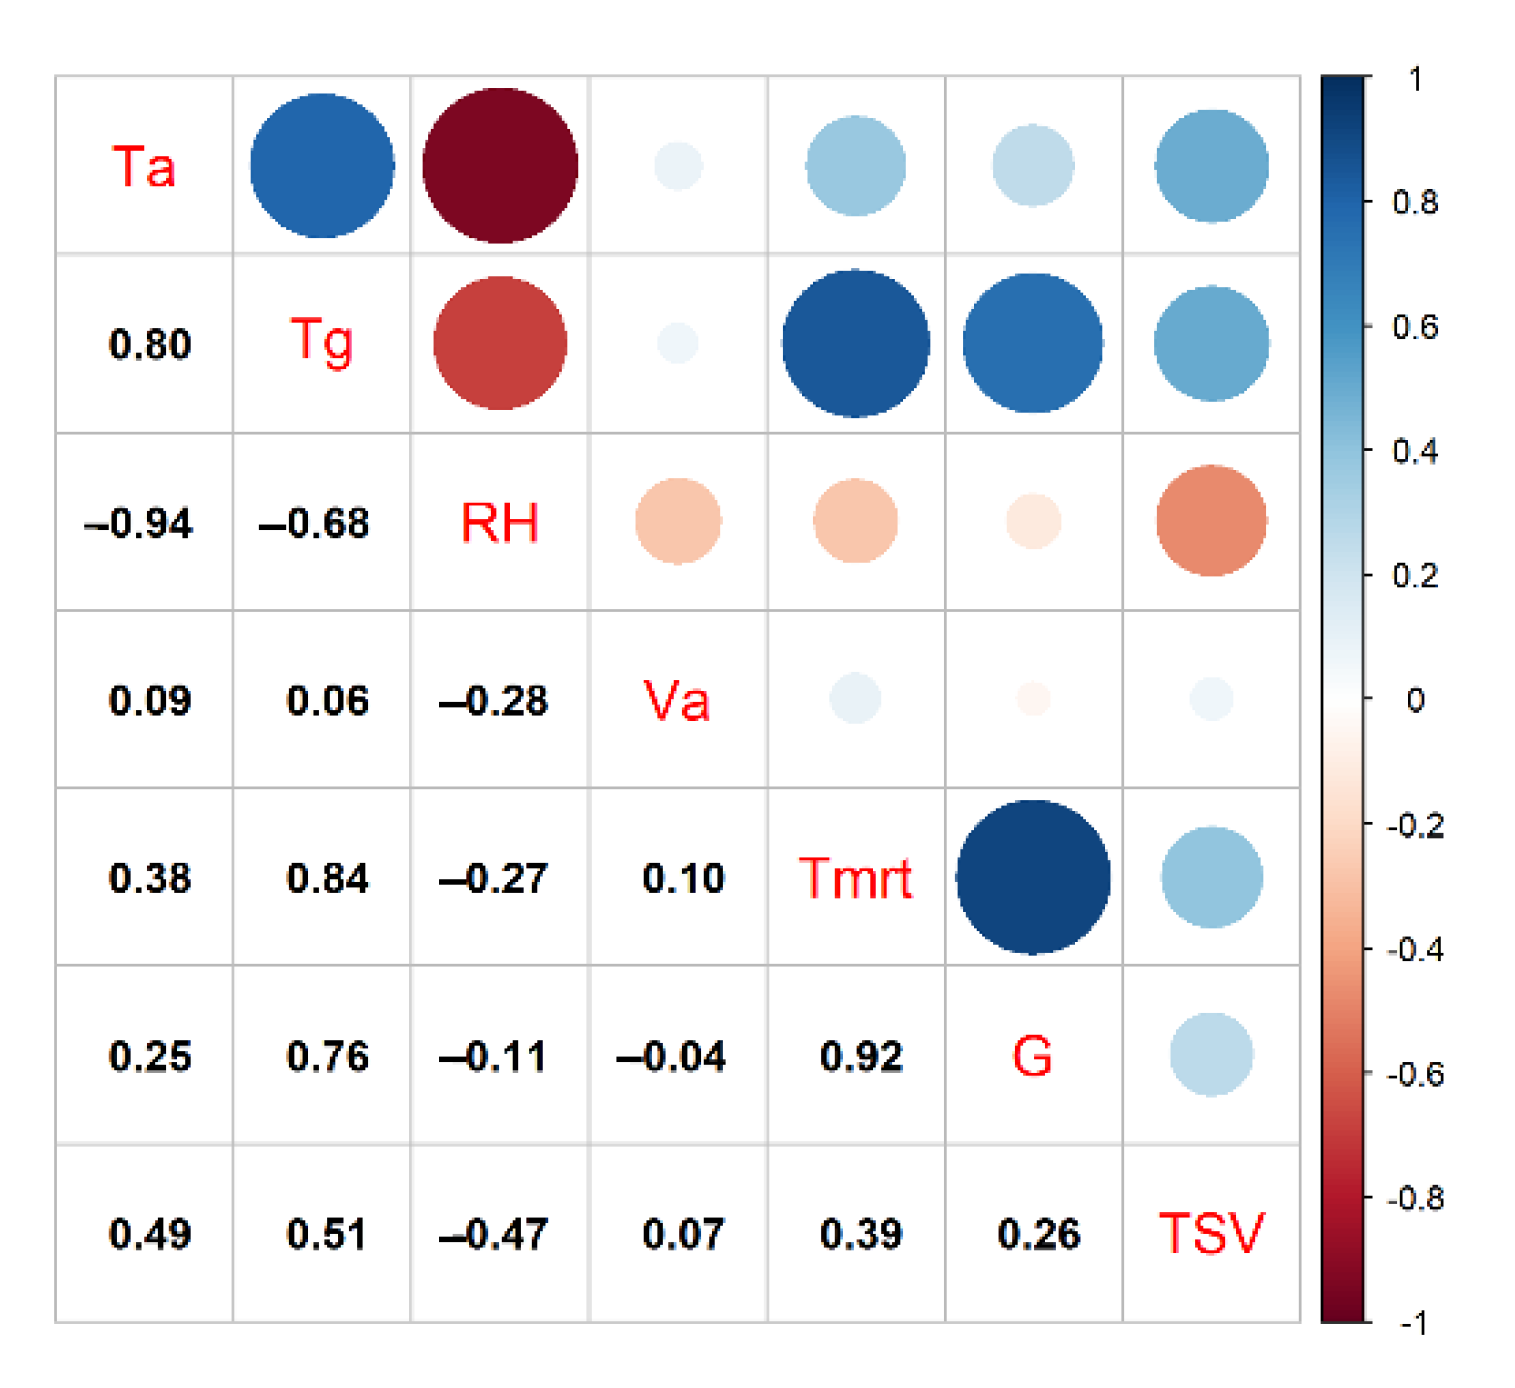
In general, residents are more influenced by physical factors in summer. The correlation analysis of Ta, Tg, RH, Va, Tmrt, G, and TSV showed that Tg had the highest correlation with the TSV of the residents, followed by Ta; both Ta and Tg were positively correlated with the TSV. The very high positive correlation between Tg and Ta indicated that Ta had a significant effect on Tg. RH was negatively correlated with the TSV. G was significantly positively correlated with Tmrt. The correlation between Va and the TSV was low, which may be due to the low and irregular variation in Va throughout the day at the observation spaces (
Figure 10).
3.3. Resident Activities and PET
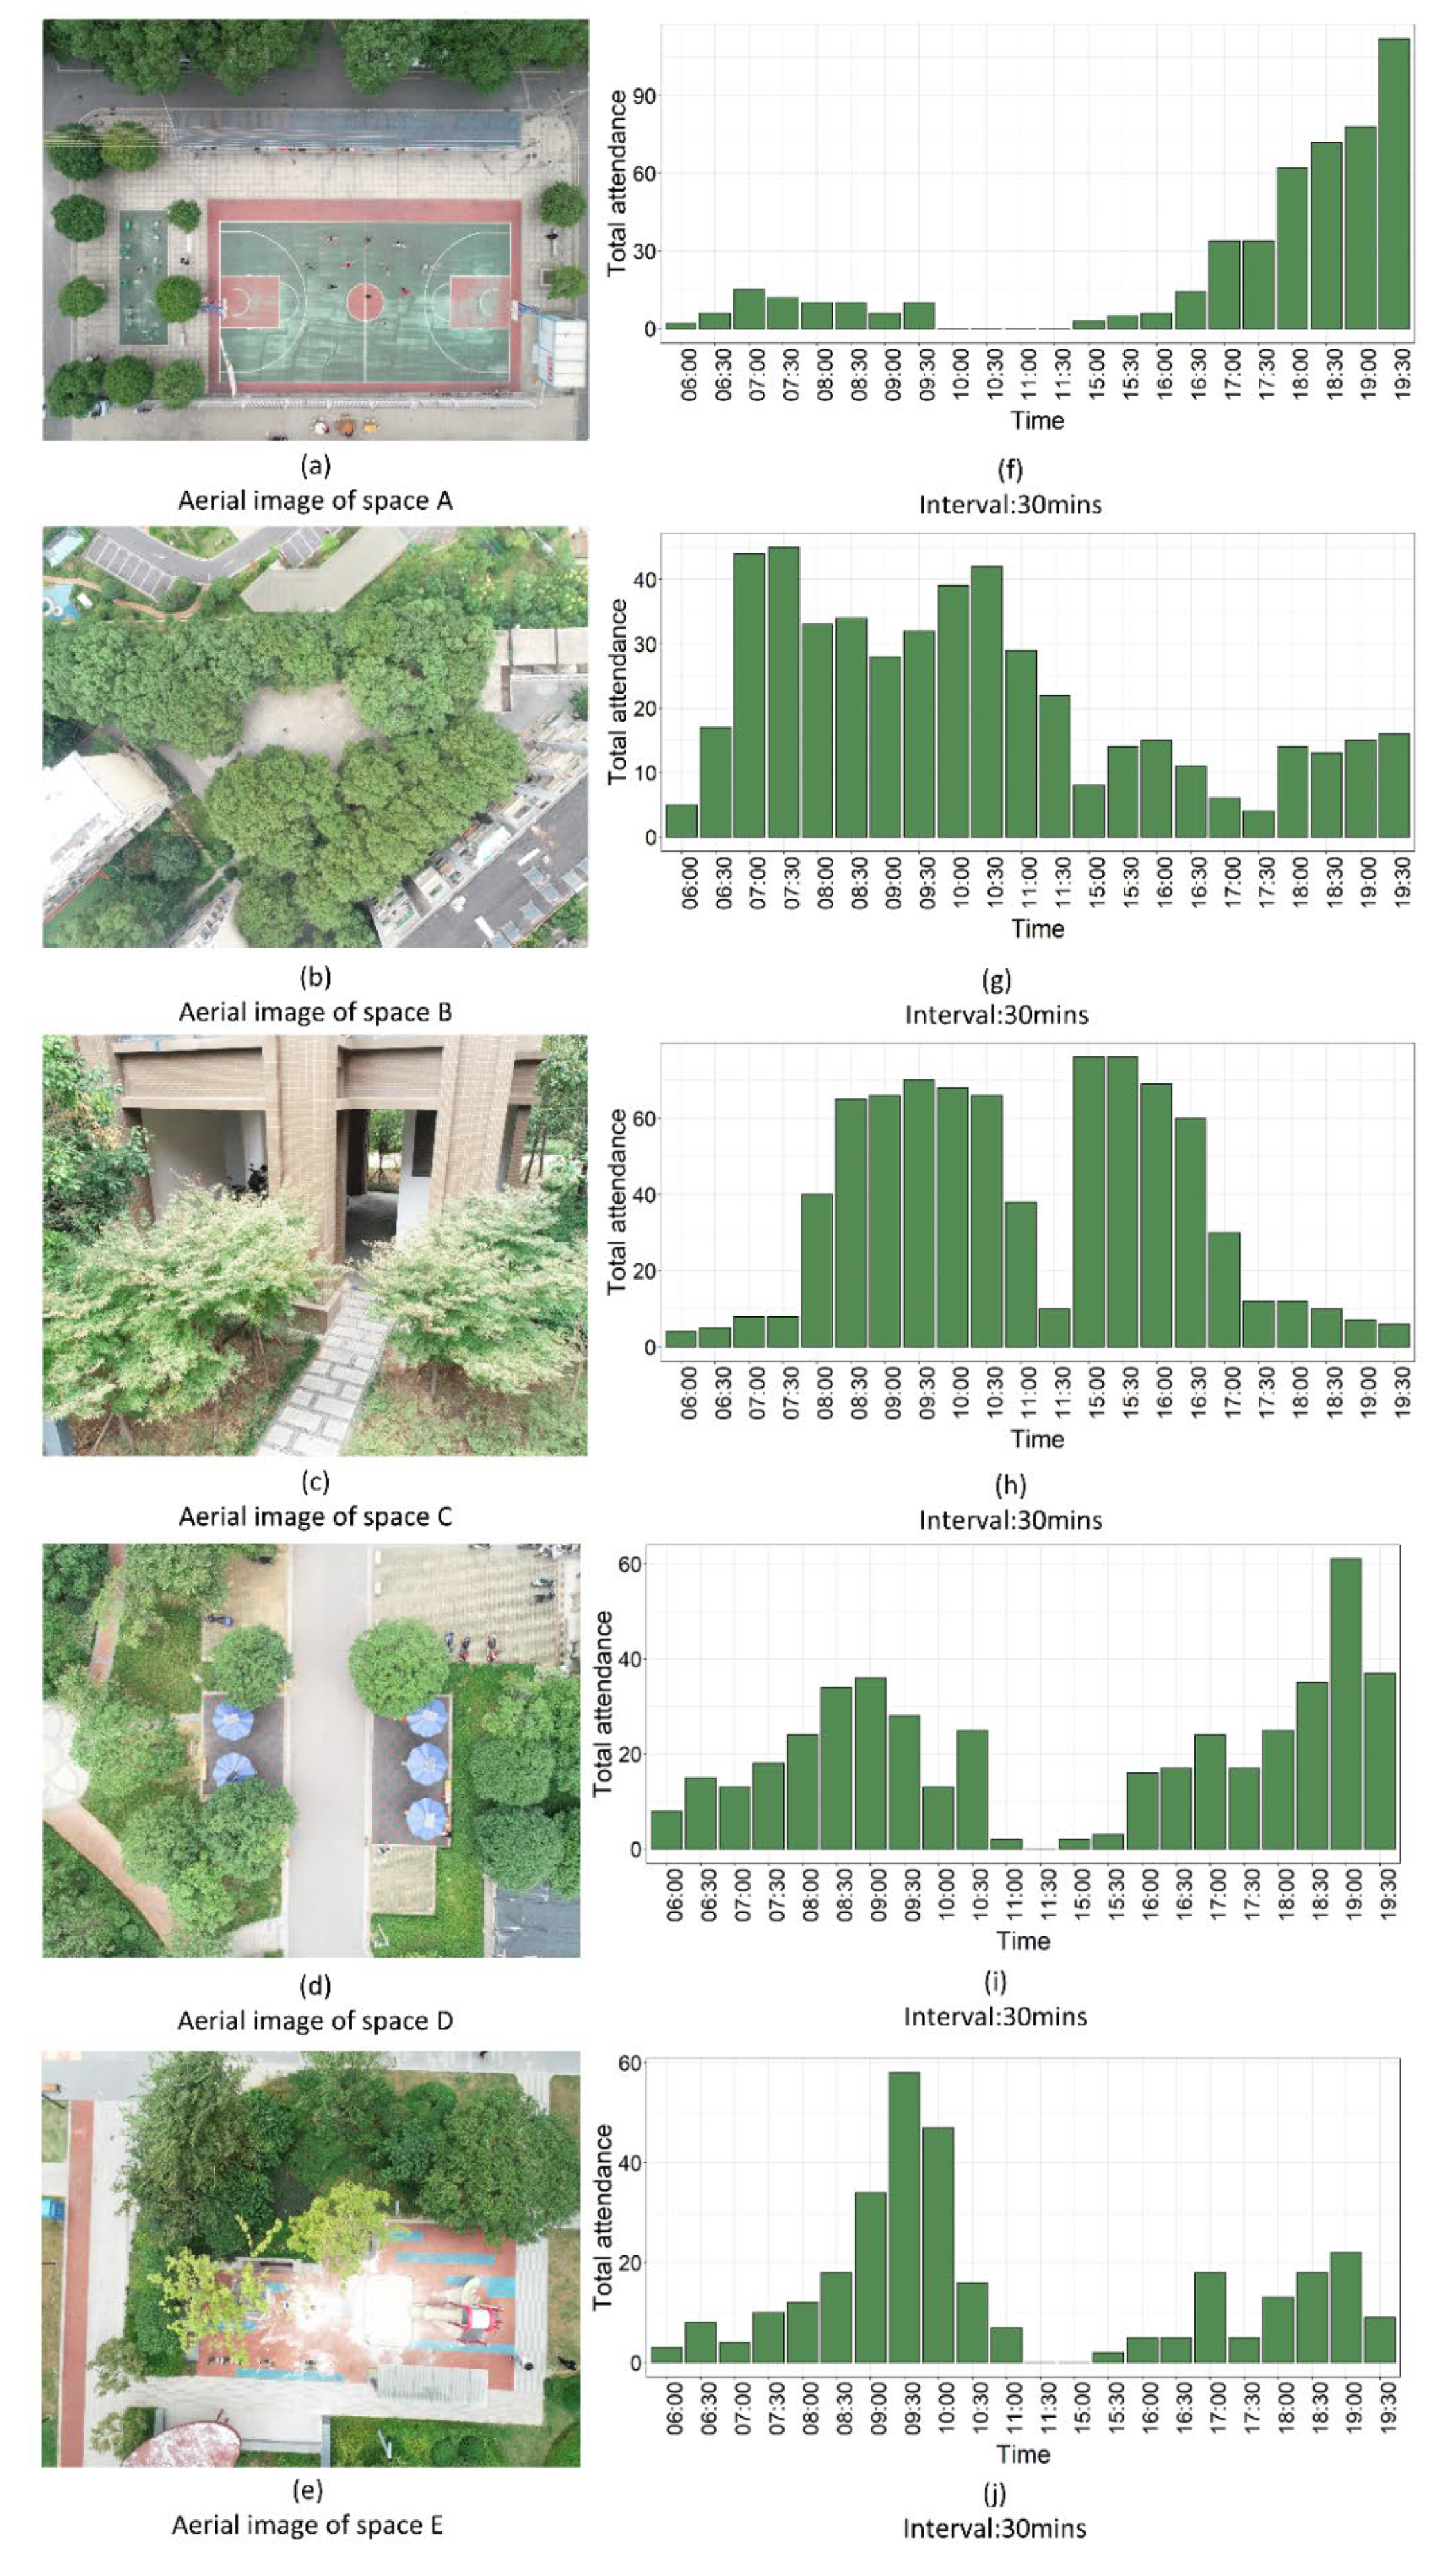
In this experiment, the residents were counted and the intensity of their activities was recorded at 30 min intervals with the main aim of exploring the impact of the outdoor thermal environment on the activities of the residents (
Figure 11). In general, Space C had the highest total number of activities during the observation time and the types of activities were all light activities such as playing cards and chatting, with a high attendance of middle-aged and elderly people. Spaces A, B, and D had a similar total number of activities and were richer in people and types of activities. Space E had the lowest total number of activities and was mainly used in the mornings by parents playing with their children.
In Space A, there were almost no people during the day, but after 6 p.m. the numbers started to increase, with older people mostly sitting on the connecting corridor chatting and more young people playing sports or playing basketball. In Space B, there was more attendance in the morning than in the afternoon, with residents enjoying sitting on stone benches in the shade or chatting on the fitness facilities. Space C was the most crowded of all the spaces; it was located on the overhead floors in the residential buildings with good ventilation and shade and had many tables and sofas for relaxing or socializing with card games. The residents of Space D tend to exercise or rest on the fitness facilities under the umbrellas of the space during the summer months. In Space E, the highest numbers of people were found between 9–10 a.m. when parents came downstairs after breakfast to take their children to play in the space, which had play equipment for children and provided a place for parents to rest and exercise at the same time. The attendance in the five spaces was lowest at midday due to the lifestyle of the residents.
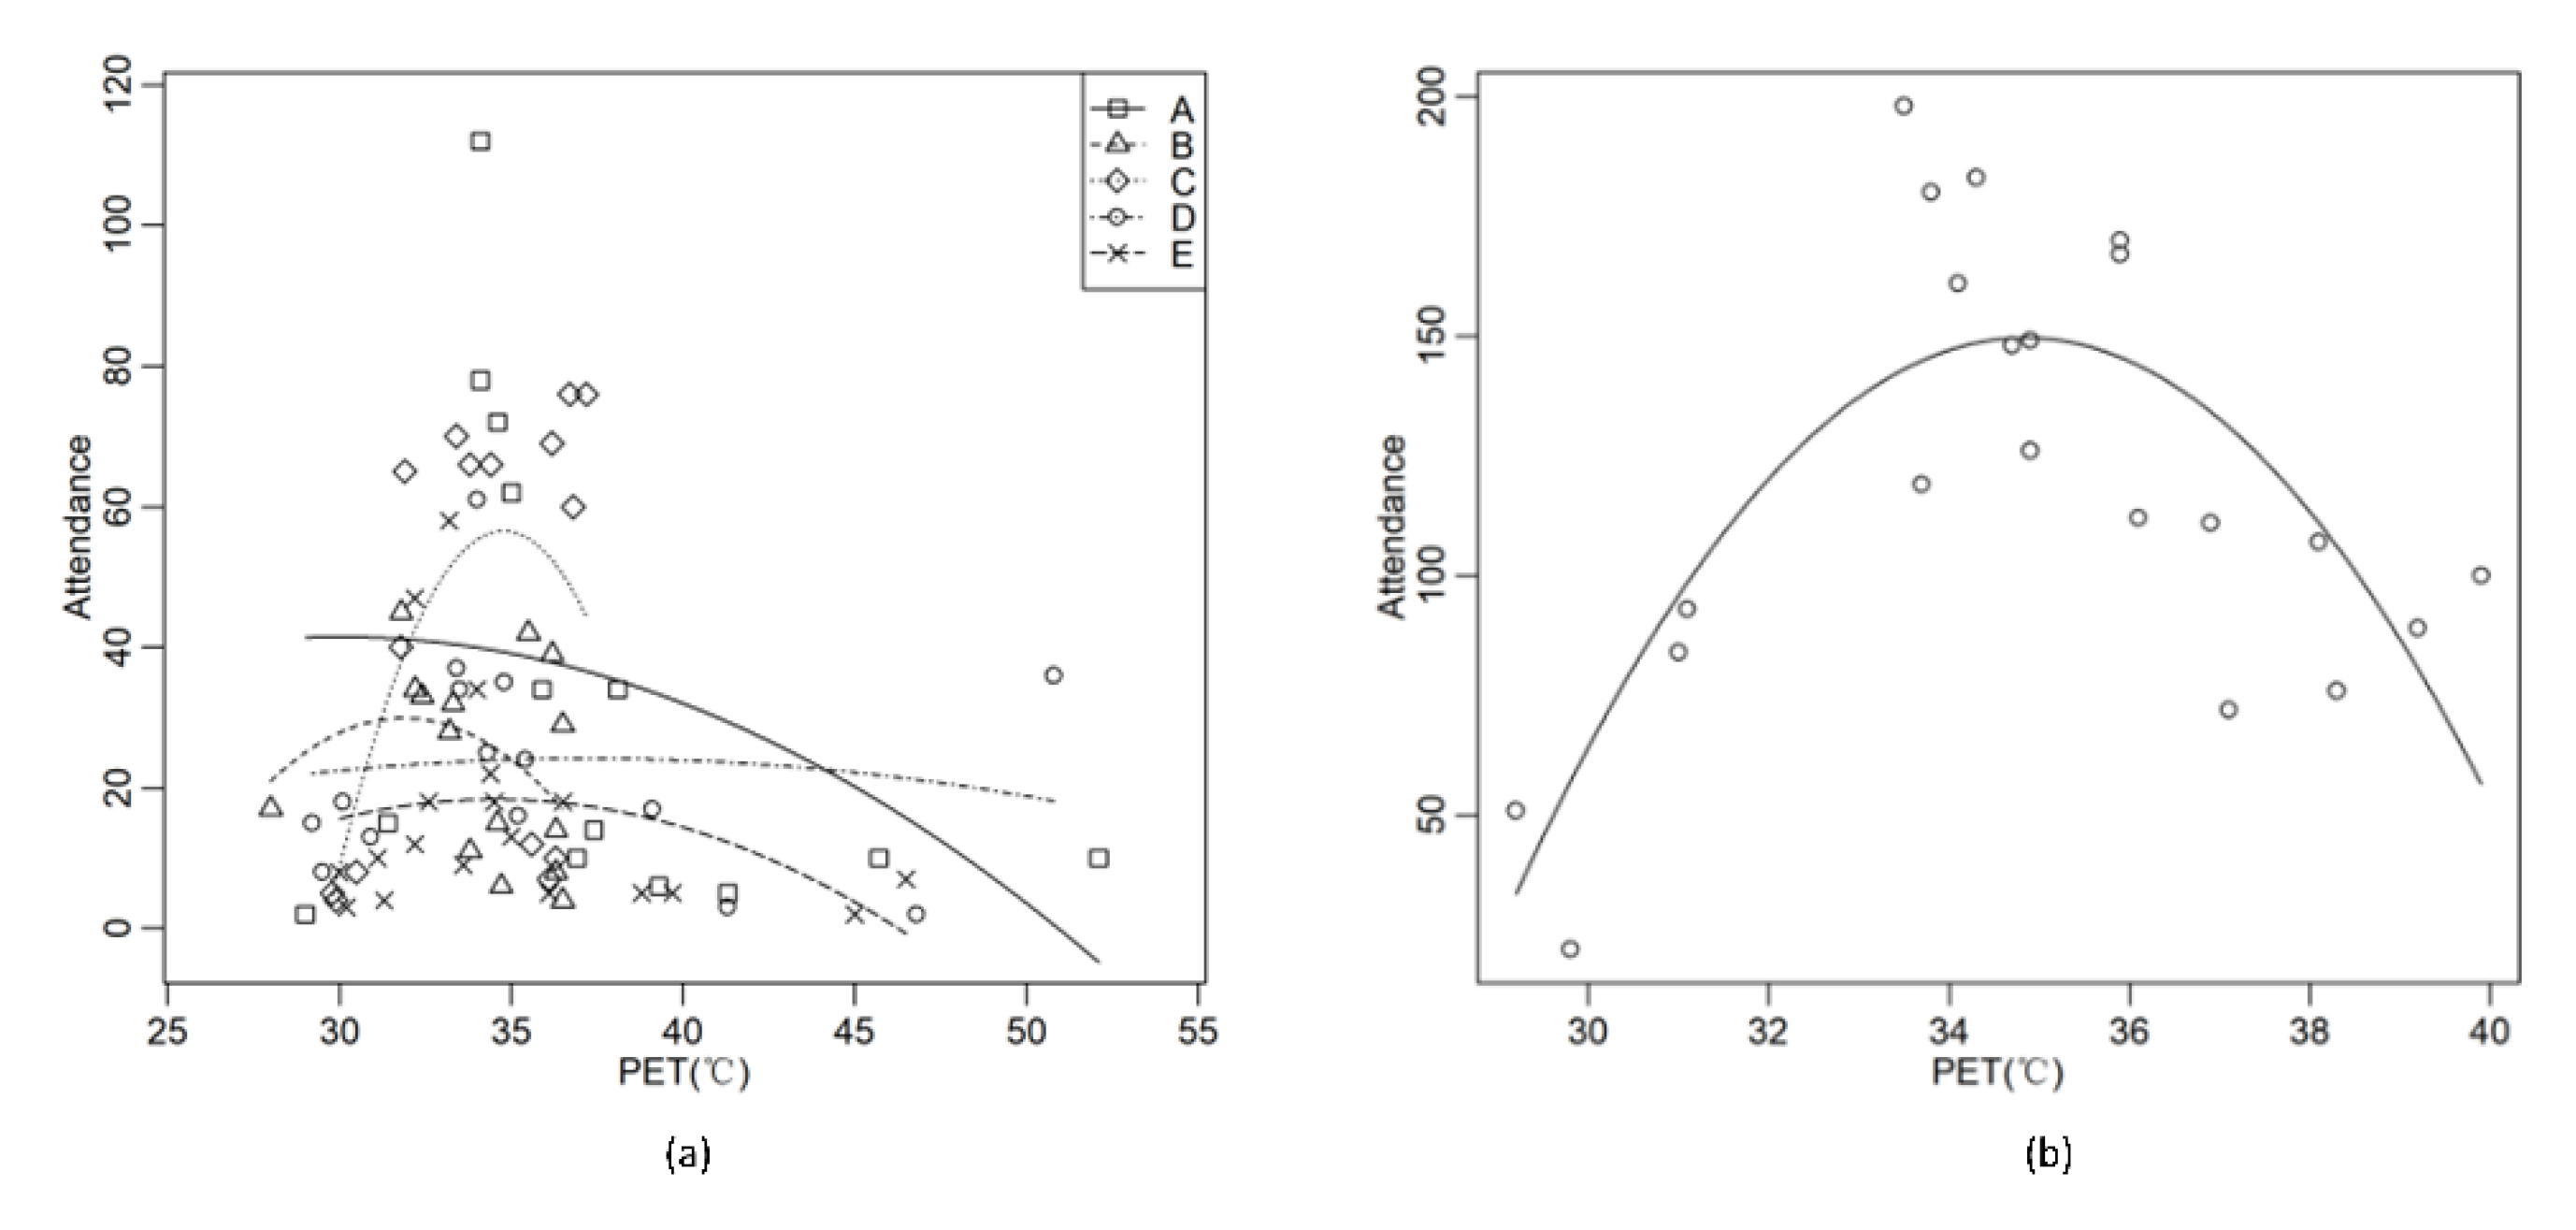
The attendance and PET were collected from the five study areas for the regression analysis, which revealed that the attendance in the five separate spaces was less correlated with the PET. This suggested that the attendance of residents in specific areas was influenced by a variety of factors (
Table 4,
Figure 12a).
When the regression analysis was performed on the total attendance of the activity spaces and the PET, a quadratic correlation was found between the attendance and PET (R
2 = 0.6028) with the maximum attendance observed when the PET was 34.8 °C. Attendance was higher between 8–10 a.m. and after 6 p.m. The residents were willing to go out and the thermal environment was more conducive to activity. Overall, there was a consistency between attendance and thermal comfort in these residential areas, which also suggested that subjective perception of the residents to the outdoor thermal environment was reflected in the attendance (
Table 4,
Figure 12b).
4. Discussion
4.1. Summer Outdoor Thermal Comfort Benchmarks for Residential Areas in Subtropical China
4.1.1. Neutral PET (NPET) and Neutral PET Range (NPETR)
According to the above analysis, in summer, the neutral temperature is 26.2 °C and the neutral temperature range is 24.7–27.8 °C in Changsha, a subtropical region. There have been many studies undertaken around the world on thermal comfort in different climatic zones and regions (
Table 5). In general, the NPET is generally higher in hot regions than in cold regions; for example, India (30.8 °C) [
34] versus Harbin (21.5 °C) [
20]. The NPET of Changsha is 26.2 °C compared with 28.5 °C in Chongqing. The low neutral temperature of Changsha can be explained by the following reasons. Firstly, Chongqing is known as one of the four major furnaces in China and is a typical mountainous city with an average elevation of 232 m, with a high relative humidity and a population that has long experienced and is more adapted to hot weather. Secondly, there may be a link to the area where the study was carried out, as the Chongqing study was carried out in an urban park whereas the Changsha study was carried out in a residential area, where residents may have more stringent requirements for the thermal environment of the residential area [
35].
The NPETR in Changsha was relatively narrow compared with Tianjin (11–24 °C) [
36] and Xi’an (12.4–26.9 °C) [
37]. This could be explained by physiological adaptation, defined as the change in a physiological response resulting from repeated exposure to a stimulus, leading to a gradual decrease in the response induced by this exposure. In Tianjin and Xi’an, where there is a large temperature difference, residents are more adapted to the local climate and have a broader range of thermal sensations. In Changsha, the temperature difference was relatively small due to the long summer season and the very hot summer weather. Outdoor thermal comfort is a complex issue, with different cultural practices and thermal histories influencing the thermal sensation of the residents for physiological or psychological reasons.
Subtropical regions have longer summers and residents are under high temperature conditions for a long time and are more eager to be in a lower temperature outdoor thermal environment.
4.1.2. Thermal Acceptability Range
It was found that the 90% acceptable temperature range in summer in Changsha was below 28.5 °C.
Table 6 shows the acceptable temperature range for the outdoor thermal comfort studies from other climate zones. From
Table 6, it can be seen that, compared with the study conducted in Mianyang [
38], the upper limit of the TAR in Changsha was 7.1 °C lower. This may be due to the difference in the subjects of the two studies. The area where the study was conducted in Mianyang was a university campus, where students are more educated and more likely to engage in physical activity and they are more likely to feel hot. These results and comparisons also suggested that there were significant differences in heat tolerance between different groups in different regions. The 80% TAR upper limit in Hong Kong [
18] was much higher than in Changsha, which was related to the high temperature of the region and the thermal history of the residents, even in winter when the average temperature in Hong Kong is above 16 °C. The 80% TAR was also broader than the 90% TAR. Compared with the experiments undertaken in the winter in Harbin [
39], a severe cold region, the TAR in Harbin was above 10.2 °C. This showed more regional characteristics of thermal environmental acceptability in different cities, with people living in hot regions having a higher tolerance to high outdoor temperatures and residents living in severe cold regions having a higher tolerance to cold [
40].
4.1.3. Thermal Comfort PET
In summer, the TCV has a good linear relationship with the PET. The lower the PET, the more comfortable the residents feel. In the summer of our study, the “cool” sensation (TSV = −1.7) was much more comfortable and the thermal comfort PET derived was 24.5 °C, 1.7 °C lower than the NPET. The results of our study showed that NPET were not necessarily the most comfortable temperatures for the residents [
9]. The residents were comfortable at temperatures lower than neutral in the summer. This was consistent with the findings from Mianyang [
38].
4.2. Outdoor Thermal Environment and Space Use
Residential areas are the main space for the activities of residents and reflect their lifestyles. Among the groups that are active in residential areas, residents prefer social activities. Apart from regular exercise groups, more people use the green spaces in residential areas less purposefully and are more susceptible to environmental influences.
The spatial and temporal trends in the distribution of the footfall in our study areas suggested that the thermal environment of the outdoor activity space affected the thermal comfort and space use of the residents [
37,
41,
42,
43]. We found that Spaces B and C had good thermal comfort due to being in the shade of trees and buildings, but had very low attendance in the evening and night. Space A was largely devoid of resident activity during the day, but attendance began to soar after sunset because, during the day, Space A was exposed to direct sunlight without shade and had very poor thermal comfort whereas at night, the open activity spaces, streetlights, and activity facilities of Space A provided a place for residents to socialize. Space D saw an increase in the number of people taking walks after dark and Space E was dominated by parents with small children, with activities mainly taking place in the morning. In addition to thermal comfort, other conditions similar to activity facilities and life patterns can influence attendance and space use [
44,
45].
In summer, residents tend to choose the morning and evening hours to be out and about in shaded areas. Residents take the initiative to balance the relationship between the summer heat and their needs by adjusting their activity times and spaces. By understanding the characteristics of different outdoor activity spaces and microclimates and by identifying the characteristics of spaces that attract residents to use them, this study helps to provide guidance for planners to create spatial environments that are suitable for use by residents in line with the characteristics of the climate, thus increasing the use of outdoor spaces.
4.3. Limitations
Our study has a few limitations. First, due to time limitations, we did not undertake thermal comfort experiments in other seasons other than summer. The thermal sensation of residents is different in winter [
46] or transitional seasons [
47]. In future studies, we will add thermal comfort experiments for other seasons. Secondly, we only chose residential areas as experimental spaces; residents show different thermal sensations and activities in places such as parks [
48] or streets [
49,
50]. In the next study, we will consider more parks, streets, or other open spaces in a comprehensive way to study the thermal comfort of residents.
5. Conclusions
In this study, we used questionnaires, physical measurements, and activity records to investigate the outdoor thermal benchmarks and activities of residents in five open spaces in four residential areas of Changsha in the subtropical region. The following conclusions were drawn.
- (1)
The NPET in Changsha, a subtropical region, is 26.2 °C. The NPETR is 24.7–27.8 °C, the thermal comfort temperature is 24.5 °C, and the 90% acceptable PET is under 28.5 °C.
- (2)
In summer, the total attendance of residents was quadratically correlated with the PET and was influenced by a variety of factors (daily routine, purpose of activity, and thermal environment), often coming out in the morning and evening and in shaded areas. Residents adapted to the outdoor thermal environment and met their activity needs by adjusting their activity time and activity space.
- (3)
Tg and Ta were positively correlated with the TSV of residents and were the main factors influencing the TSV of the residents in summer. Relative humidity was negatively correlated with the TSV and wind speed had essentially no effect on the TSV.
The results of the study have, to a certain extent, filled the research gap on outdoor thermal comfort in a subtropical region and provide guidance for optimizing the design of outdoor public spaces in residential areas for a better outdoor thermal environment.
Author Contributions
Conceptualization, Y.D., D.G. and X.L. (Xiaoma Li); data curation, Y.D., N.T. and Z.C.; formal analysis, Y.D., N.T. and Z.C.; funding acquisition, X.L. (Xiaoma Li) and D.G.; investigation, Y.D., N.T., X.L. (Xinyi Li) and S.C.; methodology, Y.D.; project administration, X.L. (Xiaoma Li) and D.G.; resources, D.G., X.L. (Xiaoma Li), Y.D. and N.T.; software, Z.C., Y.D. and N.T.; supervision, Y.D. and D.G.; validation, Y.D., D.G. and X.L. (Xiaoma Li); visualization, Y.D.; writing—original draft, Y.D.; writing—review and editing, Y.D., D.G. and X.L. (Xiaoma Li). All authors have read and agreed to the published version of the manuscript.
Funding
This research was funded by the National Natural Science Foundation of China (32001161), Hunan Provincial Natural Science Foundation of China (grant number 2021JJ30329), and Postgraduate Scientific Research Innovation Project of Hunan Agricultural University.
Institutional Review Board Statement
Not applicable.
Informed Consent Statement
Not applicable.
Data Availability Statement
Not applicable.
Acknowledgments
We would like to thank our peers who volunteered to help with the experiment and the teachers who provided valuable comments on the article.
Conflicts of Interest
The authors declare no conflict of interest.
References
- Yea, S. Are we prepared for world population implosion? Futures 2004, 36, 583–601. [Google Scholar] [CrossRef]
- National Bureau of Statistics of China. Statistical Communiqué of the People’s Republic of China on the 2020 National Economic and Social Development. Available online: http://www.stats.gov.cn/ (accessed on 10 March 2022).
- Yu, Z.; Yao, Y.; Yang, G.; Wang, X.; Vejre, H. Spatiotemporal patterns and characteristics of remotely sensed region heat islands during the rapid urbanization (1995–2015) of Southern China. Sci. Total Environ. 2019, 674, 242–254. [Google Scholar] [CrossRef] [PubMed]
- Kalogeropoulos, G.; Dimoudi, A.; Toumboulidis, P.; Zoras, S. Urban Heat Island and Thermal Comfort Assessment in a Medium-Sized Mediterranean City. Atmosphere 2022, 13, 1102. [Google Scholar] [CrossRef]
- Bi, P.; Williams, S.; Loughnan, M.; Lloyd, G.; Hansen, A.; Kjellstrom, T.; Dear, K.; Saniotis, A. The Effects of Extreme Heat on Human Mortality and Morbidity in Australia: Implications for Public Health. Asia-Pac. J. Public Health 2011, 23, 27S–36S. [Google Scholar]
- Obradovich, N.; Fowler, J.H. Climate change may alter human physical activity patterns. Nat. Hum. Behav. 2017, 1, 0097. [Google Scholar] [CrossRef]
- Niu, J.; Xiong, J.; Qin, H.; Hu, J.; Deng, J.; Han, G.; Yan, J. Influence of thermal comfort of green spaces on physical activity: Empirical study in an urban park in Chongqing, China. Build. Environ. 2022, 219, 109168. [Google Scholar] [CrossRef]
- Lai, D.; Zhou, C.; Huang, J.; Jiang, Y.; Long, Z.; Chen, Q. Outdoor space quality: A field study in an urban residential community in central China. Energy Build. 2014, 68, 713–720. [Google Scholar] [CrossRef]
- Li, K.; Zhang, Y.; Zhao, L. Outdoor thermal comfort and activities in the urban residential community in a humid subtropical area of China. Energy Build. 2016, 133, 498–511. [Google Scholar] [CrossRef]
- Irvine, K.N.; Warber, S.L.; Devine-Wright, P.; Gaston, K.J. Understanding Urban Green Space as a Health Resource: A Qualitative Comparison of Visit Motivation and Derived Effects among Park Users in Sheffield, UK. Int. J. Environ. Res. Public Health 2013, 10, 417–442. [Google Scholar] [CrossRef]
- Abraham, A.; Sommerhalder, K.; Abel, T. Landscape and well-being: A scoping study on the health-promoting impact of outdoor environments. Int. J. Public Health 2010, 55, 59–69. [Google Scholar] [CrossRef]
- Huang, H.; Jie, P. Research on the Characteristics of High-Temperature Heat Waves and Outdoor Thermal Comfort: A Typical Space in Chongqing Yuzhong District as an Example. Buildings 2022, 12, 625. [Google Scholar] [CrossRef]
- Aghamohammadi, N.; Fong, C.S.; Mohd Idrus, M.H.; Ramakreshnan, L.; Haque, U. Outdoor thermal comfort and somatic symptoms among students in a tropical city. Sustain. Cities Soc. 2021, 72, 103015. [Google Scholar] [CrossRef]
- Ali, S.B.; Patnaik, S. Thermal comfort in urban open spaces: Objective assessment and subjective perception study in tropical city of Bhopal, India. Urban Clim. 2018, 24, 954–967. [Google Scholar] [CrossRef]
- Acero, J.A.; Koh, E.J.K.; Pignatta, G.; Norford, L.K. Clustering weather types for urban outdoor thermal comfort evaluation in a tropical area. Theor. Appl. Climatol. 2019, 139, 659–675. [Google Scholar] [CrossRef]
- Li, K.; Xia, T.; Li, W. Evaluation of Subjective Feelings of Outdoor Thermal Comfort in Residential Areas: A Case Study of Wuhan. Buildings 2021, 11, 389. [Google Scholar] [CrossRef]
- Wang, Y.; Ni, Z.; Peng, Y.; Xia, B. Local variation of outdoor thermal comfort in different urban green spaces in Guangzhou, a subtropical city in South China. Urban For. Urban Green. 2018, 32, 99–112. [Google Scholar] [CrossRef]
- Cheung, P.K.; Jim, C.Y. Subjective outdoor thermal comfort and urban green space usage in humid-subtropical Hong Kong. Energy Build. 2018, 173, 150–162. [Google Scholar] [CrossRef]
- Mayer, H.; Holst, J.; Dostal, P.; Imbery, F.; Schindler, D. Human thermal comfort in summer within an urban street canyon in Central Europe. Meteorol. Z. 2008, 17, 241–250. [Google Scholar] [CrossRef]
- Yin, Q.; Cao, Y.; Sun, C. Research on outdoor thermal comfort of high-density urban center in severe cold area. Build. Environ. 2021, 200, 107938. [Google Scholar] [CrossRef]
- Chen, X.; Xue, P.; Liu, L.; Gao, L.; Liu, J. Outdoor thermal comfort and adaptation in severe cold area: A longitudinal survey in Harbin, China. Build. Environ. 2018, 143, 548–560. [Google Scholar] [CrossRef]
- Yang, B.; Olofsson, T.; Nair, G.; Kabanshi, A. Outdoor thermal comfort under subarctic climate of north Sweden—A pilot study in Umeå. Sustain. Cities Soc. 2017, 28, 387–397. [Google Scholar] [CrossRef]
- Chow, W.T.L.; Akbar, S.N.A.B.A.; Heng, S.L.; Roth, M. Assessment of measured and perceived microclimates within a tropical urban forest. Urban For. Urban Green. 2016, 16, 62–75. [Google Scholar] [CrossRef]
- Zhao, L.; Zhou, X.; Li, L.; He, S.; Chen, R. Study on outdoor thermal comfort on a campus in a subtropical urban area in summer. Sustain. Cities Soc. 2016, 22, 164–170. [Google Scholar] [CrossRef]
- Makaremi, N.; Salleh, E.; Jaafar, M.Z.; GhaffarianHoseini, A. Thermal comfort conditions of shaded outdoor spaces in hot and humid climate of Malaysia. Build. Environ. 2012, 48, 7–14. [Google Scholar] [CrossRef]
- Fong, C.S.; Aghamohammadi, N.; Ramakreshnan, L.; Sulaiman, N.M.; Mohammadi, P. Holistic recommendations for future outdoor thermal comfort assessment in tropical Southeast Asia: A critical appraisal. Sustain. Cities Soc. 2019, 46, 101428. [Google Scholar] [CrossRef]
- Acero, J.A.; Koh, E.J.Y.; Li, X.; Ruefenacht, L.A.; Pignatta, G.; Norford, L.K. Thermal impact of the orientation and height of vertical greenery on pedestrians in a tropical area. Build. Simul. 2019, 12, 973–984. [Google Scholar] [CrossRef]
- Hunan Province Bureau of Statistics. Hunan Statistical Yearbook. Available online: http://tjj.hunan.gov.cn/tjsj/tjnj/ (accessed on 18 April 2022).
- Ergonomics, I.C.T.-o. Thermal Environments: Instruments and Methods for Measuring Physical Quantities; International Organization for Standardization: Geneva, Switzerland, 1985. [Google Scholar]
- Hoppe, P. The physiological equivalent temperature—A universal index for the biometeorological assessment of the thermal environment. Int. J. Biometeorol. 1999, 43, 71–75. [Google Scholar] [CrossRef]
- Matzarakis, A.; Rutz, F.; Mayer, H. Modelling radiation fluxes in simple and complex environments: Basics of the RayMan model. Int. J. Biometeorol. 2010, 54, 131–139. [Google Scholar] [CrossRef]
- Lin, T.-P.; Matzarakis, A.; Hwang, R.-L. Shading effect on long-term outdoor thermal comfort. Build. Environ. 2010, 45, 213–221. [Google Scholar] [CrossRef]
- Cohen, P.; Potchter, O.; Matzarakis, A. Human thermal perception of Coastal Mediterranean outdoor urban environments. Appl. Geogr. 2013, 37, 1–10. [Google Scholar] [CrossRef]
- Kumar, P.; Sharma, A. Assessing outdoor thermal comfort conditions at an urban park during summer in the hot semi-arid region of India. Mater. Today Proc. 2022, 61, 356–369. [Google Scholar] [CrossRef]
- Qin, H.; Cheng, X.; Han, G.; Wang, Y.; Deng, J.; Yang, Y. How thermal conditions affect the spatial-temporal distribution of visitors in urban parks: A case study in Chongqing, China. Urban For. Urban Green. 2021, 66, 127393. [Google Scholar] [CrossRef]
- Lai, D.; Guo, D.; Hou, Y.; Lin, C.; Chen, Q. Studies of outdoor thermal comfort in northern China. Build. Environ. 2014, 77, 110–118. [Google Scholar] [CrossRef]
- Mi, J.; Hong, B.; Zhang, T.; Huang, B.; Niu, J. Outdoor thermal benchmarks and their application to climate-responsive designs of residential open spaces in a cold region of China. Build. Environ. 2020, 169, 106592. [Google Scholar] [CrossRef]
- Huang, Z.; Cheng, B.; Gou, Z.; Zhang, F. Outdoor thermal comfort and adaptive behaviors in a university campus in China’s hot summer-cold winter climate region. Build. Environ. 2019, 165, 106414. [Google Scholar] [CrossRef]
- Leng, H.; Liang, S.; Yuan, Q. Outdoor thermal comfort and adaptive behaviors in the residential public open spaces of winter cities during the marginal season. Int. J. Biometeorol. 2020, 64, 217–229. [Google Scholar] [CrossRef]
- Elnabawi, M.; Hamza, N. Outdoor Thermal Comfort: Coupling Microclimatic Parameters with Subjective Thermal Assessment to Design Urban Performative Spaces. Buildings 2020, 10, 238. [Google Scholar] [CrossRef]
- Huang, J.; Zhou, C.; Zhuo, Y.; Xu, L.; Jiang, Y. Outdoor thermal environments and activities in open space: An experiment study in humid subtropical climates. Build. Environ. 2016, 103, 238–249. [Google Scholar] [CrossRef]
- Lin, T.-P. Thermal perception, adaptation and attendance in a public square in hot and humid regions. Build. Environ. 2009, 44, 2017–2026. [Google Scholar] [CrossRef]
- Watanabe, S.; Ishii, J. Effect of outdoor thermal environment on pedestrians’ behavior selecting a shaded area in a humid subtropical region. Build. Environ. 2016, 95, 32–41. [Google Scholar] [CrossRef]
- Li, J.; Liu, N. The perception, optimization strategies and prospects of outdoor thermal comfort in China: A review. Build. Environ. 2020, 170, 106614. [Google Scholar] [CrossRef]
- Lai, D.; Chen, B.; Liu, K. Quantification of the influence of thermal comfort and life patterns on outdoor space activities. Build. Simul. 2020, 13, 113–125. [Google Scholar] [CrossRef]
- Xu, M.; Hong, B.; Mi, J.; Yan, S. Outdoor thermal comfort in an urban park during winter in cold regions of China. Sustain. Cities Soc. 2018, 43, 208–220. [Google Scholar] [CrossRef]
- Guo, F.; Wang, Z.; Dong, J.; Zhang, H.; Lu, X.; Lau, S.S.Y.; Miao, Y. Spatial Differences in Outdoor Thermal Comfort during the Transition Season in Cold Regions of China. Buildings 2022, 12, 720. [Google Scholar] [CrossRef]
- Wei, D.; Yang, L.; Bao, Z.; Lu, Y.; Yang, H. Variations in outdoor thermal comfort in an urban park in the hot-summer and cold-winter region of China. Sustain. Cities Soc. 2022, 77, 103535. [Google Scholar] [CrossRef]
- Deevi, B.; Chundeli, F.A. Quantitative outdoor thermal comfort assessment of street: A case in a warm and humid climate of India. Urban Clim. 2020, 34, 100718. [Google Scholar] [CrossRef]
- Klemm, W.; Heusinkveld, B.G.; Lenzholzer, S.; van Hove, B. Street greenery and its physical and psychological impact on thermal comfort. Landsc. Urban Plan. 2015, 138, 87–98. [Google Scholar] [CrossRef]
Figure 1.
Location of the study areas.
Figure 1.
Location of the study areas.
Figure 2.
Differences in meteorological parameters by spaces (The capital letters indicate the experimental spaces; Different Lowercase letters indicate significant difference (p ≤ 0.05)).
Figure 2.
Differences in meteorological parameters by spaces (The capital letters indicate the experimental spaces; Different Lowercase letters indicate significant difference (p ≤ 0.05)).
Figure 3.
Thermal sensation vote.
Figure 3.
Thermal sensation vote.
Figure 4.
Thermal comfort vote.
Figure 4.
Thermal comfort vote.
Figure 5.
Correlation between TSV and TCV.
Figure 5.
Correlation between TSV and TCV.
Figure 6.
Thermal adaptive behaviors.
Figure 6.
Thermal adaptive behaviors.
Figure 7.
Correlation between PET and mean TSV.
Figure 7.
Correlation between PET and mean TSV.
Figure 8.
Relationship between the thermal unacceptable range and PET.
Figure 8.
Relationship between the thermal unacceptable range and PET.
Figure 9.
Correlation between PET and mean TCV.
Figure 9.
Correlation between PET and mean TCV.
Figure 10.
Physical factors affecting TSV (blue represents positive correlations, red represents negative correlations. Numbers indicate correlation coefficients. The color shade and circle size represent the strength of the correlation).
Figure 10.
Physical factors affecting TSV (blue represents positive correlations, red represents negative correlations. Numbers indicate correlation coefficients. The color shade and circle size represent the strength of the correlation).
Figure 11.
Spatial and temporal distribution of inhabitants.
Figure 11.
Spatial and temporal distribution of inhabitants.
Figure 12.
Relationship between attendance and PET. (The relationship between the respective attendance and PET for each of the five spaces (a), The relationship between total attendance and PET (b)).
Figure 12.
Relationship between attendance and PET. (The relationship between the respective attendance and PET for each of the five spaces (a), The relationship between total attendance and PET (b)).
Table 1.
Description of the study areas.
Table 2.
Details of the equipment used to measure microclimate.
Table 2.
Details of the equipment used to measure microclimate.
| Instrumentation | Parameter | Range | Accuracy |
|---|
| Kestrel 5400 | Air temperature | −29 °C~70 °C | 0.5 °C |
| Relative humidity | 10%~90% | ±2.0% |
| Wind speed | 0.6~40 m/s | ±3.0% |
| Globe temperature | −29 °C~60 °C | 1.4 °C |
| TES-1333R | Solar radiation | 0~2000 W/m2 | ±5% |
Table 3.
Respondent attributes.
Table 3.
Respondent attributes.
| Gender | Age | Type of Activity |
|---|
| Men | Women | <12 | 13–20 | 21–59 | >60 | sitting | Standing | Walking | Caring | Exercising |
| 42.2% | 57.8% | 13.4% | 5.7% | 48.9% | 32% | 29% | 4.7% | 22.9% | 16.6% | 26.8% |
Table 4.
Regression equation for PET and attendance.
Table 4.
Regression equation for PET and attendance.
| Space | Regression Equation | R2 |
|---|
| A | y = −0.0948x2 + 5.6886x − 43.88 | R2 = 0.1321 |
| B | y = −0.5992x2 + 38.175x − 578.14 | R2 = 0.1406 |
| C | y = −2.0924x2 + 145.52x − 2473.7 | R2 = 0.3389 |
| D | y = −0.0328x2 + 2.4425x − 21.288 | R2 = 0.0105 |
| E | y = −0.1338x2 + 9.244x − 141.31 | R2 = 0.1134 |
| Total | y = −3.6396x2 + 253.65x − 4269.6 | R2 = 0.6028 |
Table 5.
NPET and NPETR in other outdoor thermal comfort studies.
Table 5.
NPET and NPETR in other outdoor thermal comfort studies.
| Location | Climatic Zone | Season | NPET | NPETR | References |
|---|
| Xi’an, China | Cwa | Winter, summer, spring | 19.7 °C | 12.4–26.9 °C | [37] |
| Safidon, India | Bsh | Summer | 30.8 °C | 24.04–37.5 °C | [34] |
| Harbin, China | Dwa | Summer | 21.5 °C | 12.99–19.89 °C | [20] |
| Chongqing, China | Cfa | Summer | 28.45 °C | 23.38–33.52 °C | [35] |
| Tianjing, China | Dwa | Cold, hot, and shoulder season | - | 11–24 °C | [36] |
Table 6.
Thermal acceptability range from other OTC studies.
Table 6.
Thermal acceptability range from other OTC studies.
| Location | Climatic Zone | Season | Content | TAR | Range | References |
|---|
| Mianyang, China | Dwa | Summer | Campus | <35.6 °C | 90% | [38] |
| Hong Kong, China | Cwa | Summer | Park | 21.3–39.5 °C | 80% | [18] |
| Harbin, China | Dwa | Winter | Residential | >10.2 °C | 90% | [39] |
| Publisher’s Note: MDPI stays neutral with regard to jurisdictional claims in published maps and institutional affiliations. |
© 2022 by the authors. Licensee MDPI, Basel, Switzerland. This article is an open access article distributed under the terms and conditions of the Creative Commons Attribution (CC BY) license (https://creativecommons.org/licenses/by/4.0/).


