1. Introduction
Rapid urbanization has accelerated the process of urban heat island effects, and the resulting urban high temperatures will inherently increase energy consumption, as well as the emissions of pollutants and greenhouse gases during the summer. In turn, these actions threaten the ecological environment and sustainable development of cities, worsening urban thermal environment problems [
1,
2,
3]. In a fundamental study by Lee et al., prolonged exposure to heat impacts significantly contributed to human discomfort and health problems, promoting heat-related illness [
4].The use of outdoor space is highly dependent on climatic conditions. Uncomfortable outdoor spaces may hinder participation in outdoor activities and increase indoor energy consumption. Therefore, it is necessary to understand and adopt appropriate strategies to provide suitable thermal conditions for urban residents [
5].
University campuses are the primary locations for students to study, live, and engage in activities; however, owing to the uncertainty and rapid transmission of COVID-19, campuses have experienced prolonged closures, severely restricting daily life and outdoor activities. Accordingly, college students have experienced frequent emotional crises [
6,
7]. In particular, campus outdoor spaces are an important part of the human living environment, and have positive impacts on student health, directly affecting the quality of campus environments and human thermal comfort. Moreover, when comparing hot summers and cold winter days, higher Tas in the summer more severely limits students’ outdoor activities; therefore, hot outdoor campus environment areas are worth exploring in more detail [
8], yet the importance of creating a suitable microclimate environment has largely been neglected during the design, construction, and use of campuses. Further, the lack of comprehensive and systematic research on human thermal comfort across outdoor campus spaces makes it difficult to effectively guide such practices. Therefore, it is important to study outdoor microclimates and thermal comfort for improving campus environmental quality.
Thermal comfort has been defined as “the psychological state of being satisfied with the thermal environment and assessed through subjective evaluations” [
9]. Accordingly, it represents an essential component of a healthy and efficient lifestyle [
10]. Recently, studies addressing strategies for improving OTC have been conducted by international scholars, and they primarily include improving urban space form (building layout) [
11,
12,
13], plant selection, planting methods [
14,
15,
16,
17], and choosing “cool” underlying surface materials to improve thermal environments [
18,
19].
The main factors affecting urban thermal comfort were the city size, street height-to-width ratio, and building orientation. Din et al. [
20] confirmed that locations surrounded by buildings had lower ambient temperatures, and were the most suitable for habitation. Taleghani et al. [
21] simulated courtyards in the Netherlands via ENVI-met, and concluded that the N–S direction had the shortest duration of solar radiation for hotter areas, while the E–W direction had the longest duration for courtyards, and was most suitable for cooler areas. Afshar et al. [
22] proposed that a proper planting design is an important step in improving thermal comfort within urban parks. Alternatively, Milosevic et al. [
23] stressed the crucial influence of tree location and canopy shape on OTC, whereas Morakinyo et al. [
24] quantified the daily and seasonal microclimate behavior of various tree species with different planting designs (either individuals or in clusters), with their results indicating a possible improvement in OTC. Altunkasa [
25] simulated various plant designs to improve thermal comfort at the School of Architecture, Çukurova University, Turkey. Taleghani et al. [
26] also assessed thermal comfort within a university campus, and concluded that the position and orientation of high-albedo materials can significantly affect pedestrians’ thermal comfort; in particular, cooler pavements maintain lower Tas, and are thus beneficial for pedestrians. Cortesao et al. [
27] similarly highlighted the relevance of “cool” paving materials and vegetation in a retrofit program for urban public spaces, whereas Wang et al. [
28] examined two permeable paving materials, and demonstrated that water sprinkling can boost thermal comfort above the pavement.
Relevant scholars have carried out some studies on campus OTC. Antoniadis et al. [
29] conducted field microclimate measurements at two Greek universities and found that solar radiation was the main factor causing heat perception and heat stress, followed by Ws, vegetation, building materials, and building orientation. Ghaffarianhoseini et al. [
30] used ENVI-met numerical simulations to evaluate thermal comfort conditions in the Kuala Lumpur campus and concluded that the spaces shaded by trees and adjacent buildings provided good thermal comfort conditions. Antoniadis et al. [
31] studied the thermal environments of schoolyards, and proposed that increasing vegetation coverage could effectively improve their outdoor microclimate environment. Elsewhere, Zaki et al. [
32] conducted a study on the building layout of an urban university in Malaysia, and concluded that shading of buildings directly affected outdoor Ta; thus, the outdoor thermal environment can be improved by adopting effective building morphology. Wu et al. [
33] analyzed different forms of tree planting and concluded that alternative spatial arrangements of plants have different effects on the interception of short-wave radiation, leading to temperature changes. Lin studied [
34] a university campus in central Taiwan and suggested that the thermal requirements of residents, as well as the characteristics of the local climate and environment, should be considered when creating shaded outdoor areas. Zhang et al. [
35] developed an integrated design approach to systematically evaluate and optimize design parameters for schools, suggesting that tree planting was the most effective strategy for a typical school in northern China.
Based on the research results, the study of microclimate and thermal comfort with ENVI-met has become an important topic in the field of landscape architecture. Most of the existing research on campus microclimate is classified by landscape elements, such as grass, squares, tree-shaded spaces, watersides, etc., and does not comprehensively consider the superposition effect caused by landscape elements and the different thermal sensations caused by the different proportions of each element. This study divides campus space into four categories, which cover different landscape elements and occupy different proportions, which can more fully illustrate the impact of landscape elements and layout on human thermal comfort. In this study conducted at the southern campus of AHJZU, PET was used as the thermal comfort evaluation index to analyze the effects of four outdoor spaces on human thermal comfort via numerical simulation techniques. Accordingly, the present study aimed to consider the effects of building heights, building modes, plants, and cushion surface material to explore the different levels of thermal comfort across each of the outdoor space forms. This information can help teachers and students more engage with these outdoor areas on campus at optimal times, as well as avoid the worst thermal comfort in time and space (e.g., in the summer, using fully enclosed area simulation renovation design to effectively improve the thermal comfort environment). This will in turn improve site utilization, in addition to saving time and cost of later renovation. Thus, this study provides a reference for improving campus thermal comfort in hot summer and cold winter areas.
The main objectives of this research were: (1) to simulate different outdoor space forms on campus (fully open, semi-open, semi-enclosed, and fully enclosed spaces) using ENVI-met, (2) to explore the varying effects of different outdoor spaces on human thermal comfort on campus using PET, and (3) to compare the spatial and temporal distribution of thermal comfort in various outdoor spaces in summer. An improvement strategy is recommended to enhance thermal comfort.
3. Results and Discussion
3.1. Spatiotemporal Distribution of Thermal Comfort in Fully Open Space
A fully open space (A) was represented by a round square south of the main teaching building (
Figure 7). It is a stilt building approximately 32 m high, with five-story buildings existing along its southwest and southeast sides. The central area is mainly paved with sesame gray granite, which maintains high reflectivity, while the square is surrounded by
Cinnamomum camphora (Linn) Presl.,
Osmanthus fragrans (Thunb.) Lour,
Loropetalum chinense var. rubrum and lawns. The central area is planted with
Malus micromalus and
Pyracantha fortuneana (Maxim.) Li, while the southwest side is planted with
Osmanthus fragrans (Thunb.) Lour,
Cerasus sp. and
Photinia x fraseri Dress.
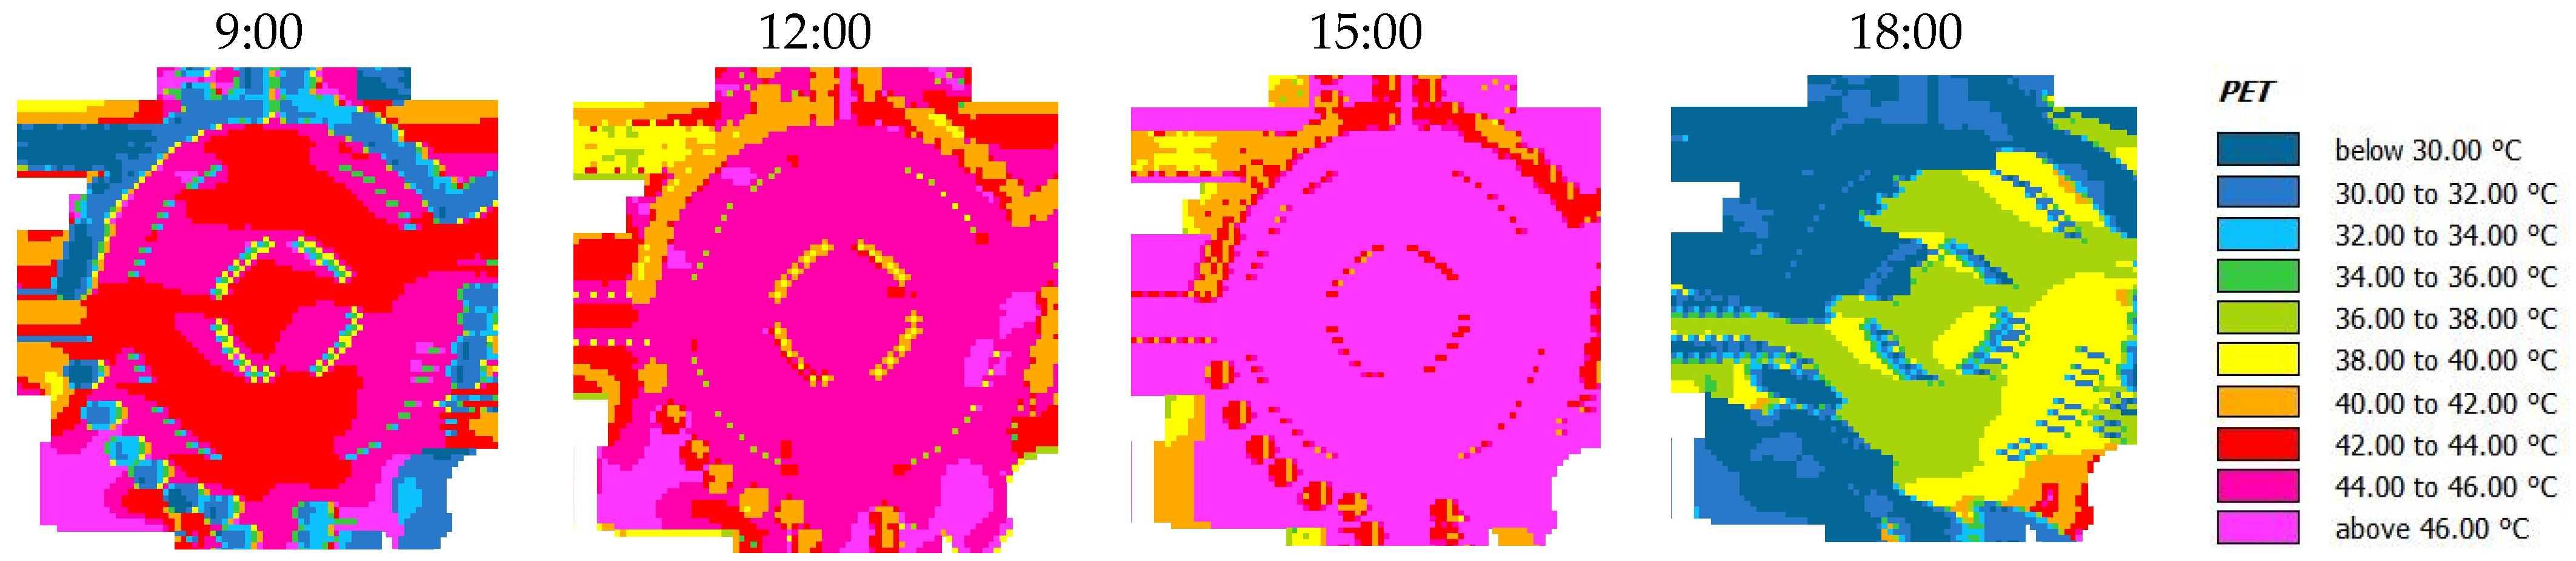
At 09:00, owing to the impacts of Ws and plants, a lower PET value was found in the area shaded by camphor trees, because not only is the solar radiation being weakened by tree canopies, but a high Ws exists at the corner of the building. The highest value was found in the southwest corner of the site, in the area adjacent to buildings, producing a thermal sensation between “slightly warm” and “very hot”. At 12:00, as the solar altitude angle increased, and the shadows of the buildings and plants decreased, the PET value gradually increased as well, with most of the square having a PET value of 44–45 °C, indicating a thermal sensation of “hot”. The lowest PET value was measured under the
Osmanthus fragrans (Thunb.) Lour in the square (yellow area in
Table 6), where the Ta and Tmrt were both low, as the lawn underneath this vegetation supplied cooling and humidifying effects, while the long-wave radiation at the lawn was weaker than at the paved area. At 15:00, the overall PET values in the square increased again, and the lowest PET value was measured in the tree shade, while the highest PET value was found at the entrance of the library (≤62 °C, extremely poor thermal comfort environment). At 18:00, the PET value in the square area ranged from 28 °C to 40 °C, and owing to the influences of the buildings along the northwest side, the PET values were the lowest in the northwest area of the square, and highest in the southeast area of the square (approximately 39 °C, “hot” thermal sensation) (
Figure 8).
3.2. Spatiotemporal Distribution of Thermal Comfort in Semi-Open Space
Semi-open spaces are mainly L-shaped or parallel to each other, and most are located at the entrance plaza of academic buildings, or in the courtyard between dormitory buildings. Four semi-open spaces on the campus were selected for the numerical simulation and study, three of which were L-shaped and located at the entrances of academic buildings, and one of which was an area between two dorms.
B1: The science and chemistry laboratory building complex includes 4- and 5-story buildings. The entrance plaza is located at the southeastern corner of the building, as shown at point 1. Landscape elements include flamed surface plaza tiles, trees, and low shrubs. Cinnamomum camphora (Linn) Presl and Prunus Cerasifera Ehrhar f. atropurpurea (Jacq.) Rehd were the main trees, while Buxus sinica (Rehd. et Wils.) Cheng and Loropetalum chinense var. rubrum were the main shrubs.
B2: The mechanical and electrical building complex includes 2- and 5-story buildings. The entrance plaza is located at the northeast corner of the building complex, as shown in point 2. The landscape elements include concrete red brick, trees, low shrubs, lawns, Cinnamomum camphora (Linn) Presl, Ginkgo biloba L., Osmanthus fragrans (Thunb.) Lour, and shrubs, such as Platycladus orientalis, Buxus sinica (Rehd. et Wils.) Cheng, and Photinia x fraseri Dress.
B3: The Yifu Building is 5 stories tall, and the entrance plaza is located at its southwest corner (point 3). The landscape elements are stone, trees, low shrubs, and lawns, such as
Sapindus,
Ginkgo biloba L.,
Cinnamomum camphora (Linn) Presl,
Platanus acerifolia and
Cerasus sp., while the shrubs are primarily
Buxus sinica (Rehd. et Wils.) Cheng. The lawn area is relatively large (
Figure 9).
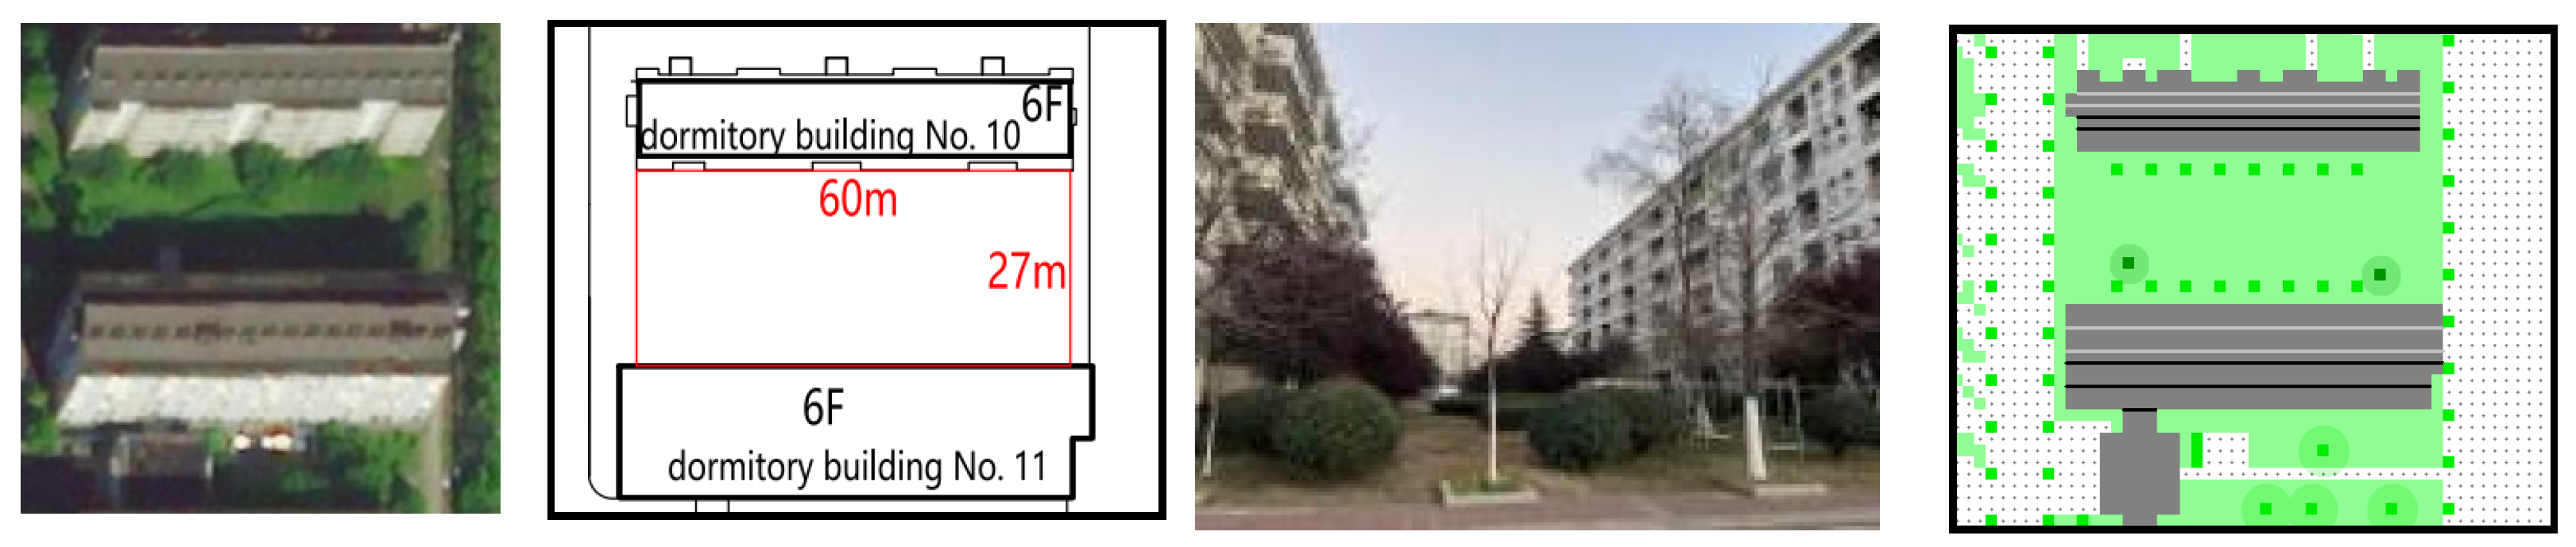
B4: The semi-open space parallel to the two buildings was mostly located in the semi-open dormitory area enclosed by dormitory buildings 10 and 11. It has a length of ~60 m, and a width of ~27 m, without hard pavement. The main landscape elements are lawns and trees, mainly including
Pinus,
Sapium sebiferum (L.)
Roxb,
Prunus Cerasifera Ehrhar f. atropurpurea (Jacq.) Rehd, and
Photinia x fraseri Dress (
Figure 10).
The thermal comfort of semi-open spaces at pedestrian heights across the four time periods were compared and analyzed. As shown in
Figure 11 (where the white area represents the buildings), PET distribution at different time points varied owing to the differences in the positional relation between the semi-open space, the adjacent building, plant planting, and paving.
At 09:00, the highest PET values were found in a small area to the east of building B1, as it was perpendicular to the prevailing wind direction, whereas along the east side of the building, a high-pressure area formed against the wind, reducing its speed, and motionless people would not feel the wind. Area B1 is mainly covered with hard paving materials and showed higher Tmrt and PET values. The PET values were lower in area B2, which was shaded by a connecting corridor of buildings and trees. Area B3 was not shaded by buildings or trees, and had higher PET values, along with the worst overall thermal comfort. Area B4 is underlain by lawns, while the site is also planted with trees. Further, the Ws between the two buildings is high, resulting in a lower overall PET value. At 12:00, the PET values under the trees were the lowest, whereas most places in areas B1, B2, and B3 had PET values between 44 and 47 °C. B2 and B3 had the highest PET values in two areas adjacent to the buildings that were located on the eastern windward side of a B2, and west windward side of B3, where a high-pressure area was formed, reducing its speed. Therefore, the Ws in these two areas were low, and the resulting PET values were the highest. At that time, the underlying surface of area B4 was lawns, while shrubs and trees were planted, producing strong evaporative cooling effects. The overall Tmrt was the lowest here, and the thermal comfort environment in area B4 was improved. At 15:00, the PET value reached its peak, as Tas and solar radiation increased. The lowest values of PET were distributed in the shadows of B1 and B2 squares, as well as in the shadows of B1, B2, and B4 trees. The highest PET values were also observed in areas with low Ws, such as the leeward sides of B2, B3, and B4. At 18:00 as the sun set to the northwest, the solar elevation angle decreased, and PET values gradually decreased as well. PET values were below 30 °C in most areas, and the overall thermal comfort environment was good (
Figure 11).
3.3. Spatiotemporal Distribution of Thermal Comfort in Semi-Enclosed Spaces
Semi-enclosed spaces(U-shaped) are enclosed on three sides, their connections to the outside vary with the orientations of courtyards, and they often have a stronger sense of enclosure and centrality than semi-open spaces. These usually refer to the courtyard spaces of a building. A semi-enclosed area between the courtyard of a science and chemistry laboratory building, and a dormitory building were chosen for the thermal comfort study, and its openings were oriented in opposite directions.
C1: The courtyard of the Science and Chemistry Building is a semi-enclosed space in the teaching building area. It is about 54.5 m long and 23 m wide. The height of the building on the north and south sides is approximately 20 m, with a 4-story building on the east side, along with a 5-story corridor. The courtyard is rectangular, and the main landscape elements are trees, globe-shaped shrubs, lawns, and pavement. The trees are planted freely, such as
Michelia figo (Lour.) Spreng,
Osmanthus fragrans (Thunb.) Lour,
Cinnamomum camphora (Linn) Presl and
Photinia x fraseri Dress. The hard paving used square flamed surface tiles (
Figure 12).
C2: The courtyard between dormitory buildings No. 11 and No. 12 is also semi-enclosed. Located on the east side of the building, it is ~42 m long and 21 m wide. The buildings on the north and south sides are approximately 20 m high, and there is a two-story building along the west side. The main landscape elements are trees and lawns, with the former including
Cinnamomum camphora (Linn) Presl,
Osmanthus fragrans (Thunb.) Lour and
Photinia x fraseri Dress, which were planted freely (
Figure 13).
Figure 14 shows that the spatiotemporal distributions of the thermal comfort in C1 and C2 were similar. At 09:00, the lowest PET values in area C1 were found in the left corridor and under the shade of trees, whereas for area C2, the lowest values were observed in the tree shade. At 12:00, the PET values under the trees in C1 and C2 were low, and the thermal sensation was “warm”. Further, the PET values in the lawn were also low. The highest PET value areas were mostly those covered with hard paving materials, with PET values ranging from 45 °C to 47 °C. At 15:00, the overall PET values were high in the study areas, mainly behind buildings and plants with low wind velocities. In C1, the lowest PET values were found on the north side of the site, where shrubs and trees were planted with low Tmrt. Comparatively, the PET values in the building and tree shade of C2 were low (~35 °C). At 18:00, all PET values were below 32 °C in area C2, while they remained high in parts of C1’s central area (38–41 °C).
3.4. Spatiotemporal Distribution of Thermal Comfort in Fully Enclosed Spaces
Fully enclosed spaces are enclosed by buildings on four sides, and the sense of centrality, closure, and privacy of the courtyard is very strong. The courtyards of the Logistics Complex (D1) and the Yifu Building (D2) were selected for this study. The sites are both courtyard spaces within buildings, but the building heights, as well as their forms of enclosure differ.
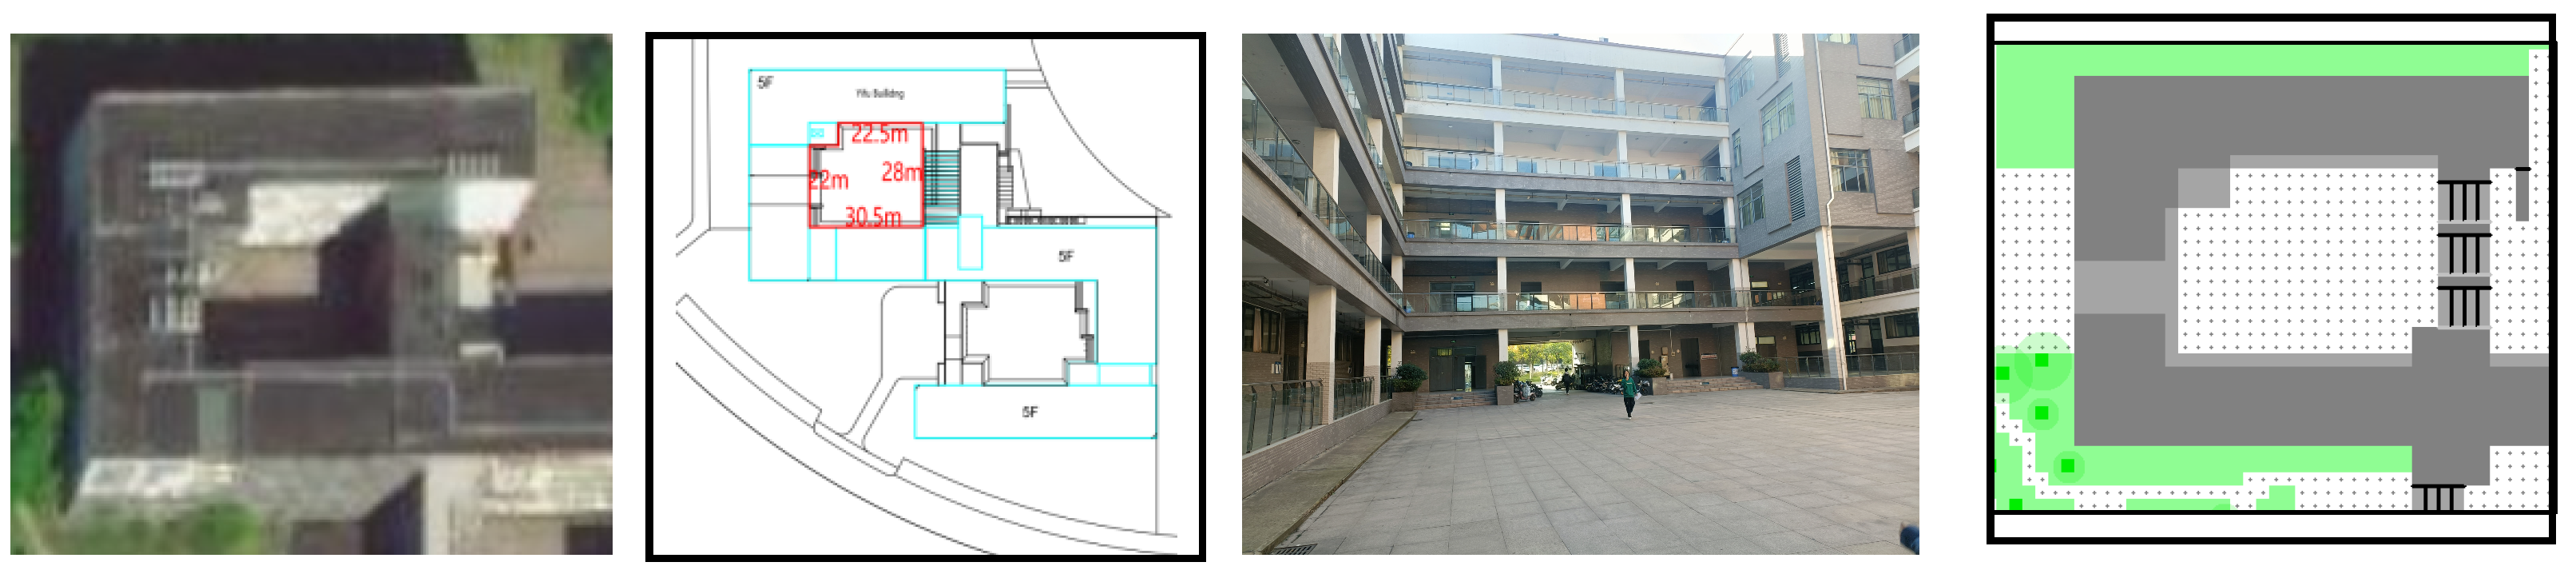
D1: In the Yifu teaching building area, the courtyard on the northwestern side is a fully enclosed space (
Figure 15). The courtyard is enclosed by buildings on all four sides: the buildings on the south, north, and west sides of the courtyard are approximately 20 m high, while the building to the west is partially elevated, and the building to the east is approximately 4 m high. The courtyard is rectangular, and about 30.5 m long and 28 m wide. The main landscape element is granite pavement, and the site was relatively spacious.
D2: The courtyard of the logistics complex in the living area is shown in
Figure 16. The buildings in the site are mainly 2–3 stories, and the space formed by the two buildings is less enclosed than the courtyard of the D1. The center of the courtyard is a small, hard-paved recreational square, surrounded by lawns,
Cinnamomum camphora (Linn) Presl,
Diospyros kaki Thunb, and
Osmanthus fragrans (Thunb.) Lour which are planted to the north side of the site, while shrubs are planted along the east and south sides.
3.4.1. Spatiotemporal Distribution of Thermal Comfort
At 09:00, the lowest PET values in both D1 and D2 were found in the areas with the lowest Tmrt, such as the shadows on the west side of the building. Additionally, the high connecting corridor on the right side of D2 created a large area of shadows, and the ground floor was ventilated, resulting in a lower Tmrt than D1; thus lower PET values on the right side of D2 were created than in D1. The maximum PET values were also found in areas with low Ws and direct sunlight, such as the northwest and northeast corners of D1, and the north and south sides of D2 (rose red indicates the highest PET value). At 12:00, the minimum PET value in the D2 courtyard was found in the overhead space of the building’s ground floor, whereas the minimum value in D1 was found in the shadow overlap of the north building and osmanthus trees. The maximum PET values were found at the corner of the building on the north side of D1, as well as in areas with low Ws to the north and south sides of the courtyard. At 15:00, the PET values in the shades of the buildings on the west side areas of D1 and D2 were the lowest, and the PET value in the shadow of D2 was lower than that in D1 because of the larger shaded area created by the buildings on the west side of D2. The highest PET values were also found in areas with direct sunlight and low Ws. At 18:00, the PET values of most areas of D1 and D2 ranged from 30 °C to 32 °C, and the thermal sensation was “warm”. The southwest side of D1 was exposed to direct sunlight and had a high Tmrt, thus, the PET value was high (37–39 °C), but the Ws on the south side was lower than that to the west, so its PET value was higher as well (
Figure 17).
3.4.2. Percentage of Thermal Comfort Grade at 9:00
At 9:00, thermal comfort in fully open spaces was graded as “slightly warm”, “warm”, “hot, and “very hot”. The PET value in most areas fell between 38 °C and 46 °C, providing a “hot” thermal sensation. In the semi-open space, B2 had the highest proportion of “slightly warm” areas (18.4%), followed by B4 (12.6%); B4 had the smallest proportion of “very hot” areas (0.7%), followed by B2 (2.4%), B2 “hot” and “very hot” categories had the smallest sum of proportions, followed by B1, and B3 area was the largest, accounting for 81.2%; thus, B2 had a higher thermal comfort level at this time, followed by B1 and B4. The order of thermal comfort of different semi-open spaces was B2 > B1 > B4 > B3. In the semi-closed space, the proportion of areas with a thermal comfort grade of “slightly warm” was 35.1% in C1, and 22.7% in C2, whereas the proportion of areas with a thermal comfort grade of “very hot” was 5.2% in C2 compared with 0% in C1. Therefore, the thermal comfort environment of C1 at 09:00 was superior to that of C2. In the fully closed space, there were four grades of thermal comfort, with a greater proportion of “very hot” sensation in D2 (48.4%) than in D1 (37.4%), and also a greater proportion of “slightly warm” sensation in D2 (28.9%) than D1 (6.8%) (
Figure 18).
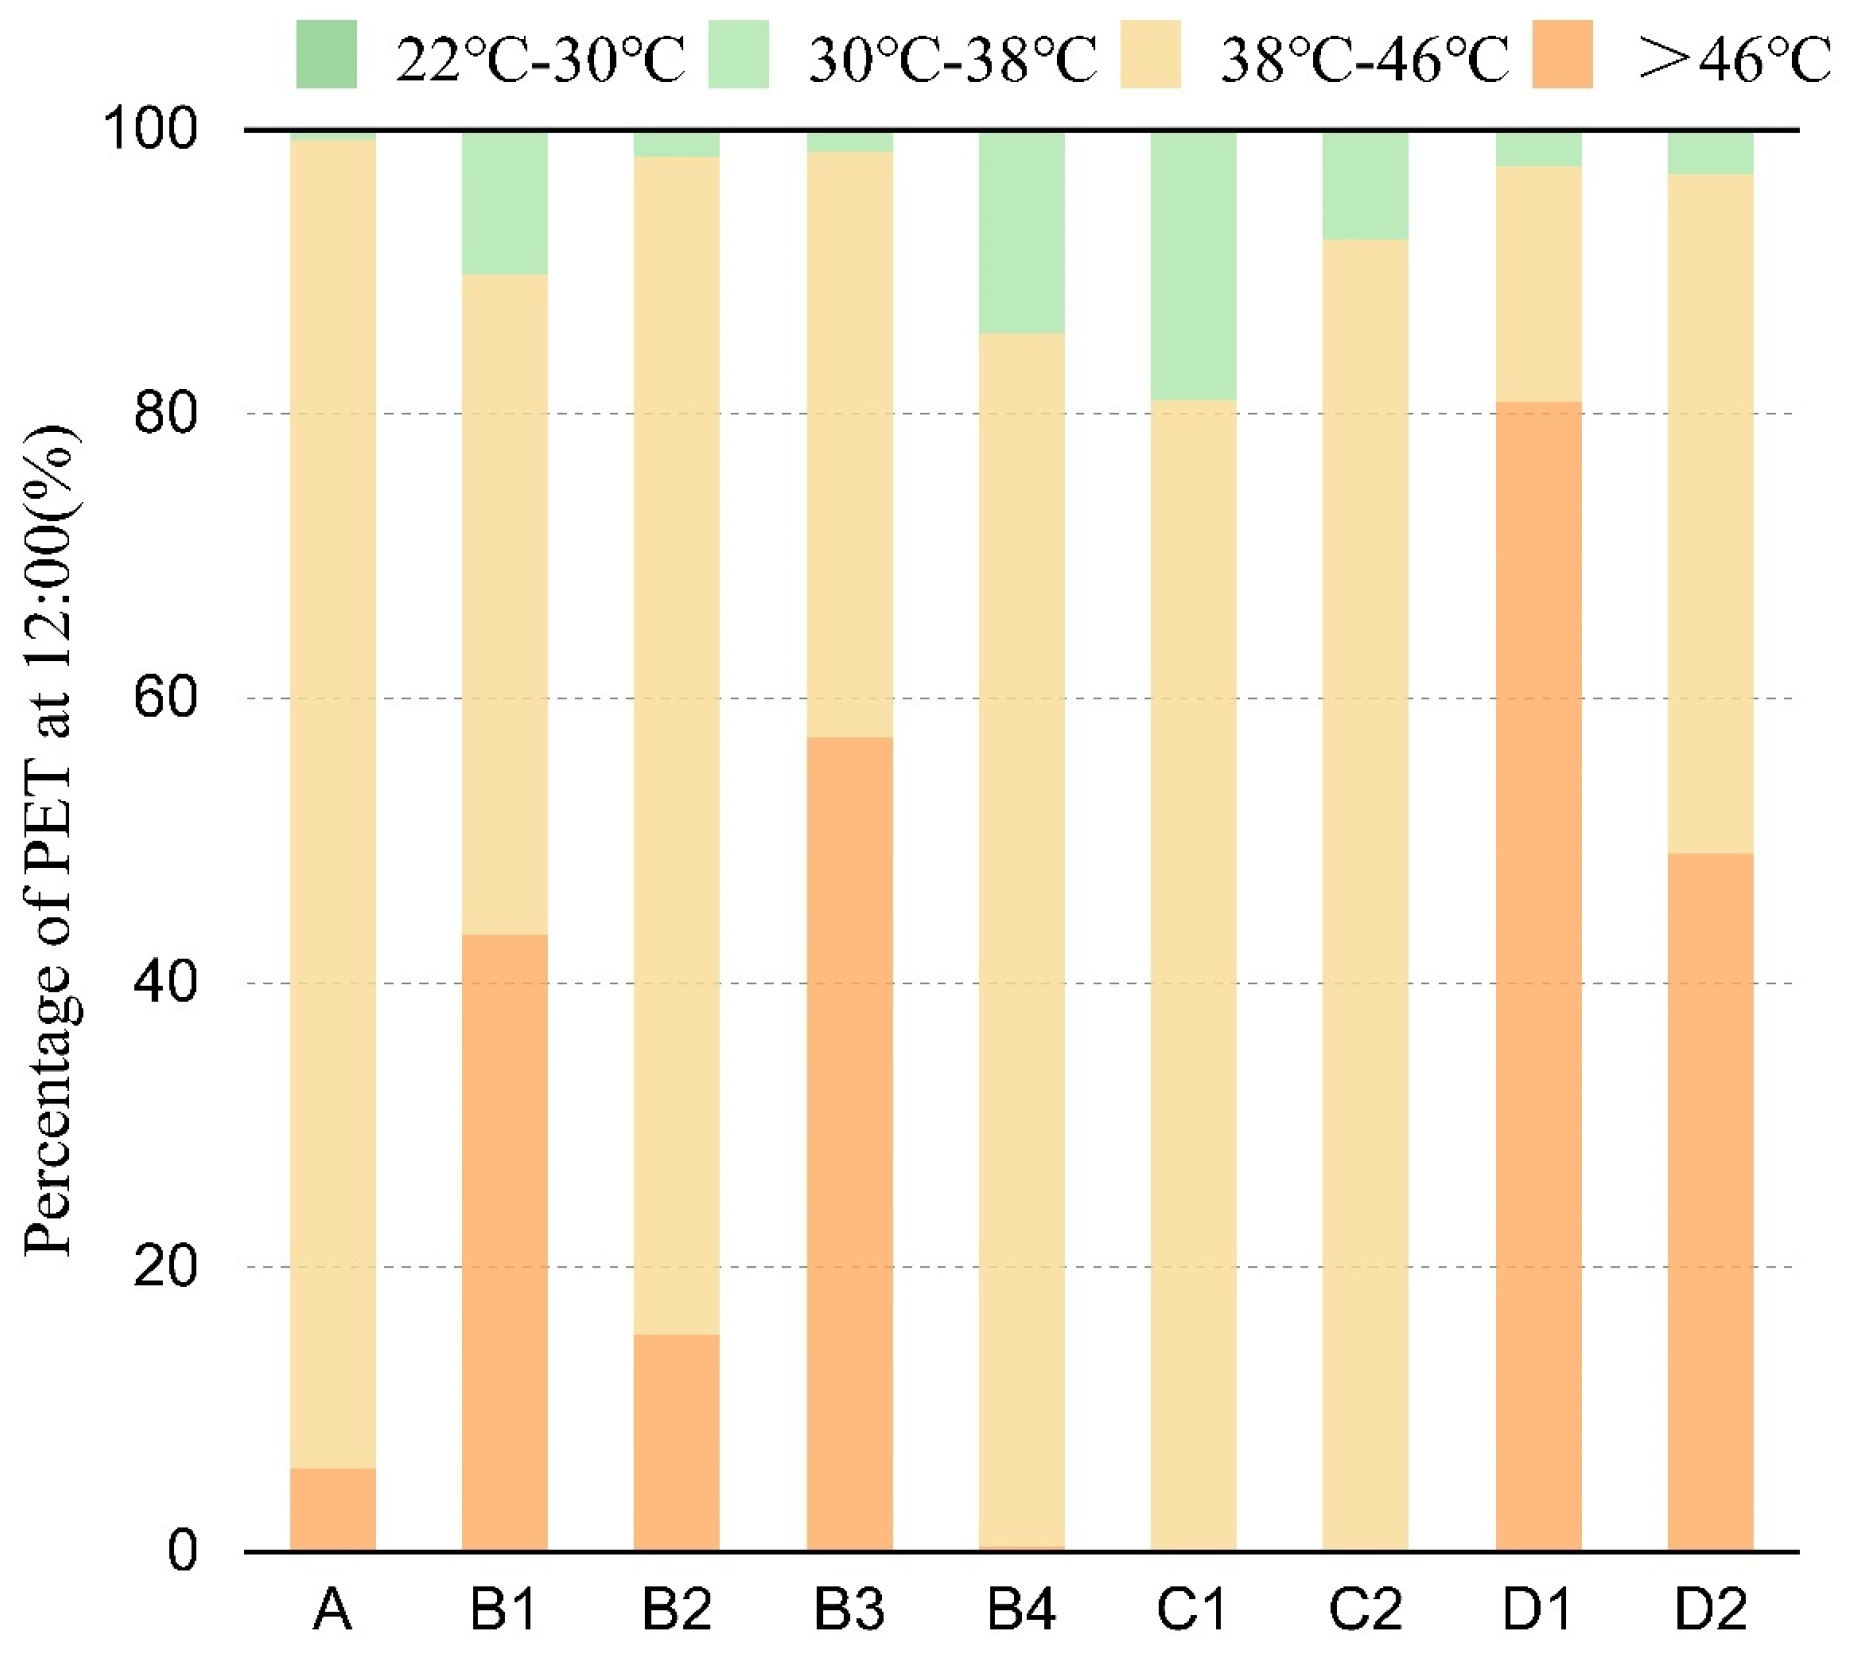
3.4.3. Percentage of Thermal Comfort Grade at 12:00
At 12:00, 93.4% of the areas had a PET value within the range of 38–46 °C, also making the thermal sensation “hot” in fully open space. The PET values in all four semi-open areas were changed, and the thermal comfort changed to three grades. The proportion of “very hot” areas had expanded, with “very hot” areas accounting for the largest proportion in B3 (57.4), followed by B1 (43.4%). B4 had the largest proportion of “warm” areas (14.3%) and “very hot” areas accounted for the smallest proportion (0.4%). The order of thermal comfort in each area was B4 > B1 > B2 > B3. There were only two grades of thermal comfort, “warm” and “hot” in semi-closed spaces. The percentage of “warm” areas in C1 (19%) was higher than that of C2 (7.7%). The thermal comfort environment of C1 at 12:00 was better than that of C2. In fully closed spaces, the “very hot” area in D1 reached its maximum daily value, accounting for ≤80.9% of the area, whereas the “very hot” area in D2 also expanded slightly (about 0.7%). The thermal comfort environment of D2 at 12:00 was better than that of D1(
Figure 19).
3.4.4. Percentage of Thermal Comfort Grade at 15:00
At 15:00, the thermal comfort grade increased with higher temperatures and Tmrt, resulting in a higher percentage of “very hot” thermal sensations (80.4%), and thus creating a very poor thermal comfort environment in fully open space. In semi-open spaces, as the Ta gradually increased and the solar radiation strengthened, the PET value reached its peak, and the corresponding thermal comfort levels were at their worst. Among them, the proportion of “very hot” areas in the B4 area reached 80.5%, followed by B3 at 57.9%, and the sum of the proportions of “slightly warm” and “warm” areas in B1 was the highest (43.6%). Thus, at this time, the order of thermal comfort in each area was B1 > B2 > B3 > B4. The number of thermal comfort grades increased to three-“warm,” “hot”, and “very hot” in semi-closed spaces. Namely, the proportion of “very hot” (49.4%) areas in C2 was lower than that in C1 (53.2%). At the same time, the proportion of C1 “warm” (6.7%) areas was higher than that of C2 (1.7%). In fully closed spaces, the “very hot” area in D2 expanded slightly (1.2%), while the “very hot” area in D1 shrunk (2.5%). The thermal comfort environment of D2 at 15:00 was better than that of D1 and the overall uncomfortable area remained large (
Figure 20).
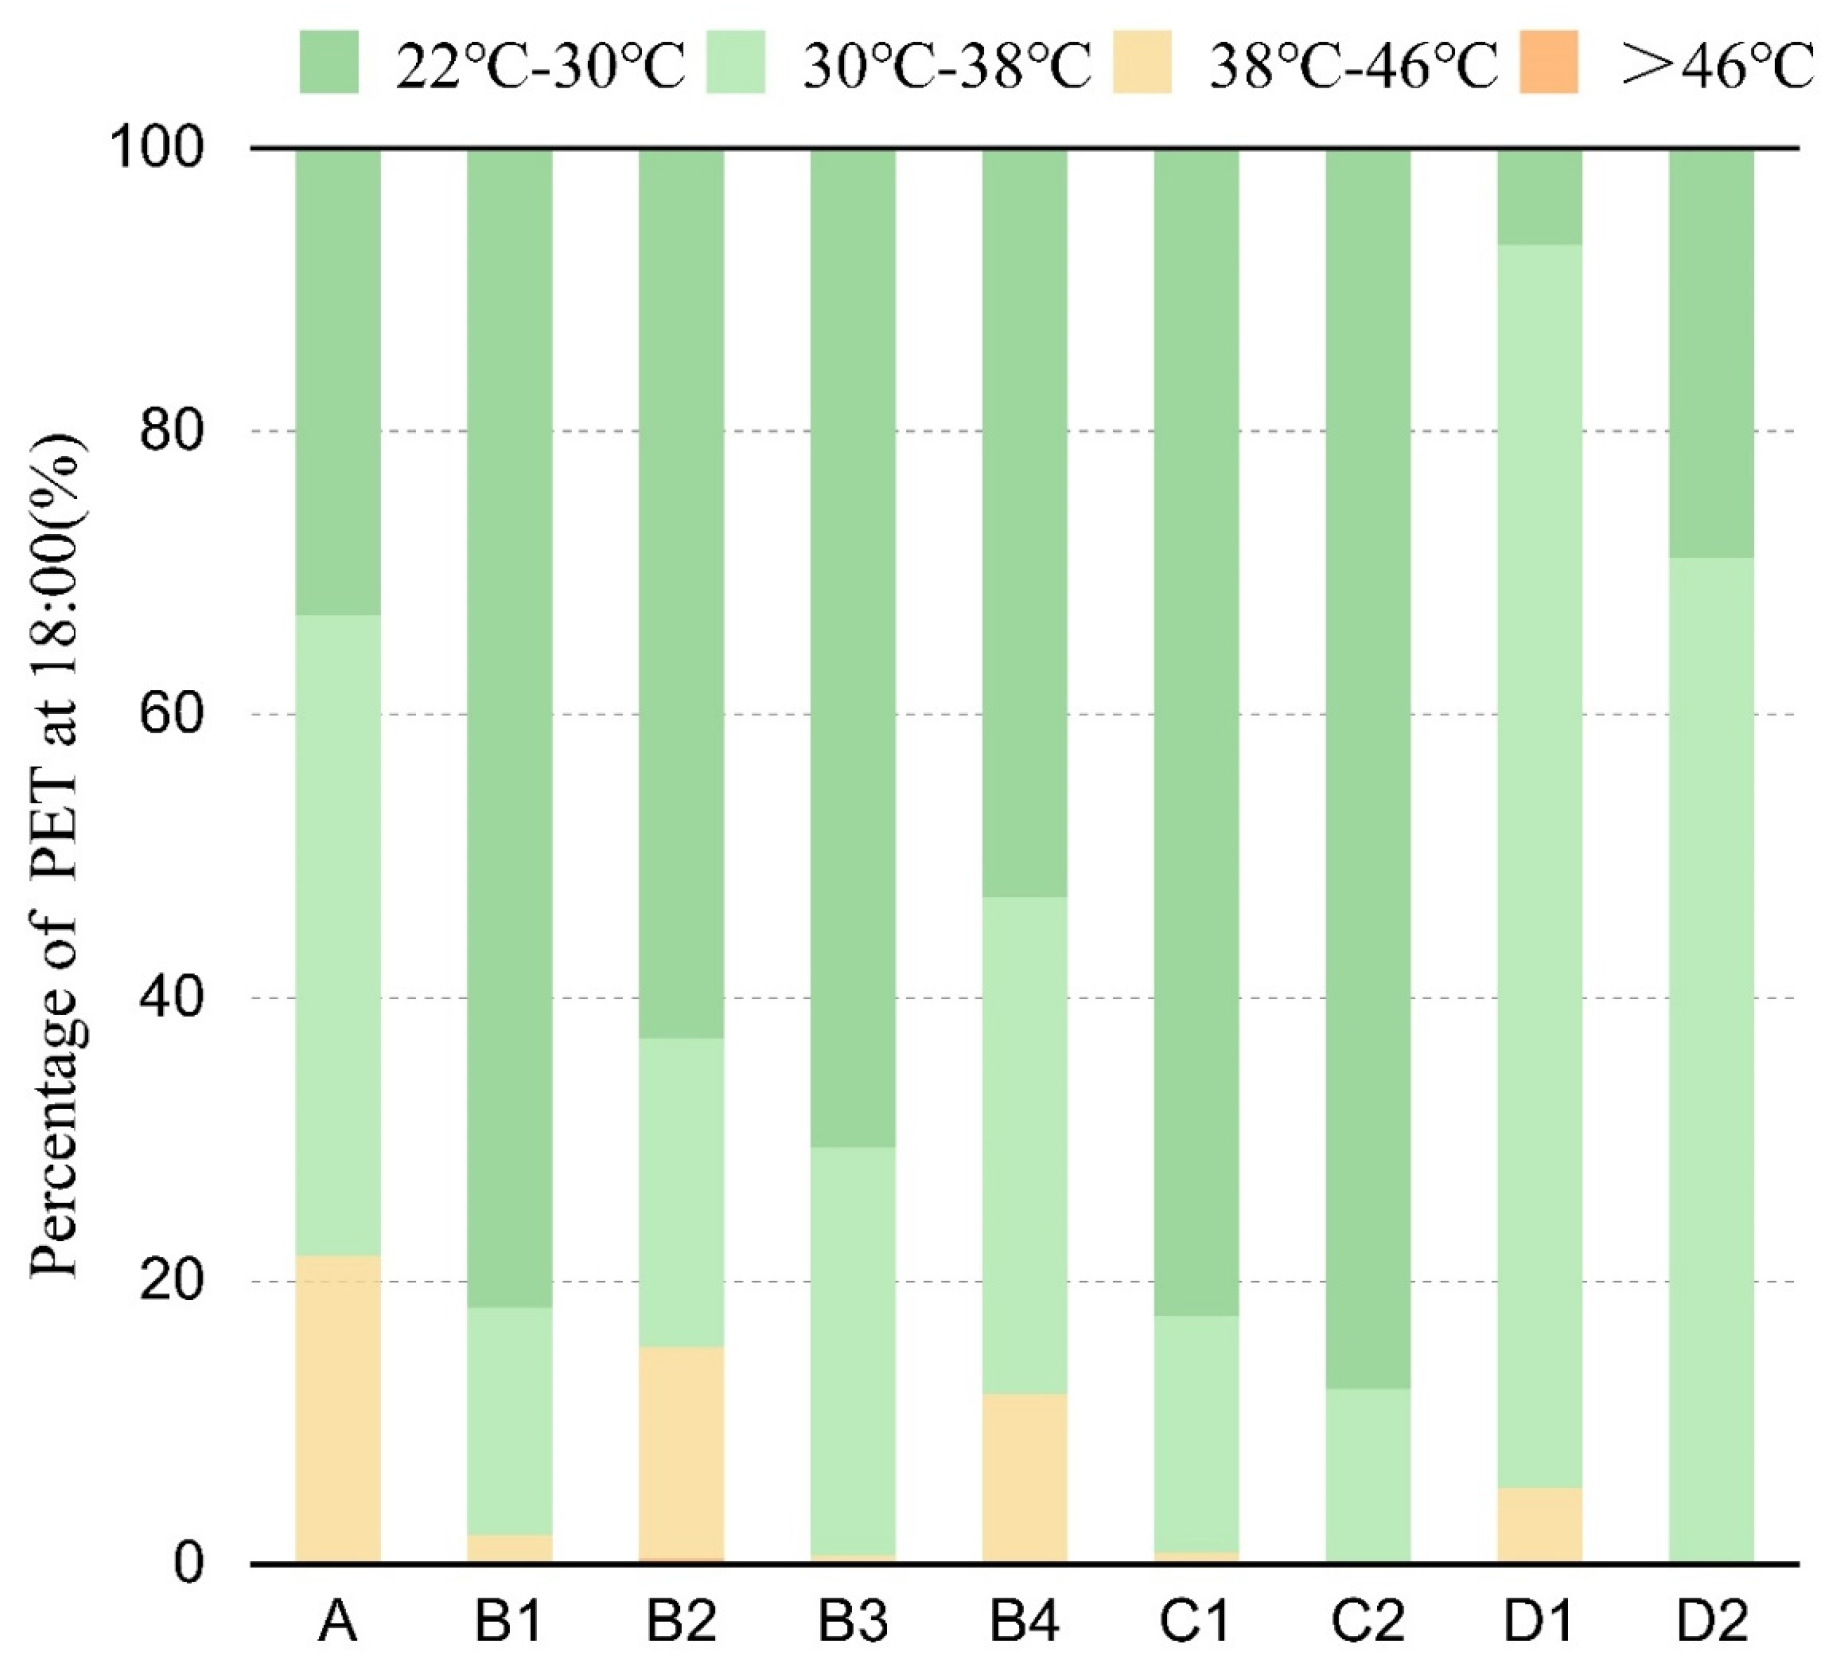
3.4.5. Percentage of Thermal Comfort Grade at 18:00
At 18:00, “slightly warm” and “warm” accounted for a relatively large proportion of the study area, and the overall comfort was good in fully open space. In semi-open spaces, as the solar altitude angle became smaller, the Ta and solar radiation decreased, and the thermal environment of the campus became more comfortable, with the grades of PET values here shifting to “slightly warm,” “warm”, and “hot”. Among them, B1 “slightly warm” areas accounted for the highest proportion (82%), followed by B3 (70.6%). The order of thermal comfort for each area at this time was B1 > B3 > B2 > B4. Among them, B1 “slightly warm” areas accounted for the highest proportion (82%), followed by B3 (70.6%). The thermal comfort environment of C2 was better than that of C1. In fully closed spaces, the thermal comfort grades in D1 were “slightly warm”, “warm”, and “hot”, whereas those in D2 were only “slightly warm” and “warm”. The percentage of “slightly warm” areas in D2 (28.9%) was higher than that in D1 (6.8%), and the percentage of “hot” grade in D1 was 5.4%. In summary, fully enclosed areas had a poor thermal comfort environment, and are less suitable for outdoor activities(
Figure 21).
3.5. Strategies for Improving Outdoor Spaces on Campus Based on Thermal Comfort
Traditional campus outdoor space design is mainly based on spatial aesthetics and functionality, often lacking consideration for the sustainability and climate adaptation of green campuses, which could easily lead to the deterioration of outdoor thermal comfort environments [
63]. It has long been hoped to provide better outdoor thermal comfort conditions by changing the configuration of the environment, mainly including the establishment of green space, providing shading facilities, the cooling benefits of water bodies, cold underlying surface materials, etc. [
5]. In terms of comprehensive thermal comfort levels, changing the urban geometry provides the greatest improvement, followed by vegetation, water bodies, and the cold surface [
64]. Therefore, to improve the thermal comfort of campuses, rational planning and design of spatial forms and landscape elements based on climate adaptation are essential.
3.5.1. Experimental Design for Optimizing Outdoor Spaces
For the hot-summer and cold-winter zones, efforts should be made to improve outdoor comfort during these seasons (especially summer) [
65]. Accordingly, the experimental optimization solution should focus on improving extremely hot conditions in the summer. Of the four study areas, the courtyard of the logistics building had the worst thermal comfort conditions in the summer among the fully enclosed spaces, and improving its overall environment should be prioritized. Therefore, the courtyard of the logistics building (fully enclosed space) was selected as the experimental transformation area. Landscape elements were designed to intervene in the microclimate of the site, thus optimizing thermal comfort without changing the geometric structure of the building.
3.5.2. Optimization Scheme Design and Model Construction
From the previous analysis of the logistics building’s courtyard, PET was lowest at 09:00 in the shadow of the buildings on the southwest side, and at 15:00 on the west side of the site and below the trees. The transformation strategy of a fully enclosed space mainly involves adding landscape structures to provide shade, enriching plant configuration, and improving the materials of the underlying surface. The activity areas were arranged in combination with buildings and trees. Hefei has a high Tmrt in summer, and a relatively poor thermal comfort environment; therefore, shading is required to create a more suitable comfort environment.
This design set up two leisure places: in the morning, the one on the southeast side could be used for activities, making full use of the shading effect of the vegetation itself. In the afternoon, a suitable thermal comfort environment was created by utilizing the shade of the building on the west side and arranging a veranda 2 m to its right to further expand the shaded area. The cooling and humidifying effect of plants can affect the internal microclimate of the courtyard to a certain extent; therefore, in summer, plants should be used to create shaded spaces, but trees with too low branching points could obstruct the ventilation at human height, and detrimentally affect OTC. Accordingly, existing
Cinnamomum camphora (Linn) Presl,
Osmanthus fragrans (Thunb.) Lour, and
Diospyros kaki Thunb on the site were kept, and
Platanus acerifolia (deciduous trees) were planted as supplements. The trees can not only create sufficient shading in summer to improve thermal comfort, but also increase the transmission of sunlight in winter, to prevent excessive sun blocking from reducing thermal comfort [
38]. Meanwhile, the planting of shrubs and herbaceous plants was also increased to enrich plant types and levels, thereby constituting a rich enclosure to enhance cooling and humidifying effects [
66]. Two plane trees were planted in the northwest and southeast corners of the courtyard, and the existing trees on the site were transplanted. Owing to poor ventilation in the enclosed courtyard, the
Cinnamomum camphora (Linn) Presl was transplanted to a ventilated place on the southwest side of the courtyard, thus changing the wind direction and increasing the air circulation inside the site. The original granite paving was also replaced by permeable concrete. Granite paving has high reflectance, and some scholars maintain that high reflectance increases the short-wave radiation, and Tmrt of the pavement [
67], thereby creating an uncomfortable thermal environment. In contrast, permeable materials can store rainwater because of their large pores, and cool the surface temperature through evaporation, which can improve thermal comfort to a certain extent. Additionally, permeable paving can recharge groundwater, reduce surface runoff, and absorb noise.
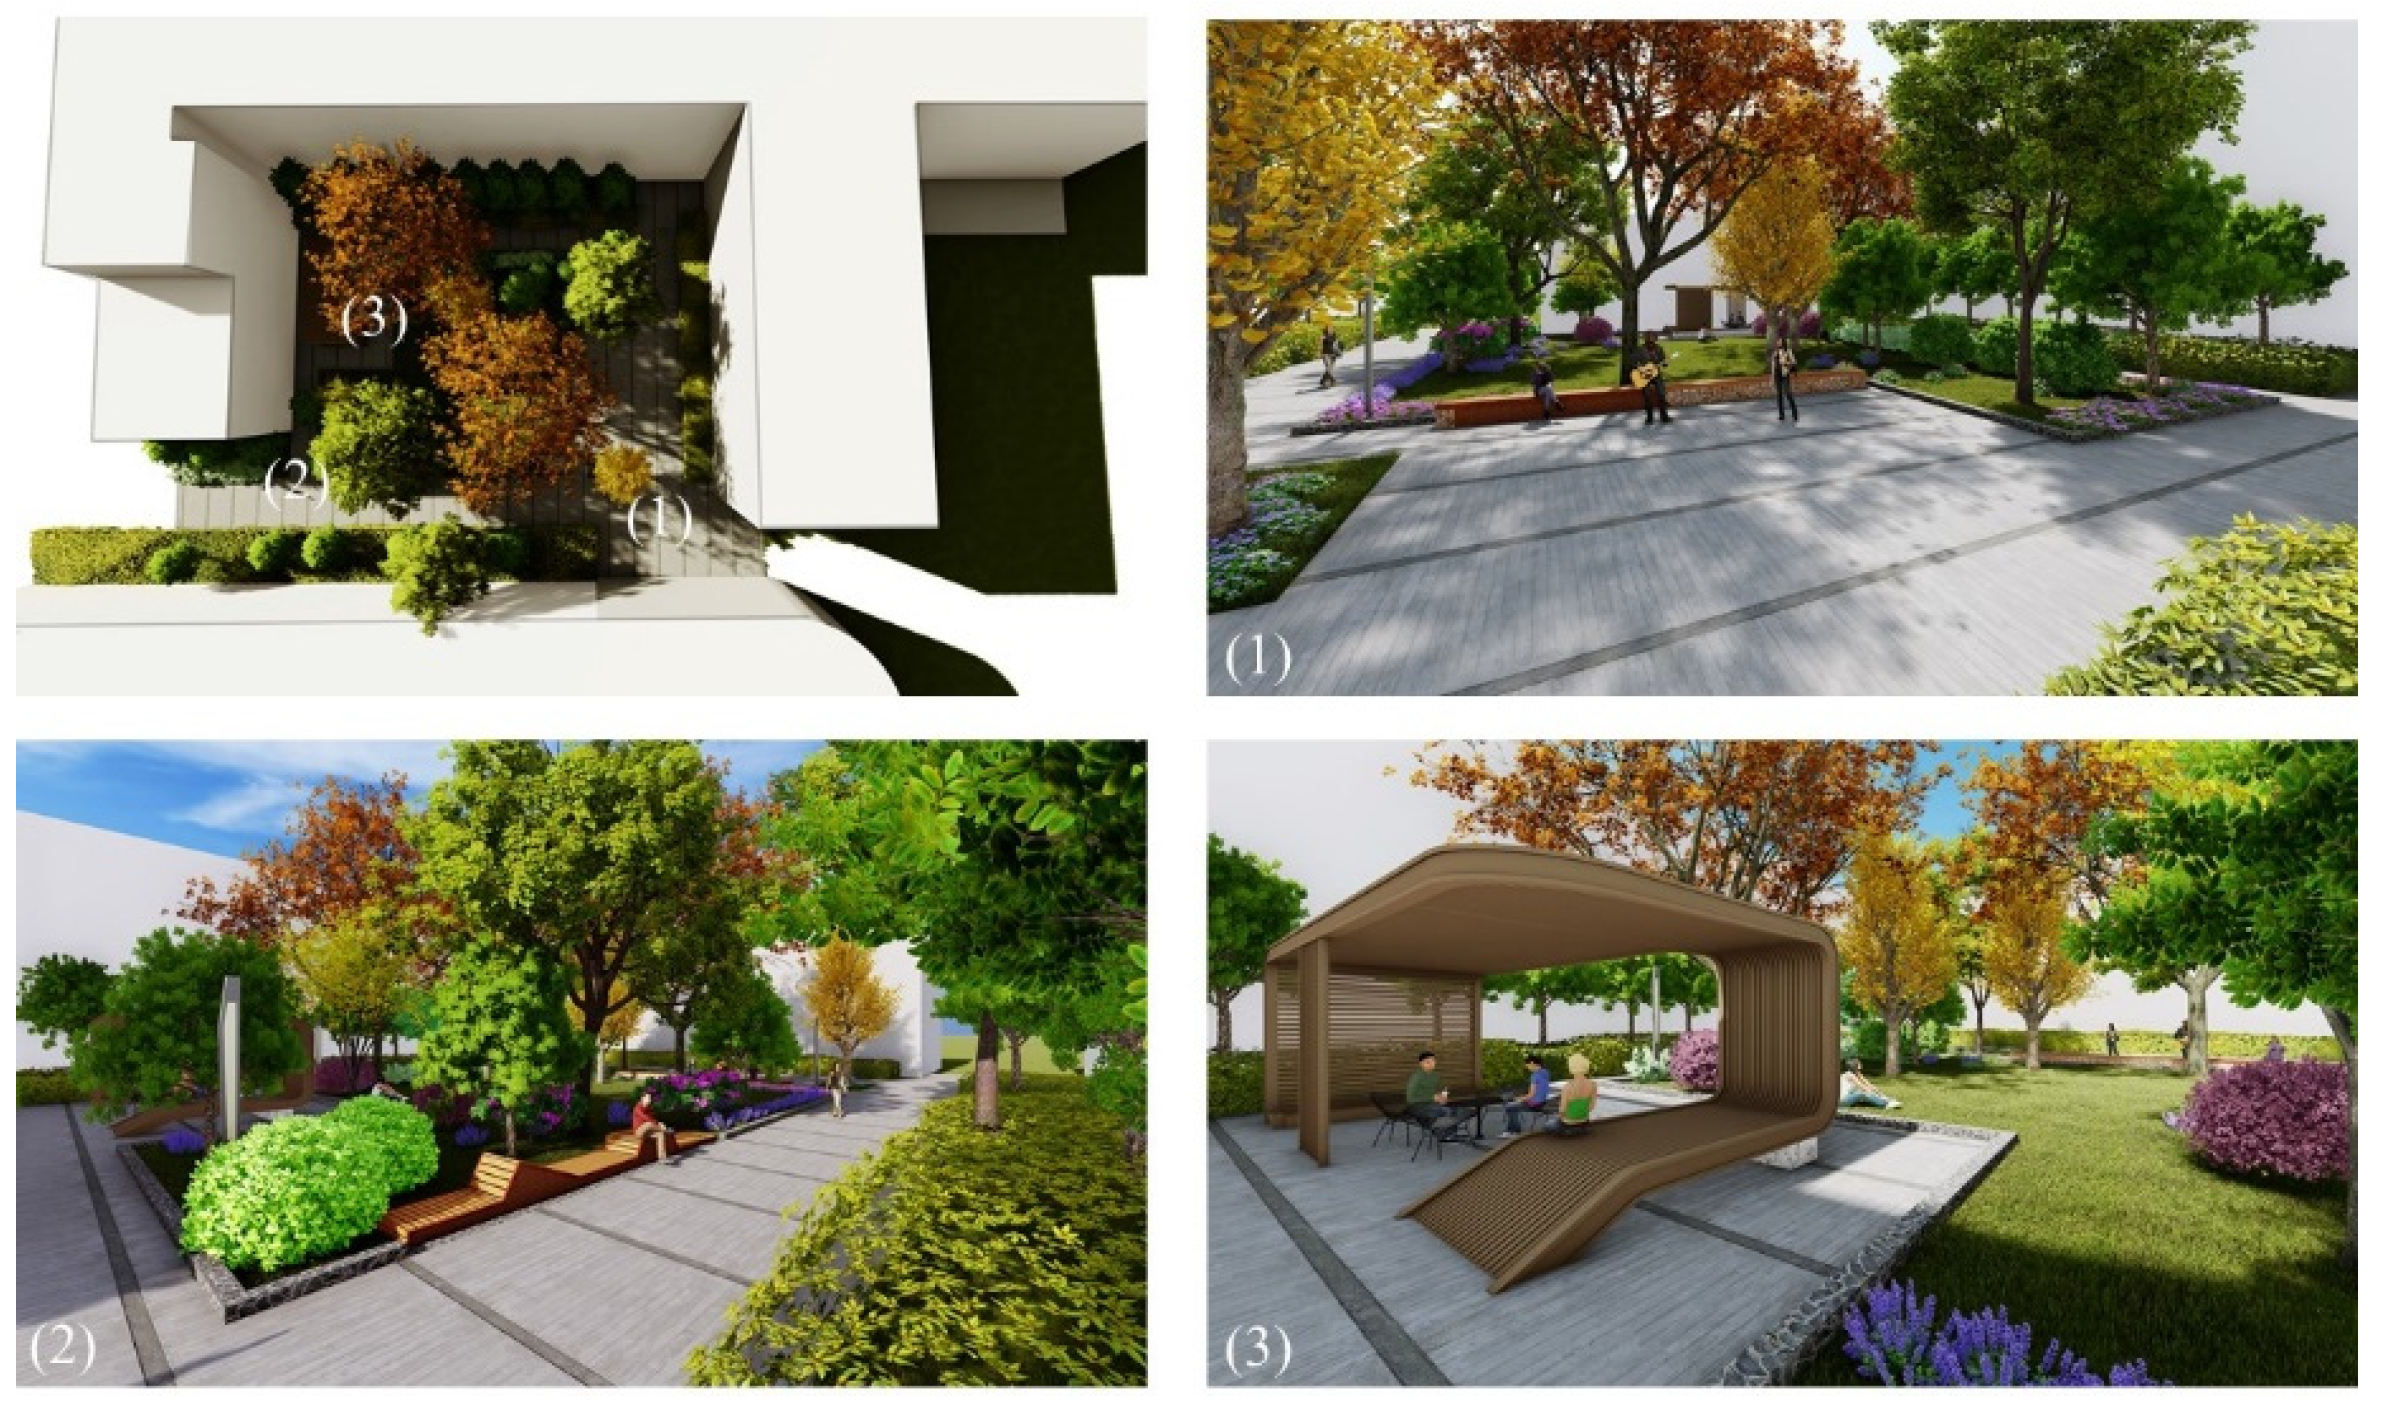
After several rounds of design and simulation comparisons of the transformation plan, the results post-transformation results are shown in
Figure 22. Areas 1 and 3 were the activity locations. Located along the roadside, Area 1 was more open and can be used as a space for club activities, whereas Area 3 was a more private space for teachers and students to read and communicate outdoors.
3.5.3. Percentage of Each Thermal Comfort Grade
The modified scheme was simulated, and the size, accuracy, and meteorological data of the modeling courtyard were consistent with those of the original scheme. Microclimate simulations were performed for the optimized scheme, and the spatiotemporal distribution graphs of PET at 09:00, 12:00, 15:00, and 18:00 were generated, and then compared with the PET distribution graphs before the transformation. The PET differences and mean temperature changes in the courtyard pre- and post-transformation were calculated (
Figure 23).
The distribution of PET values before and after the renovation is compared in
Figure 24. At 9:00, the PET value in most areas of the courtyard was blue, PET was below 30 °C, and the thermal comfort was “slightly warm” and “warm”, of which the proportion of “slightly warm” areas changed from the original 0.4% to 29%. Further, the proportion of “warm” areas increased from 47.1% to 68%, the proportion of “hot” areas decreased from 15.1% to 3%, and the area after renovation had no “very hot” areas at 9:00. The largest decrease in PET values in the middle and northwest areas of the site was mainly due to the addition of shading facilities here, and the larger canopy of the plants, which provided more shade space, and had the overall effect of lowering the Ta.
At 12:00, the overall PET of the courtyard increased, 66 % of the area reached the “hot” category, 12% of the area had a temperature >46 °C, and the thermal feeling was “very hot”, compared with the “hot” range of 16.5% and the “very hot” range of 80.9%; in the front courtyard before the renovation, the overall PET decreased and the thermal comfort improved.
At 15:00, the PET value in most areas of the courtyard was below 46 °C, and the range of the “very hot” category had reduced from 78.4% to 8% compared to that at 12:00, and the effect of the renovation was distinct.
At 18:00, the thermal comfort level of the courtyard was generally good, most of the PET values in the site were between 30–38 °C, the thermal feeling was “warm”, and the thermal comfort level before the renovation was similar. Further, the PET value under the tree increased slightly, because the effective long-wave radiation emitted under the canopy was slow and the heat was not getting easily dissipated. Although the effect of changing PET value at 18:00 was not as significant as that compared with other times, the effect of transformation in the hot period of the day was distinct, which suggests the feasibility of this scheme.
4. Discussion
A comparative analysis of the thermal comfort of different outdoor space forms showed that the correlation between the Tmrt and thermal comfort was high [
68,
69,
70]. The Tmrt in the shadows of trees and buildings was low, and the corresponding PET value was relatively low as well. In particular, there are lawns or shrubs under the trees which can cool and humidify the micro-climate; moreover, the long-wave radiation is weak, and the resulting PET value is the lowest. The PET values were also lower for trees with larger crowns
(Koelreuteria paniculata). Additionally, there was a significant negative correlation between Ws and PET [
71]. With the same Tmrt, the Ws at the corner of the building was higher, and the PET value was lower, whereas the Ws at the east and west sides of the building were lower, and the resulting PET value was higher. Although the improvement effect of small water bodies on the thermal comfort of the surrounding environment was weak, appropriately expanding the shaded area, building sunshade components, and increasing the coverage of campus plants can effectively improve the thermal comfort of this space in summer. The material of the underlying surface also affects thermal comfort. As ground surfaces reflect solar radiation or heat the air above them, pavements that can absorb more solar radiation may become a radiating body, thus warming the surrounding air, heating urban areas, and decreasing the thermal comfort for people [
72].
The thermal comfort environment of each space was the worst at 15:00 and the best at 18:00 due to the solar altitude angle and solar radiation. Among them, in the semi-open space, the PET value of 9:00 in B2 was the best, mainly because the building is on the east side of the site, the sun shines in from the east, and the shadow area formed by the building is relatively large. The PET value of B4 was the best at 12:00, and at 15:00, and 18:00 in the afternoon, and the PET value in B1 was the best, mainly because the bottom floor of some buildings in the B1 area is elevated, the wind environment is better, and the B1 area is built on the west side of the site. Further, B1 is affected by the sun height angle, the shadow range formed by the building is larger, and the B1 area has a larger arbor crown. Therefore, the overall thermal comfort of the B1 area in the afternoon was better. In the semi-enclosed space, the thermal comfort of C1 at 9:00 and 12:00 was better than that of C2. The thermal comfort of C2 in the afternoon is better than that of C1, mainly because the position of the building’s shadow changes as the height angle of the sun changes. The thermal comfort environment of the fully enclosed space was poor, the “very hot” category range was large, and the duration was long. The thermal comfort environment of the D1 courtyard was generally inferior to that of the D2 courtyard, and the area with a thermal feeling of the “very hot” category accounted for a large proportion. Based on a comprehensive analysis of the thermal comfort of these four types of spaces on campus in a day, it was found that the thermal comfort of the fully enclosed space was the worst, followed by the low thermal comfort of the fully open space. The thermal comfort environment of the semi-enclosed space was the best, followed by the half-open space.
The simulation results suggest that the thermal comfort of the fully enclosed space (D1) with the worst thermal comfort can be improved by adding shading structures (summerhouse), enriching plant configurations, and changing the underlying material without modifying the building. By comparing the PET value before and after the transformation at the same time of the day, it can be seen that the PET value after the transformation had decreased, and the thermal comfort had significantly improved. The shading structure can effectively block solar radiation and have a significant cooling effect in summer [
73]. Effective tree placement and arrangement can improve outdoor microclimate and thermal comfort. Plant levels and species should be enriched and placed in groups and overlapping canopies should be avoided when designing to provide more shade, and the introduction of vegetation has an overall cooling effect. Through the survey of thermal comfort, it can be seen that pedestrians prefer grass in hot summer [
74]. Therefore, expanding the area of grass cover is an effective strategy to improve PET. At the same time, permeable concrete can increase pavement evaporation, reduce pavement temperature, and improve thermal comfort to a certain extent. Therefore, through the simulated transformation, it can be seen that in the hot summer, providing shade structures, increasing the planting of trees, especially trees with larger canopies, and improving the underlying surface material has a significant effect on thermal comfort.
5. Conclusions
In this study, the southern campus of AHJZU was selected as the research area. The 29 April and 13 November were selected as the monitoring dates for field measurements to verify the applicability of the ENVI-met within the Hefei area. During a typical summer climate, four outdoor space types were selected for thermal comfort research. Here, the PET thermal comfort index was calculated, revealing that the fully enclosed space produced the worst thermal comfort. Thus, this space was simulated and transformed, and the modified PET thermal comfort index was calculated. The main conclusions of this study are as follows:
(1) The field measurement data were compared with the ENVI-met simulation data to obtain the temperature, RMS coefficient, RMS error, and consistency index for each measured point. The results supported that the temperature, RMS error, and wind speed index of each measurement point were within the error range, indicating that ENVI-met well represented the changing trends, and supporting its applicability within the Hefei area. The consistency index of the summer meteorological parameters was close to 1, indicating that the ENVI-met performed better in the summer than in winter.
(2) Owing to the various architectural modes and plant configurations, the spatial and temporal distributions of PET were quite different. A comprehensive analysis of the thermal comfort of these four types of spaces in the campus showed that the thermal comfort of the fully enclosed space was the worst, followed by the poor fully open space. Comparatively, the thermal comfort environment of the semi-enclosed space was the best, followed by the semi-open space. Therefore, in the planning and construction of the campus, the spatial form of semi-enclosed space (U-shaped) is preferred. This may be mainly because the U-shaped surrounding buildings better block solar radiation and provide more shade. At the same time, both C1 and C2 are semi-enclosed spaces, but the thermal comfort level of C1 is generally better than that of C2, mainly because C1 has more abundant plant groups and a high proportion of permeable underwater cushion surfaces, which can improve thermal comfort. Through the classification and analysis of different outdoor spaces, the differences in thermal comfort and thermal comfort levels at different time points were obtained to propose suggestions and references for the optimization of outdoor campus environments.
A comparative analysis of the thermal comfort of different outdoor space forms showed that the correlation between the Tmrt and thermal comfort was high [
68,
69,
70]. The Tmrt in the shadows of trees and buildings was low, and the corresponding PET value was relatively low as well. In particular, there are lawns or shrubs under the trees which can cool and humidify the micro-climate; moreover, the long-wave radiation is weak, and the resulting PET value is the lowest. The PET values were also lower for trees with larger crowns
(Koelreuteria paniculata). Additionally, there was a significant negative correlation between Ws and PET [
71]. With the same Tmrt, the Ws at the corner of the building was higher, and the PET value was lower, whereas the Ws at the east and west sides of the building were lower, and the resulting PET value was higher. Although the improvement effect of small water bodies on the thermal comfort of the surrounding environment was weak, appropriately expanding the shaded area, building sunshade components, and increasing the coverage of campus plants can effectively improve the thermal comfort of this space in summer. The material of the underlying surface also affects thermal comfort. As ground surfaces reflect solar radiation or heat the air above them, pavements that can absorb more solar radiation may become a radiating body, thus warming the surrounding air, heating urban areas, and decreasing the thermal comfort for people [
72].
(3) To address the thermal comfort of the worst fully enclosed space, a simulation was run by increasing landscape structures to provide shade spaces and rich plant configurations. Accordingly, the PET spatiotemporal distribution compared with before showed varying levels of improvement, especially during the day when the effects were more obvious.
In conclusion, this research showed that the thermal comfort of university campuses is influenced by the building mode, plant configuration, and underlying surface materials. The findings here can provide theoretical support and serve as a technical reference for the construction of a more thermally comfortable university campus. The study yielded satisfactory results, but some limitations remained. Firstly, it should be pointed out that based on the typical summer weather in June, there is a lack of research on the transition seasons. Secondly, longer measurement times are needed to collect a more comprehensive and convincing database. Finally, the relevant content of the questionnaire survey should be supplemented in the study to better explore the impact of different landscape elements and layouts on human thermal comfort. In follow-up research, the seasons and their duration will be expanded to explore and analyze the impacts of the dynamic changes of different weather conditions on the thermal comfort of campus outdoor spaces.


