
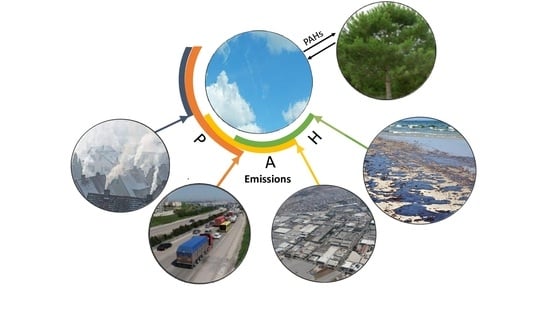
Usage of Needle and Branches in the Applications of Bioindicator, Source Apportionment and Risk Assessment of PAHs

Abstract
:
1. Introduction
2. Material Method
2.1. Sampling
2.2. Sample Preparation and Experimental Process
2.3. GC Analysis
2.4. Quality and Reliability Measures
2.5. Statistical Analysis of Data
3. Results and Discussion
3.1. Identification of PAH Sources
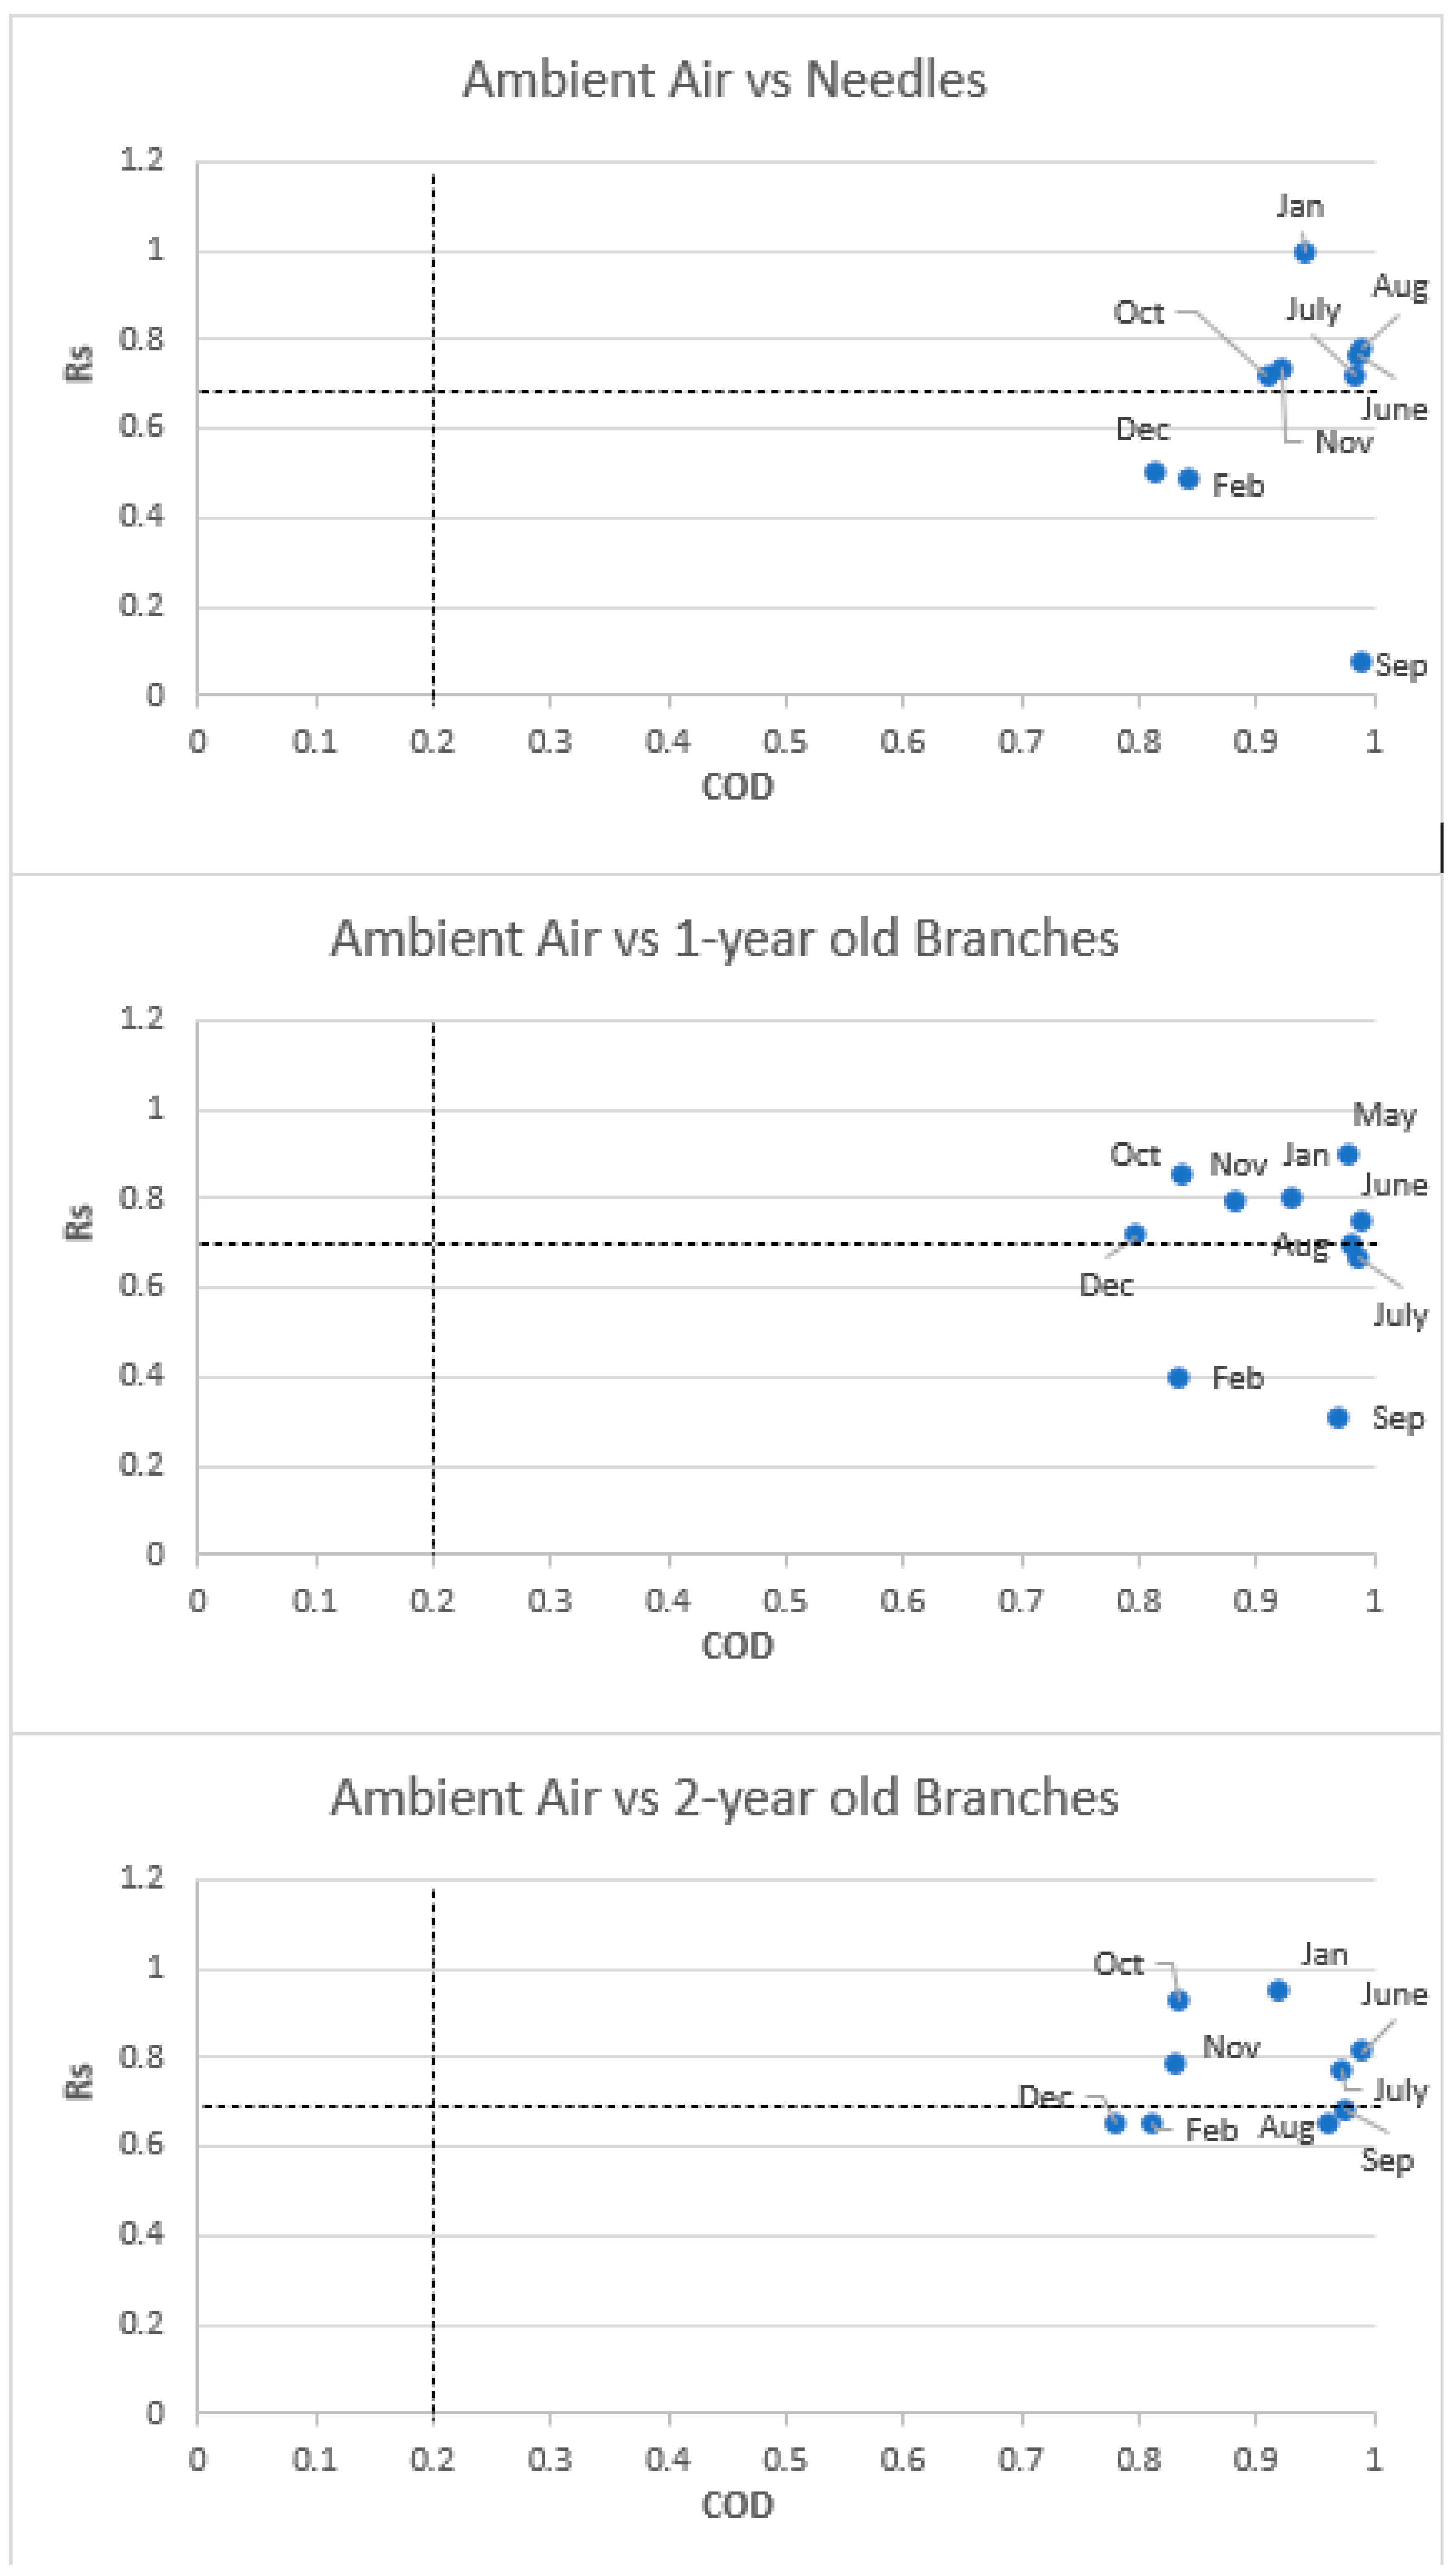
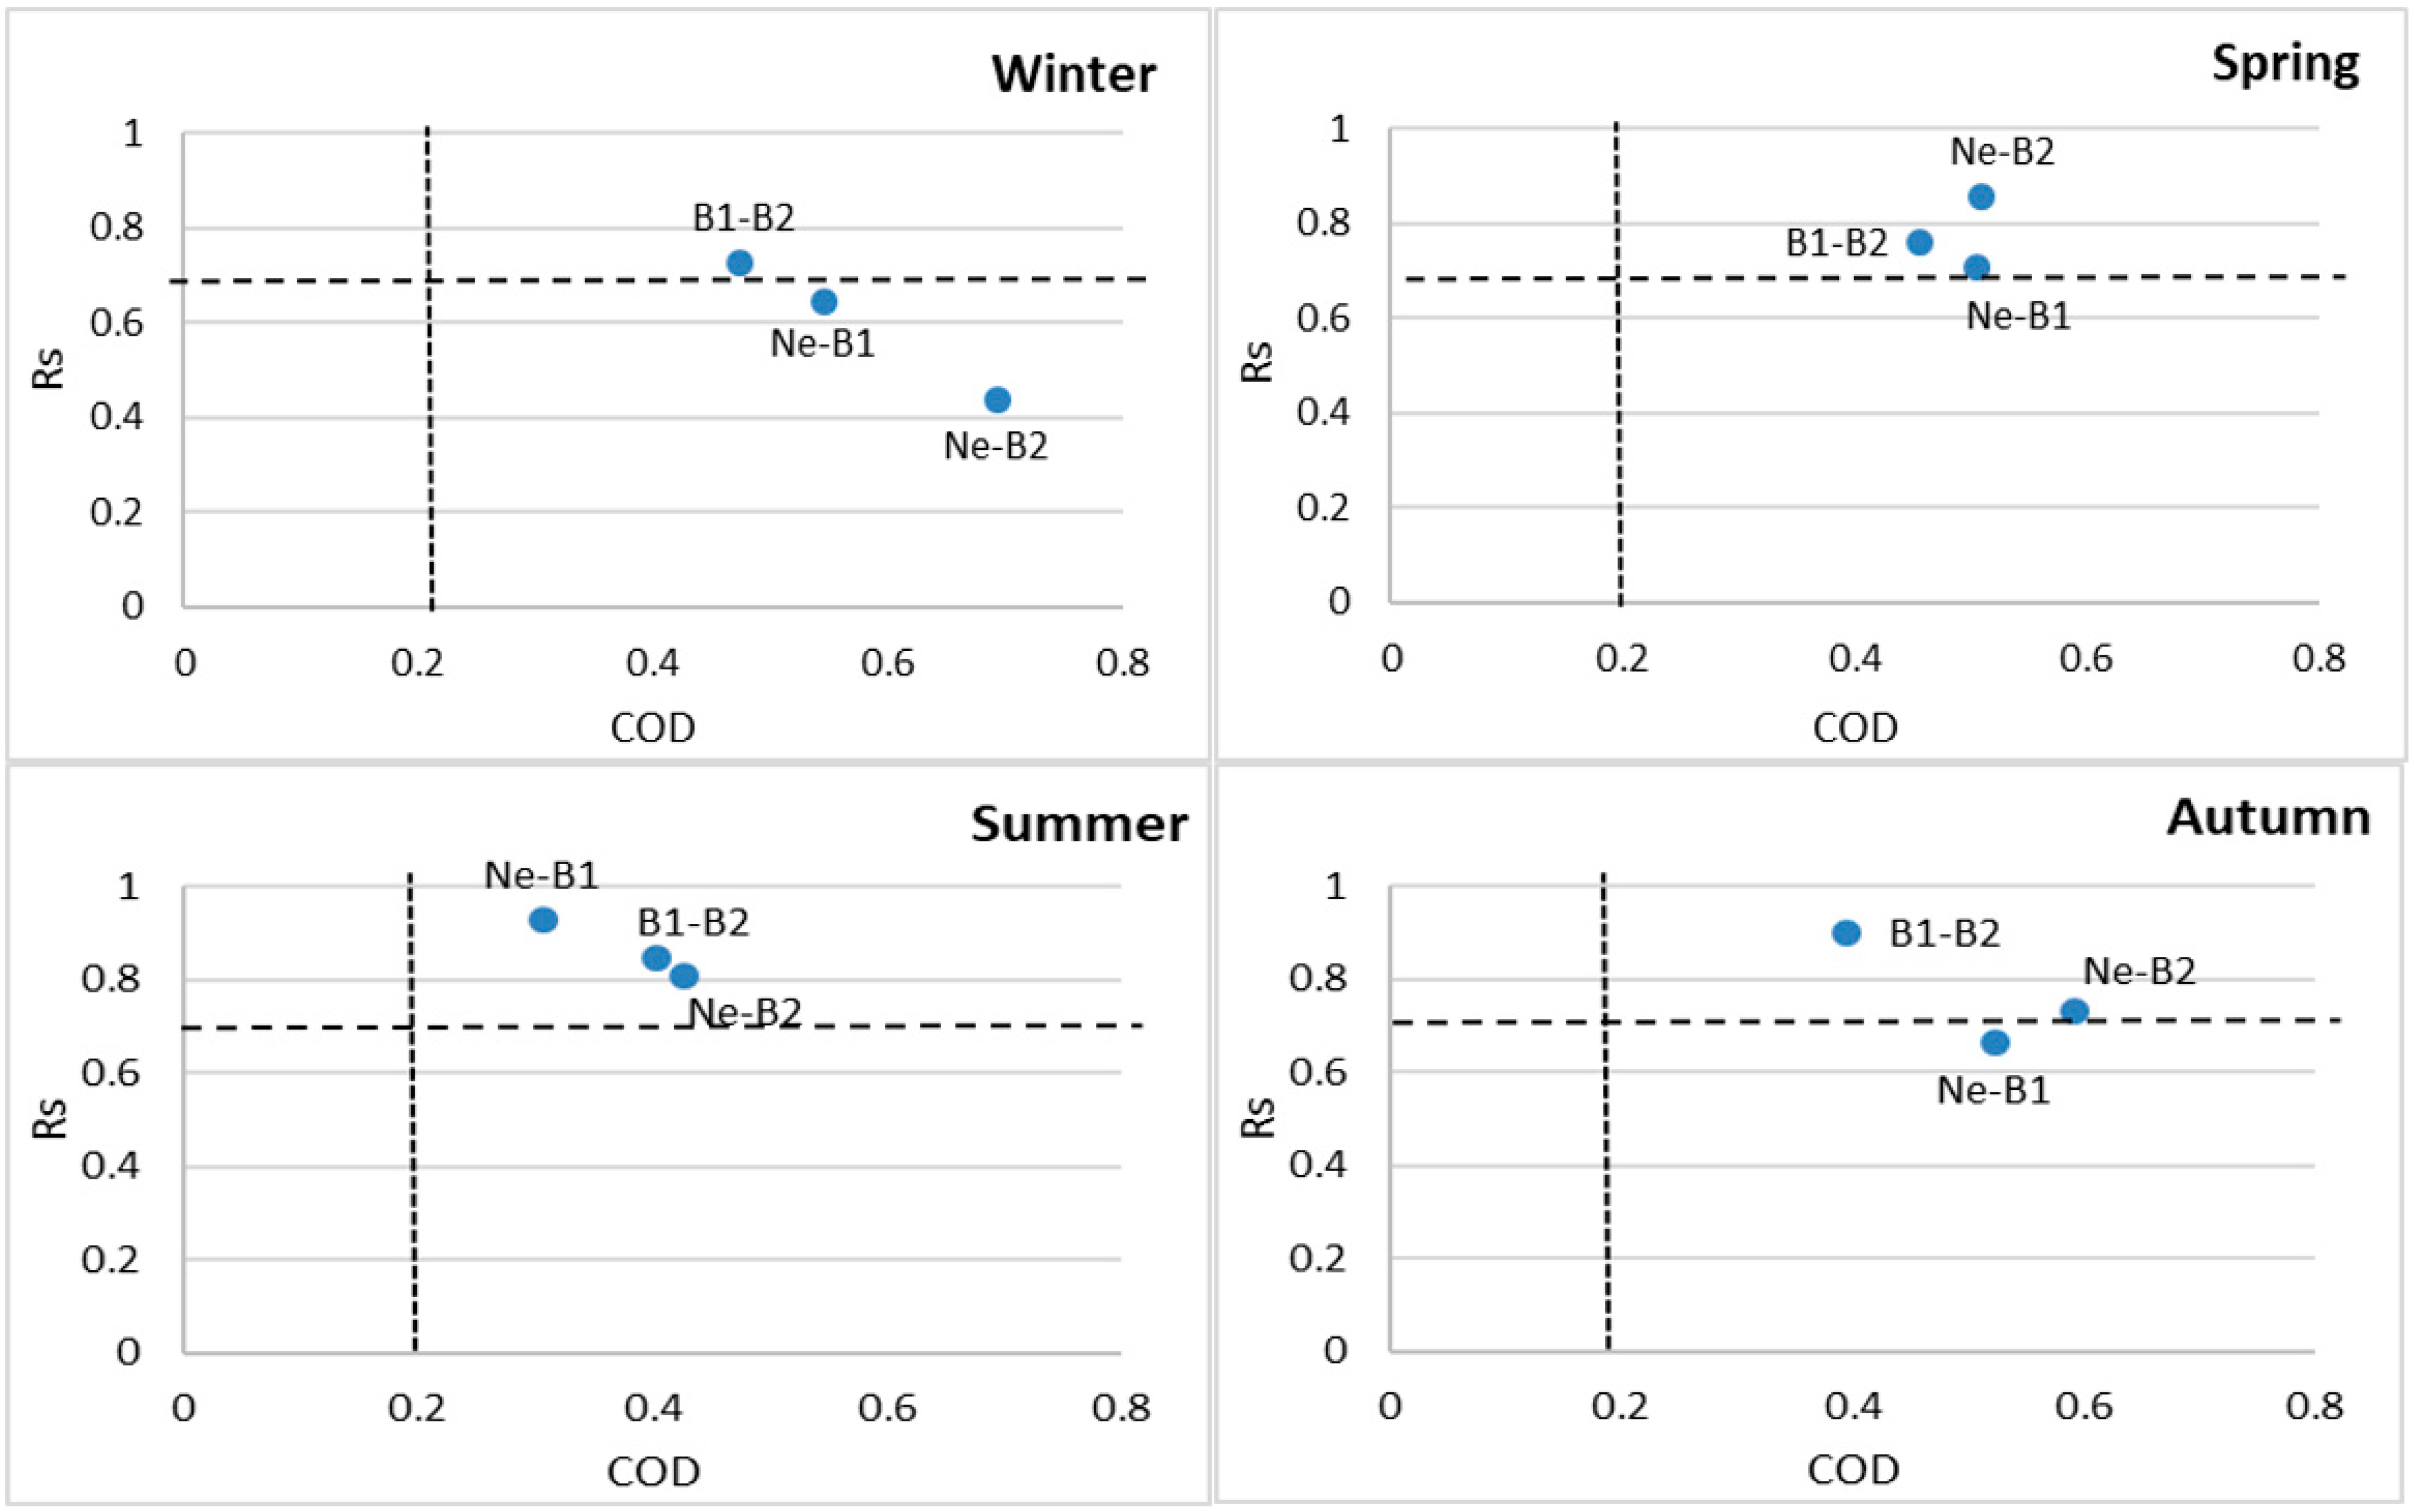
3.1.1. Coefficient of Divergence (COD)
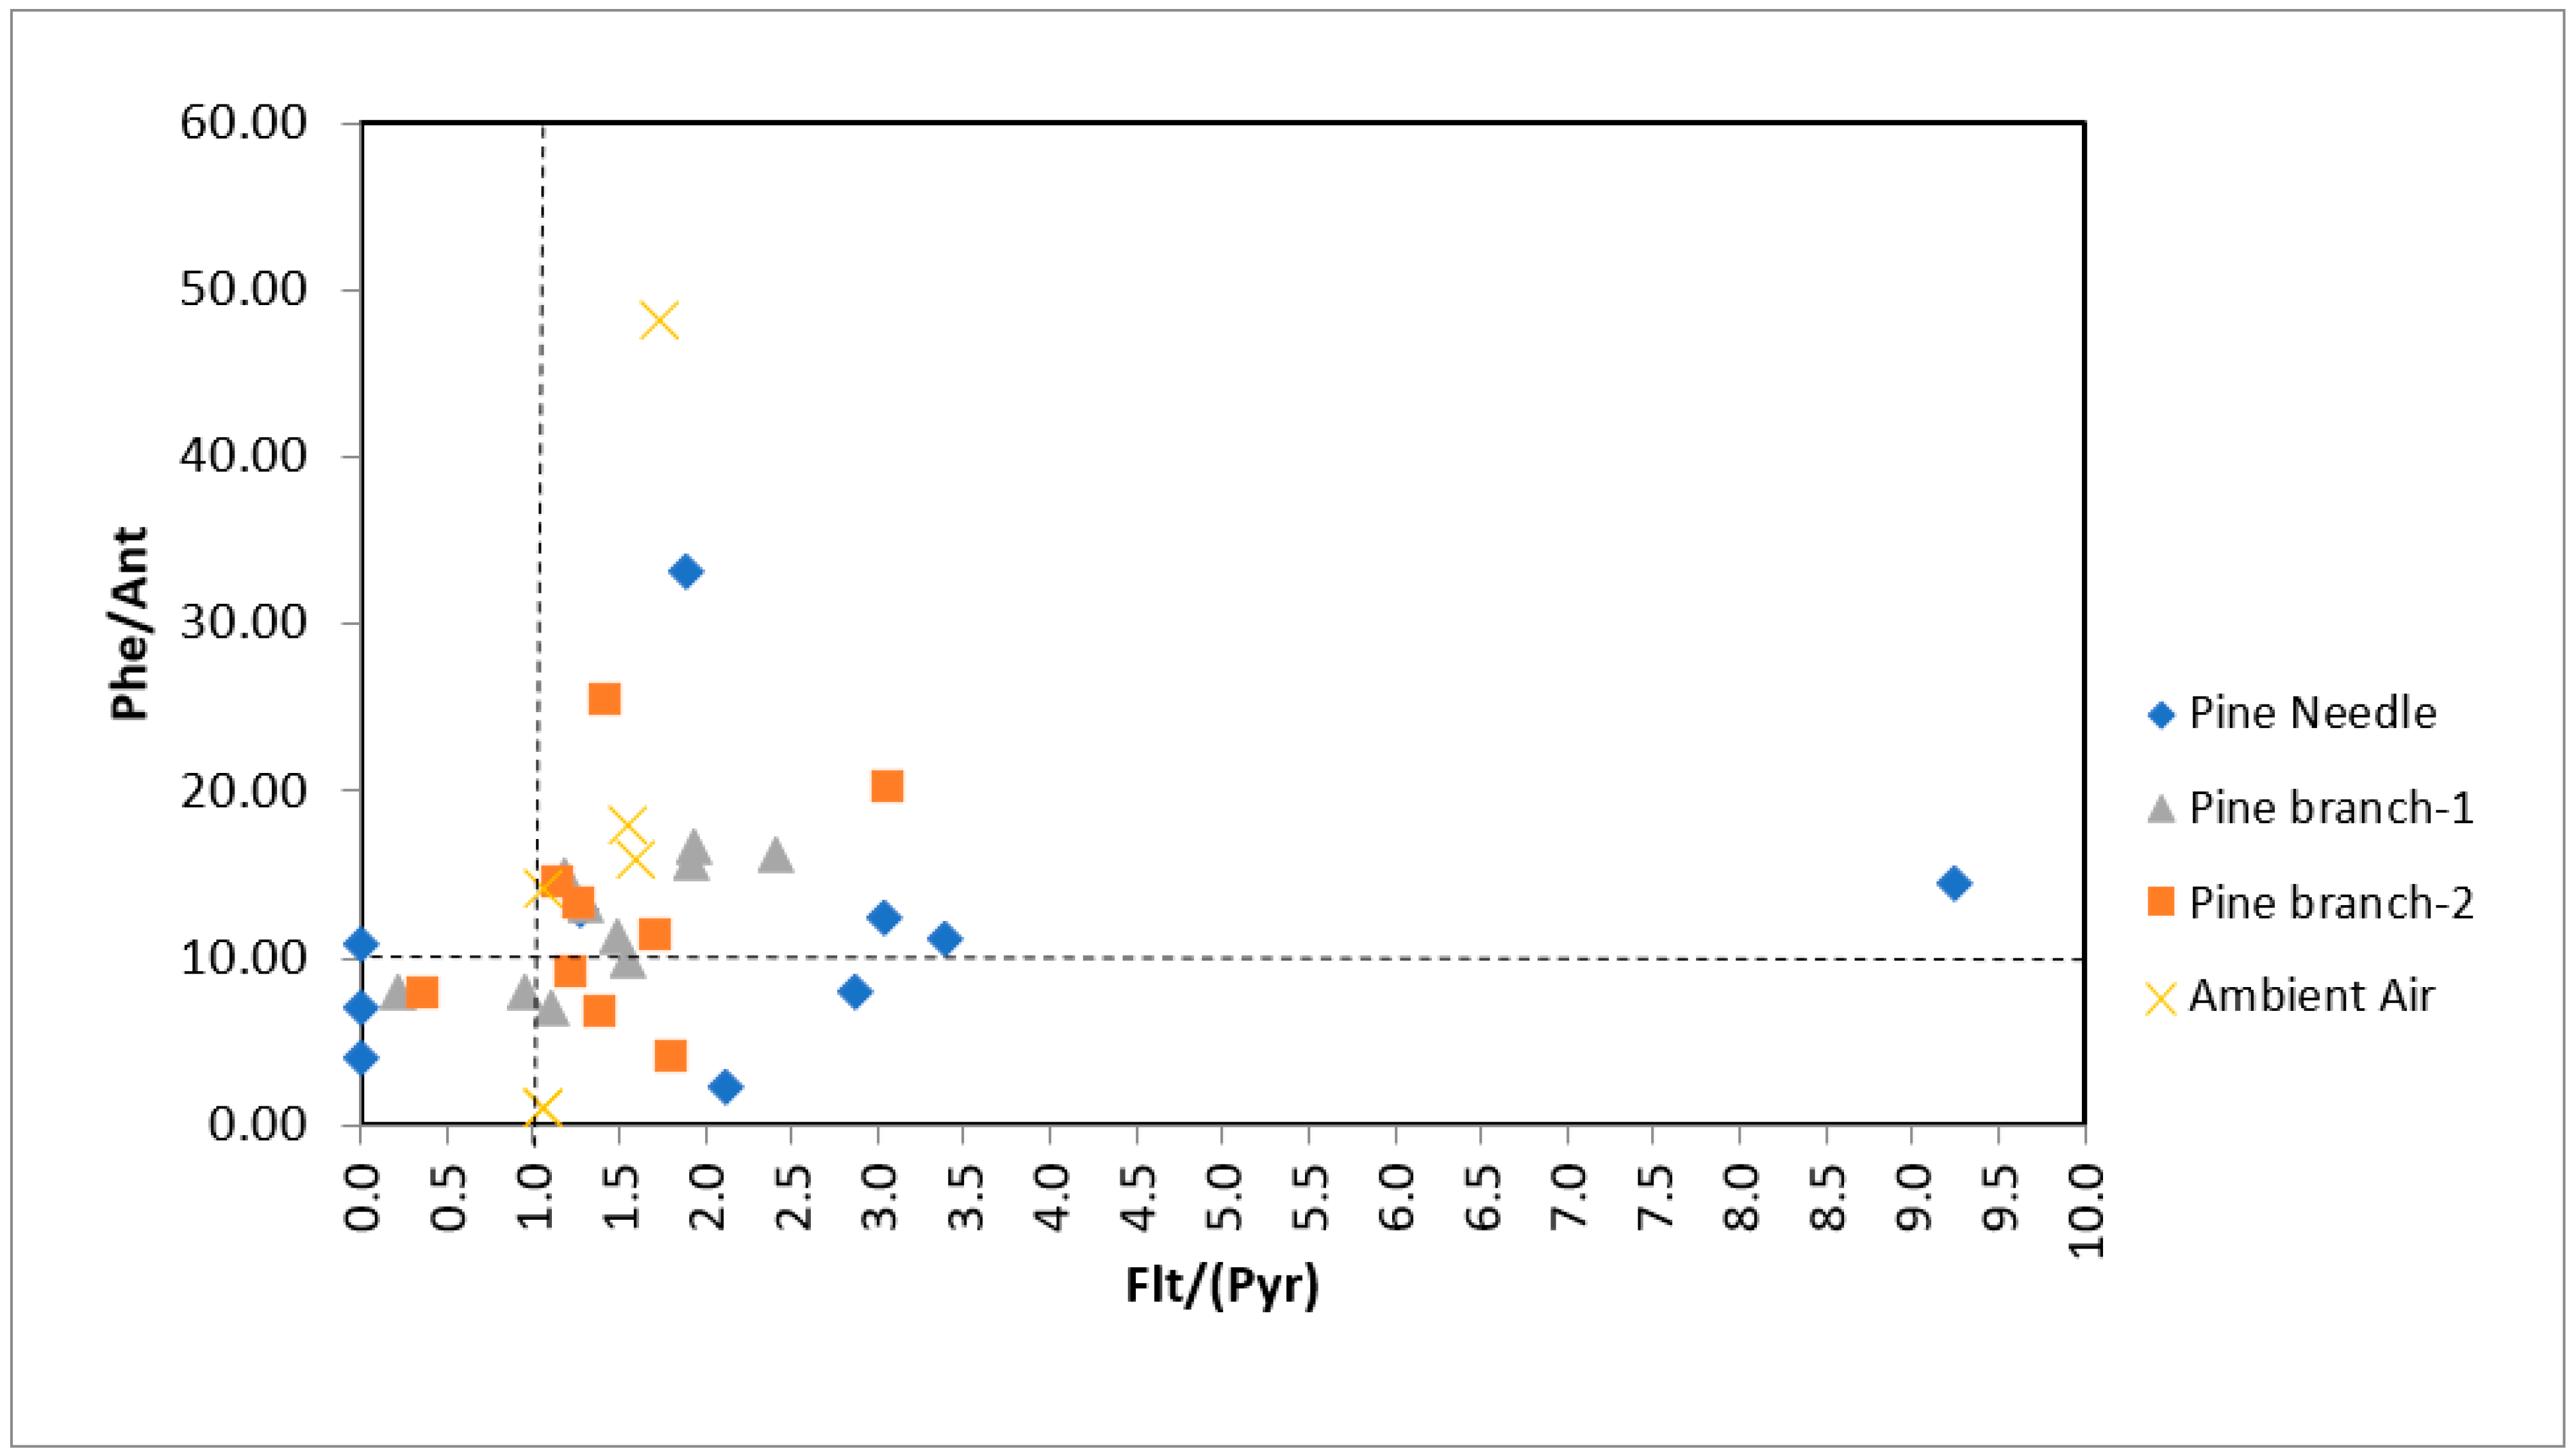
3.1.2. Diagnostic Ratios

| Diagnostic Ratio | ||||
|---|---|---|---|---|
| Value | Potential Source | Reference | This Study | |
| Indeno/(Indeno+BghiP) | <0.2 >0.5 0.2–0.5 0.4 0.3–0.7 0.56 0.48 0.19 0.32 0.32 0.36 0.35 0.42 | Petrogenic Grass, wood and coal combustion Petroleum combustion Gasoline Diesel engine Coal Coal combustion Diesel vehicles Gasoline vehicles Natural gas combustion Oil combustion Vegetation combustion Wood combustion | [63] [6] [6] [64] [60] [65] [62] [62] [62] [62] [62] [62] [62] | 0.08–0.61 |
| BaA/(BaA+Chr) | 0.2–0.35 >0.35 <0.2 >0.35 0.53 0.73 0.79 0.46 0.65 0.50 0.39 0.50 0.59 | Coal combustion Vehicle emission Petrogenic Combustion Vehicle emission Diesel engine Wood burning Coal combustion Diesel vehicles Gasoline vehicles Natural gas combustion Oil combustion Wood combustion | [66] [67] [63] [63] [57] [68] [57] [62] [62] [62] [62] [62] [62] | 0.55–1.00 |
| Phe/Ant | <10 >15 | Pyrogenic Petrogenic | [69] [69] | 1.00–48.19 |
| BaP/BghiP | <0.6 >0.6 | Non-traffic emissions Traffic emissions | [66] [66] | 0.38–1.36 |
| Fluo/(Fluo+Py) | <0.5 >0.5 | Petrol emissions Diesel emissions | [66] [70] | 0.61–0.66 |
| BaA/Chr | <0.2 >0.35 0.20–0.35 <0.35 >0.35 >0.4 <0.4 | Petrogenic, Combustion Petroleum or combustion Coal combustion Vehicle emission Fresh particles, Ageing (photolysis) | [63] [63] [63] [67] [67] [71] [71] | 1.21–2.97 |
| LMW/HMW | <1 >1 | Pyrolytic Petrogenic | [72] [72] | 0.74–2.61 |
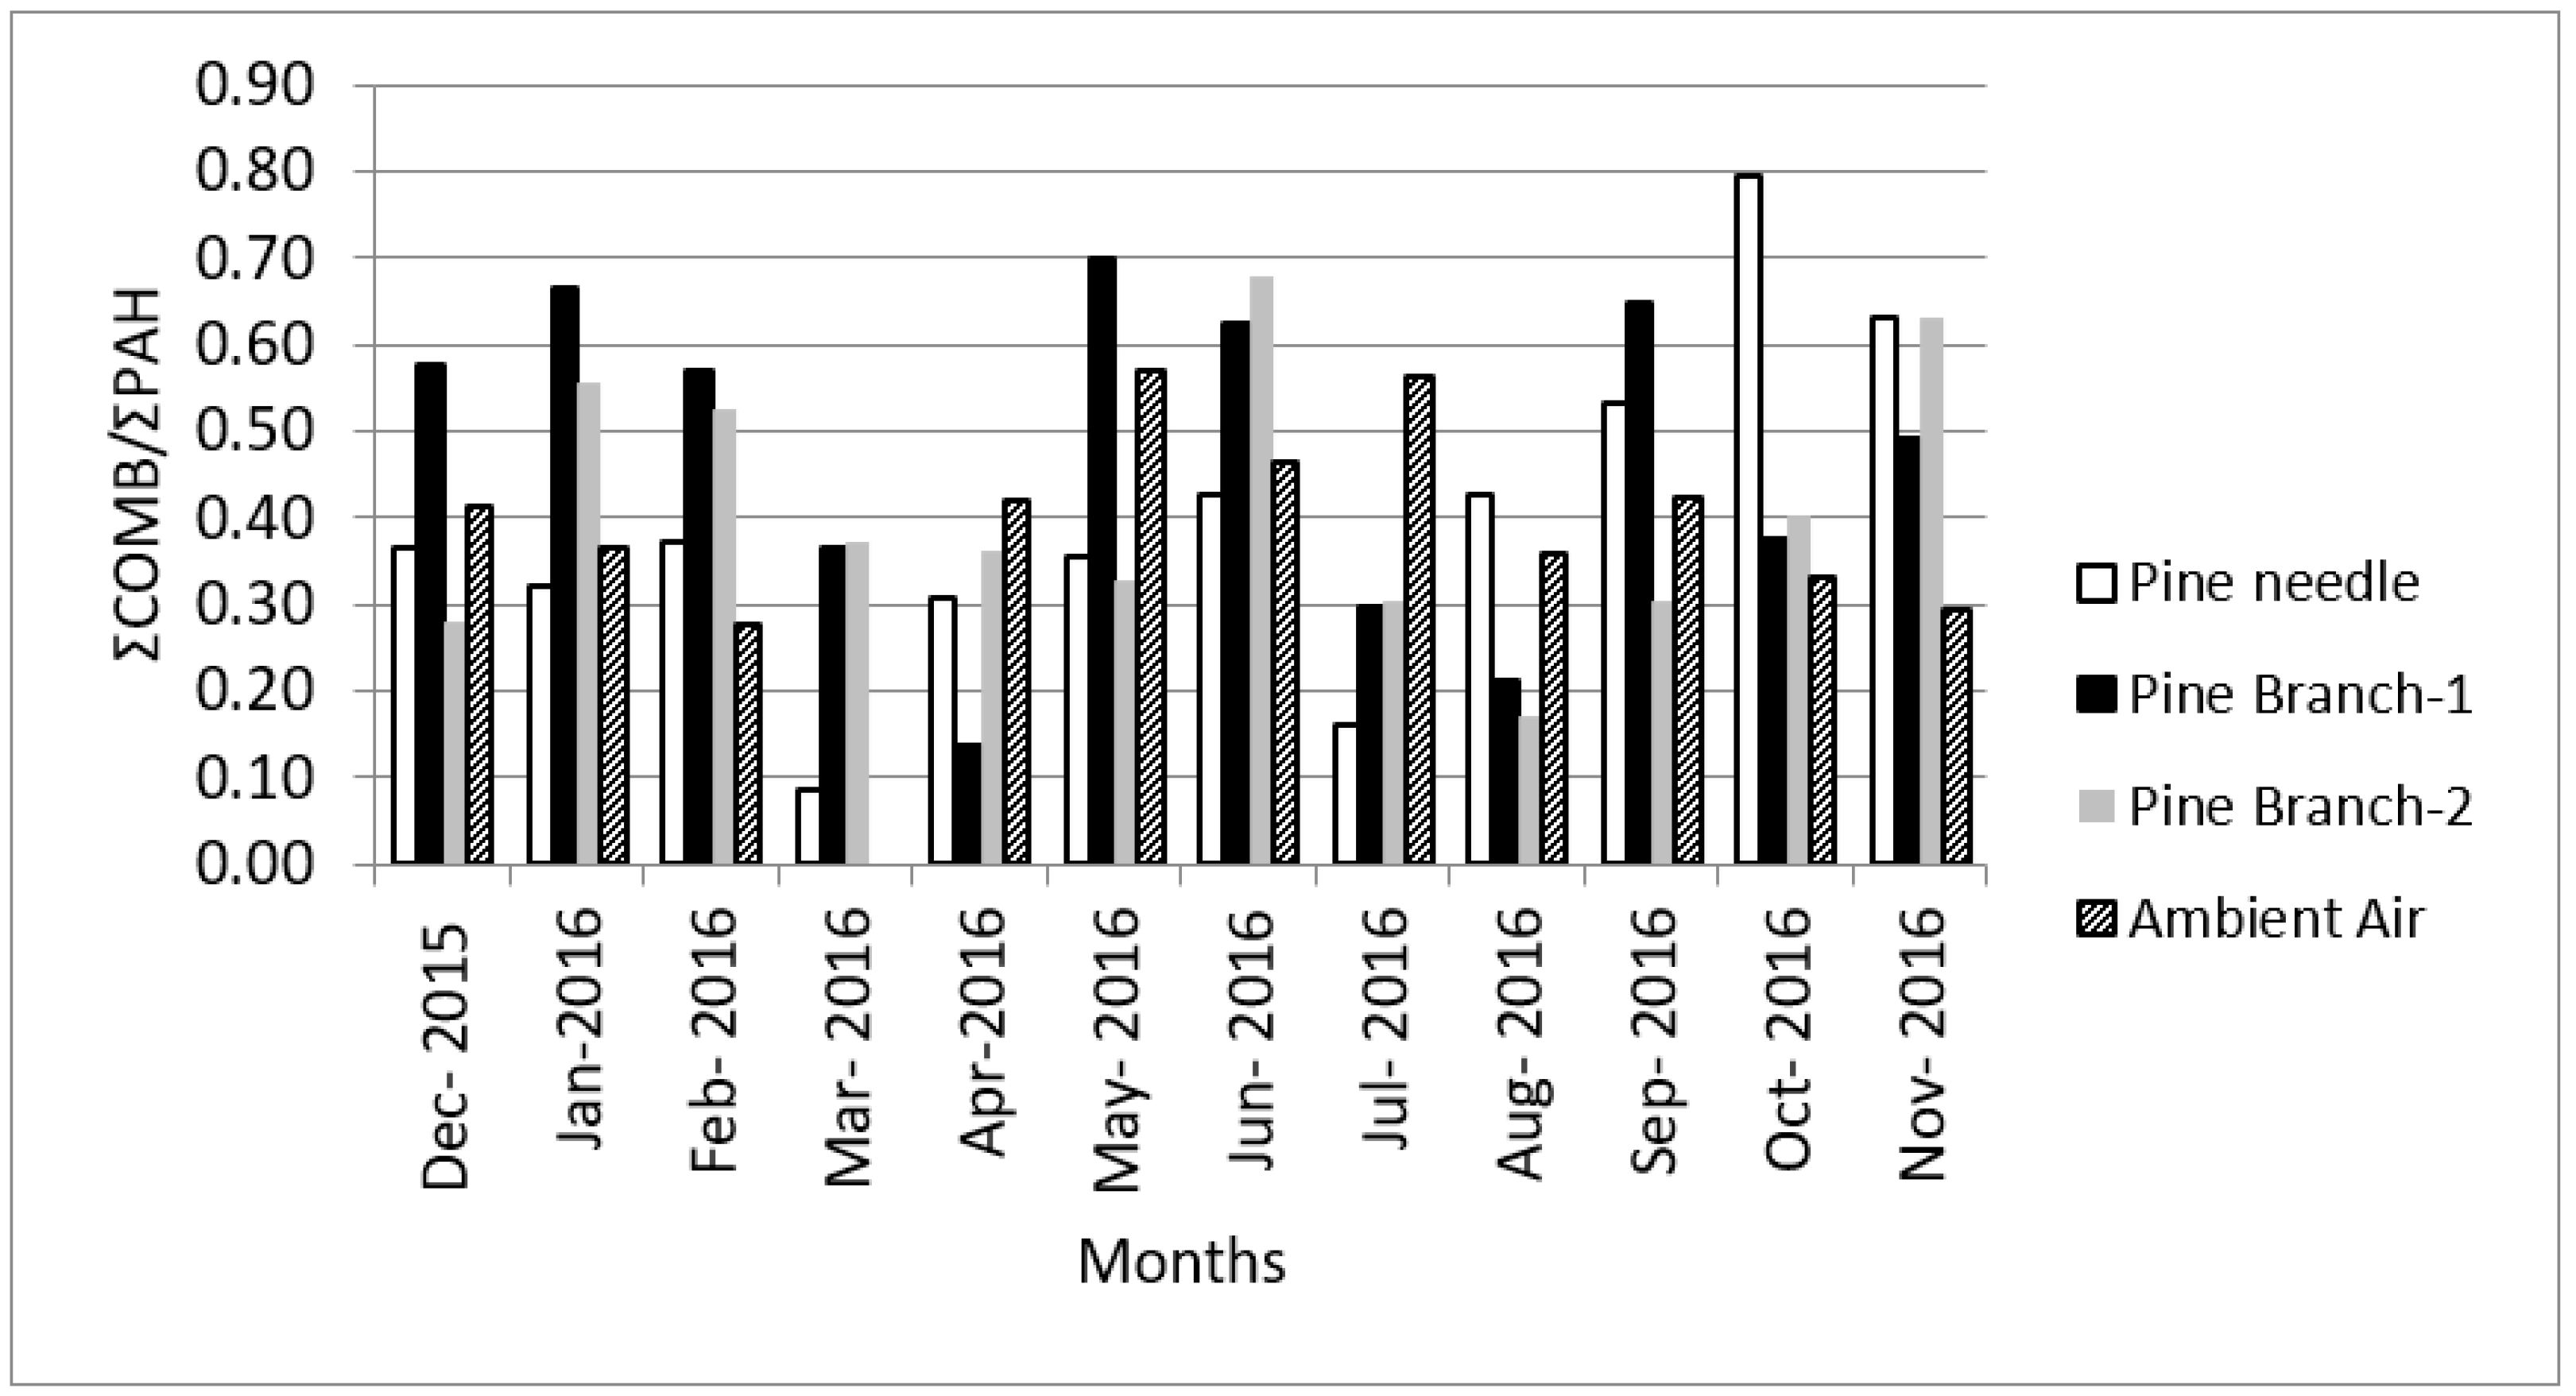
| ΣCOMB/ΣPAHs | >0.49 0.34 0.7–0.73 0.19–0.39 >0.7 0.41 0.51 0.30 0.8–0.9 | Industrial site Remote site Combusiton source: Non-catalyst-equipped vehicles Petrogenic Pyrogenic Non-catalyst-equipped Catalyst-equipped Heavy duty diesel trucks Coal burning | [73] [73] [74] [60] [68] [68] [68] [68] [75] | 0.28–0.57 |
3.1.3. Principle Component Analysis (PCA)
| Diagnostic Ratio | ||||
|---|---|---|---|---|
| Value | Potential Source | Reference | This Study | |
| Indeno/(Indeno+BghiP) | >0.50 <0.20 | Solid fuel (Grass, wood or coal) combustion Asphalt, tire particles, motor oils and uncombusted fuels, petrogenic | [96,97] [63,98,99] | 0–1 (Needle) 0.31–1 (1-year-old branches) 0–0.56 (2-year-old branches) |
| BaA/(BaA+Chr) | 0.2–0.35 >0.35 | Petroleum and fuel oil combustion, Solid fuel (Grass, wood or coal) combustion | [6] [6] | 0–1(Needle) 0–0.93 (1-year-old branches) 0–0.70 (2-year-old branches) |
| Flt/(Flt+Py) | <0.40 >0.50 0.40–0.50 | Petroleum Solid fuel (Grass, wood or coal) combustion Fossil fuel combustion petroleum and fuel oil combustion | [63] [23,96,97,100] [6] | 0–0.90 (Needle) 0.18-1 (1-year-old branches) 0.26–1 (2-year-old branches) |
| ΣCOMB/ΣPHs | >0.49 0.34 0.7–0.73 0.19–0.39 >0.7 0.41 0.51 0.30 0.8–0.9 | Industrial site Remote site Combustion source: non-catalyst-equipped vehicles Petrogenic Pyrogenic non-catalyst-equipped catalyst-equipped heavy duty diesel trucks Coal burning | [101] [101] [74] [60] [68] [68] [68] [68] [75] | 0.09–0.80 (Needle) 0.14–0.70 (1-year-old branches) 0.17–0.68 (2-year-old branches) |
3.2. Carcinogenic Potential
4. Conclusions
Supplementary Materials
Author Contributions
Funding
Institutional Review Board Statement
Informed Consent Statement
Data Availability Statement
Acknowledgments
Conflicts of Interest
References
- Abdallah, M.A.E.; Atia, N.N. Atmospheric concentrations, gaseous-particulate distribution, and carcinogenic potential of polycyclic aromatic hydrocarbons in Assiut, Egypt. Environ. Sci. Pollut. Res. 2014, 21, 8059–8069. [Google Scholar] [CrossRef] [PubMed]
- Fasani, D.; Fermo, P.; Barroso, P.J.; Martín, J.; Santos, J.L.; Aparicio, I.; Alonso, E. Analytical method for biomonitoring of PAH using leaves of bitter orange trees (Citrus Aurantium): A case study in South Spain. Water Air Soil. Pollut. 2016, 227, 360. [Google Scholar] [CrossRef]
- Salihoglu, N.K.; Salihoglu, G.; Tasdemir, Y.; Cindoruk, S.S.; Yolsal, D.; Ruken, O.; Karaca, G. Comparison of polycyclic aromatic hydrocarbons levels in sludges from municipal and industrial wastewater treatment plants. Arch. Environ. Contam. Toxicol. 2010, 58, 523–534. [Google Scholar] [CrossRef] [PubMed]
- Sari, M.F.; Esen, F.; Tasdemir, Y. Biomonitoring and source identification of Polycyclic Aromatic Hydrocarbons (PAHs) using pine tree components from three different sites in Bursa, Turkey. Arch. Environ. Contam. Toxicol. 2020, 78, 646–657. [Google Scholar] [CrossRef]
- Tasdemir, Y.; Esen, F. Urban air PAHs: Concentrations, temporal changes and gas/particle partitioning at a traffic site in Turkey. Atmos. Res. 2007, 84, 1–12. [Google Scholar] [CrossRef]
- Tobiszewski, M.; Namieśnik, J. PAH diagnostic ratios for the identification of pollution emission sources. Environ. Pollut. 2012, 162, 110–119. [Google Scholar] [CrossRef] [PubMed]
- Sanli, G.E.; Tasdemir, Y. Accumulations and temporal trends of Polychlorinated Biphenyls (PCBs) in olive tree components. Environ. Geochem. Health 2022, 44, 2577–2594. [Google Scholar] [CrossRef] [PubMed]
- Simonich, S.L.; Hites, R.A. Importance of vegetation in removing polycyclic aromatic hydrocarbons from the atmosphere. Nature 1994, 370, 49–51. [Google Scholar] [CrossRef]
- Srogi, K. Monitoring of environmental exposure to polycyclic aromatic hydrocarbons: A review. Environ. Chem. Lett. 2007, 5, 169–195. [Google Scholar] [CrossRef] [Green Version]
- Huckins, J.N.; Tubergen, M.W.; Manuweera, G.K. Semipermeable membrane devices containing model lipid: A new approach to monitoring the Bioavaiiability of Lipophilic contaminants and estimating their bioconcentration potential. Chemosphere 1990, 20, 533–552. [Google Scholar] [CrossRef]
- Odabasi, M.; Dumanoglu, Y.; Ozgunerge Falay, E.; Tuna, G.; Altiok, H.; Kara, M.; Bayram, A.; Tolunay, D.; Elbir, T. Investigation of spatial distributions and sources of Persistent Organic Pollutants (POPs) in a heavily polluted industrial region using tree components. Chemosphere 2016, 160, 114–125. [Google Scholar] [CrossRef]
- Ratola, N.; Amigo, J.M.; Oliveira, M.S.N.; Araújo, R.; Silva, J.A.; Alves, A. Differences between Pinus Pinea and Pinus Pinaster as bioindicators of polycyclic aromatic hydrocarbons. Environ. Exp. Bot. 2011, 72, 339–347. [Google Scholar] [CrossRef] [Green Version]
- Oishi, Y. Comparison of pine needles and mosses as bio-indicators for polycyclic aromatic hydrocarbons. J. Environ. Prot. 2013, 4, 106–113. [Google Scholar] [CrossRef] [Green Version]
- Piccardo, M.T.; Pala, M.; Bonaccurso, B.; Stella, A.; Redaelli, A.; Paola, G.; Valerio, F. Pinus Nigra and Pinus Pinaster needles as passive samplers of polycyclic aromatic hydrocarbons. Environ. Pollut. 2005, 133, 293–301. [Google Scholar] [CrossRef]
- Ratola, N.; Lacorte, S.; Alves, A.; Barceló, D. Analysis of polycyclic aromatic hydrocarbons in pine needles by gas chromatography-mass spectrometry: Comparison of different extraction and clean-up procedures. J. Chromatogr. A 2006, 1114, 198–204. [Google Scholar] [CrossRef] [PubMed]
- Simonich, S.L.; Hites, R.A. Organic pollutant accumulation in vegetation. Environ. Sci. Technol. 1995, 29, 2905–2914. [Google Scholar] [CrossRef]
- Tomashuk, T.A.; Truong, T.M.; Mantha, M.; McGowin, A.E. Atmospheric polycyclic aromatic hydrocarbon profiles and sources in pine needles and particulate matter in Dayton, Ohio, USA. Atmos. Environ. 2012, 51, 196–202. [Google Scholar] [CrossRef] [Green Version]
- Wang, D.; Tian, F.; Yang, M.; Liu, C.; Li, Y.-F. Application of positive matrix factorization to identify potential sources of PAHs in Soil of Dalian, China. Environ. Pollut. 2009, 157, 1559–1564. [Google Scholar] [CrossRef] [PubMed]
- Zítková, J.; Hegrová, J.; Keken, Z.; Ličbinský, R. Impact of road salting on scots pine (Pinus Sylvestris) and Norway Spruce (Picea Abies). Ecol. Eng. 2021, 159, 106129. [Google Scholar] [CrossRef]
- Cindoruk, S.S.; Sakin, A.E.; Tasdemir, Y. Levels of persistent organic pollutants in pine tree components and ambient air. Environ. Pollut. 2020, 256, 113418. [Google Scholar] [CrossRef]
- De Nicola, F.; Maisto, G.; Prati, M.V.; Alfani, A. Temporal variations in PAH concentrations in Quercus Ilex L. (Holm Oak) leaves in an urban area. Chemosphere 2005, 61, 432–440. [Google Scholar] [CrossRef] [PubMed]
- Hubai, K.; Kováts, N.; Sainnokhoi, T.-A.; Teke, G. Accumulation pattern of polycyclic aromatic hydrocarbons using Plantago Lanceolata L. as passive biomonitor. Environ. Sci. Pollut. Res. 2022, 29, 7300–7311. [Google Scholar] [CrossRef] [PubMed]
- Lehndorff, E.; Schwark, L. Biomonitoring of air quality in the cologne conurbation using pine needles as a passive sampler—Part II: Polycyclic Aromatic Hydrocarbons (PAH). Atmos. Environ. 2004, 38, 3793–3808. [Google Scholar] [CrossRef]
- Librando, V.; Perrini, G.; Tomasello, M. Biomonitoring of atmospheric PAHs by evergreen plants: Correlations and applicability. Polycycl. Aromat. Compd. 2002, 22, 549–559. [Google Scholar] [CrossRef]
- Marsili, M.; Stracquadanio, M.; Trombini, C.; Vassura, I. The epicuticular wax of laurus nobilis leaves as a passive sampler of polycyclic aromatic hydrocarbons in ambient air. Fresenius Environ. Bull. 2001, 10, 26–30. [Google Scholar]
- Meharg, A.A.; Wright, J.; Dyke, H.; Osborn, D. Polycyclic Aromatic Hydrocarbon (PAH) dispersion and deposition to vegetation and soil following a large scale chemical fire. Environ. Pollut. 1998, 99, 29–36. [Google Scholar] [CrossRef]
- Kargar, N.; Matin, G.; Matin, A.A.; Buyukisik, H.B. Biomonitoring, status and source risk assessment of Polycyclic Aromatic Hydrocarbons (PAHs) using honeybees, pine tree leaves, and propolis. Chemosphere 2017, 186, 140–150. [Google Scholar] [CrossRef] [PubMed]
- Tarricone, K.; Wagner, G.; Klein, R. Toward standardization of sample collection and preservation for the quality of results in biomonitoring with trees—A critical review. Ecol. Indic. 2015, 57, 341–359. [Google Scholar] [CrossRef]
- Chefetz, B.; Xing, B. Relative role of aliphatic and aromatic moieties as sorption domains for organic compounds: A review. Environ. Sci. Technol. 2009, 43, 1680–1688. [Google Scholar] [CrossRef]
- Zhang, M.; Zhu, L. Sorption of polycyclic aromatic hydrocarbons to carbohydrates and lipids of ryegrass root and implications for a sorption prediction model. Environ. Sci. Technol. 2009, 43, 2740–2745. [Google Scholar] [CrossRef] [PubMed]
- van Drooge, B.L.; Garriga, G.; Grimalt, J.O. Polycyclic aromatic hydrocarbons in pine needles (Pinus Halepensis) along a spatial gradient between a traffic intensive urban area (Barcelona) and a nearby natural park. Atmos. Pollut. Res. 2014, 5, 398–403. [Google Scholar] [CrossRef]
- Chrabąszcz, M.; Mróz, L. Tree bark, a valuable source of information on air quality. Pol. J. Environ. Stud. 2017, 26, 453–466. [Google Scholar] [CrossRef]
- Odabasi, M.; Ozgunerge Falay, E.; Tuna, G.; Altiok, H.; Kara, M.; Dumanoglu, Y.; Bayram, A.; Tolunay, D.; Elbir, T. Biomonitoring the spatial and historical variations of Persistent Organic Pollutants (POPs) in an industrial region. Environ. Sci. Technol. 2015, 49, 2105–2114. [Google Scholar] [CrossRef]
- Oishi, Y. Comparison of moss and pine needles as bioindicators of transboundary polycyclic aromatic hydrocarbon pollution in Central Japan. Environ. Pollut. 2018, 234, 330–338. [Google Scholar] [CrossRef] [PubMed]
- Zhu, X.; Fan, Z.T.; Wu, X.; Meng, Q.; Wang, S.W.; Tang, X.; Ohman-Strickland, P.; Georgopoulos, P.; Zhang, J.; Bonanno, L.; et al. Spatial variation of volatile organic compounds in a “hot spot” for air pollution. Atmos. Environ. 2008, 42, 7329–7338. [Google Scholar] [CrossRef] [PubMed] [Green Version]
- Farooq, S.; Ali-Musstjab-Akber-Shah Eqani, S.; Malik, R.N.; Katsoyiannis, A.; Zhang, G.; Zhang, Y.; Li, J.; Xiang, L.; Jones, K.C.; Shinwari, Z.K. Occurrence, finger printing and ecological risk assessment of Polycyclic Aromatic Hydrocarbons (PAHs) in the Chenab River, Pakistan. J. Environ. Monit. 2011, 13, 3207–3215. [Google Scholar] [CrossRef] [PubMed]
- Dvorská, A.; Lammel, G.; Klánová, J. Use of diagnostic ratios for studying source apportionment and reactivity of ambient polycyclic aromatic hydrocarbons over Central Europe. Atmos. Environ. 2011, 45, 420–427. [Google Scholar] [CrossRef]
- Abdel-Shafy, H.I.; Mansour, M.S.M. A review on polycyclic aromatic hydrocarbons: Source, environmental impact, effect on human health and remediation. Egypt. J. Pet. 2016, 25, 107–123. [Google Scholar] [CrossRef] [Green Version]
- IARC Working Group. Some non-heterocyclic polycyclic aromatic hydrocarbons and some related exposures. IARC Monogr. Eval. Carcinog. Risks Hum. 2010, 92, 1–853. [Google Scholar]
- ACGIH (American Conference of Governmental Industrial Hygienists). Polycyclic Aromatic Hydrocarbons (PAHs) Biologic Exposure Indices (BEI) Cincinnati; American Conference of Governmental Industrial Hygienists: Cincinnati, OH, USA, 2005. [Google Scholar]
- Kim, K.H.; Jahan, S.A.; Kabir, E.; Brown, R.J.C. A review of airborne Polycyclic Aromatic Hydrocarbons (PAHs) and their human health effects. Environ. Int. 2013, 60, 71–80. [Google Scholar] [CrossRef] [PubMed]
- Esen, F.; Evci, Y.M.; Tasdemir, Y. Evaluation and application of a passive air sampler for Polycylic Aromatic Hydrocarbons (PAHs). J. Environ. Sci. Heal. Part A 2017, 52, 1022–1029. [Google Scholar] [CrossRef] [PubMed]
- Evci, Y.M.; Esen, F.; Taşdemir, Y. Monitoring of long-term outdoor concentrations of PAHs with passive air samplers and comparison with meteorological data. Arch. Environ. Contam. Toxicol. 2016, 71, 246–256. [Google Scholar] [CrossRef] [PubMed]
- The University of Iowa. PUF-PAS Sampling Rate Model Interface. Available online: http://s-iihr41.iihr.uiowa.edu/pufpas_model/ (accessed on 28 April 2021).
- Schuster, J.K.; Harner, T.; Eng, A.; Rauert, C.; Su, K.; Hornbuckle, K.C.; Johnson, C.W. Tracking POPs in global air from the first 10 years of the GAPS network (2005 to 2014). Environ. Sci. Technol. 2021, 55, 9479–9488. [Google Scholar] [CrossRef] [PubMed]
- Sari, M.F.; Esen, F.; Tasdemir, Y. Characterization, source apportionment, air/plant partitioning and cancer risk assessment of atmospheric PAHs measured with tree components and passive air sampler. Environ. Res. 2021, 194, 110508. [Google Scholar] [CrossRef]
- Esen, F.; Cindoruk, S.S.; Taşdemir, Y. Ambient concentrations and gas/particle partitioning of polycyclic aromatic hydrocarbons in an urban site in Turkey. Environ. Forensics 2006, 7, 303–312. [Google Scholar] [CrossRef]
- Vardar, N.; Tasdemir, Y.; Odabasi, M.; Noll, K.E. Characterization of atmospheric concentrations and partitioning of PAHs in the Chicago atmosphere. Sci. Total Environ. 2004, 327, 163–174. [Google Scholar] [CrossRef]
- Birgul, A.; Tasdemir, Y. Concentrations, gas-particle partitioning, and seasonal variations of polycyclic aromatic hydrocarbons at four sites in Turkey. Arch. Environ. Contam. Toxicol. 2015, 68, 46–63. [Google Scholar] [CrossRef]
- Eker, G. Bursa’nin Zeytinlik Arazilerindeki Topraklarda Poliaromatik Hidrokarbon (Pah) Konsantrasyonlarinin Bölgesel Deǧişimi. J. Fac. Eng. Archit. Gazi Univ. 2017, 32, 607–616. [Google Scholar] [CrossRef] [Green Version]
- Fernández-Varela, R.; Ratola, N.; Alves, A.; Amigo, J.M. Relationship between levels of polycyclic aromatic hydrocarbons in pine needles and socio-geographic parameters. J. Environ. Manage 2015, 156, 52–61. [Google Scholar] [CrossRef] [Green Version]
- Ratola, N.; Amigo, J.M.; Alves, A. Levels and sources of PAHs in selected sites from portugal: Biomonitoring with Pinus Pinea and Pinus Pinaster needles. Arch. Environ. Contam. Toxicol. 2010, 58, 631–647. [Google Scholar] [CrossRef] [Green Version]
- Çalişkan Eleren, S.; Tasdemir, Y. Levels, distributions, and seasonal variations of Polycyclic Aromatic Hydrocarbons (PAHs) in ambient air and pine components. Environ. Monit. Assess 2021, 193, 253. [Google Scholar] [CrossRef] [PubMed]
- Bano, S.; Pervez, S.; Chow, J.C.; Matawle, J.L.; Watson, J.G.; Sahu, R.K.; Srivastava, A.; Tiwari, S.; Pervez, Y.F.; Deb, M.K. Coarse Particle (PM10–2.5) source profiles for emissions from domestic cooking and industrial process in Central India. Sci. Total Environ. 2018, 627, 1137–1145. [Google Scholar] [CrossRef] [PubMed]
- Liu, Y.; Yan, C.; Ding, X.; Wang, X.; Fu, Q.; Zhao, Q.; Zhang, Y.; Duan, Y.; Qiu, X.; Zheng, M. Sources and spatial distribution of particulate polycyclic aromatic hydrocarbons in Shanghai, China. Sci. Total Environ. 2017, 584–585, 307–317. [Google Scholar] [CrossRef] [PubMed] [Green Version]
- Wu, B.; Guo, S.; Li, X.; Wang, J. Temporal and spatial variations of Polycyclic Aromatic Hydrocarbons (PAHs) in soils from a typical organic sewage irrigation area. Sci. Total Environ. 2018, 613–614, 513–520. [Google Scholar] [CrossRef] [PubMed]
- Dickhut, R.M.; Canuel, E.A.; Gustafson, K.E.; Liu, K.; Arzayus, K.M.; Walker, S.E.; Edgecombe, G.; Gaylor, M.O.; MacDonald, E.H. Automotive sources of carcinogenic polycyclic aromatic hydrocarbons associated with particulate matter in the Chesapeake Bay Region. Environ. Sci. Technol. 2000, 34, 4635–4640. [Google Scholar] [CrossRef]
- Khalili, N.R.; Scheff, P.A.; Holsen, T.M. PAH source fingerprints for coke ovens, diesel and, gasoline engines, highway tunnels, and wood combustion emissions. Atmos. Environ. 1995, 29, 533–542. [Google Scholar] [CrossRef]
- Kaur, S.; Senthilkumar, K.; Verma, V.K.; Kumar, B.; Kumar, S.; Katnoria, J.K.; Sharma, C.S. Preliminary analysis of polycyclic aromatic hydrocarbons in air particles (PM10) in Amritsar, India: Sources, apportionment, and possible risk implications to humans. Arch. Environ. Contam. Toxicol. 2013, 65, 382–395. [Google Scholar] [CrossRef]
- Kavouras, I.G.; Koutrakis, P.; Tsapakis, M.; Lagoudaki, E.; Stephanou, E.G.; Von Baer, D.; Oyola, P. Source apportionment of urban particulate aliphatic and Polynuclear Aromatic Hydrocarbons (PAHs) using multivariate methods. Environ. Sci. Technol. 2001, 35, 2288–2294. [Google Scholar] [CrossRef]
- Ravindra, K.; Wauters, E.; Tyagi, S.K.; Mor, S.; Van Grieken, R. Assessment of air quality after the implementation of Compressed Natural Gas (CNG) as fuel in public transport in Delhi, India. Environ. Monit. Assess 2006, 115, 405–417. [Google Scholar] [CrossRef] [Green Version]
- Galarneau, E. Source specificity and atmospheric processing of airborne PAHs: Implications for source apportionment. Atmos. Environ. 2008, 42, 8139–8149. [Google Scholar] [CrossRef]
- Yunker, M.B.; Macdonald, R.W.; Vingarzan, R.; Mitchell, R.H.; Goyette, D.; Sylvestre, S. PAHs in the Fraser River Basin: A Critical appraisal of PAH ratios as indicators of PAH source and composition. Org. Geochem. 2002, 33, 489–515. [Google Scholar] [CrossRef]
- Caricchia, A.M.; Chiavarini, S.; Pezza, M. Polycyclic aromatic hydrocarbons in the urban atmospheric particulate matter in the city of Naples (Italy). Atmos. Environ. 1999, 33, 3731–3738. [Google Scholar] [CrossRef]
- Ravindra, K.; Sokhi, R.; Van Grieken, R. Atmospheric polycyclic aromatic hydrocarbons: Source attribution, emission factors and regulation. Atmos. Environ. 2008, 42, 2895–2921. [Google Scholar] [CrossRef] [Green Version]
- Shahsavani, S.; Hoseini, M.; Dehghani, M.; Fararouei, M. Characterisation and potential source identification of polycyclic aromatic hydrocarbons in atmospheric particles (PM10) from urban and suburban residential areas in Shiraz, Iran. Chemosphere 2017, 183, 557–564. [Google Scholar] [CrossRef]
- Akyüz, M.; Çabuk, H. Gas–particle partitioning and seasonal variation of polycyclic aromatic hydrocarbons in the atmosphere of Zonguldak, Turkey. Sci. Total Environ. 2010, 408, 5550–5558. [Google Scholar] [CrossRef]
- Rogge, W.F.; Hildemann, L.M.; Mazurek, M.A.; Cass, G.R.; Simoneit, B.R.T. Sources of Fine Organic Aerosol. 2. Noncatalyst and catalyst-equipped automobiles and heavy-duty diesel trucks. Environ. Sci. Technol. 1993, 27, 636–651. [Google Scholar] [CrossRef]
- Baumard, P.; Budzinski, H.; Michon, Q.; Garrigues, P.; Burgeot, T.; Bellocq, J. Origin and bioavailability of PAHs in the mediterranean sea from mussel and sediment records. Estuar. Coast Shelf Sci. 1998, 47, 77–90. [Google Scholar] [CrossRef]
- Hoseini, M.; Yunesian, M.; Nabizadeh, R.; Yaghmaeian, K.; Ahmadkhaniha, R.; Rastkari, N.; Parmy, S.; Faridi, S.; Rafiee, A.; Naddafi, K. Characterization and risk assessment of Polycyclic Aromatic Hydrocarbons (PAHs) in urban atmospheric particulate of Tehran, Iran. Environ. Sci. Pollut. Res. 2016, 23, 1820–1832. [Google Scholar] [CrossRef]
- Lohmann, R.; Northcott, G.L.; Jones, K.C. Assessing the contribution of diffuse domestic burning as a source of PCDD/Fs, PCBs, and PAHs to the U.K. atmosphere. Environ. Sci. Technol. 2000, 34, 2892–2899. [Google Scholar] [CrossRef]
- Wilcke, W. Global patterns of Polycyclic Aromatic Hydrocarbons (PAHs) in soil. Geoderma 2007, 141, 157–166. [Google Scholar] [CrossRef]
- Sun, F.; Wen, D.; Kuang, Y.; Li, J.; Li, J.; Zuo, W. Concentrations of heavy metals and polycyclic aromatic hydrocarbons in needles of Masson Pine (Pinus Massoniana L.) growing nearby different industrial sources. J. Environ. Sci. 2010, 22, 1006–1013. [Google Scholar] [CrossRef]
- Hwang, H.M.; Wade, T.L.; Sericano, J.L. Concentrations and source characterization of polycyclic aromatic hydrocarbons in pine needles from Korea, Mexico, and United States. Atmos. Environ. 2003, 37, 2259–2267. [Google Scholar] [CrossRef]
- Cecinato, A.; Marino, F.; Di Filippo, P.; Lepore, L.; Possanzini, M. Distribution of N-Alkanes, polynuclear aromatic hydrocarbons and nitrated polynuclear aromatic hydrocarbons between the fine and coarse fractions of inhalable atmospheric particulates. J. Chromatogr. A 1999, 846, 255–264. [Google Scholar] [CrossRef]
- Orecchio, S.; Gianguzza, A.; Culotta, L. Absorption of polycyclic aromatic hydrocarbons by Pinus bark: Analytical method and use for environmental pollution monitoring in the Palermo Area (Sicily, Italy). Environ. Res. 2008, 107, 371–379. [Google Scholar] [CrossRef]
- Katsoyiannis, A.; Terzi, E.; Cai, Q.Y. On the use of PAH molecular diagnostic ratios in sewage sludge for the understanding of the PAH sources. Is this use appropriate? Chemosphere 2007, 69, 1337–1339. [Google Scholar] [CrossRef] [PubMed]
- Shabbaj, I.I.; Alghamdi, M.A.; Khoder, M.I. Street dust—bound polycyclic aromatic hydrocarbons in a Saudi Coastal City: Status, profile, sources, and human health risk assessment. Int. J. Environ. Res. Public Health 2018, 15, 2397. [Google Scholar] [CrossRef] [PubMed] [Green Version]
- Katsoyiannis, A.; Breivik, K. Model-based evaluation of the use of polycyclic aromatic hydrocarbons molecular diagnostic ratios as a source identification tool. Environ. Pollut. 2014, 184, 488–494. [Google Scholar] [CrossRef] [Green Version]
- Mishra, N.; Ayoko, G.A.; Morawska, L. Atmospheric polycyclic aromatic hydrocarbons in the urban environment: Occurrence, toxicity and source apportionment. Environ. Pollut. 2016, 208, 110–117. [Google Scholar] [CrossRef] [Green Version]
- Soclo, H.H.; Garrigues, P.; Ewald, M. Origin of Polycyclic Aromatic Hydrocarbons (PAHs) in coastal marine sediments: Case Studies in Cotonou (Benin) and Aquitaine (France) areas. Mar. Pollut. Bull. 2000, 40, 387–396. [Google Scholar] [CrossRef]
- Sojinu, O.S.; Sonibare, O.O.; Ekundayo, O.; Zeng, E.Y. Biomonitoring potentials of Polycyclic Aromatic Hydrocarbons (PAHs) by higher plants from an oil exploration site, Nigeria. J. Hazard Mater. 2010, 184, 759–764. [Google Scholar] [CrossRef]
- Yang, H.H.; Lai, S.O.; Hsieh, L.T.; Hsueh, H.J.; Chi, T.W. Profiles of PAH emission from steel and iron industries. Chemosphere 2002, 48, 1061–1074. [Google Scholar] [CrossRef]
- Khedidji, S.; Balducci, C.; Ladji, R.; Cecinato, A.; Perilli, M.; Yassaa, N. Chemical composition of particulate organic matter at industrial, university and forest areas located in Bouira Province, Algeria. Atmos. Pollut. Res. 2017, 8, 474–482. [Google Scholar] [CrossRef]
- Ladji, R.; Yassaa, N.; Balducci, C.; Cecinato, A. Particle size distribution of N-alkanes and Polycyclic Aromatic Hydrocarbons (PAHS) in urban and industrial aerosol of Algiers, Algeria. Environ. Sci. Pollut. Res. 2014, 21, 1819–1832. [Google Scholar] [CrossRef] [PubMed]
- Sienra, M.D.R.; Rosazza, N.G.; Préndez, M. Polycyclic aromatic hydrocarbons and their molecular diagnostic ratios in urban atmospheric respirable particulate matter. Atmos. Res. 2005, 75, 267–281. [Google Scholar] [CrossRef]
- Mantis, J.; Chaloulakou, A.; Samara, C. PM10-bound Polycyclic Aromatic Hydrocarbons (PAHs) in the greater area of Athens, Greece. Chemosphere 2005, 59, 593–604. [Google Scholar] [CrossRef]
- Yang, H.H.; Lee, W.J.; Chen, S.J.; Lai, S.O. PAH Emission from various industrial stacks. J. Hazard Mater. 1998, 60, 159–174. [Google Scholar] [CrossRef]
- Azid, A.; Juahir, H.; Ezani, E.; Toriman, M.E.; Endut, A.; Rahman, M.N.A.; Yunus, K.; Kamarudin, M.K.A.; Hasnam, C.N.C.; Saudi, A.S.M.; et al. Identification source of variation on regional impact of air quality pattern using chemometric. Aerosol Air Qual. Res. 2015, 15, 1545–1558. [Google Scholar] [CrossRef] [Green Version]
- Iqbal, K.; Ahmad, S.; Dutta, V. Pollution mapping in the urban segment of a tropical river: Is Water Quality Index (WQI) enough for a nutrient-polluted river? Appl. Water Sci. 2019, 9, 197. [Google Scholar] [CrossRef] [Green Version]
- Dong, T.T.T.; Lee, B.K. Characteristics, toxicity, and source apportionment of Polycylic Aromatic Hydrocarbons (PAHs) in road dust of Ulsan, Korea. Chemosphere 2009, 74, 1245–1253. [Google Scholar] [CrossRef]
- Ho, K.F.; Lee, S.C.; Chiu, G.M.Y. Characterization of selected volatile organic compounds, polycyclic aromatic hydrocarbons and carbonyl compounds at a roadside monitoring station. Atmos. Environ. 2002, 36, 57–65. [Google Scholar] [CrossRef]
- Li, A.; Jang, J.K.; Scheff, P.A. Application of EPA CMB8.2 model for source apportionment of sediment PAHS in Lake Calumet, Chicago. Environ. Sci. Technol. 2003, 37, 2958–2965. [Google Scholar] [CrossRef]
- Ma, W.L.; Li, Y.F.; Qi, H.; Sun, D.Z.; Liu, L.Y.; Wang, D.G. Seasonal variations of sources of Polycyclic Aromatic Hydrocarbons (PAHs) to a northeastern urban city, China. Chemosphere 2010, 79, 441–447. [Google Scholar] [CrossRef] [PubMed]
- Çed ve Çevre İzinleri Şube Müdürlüğü, Ç.V.Ş.İ. Bursa İli 2016 Yılı Çevre Durum Raporu. 2017. Available online: https://webdosya.csb.gov.tr/db/ced/editordosya/Bursa_icdr2016.pdf (accessed on 28 April 2021).
- Freeman, D.J.; Cattell, F.C.R. Woodburning as a source of atmospheric polycyclic aromatic hydrocarbons. Environ. Sci. Technol. 1990, 24, 1581–1585. [Google Scholar] [CrossRef]
- Jenkins, B.M.; Jones, A.D.; Turn, S.Q.; Williams, R.B. Emission factors for polycyclic aromatic hydrocarbons from biomass burning. Environ. Sci. Technol. 1996, 30, 2462–2469. [Google Scholar] [CrossRef]
- Van Metre, P.C.; Mahler, B.J. Contribution of PAHs from coal-tar pavement sealcoat and other sources to 40 U.S. lakes. Sci. Total Environ. 2010, 409, 334–344. [Google Scholar] [CrossRef] [PubMed]
- De Nicola, F.; Lancellotti, C.; Prati, M.V.; Maisto, G.; Alfani, A. Biomonitoring of PAHs by using Quercus Ilex leaves: Source diagnostic and toxicity assessment. Atmos. Environ. 2011, 45, 1428–1433. [Google Scholar] [CrossRef]
- Budzinski, H.; Jones, I.; Bellocq, J.; Piérard, C.; Garrigues, P. Evaluation of sediment contamination by polycyclic aromatic hydrocarbons in the Gironde estuary. Mar. Chem. 1997, 58, 85–97. [Google Scholar] [CrossRef]
- Orecchio, S. PAHs Associated with the Leaves of Quercus Ilex L.: Extraction, GC-MS analysis, distribution and sources. Assessment of air quality in the Palermo (Italy) Area. Atmos. Environ. 2007, 41, 8669–8680. [Google Scholar] [CrossRef]
- Ma, J.; Zhang, W.; Chen, Y.; Zhang, S.; Feng, Q.; Hou, H.; Chen, F. Spatial variability of PAHs and microbial community structure in surrounding surficial soil of coal-fired power plants in Xuzhou, China. Int. J. Environ. Res. Public Health 2016, 13, 878. [Google Scholar] [CrossRef] [Green Version]
- Yang, J.; Xu, W.; Cheng, H. Seasonal variations and sources of airborne Polycyclic Aromatic Hydrocarbons (PAHs) in Chengdu, China. Atmosphere 2018, 9, 63. [Google Scholar] [CrossRef] [Green Version]
- Klánová, J.; Čupr, P.; Baráková, D.; Šeda, Z.; Anděl, P.; Holoubek, I. Can pine needles indicate trends in the air pollution levels at remote sites? Environ. Pollut. 2009, 157, 3248–3254. [Google Scholar] [CrossRef] [PubMed]
- Syed, J.H.; Iqbal, M.; Zhong, G.; Katsoyiannis, A.; Yadav, I.C.; Li, J.; Zhang, G. Polycyclic Aromatic Hydrocarbons (PAHs) in Chinese forest soils: Profile composition, spatial variations and source apportionment. Sci. Rep. 2017, 7, 2692. [Google Scholar] [CrossRef] [PubMed]
- Fang, G.C.; Chang, C.N.; Wu, Y.S.; Fu, P.P.C.; Yang, I.L.; Chen, M.H. Characterization, identification of ambient air and road dust polycyclic aromatic hydrocarbons in central Taiwan, Taichung. Sci. Total Environ. 2004, 327, 135–146. [Google Scholar] [CrossRef]
- Motelay-Massei, A.; Ollivon, D.; Garban, B.; Tiphagne-Larcher, K.; Zimmerlin, I.; Chevreuil, M. PAHs in the Bulk Atmospheric deposition of the Seine River Basin: Source identification and apportionment by ratios, multivariate statistical techniques and scanning electron microscopy. Chemosphere 2007, 67, 312–321. [Google Scholar] [CrossRef]
- Sulong, N.A.; Latif, M.T.; Sahani, M.; Khan, M.F.; Fadzil, M.F.; Tahir, N.M.; Mohamad, N.; Sakai, N.; Fujii, Y.; Othman, M.; et al. Distribution, sources and potential health risks of Polycyclic Aromatic Hydrocarbons (PAHs) in PM2.5 Collected during different monsoon seasons and haze episode in Kuala Lumpur. Chemosphere 2019, 219, 1–14. [Google Scholar] [CrossRef]
- Guo, H.; Lee, S.C.; Ho, K.F.; Wang, X.M.; Zou, S.C. Particle-associated polycyclic aromatic hydrocarbons in urban air of Hong Kong. Atmos. Environ. 2003, 37, 5307–5317. [Google Scholar] [CrossRef]
- Park, S.U.; Kim, J.G.; Jeong, M.J.; Song, B.J. Source identification of atmospheric polycyclic aromatic hydrocarbons in industrial complex using diagnostic ratios and multivariate factor analysis. Arch. Environ. Contam. Toxicol. 2011, 60, 576–589. [Google Scholar] [CrossRef]
- Jamhari, A.A.; Sahani, M.; Latif, M.T.; Chan, K.M.; Tan, H.S.; Khan, M.F.; Mohd Tahir, N. Concentration and source identification of Polycyclic Aromatic Hydrocarbons (PAHs) in PM10 of urban, industrial and semi-urban areas in Malaysia. Atmos. Environ. 2014, 86, 16–27. [Google Scholar] [CrossRef]
- Fang, Y.; Chen, Y.; Tian, C.; Lin, T.; Hu, L.; Li, J.; Zhang, G. Application of PMF receptor model merging with PAHs signatures for source apportionment of black carbon in the continental shelf surface sediments of the Bohai and Yellow Seas, China. J. Geophys. Res. Ocean 2016, 121, 1346–1359. [Google Scholar] [CrossRef] [Green Version]
- Hussain, K.; Hoque, R.R. Seasonal attributes of urban soil PAHs of the Brahmaputra Valley. Chemosphere 2015, 119, 794–802. [Google Scholar] [CrossRef] [PubMed]
- Hussain, K.; Rahman, M.; Prakash, A.; Hoque, R.R. Street dust bound PAHs, carbon and heavy metals in Guwahati City—Seasonality, toxicity and sources. Sustain. Cities Soc. 2015, 19, 17–25. [Google Scholar] [CrossRef]
- Lakhani, A. Source apportionment of particle bound polycyclic aromatic hydrocarbons at an industrial location in Agra, India. Sci. World J. 2012, 2012, 781291. [Google Scholar] [CrossRef]
- Callén, M.S.; Iturmendi, A.; López, J.M. Source apportionment of atmospheric PM2.5-bound polycyclic aromatic hydrocarbons by a PMF receptor model. assessment of potential risk for human health. Environ. Pollut. 2014, 195, 167–177. [Google Scholar] [CrossRef]
- Lee, J.H.; Gigliotti, C.L.; Offenberg, J.H.; Eisenreich, S.J.; Turpin, B.J. Sources of polycyclic aromatic hydrocarbons to the Hudson River Airshed. Atmos. Environ. 2004, 38, 5971–5981. [Google Scholar] [CrossRef]
- Chen, H.-Y.; Teng, Y.-G.; Wang, J.-S. Source apportionment of Polycyclic Aromatic Hydrocarbons (PAHs) in surface sediments of the Rizhao Coastal Area (China) using diagnostic ratios and factor analysis with nonnegative constraints. Sci. Total Environ. 2012, 414, 293–300. [Google Scholar] [CrossRef]
- Jiao, H.; Wang, Q.; Zhao, N.; Jin, B.; Zhuang, X.; Bai, Z. Distributions and sources of Polycyclic Aromatic Hydrocarbons (PAHs) in soils around a chemical plant in Shanxi, China. Int. J. Environ. Res. Public Health 2017, 14, 1198. [Google Scholar] [CrossRef] [PubMed]
- Cao, Q.; Wang, H.; Chen, G. Source apportionment of PAHs using two mathematical models for mangrove sediments in Shantou Coastal Zone, China. Estuaries Coasts 2011, 34, 950–960. [Google Scholar] [CrossRef]
- Zhang, W.; Wei, C.; Chai, X.; He, J.; Cai, Y.; Ren, M.; Yan, B.; Peng, P.; Fu, J. The behaviors and fate of Polycyclic Aromatic Hydrocarbons (PAHs) in a coking wastewater treatment plant. Chemosphere 2012, 88, 174–182. [Google Scholar] [CrossRef]
- Ciaparra, D.; Aries, E.; Booth, M.J.; Anderson, D.R.; Almeida, S.M.; Harrad, S. Characterisation of volatile organic compounds and polycyclic aromatic hydrocarbons in the ambient air of steelworks. Atmos. Environ. 2009, 43, 2070–2079. [Google Scholar] [CrossRef]
- Jang, E.; Alam, M.S.; Harrison, R.M. Source apportionment of polycyclic aromatic hydrocarbons in urban air using positive matrix factorization and spatial distribution analysis. Atmos. Environ. 2013, 79, 271–285. [Google Scholar] [CrossRef]
- Zhao, Z.; Qin, Z.; Cao, J.; Xia, L. Source and ecological risk characteristics of PAHs in sediments from Qinhuai River and Xuanwu Lake, Nanjing, China. J. Chem. 2017, 2017, 3510796. [Google Scholar] [CrossRef] [Green Version]
- Yu, Y.; Yang, Y.; Liu, M.; Zheng, X.; Liu, Y.; Wang, Q.; Liu, W. PAHs in organic film on glass window surfaces from Central Shanghai, China: Distribution, sources and risk assessment. Environ. Geochem. Health 2014, 36, 665–675. [Google Scholar] [CrossRef] [PubMed]
- Kim, L.; Jeon, H.J.; Kim, Y.C.; Yang, S.H.; Choi, H.; Kim, T.O.; Lee, S.E. Monitoring polycyclic aromatic hydrocarbon concentrations and distributions in rice paddy soils from Gyeonggi-Do, Ulsan, and Pohang. Appl. Biol. Chem. 2019, 62, 18. [Google Scholar] [CrossRef] [Green Version]
- Chen, Y.; Sheng, G.; Bi, X.; Feng, Y.; Mai, B.; Fu, J. Emission factors for carbonaceous particles and polycyclic aromatic hydrocarbons from residential coal combustion in China. Environ. Sci. Technol. 2005, 39, 1861–1867. [Google Scholar] [CrossRef] [PubMed]
- Tian, Y.Z.; Li, W.H.; Shi, G.L.; Feng, Y.C.; Wang, Y.Q. Relationships between PAHs and PCBs, and quantitative source apportionment of PAHs toxicity in sediments from Fenhe Reservoir and Watershed. J. Hazard Mater. 2013, 248–249, 89–96. [Google Scholar] [CrossRef] [PubMed]
- Nisbet, I.C.T.; LaGoy, P.K. Toxic Equivalency Factors (TEFs) for Polycyclic Aromatic Hydrocarbons (PAHs). Regul. Toxicol. Pharmacol. 1992, 16, 290–300. [Google Scholar] [CrossRef]
- Hertel, R.F.; Rosner, G.; Kielhorn, J.; Artelt, S.; Boehncke, A.; Creutzenberg, O.; Mangelsdorf, I.; Menichini, E.; Grover, P.L.; Blok, J.; et al. Selected Non-Heterocyclic Polycyclic Aromatic Hydrocarbons; World Health Organization: Geneva, Switzerland, 1998; ISBN 9241572027.
- Callén, M.S.; López, J.M.; Iturmendi, A.; Mastral, A.M. Nature and sources of particle associated Polycyclic Aromatic Hydrocarbons (PAH) in the atmospheric environment of an urban area. Environ. Pollut. 2013, 183, 166–174. [Google Scholar] [CrossRef] [Green Version]
- Cal-EPA. Air Toxics Hot Spots Program Risk Assessment Guidelines Part II: Technical Support Document for Describing Available Cancer Potency Factors; Office of Environmental Health Hazards Assessment: Oakland, CA, USA, 2005.
- OEHHA. Benzo[a]Pyrene as a Toxic Air Contaminant—California Air Resources Board Office of Environmental Health Hazard-Assessment; Office of Environmental Health Hazards Assessment: Oakland, CA, USA, 1994.
- World Health Organization. Air quality guidelines for Europe. Environ. Sci. Pollut. Res. 1996, 3, 23. [Google Scholar] [CrossRef]
- Ramírez, N.; Cuadras, A.; Rovira, E.; Marcé, R.M.; Borrull, F. Risk assessment related to atmospheric polycyclic aromatic hydrocarbons in gas and particle phases near industrial sites. Environ. Health Perspect. 2011, 119, 1110–1116. [Google Scholar] [CrossRef] [Green Version]
- Taghvaee, S.; Sowlat, M.H.; Hassanvand, M.S.; Yunesian, M.; Naddafi, K.; Sioutas, C. Source-specific lung cancer risk assessment of ambient PM2.5-bound Polycyclic Aromatic Hydrocarbons (PAHs) in Central Tehran. Environ. Int. 2018, 120, 321–332. [Google Scholar] [CrossRef]
- U.S. EPA. Regional Screening Levels for Chemical Contaminants at Superfund Sites; U.S. Environmental Protection Agency: Washington, DC, USA, 2015.


| Site Type | PAH (ng/g DW) | Reference |
|---|---|---|
| Urban area (containing industrial activities and heavy-duty traffic) | Σ9PAH = 817.4 for pine needle | [14] |
| A metropolitan region, industrial areas | Σ16PAH = 465 (urban areas) for pine needle Σ16PAH = 433 (industrial areas) for pine needle | [52] |
| Main industrial area | Σ16PAH = 64–813 for pine needle | [51] |
| Suburban area | Σ14PAH = 626 ± 306 for pine needle Σ14PAH = 548 ± 261 for pine branch | [20] |
| Industrial site | Σ16PAH = 414 ± 265 for pine needle Σ16PAH = 995 ± 643 for pine branch | [4] |
| Industrial site | Σ16PAH = 2157 ± 2098 for 2-year-old pine needle Σ16PAH = 1016 ± 684 for 1-year-old pine needle | [33] |
| Suburban–industrial area | Σ14PAH = 756 ± 232 for pine needle Σ14PAH = 685 ± 350 for 1-year-old pine branch Σ14PAH = 587 ± 361 for 1-year-old pine branch | [53] |
| Season | Variables | Cbranch (1-year-old) | Cbranch (2-year-old) |
|---|---|---|---|
| Winter | Cneedle | 0.855 (0.002) | 0.600 (0.088) |
| Cbranch (1-year-old) | 0.855 (0.001) | ||
| Spring | Cneedle | 0.790 (0.002) | 0.776 (0.003) |
| Cbranch (1-year-old) | 0.958 (<0.001) | ||
| Summer | Cneedle | 0.930 (<0.001) | 0.929 (<0.001) |
| Cbranch (1-year-old) | 0.967 (<0.001) | ||
| Autumn | Cneedle | 0.698 (0.008) | 0.841 (<0.001) |
| Cbranch (1-year-old) | 0.903 (<0.001) |
| The Molecular Weight of PAHs | Variables | Cneedle | Cbranch (1-year-old) | Cbranch (2-year-old) |
|---|---|---|---|---|
| LMW (light molecular weight) | Cair | 0.228 (0.363) | 0.274 (0.243) | 0.370 (0.119) |
| MMW (medium molecular weight) | Cair | 0.436 (0.020) | 0.524 (0.005) | 0.790 (<0.001) |
| HMW(heavy molecular weight) | Cair | 0.067 (0.736) | −0.186 (0.354) | −0.381 (0.089) |
| The Molecular Weight of PAHs | Variables | Cbranch (1-year-old) | Cbranch (2-year-old) |
|---|---|---|---|
| LMW (light molecular weight) | Cneedle | 0.813 (<0.001) | 0.729 (<0.001) |
| Cbranch (1-year-old) | 0.857 (0.001) | ||
| MMW (medium molecular weight) | Cneedle | 0.414 (0.018) | 0.541 (0.001) |
| Cbranch (1-year-old) | 0.775 (<0.001) | ||
| HMW (heavy molecular weight) | Cneedle | 0.531 (0.001) | 0.229 (0.223) |
| Cbranch (1-year-old) | 0.428 (0.013) |
Publisher’s Note: MDPI stays neutral with regard to jurisdictional claims in published maps and institutional affiliations. |
© 2022 by the authors. Licensee MDPI, Basel, Switzerland. This article is an open access article distributed under the terms and conditions of the Creative Commons Attribution (CC BY) license (https://creativecommons.org/licenses/by/4.0/).
Share and Cite
Caliskan Eleren, S.; Tasdemir, Y. Usage of Needle and Branches in the Applications of Bioindicator, Source Apportionment and Risk Assessment of PAHs. Atmosphere 2022, 13, 1938. https://doi.org/10.3390/atmos13111938
Caliskan Eleren S, Tasdemir Y. Usage of Needle and Branches in the Applications of Bioindicator, Source Apportionment and Risk Assessment of PAHs. Atmosphere. 2022; 13(11):1938. https://doi.org/10.3390/atmos13111938
Chicago/Turabian StyleCaliskan Eleren, Sevil, and Yücel Tasdemir. 2022. "Usage of Needle and Branches in the Applications of Bioindicator, Source Apportionment and Risk Assessment of PAHs" Atmosphere 13, no. 11: 1938. https://doi.org/10.3390/atmos13111938