Article

Seasonal Variations in Concentrations and Chemical Compositions of TSP near a Bulk Material Storage Site for a Steel Plant

1
Institute of Environmental Toxin and Emerging-Contaminant, Cheng Shiu University, Kaohsiung 833301, Taiwan
2
Super Micro Mass Research and Technology Centre, Cheng Shiu University, Kaohsiung 833301, Taiwan
3
Center for Environmental Toxin and Emerging-Contaminant Research, Cheng Shiu University, Kaohsiung 833301, Taiwan
4
School of Mechanical Engineering, Beijing Institute of Technology, Beijing 100081, China
5
Department of Mechanical Engineering, Cheng Shiu University, Kaohsiung 833301, Taiwan
*
Authors to whom correspondence should be addressed.
Atmosphere 2022, 13(11), 1937; https://doi.org/10.3390/atmos13111937
Submission received: 30 September 2022 / Revised: 3 November 2022 / Accepted: 17 November 2022 / Published: 21 November 2022
(This article belongs to the Special Issue Air Pollution in Industrial Regions)

Abstract

:
The concentrations of total suspended particles (TSPs) on four buildings near a steel plant’s bulk material storage site for iron ore, coal, limestone, and sinter were evaluated for summer and winter, where the concentrations were 58 (17–55) μg m−3 and 125 (108–155) μg m−3, respectively. A multivariate regression analysis of meteorological parameters with TSP concentrations indicates that temperature, wind speed, and frequency of rainfall are potential predictors of TSP concentrations, where the respective p values for the model are p = 0.005, p = 0.049, and p = 0.046. The strong correlation between usual co-pollutants, CO, NO2, and NOX with TSP concentrations, as indicated by the Pearson correlation values of 0.87, 0.86, and 0.77, respectively, implies substantial pollution from mobile sources. The weak correlation of SO2 with TSP concentrations rules out a significant pollution contribution from power plants. The speciation of TSPs in winter showed the percentage proportions of water-soluble ions, metal elements, and carbon content in winter as 60%, 15%, and 25%, while in summer, they were 68%, 14%, and 18%, respectively. Water-soluble ions were the most significant composition for both seasons, where the predominant species in summer and winter are SO42− and NO3, respectively. In the TSP metal elements profile, the proportion of natural origin ones exceeded those from anthropogenic sources. The health risk assessment indicates a significant cancer risk posed by chromium, while that posed by other metal elements including Co, Ni, As, and Pb are insignificant. Additionally, all metal elements’ chronic daily occupational exposure levels were below the reference doses except for Cu and Zn. Insights from this investigation can inform decisions on the design of the TSP-capturing mechanism. Specifically, water sprays to capture the water-soluble portion would substantially reduce the amplified concentrations of TSPs, especially in winter.

1. Introduction

The World Health Organization (WHO) recommends tracking the levels of inhalable dust near emission hotspots to maintain healthy working environments and protect the health of neighboring residents. Inhalable dust refers to the portion of particulate matter (PM) that can get into the nose and mouth during breathing. Usually referred to as total suspended particles (TSPs), they are less than 100 µm and are a source of occupational and residential nuisance. Furthermore, a subset of these respirable PM, usually less than 10 µm, poses a more severe health threat due to its ability to penetrate through the lung filtration mechanisms and reach the gaseous exchange region. Chronic exposure to these is closely linked to mortality and morbidity due to respiratory and cardiovascular complications [1].
TSP compositions include crust elements, metals, organic and elemental carbon, and water-soluble ions [2]. In the earlier literature, dominant metal components in suspended PM include Al, Ca, Fe, and K. Since TSPs have a low residence time in the atmosphere, they cause adverse health effects and nuisance in the surroundings of their emission sources [3,4]. The deposition of toxic TSP components through dry or wet depositions threatens the ecosystem’s health through adsorption on organic matter and soils, uptake by plants, and bio-accumulation up the food chains [5]. Although inhalable, the portion of TSP with diameters exceeding 10 μm is primarily deposited in the upper sections of the respiratory system characterized by turbulent flow [6]. Hydrophilic components in TSP exceed those in PM10 and PM2.5 and have lower clearance levels from the respiratory system, which may cause adverse health [7]. TSPs are cytotoxic, and exposure to them is linked to adverse health effects such as inflammation, cancer, respiratory, CNS, circulatory conditions, and congenital anomalies [8,9,10].
Wind action on bulk raw materials such as iron ore, limestone, sinter, coke, and recycled steel resuspends loose particles which contribute to ambient air TSP. Meteorological parameters and properties of the raw material piles, including particle size segregation and PM chemical compositions, affect their resuspension. This leads to seasonal variations in TSP concentrations and compositions in the surroundings of bulk material storage sites [11]. Prevalent temperatures facilitate evaporation from piles’ surfaces, while precipitation is vital for wet deposition and primary dust minimization [12]. TSP emissions also occur during material handling and combustion processes in steel plants. Air pollution control devices (APCDs) such as bag filters, electrostatic precipitators, and scrubbers effectively capture those emitted at the stack exhaust [13,14]. To lower ambient air TSP concentrations from large scale emissions, dust screens and water spray techniques are applied [15].
Under sources of TSP, emissions from industrial processes and mechanical activities, including construction, mining, and combustion processes, recieve the most attention [3]. However, resuspension from bulk material storage sites for industrial plants mostly gets ignored. This investigation fills the knowledge gap by accurately quantifying the TSP concentrations and their chemical compositions near a raw material storage site for a steel plant. To estimate the synergistic effects of prevailing meteorological conditions on TSP emissions, regression analyses were performed for routinely monitored parameters in two ambient air monitoring stations near the raw material storage site and TSP concentrations. Pearson correlation test was performed to estimate the likelihood of joint emission of TSP with other co-pollutants. Mapping TSP concentration helps identify regions of high ambiguity for collecting additional samples and strengthening TSP mitigation measures. This detailed assessment of TSP aligns with the WHO’s efforts to reduce mortality from air pollution and enhance the air quality in cities.

2. Methodology

The study site lies in the southeastern part of Taiwan, as seen in Figure 1a, where the raw material storage site and a neighboring, densely populated residential area cover 1.35 sq km and 1.24 sq km, respectively. The sampling locations include a densely populated region on the south and southwestern side of the raw material storage site, an administration building for the steel company on the northern side of the raw material piles, and a public library on the southeastern side of the raw material storage site.

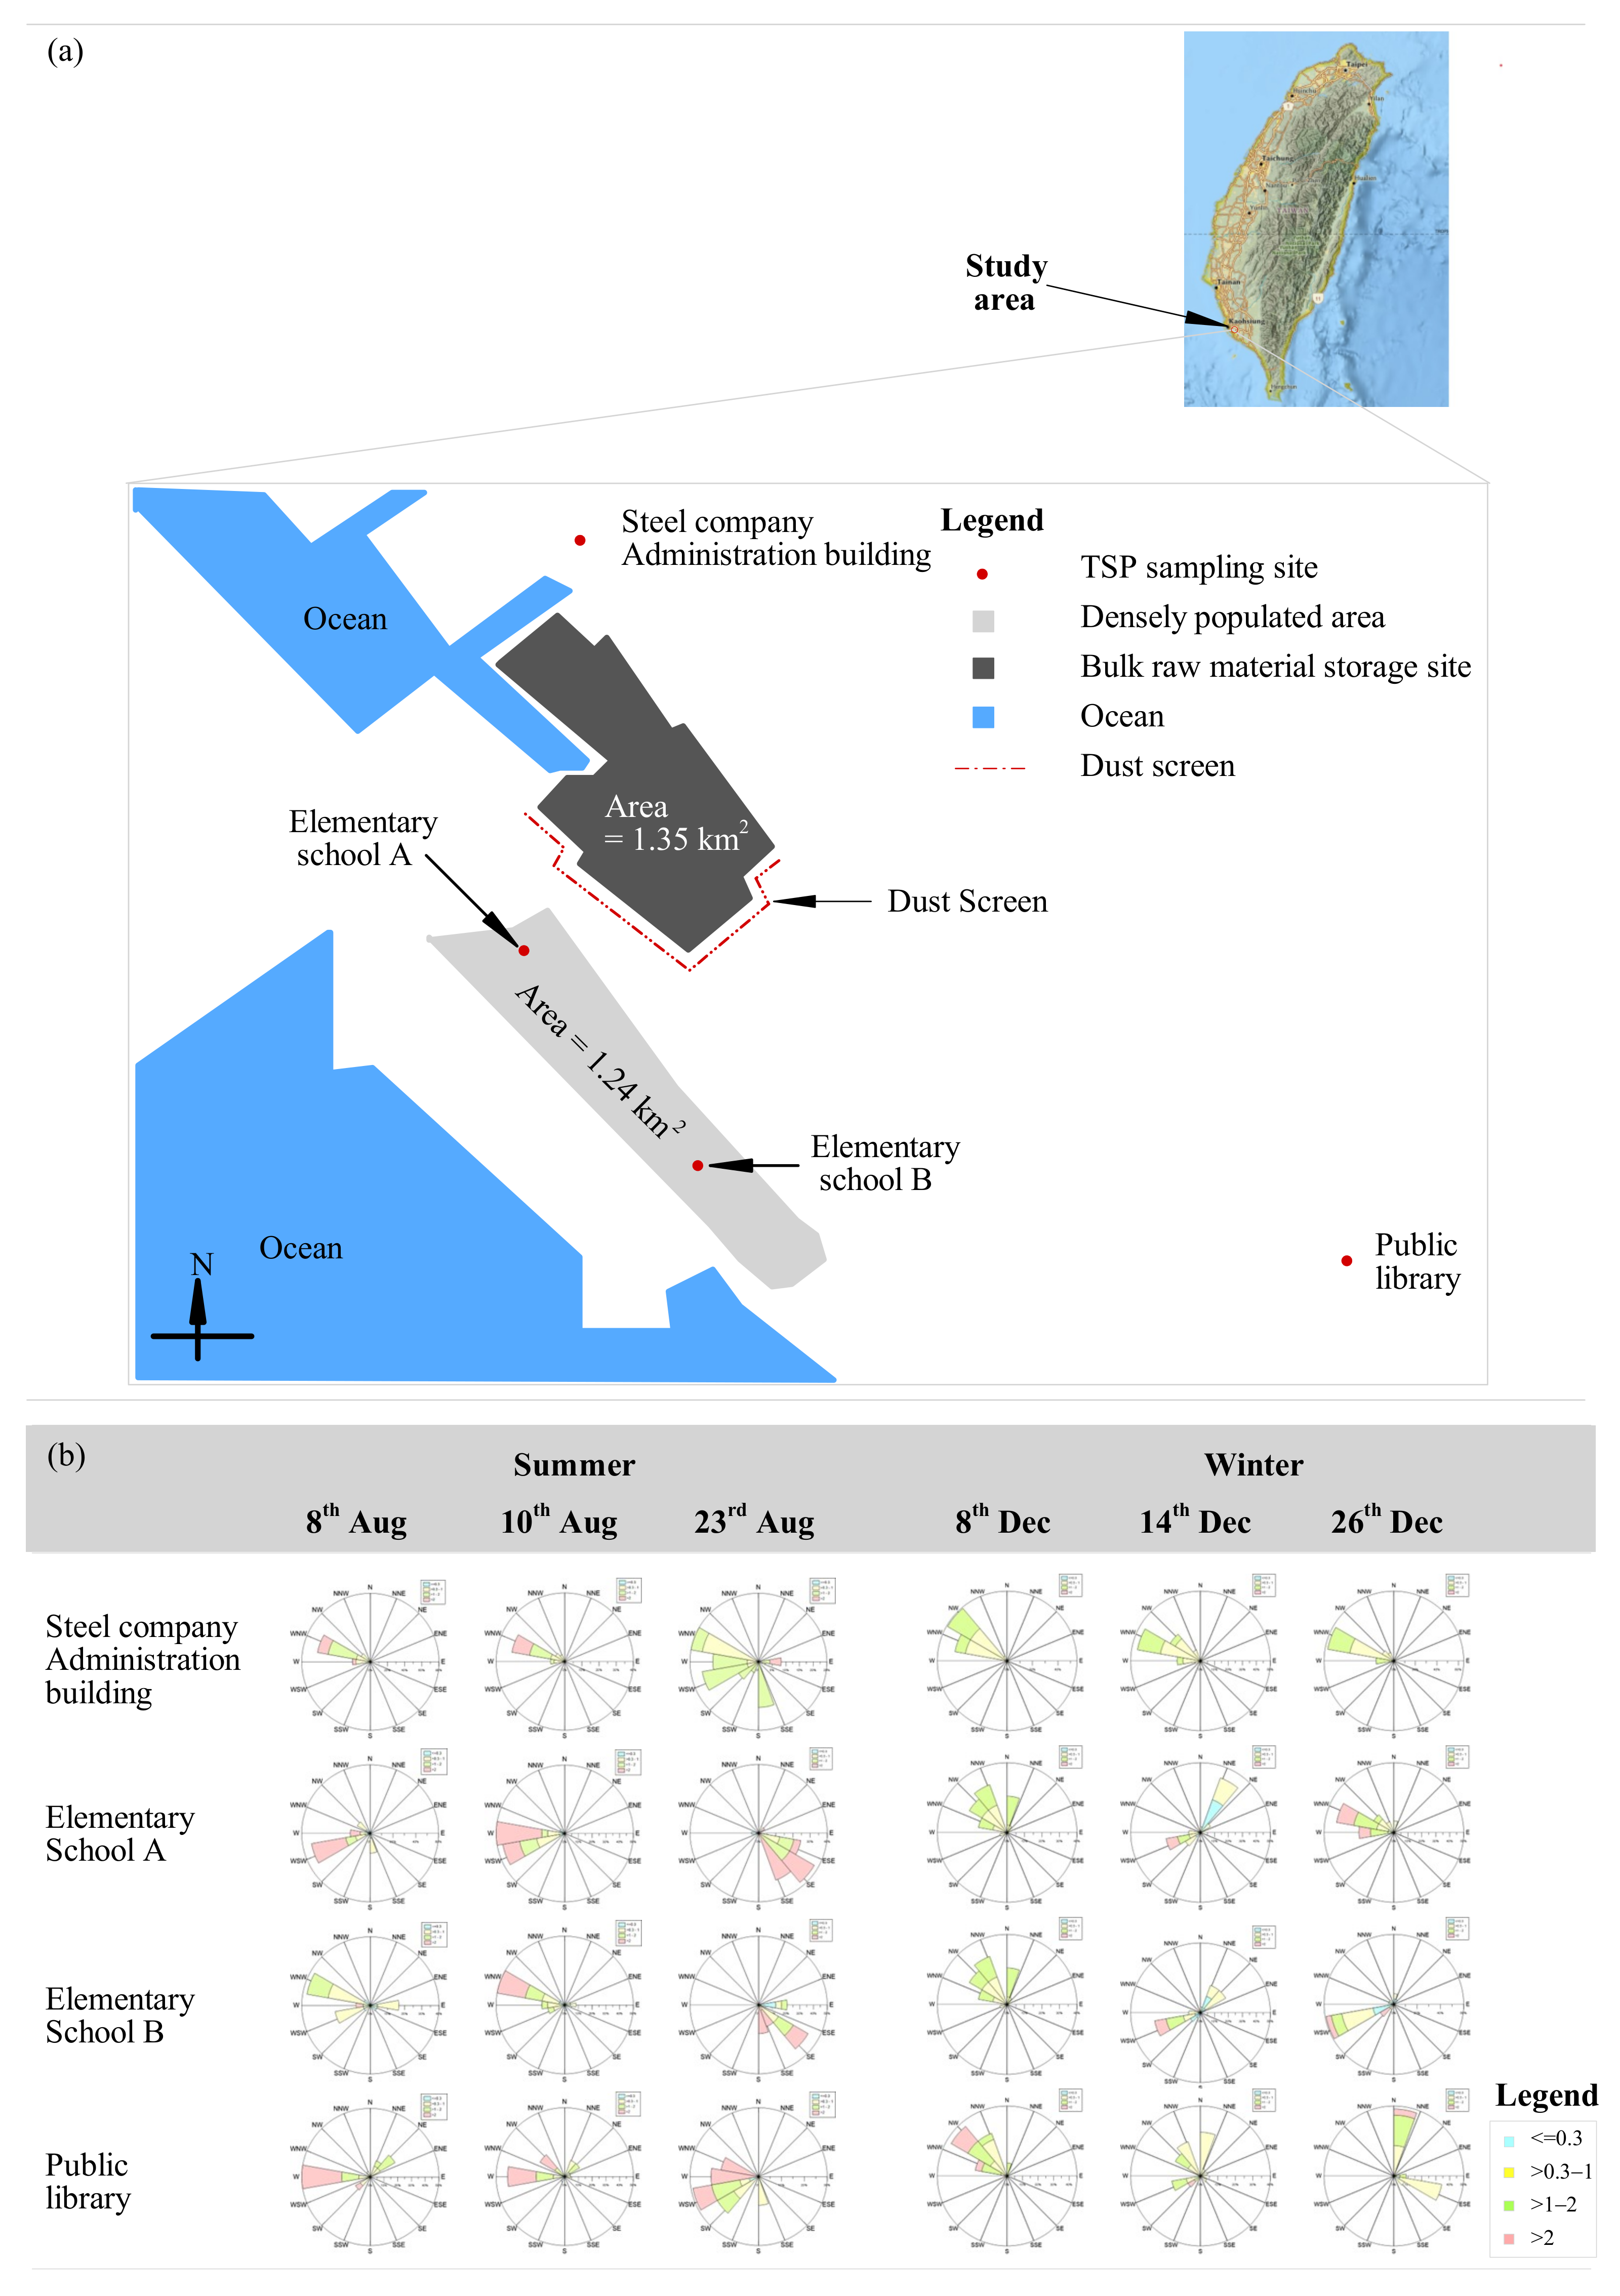
2.1. Description of Parameters in the Study Location

The southwestern region of Taiwan has a tropical climate that receives rainfall in 5–9 months annually. During summer, warm and humid air masses blow mainly from the south and southwestern sides, while in winter, low wind speeds blow primarily from the northwestern side, as indicated in Figure 1b.
Seasonal data with a one-hour interval time resolution for summer and winter were derived from the website (https://airtw.epa.gov.tw/ENG/default.aspx (accessed on 3 April 2022)). For summer, the data were gathered for the dates from 1 June to 31 August 2017, while for winter, the data were obtained for the dates from 1 December 2017 to 28 February 2018. The diurnal profiles for temperature, wind speed, rainfall frequency, and concentrations of CO, NOX, NO2, and SO2 presented in Figure S1 are hourly averages of the data sourced from Xiaogang and Daliao air quality monitoring stations. These stations lie in the east side of the sampling locations and were selected due to their proximity to the sampling locations.

2.2. Collection, Weighing and Conditioning of the Samples

TSP samples were collected from four locations for three days per season in summer and winter. Specific sampling dates for summer were the 8, 10, and 23 of August 2017; for winter, they were the 8, 14, and 26 of December 2017. Two points were near the raw material storage site, including the steel plant’s administration building and elementary school A. The other two points were far from the raw material storage site, corresponding to elementary school B and a public library, as presented in Figure 1a. The sampling height is 2–15 m above ground, and caution was exercised to avoid the obstruction of the sampler.
The filters were inspected to ensure they were free of oil or soot, which might obstruct the airflow on the filter paper and cause an unstable extraction rate. The sampling time had favorable weather conditions, including the absence of dense fog or high humidity, which would otherwise dampen the filter paper and reduce the airflow.
Herein, the NIEA A102.12A method was applied for PM with diameters of less than 100 μm. Sampling was performed for 24 h using a high-volume sampler TISCH TE-5200 with an airflow rate of 1.1–1.7 m3 min−1. The high-volume air sampler comprises of an air suction part, a filter paper holder, appropriate filter paper, a flow measurement device, and a protector. The filter paper had a 99.95% collection efficiency for 0.3 μm particles according to the DOP test.
A microbalance was applied to determine the mass concentrations of TSP in twenty-four filters. Before weighing, the integrity of the filter was ensured by inspection using a lamp and a magnifying glass to confirm it was uncontaminated and free of physical deformations such as breakages, indentations, dents, and scratches. The filter papers were carefully unpackaged, weighed, conditioned for 12 h, and clipped before fine weighing. Successive fine weighing exercises were performed until the variation in consecutive measurements was less than 5 µg. The weight of the filter paper after sampling was the average before and after conditioning.
T S P   C o n c e n t r a t i o n = W e W i v × 10 6
where the T S P c o n c e n t r a t i o n is in μg m−3.   W i and W e are masses of the filter paper in g before and after sample collection, respectively. V is the total volume of air in m3.

2.3. Sample Pretreatment and Chemical Analysis

The prominence of specific chemical groups, including metals, water-soluble ions, and carbon content, in TSP, was determined. The investigations for the metal composition in TSP were carried out using half of the Teflon filter paper. Pretreatment was performed via a microwave digestion procedure developed by the Environmental Protection Administration (Taiwan EPA). Thirty-one metal and potentially toxic elements, including Li, Be, Na, Mg, Al, K, Ca, Ti, V, Cr, Mn, Fe, Co, Cu, Zn, Ga, As, Se, Rb, Sr, Ag, Cd, In, Sn, Cs, Ba, Tl, Pb, U, Ni, and Si were quantified using the HR-ICP-MS, Agilent 7500 A.
The other half of the Teflon filter was placed in 10 mL of deionized water and shaken for 90 min using ultrasonic vibrations. Thereafter, it is poured into a syringe and filtered with a 0.45 µm membrane to remove particles. The concentration of the water-soluble anions was thereafter performed using an Ion Chromatograph (IC) (Dionex, Model DX-120) series conductivity detector. An ASRS-ULTRA suppressor, Ion Pac AS4A-SC column, and Na2CO3/NaHCO3 eluent were applied for the anions including SO42−, NO3, CI, and Fl. On the other hand, cations such as Na +, K +, Ca 2+, Mg 2+, and NH42+ applied a CSRS-ULTRA suppressor, an Ion Pac CS12 column, and 0.1 M of H2SO4 eluent. The concentrations of ions in the blank samples fell below the limit of detection (LOD).
The elemental carbon (EC) and organic carbon (OC) are quantified using an elemental analyzer (Elementar Vario MIRCO Cube) coupled with an AS 200 type Autosampler and DP 700 integrator. Carbon content analysis in TSP is performed using instantaneous dynamic oxidation where their chemical bonds were broken in the quartz reaction tube before undergoing rapid oxidation to CO2. Thereafter, it was reduced using Cu and then passed through the column for separation detection by the thermal conductivity detector (TCD). The concentration of OC was based on the difference between total carbon TC and EC.
Principles and specific details of the analytical procedures and QA/QC are indicated in earlier works [14]. Five standard solutions are applied to produce a calibration curve, where the relative error in the calibration line had a limit of 10%. A blank sample was prepared and analyzed after every 10 samples, and care was taken to ensure its concentration was less than double the MDL and the recovery rate ranged from 80 to 120%. The validity of the analytical techniques was demonstrated by the reproducibility of the results obtained here, where in every batch of 10 samples, a sample was selected and tested twice, and the relative difference could not exceed 20%.

2.4. Exposure and Risk Assessment

A health risk assessment was carried out to determine the nature and probability of adverse health effects on humans due to inhalation of TSP with potentially toxic elements (PTEs) such as Cr, Co, Ni, As, Pb, Mn, Cu, and Zn. Occupational exposure assessments were carried out using standard inhalation flow rates for individuals whose physiological status was rest condition for a chronic 70-year average and occupational exposure of eight hours a day. The cancer slope factors (CSF) for PTEs were collected from the California office of Environmental Health Hazard Assessment at https://oehha.ca.gov/ (accessed on 28 October 2022) where for Cr, Co, Ni, As, and Pb, they were 5.1 × 10², 2.7 × 101, 6.6 × 10⁻³, 1.2 × 101, and 4.2 × 10⁻². The reference doses for potentially toxic elements were obtained from the integrated risk information system—USEPA [16].

3. Results and Discussion

The average seasonal, diurnal variations in temperature, wind speed, and the instances of rain for the two seasons are seen in Figure S1a–c, where, overall, those of summer exceed those of the winter season. In addition, the average seasonal, diurnal CO, NOx, NO2, and SO2 concentrations for Xiaogang and Daliao monitoring stations are presented in Figure S1d–g, where winter concentrations exceeded those of summer except for SO2. It is worth noting that the average diurnal concentration of NO2 slightly exceeds the WHO 24 h air quality guideline of 25 μg m−3, as indicated in Figure S1f. For SO2, the average concentrations in summer and winter were far below the 24 h mean of 40 μg m−3. This shows that there are more significant sources of NO2 in the study site than SO2. Therefore, the area’s dominant combustion sources of emissions are mobile sources rather than power plants [17,18].

3.1. TSP Concentrations during Summer and Winter

In summer, the TSP concentrations in the four sampling locations ranged from 17 to 55 μg m−3, as indicated in Figure 2a. On 23 August, a combination of unusual meteorological parameters and surface properties of the background soil and raw material piles at the steel company’s administration building caused a TSP concentration of 315 μg m−3, which was treated as an outlier. Consequently, median concentrations for all investigations were adopted to represent the TSP concentrations. Overall, the steel company’s building had the highest TSP concentrations on all sampling dates, and the public library had the lowest TSP concentration of 17 μg m−3 on 23 August. Primarily low TSP concentrations were due to the adequate mixing of ambient air in a high boundary layer caused by high ambient air temperatures and solar radiation in summer.
During winter, the TSP concentrations in the four sampling locations ranged from 108 to 155 μg m−3, where elementary school B had the highest TSP concentration, as seen in Table 1. This phenomenon can be attributed to the northerly and north-western winds blowing from the raw material storage piles. The range of TSP concentrations in summer was narrower than in winter due to the intensity of mixing in the atmosphere. The western, southern, and southeastern sides of the bulk materials storage site had a dust screen. However, this significantly reduced the TSP concentrations in elementary schools A and B and the public library in summer only, where the relative TSP reductions were 25.5% and 21.3%, respectively. In winter, northerly winds dominated, causing higher TSP concentrations in elementary schools A and B compared to the steel company’s administration building because of high density and shorter diffusion distances from the zones of resuspension raw material piles. Due to the change in the prevailing wind direction in winter, TSP mainly accumulated on the south and southeast sides of the plant area.

3.2. Model Predictions of TSP Concentrations

Prevailing meteorological conditions, including temperature, wind, and precipitation, determine the fate of TSP, especially transport, dispersion, and removal. Temperature and wind affect the height of the boundary layer, circulation, and the extent of TSP dilution [19]. Wind speed and dominant wind direction affect their resuspension, redistribution, and consequently, their ambient air concentrations [3]. The wind rose maps in Figure 1b show a predominant westerly wind blowing from the seaside in the summer, except for 23 August, where high-speed southeasterly winds occurred. On the other hand, low-speed northerly and north-westerly winds were dominant in winter, as indicated in Figure 1b.
The multivariate regression analysis for temperature, wind speed, and rainfall frequency with TSP are presented in Figure 3, where their respective p values are p = 0.005, p = 0.049, and p = 0.046. This implies that the three independent variables can effectively predict the concentrations of TSP. Vertical mixing is a function of thermal turbulence and the depth of the surface mixing layer. Approximations of the mixing boundary layer using routinely measured parameters such as temperature, wind direction, and wind speed indicate a lower and more stable mixing height in winter than in summer [20,21]. This implies that the clearance of high- and ground-level TSP concentrations are most effective in summer and least effective in winter. Furthermore, summer has more robust and frequent deposition mechanisms such as precipitation and winds to wash out or disperse TSPs, as seen in Figure S1b,c. The dispersion of TSP to higher heights due to mixing lowers their concentrations on the breathable and ground level. Predictions from the multivariate analysis are supported by the TSP concentrations observed for this investigation, as seen in Figure 3. However, in the presence of TSP sources upstream, intense winds can cause resuspension and dispersion to downwind regions, just like the case of the outlier found in this investigation.

3.3. Relationship between TSP Concentrations and Those of Other Co-Pollutants

Among the usual co-pollutants, CO, NO2, and NOX had a strong correlation with TSP concentration, as indicated by the Pearson correlation values of 0.87, 0.86, and 0.77, respectively, presented in Figure 4a,c,d. The weak relationship between SO2 and TSP concentrations, represented by the Pearson correlation value of 0.2 seen in Figure 4b, rules out their co-emission from primary sources, including burning fossil fuels and smelting sulfur-containing iron. This implies that the CO, NOX, and TSP are co-pollutants from specific emission sources in the study area. The regression of the TSP and NOx family, herein including NO, N2O, N2O2, N2O3, N2O4, and N2O5 had a Pearson r value of 0.77 as seen in Figure 4d. In the atmosphere, NO2 and the rest of the NOx undergo similar atmospheric conversions involving dissolution in atmospheric water and decomposition to form nitric and nitrous acids [22]. Nitrite and nitrate salts, essential components of atmospheric PM, are formed after these acids’ neutralization. Since NO2 is the most significant proportion of NOx in the atmosphere, it is the primary source of nitrates in TSP, and their correlation indicates their joint emissions from primary combustion processes.
In scenarios where combustion processes are the primary emission sources for TSP, all Pearson correlations of SO2, NO2, and CO concentrations with TSP concentration are usually strong, for instance, in the case of Erzurum Turkey [12]. Therefore, the weak correlation of SO2 with TSP concentrations seen in Figure 4b rules out combustion processes in power plants as the dominant sources of TSP in the study area. However, the strong correlation between CO, NO2, and NOX with TSP concentrations indicate that the region is characterized by substantial pollution from mobile sources [23,24].

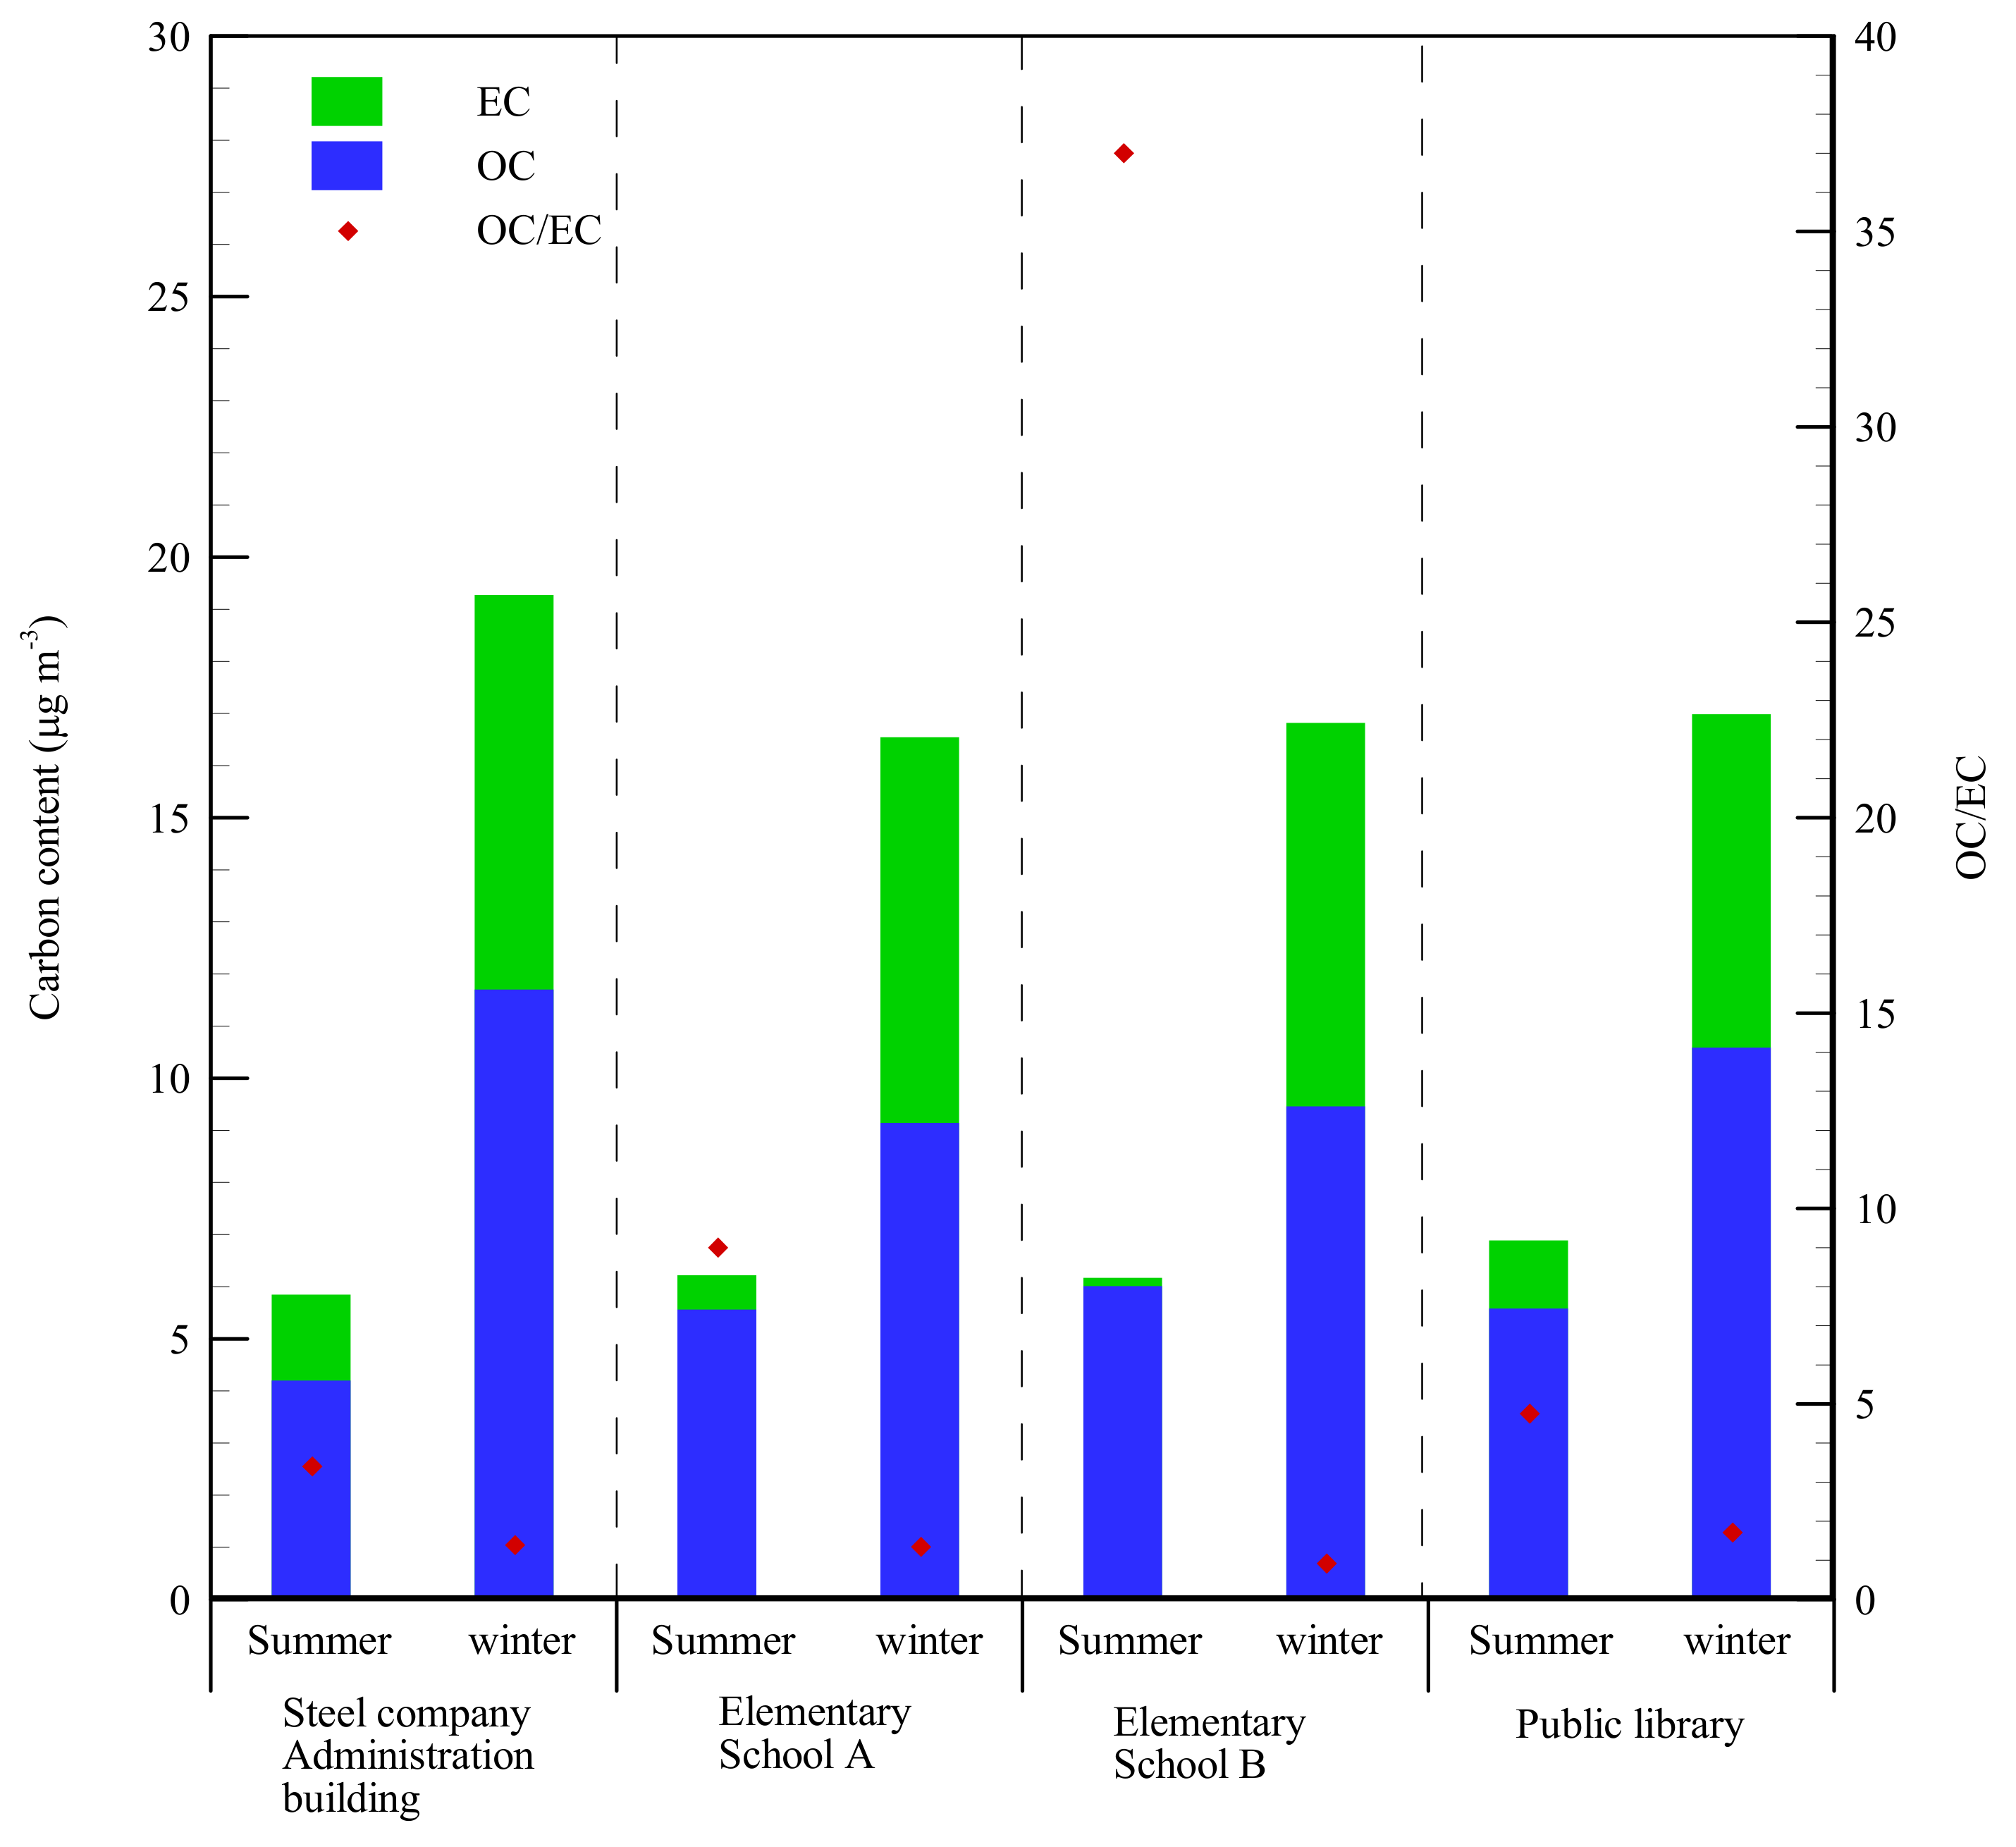
3.4. Chemical Compositions of TSP

The mass concentrations of different water-soluble ions are the most critical component for TSP, while the concentrations of metals were the most trivial for all seasons, as summarized in Table 2. Specifically, the major components of TSP are SO42−, NO3, NH4, NaCl, black carbon, mineral dust, and water. The seasonal speciation of TSP at the four sites are presented in Table 3, and Figure 5 and Figure 6, where the concentrations of TSP elements during winter exceed those of summer for all sampling locations. The metal composition indicates the contribution of the bulk material storage piles and the effect of wind and other meteorological factors on resuspension. The water-soluble ions had the largest mass; the averages in summer and winter were 23.28 ± 6 μg m−3 and 42.58 ± 4.41 μg m−3, respectively. The concentrations of individual water-soluble ions are presented in Figure 5, where the most critical components during summer and winter are SO42− and NO3, respectively. In summer, the concentration for SO42− exceeded 10.5 μg m−3 in all sampling locations except the public library, while in winter, it fell below 10.2 μg m−3 for all sampling locations. Among the water-soluble ions, the seasonal variations in NO3, are the most outstanding due to its role in atmospheric conversions of other atmospheric species. Among all water-soluble ions, SO42−, NO3, NH4+, Na+, Cl, and Ca2+ had the most significant contribution in the total mass concentrations, as seen in Figure 5. The concentration of NH4+ in winter exceeded that of summer for all sites. This is contrary to the phenomenon of PM2.5 reported by Mutuku, Lee [14]. The predominance of SO42− and NO3 implies that a greater mass of TSP has an anthropogenic origin.
Metal elements in summer and winter had an average of 4.83 ± 1.77 μg m−3 and 10.80 ± 1.61 μg m−3. The metal elements of natural origin, including Na, Mg, Al, Si, K, Ca, and Fe dominated the profile, as seen in Table S1. TSP lacked Na content for summer. A similar finding was reported in a study by Hueglin, Gehrig [25], where the concentrations in summer were the least. There were significant differences in the profile for metal emissions from natural sources; in summer, Mg had the highest concentration, while in winter, Na and Fe had the highest concentrations due to sea salt droplets and resuspension from the surface of iron piles. Among the metal elements of anthropogenic origin, Mn, Cu, Zn, and Pb had the highest concentrations for all investigated sites. The steel company’s administration building had the highest Pb content in summer, as indicated in Table S1, due to emissions from mobile sources and a nearby refinery [26]. This is critical since dermal and inhalation exposure to Pb poses a carcinogenic risk. The concentration of the rest of the metal elements with anthropogenic origins was insignificant for both seasons, as seen in Table S1. Overall, the total concentrations of metal elements in summer exceeded winter due to lower dilution rates of pollutants in the ambient air. The ferromanganese (Fe-Mn), ferrosilicon (Fe-Si), and aluminum applied in the manufacture of steel and the Si-, K-, Mn-, and Mg-rich crust surrounding the steel plant cause high concentrations of these metal elements in TSP. Zn, a dominant metal of anthropogenic origin is emitted by mobile sources. Previous investigations indicate that the bioaccessibility of Zn, Mn, and Pb exceeds that of other metalloids [27]. Therefore, mitigation measures for lowering the emission of these dangerous pollutants are necessary.
Carbonaceous aerosols form an essential portion of ambient air PM and play a critical role in atmospheric chemistry and respiratory health. The average total carbon concentrations in summer and winter were 6.28 ± 0.44 μg m−3 and 17.40 ± 16.9 μg m−3, respectively. The average mass concentrations of EC and OC in the atmospheric TSP for the summer and winter seasons are 5.34 μg m−3 and 0.95 μg m−3, while those for winter are 10.22 μg m−3 and 7.18 μg m−3, respectively. The range of TC for winter exceeded that for summer due to the varying emission sources in the two seasons. EC results from the incomplete combustion of fuels, while the degradation of carbonaceous materials forms OC. Since OC is the dominant portion of TC, it implies the dominance of degradation of carbon-containing materials in the surrounding steel plant as the primary sources of carbon-based aerosols. This is contrary to the findings in research involving PM2.5, where EC was dominant [14]. The mass of organic carbon exceeded that of elemental carbon for all samples, as seen in Figure 6. Subsequently, the median of the O C E C ratio for TSP is 6.9 in summer and 1.4 in winter, indicating a high secondary organic aersosl (SOA) formation potential for both seasons; this is contrary to a previous study on TSP emissions from wood combustion, where the OC/EC ratio was about 0.31 [28]. The O C E C is peculiarly high for the elementary schools, indicating that the degradation of carbon-containing materials in the school is the main source of carbon in summer. There are significant positive correlations between TSP concentrations and the four compositions. Specifically, the Pearson correlations and p-values for metal elements, water-soluble ions, elemental carbon, and organic carbon are (r = 0.95, p < 0.001), (r =0.96, p < 0.001), (r = 0.95, p < 0.001), and (r = 0.8, p = 0.02), respectively, as indicated in Table S3. The lower r value of TSP vs. organic carbon indicates less TSP emissions from the combustion of organic material, evaporation of fuels, and pr natural emission of VOCs [29].

3.5. Health Risk Assessment of the Potentially Toxic Elements in TSP

The health hazards due to occupational exposure to potentially toxic metal elements (PTEs) in TSP are evaluated, where the reference doses (RfD), cancer slope factors (CSF), and incremental lifetime cancer risk (ILCR) are presented in Table 3. The ILCR posed by chromium exceeds 1 × 10⁻⁴ and, therefore, is significant and calls for control measures. On the other hand, an insignificant cancer risk is posed by Co, Ni, As, and Pb, where the ILCR is mostly below 1 × 10⁻⁶. All metal elements’ chronic daily occupational exposure levels were below the reference doses except for Cu and Zn. Since these metal elements are associated with combustion processes during road transport, incineration, and metal smelting, proper air pollution control applications could control their emissions. Other potential risk management options include setting up outdoor screens around the raw material storage site, installing wetting mechanisms to suppress TSP resuspension, and applying protective wear, such as surgical face masks.
Table 3. Incremental lifetime cancer risk (ILCR) and reference doses for chronic (70-year average) daily intake.
Metal ElementsCSF (mg kg-day−1)−1RfD (mg kg-day−1)−1Incremental Lifetime Cancer Risk (ILCR)
SummerWinter
Site 1Site 2Site 3Site 4Average for SummerSite 1Site 2Site 3Site 4Average for Winter
Cr5.10 × 1023.00 × 10−56.01 × 10−41.68 × 10−41.91 × 10−41.79 × 10−42.85 × 10−46.93 × 10−46.51 × 10−47.89 × 10−47.09 × 10−47.11 × 10−4
Co2.70 × 1015.70 × 10−63.61 × 10−75.02 × 10−74.55 × 10−73.72 × 10−74.22 × 10−74.34 × 10−63.97 × 10−63.89 × 10−63.92 × 10−64.03 × 10−6
Ni6.60 × 10−39.80 × 10−26.14 × 10−93.37 × 10−92.72 × 10−92.39 × 10−93.65 × 10−91.34 × 10−81.87 × 10−81.45 × 10−89.22 × 10−91.39 × 10⁻⁸
As1.20 × 1013.30 × 10−21.74 × 10−67.62 × 10−74.81 × 10−74.67 × 10−78.64 × 10−73.89 × 10−63.98 × 10−63.78 × 10−64.25 × 10−63.98 × 10−6
Pb4.20 × 10−25.60 × 10−21.22 × 10−72.09 × 10−81.92 × 10−82.22 × 10−84.60 × 10−81.81 × 10−71.64 × 10−71.98 × 10−72.67 × 10−72.03 × 10⁻⁷
Mn-1.43 × 10⁻⁵
Cu-1.95 × 10⁻⁷
Zn-2.40 × 10⁻⁸
Note: Site 1 refers to the steel company’s administration building. Site 2 refers to elementary school A. Site 3 refers to elementary school B. Site 4 refers to the public library.

4. Conclusions

Field measurements and laboratory investigations for TSP concentrations and their compositions were conducted for emissions near a steel plant’s raw material storage site during summer and winter. Thereafter, a TSP prediction model was built based on the prevailing meteorological conditions, including ambient air temperature, wind speed, and rainfall frequency. p values from the model indicated acceptable levels of accuracy. Overall, winter had the highest concentrations because of stable meteorological parameters for surface growth, coagulation, and the low redistribution of PM in the atmosphere. Furthermore, the Pearson correlation was developed between TSP concentrations and other primary pollutants, where a strong correlation between CO, NO2, and NOX with TSP suggests that the region is characterized by substantial pollution from mobile sources. On the other hand, the weak correlation of SO2 with TSP concentrations rules out combustion processes in power plants as dominant sources of TSP in the study area. Overall chemical compositions suggest that the bulk material storage site is the chief source of TSP. Among the TSP composition, the abundance of SO42− and NO3 ions implies the dominance of anthropogenic sources. Although metal elements of natural origin dominated the profile for metal elements, the presence of Mn, Cu, Zn, and Pb indicated the influence of anthropogenic activities. In the total carbon content, OC was the main component, demonstrating the impact of the degradation of carbon-containing materials in the steel plant’s surroundings. From the health risk assessment, a significant cancer risk is posed by chromium, while that of other metal elements, including Co, Ni, As, and Pb, are insignificant. Additionally, all metal elements’ chronic daily occupational exposure levels were below the reference daily doses, except for Cu and Zn.

Supplementary Materials

The following supporting information can be downloaded at: https://www.mdpi.com/article/10.3390/atmos13111937/s1, Figure S1: Diurnal variations in (a) temperature, (b) wind speed, (c) rainfal occurrence frequency, and concentrations of (d) CO, (e) NOx, (f) NO2, and SO2 for summer and winter for Xiaogang and Daliao meteorological and air quality monitoring stations; Table S1: Metal composition in suspended TSP at the steel company’s administration building, elementary school A, elementary school B, and public library in summer and winter; Table S2: Chronic Daily Occupational Exposure to Potentially toxic elements contained in TSP at the steel company’s administration building, elementary school A, elementary school B, and public library in summer and winter; and Table S3: Pearson r correlation values between Average TSP concentrations and the metal elements, water-soluble ions, elemental and organic carbon.

Author Contributions

Conceptualization, Y.-Y.L., S.-L.L., J.K.M. and G.-P.C.-C.; methodology, S.-L.L. and J.K.M.; formal analysis, S.-L.L., B.-W.H. and J.K.M.; investigation, Y.-Y.L. and S.-L.L.; resources, B.-W.H. and G.-P.C.-C.; data curation, S.-L.L. and J.K.M.; writing—original draft preparation, S.-L.L. and J.K.M.; writing—review and editing, B.-W.H., J.K.M. and G.-P.C.-C.; visualization, Y.-Y.L. and S.-L.L.; supervision, B.-W.H.; project administration, G.-P.C.-C.; funding acquisition, Y.-Y.L., B.-W.H. and G.-P.C.-C. All authors have read and agreed to the published version of the manuscript.

Funding

This research received no external funding.

Institutional Review Board Statement

Not applicable.

Informed Consent Statement

Not applicable.

Data Availability Statement

Please refer to the suggested Data Availability Statements on hourly averaged meteorological and pollutant concentration data from https://airtw.epa.gov.tw/ENG/default.aspx (accessed on 29 September 2022) and cancer slope factors on https://oehha.ca.gov/ (accessed on 29 September 2022).

Conflicts of Interest

The authors declare no conflict of interest.

References

  1. Gupta, A.K.; Nag, S.; Mukhopadhyay, U.K. Measurements of Inhalable Particles < 10 μm (PM10) and Total Suspended Particulates (TSP) Concentrations along the North–South Corridor, in Kolkata, India. J. Environ. Sci. Health Part A 2006, 41, 431–445. [Google Scholar] [CrossRef]
  2. Duvall, R.; Majestic, B.; Shafer, M.; Chuang, P.; Simoneit, B.; Schauer, J. The water-soluble fraction of carbon, sulfur, and crustal elements in Asian aerosols and Asian soils. Atmos. Environ. 2008, 42, 5872–5884. [Google Scholar] [CrossRef]
  3. Petavratzi, E.; Kingman, S.; Lowndes, I. Particulates from mining operations: A review of sources, effects and regulations. Miner. Eng. 2005, 18, 1183–1199. [Google Scholar] [CrossRef]
  4. Watson, J.G.; Chow, J.C.; Pace, T.G. Fugitive dust emissions. Crops 2000, 3, 7. [Google Scholar]
  5. Wang, Z.; Chen, J.; Huang, L.; Wang, Y.; Cai, X.; Qiao, X.; Dong, Y. Integrated fuzzy concentration addition–independent action (IFCA–IA) model outperforms two-stage prediction (TSP) for predicting mixture toxicity. Chemosphere 2009, 74, 735–740. [Google Scholar] [CrossRef]
  6. Mutuku, J.K.; Hou, W.-C.; Chen, W.-H. An overview of experiments and numerical simulations on airflow and aerosols deposition in human airways and the role of bioaerosol motion in COVID-19 transmission. Aerosol Air Qual. Res. 2020, 20, 1172–1196. [Google Scholar] [CrossRef]
  7. Begam, G.R.; Vachaspati, C.V.; Ahammed, Y.N.; Kumar, K.R.; Reddy, R.; Sharma, S.; Saxena, M.; Mandal, T. Seasonal characteristics of water-soluble inorganic ions and carbonaceous aerosols in total suspended particulate matter at a rural semi-arid site, Kadapa (India). Environ. Sci. Pollut. Res. 2017, 24, 1719–1734. [Google Scholar] [CrossRef]
  8. Rogers, J.F.; Thompson, S.J.; Addy, C.L.; McKeown, R.E.; Cowen, D.J.; Decoufle, P. Association of very low birth weight with exposures to environmental sulfur dioxide and total suspended particulates. Am. J. Epidemiol. 2000, 151, 602–613. [Google Scholar] [CrossRef]
  9. Chen, E.K.-C.; Zmirou-Navier, D.; Padilla, C.; Deguen, S. Effects of air pollution on the risk of congenital anomalies: A systematic review and meta-analysis. Int. J. Environ. Res. Public Health 2014, 11, 7642–7668. [Google Scholar] [CrossRef] [Green Version]
  10. Lewtas, J. Air pollution combustion emissions: Characterization of causative agents and mechanisms associated with cancer, reproductive, and cardiovascular effects. Mutat. Res. Rev. Mutat. Res. 2007, 636, 95–133. [Google Scholar] [CrossRef]
  11. Radulescu, C.; Stihi, C.; Ion, R.-M.; Dulama, I.-D.; Stanescu, S.-G.; Stirbescu, R.M.; Teodorescu, S.; Gurgu, I.-V.; Let, D.-D.; Olteanu, L. Seasonal Variability in the Composition of Particulate Matter and the Microclimate in Cultural Heritage Areas. Atmosphere 2019, 10, 595. [Google Scholar] [CrossRef]
  12. Sezer Turalıoğlu, F.; Nuhoğlu, A.; Bayraktar, H. Impacts of some meteorological parameters on SO2 and TSP concentrations in Erzurum, Turkey. Chemosphere 2005, 59, 1633–1642. [Google Scholar] [CrossRef]
  13. Marenco, L.; Cantillo, V. A framework to evaluate particulate matter emissions in bulk material ports: Case study of Colombian coal terminals. Marit. Policy Manag. 2015, 42, 335–361. [Google Scholar] [CrossRef]
  14. Mutuku, K.J.; Lee, Y.-Y.; Chang-Chien, G.-P.; Lin, S.-L.; Chen, W.-H.; Ho, W.-C. Chemical fingerprints for PM2. 5 in the ambient air near a raw material storage site for iron ore, coal, limestone, and sinter. Aerosol Air Qual. Res. 2021, 21, 200624. [Google Scholar] [CrossRef]
  15. Lee, Y.-Y.; Yuan, C.-S.; Yen, P.-H.; Mutuku, J.K.; Huang, C.-E.; Wu, C.-C.; Huang, P.-J. Suppression Efficiency for Dust from an Iron Ore Pile Using a Conventional Sprinkler and a Water Mist Generator. Aerosol Air Qual. Res. 2022, 22, 210320. [Google Scholar] [CrossRef]
  16. US EPA. Integrated Risk Information System; Environmental Protection Agency Region: Washington, DC, USA, 2011; p. 20460. Available online: https://iris.epa.gov/AtoZ (accessed on 29 September 2022).
  17. Chakraborty, N.; Mukherjee, I.; Santra, A.; Chowdhury, S.; Chakraborty, S.; Bhattacharya, S.; Mitra, A.; Sharma, C. Measurement of CO2, CO, SO2, and NO emissions from coal-based thermal power plants in India. Atmos. Environ. 2008, 42, 1073–1082. [Google Scholar] [CrossRef]
  18. Josipovic, M.; Annegarn, H.J.; Kneen, M.A.; Pienaar, J.J.; Piketh, S.J. Concentrations, distributions and critical level exceedance assessment of SO2, NO2 and O3 in South Africa. Environ. Monit. Assess. 2010, 171, 181–196. [Google Scholar] [CrossRef]
  19. Cyrys, J.; Hochadel, M.; Gehring, U.; Hoek, G.; Diegmann, V.; Brunekreef, B.; Heinrich, J. GIS-based estimation of exposure to particulate matter and NO2 in an urban area: Stochastic versus dispersion modeling. Environ. Health Perspect. 2005, 113, 987–992. [Google Scholar] [CrossRef] [Green Version]
  20. Du, C.; Liu, S.; Yu, X.; Li, X.; Chen, C.; Peng, Y.; Dong, Y.; Dong, Z.; Wang, F. Urban boundary layer height characteristics and relationship with particulate matter mass concentrations in Xi’an, central China. Aerosol Air Qual. Res. 2013, 13, 1598–1607. [Google Scholar] [CrossRef]
  21. Gupta, P.; Christopher, S.A. Particulate matter air quality assessment using integrated surface, satellite, and meteorological products: Multiple regression approach. J. Geophys. Res. Atmos. 2009, 114. [Google Scholar] [CrossRef] [Green Version]
  22. Chai, J.; Miller, D.J.; Scheuer, E.; Dibb, J.; Selimovic, V.; Yokelson, R.; Zarzana, K.J.; Brown, S.S.; Koss, A.R.; Warneke, C. Isotopic characterization of nitrogen oxides (NO x), nitrous acid (HONO), and nitrate (pNO 3−) from laboratory biomass burning during FIREX. Atmos. Meas. Tech. 2019, 12, 6303–6317. [Google Scholar] [CrossRef]
  23. Hao, J.; Wu, Y.; Fu, L.; He, D.; He, K. Source contributions to ambient concentrations of CO and NOx in the urban area of Beijing. J. Environ. Sci. Health Part A 2001, 36, 215–228. [Google Scholar] [CrossRef] [PubMed]
  24. Lu, Q.; Zheng, J.; Ye, S.; Shen, X.; Yuan, Z.; Yin, S. Emission trends and source characteristics of SO2, NOx, PM10 and VOCs in the Pearl River Delta region from 2000 to 2009. Atmos. Environ. 2013, 76, 11–20. [Google Scholar] [CrossRef]
  25. Hueglin, C.; Gehrig, R.; Baltensperger, U.; Gysel, M.; Monn, C.; Vonmont, H. Chemical characterization of PM2.5, PM10 and coarse particles at urban, near-city and rural sites in Switzerland. Atmos. Environ. 2005, 39, 637–651. [Google Scholar] [CrossRef]
  26. Rajšić, S.; Mijić, Z.; Tasić, M.; Radenković, M.; Joksić, J. Evaluation of the levels and sources of trace elements in urban particulate matter. Environ. Chem. Lett. 2008, 6, 95–100. [Google Scholar] [CrossRef]
  27. Hu, X.; Zhang, Y.; Ding, Z.; Wang, T.; Lian, H.; Sun, Y.; Wu, J. Bioaccessibility and health risk of arsenic and heavy metals (Cd, Co, Cr, Cu, Ni, Pb, Zn and Mn) in TSP and PM2.5 in Nanjing, China. Atmos. Environ. 2012, 57, 146–152. [Google Scholar] [CrossRef]
  28. Kirchsteiger, B.; Kubik, F.; Sturmlechner, R.; Stressler, H.; Schwabl, M.; Kistler, M.; Kasper-Giebl, A. Real-life emissions from residential wood combustion in Austria: From TSP emissions to PAH emission profiles, diagnostic ratios and toxic risk assessment. Atmos. Pollut. Res. 2021, 12, 101127. [Google Scholar] [CrossRef]
  29. Jones, A.M.; Harrison, R.M. Interpretation of particulate elemental and organic carbon concentrations at rural, urban and kerbside sites. Atmos. Environ. 2005, 39, 7114–7126. [Google Scholar] [CrossRef]
Figure 1. Schematic representations of (a) a plan view of the four TSP sampling sites and the surroundings of the raw material storage site and (b) wind rose maps for the TSP sample collection dates.
Atmosphere 13 01937 g001
Figure 2. The concentrations of TSP in the steel company’s administration building, elementary school A, elementary school B, and the public library for (a) summer and (b) winter.
Atmosphere 13 01937 g002
Figure 3. Regression curves for (a) temperature and wind speed, (b) frequency of rainfall occurrence.
Atmosphere 13 01937 g003
Figure 4. Pearson correlation values for (a) CO, (b) SO2, (c) NO2, and (d) NOX concentrations with the average TSP concentrations.
Atmosphere 13 01937 g004
Figure 5. Percentage of water-soluble ions in TSP for winter and summer and at the steel company’s administration building, elementary school A, elementary school B, and public library.
Atmosphere 13 01937 g005
Figure 6. Mass of elemental and organic carbon in TSP and the ratios of OC/EC at the steel company administration building, elementary school A, elementary school B and public library during summer and winter.
Atmosphere 13 01937 g006
Table 1. Median TSP concentrations at the four sampling points.
Sampling PointMedian TSP Concentration (μg m−3)
SummerWinter
Stee company’s administration building47111
Elementary school A35120
Elementary school B37134
Public library25114
Table 2. Seasonal concentrations of metal elements, water soluble ions, and total carbon content.
Mass Concentrations of Chemical Groups (μg m−3)
Metal ElementsWater Soluble IonsTotal Carbon Content
Summer WinterSummer WinterSummer Winter
Steel company’s Admin. building6.6610.3629.8041.405.8519.28
Elementary school A3.5511.3122.2140.436.2216.54
Elementary school B6.0112.6725.5349.076.1716.82
Public library 3.108.8615.6039.406.8916.99
Mean4.8310.8023.2842.586.2817.41
Std dev.1.770.805.994.410.441.26
Note: Admin. represents administration. Std dev. represents standard deviation.
Publisher’s Note: MDPI stays neutral with regard to jurisdictional claims in published maps and institutional affiliations.

