Article

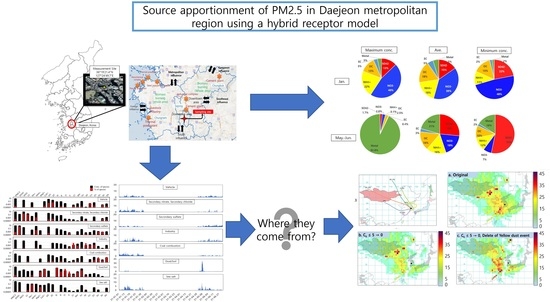
Source Apportionment of PM2.5 in Daejeon Metropolitan Region during January and May to June 2021 in Korea Using a Hybrid Receptor Model

1
Department of Environmental Engineering, Anyang University, Anyang 14028, Korea
2
National Institute Environmental Research, Incheon 22689, Korea
*
Author to whom correspondence should be addressed.
Atmosphere 2022, 13(11), 1902; https://doi.org/10.3390/atmos13111902
Submission received: 11 October 2022 / Revised: 8 November 2022 / Accepted: 11 November 2022 / Published: 14 November 2022
(This article belongs to the Special Issue Ammonia Emission and Particulate Matter)

Abstract

:
We tried to estimate anthropogenic emission sources, including the contributions of neighboring regions, that affect the fine particle concentration (PM2.5) in Daejeon using positive matrix factorization (PMF), concentration weight trajectory (CWT), and modified concentration weight trajectory (MCWT) models in a manner that might overcome the limitations of widely applied hybrid receptor models. Fractions of ion, carbonaceous compound and elements in PM2.5 were 58%, 17%, and 3.6% during January and 49%, 17%, and 14.9% during May to June, respectively. The fraction of ions was higher during winter season, while the fraction of elements was higher during the other season. From the PMF model, seven factors were determined, including dust/soil, sea salt, secondary nitrate/chloride, secondary sulfate, industry, coal combustion, and vehicle sources. Secondary sulfate showed the highest contribution followed by secondary nitrate/chloride and vehicle sources. The MCWT model significantly improved the performance of regional contributions of the CWT model, which had shown a high contribution from the Yellow Sea where there are no emission sources. According to the MCWT results, regional contributions to PM2.5 in the Daejeon metropolitan region were highest from eastern and southern China, followed by Russia, northeastern China, and Manchuria. We conclude that the MCWT model is more useful than the CWT model to estimate the regional influence of the PM2.5 concentrations. This approach can be used as a reference tool for studies to further improve on the limitations of hybrid receptor models.

Graphical Abstract

1. Introduction

Increasing industrialization, urbanization, and the accompanying population growth in Northeast Asia, including Korea, in recent decades have given rise to substantial atmospheric environmental pollution in the form of anthropogenic air pollutants and particulate matter (PM) [1,2,3]. PM and gaseous air pollutants adversely affect human health and visibility and contribute to global climate change [2,4,5,6]. Particulate matter less than 2.5 microns in aerodynamic diameter (PM2.5, i.e., fine particles) is classified by the International Agency for Research on Cancer (IARC) as a Group 1 carcinogen, which is regarded as a major concern in many countries [7]. Fine particles produced from both anthropogenic and natural sources can be inhaled and penetrate into deeper areas of the human body, and then they adversely affect human health by reacting with their large surface area [8,9,10]. According to a World Health Organization (WHO) report, about 90% of the population of urban residents during 2014 were exposed to excess concentrations of PM2.5 [11]. Approximately 7 million people died of various diseases related to PM2.5 exposure around the world [12]. The Korean government, through the Ministry of the Environment, has conducted trials that have focused on managing specific sources, such as mobile and coal power plants, to mitigate PM pollution [13], but scientific evidence about major sources is still insufficient. To achieve an effective strategy for PM pollution control, the major sources and their contributions to PM pollution should be identified [1,13,14]. An effective top-down scientific approach would consist of identifying sources of PM emissions and characterizing PM at the receptor, the sampling location where air quality is measured [1,13,14].
Various mathematical or statistical modeling methods have been introduced for determining the influence of PM2.5 pollution at the receptor. Many studies have used the positive matrix factorization (PMF) model, one of several receptor models, in an attempt to trace emission sources [15,16,17,18,19,20,21]. Receptor models such as the PMF model are a powerful tool to analyze complicated data such as air quality data based on 12 statistically extracted emission sources [13,22,23]. However, those receptor models do not include functions that can locate sites of pollution origin. Accordingly, several hybrid receptor models using a back trajectory of air mass such as the potential source contribution function (PSCF), the concentration-weighted trajectory (CWT), the residence time-weighted concentration (RTWC), and others have been developed [24,25,26]. However, a limitation of these hybrid receptor models is that they tend to overestimate the contribution of the sea and other sources where there actually are little or no emission sources [27,28]. Hybrid models are still needed to improve the tracing function that finds the source location [29,30,31,32,33,34]. PSCF models are often unable to classify regions with a high contribution because the same PSCF values appear when the sample concentration is high [35]. As an alternative, the CWT and concentration field (CF) hybrid models using pollution concentrations in grid cells were developed [36]. However, these hybrid receptor models still need to compensate for the overestimation in the grid without any emission sources.
A recent, large-scale study (Fine Particle Research Initiative in East Asia Considering National Differences (FRIEND)) has scientifically identified PM2.5 pollution in Korea. The central region of Korea, including Chungcheongnam-do, Chungcheongbuk-do, Jeollabuk-do, Daejeon, and Sejong-si, is one of the research regions in this project. The Daejeon metropolitan region, located in the center, has a supersite for air quality monitoring (Central Air Environment Research Center). An emission inventory of air pollutants from the central region of Korea shows that emissions of SOx, VOCs, PM, and others are higher than those from the capital region (Seoul, Gyeonggi-do, Incheon) because the central region of Korea has, in particular, large-scale power plants and steel mills. Most previous studies related to PM source apportionment using receptor models were mostly focused on the capital region in Korea.
In this study, a hybrid receptor model that combines features of the PMF and MCWT was used to identify PM2.5 pollution in Daejeon metropolitan city. The source apportionment of was carried out using this PMF model, and finally, contributions of dominant sources and the area of origin influencing PM2.5 pollution in the Daejeon metropolitan region were investigated using an MCWT model which is used to overcome the limitations of the CWT model.

2. Experimental Methods

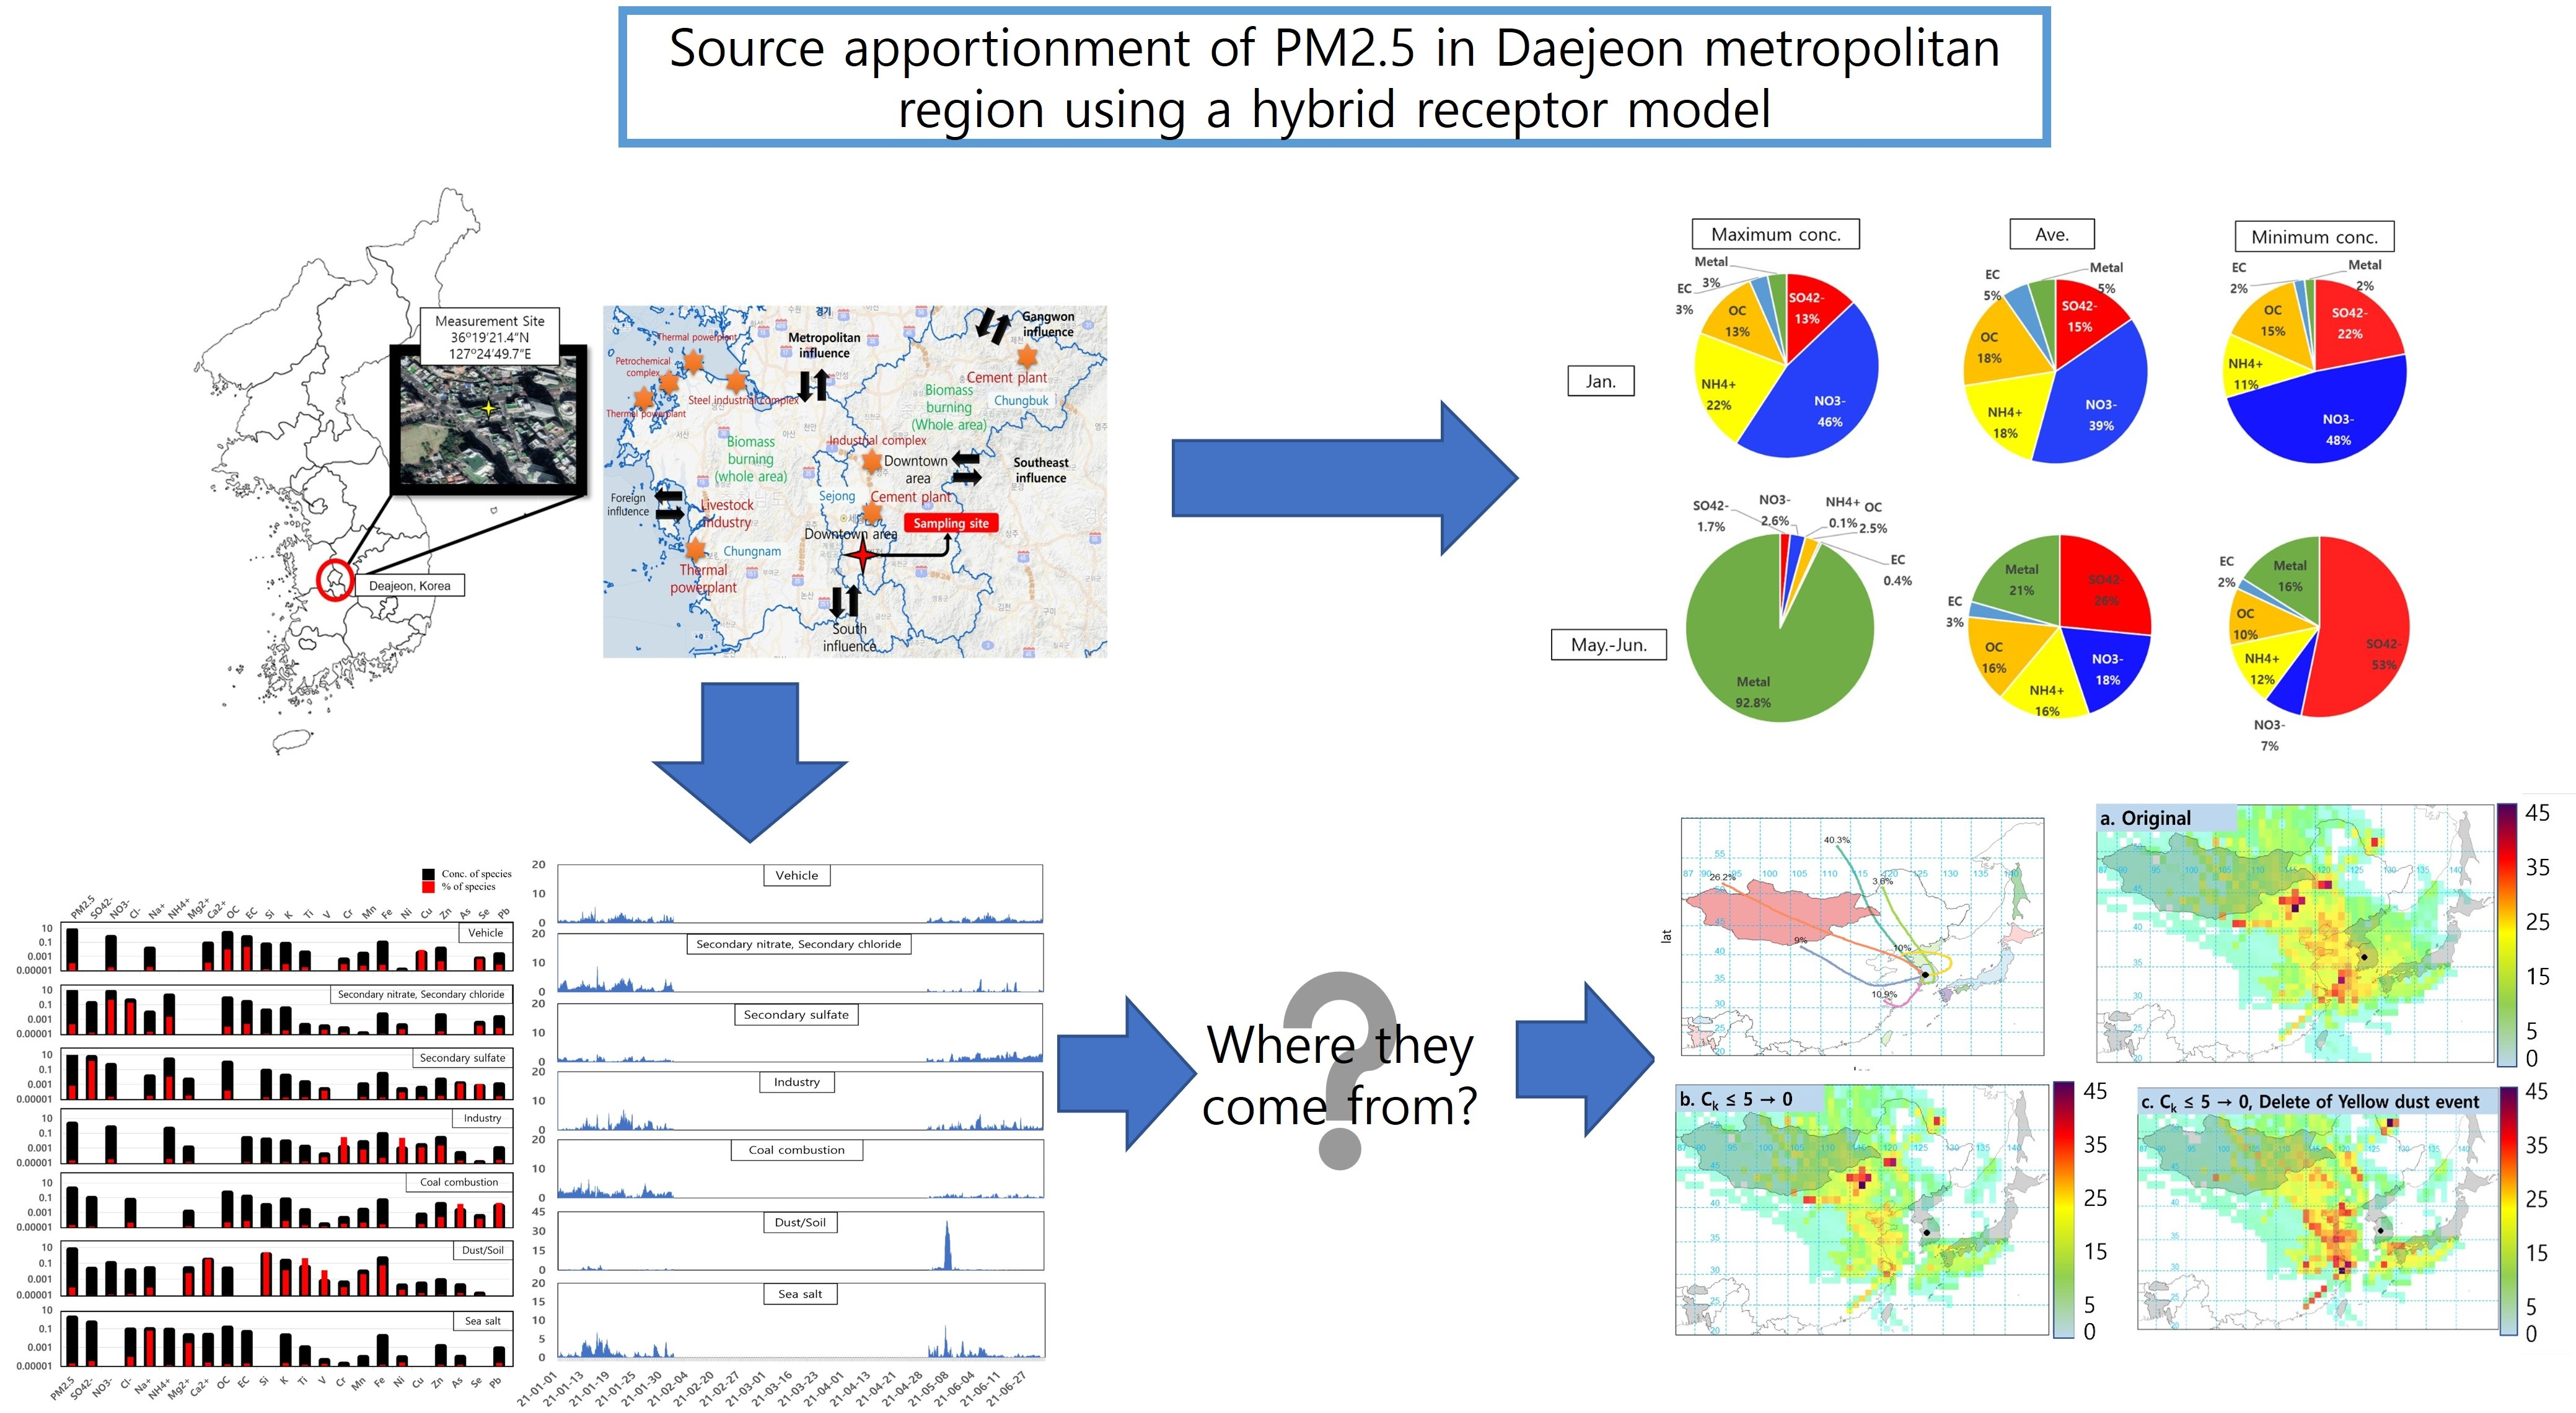
2.1. Sampling Location and Monitoring Site

Figure 1 shows the location of the measurement site and surrounding environmental/industrial conditions, including the central region of Korea, which contains a monitoring site adjacent to the Yellow Sea in the west (oversea influence), the capital region (urban influence) in the north, the southeastern region (mountain influence), and the southern region (agricultural influence). The distribution of emission sources in the central region includes large manufacturers such as petroleum plants, steel mills, and coal-fired power plants, which are located in the northwest; animal feeding operations and a coal-fired power plant located in the west; urban areas, including the Daejeon metropolitan region, Sejong special self-governing city, Cheongju-si, and Cheonan-si, located in the central-north; and cement industries located in the northeast. This central region in Korea is thus a proper geographical location to determine internal and external sources of emissions of PM2.5 and any interactions between the sources. The measurement site is located at 36°19′21.4″ N (latitude), 127°24′49.7″ E (longitude), i.e., one of the supersites in the central region of Korea (Central Air Environment Research Center).

2.2. PM2.5 Sampling and Measurement

The two PM2.5 monitoring periods were from 1 January to 31 January 2021, and 1 May to 30 June. Measurement compounds were PM2.5 mass concentration, 8 ions (SO42−, NO3, Cl, Na+, NH4+, K+, Mg2+, and Ca2+), organic carbon (OC) and elemental carbon (EC), and 17 elements (Si, S, K, Ca, Ti, V, Cr, Mn, Fe, Ni, Cu, Zn, As, Se, Br, Ba, and Pb). Hourly data for all measurement compounds were used in this study. Real-time PM2.5 mass concentration (µg/m3) was measured by beta-ray attenuation methods (BAM-1020, Met One Ins, Oregon, 97526, USA) which semi-continuous monitoring method. Ions were analyzed by an Ambient Ion Monitor (AIM(9000D), URG Co., North Carolina, 27516, USA), i.e., ion chromatography (IC) [37,38]. The experimental conditions of IC in details are shown in Table S1 in the Supplementary Materials.
OC and EC were analyzed by the thermal/optical transmittance method (OCEC Aerosol Analyzer, Sunset Laboratory) and non-dispersed infrared (NDIR) method based on the National Institute for Occupational Safety and Health (NIOSH) and the Environmental Protection Agency (EPA) Scientific and Technology Network (STN) methods. Table S2 in the Supplementary Materials shows gas and temperature conditions of the OCEC Aerosol Analyzer [37].
Elements were analyzed by an online X-ray fluorescence (XRF) (Xact® 625i, SailBri Cooper, Inc., Tigard, OR 97223, USA) [38,39]. Online PM2.5 samples were taken by a PM2.5 cyclone and collected on a filter tape. Mass concentration of 17 elements were detected by non-destructive analysis method. Further details on sampling and analysis methods are provided in the references [37]. Table S3 in the Supplementary Materials shows measurement detection limit (MDL) of PM2.5 components.

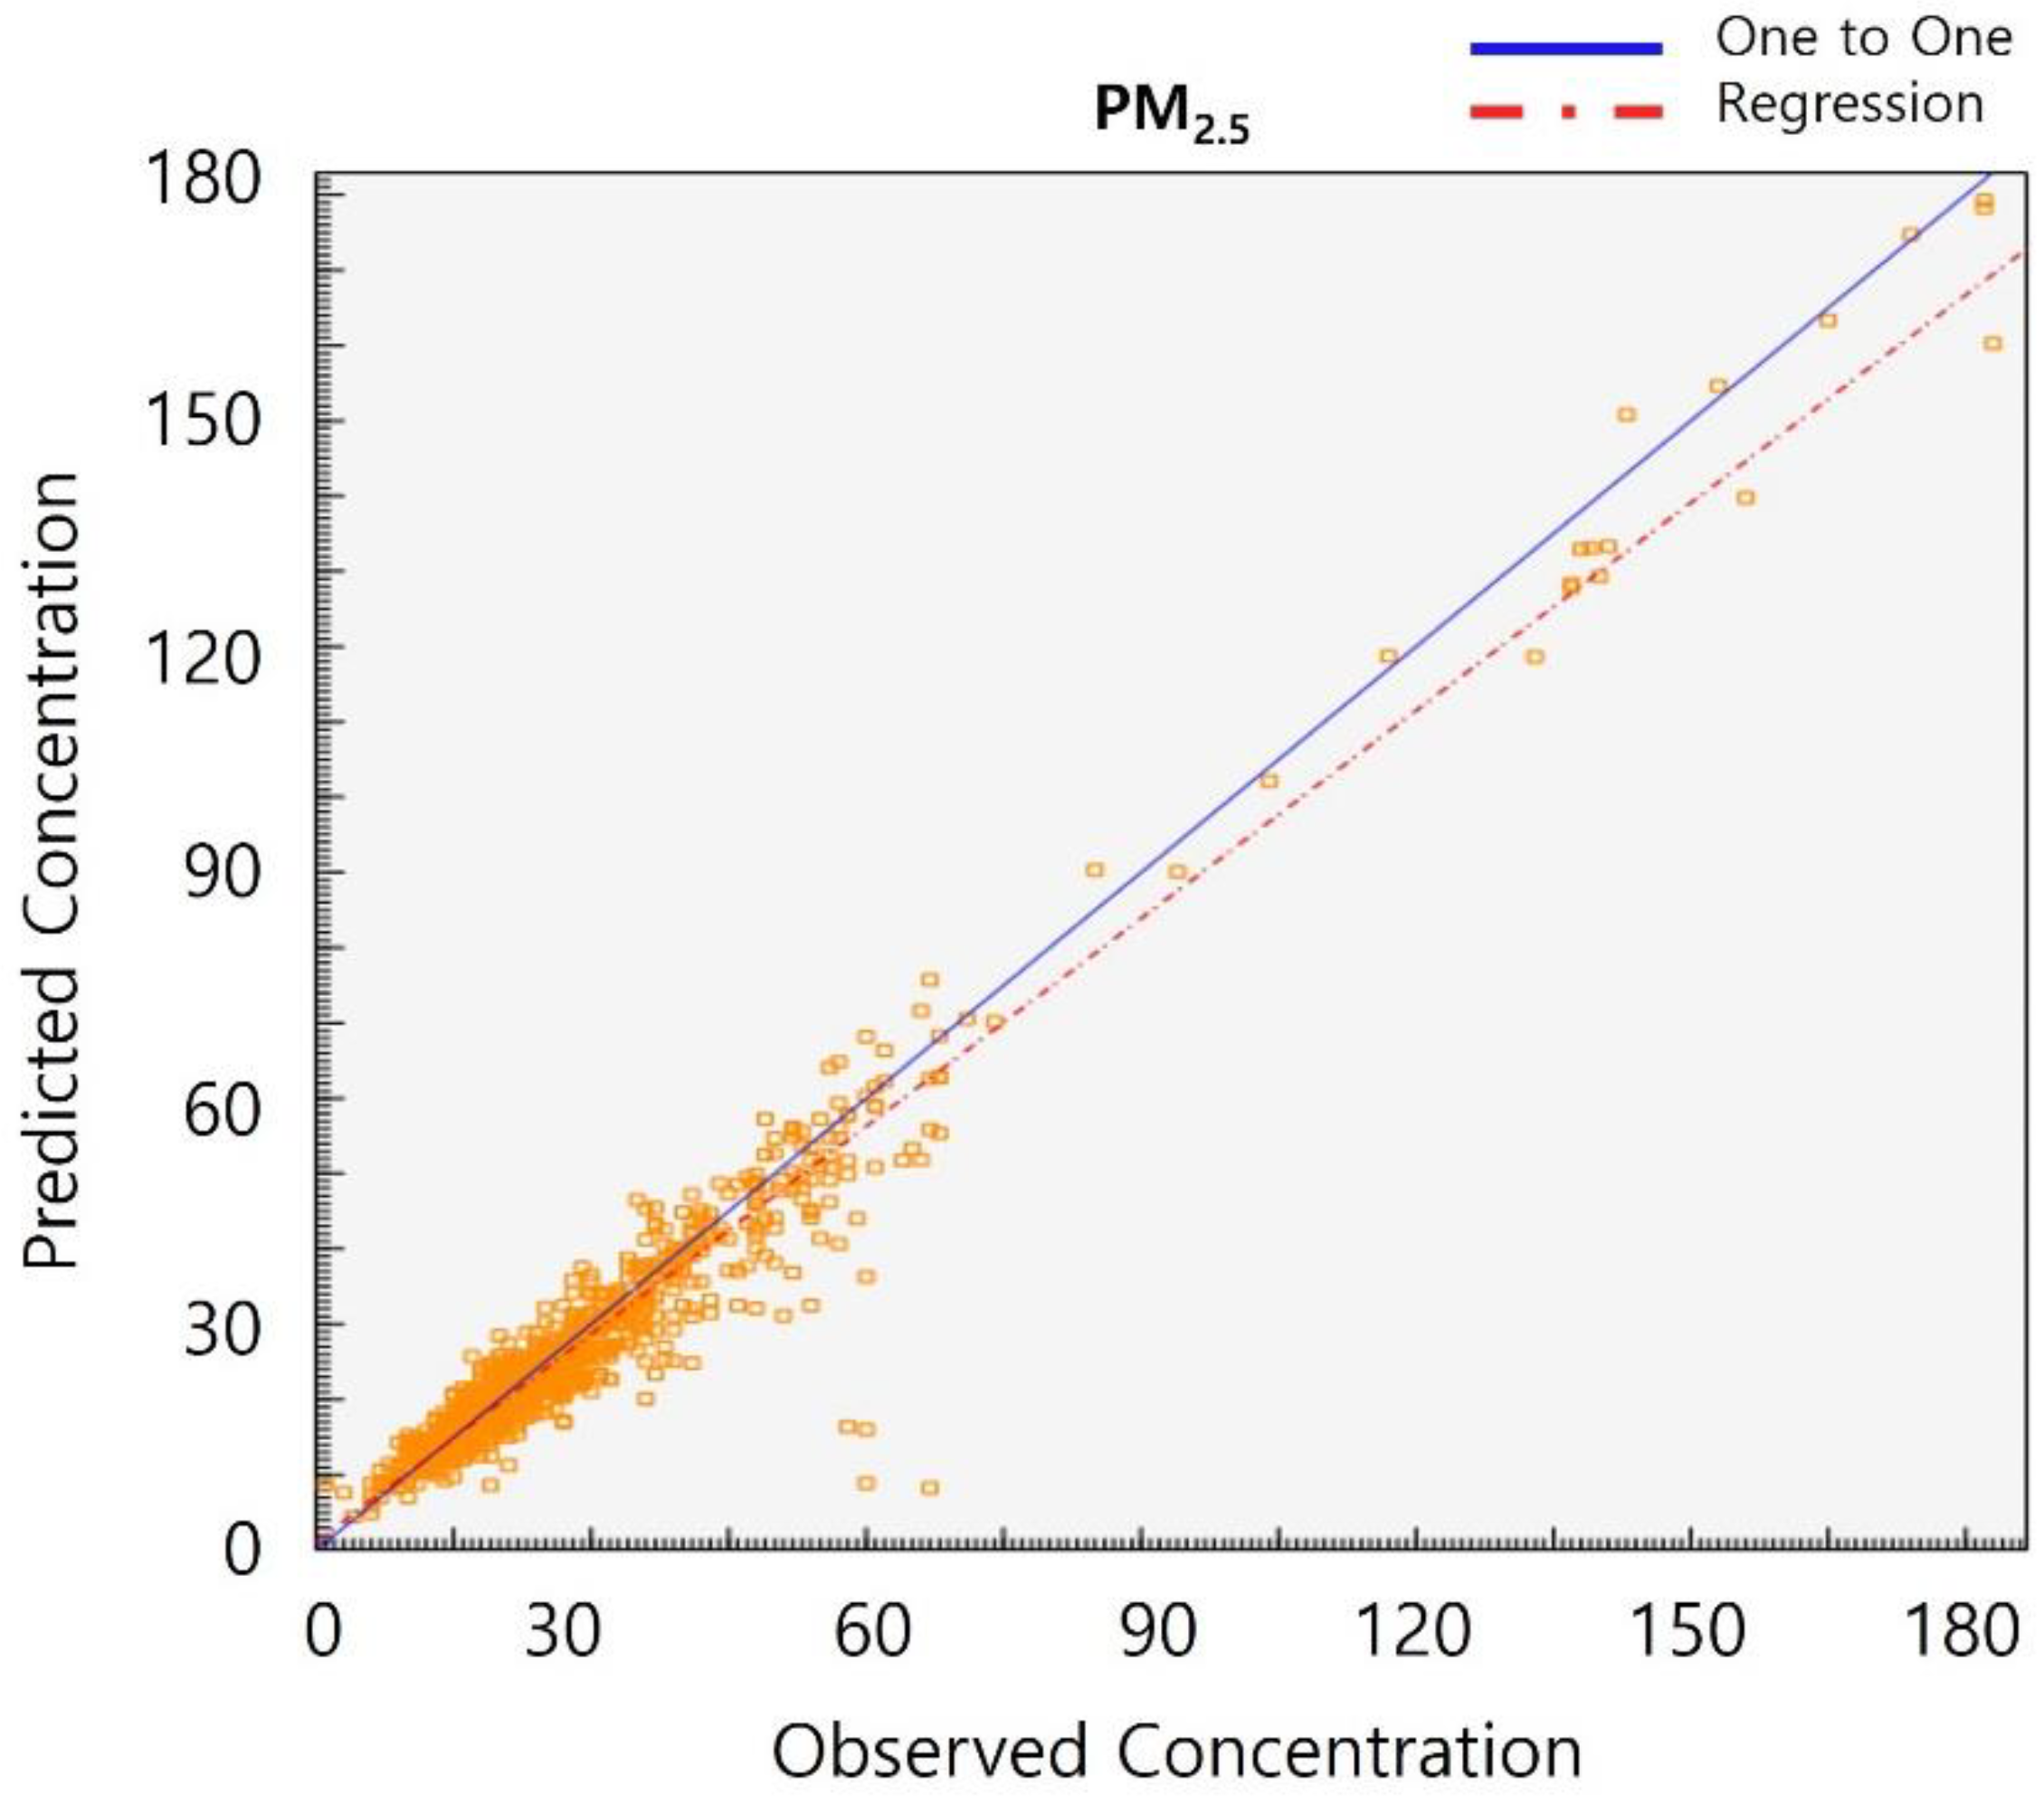
2.3. Positive Matrix Factorization (PMF)

PMF receptor models are based on an algorithm that calculates factors as positive values and minimizes the least square of individual data [13]. Positive matrix factorization (PMF) model version 5.0 was used in this study. In the PMF model, X data matrix can be expressed as two matrices, i.e., G ( n × p ) and F ( p × m ) (Equation (1)), where n and m are the number of samples and chemical species, respectively. E is the residual species; p is the number of extracted factors. In Equation (1), G means the source contribution matrix of p (number of factors) and F means the source profile matrix.
X = GF + E
Missing values for mass concentration or abnormal data that exceeded the recommended ratios between PM2.5 and each individual species were eliminated in the data preprocessing. Data processing details for input data were described in “An estimate of internal and external sources contributing to ambient particulate matter and a guideline on the application of air quality receptor models (II)” [40].

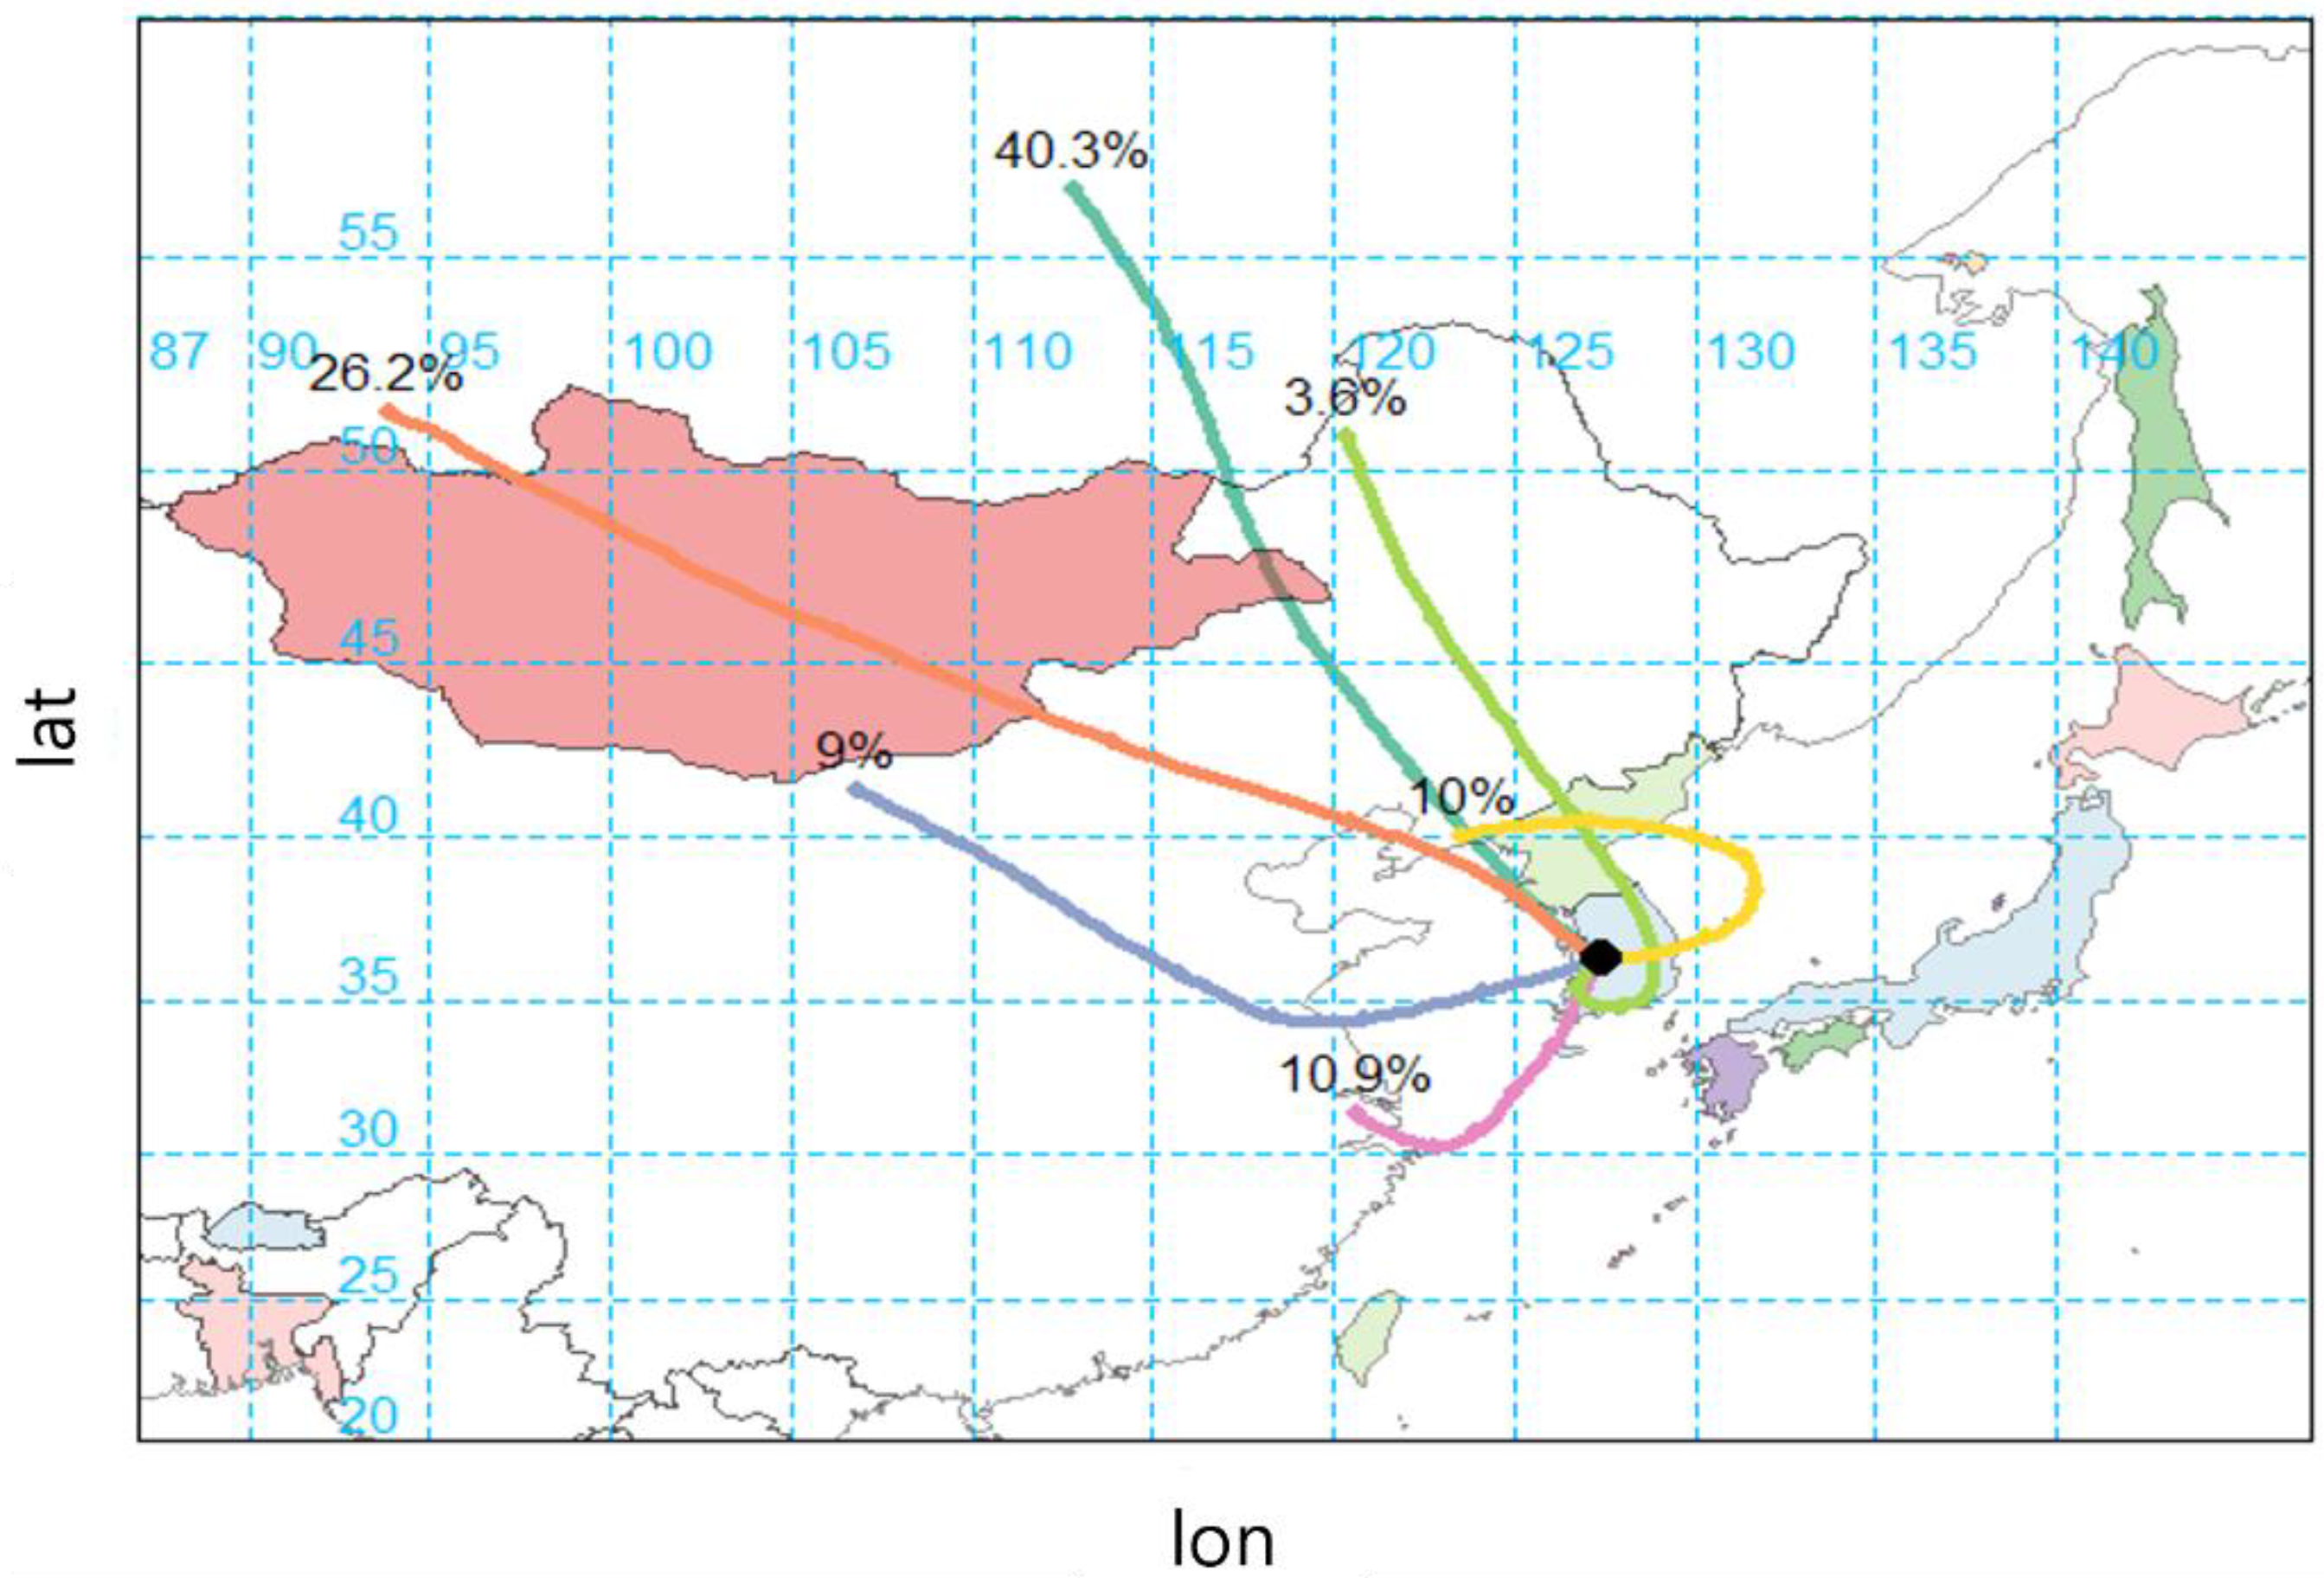
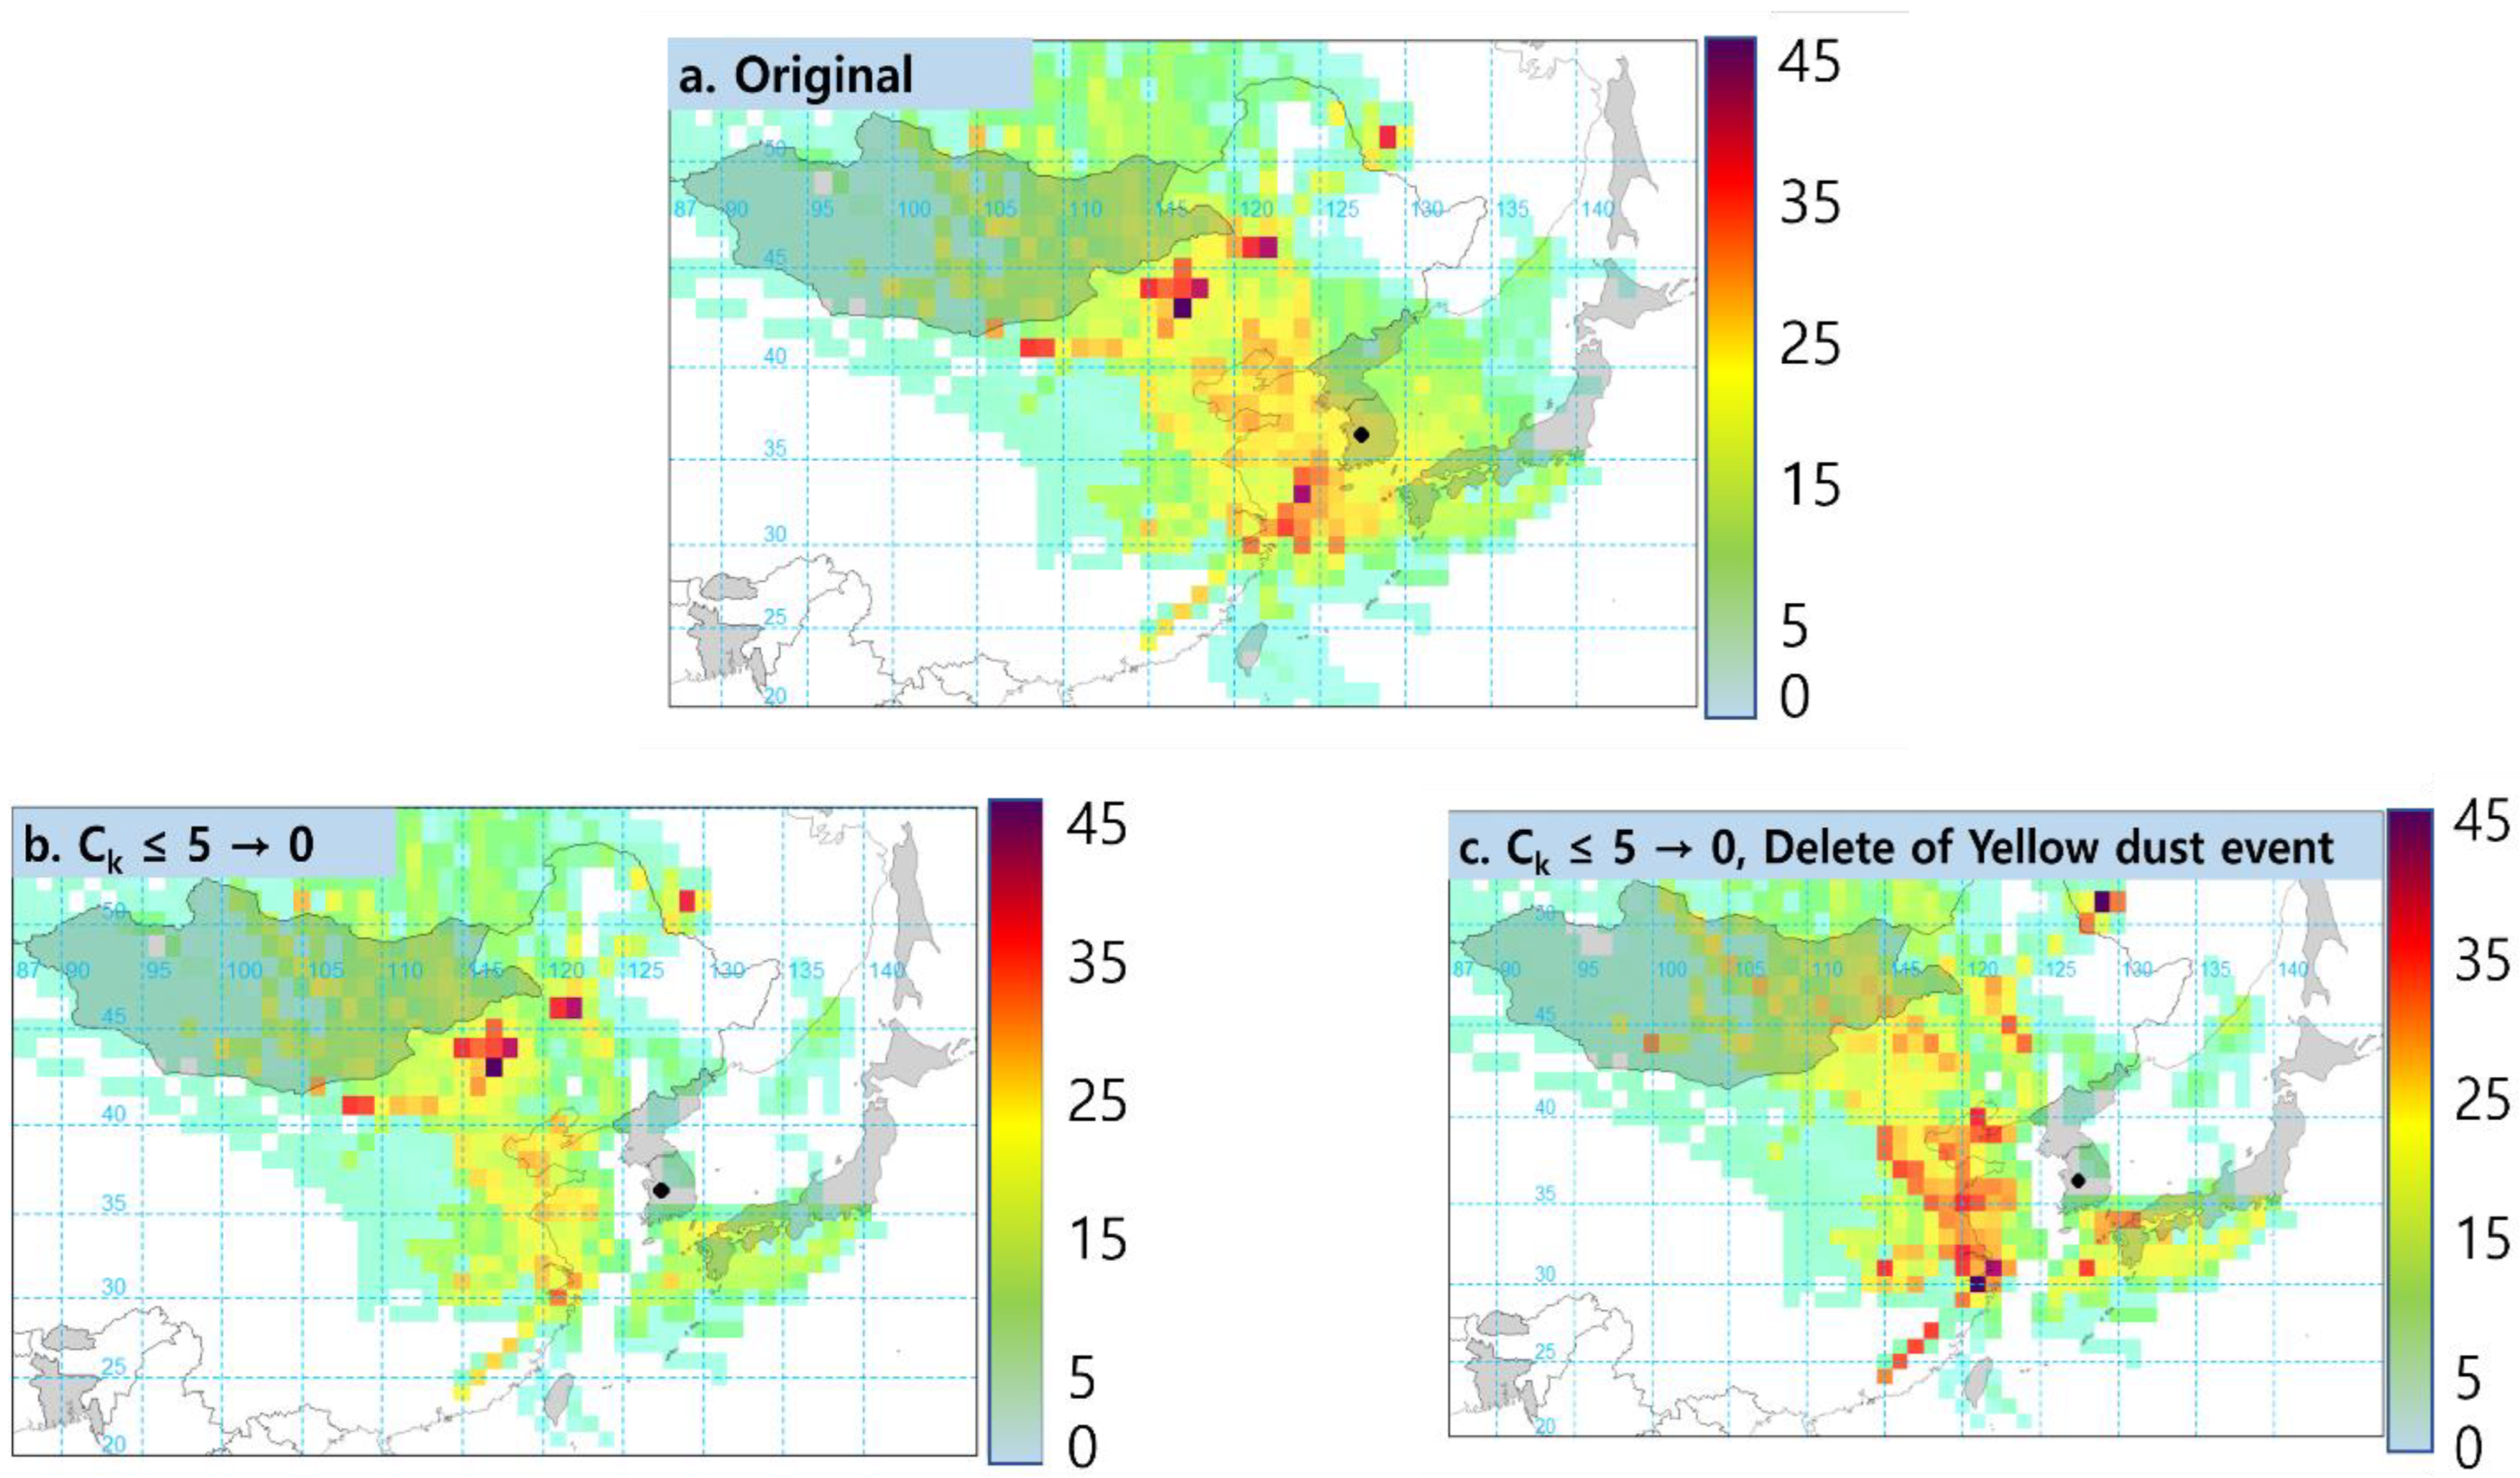
2.4. Concentration Weight Trajectory (CWT)

Hybrid single-particle Lagrangian integrated trajectory (HYSPLIT) and CWT models based on the HYSPLIT model were used in this study to trace source locations. A HYSPLIT model developed by the National Oceanic and Atmospheric Administration/Air Research Lab (NOAA/ARL) was used to induce air masses arriving at the receptor site. The HYSPLIT model calculates the trajectories using grid data obtained by various weather forecast models. A 3-day back trajectory (500 m height) was used in this study. The 3-day back trajectories are the most common method to analyze transportation of air mass in East Asia on the Korean Peninsula. Previous studies have shown that short-range reverse trajectory patterns, such as 3-day back trajectory, are useful to identify which regions are potential sources of the dominant aerosol type [41]. CWT analysis was processed using the package “openair” in R studio [36]. The concentration used in the CWT analysis was calculated according to Equation (2). In Equation (2), i and j are the grids indicating each location, k is the index of trajectory. N is the total number of trajectories, C k is the concentration of pollutants when k trajectory arrives at the receptor site. τ i j k means the residence time of k trajectory at the grid ( i ,   j ). The high C ¯ i j means that k trajectory passed by the grid ( i ,   j ) causing a high average concentration at the receptor site [36].
ln ( C ¯ i j ) = 1 k = 1 N τ i j k k = 1 N ln C k τ i j k
To improve the limit of CWT, which continuously overlaps depending on the analyzed trajectory, a modified concentration weight trajectory (MCWT) model was also used and compared with CWT model. In the MCWT model, a trajectory that appeared at a concentration of 5 μg/m3 or less (background level) among the analyzed Ck values was extracted under the assumption that the trajectory did not affect the high levels of concentration of the receptor site.

3. Result and Discussion

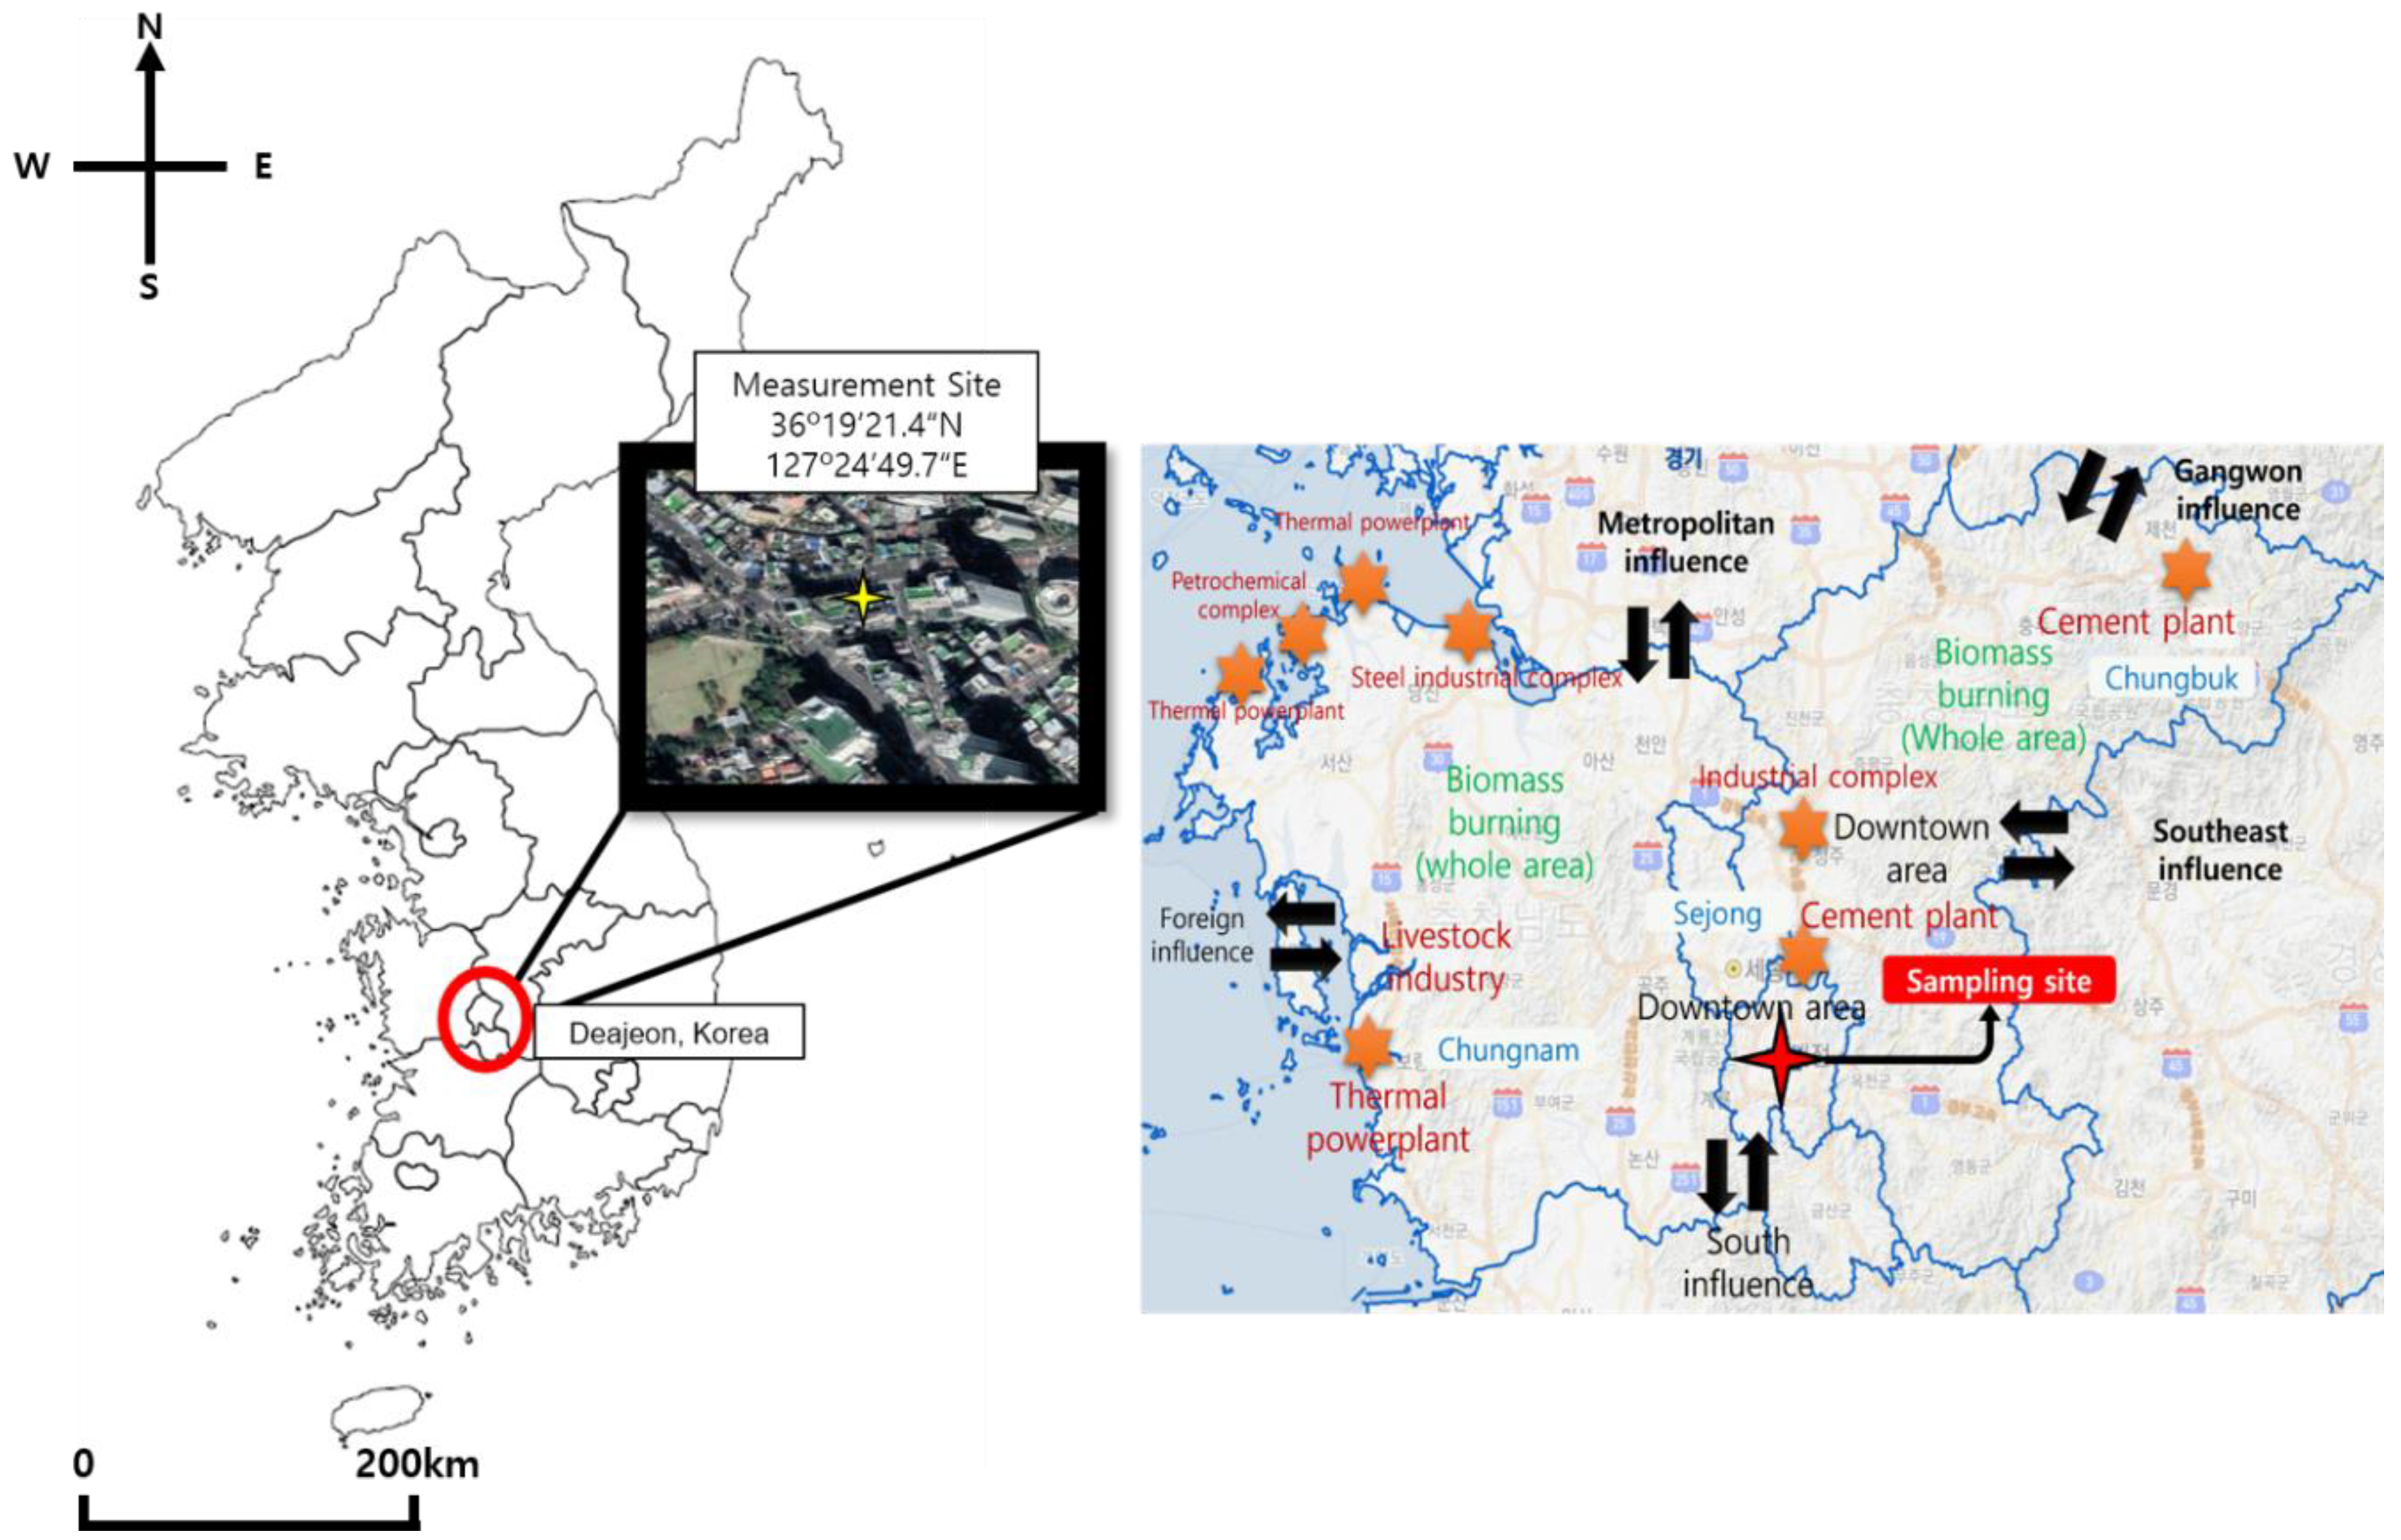
3.1. Chemical Composition of PM2.5

Table 1 shows the PMF input data of the physicochemical composition of PM2.5 during the one-month period of January 2021 and during the two-month period of May to June 2021. Data which had possible errors were eliminated in the preliminary data analysis. Fractions of ion, carbonaceous compound and elements in PM2.5 during January were 58%, 17%, and 3.6%, respectively, while those fractions during May to June were 49%, 17%, and 14.9%, respectively. Owing to yellow dust events, the elements fraction during May to June was significantly higher than that during January. The average PM2.5 concentration was 25 ± 14 μg/m3 during January and 22 ± 19 μg/m3 during May to June. The highest PM2.5 concentrations were 104 μg/m3 during January and 183 μg/m3 during May to June. The element high concentration during January was 8.53 μg/m3, while the concentration during May to June was significantly higher (85.2 μg/m3), indicating a yellow dust event in this period. Filonchyk et al. (2022) reported that yellow dust was formed by sand storms in the Gobi Desert in China [42]. The concentration of cluster elements (Ca, Al, Fe etc.) existed at a higher concentration during the period of yellow dust [42,43]. Dust storms deliver large amounts of crustal aerosols and trace elements [44]. Therefore, the concentration of the elements was high in the period of May–June containing yellow dust events. Indeed, the fraction unknown portion in PM2.5 was considerably high in yellow dust periods, compared with other periods. Thus, the extremely high fraction of elements would be sometimes possible to be expressed in the PM2.5 chemical speciation. Average sulfate and nitrate concentrations were 3.29 ± 2.09 μg/m3 and 8.32 ± 5.96 μg/m3 during January and 5.01 ± 3.01 μg/m3 and 3.45 ± 4.39 μg/m3 during May to June, respectively. The sulfate concentration was higher during May to June, while nitrate was higher during January. Guo et al. (2010) reported that the formation of sulfate in May–June was higher than other periods and the sulfate was mainly attributed to the formation of cloud or aerosol droplets (70–80%), while nitrate decreased because NH4NO3 was converted to gas-phase HNO3 and NH3 by thermodynamic equilibrium in May–June [45]. These results were consistent with previous reports that the gas-to-particle conversion rate from sulfur dioxide to sulfate salt was higher in the daytime in the humid summer season [7,22,23] and the formation of particulate nitrate was more significant in conditions of low temperature and relative humidity [46,47].
Figure 2 shows the fraction of major compounds in PM2.5. The average concentrations of SO42−, NO3, NH4+, OC, EC, and elements during January were 15%, 39%, 18%, 18%, 5%, and 5%, respectively, while those fractions during May to June were 26%, 18%, 16%, 16%, 3%, and 14.9%, respectively. When PM2.5 concentration rose during sampling periods, NO3- was increased in the January period. May to June showed high SO42−, but elements were high due to the yellow dust events, e.g., crustal elements. The fractions of OC and NH4+ were quite stable because OC emission was mainly caused by vehicle source rather than the source of biomass burning in Daejeon area and ammonium at all times combined with either nitrate or sulfate, regardless of seasonal variations in winter and summer [45,48,49,50,51].
Table 1. PMF input data during the measurement period (µg/m3).
Jan. 2021May to Jun. 2021
Data
( n )
Ave.Med.Std.Max.Min.Data
( n )
Ave.Med.Std.Max.Min.
PM2.5743252214104114602219191831
SO42−5403.292.742.0911.80.338905.014.893.0115.80.16
NO35408.327.055.9642.20.558903.451.834.3929.50.07
Cl5400.750.670.412.920.18660.160.070.231.440.005
Anions54012.310.17.5856.11.568908.617.316.7645.90.31
Anions
/PM2.5
5400.430.350.261.930.058880.370.360.151.190.013
Na+4190.130.090.10.630.029350.10.060.131.320.005
NH4+5403.93.212.6819.30.49623.072.642.3514.90.014
K+2910.160.130.130.90.018470.160.130.130.930.005
Mg2+4970.090.030.212.580.017910.050.020.120.850.005
Ca2+5390.330.130.747.790.019490.260.090.796.810.006
Cations5404.53.812.9820.10.59693.593.132.4415.20.09
Cations
/PM2.5
5400.160.130.10.720.029680.150.150.060.450.01
A+C
/PM2.5
5400.580.480.362.650.079680.490.490.221.640.016
OC7373.813.342.0712.40.9213852.932.342.0812.90.14
EC7371.030.810.734.210.1113000.510.450.271.710.02
Carbon7374.844.192.7416.61.1813923.392.852.32140.03
Carbon
/PM2.5
7370.170.140.090.570.0413880.170.160.080.820.01
Element7381.040.641.168.530.1214303.972.667.9685.20.031
Element
/PM2.5
7380.0360.020.040.290.00414260.1490.130.070.810.01

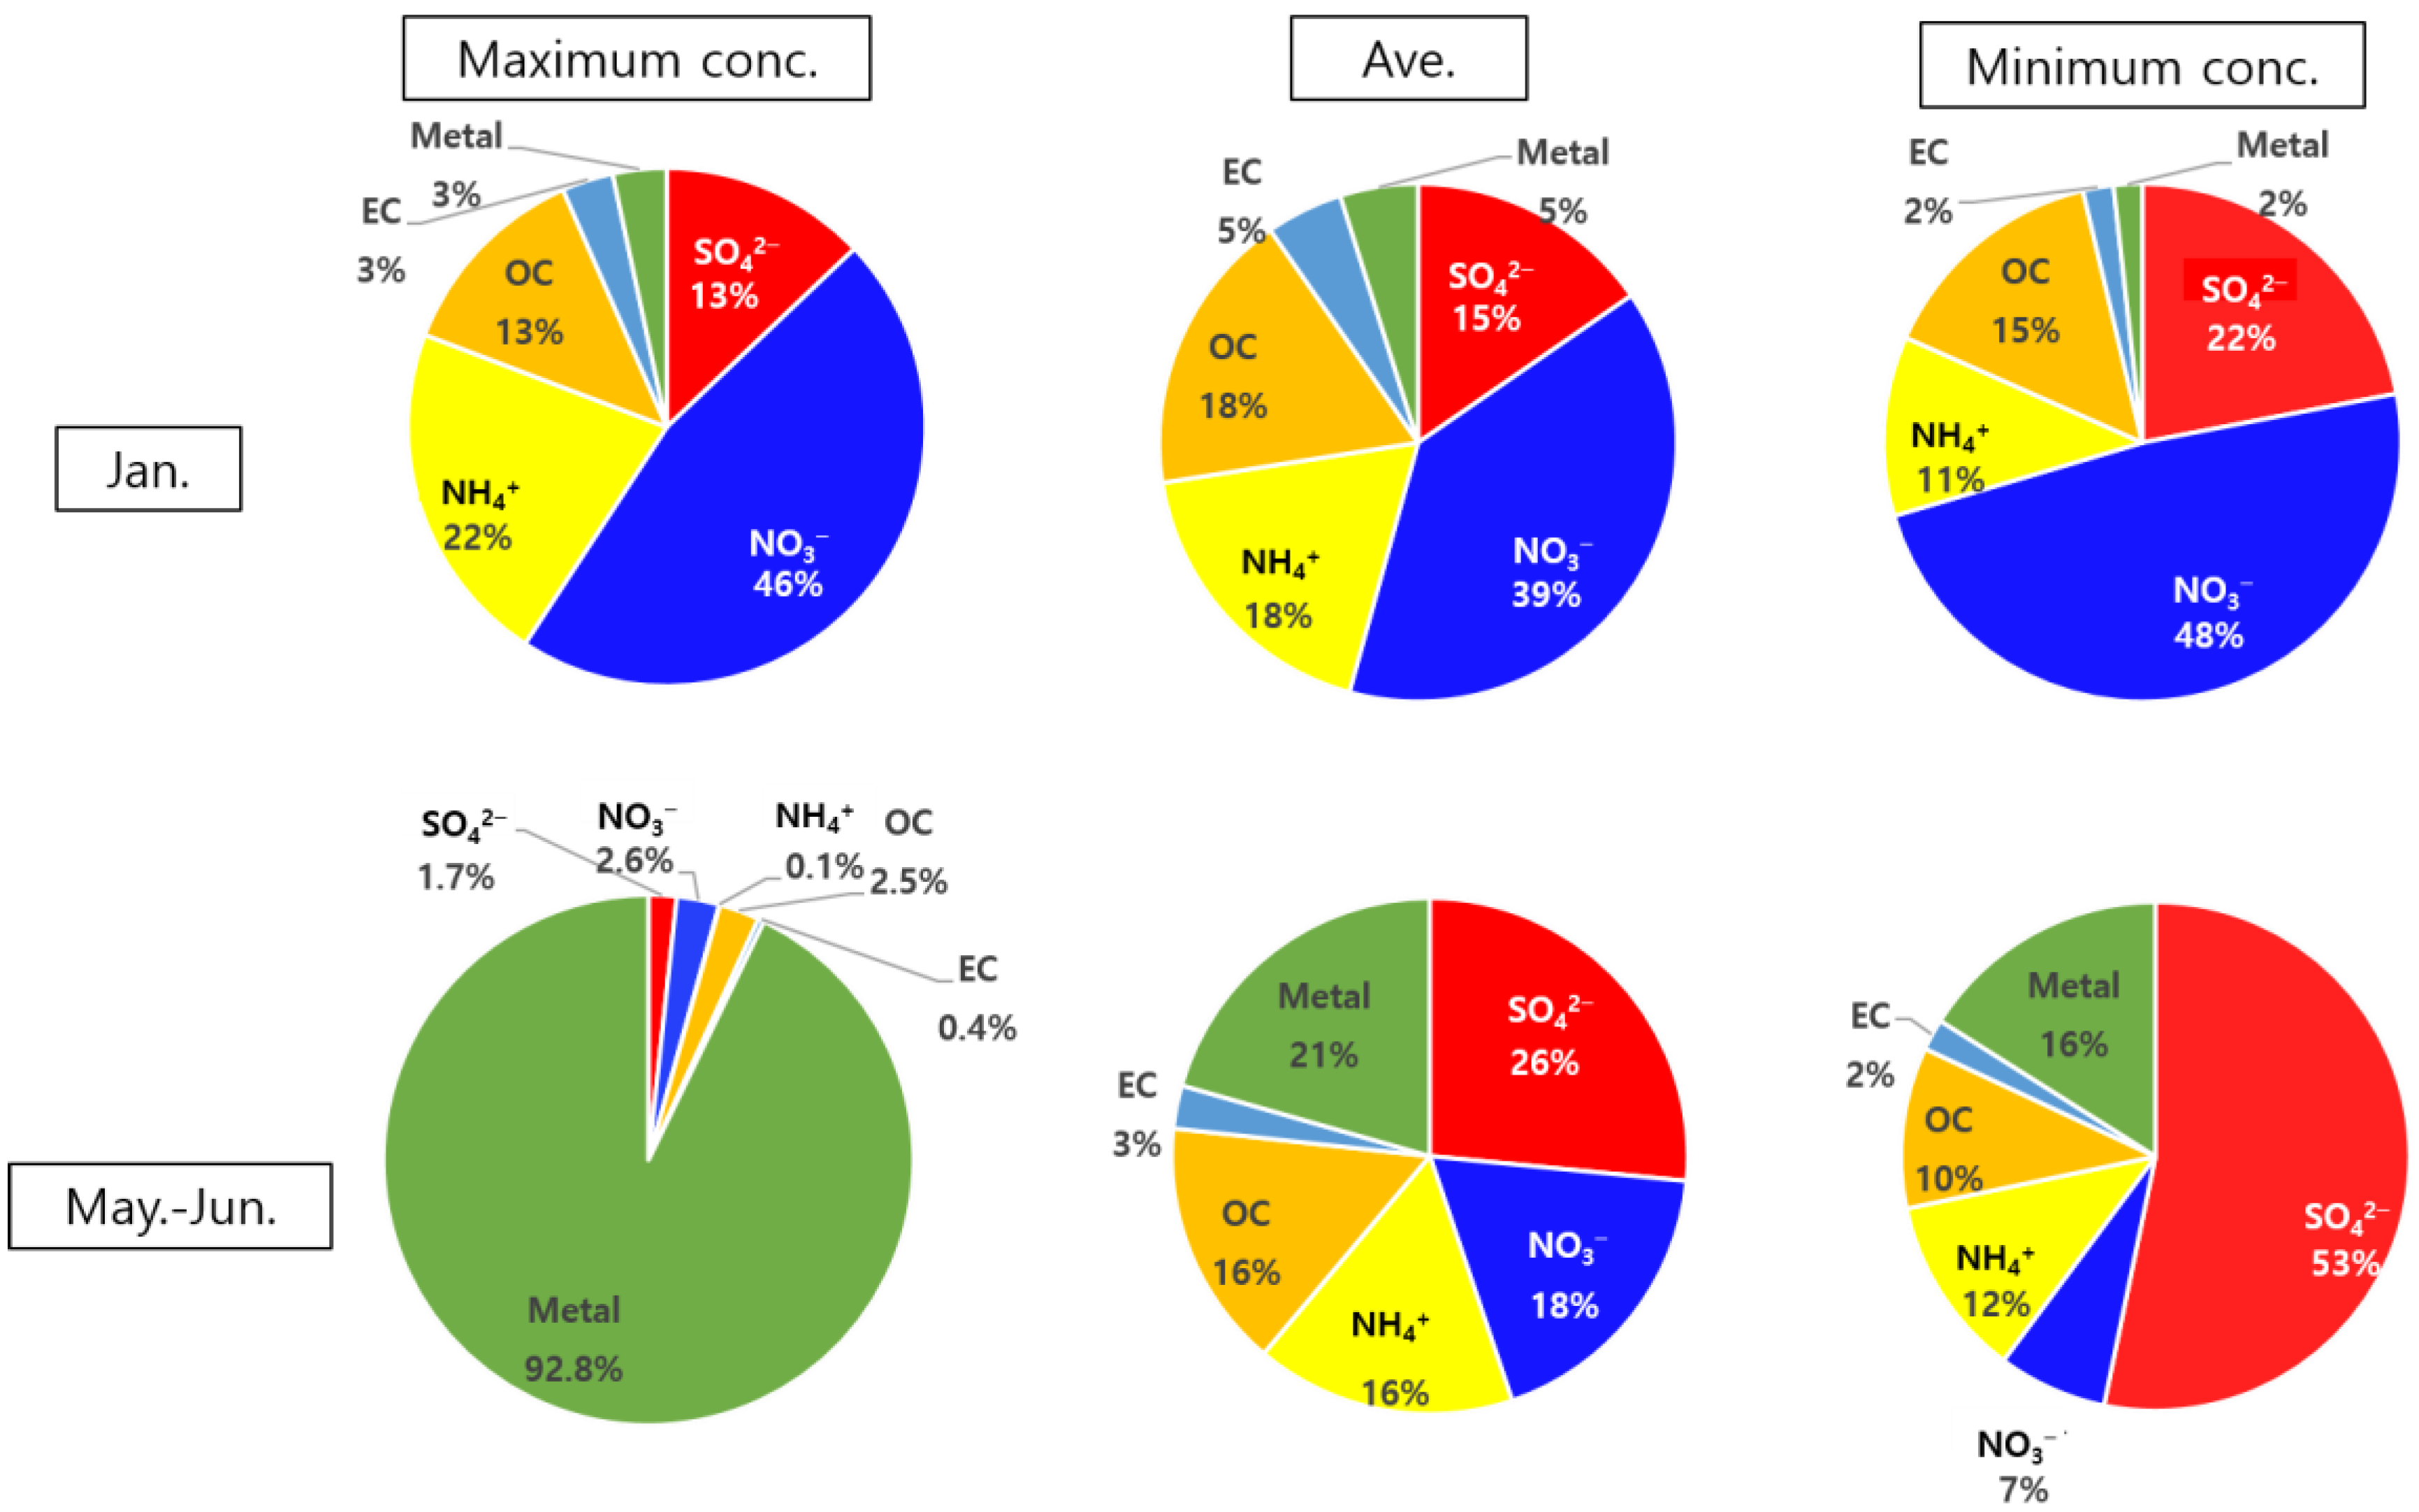
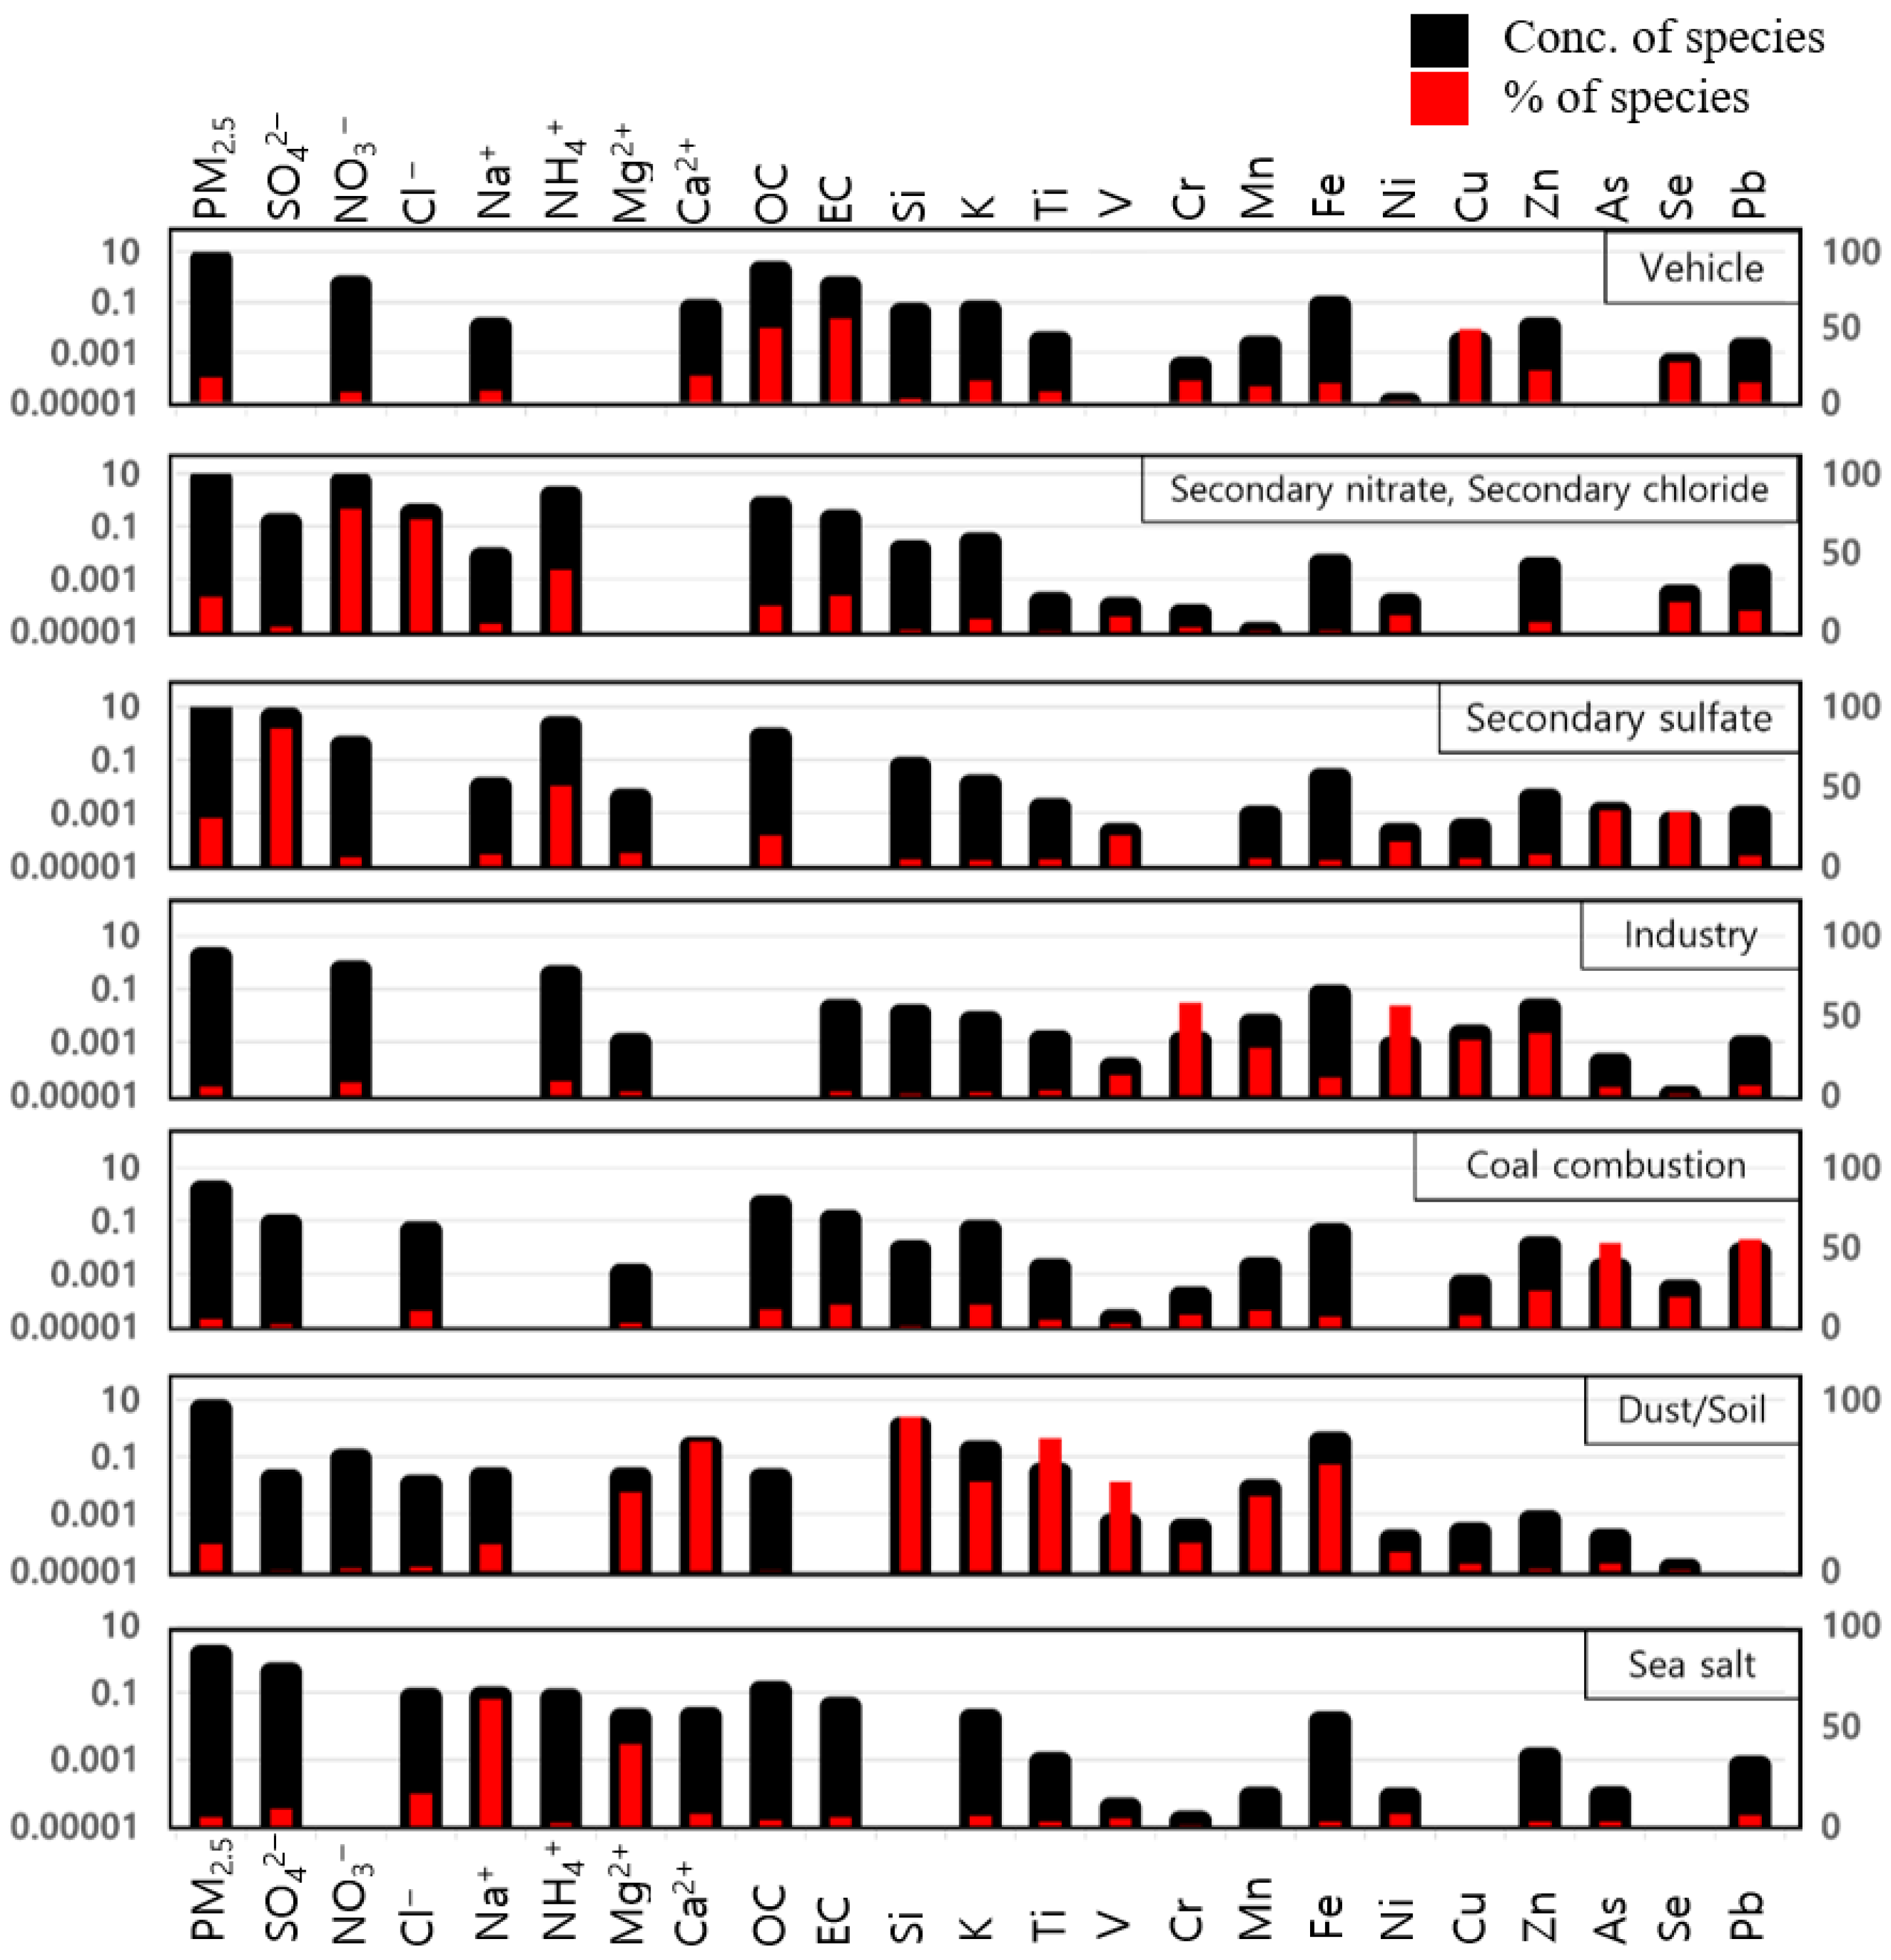
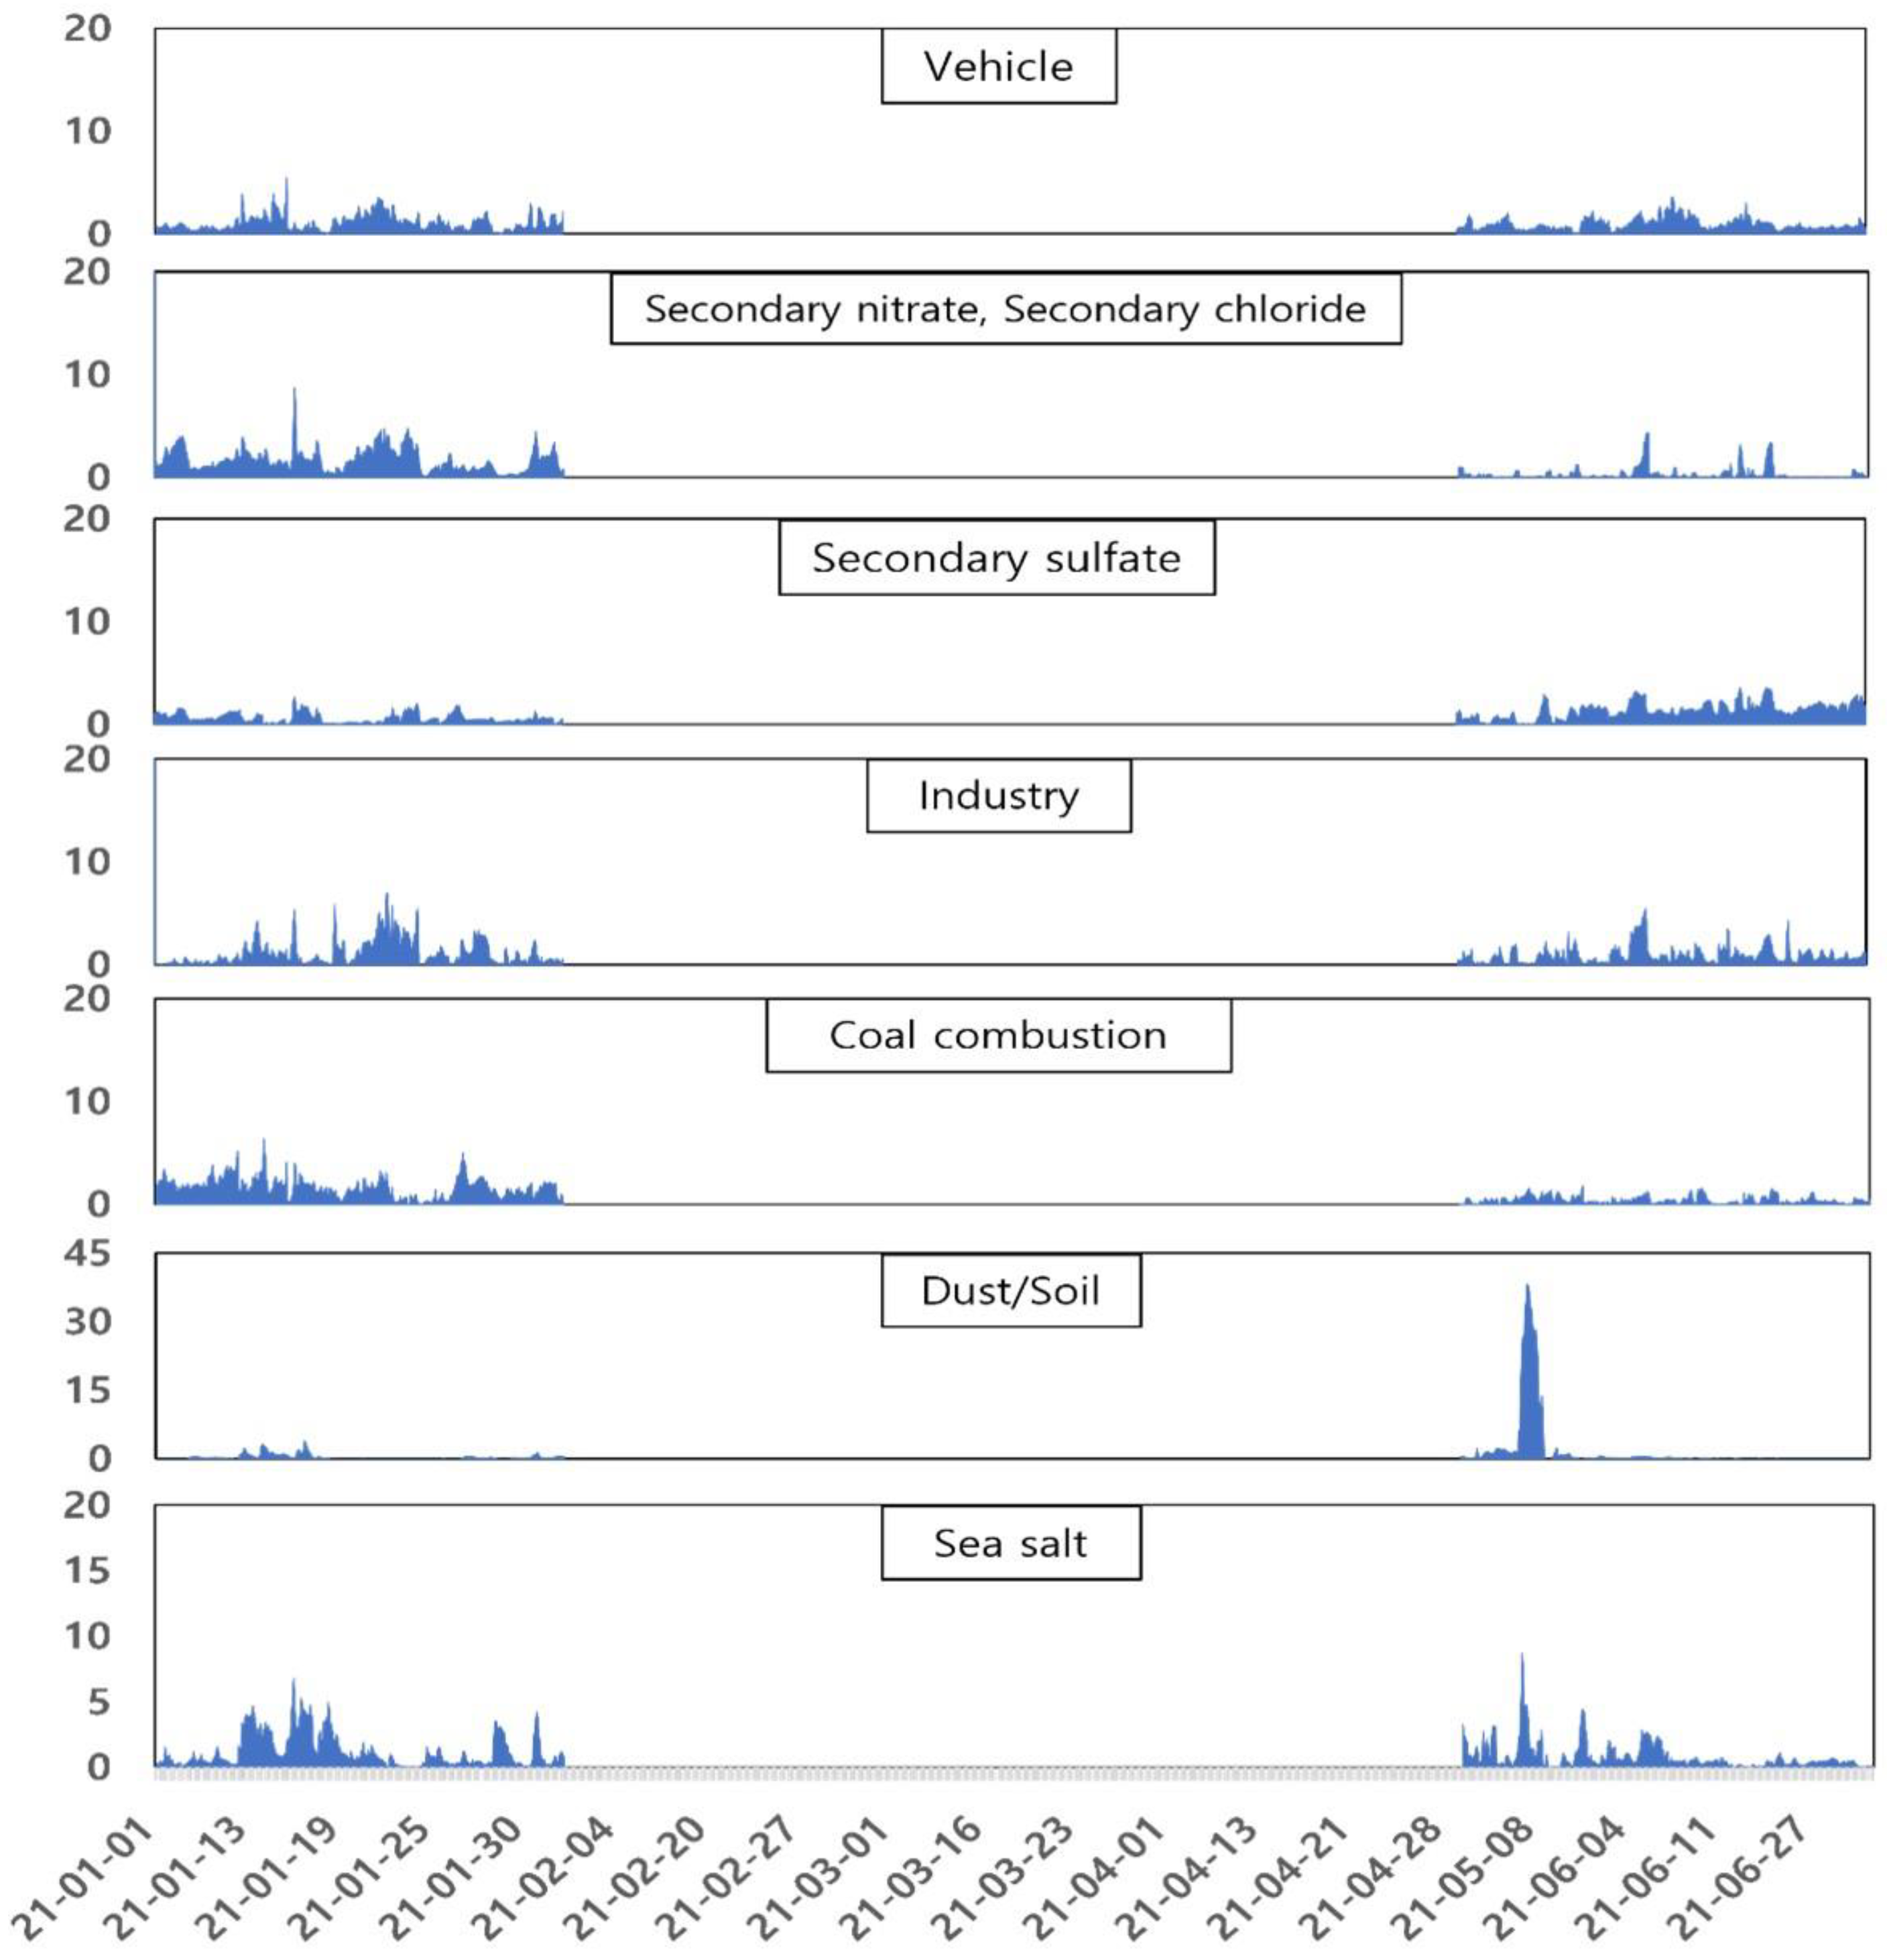
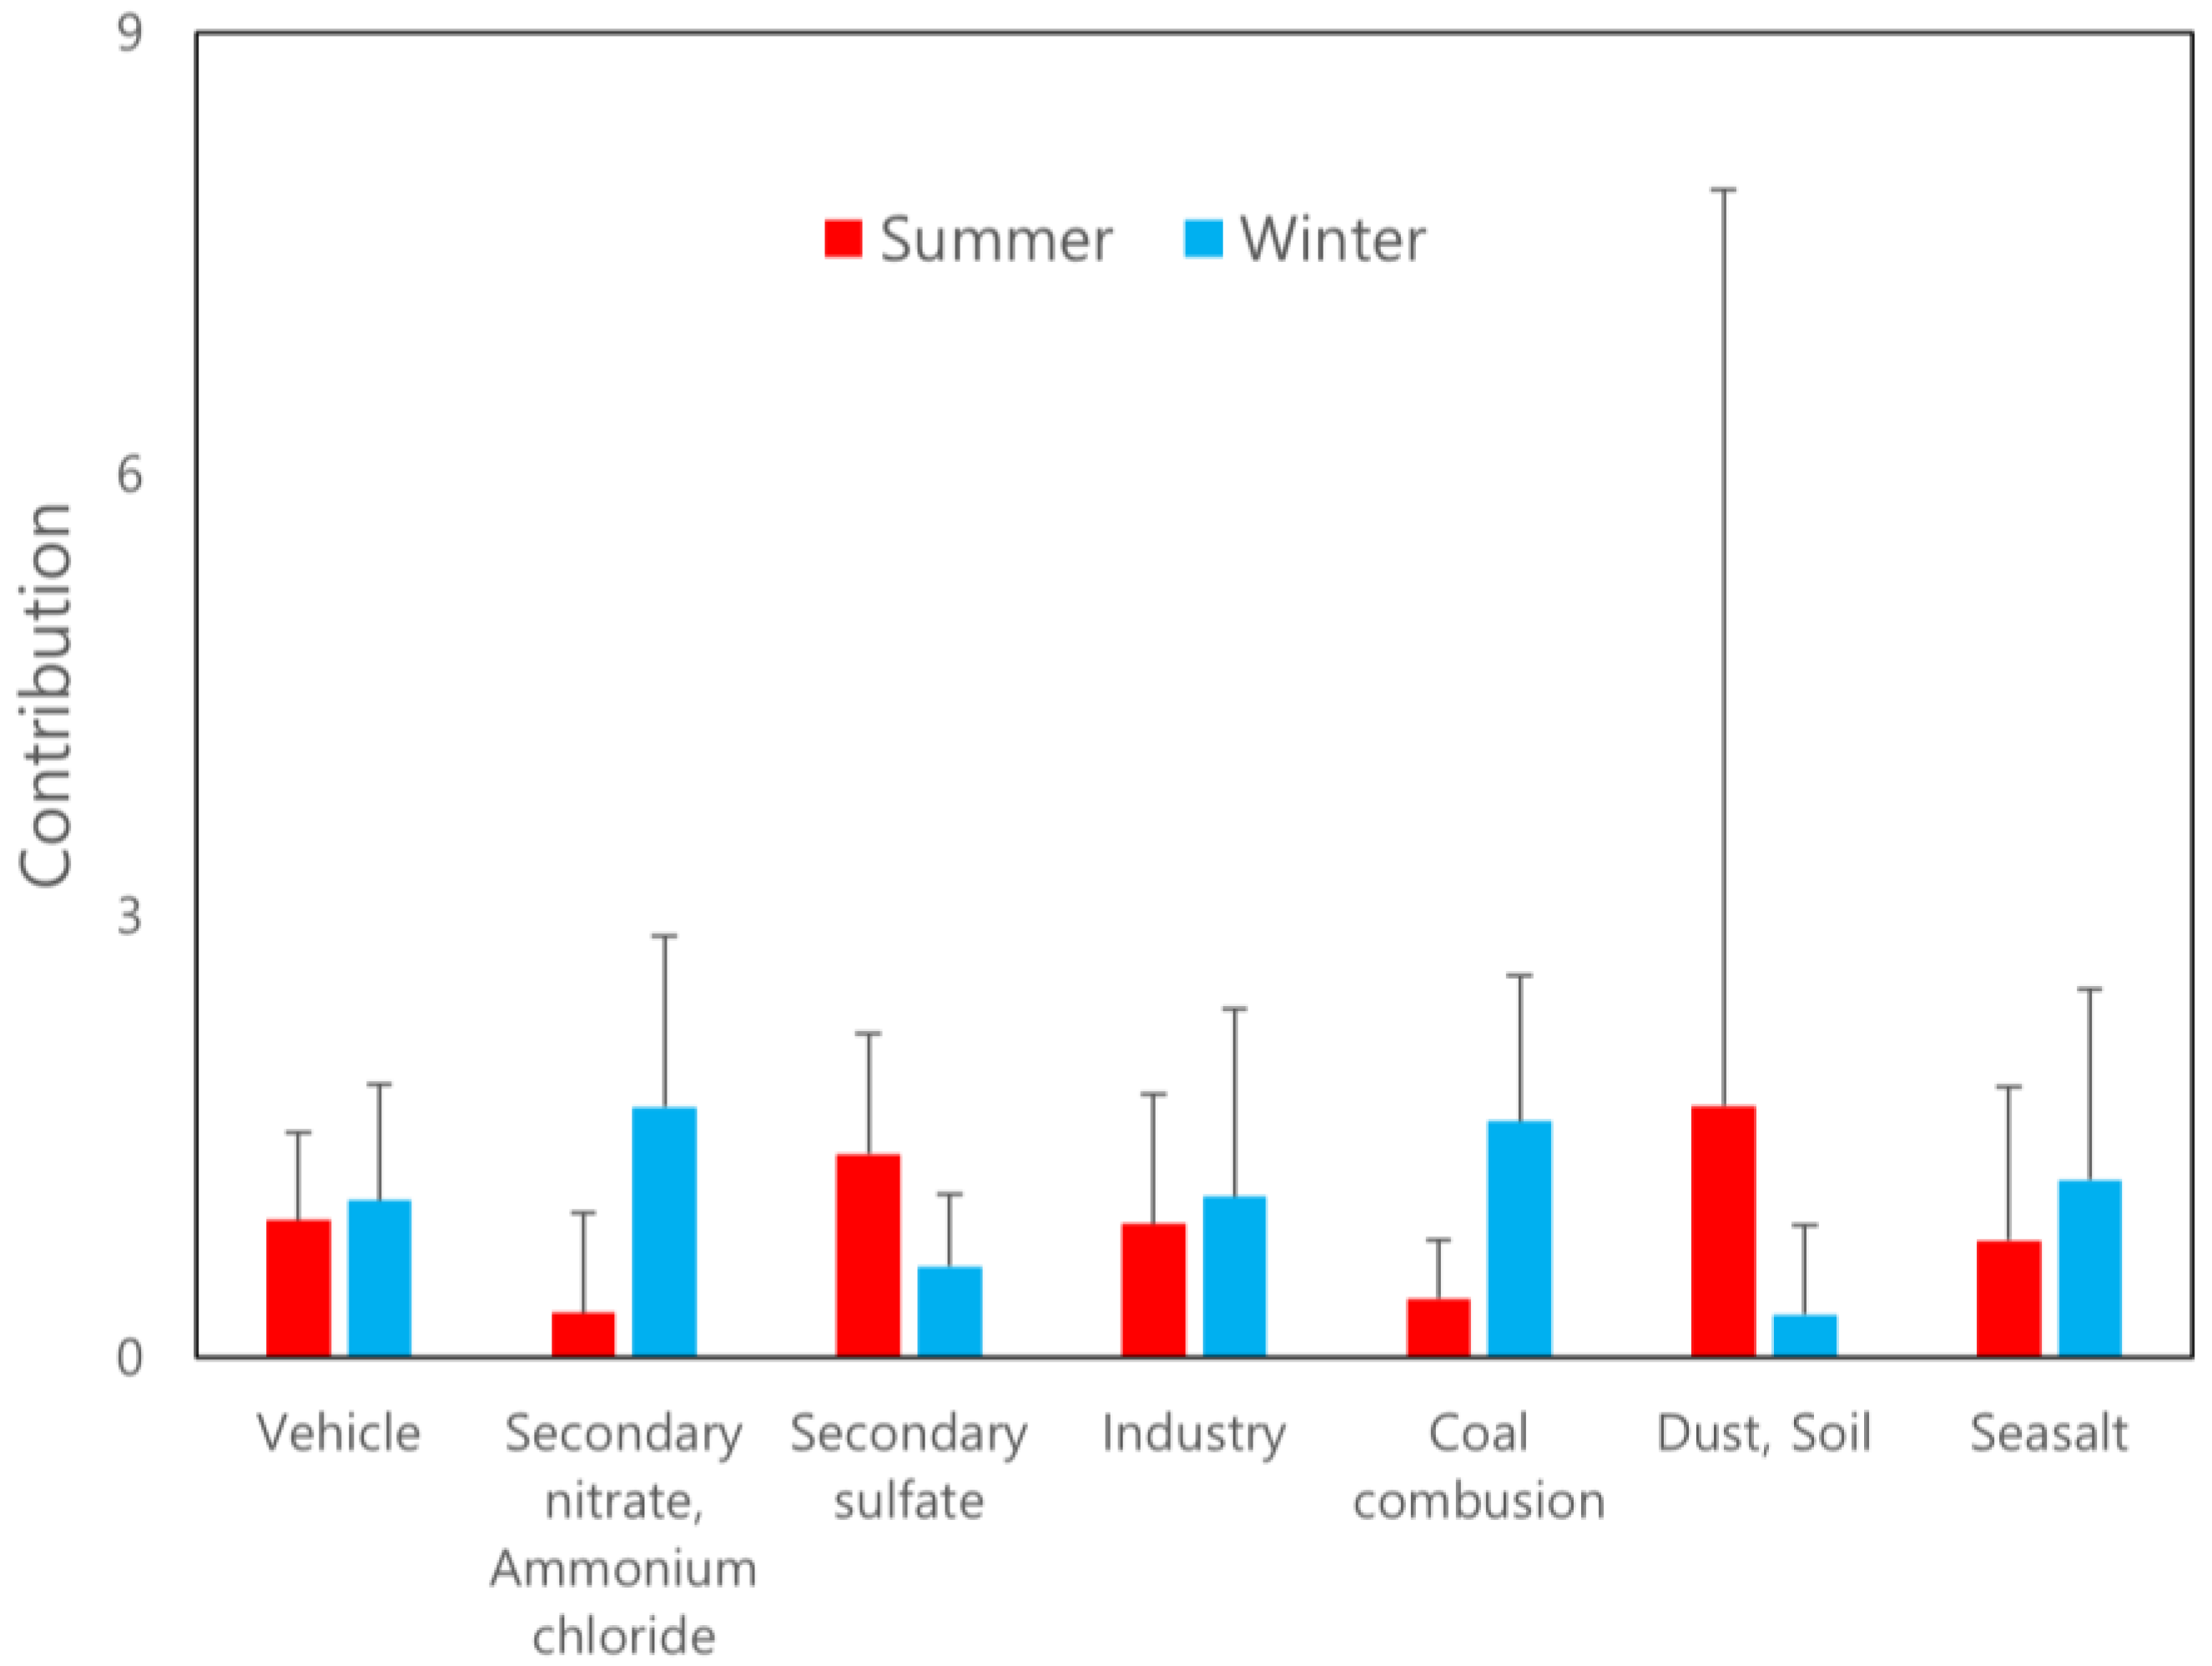
3.2. Source Apportionment by PMF

In the PMF base model, differences between observed and estimated values for factors such as the correlation coefficient (R2), slope, intercept, and standard error underwent preliminary data analysis. Major components (PM2.5, SO42−, NO3, NH4+, OC, EC, K, V, and As), which were frequently used as markers in the source apportionment, mostly showed good values indicating an R2 of more than 0.8 (data not shown). Figure 3 and Figure 4 show factor profiles and contributions by PMF during both measurement periods (1 January to 31 January and 1 May to 30 June 2021). This result was optimized by changing the number of factors and considering whether markers expressed factor properties well. In conclusion, seven factors for source profile and contributions were selected, as shown in Figure 3 and Figure 4 and Table 2.
Figure 5 shows the correlation between observed and predicted PM2.5 mass concentrations. The correlation coefficient (R2) between observed and predicted PM2.5 concentrations was significant (R2 = 0.939). This study showed a similar value compared with previous studies that showed correlation coefficients between predicted and observed concentrations ranging from 0.93 to 0.96 [23,52].
Factor 1 was classified as vehicle source (exhaust gas), indicating a higher contribution of OC, EC, and Fe. In general, OC and EC appear in the vehicle combustion process [48,49,50,51]. The average contribution during whole monitoring periods was 4.8 μg/m3 (17%), and the contribution of vehicle sources had no significant pattern during the monitoring period. In general, the emission of diesel exhaust showed high EC, while the emission of gasoline exhaust showed high OC [48,49,50,51]. Unfortunately, diesel and gasoline vehicle sources were not distinguished in this study. A past study reported that the contribution of gasoline vehicles was usually higher than that of diesel vehicles in urban areas [9].
Factor 2 was classified as a secondary nitrate/chloride source, indicating higher contributions of NO3, Cl, and NH4+. Gaseous ammonia, NOx, and Cl2 or Cl salt emitted or transported from various sources formed NH4NO3 and NH4Cl in the atmosphere by photochemical oxidation with gaseous ammonia [16,53]. The average contribution of this source during whole monitoring periods was 6.3 μg/m3 (22%), and this factor was the second highest source influencing PM2.5 pollution in Daejeon city. The contribution of this factor was higher during January because nucleation and condensation of gaseous compounds progressed well for gas-to-particle conversion in low temperature conditions during the winter season (Figure 6). The formation of secondary nitrate by the oxidation of NOx generally progresses well in conditions of low temperature and high humidity [46,47].
Factor 3 was classified as a secondary sulfate source, indicating a higher contribution of SO42− and NH4+. (NH4)2SO4 is formed from gaseous SO2 in the air by combination with gaseous ammonia [22]. The average contribution of secondary sulfate source for whole monitoring periods was 8.6 μg/m3 (30%), which was the most dominant source influencing PM2.5 pollution in Daejeon city. The contribution of secondary sulfate sources was higher during May to June than that during January due to the high humidity and high temperature, which allows for the formation of particulate sulfate (Figure 6). In a previous study, Dockery and Stone (2007) demonstrated that the conversion from SO2 to SO42− was higher during the summer season and daytime than during the winter season and nighttime [9,22].
Factor 4 was classified as an industry source, indicating a higher contribution of elements such as Cr, Mn, Fe, Cu, Ni, and Zn. The average contribution during the whole monitoring period was 1.6 μg/m3 (5.6%). The variation of this factor between January and May to June had no significant pattern during the monitoring period (Figure 6), which coincided with a previous study [54].
Factor 5 was classified as a coal combustion source, indicating a higher contribution of As. In many cases, As, K, and Mn are used as markers for coal combustion sources [13,54]. The average contribution during the whole monitoring period was 1.4 μg/m3 (4.9%), and the temporal contribution of this source was reasonably higher during the winter season (Figure 6).
Factor 6 was classified as a dust/soil source, indicating a higher contribution of Ca2+, Mg2+, Si, Ti, and Fe. Average contributions of dust sources during the whole monitoring period were 4.6 μg/m3 (15.9%), and the contribution during May to June was higher than that during January because of yellow dust events from 7 May to 9 May (3 days) (Figure 6). In the previous study, Si, Ti, Fe, and so on were used as markers for dust sources and the profile showed similar values with a previous study [23].
Factor 7 was classified as a sea salt source, indicating a higher contribution of Na+ and Cl. Sea salt is composed of Na+ and Cl- and is generally produced from the sea surface by bubble bursting of waves. The contribution of Cl was considerably low, probably because of Cl- depletion through the reaction between NaCl and gas-phase HNO3 formed by thermodynamic equilibrium with NH4NO3 [55]. The contribution of sea salt during May to June was higher than during January (Figure 6). Yellow dust events occur in these periods and wind speed is usually high during yellow dust events. High wind speed influenced the activity of bubble bursting; thus, the contribution of sea salt was high during the yellow dust event period.

3.3. Regional Contribution

Figure 7 shows the clusters of 3-day back trajectories using a HYSPLIT model using the openair package (RStudio (v. 4.2.2)). In the openair package, the clusters of back trajectories were calculated by Euclid distance and angle distance. The angle distance matrix indicates the similarity of angles between two different back trajectories from their starting points. In the 3-day back trajectory analysis, most air masses were transported from the northwest direction of the Korean Peninsula, which is the traditional geographical property of the Korean Peninsula (dominated by the prevailing westerlies). Inflow of secondary aerosols with most air masses can be speculated because secondary sulfate, secondary nitrate/chloride occupied 52% of the total contribution in the PMF result (Table 2).
In this study, the PMF model was used to find dominant sources and the CWT model was used to trace hot spots influencing PM2.5 pollution in the central region in Korea. The result produced by this hybrid model was compared with that produced by a CWT single model.
Figure 8 shows the PM2.5 mass concentration by a CWT model using three different approaches. Data used PM2.5 mass concentrations for entire measurement periods (January 2021 and May to June 2021). High PM2.5 mass concentration episodes in the central region in Korea were observed during the yellow dust events, with PM2.5 concentrations higher than 100 μg/m3. The results using a CWT model based on 3-day back trajectory (Figure 8a) showed that air masses from the Yellow Sea, western China and northern China strongly influenced high PM2.5 episodes at the receptor site. Although the Yellow Sea has no anthropogenic emission sources, the Yellow Sea area highly influences PM2.5 pollution in the CWT model, which is actually a limitation of CWT models. In other words, the contributions near the receptor site affected by the air mass (e.g., the Yellow Sea) can be overestimated by the overlapping of several trajectories with different concentration levels when many air mass trajectories pass near the receptor site.
Thus, a modified concentration weight trajectory (MCWT) was used to improve the original CWT model which overestimated specific grids without emission source, e.g., the Yellow Sea. The equation of MCWT is as follows (Equation (3)).
ln ( C ¯ i j ) = 1 k = 1 N τ i j k k = 1 N ln C k τ i j k   , C k 5 ,   ln ( C ¯ i j ) = 0
Figure 8a–c show the result of the original CWT, and MCWT, respectively. In MCWT, ln ( C ¯ i j ) values in Equation (3) for the grids passed less than C k value 5 μg/m3 (background level) were set to zero, even if other trajectories passed over the grids ( C k ≤ 5 →0, Figure 8b). In addition to C k ≤ 5 →0, yellow dust events were eliminated to locate anthropogenic sources continuously influencing PM2.5 pollution at the receptor site because the effect of the yellow dust events was dominant when the concentration of C k was high ( C k ≤ 5 →0, delete dust event, Figure 8c).
The original CWT model result was that anthropogenic emission sources were distributed in the desert areas of northern China and the Yellow Sea area on the southwest side of Korea. Unusually, the contributions of the Yellow Sea area were higher than those in the eastern area of China where many industries are distributed (Figure 8a). Therefore, this result means that the CWT model could not reflect the real status. On the other hand, the results of the MCWT show that anthropogenic emission sources were only distributed in desert areas of northern China and the influence of the Yellow Sea fully decreased, compared with Figure 8a. This result shows that an MCWT model significantly improves the model performance and an MCWT model can be more useful than a CWT model to locate anthropogenic emission sources or areas (Figure 8b). The contributions in Figure 8b still contain yellow dust events which occur at only particular times of the year. It is difficult to find out the net-influence of the anthropogenic emission source or area (grid) owing to yellow dust events. Because the concentration of PM2.5 during the dust period increased to higher than 100 μg/m3 or more, the CWT model weighted concentration reveals a limitation in which there was not a relatively existent contribution from an anthropogenic source. Although the yellow dust event occurs during a short period (a few days), it usually plays a dominant role in PM source apportionment [56,57]. Therefore, Figure 8c shows the result after eliminating yellow dust events; it clearly shows the anthropogenic emission grids influencing PM2.5 pollution in the receptor site. Anthropogenic emission grids were mostly distributed in eastern and southern China, a famous industrial area in China (Shandong, Hebei, Jiangsu, Zhejiang, etc.) [58,59]. Another anthropogenic emission source area is the region adjacent to northeastern China, Russia, and the western region of Japan [60], where there are energy power plants in Goto, Japan [61].
In this study, we suggest that an MCWT model, after eliminating yellow dust events, can significantly improve the ability to locate anthropogenic emission grids in Northeast Asia. In the PMF analysis, secondary sulfate showed the highest contribution to PM2.5 pollution in the Daejeon metropolitan region, followed by secondary nitrate/chloride. This result means that sulfur oxides and nitrogen oxides emitted from large-scale industrial complexes were converted to particles by long-range transportation. Many industrial complexes or parks in east and southern China significantly contributed to PM2.5 pollution in the Daejeon metropolitan region in the MCWT analysis. In addition, the contribution from northeastern China and the border area between China and Russia were also observed in the MCWT analysis; those areas have small-scale industrial complexes.

4. Conclusions

In this study, we tried to estimate the emission sources that affect the fine particle concentration in Daejeon using the hybrid receptor models PMF, CWT, and MCWT. In the PMF results, seven factors were selected for estimation of source profile and contributions (vehicles, secondary nitrate/chloride, secondary sulfate, industry, coal combustion, dust/soil, and sea salt). The secondary sulfate source (factor 3) showed the highest contribution (30%) followed by the secondary nitrate/chloride source (factor 2, 22%), the vehicle source (factor 1, 17%), the dust/soil source (factor 6, 16%), the coal source (factor 5, 5%), the industry source (factor 4, 5%), and the sea salt source (factor 7, 5%). As seasonal contributions, the secondary nitrate/chloride source and coal combustion source showed a high contribution in the January period. Secondary sulfate sources and dust/soil sources showed a high contribution in the May to June period. In this study, CWT based on HYSPLIT overestimated values owing to the overlapping of several trajectories, especially in the Yellow Sea area (Yellow Sea effect). The MCWT model significantly improved the limitation of CWT results by decreasing the Yellow Sea effect. The result showed that the western area of China and Manchuria dominantly affect PM2.5 pollution in the receptor site. Therefore, we suggest that the MCWT model is more useful than the CWT model to estimate the regional influence of the PM2.5 concentration at the receptor site in Korea. In addition, the research approach of this study can be used as a reference tool for studies to improve the limitations of the hybrid receptor model in the future.

Supplementary Materials

The following supporting information can be downloaded at: https://www.mdpi.com/article/10.3390/atmos13111902/s1, Table S1. Analytical conditions of ion chromatography used in this study; Table S2. Gas/temperature conditions of the OCEC Aerosol Analyzer; Table S3. MDL of PM2.5 components.

Author Contributions

Conceptualization, J.-S.H.; Data curation, S.-W.H., H.-J.S. and S.-B.L.; Formal analysis, S.-W.H.; Supervision, J.-S.H.; Writing—original draft, S.-W.H.; Writing—review & editing, S.-W.H. and H.-S.J. All authors have read and agreed to the published version of the manuscript.

Funding

This research was supported by the FRIEND (Fine Particle Research Initiative in East Asia Considering National Differences) Project through the National Research Foundation of Korea (NRF) funded by the Ministry of Science and ICT (2020M3G1A1114999) and Experts Training Graduate Program for Particulate Matter Management from the Ministry of Environment, Korea.

Institutional Review Board Statement

Not applicable.

Informed Consent Statement

Not applicable.

Data Availability Statement

Not applicable.

Acknowledgments

This research was supported by the FRIEND (Fine Particle Research Initiative in East Asia Considering National Differences) Project through the National Research Foundation of Korea (NRF) funded by the Ministry of Science and ICT (2020M3G1A1114999) and Experts Training Graduate Program for Particulate Matter Management from the Ministry of Environment, Korea.

Conflicts of Interest

The authors declare no conflict of interest.

References

  1. Han, J.S.; Moon, K.J.; Kim, Y.J. Identification of potential sources and source regions of fine ambient particles measured at Gosan background site in Korea using advanced hybrid receptor model combined with positive matrix factorization. J. Geophys. Res. 2006, 111, D22217. [Google Scholar] [CrossRef] [Green Version]
  2. Lu, Z.J.; Liu, Q.Y.; Xiong, Y.; Huang, F.; Zhou, J.B. A hybrid source apportionment strategy using positive matrix factorization (PMF) and molecular marker chemical mass balance (MM-CMB) models. Environ. Pollut. 2018, 238, 39–51. [Google Scholar] [CrossRef] [PubMed]
  3. Park, J.E.; Kim, H.W.; Kim, Y.K.; Heo, J.B.; Kim, S.W.; Jeon, K.H.; Yi, S.M.; Hopke, P.K. Source apportionment of PM2.5 in Seoul, South Korea and Beijing, China using dispersion normalized PMF. Sci. Total Environ. 2022, 833, 155056. [Google Scholar] [CrossRef] [PubMed]
  4. Anderson, H.R. Air pollution and mortality: A history. Atmos. Environ. 2009, 43, 142–152. [Google Scholar] [CrossRef]
  5. Miller, K.A.; Siscovick, D.S.; Sheppard, L.; Shepherd, K.; Sullivan, J.H.; Anderson, G.L.; Kaufman, J.D. Long-term exposure to air pollution and incidence of cardiovascular events in women. N. Engl. J. Med. 2007, 356, 447–458. Available online: https://www.nejm.org/doi/full/10.1056/NEJMoa054409 (accessed on 1 October 2022). [CrossRef]
  6. WHO. Ambient (Outdoor) Air Quality and Health. Fact Sheet No 313. Updated March 2014. 2016. Available online: http://www.who.int/mediacentre/factsheets/fs313/en/ (accessed on 7 November 2016).
  7. IARC. IARC: Outdoor Air Pollution a Leading Environmental Cause of Cancer Deaths. 2013. Press Release N° 221. Available online: https://www.iarc.fr/en/media-centre/iarcnews/pdf/pr221_E.pdf (accessed on 17 October 2013).
  8. Brunekreef, B.; Holgate, S. Air pollution and health. Lancet 2002, 360, 1233–1242. Available online: https://dspace.library.uu.nl/bitstream/handle/1874/7410/IVR%203A1%20Brunekreef%20et%20al%20(2002).pdf?sequence=2 (accessed on 1 October 2022). [CrossRef]
  9. Dockery, D.W.; Stone, P.H. Cardiovascular risks from fine particulate air pollution. N. Engl. J. Med. 2007, 356, 511–513. Available online: http://toxicology.usu.edu/endnote/511.pdf (accessed on 1 October 2022). [CrossRef] [Green Version]
  10. Ozkaynak, H.; Spengler, J.D. Analysis of health effect resulting from population exposures to acid precipitation precursors. Environ. Health Perspect. 1985, 63, 45–55. Available online: https://www.ncbi.nlm.nih.gov/pmc/articles/PMC1568498/ (accessed on 1 October 2022). [CrossRef]
  11. WHO. World Health Statistics 2016. Available online: http://www.who.int/gho/publications/world_health_statistics/2016/en/ (accessed on 1 October 2022).
  12. WHO. World Health Statistics 2021: Monitoring Health for the SDGs, Sustainable Development Goals; WHO: Geneva, Switzerland, 2021; ISBN 978-92-4-002705-3. (electronic version); Licence: CC BYNC-SA 3.0 IGO. [Google Scholar]
  13. Park, M.B.; Lee, T.J.; Lee, E.S.; Kim, D.S. Enhancing source identification of hourly PM2.5 data in Seoul based on a dataset segmentation scheme by positive matrix factorization (PMF). Atmos. Pollut. Res. 2019, 10, 1042–1059. [Google Scholar] [CrossRef]
  14. Park, J.M.; Lee, T.J.; Kim, D.S. Improving PMF source reconciliation with cluster analysis for PM2.5 hourly data from Seoul, Korea. Atmos. Pollut. Res. 2022, 13, 101398. [Google Scholar] [CrossRef]
  15. Han, J.S.; Moon, K.J.; Lee, S.J.; Kim, Y.J.; Ryu, S.Y.; Cliff, S.S.; Yi, S.M. Size-resolved source apportionment of ambient particles by positive matrix factorization at Gosan background site in East Asia. Atmos. Chem. Phys. 2006, 6, 211–223. [Google Scholar] [CrossRef] [Green Version]
  16. Belis, C.A.; Karagulian, F.; Larsen, B.R.; Hopke, P.K. Critical review and metaanalysis of ambient particulate matter source apportionment using receptor models in Europe. Atmos. Environ. 2013, 69, 94–108. Available online: https://www.sciencedirect.com/science/article/pii/S1352231012010540 (accessed on 1 October 2022). [CrossRef]
  17. Brown, S.G.; Eberly, S.; Paatero, P.; Norris, G.A. Methods for estimating uncertainty in PMF solutions: Examples with ambient air and water quality data and guidance on reporting PMF results. Sci. Total Environ. 2015, 518–519, 626–635. Available online: https://www.sciencedirect.com/science/article/pii/S004896971500025X (accessed on 1 October 2022). [CrossRef] [PubMed] [Green Version]
  18. Hwang, I.J.; Kim, D.S. Research trends of receptor models in Korea and foreign countries and improvement directions for air quality management. J. Kor. Soc. Atmos. Environ. 2013, 29, 459–476. Available online: http://www.dbpia.co.kr/Journal/PDFViewNew?id=NODE02230877 (accessed on 1 October 2022). [CrossRef] [Green Version]
  19. Reff, A.; Eberly, S.I.; Bhave, P.V. Receptor modeling of ambient particulate matter data using positive matrix factorization: Review of existing methods. J. Air Waste Manag. Assoc. 2007, 57, 146–154. Available online: https://www.tandfonline.com/doi/abs/10.1080/10473289.2007.10465319 (accessed on 1 October 2022). [CrossRef] [Green Version]
  20. Solomon, P.A.; Hopke, P.K.; Froines, J.; Scheffe, R. Key scientific findings and policy- and health-relevant insights from the U.S. EPA’s particulate matter Supersites program and related studies: An integration and synthesis of results. J. Air Waste Manag. Assoc. 2008, 58, S3–S92. Available online: https://search.proquest.com/docview/214375417?pqorigsite=gscholar (accessed on 1 October 2022). [CrossRef]
  21. Thurston, G.D.; Ito, K.; Lall, R. A source apportionment of U.S. fine particulate matter air pollution. Atmos. Environ. 2011, 45, 3924–3936. Available online: https://www.sciencedirect.com/science/article/pii/S1352231011004596 (accessed on 1 October 2022). [CrossRef] [Green Version]
  22. Hwang, J.; Hopke, P.K. Estimation of source apportionment and potential source locations of PM2.5 at a west coastal IMPROVE site. Atmos. Environ. 2007, 41, 506–518. [Google Scholar] [CrossRef]
  23. Hwang, I.H.; Yi, S.M.; Park, J.S. Estimation of Source Apportionment for Filter-based PM2.5 Data using the EPA-PMF Model at Air Pollution Monitoring Supersites. J. Korean Soc. Atmos. Environ. 2020, 36, 620–632. [Google Scholar] [CrossRef]
  24. Hopke, P.K.; Gao, N.; Cheng, M.D. Combining chemical and meteorological data to infer source areas of airborne pollutants. Chemom. Intel. Lab. Syst. 1993, 19, 187–199. [Google Scholar] [CrossRef]
  25. Seibert, P.; Kromp-Kolb, H.; Baltensperger, U.; Jost, D.T.; Schwikowski, M.; Kasper, A.; Puxbaum, H. Trajectory analysis of aerosol measurements at high Alpine sites. In Transport and Transformation of Pollutants in the Troposphere; Borrell, P.M., Ed.; Elsevier: New York, NY, USA, 1994; pp. 689–693. [Google Scholar]
  26. Stohl, A. Trajectory statistics—A new method to establish source receptor relationships of air pollutants and its application to the transport of particulate sulfate in Europe. Atmos. Environ. 1996, 30, 579–587. [Google Scholar] [CrossRef]
  27. Han, Y.J.; Holsen, T.M.; Hopke, P.K.; Cheong, J.P.; Kim, H.; Yi, S.M. Identification of source locations for atmospheric dry composition of heavy metals during yellow-sand events in Seoul, Korea in 1998 using hybrid receptor models. Atmos. Environ. 2004, 38, 5353–5361. [Google Scholar] [CrossRef]
  28. Lupu, A.; Maenhaut, W. Application and comparison of two statistical trajectory techniques for identification of source regions of atmospheric aerosol species. Atmos. Environ. 2002, 36, 5607–5618. [Google Scholar] [CrossRef]
  29. Fan, W.; Qin, K.; Xu, J.; Yuan, L.; Li, D.; Jin, Z.; Zhang, K. Aerosol vertical distribution and sources estimation at a site of the Yangtze River Delta region of China. Atmos. Res. 2019, 217, 128–136. [Google Scholar] [CrossRef] [Green Version]
  30. Dimitriou, K.; Mihalopoulos, N.; Leeson, S.R.; Twigg, M.M. Sources of PM2.5-bound water soluble ions at EMEP’s Auchencorth Moss (UK) supersite revealed by 3D-Concentration Weighted Trajectory (CWT) model. Chemosphere 2021, 274, 129979. [Google Scholar] [CrossRef]
  31. Wang, Y.Q.; Zhang, X.Y.; Arimoto, R. The contribution from distant dust sources to the atmospheric particulate matter loadings at XiAn, China during spring. Sci. Total Environ. 2006, 368, 875–883. [Google Scholar] [CrossRef]
  32. Jeong, U.K.; Kim, J.H.; Lee, H.L.; Jung, J.S.; Kim, Y.J.; Song, C.H.; Koo, J.H. Estimation of the contributions of long range transported aerosol in East Asia to carbonaceous aerosol and PM concentrations in Seoul, Korea using highly time resolved measurements: A PSCF model approach. J. Environ. Monit. 2011, 13, 1905–1918. [Google Scholar] [CrossRef]
  33. Zachary, M.; Yin, L.; Zacharia, M. Application of PSCF and CWT to Identify Potential Sources of Aerosol Optical Depth in ICIPE Mbita. Open Access Libr. J. 2018, 5, e4487. [Google Scholar] [CrossRef]
  34. Do, W.G.; Jung, W.S. Estimation of PM10 source locations in Busan using PSCF model. J. Environ. Sci. Int. 2015, 24, 793–806. [Google Scholar] [CrossRef] [Green Version]
  35. Hsu, Y.K.; Holsen, T.M.; Hopke, P.K. Comparison of hybrid receptor models to locate PCB sources in Chicago. Atmos. Environ. 2003, 37, 545–562. [Google Scholar] [CrossRef]
  36. Carslaw, D. The Openair Manual Open-Source Tools for Analysing Air Pollution Data; University of York and Ricardo Energy & Environment: York, UK, 2019. [Google Scholar]
  37. National Institute of Environmental Research (NIER). 2020 Annual Report of Intensive Air Quality Monitoring Station, NIER-GP2020-208; NIER: Incheon, Korea, 2021. [Google Scholar]
  38. Nuhoglu, Y.; Yazici, M.; Nuhoglu, C.; Kam, E.; Adar, E.; Kuzu, L.; Osmanlioglu, A.E. XRF Analysis of Airborne Heavy Meatals and Distribution of Environment in Sivas City Turkey through Dust Samples. In Proceedings of the EurAsia Waste Management Symposium, Istanbul, Turkey, 26–28 October 2020; pp. 26–28. [Google Scholar]
  39. Rahman, M.S.; Kumar, P.; Ullah, M.; Jolly, Y.N.; Akhter, S.; Karbir, J.; Begum, B.A.; Salam, A. Elemental analysis on surface soil and dust of roadside academic institutions in Dhaka city, Bangladesh and their impact on human health. Environ. Chem. Ecotoxicol. 2021, 3, 197–208. [Google Scholar] [CrossRef]
  40. National Institute of Environmental Research (NIER). An Estimate of Internal and External Sources Contributing to Ambient Particulate Matter and a Guideline on the Application of Air Quality Receptor Models (II), NIER-SP2016-422; NIER: Incheon, Korea, 2017. [Google Scholar]
  41. Lee, S.Y.; Hong, J.M.; Cho, Y.S.; Choi, M.J.; Kim, J.H.; Park, S.S.; Ahn, J.Y.; Kim, S.K.; Moon, K.J.; Eck, T.F.; et al. Characteristics of Classified Aerosol Types in South Korea during the MAPS-Seoul Campaign. Aerosol Air Qual. Res. 2018, 18, 2195–2206. [Google Scholar] [CrossRef] [Green Version]
  42. Filonchyk, M.; Peterson, M. Development, progression, and impact on urban air quality of the dust storm in Asia in March 15-18, 2021. Urban Clim. 2022, 41, 101080. [Google Scholar] [CrossRef]
  43. Liu, Q.; Liu, Y.; Yin, J.; Zhang, M.; Zhang, T. Chemical characteristics and source apportionment of PM10 during Asian dust storm and non-dust storm days in Beijing. Atmos. Environ. 2014, 91, 85–94. [Google Scholar] [CrossRef]
  44. Tan, S.C.; Shi, G.Y.; Wang, H. Long-range transports of spring dust storm in Inner Mongolia and impact on the China seas. Atmos. Environ. 2012, 46, 299–308. [Google Scholar] [CrossRef]
  45. Guo, S.; Hu, M.; Wang, Z.B.; Slanina, J.; Zhao, Y.L. Size-resolved aerosol water-soluble ionic compositions in the summer of Beijing: Implication of regional secondary formation. Atmos. Chem. Phys. 2010, 10, 947–959. [Google Scholar] [CrossRef] [Green Version]
  46. Seinfeld, J.H.; Pandis, S.N. Atmospheric Chemistry and Physics: From Air Pollution to Climate Change, 3rd ed.; John Wiley and Sons: New York, NY, USA, 2016; Volume 40, p. 26. [Google Scholar]
  47. Wang, Y.; Zhuang, G.; Zhang, X.; Huang, K.; Xu, C.; Tang, A.; Chen, J.; An, Z. The ion chemistry, seasonal cycle, and sources of PM2.5 and TSP aerosol in Shanghai. Atmos. Environ. 2006, 40, 2935–2952. [Google Scholar] [CrossRef]
  48. Busra, M.; Karsi, B.; Berberler, E.; Berberler, T.; Aslan, O.; Wenisoy-Karakas, S.; Karakas, D. Correction and source apportionment of vehicle enission factors obtained from Bolu Mountain Highway Tunnel, Turkey. Atmos. Pollut. Res. 2020, 11, 2133–2141. [Google Scholar]
  49. Hao, Y.; Gao, C.; Deng, S.; Yuan, M.; Song, W.; Lu, Z.; Qiu, Z. Chemical characterization of PM2.5 emitted from motor vehicles powered by diesel, gasoline, natural gas, and methanol fuel. Sci. Total Environ. 2019, 674, 128–139. [Google Scholar] [CrossRef]
  50. Coufalík, P.; Matoušek, T.; Křůmal, K.; Vojtíšek-Lom, M.; Beránek, V.; Mikuška, P. Content of metals in emissions from gasoline, diesel, and alternative mixed biofuels. Environ. Sci. Pollut. Res. 2019, 26, 29012–29019. [Google Scholar] [CrossRef]
  51. Cheung, K.L.; Ntziachristos, L.; Tzamkiozis, T.; Schauer, J.J.; Samaras, Z.; Moore, K.F.; Sioutas, C. Emissions of particulate trace elements, metals and organic species from gasoline, diesel, and biodiesel passenger vehicles and their relation to oxidative potential. Aerosol. Sci. Technol. 2010, 44, 500–513. [Google Scholar] [CrossRef]
  52. Taghvaee, S.; Sowlat, M.H.; Mousavi, A.; Hassanvand, M.S.; Yuesian, M.; Naddafi, K.; Sioutas, C. Source apportionment of ambient PM2.5 in two locations in central Tehran using the Positive Matrix Factorization (PMF) model. Sci. Total Environ. 2018, 628–629, 672–686. [Google Scholar] [CrossRef] [PubMed]
  53. Chun, M.Y.; Lee, Y.J.; Kim, H.K. Concentration of NH4NO3 in TSP in Seoul Ambient Air. J. Korean Soc. Atmos. Environ. 1994, 10, 130–136. [Google Scholar]
  54. Son, S.E.; Park, S.S.; Bae, M.A.; Kim, S.T. A study on characteristics of high pollution observed around large scale stationary sources in Chungcheongnam-do province. J. Korean Soc. Atmos. Environ. 2020, 36, 669–687. [Google Scholar] [CrossRef]
  55. Jr, S.J.G.; Weis, J.; China, S.; Evangelista, H.; Harber, T.H.; Muller, S.; Sampaio, M.; Laskin, A.; Gilles, M.K.; Godoi, R.H.M. Photochemical reactions on aerosols at West Antarctica: A molecular case-study of nitrate formation among sea salt aerosols. Sci. Total Environ. 2021, 758, 143586. [Google Scholar]
  56. Kim, K.H.; Kim, M.Y. The effects of asian dust on particulate matter fractionation in Seoul, Korea during spring 2001. Chemosphere 2003, 51, 707–721. [Google Scholar] [CrossRef]
  57. Lee, B.K.; Jun, N.Y.; Lee, H.K. Comparison of particulate matter characteristics before, during, and after Asian dust events in Incheon and Ulsan. Korea Atmos. Environ. 2004, 38, 1535–1545. [Google Scholar] [CrossRef]
  58. Zhao, Y.F.; Shi, X.Z.; Huang, B.; Yu, D.S.; Wang, H.J.; Sun, W.X.; Oboern, I.; Blomback, K. Spatial distribution of heavy metals in agricultural soils of an industry-based peri-urban area in Wuxi, China. Pedosphere 2007, 17, 44–51. [Google Scholar] [CrossRef]
  59. Li, Y.; Lin, T.; Hu, L.; Feng, J.; Guo, Z. Time trends of polybrominated diphenyl ethers in east China seas: Response to the booming of PBDE pollution industry in China. Environ. Int. 2016, 92–93, 507–514. [Google Scholar] [CrossRef]
  60. Cho, J.W. The current situation and prospect of economic cooperation between far eastern Russia and three provinces of northeastern China. Russ. Stud. 2013, 23, 343–373. [Google Scholar]
  61. Patxi, G.N.; Yusaku, K. Tidal stream energy as a potential continuous power producer: A case study for west Japan. Energy Convers. Manag. 2021, 245, 114533. [Google Scholar]
Figure 1. Location of the measurement site and surroundings.
Atmosphere 13 01902 g001
Figure 2. PM2.5 chemical speciation during the measurement periods.
Atmosphere 13 01902 g002
Figure 3. Factor profiles in Daejeon.
Atmosphere 13 01902 g003
Figure 4. Factor contributions in Daejeon.
Atmosphere 13 01902 g004
Figure 5. Scatter plot for observed and predicted PM2.5 mass concentrations.
Atmosphere 13 01902 g005
Figure 6. Average seasonal source contribution at the Central Air Environment Research Center of NIER.
Atmosphere 13 01902 g006
Figure 7. PM2.5 concentration with air masses based on HYSPLIT back trajectory model.
Atmosphere 13 01902 g007
Figure 8. PM2.5 mass concentrations using a CWT model. (a) Original CWT; (b) Ck ≤ 5, MCWT; and (c) Ck ≤ 5, delete of yellow dust event, MCWT.
Atmosphere 13 01902 g008
Table 2. Source contribution for seven sources during the whole measurement periods.
SourceContributionPie Chart
Secondary sulfate30%Atmosphere 13 01902 i001
Secondary nitrate/chloride22%
Coal combustion5%
Vehicle17%
Dust16%
Sea salt5%
Industry5%
Publisher’s Note: MDPI stays neutral with regard to jurisdictional claims in published maps and institutional affiliations.

