Article

Joint Contribution of Preceding Pacific SST and Yunnan-Guizhou Plateau Soil Moisture to September Precipitation over the Middle Reaches of the Yellow River

1
State Key Laboratory of Severe Weather, Institute of Tibetan Plateau Meteorology, Chinese Academy of Meteorological Sciences, Beijing 100081, China
2
Hydrological Bureau of Yellow River Conservancy Commission, Ministry of Water Resources of the People’s Republic of China, Zhengzhou 450004, China
3
Collaborative Innovation Centre on Forecast and Evaluation of Meteorological Disasters, Nanjing University of Information Science and Technology, Nanjing 210044, China
*
Author to whom correspondence should be addressed.
Atmosphere 2022, 13(10), 1737; https://doi.org/10.3390/atmos13101737
Submission received: 4 October 2022 / Revised: 17 October 2022 / Accepted: 17 October 2022 / Published: 21 October 2022
(This article belongs to the Special Issue Long-Term Variability of Atmospheric Precipitation)

Abstract

:
The middle reaches of the Yellow River (MRYR) are an important base for agricultural and husbandry production and coal and coal-based power and chemical industries. Understanding the variability of autumn (especially September) precipitation over the MRYR region and the associated atmospheric circulation anomalies and precursory signals is of great importance for the prevention and mitigation of meteorological disasters during autumn rainy season. This study primarily explored precursory signals for September precipitation over the MRYR from the perspectives of sea surface temperature (SST) and soil moisture (SM) anomalies. The results reveal that the northward-shifted East Asian westerly jet (EAWJ) and the strengthened and westward-extended western Pacific subtropical high (WPSH) are responsible for more precipitation over the MRYR region. Further analyses show that the September MRYR precipitation is significantly related to the preceding July–August southern Pacific SST pattern (SPSP) and Yunnan-Guizhou Plateau (YGP) SM. The preceding SPSP anomaly, which reflects the La Niña/El Niño-like SST anomalies, can be maintained until September and plays an important role in modulating the September MRYR precipitation. Moreover, the above SST anomalies may adjust the SM anomalies in the YGP during July–August. The SM anomalies in The YGP persist from July–August to September and eventually affect the MRYR precipitation through exciting an anomalous vertical motion during September. The effect of the preceding SPSP anomaly on the September MRYR precipitation decreases when the SM effect is absent, which suggests that the YGP SM anomalies act as a bridge linking the preceding Pacific SST anomalies and the ensuing September MRYR precipitation. This study discloses the joint contribution of the preceding Pacific SST and YGP SM anomalies to the September MRYR precipitation and may shed new light on the short-term prediction of autumn precipitation over the MRYR.

1. Introduction

The middle reaches of the Yellow River (MRYR) are located in northern China (see bold black borderline in Figure 1a), which stretch across six provinces/autonomous regions, including Inner Mongolia, Ningxia, Gansu, Shaanxi, Shanxi, and Henan. The drainage area of the MRYR is approximately 363,000 km2, accounting for 45.7% of the total drainage area of the Yellow River [1]. The MRYR region is an important base for agricultural and husbandry production and coal and coal-based power and chemical industries in China. The MRYR region features a continental monsoon climate, with less (more) precipitation during boreal winter and spring (summer and autumn). Precipitation during the flood season (June–September) accounts for approximately 70% of total annual precipitation over the MRYR [2]. Although more precipitation appears over the MRYR in summer, precipitation from September to October (generally called the autumn rainy season) is considerable and nonnegligible [3]. Particularly, September precipitation generally accounts for 15–20% of the total annual precipitation in the south of the MRYR region [4]. Additionally, autumn (especially September) is the critical period for the harvesting and planting of crops and for reservoir impoundment over the MRYR. In the recent two decades, precipitation over the MRYR has increased [5,6], which is primarily due to the increase in autumn precipitation [7]. More frequent autumn precipitation over the MRYR region has caused severe floods and related disasters. For instance, six floods occurred in the Weihe River, the largest tributary of the Yellow River, in the autumn of 2003, causing a direct loss of 2.3 billion RMB [8]. Continuous heavy precipitation occurred in the MRYR and resulted in a large-area reduction of the crop production in the early and middle of September 2011, with a direct economic loss of more than 8 billion RMB [9]. In the autumn of 2021, the strongest autumn flood since 1949 occurred in the MRYR region and led to disastrous results for national security and people’s lives and property [10]. Clearly, understanding the variability of autumn (especially September) precipitation over the MRYR region and its precursory signals and unraveling potential mechanisms can help enhance the ability of precipitation prediction over this region, which is of great significance for regional water supply security, food security, energy security, and ecological security.
Sea surface temperature anomalies (SSTAs) in several oceans are the crucial factors affecting the variability of summer precipitation over the Yellow River valley, which also provide the sources of the predictability, since SSTAs have long persistence/memory. Yasuda et al. [11] found that the summer precipitation over the Loess Plateau, around the Yellow River, is significantly and negatively correlated with SSTAs in the east Pacific Ocean. Similarly, Yuan et al. [12] revealed that the higher SSTA in the equatorial Pacific, which reflects El Niño, corresponds to less summer precipitation in the source region of the Yellow River. Additionally, the preceding El Niño South Oscillation (ENSO) has a lagged impact on summer precipitation over the source region of the Yellow River and therefore can be used as a precursory signal [12,13]. The warm phase of the North Atlantic SST can cause less precipitation or more frequent droughts in the semi-arid subarea in the upper reaches of the Yellow River [14]. Summer precipitation over the source region of the Yellow River negatively correlates with the SSTAs in the Atlantic and South Indian Oceans during the preceding months [12]. Previous studies have primarily focused on the effect of the SSTAs in different oceans on summer precipitation over the Yellow River valley, but rare studies have been conducted on the reason and prediction of autumn precipitation there. Chang et al. [15] reported that the synergistic effect of the summer Indian Ocean Dipole (IOD) and ENSO on the autumn precipitation over the Yellow River basin is crucial and can be considered the precursory signals to predict the latter. Nevertheless, the effects and relevant mechanisms of the preceding SST signals on autumn (especially September) precipitation over the MRYR region remain an open question.
Many studies have revealed that the forcing of SSTAs can only partly explain the variability of precipitation in some regions and that the land conditions and associated land–air interaction also play a nonnegligible role. Soil moisture (SM) anomalies can persist from several weeks to several months [16] and therefore can be regarded as an important signal source of climate predictability in some regions [17,18]. For example, the spring SM in the TP has a cross-seasonal impact on the summer precipitation in South Asia by adjusting the thermal profile of the TP [19]. The snow cover and SM anomalies in the Iran Plateau and Turan Plain can persist from April to June and affect the June precipitation in the middle and lower reaches of the Yangtze River through triggering the eastward propagating Rossby wave [20]. The SM anomaly in South China, which persists from July to August, can stimulate the vertical circulation anomaly and the associated precipitation anomaly over the Huang-Huai River Basin in August [21].
In addition to the direct impact, persistent SM anomalies may play a role in bridging the preceding SSTAs and atmospheric circulation and associated climate anomalies during the ensuing months. The land–atmosphere feedback, which is connected with SM, can enhance the ocean-forced precipitation over the African Sahel [22]. The winter and spring SSTAs in the tropical central-eastern Pacific can affect the summer Asian-Pacific Oscillation and relevant climate anomalies through adjusting spring precipitation and SM in the Tibetan Plateau [23]. The spring SSTAs in the high-latitude North Atlantic may remotely modulate SM in the Indian subcontinent and then affect the summer air temperature in the TP through a persistent SM-precipitation interaction [24]. Similarly, the spring SSTAs in the Indian Ocean may modulate summer precipitation over the Tibetan Plateau through a SM-related relay effect in the Turan Plateau [25]. Due to the delivery of SM signals, the influence of El Niño events on precipitation anomalies over central Asia can be extended to summer [26].
Given that previous studies on the reasons and prediction of autumn precipitation over the MRYR region are relatively few and that these studies generally focused on the effect of the SSTA forcing, the present study attempted to explore the variability of the autumn MRYR precipitation and its precursory signals from a new perspective (i.e., the direct and indirect contributions of SM). Specifically, this study aimed to clarify whether the autumn precipitation over the MRYR can be affected by SM anomalies in some specific regions during the preceding months and whether the SM signals are related to the SSTAs in some oceanic areas and to convey the influence of the SSTAs. Obviously, investigating the SM signal should be favorable for the prediction of the autumn MRYR precipitation and can be considered an important supplement to traditional studies on SST signals.
The remainder of this paper is organized as follows. In Section 2, the data and methods are described. In Section 3, we explore the variability of the September precipitation over the MRYR region and associated atmospheric circulation anomalies. The respective and joint effects of preceding SM and SST signals on the September MRYR precipitation are also investigated in Section 3. Section 4 analyzes the innovation of this research. Finally, the conclusions are given in Section 5.

2. Data and Methods

This study used monthly observational precipitation from 66 stations (red dots in Figure 1a) in the MRYR region (black bold borderline in Figure 1a) from 1979 to 2021, which was obtained from the Information Center of the Ministry of Water Resources, China. The monthly mean Climate Prediction Center (CPC) Merged Analysis of Precipitation (CMAP) on 2.5 × 2.5° grids [27] was also used. In this study, we focus on September MRYR precipitation since there is much more precipitation in September (76.1 mm for the September climatological mean) than in the other two months (38.1 mm and 13.4 mm for the October and November climatological mean, respectively) of autumn. Moreover, September is a crucial period for the harvesting and planting of crops and for reservoir impoundment. Here, the 66-station mean precipitation over the MRYR region was defined as the observational MRYR precipitation index. The timeseries of the September observational MRYR precipitation index is significantly correlated with that of the CMAP-based one during the period 1979–2021, with a correlation coefficient of 0.93, significant at the 99.9% confidence level (Figure 1b). This high correlation indicates that the CMAP dataset is in excellent agreement with the observation and can be applied in analyzing the distribution of precipitation associated with impact factors.
The study also used monthly mean pressure-level geopotential height, U- and V-wind, and vertical velocity (omega), which were provided by the National Centers for Environmental Prediction (NCEP)–National Center for Atmospheric Research (NCAR) reanalysis dataset [28]. The NCEP–NCAR reanalysis has a horizontal resolution of 2.5 × 2.5°. The monthly mean SSTs on 1.0 × 1.0° grids were obtained from the Met Office Hadley Centre Sea Ice and SST dataset (HadISST version 1.1) [29]. The monthly mean volume of water (i.e., soil moisture) between 0 and 7 cm below ground level on 0.1° × 0.1° grids was obtained from the ERA5 reanalysis [30]. To be consistent with the precipitation data, the abovementioned atmospheric circulation and SST data were extracted for the period from 1981 to 2019.
A linear fitting method was applied to show the independent effect of one factor after removing the variation of the other factor [31,32]. The relative influences of the SM and SST signals on September precipitation over the MRYR region can be distinguished from each other using this method. The details of this method have been presented in the literature by Wang et al. [24]. To avoid the potential interference of interdecadal variability, we also extracted the interannual components (i.e., 9 year and longer time variability has been removed) from the raw variability of September precipitation over the MRYR region and related factors through using a harmonic analysis [33,34]. Correlation and regression were also used in this study. Unless otherwise stated, the statistical significance was evaluated using the Student’s t-test. We used multiple linear regression to construct a statistical prediction/fitting model of the September precipitation over the MRYR region.

3. Results

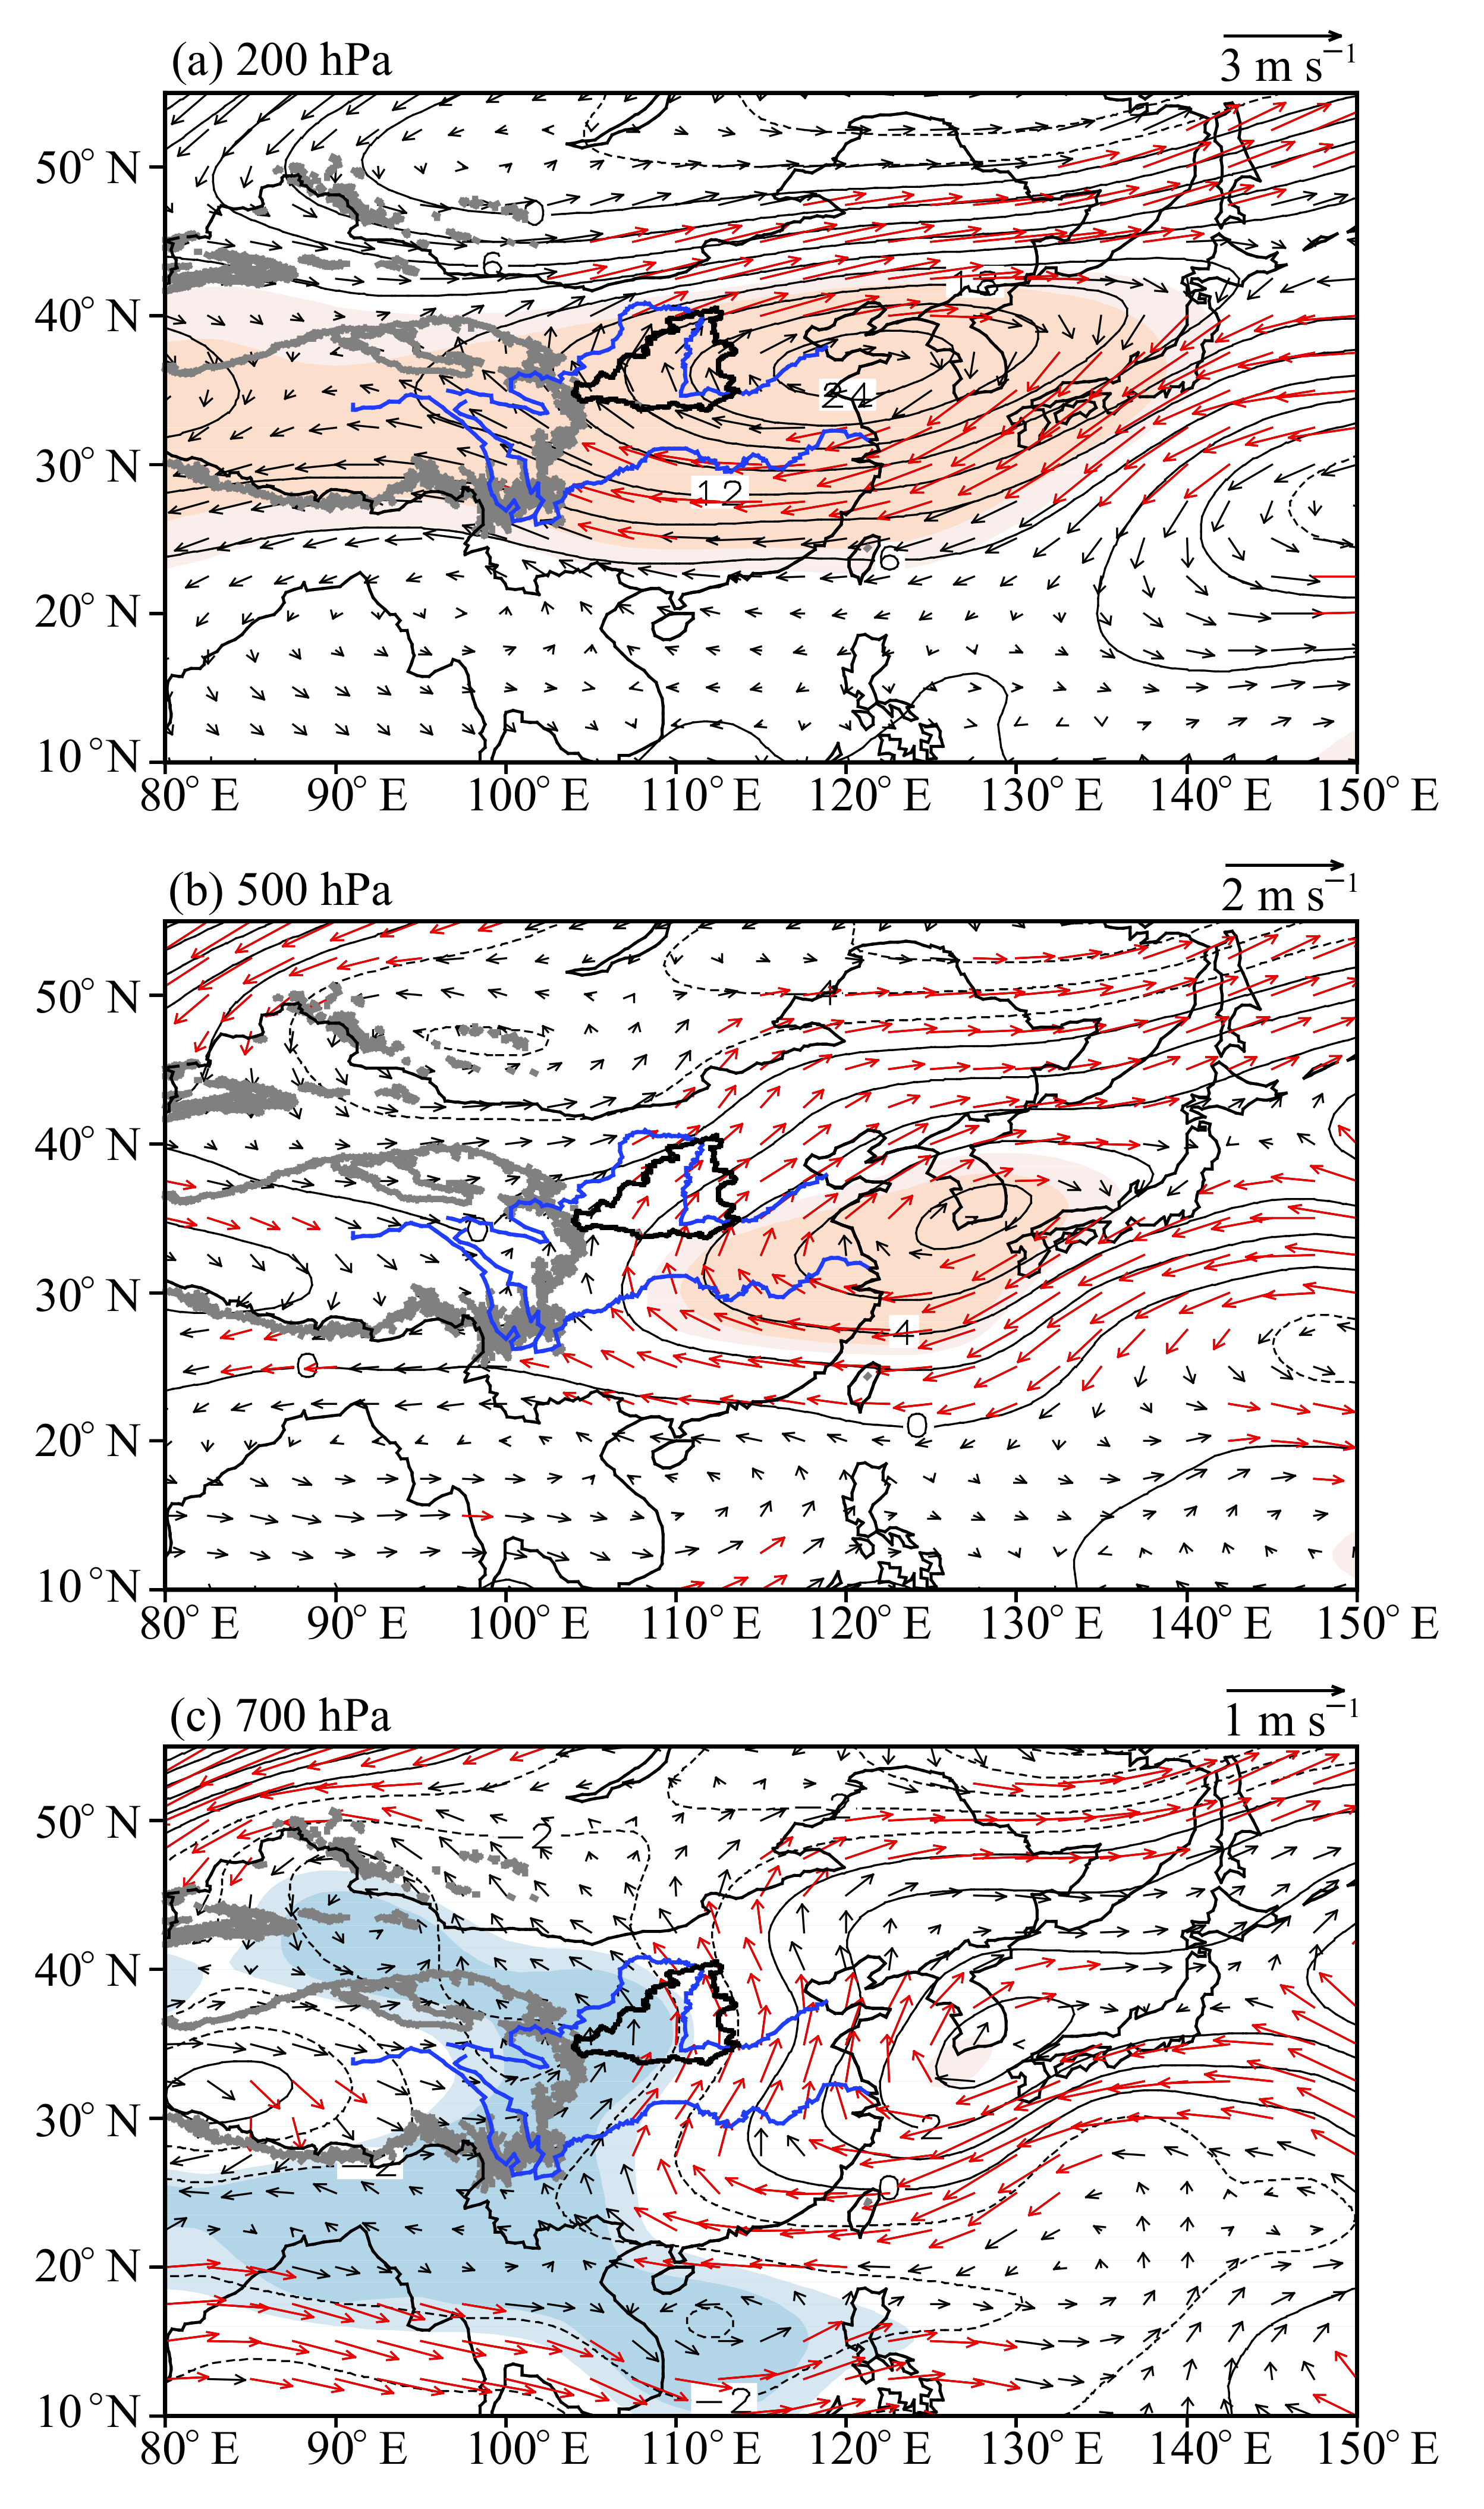
3.1. Atmospheric Circulation Anomalies Associated with the Variability of the September MRYR Precipitation

Before exploring the effects of the SM and SST signals, we first present the atmospheric circulation anomalies responsible for the variability of September precipitation over the MRYR region. Figure 2a shows the September 200 hPa geopotential height and wind anomalies regressed upon the simultaneous observational MRYR precipitation index. A significantly positive geopotential height anomaly appears from the east of the Tibetan Plateau to the Japan Sea, with a center around the Shandong Peninsula. Corresponding to this geopotential height anomaly, an anomalous anticyclone appears in situ, with anomalous westerlies to the north of 40° N and anomalous easterlies around 30° N (Figure 2a). The climatological East Asian westerly jet (EAWJ) is located at 40° N (figure omitted). As such, anomalous westerlies to the north of 40° N and anomalous easterlies around 30° N reflect a northward shift of the EAWJ, which is conducive to the northward shift of rain belts from the Yangtze River to the MRYR.
At the 500 and 700 hPa levels, a significantly positive geopotential height anomaly and an associated anomalous anticyclone appear from eastern China to the south of Japan (Figure 2c), reflecting the strengthened and westward-extended western Pacific subtropical high (WPSH). Along the western flank of the WPSH, the anomalous lower tropospheric southerlies appear (Figure 2), which can induce warm and wet air from the western North Pacific to the MRYR region and therefore result in more precipitation there
In summary, the northward-shifted EAWJ in the upper troposphere and the strengthened and westward-extended WPSH in the middle and lower troposphere jointly contribute to more precipitation over the MRYR region during September, and vice versa.

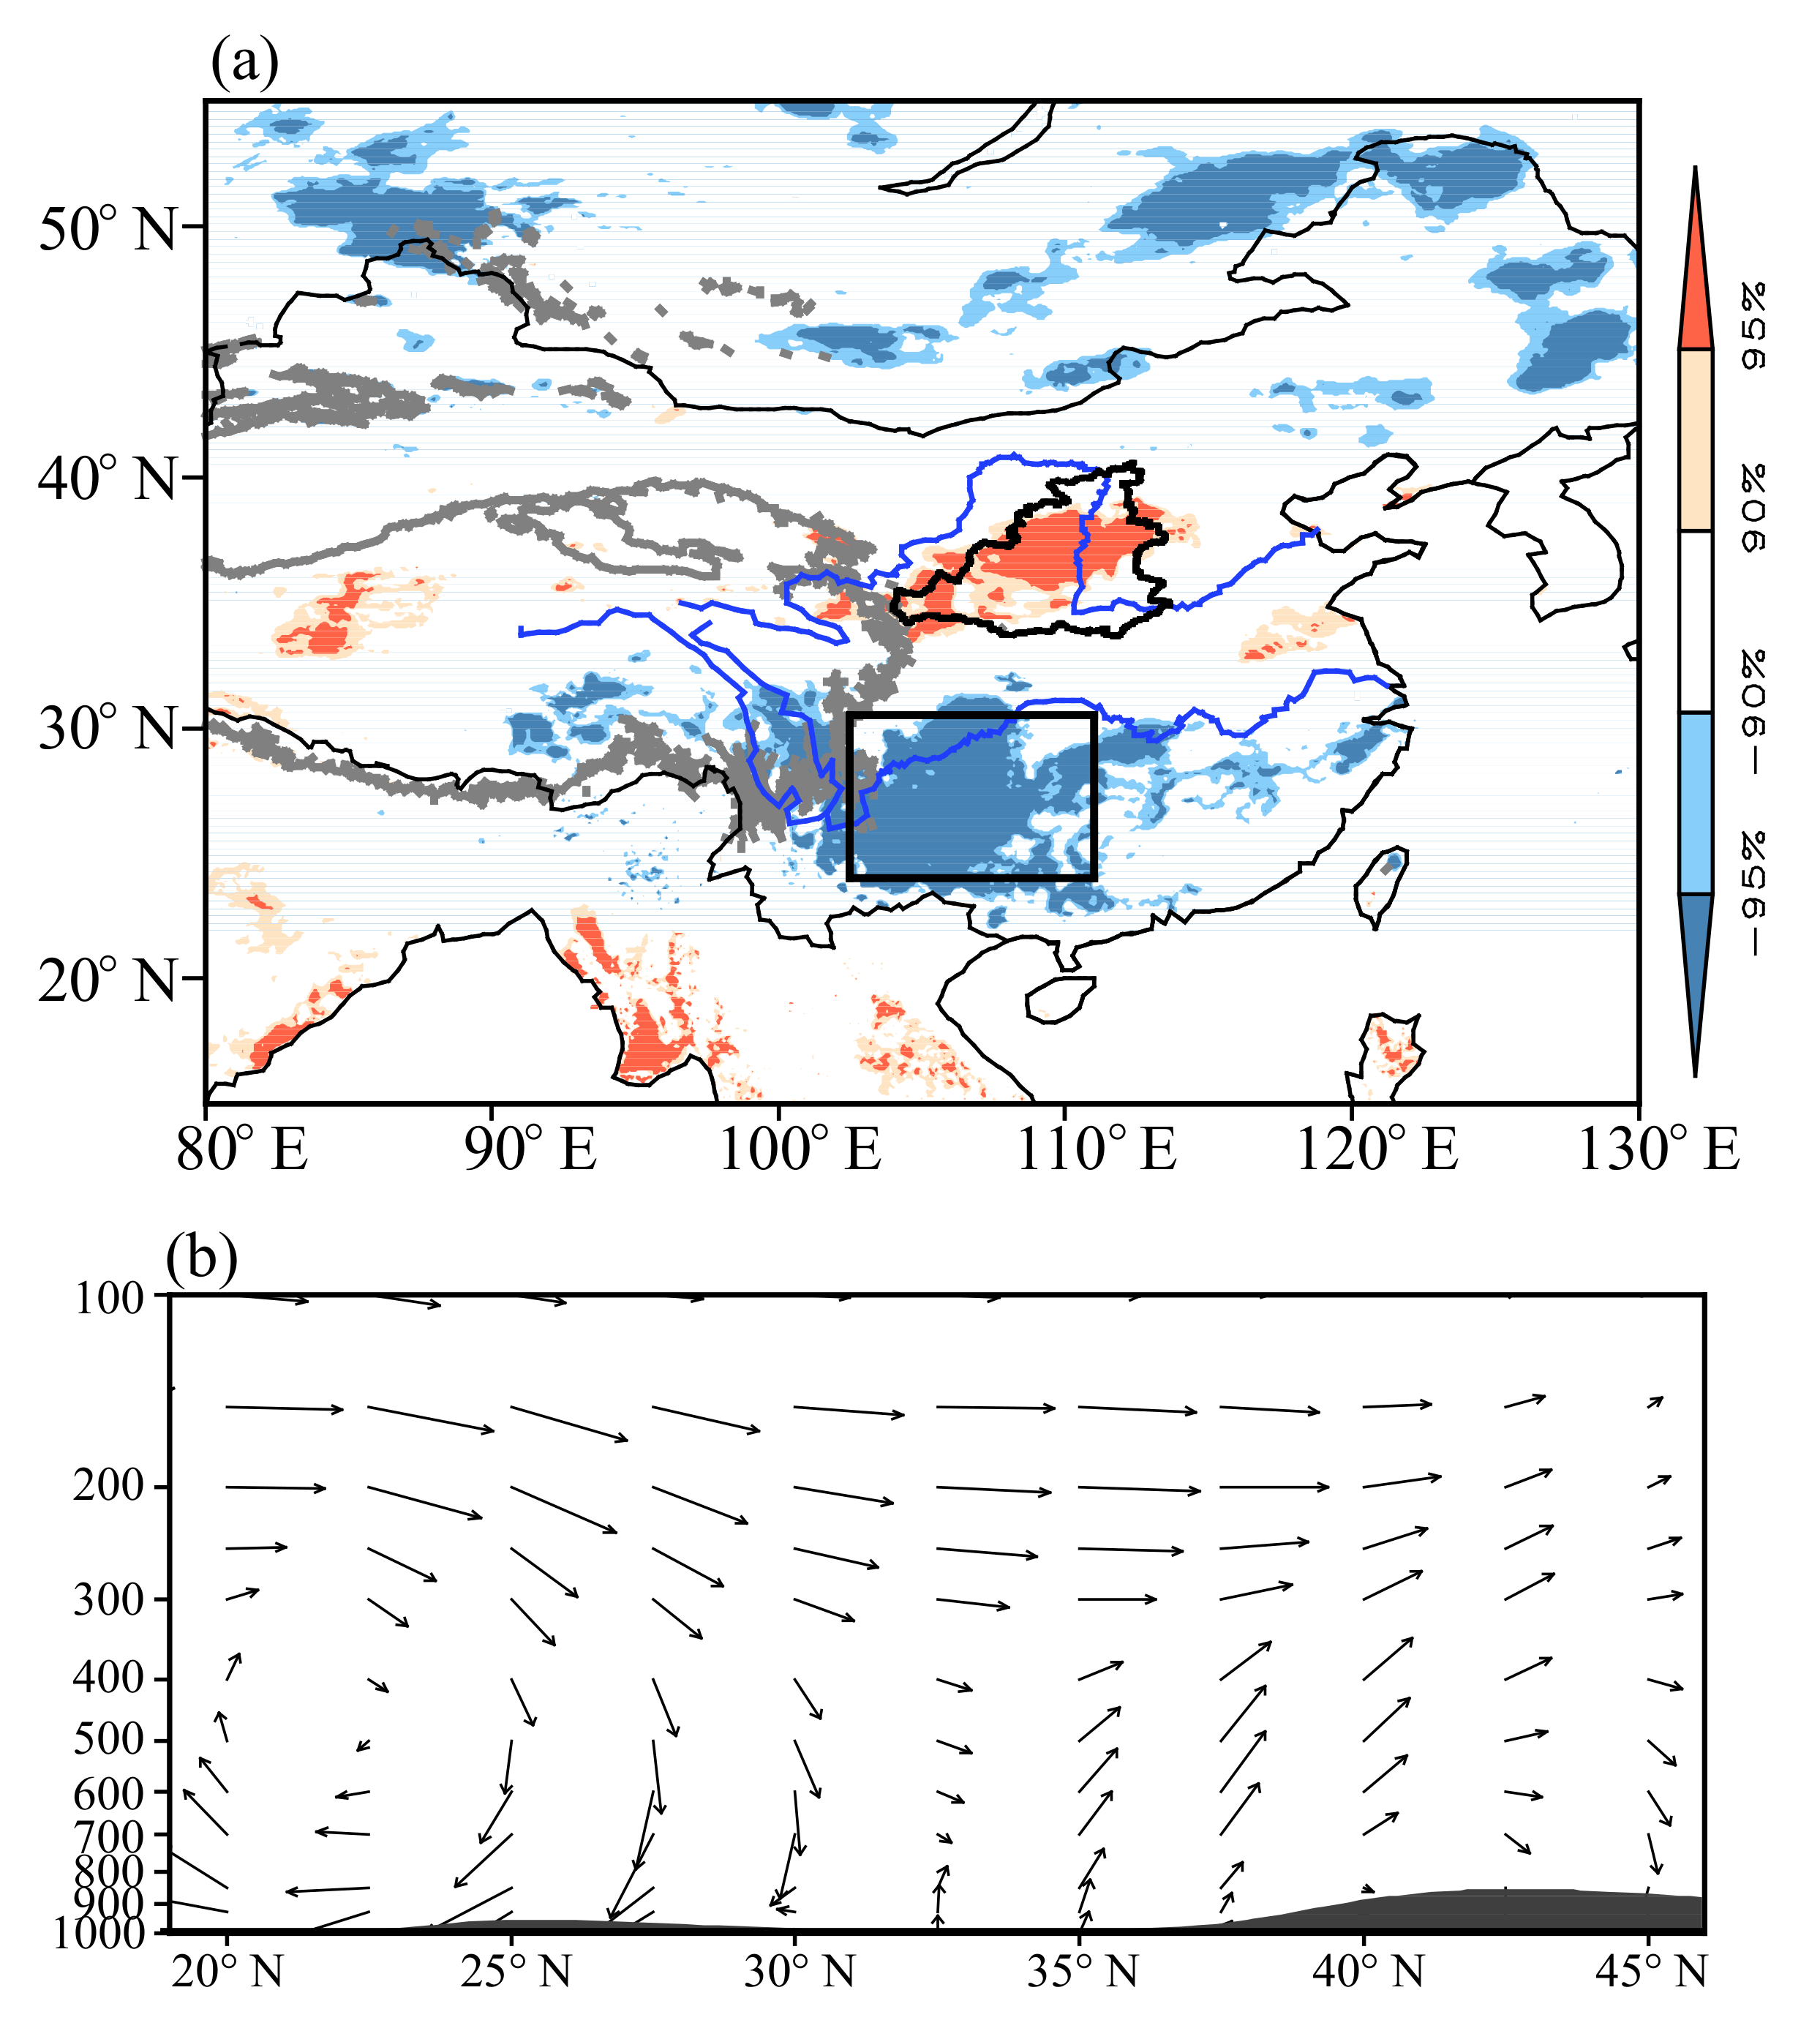
3.2. The Effect of Preceding SM Anomalies

Figure 3a presents the correlation between the September observational MRYR precipitation index and SM during preceding July–August. Significantly negative correlations appear around the Yunnan–Guizhou Plateau (YGP), to the northeast of the Tibetan Plateau (Figure 3a). After removing the interdecadal variability of the MRYR precipitation index and SM field through a harmonic analysis, the significantly negative correlations can also be detected over the YGP region (Figure 3b), which implies that the relationship between the preceding YGP SM and the September MRYR precipitation also exists on interannual timescales.
Based on the area of significant correlation in Figure 3, the SM was regionally averaged in the YGP region (23–29° N, 101.5–111° E) to reflect the variability of the YGP SM. For ease of understanding, the YGP SM index was defined as the above regional mean SM multiplied by −1. As such, a higher (lower) YGP SM index, which reflects lower (higher) SM in the YGP region during July–August, corresponds to more (less) precipitation over the MRYR region in September. This relationship can also be confirmed by the correlation between the July–August YGP SM index and the ensuing September precipitation, in which significantly positive correlations appear over the MRYR region for both the raw (Figure 4a) and interannual timescales (Figure 4b). Moreover, the raw September MRYR precipitation index is closely related to the raw July–August YGP SM index during the period 1979–2021, with a correlation coefficient of 0.49, significant at the 99.9% confidence level (Figure 4c). On interannual timescales, the correlation coefficient between the above two indices is 0.45, still exceeding the 99% confidence level (Figure 4d).
The abovementioned results indicate a close relationship between the September MRYR precipitation and the YGP SM during the preceding July–August. Further analysis shows that the relationship between the MRYR precipitation and the YGP SM during the earlier months rapidly decreases. Specifically, the correlation coefficient is 0.35 for the June–July YGP SM and only 0.08 for the May–June YGP SM. This reveals that the strong YGP SM signal can only be traced to the preceding July–August.
Figure 5 shows the September geopotential height and wind anomalies regressed upon the preceding July–August YGP SM index at different levels, which grossly resembles Figure 2. Corresponding to a higher July–August YGP SM index (i.e., dryer soil in the YGP), the northward-shifted EAWJ in the upper troposphere (Figure 5a) and the strengthened and westward-extended WPSH in the middle and lower troposphere (Figure 5b) occur during September. Although the lower-tropospheric positive geopotential height anomaly from eastern China and the south of Japan (Figure 5c) is relatively weaker than that in Figure 2c, it can still induce warm and wet air from the western North Pacific to the MRYR region (Figure 5c) and thus cause more precipitation there. The aforementioned results imply that the preceding July–August YGP SM may affect the September precipitation over the MRYR region through modulating the EAWJ and WPSH during September.
The lagged influence of the preceding July–August YGP SM on the atmospheric circulation anomalies during September can be attributed to the persistence of the SM anomalies. The correlation between the July–August YGP SM index and September SMs displays a significantly negative correlation in the YGP (Figure 6a). This result implies that the SM anomalies in the YGP can persist from July–August to the ensuing September. The lower (higher) SM can decrease (enhance) the convective available potential energy and accordingly suppresses (facilitate) local convection ascent [35,36,37]. This can also be detected in Figure 6b, which presents the September vertical circulation anomalies regressed upon the simultaneous YGP SM index on a meridional–vertical cross section along 110° E. Corresponding to lower SM, anomalous sinking air flow appears over the YGP (around 25° N) due to the decrease in the convective available potential energy (Figure 6b). The sinking air flow diverges and forms anomalous southerlies and northerlies in the middle and lower troposphere (Figure 6b). The anomalous southerlies, which can also be identified as the southerlies along the western flank of the WPSH in Figure 5, guide warm and wet air from the western North Pacific to the MRYR region. Additionally, the anomalous southerly flow turns to ascend around 35° N (Figure 6b), facilitating more precipitation over the MRYR region.

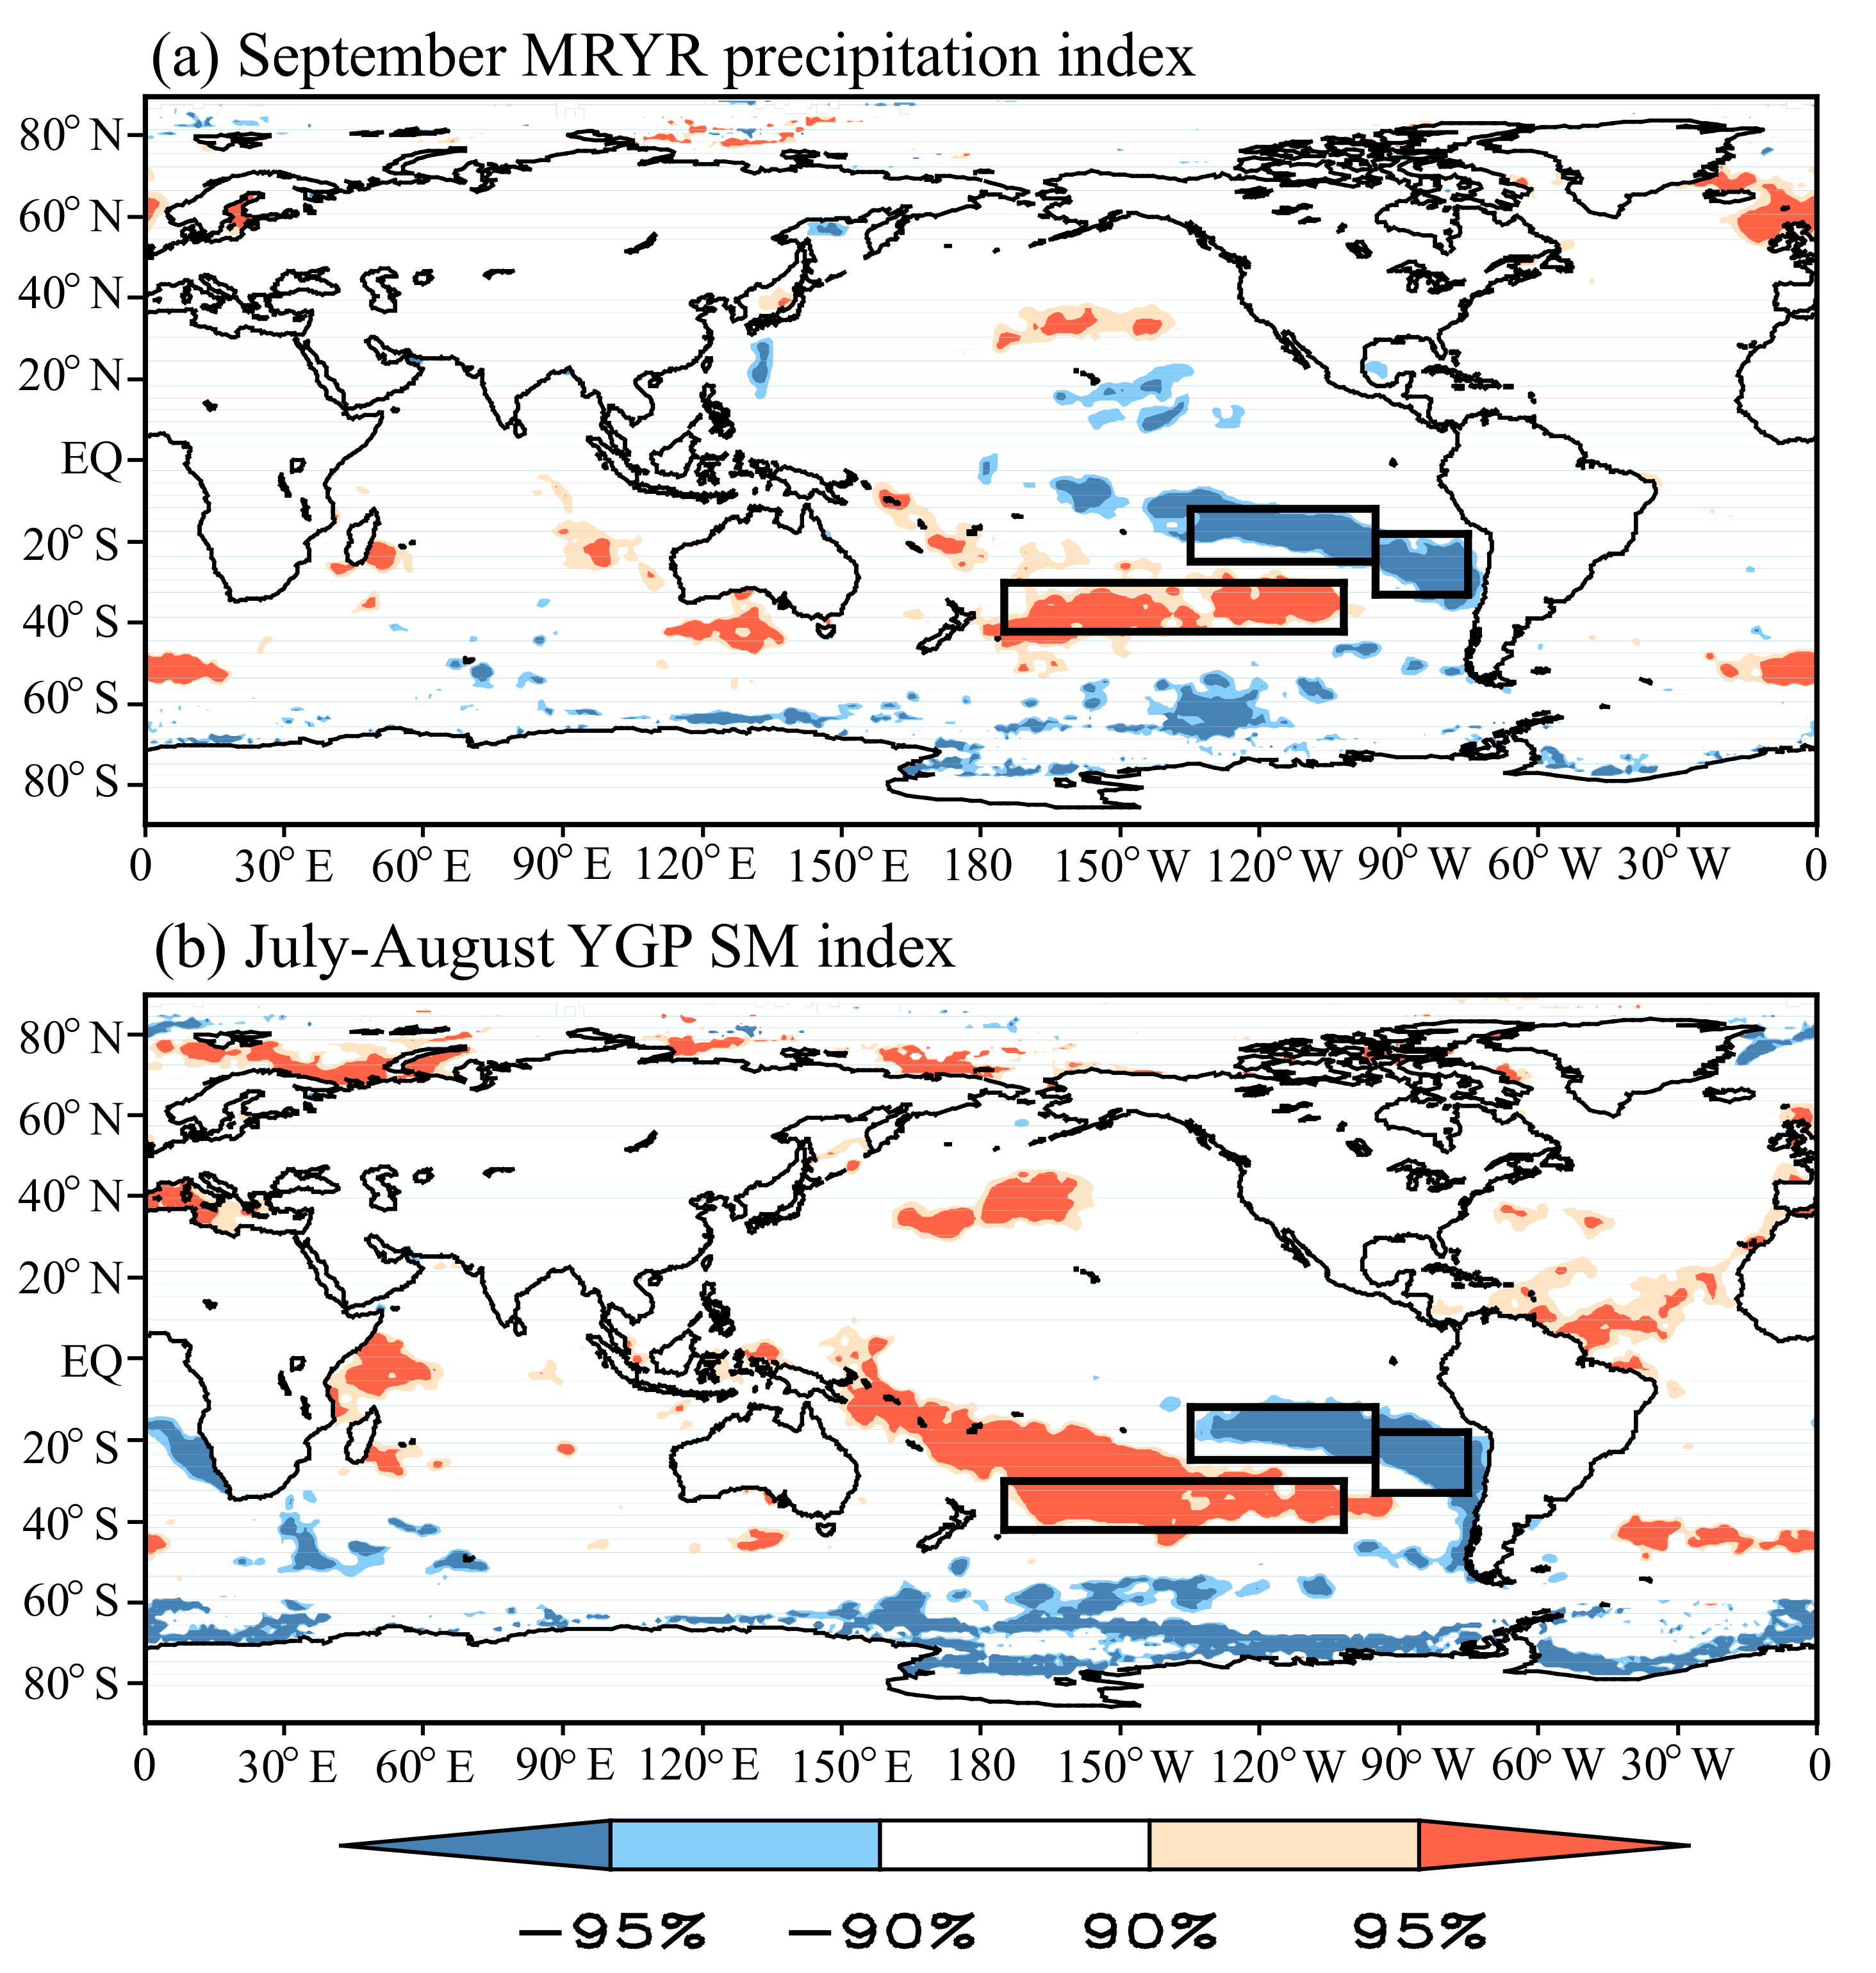
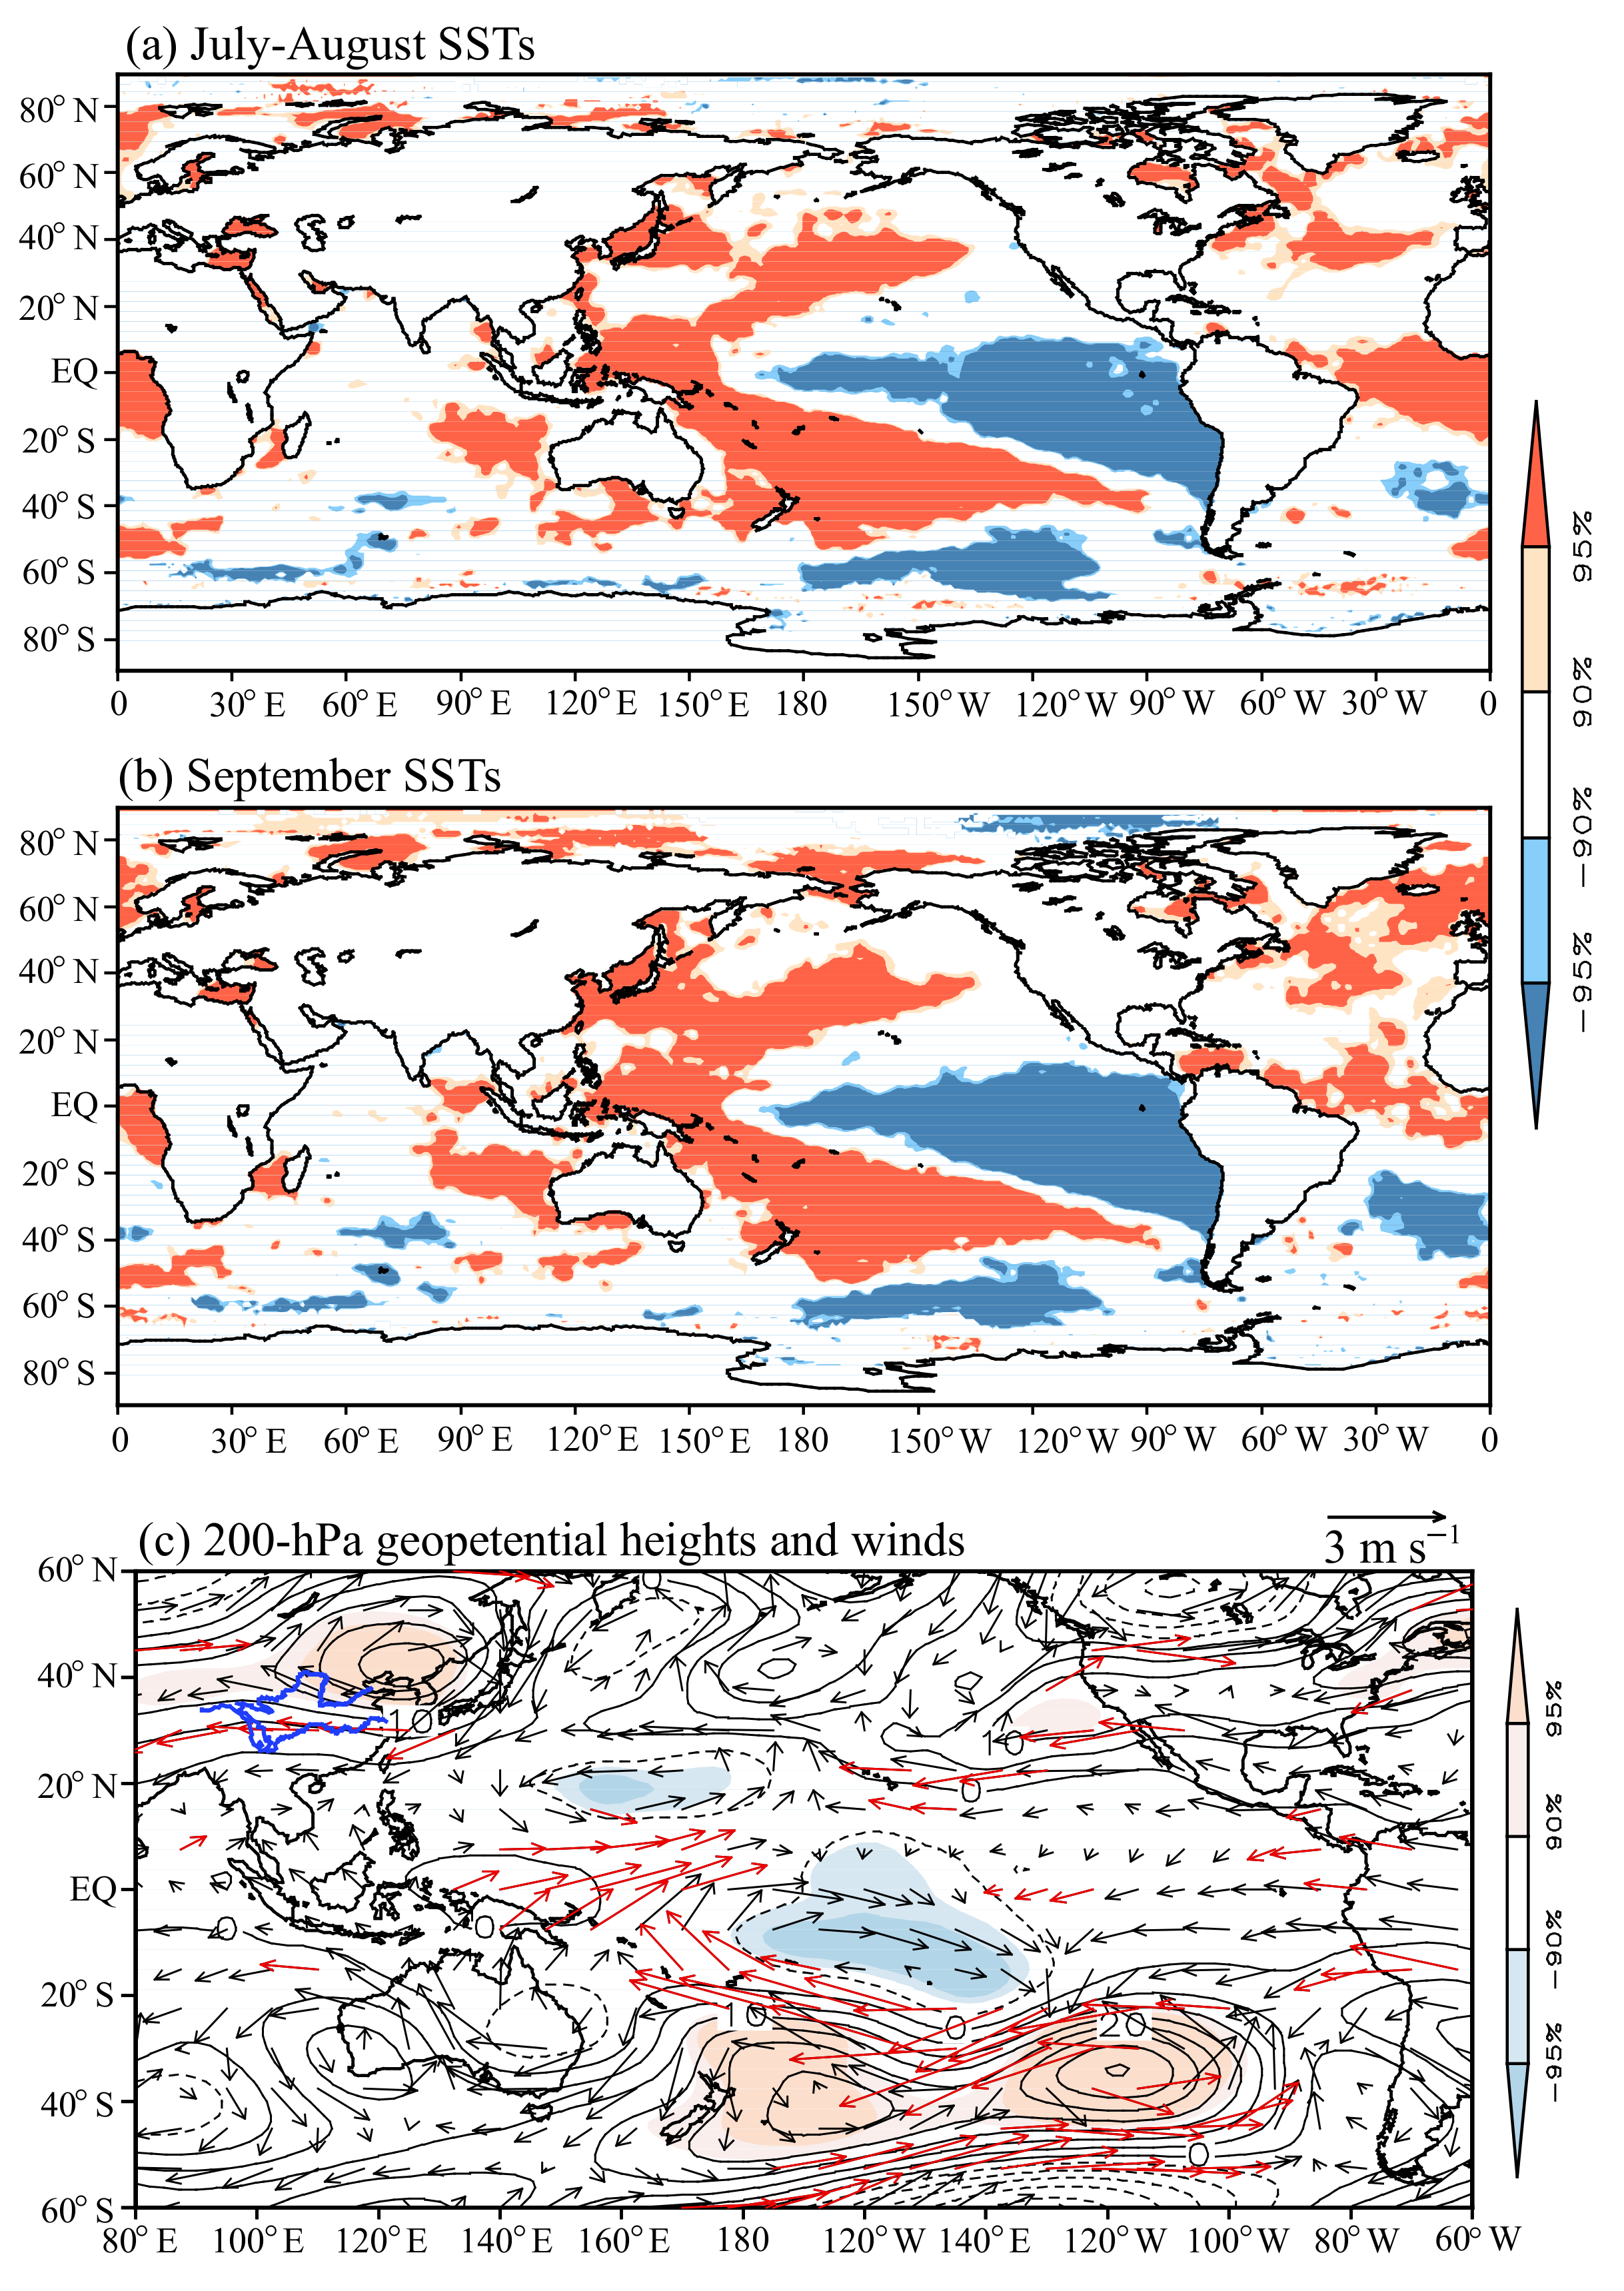
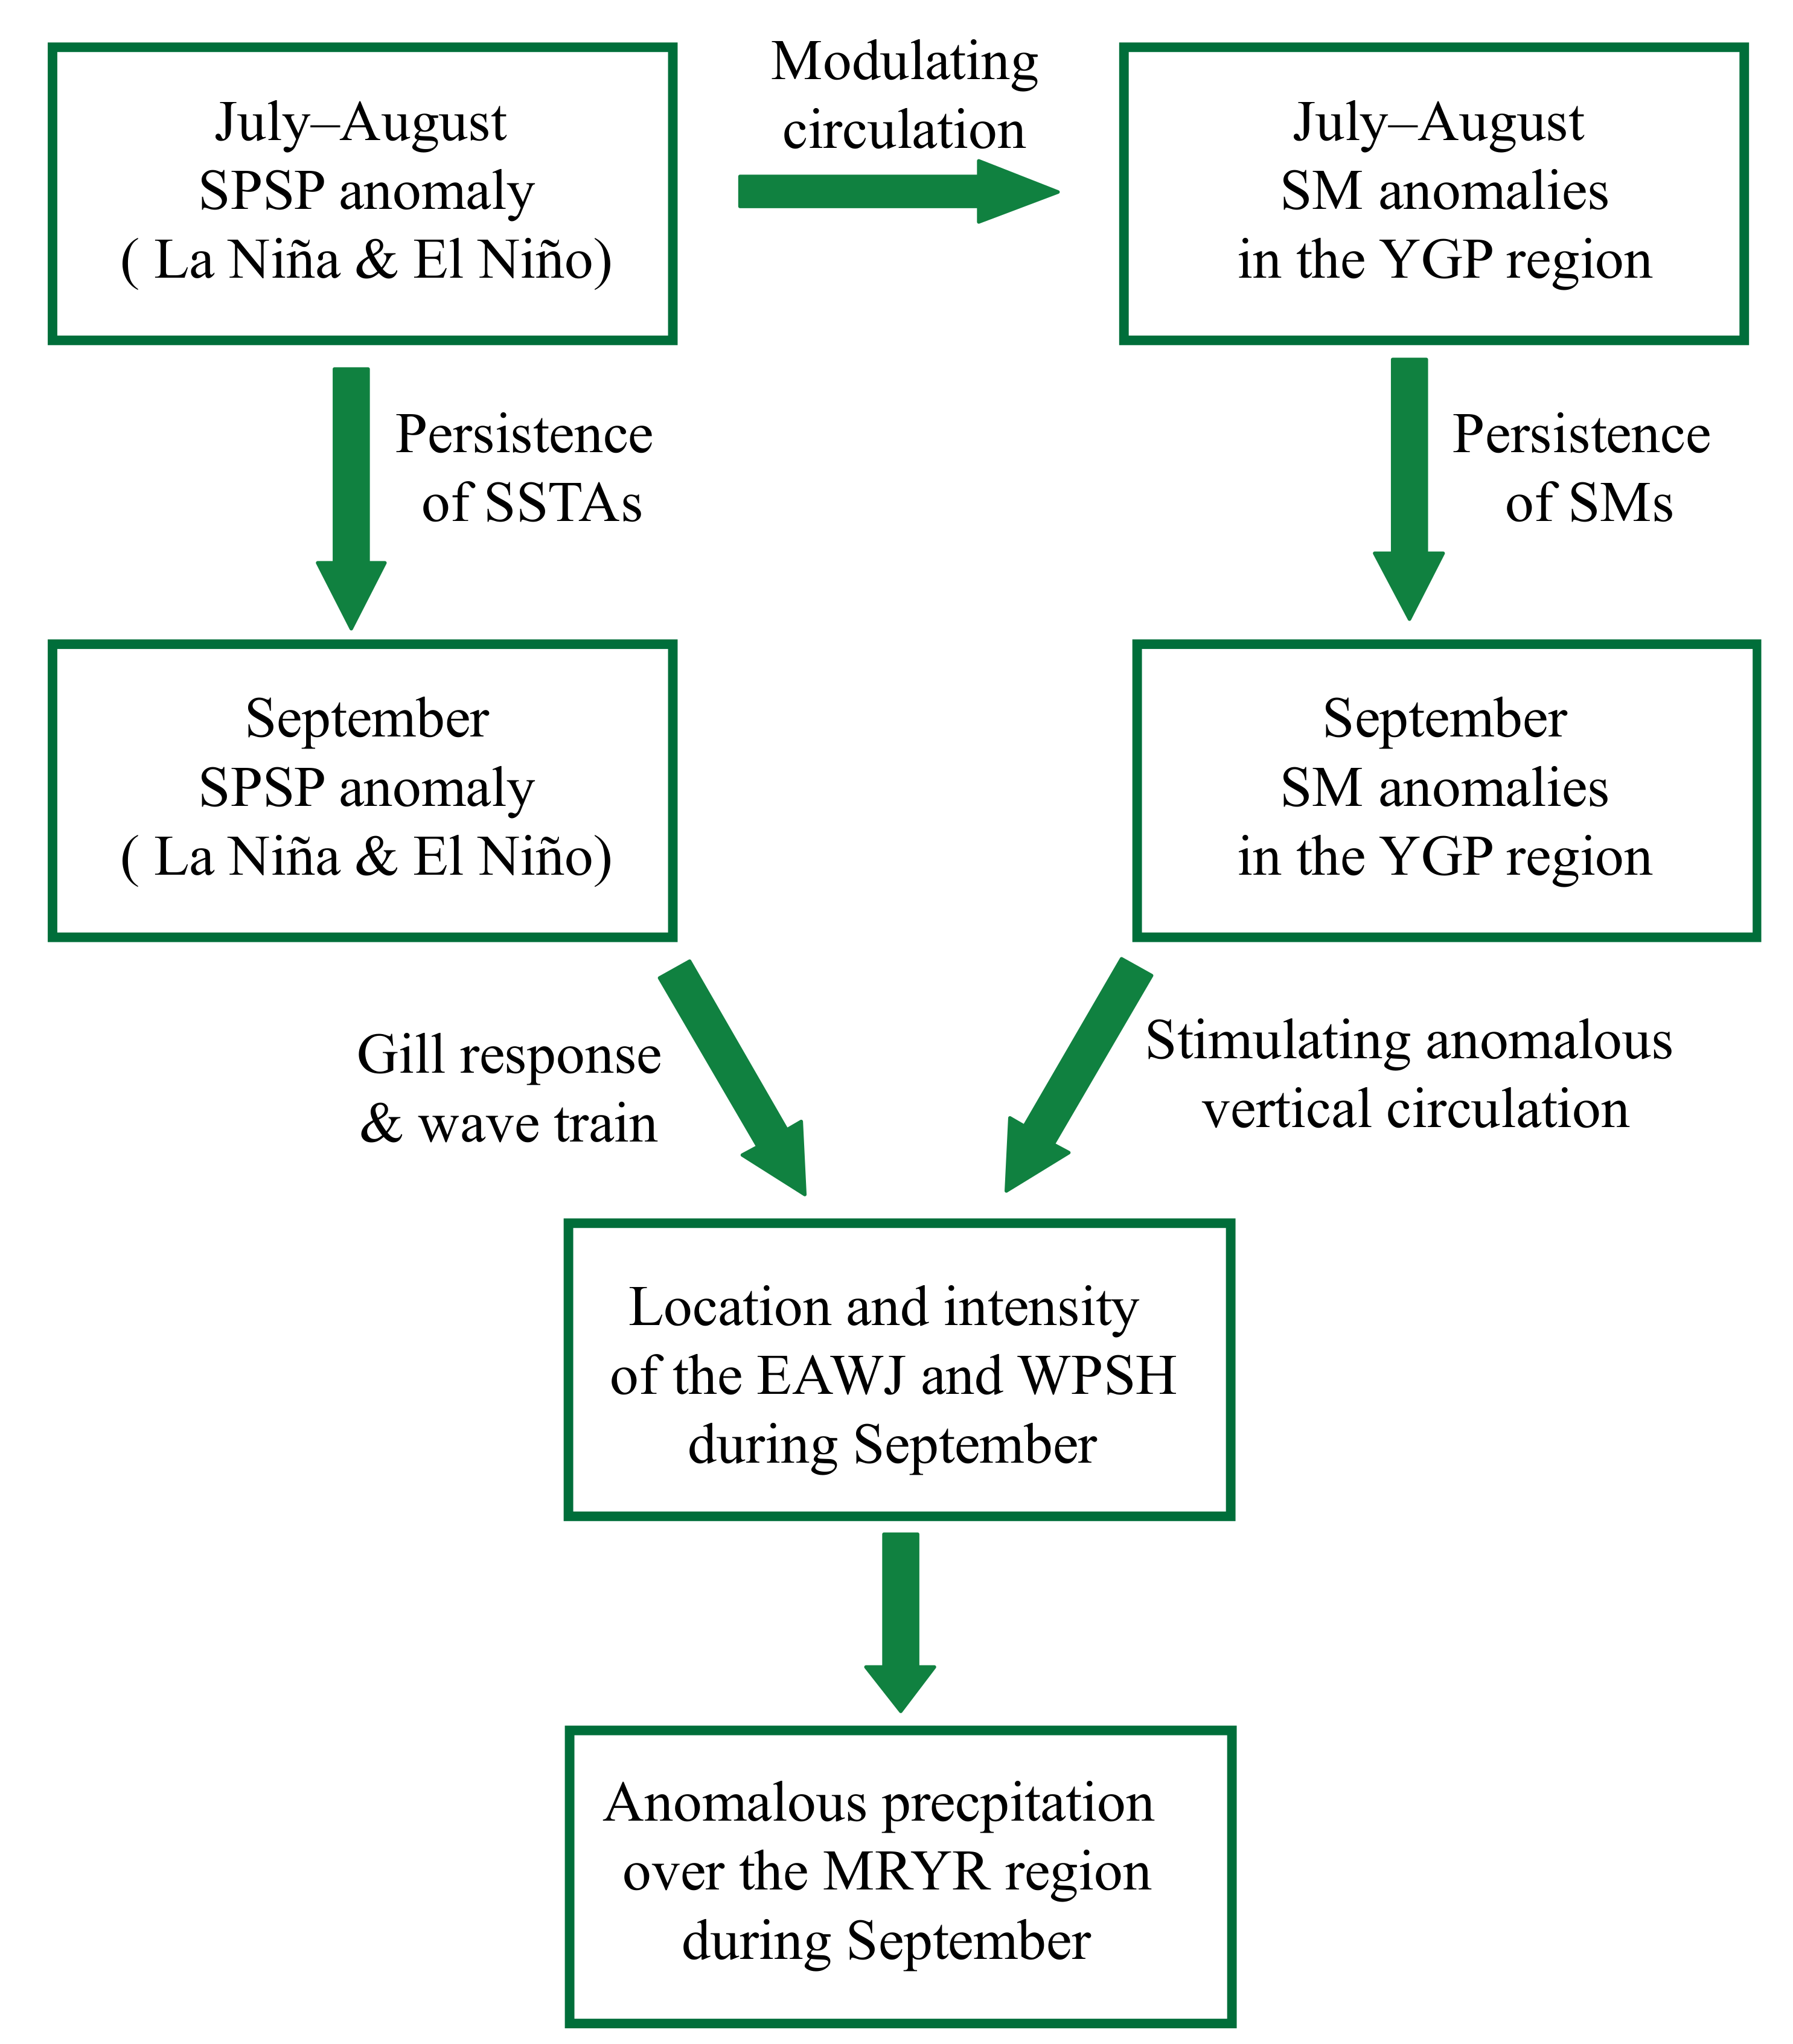
3.3. Contribution of the Preceding Pacific SSTAs and the Bridge Effect of YGP SM Anomalies

To be consistent with the time of the YGP SM signal, we performed the correlation between the September observational MRYR precipitation index and SSTs during July–August (Figure 7a). Significantly negative correlations appear in the southeastern Pacific (135–95° W, 12° S–25° S and 95–75° W, 18–33° S) and significantly positive correlation appear in the further southern Pacific (175–102° W, 30–42° S). This correlation signifies that corresponding to such a pattern of SSTAs during July–August, more precipitation appears over the MRYR region during the subsequent September. Additionally, the correlation between the July–August YGP SM index and simultaneous SSTs (Figure 7b) shows a pattern of SSTAs similar to Figure 7a. This result indicates that the SSTAs in the Pacific, which correspond to anomalous precipitation over the MRYR region during September, are also closely related to the SMs in the YGP during July–August.
According to Figure 7, the southern Pacific SST pattern (SPSP) index was defined as the difference between the area-mean SST in the southeastern Pacific and that in the further southern Pacific (the latter minus the former). This SPSP index can measure well the variability of the SST pattern in the Pacific (i.e., El Niño and La Niña). The correlation coefficient between the July–August SPSP index and the September observational MRYR precipitation index is 0.49, significant at the 99.9% confidence level. Furthermore, the correlation coefficient between the July–August SPSP index and the simultaneous YGP SM index is 0.52, also significant at the 99.9% confidence level. Corresponding to a higher SPSP index, the La Niña-like SSTAs appear during July–August, with a significant warming in the Indo-Pacific warm pool (figure omitted). The warming in the Indo-Pacific warm pool and associated atmospheric heat source above it can stimulate the Matsuno-Gill response [38,39]. The atmospheric circulation anomalies, which are connected with the Matsuno-Gill response, correspond to an anomalous lower-tropospheric anticyclone and anomalous upper-tropospheric easterlies over the YGP (figure omitted). The lower- and upper-tropospheric circulation anomalies seem to be favorable for a lower SM in the YGP. The results imply that the higher SPSP (i.e., the La Niña-like SSTAs) may contribute to the lower SM in the YGP during July–August through the Matsuno-Gill response. This is only a preliminary explanation for the high correlation between the SPSP and YGP SM indices during July–August. Some detailed processes warrant more explorations in the future.
The above two significant correlations imply that the lagged effects of the preceding SPSP and YGP SM on the September MRYR precipitation are intertwined with each other and that the SPSP may affect the MRYR precipitation via the bridge effect of the YGP SM. To reveal the individual effect of the July–August SPSP on atmospheric circulation and relevant precipitation anomalies during September, we defined the July–August individual SPSP index after removing the variability of the July–August YGP SM index through a linear fitting method [31,32]. The correlation between the July–August individual SPSP index and simultaneous SSTs clearly shows a La Niña-like SST pattern in the Pacific, with a significant cooling in the tropical eastern Pacific and a significant warming in the Indo-Pacific warm pool, around the Maritime Continent (Figure 8a). Additionally, a similar La Niña-like SST pattern can be clearly identified in the correlation between this individual SPSP index and SSTs during the ensuing September (Figure 8b). The results imply that a lower (higher) July–August individual SPSP index can reflect the persistence of the La Niña-like (El niño-like) SST pattern from July–August to September.
The warming around the Maritime Continent can stimulate anomalous upper-tropospheric easterlies to the east of this warming and accordingly form anomalous cyclones to the north of the equator (Figure 8c), which shows a typical result of the Matsuno-Gill response [38,39]. Corresponding to this anomalous cyclone, an anomalous anticyclone appears around the Stanovoy Mountains, to the west of the Okhotsk Sea (Figure 8c). This pattern, with an anomalous cyclone and an anomalous anticyclone, may be attributed to the westward propagation of Rossby waves that are excited by the negative SSTAs in the equatorial central Pacific and positive SSTAs in the Indo-Pacific warm pool [40].
For ease of comparison, the anomalies of September geopotential heights and winds regressed upon the July–August individual SPSP index (Figure 9a–c) are shown in the domain same as Figure 2. Compared to Figure 2a, the upper-tropospheric (200 hPa) geopotential height anomaly and associated anomalous anticyclone appear over a further north region, accompanied by anomalous westerlies around 50° N, to the north flank of this anomalous anticyclone (Figure 9a). This signifies that the EAWJ anomaly caused by the individual effect of the SPSP (i.e., La Niña) is further north than that responsible for anomalous precipitation over the MRYR region. At the 500 and 700 hPa levels, a positive geopotential height anomaly appears over a similar region, manifesting as a barotropic structure (Figure 9b,c). The positive geopotential height anomaly can induce lower-tropospheric warm and wet air flow to a further north region, together with the further northward-shifted EAWJ, resulting in more precipitation to the north of the MRYR region, rather than exactly over the MRYR region (Figure 10a). As such, the correlation coefficient between the July–August individual SPSP and September MRYR precipitation indices is only 0.28 (below the 95% confidence level).
Since the SSTAs in the Pacific have longer persistence than the SM anomalies in the YGP, the SPSP signal, which modulates the September MRYR precipitation, can be traced to the earlier months. The September MRYR precipitation is closely related to the preceding January–February SPSP, with a correlation coefficient of 0.43 during the period 1979–2021, significant at the 99% confidence level. However, after removing the variability of the July–August YGP SM index through a linear fitting method [31,32], the correlation coefficient between the January–February individual SPSP and September MRYR precipitation indices decreases to 0.30, slightly below the 95% confidence level.
The aforementioned results imply that the influence of the preceding SPSP (La Niña or El Niño) on the September MRYR precipitation becomes weaker when the bridge effect of the SM anomalies in the YGP region is absent. This implies that the SM anomalies in the YGP may play an important role in linking the preceding SPSP and the September MRYR precipitation. Similarly, the correlation coefficient between the July–August individual YGP SM (after removing the effect of the July–August SPSP) and September MRYR precipitation indices is only 0.27 (also below the 95% confidence level). This reveals that the individual effect of the YGP SM is also insufficient to significantly affect anomalous precipitation over the MRYR region.

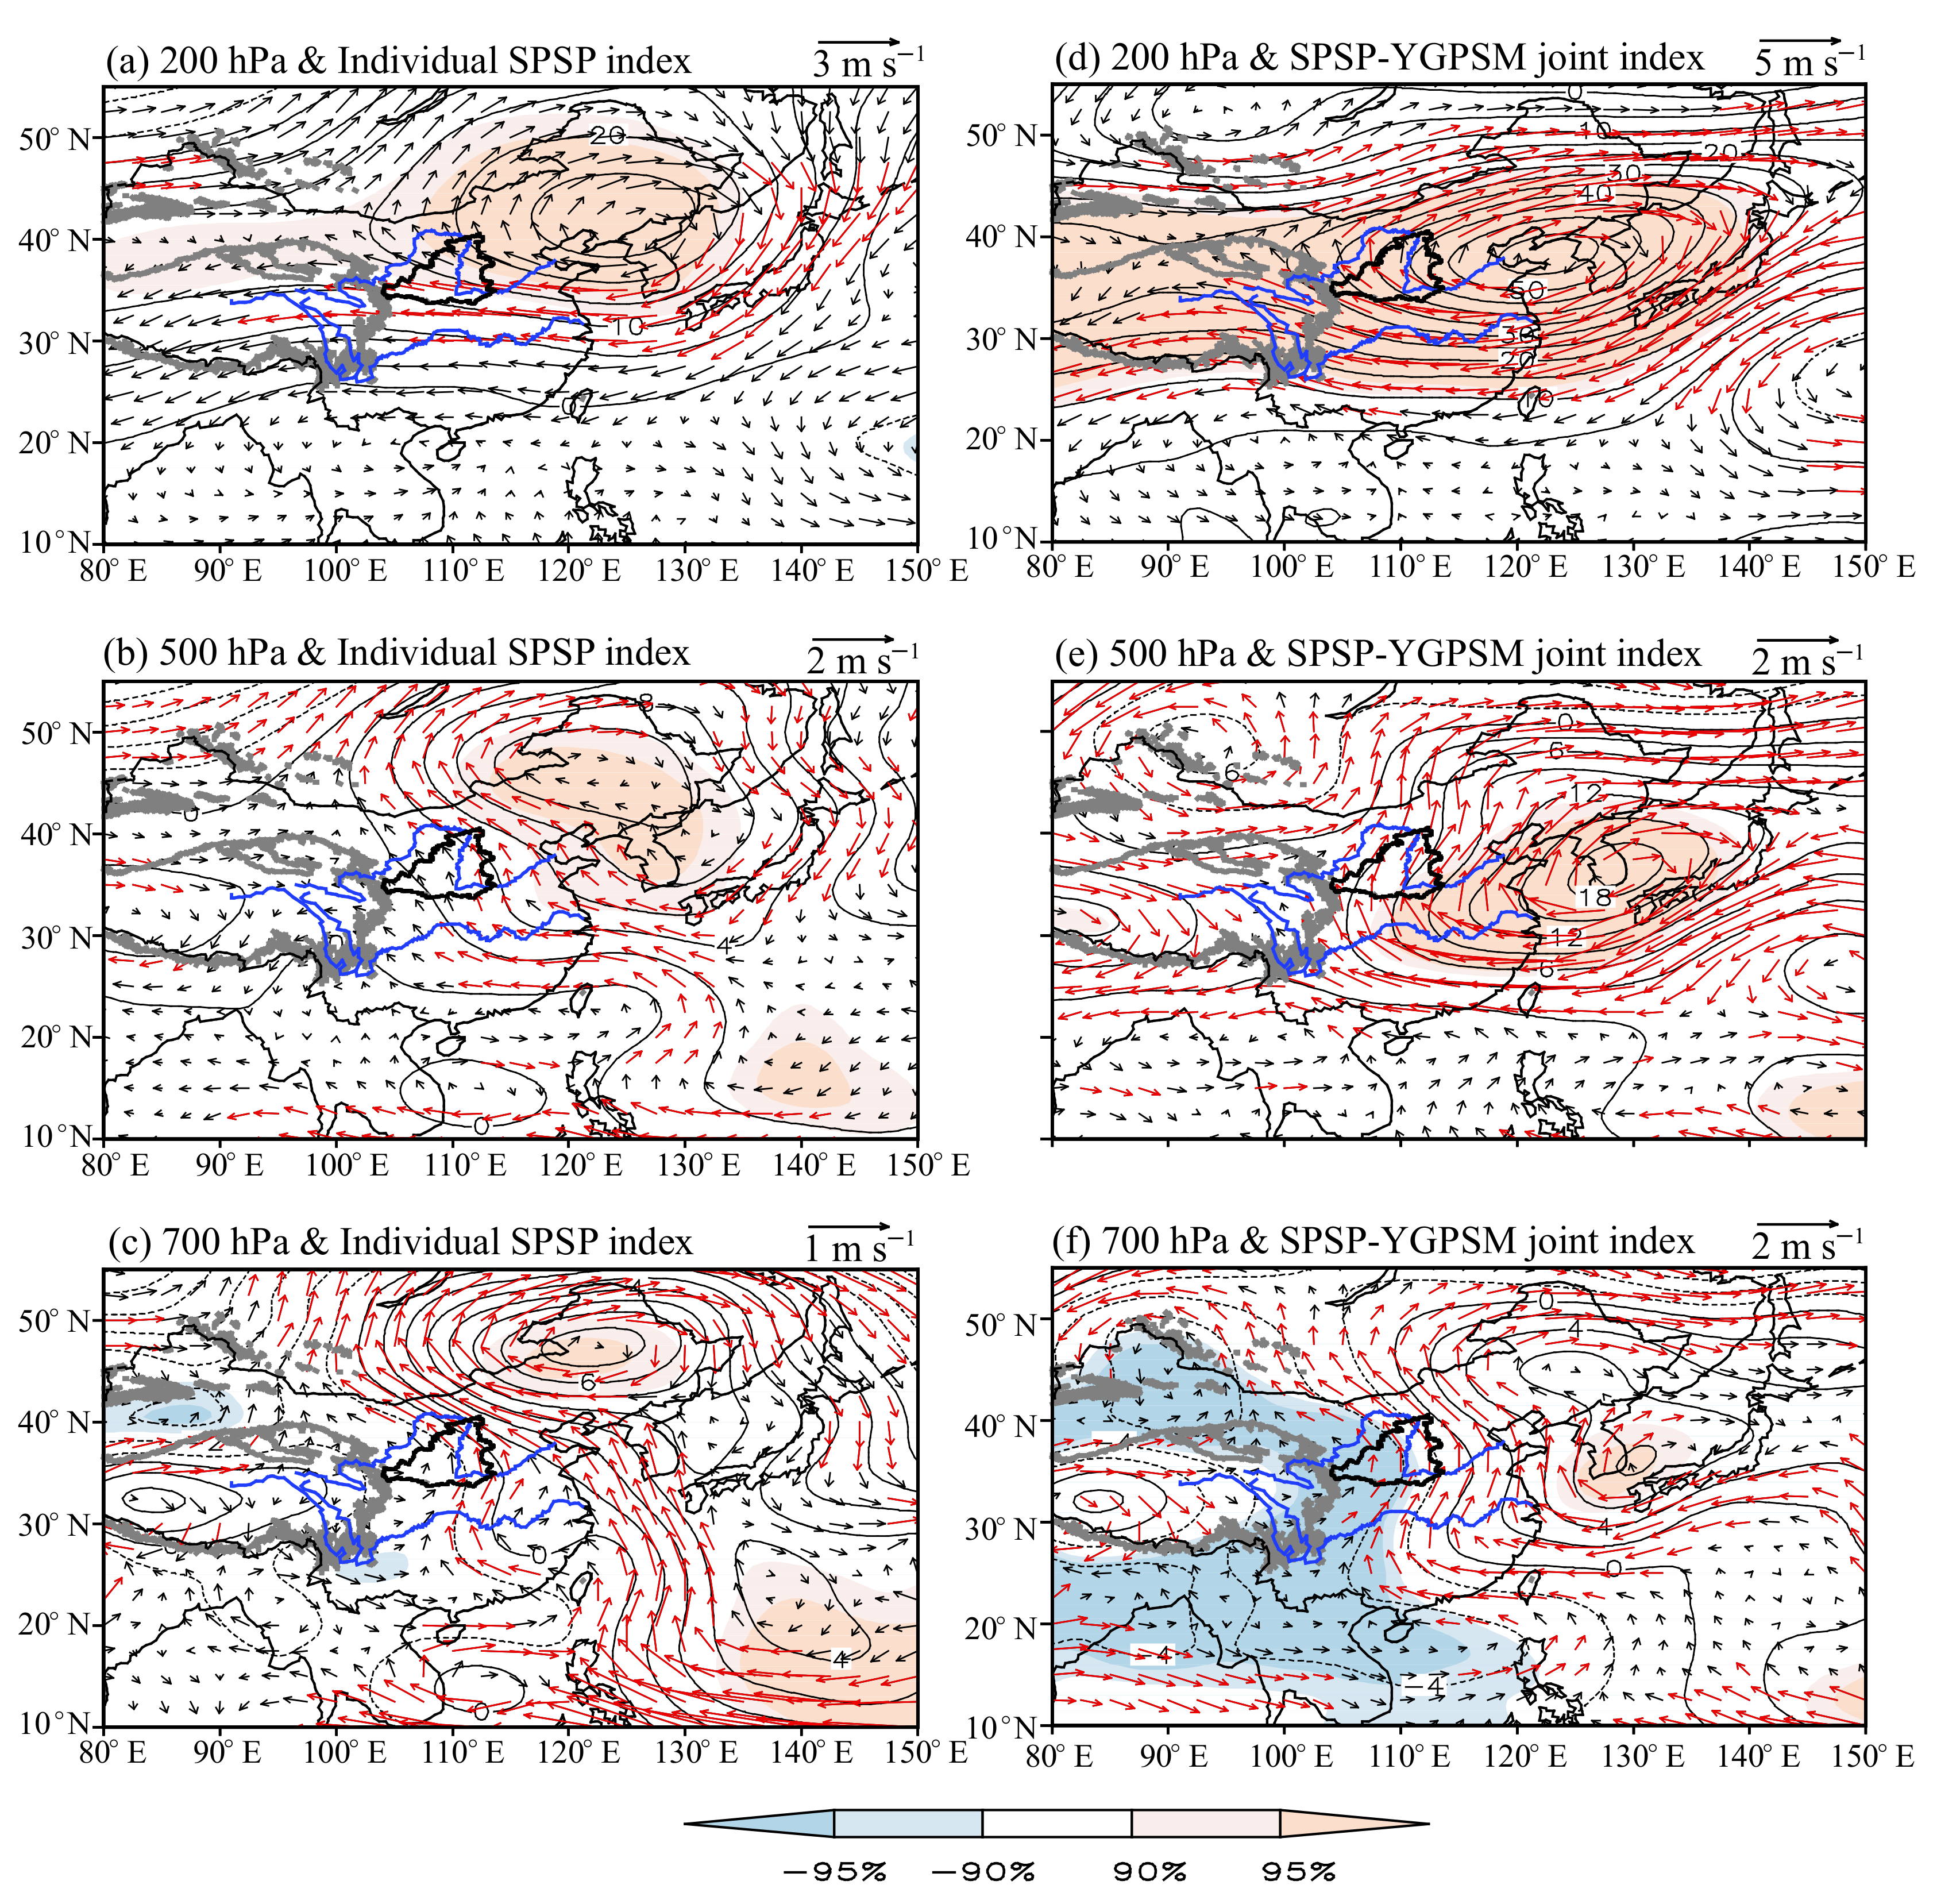
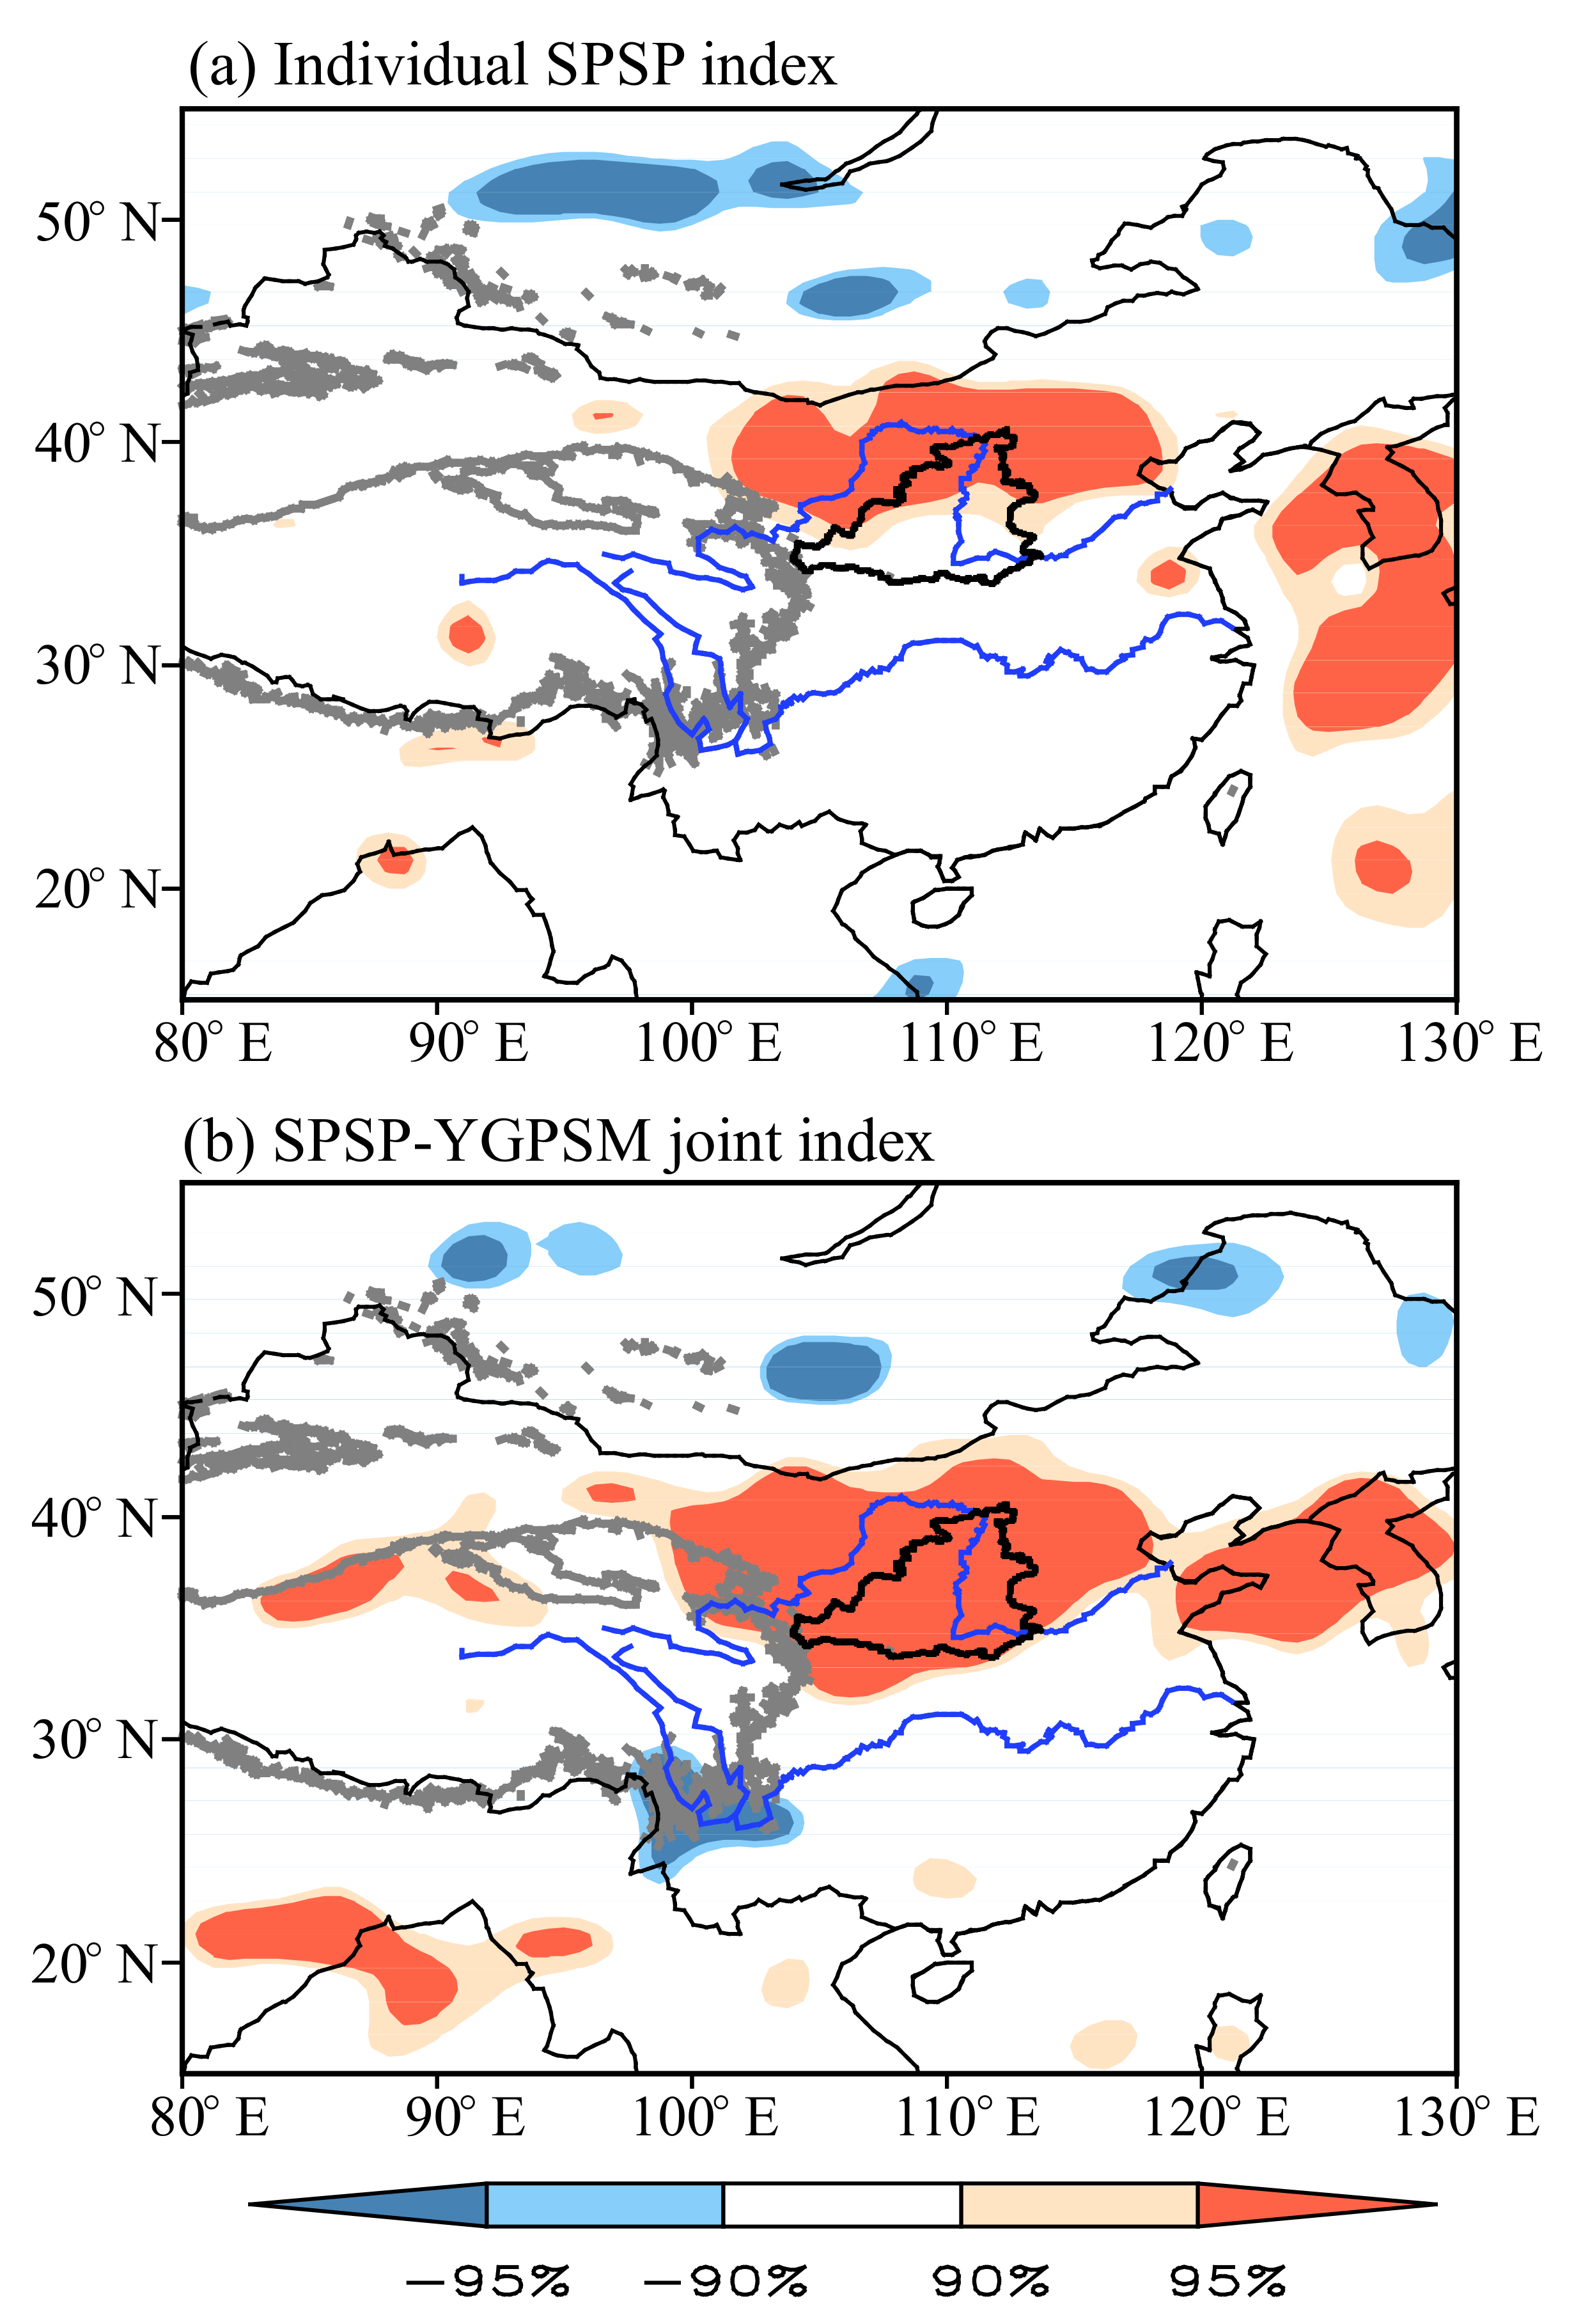
3.4. Joint Effect of the YGP SM and SPSP

Given the statistical and physical links of the September MRYR precipitation with the preceding July–August YGP SM and SPSP, we can establish a physical–empirical model for the period 1979–2021.
I MRYR = 0.316 I YGPSM + 0.325 I SPSP
in which I MRYR , I YGPSM , and I SPSP represent the normalized September MRYR precipitation, preceding July–August YGP SM and SPSP indices, respectively. The right terms of this equation can reflect the joint effect of the two precursory signals with different weights. As such, the right terms are referred to as the SPSP-YGPSM joint index.
The September 200 hPa geopotential height and wind anomalies regressed upon the July–August SPSP-YGPSM joint index show a geopotential height anomaly and an associated anomalous anticyclone from the east of the Tibetan Plateau to the Japan Sea (Figure 9d), resembling Figure 2a. A significantly positive geopotential height anomaly and associated anomalous anticyclone appear in the middle and lower troposphere from eastern China to the south of Japan (Figure 9e,f), which also resemble Figure 2b,c, respectively. The above results reveal that the circulation anomalies (i.e., the northward-shifted EAWJ and the strengthened and westward-extended WPSH), which are forced by the joint effect of the July–August SPSP and YGPSM, agree well with those responsible for more precipitation over the MRYR region during September. As such, the correlation between the July–August SPSP-YGPSM joint index and September precipitation shows a significantly positive correlation over the MRYR region (Figure 10b).
The fitted September MRYR precipitation index based on the preceding July–August SPSP and YGP SM is tightly correlated with the observational one, with a correlation coefficient of 0.56, exceeding the 99.9% confidence level. This correlation coefficient is much higher than those between the September observational MRYR precipitation index and the July–August individual YGP SM (0.27) and SPSP (0.28) indices, further supporting the joint contribution of the preceding YGP SM and SPSP to September precipitation over the MRYR region.

4. Discussion

Previous studies have explored the reasons and predictions for the variability in summer precipitation around the Yellow River valley [11,12,13,14]. However, the studies on autumn precipitation over the MRYR regions are much fewer that those on summer precipitation. The present study indicates the circulation anomalies responsible for the variability in September precipitation over the MRYR region and reveals the joint contribution of the preceding July–August SPSP and YGP SM to the September MRYR precipitation.
More precipitation over the MRYR region can be attributed to the modulation of the northward-shifted EAWJ and the strengthened and westward-extended WPSH during September, which is generally consistent with the circulation anomalies for more precipitation over North China during Summer [41,42,43]. The September MRYR precipitation is significantly related to the preceding July–August YGP SM, implying that the July–August YGP SM signal can be used in the short-term prediction of the September MRYR precipitation. However, the YGP SM signal cannot be traced to the earlier months, which may be due to that SM has a persistence/memory only from several weeks to 1 or 2 months [16,17].
Different from previous studies that focused on the effect of the SST forcing [11,12,13,14], our result indicates the importance of the SM anomalies. The preceding July–August YGP SM itself can modulate, to some extent, the September MRYR precipitation. Moreover, the YGP SM seems to act as a bridge between the preceding pacific SSTAs (i.e., SPSP) and the September MRYR precipitation. The absence of the SM relay effect may reduce the effect of the preceding pacific SSTAs on the September MRYR precipitation. That is, the preceding Pacific SSTAs and the YGP SM anomalies jointly affect the September MRYR precipitation through adjusting the location and intensity of the EAWJ and WPSH. Therefore, the joint contribution of the preceding Pacific SSTAs and the YGP SM anomalies should be taken into account when predicting the September MRYR precipitation.
Apart from the above precursory signals, the SM anomalies, which are significantly correlated with the September MRYR precipitation index, appear in the Tarim Basin (Figure 3a). It is worth further exploring whether the SM anomalies in the Tarim Basin can cause the downstream circulation anomalies and associated precipitation over the MRYR region during September. Moreover, the South Asian monsoon and the Tibetan Plateau monsoon can affect precipitation over the Tarim Basin [44]. This implies that the September MRYR precipitation may be indirectly linked with the above two monsoons, which deserves further research. Yuan et al. [13] revealed the contribution of global teleconnection patterns to summer precipitation in the source region of the Yellow River. In future research, we will explore and combine these factors (SM, SST, and teleconnection) to improve the prediction skill of the September MRYR precipitation.

5. Conclusions

In this study, we investigated the variability of the September precipitation over the MRYR region and associated atmospheric circulation anomalies and precursory signals from the SST and SM anomalies. The results show that the northward-shifted EAWJ and the strengthened and westward-extended WPSH are the dominant circulation anomalies for more precipitation over the MRYR region during September. Additionally, the September MRYR precipitation is significantly related to the preceding July–August SPSP and YGP SM.
The preceding July–August SPSP anomaly, which reflects the La Niña/El Niño-like SSTAs, plays an important role in modulating the variability of the September MRYR precipitation. In this process, the YGP SM may act as a bridge linking the preceding SSTAs and the ensuing September MRYR precipitation. This specific process can be explained by the following mechanism (Figure 11). The positive SPSP (i.e., La Niña-like) SSTAs can persist from July–August to September. The September La Niña-like SSTAs induce a Rossby wave through the Matsuno-Gill response [38,39] and therefore result in more precipitation over the MRYR region through modulating the location and intensity of the EAWJ and WPSH during September. In addition to the above SST relay effect, the La Niña-like SSTAs may modulate the September MRYR precipitation through an SM relay effect. Specifically, the La Niña-like SSTAs contribute to the SM anomalies in the YGP through stimulating a Matsuno-Gill response during July–August (figure omitted). The SM anomalies in YGP persist from July–August to September and excite an anomalous vertical motion and relevant anomalous southerlies along the west flank of the WPSH, which guide warm and wet air flow from the ocean to the MRYR region and eventually cause more precipitation there.
Through both the SST and SM relay effects, the preceding SSTAs in the Pacific can exert a lagged impact on precipitation over the MRYR region during September. As a result, the July–August SPSP–YGPSM joint index, which reflects the joint contribution of the preceding pacific SSTAs and the YGP SM anomalies, has a higher correlation coefficient (0.53) with the September MRYR precipitation than the individual YGP SM (0.27) and SPSP (0.28) indices. This research emphasizes the importance of SM anomalies and accordingly provides an important supplement to traditional SST signals. As such, this work may shed new light on the short-term prediction of autumn precipitation over the MRYR and is therefore useful for water supply management and food and ecological securities in the Yellow River basin.

Author Contributions

Conceptualization, data curation, supervision, G.L.; Writing—original draft preparation, L.J. and G.L.; Visualization, L.J., G.L., X.W., T.Z. and Y.F. Writing—review and editing, L.J., G.L., X.W., T.Z. and Y.F.; Funding acquisition, G.L. All authors have read and agreed to the published version of the manuscript.

Funding

This research was funded by the Second Tibetan Plateau Scientific Expedition and Research (STEP) program (Grant 2019QZKK0105), the Strategic Priority Research Program of the Chinese Academy of Sciences (Grant XDA2010030807) and the Basic Research Fund of CAMS (Grants 2021Z007 and 2019Z008).

Institutional Review Board Statement

Not applicable.

Data Availability Statement

Not applicable.

Acknowledgments

The authors acknowledge the National Oceanic and Atmospheric Administration (NOAA) for providing NCEP-1 data (https://psl.noaa.gov/data/gridded/data.ncep.reanalysis.html (accessed on 2 April 2022)) and CMAP data (https://rda.ucar.edu/datasets/ds728.1 (accessed on 4 June 2022)) and the Met Office Hadley Centre for providing Global Sea Ice and SST (https://rda.ucar.edu/datasets/ds277.3/ (accessed on 21 March 2022)) and the European Centre for Medium-Range Weather Forecasts (ECMWF) for providing the ERA5-Land SM data (https://cds.climate.copernicus.eu/cdsapp#!/dataset/reanalysis-era5-land-monthly-means (accessed on 8 April 2022)).

Conflicts of Interest

The authors declare no conflict of interest.

References

  1. Feng, J.; Zhao, G.; Mu, X.; Tian, P.; Tian, X. Analysis on runoff regime in middle Yellow River and its driving factors. J. Hydroelectr. Eng. 2020, 39, 90–103. (In Chinese) [Google Scholar]
  2. Wang, X.; Yang, D.; Feng, X.; Cheng, C.; Zhou, C.; Zhang, X.; Ao, Y. Impacts of ecological restoration on water resources in middle reaches of Yellow River. Bull. Soil Water Conserv. 2020, 40, 205–212. (In Chinese) [Google Scholar]
  3. Wei, J.; Ren, W.; Zhang, L. Review of the autumn flood prevention in the Yellow River in 2021. China Flood Drought Manag. 2012, 22, 62–64. (In Chinese) [Google Scholar]
  4. Gao, Z.; Li, W.; Li, H. Study on the influence of storm flood and environmental change in the Yellow River Basin. Yellow River Water Conserv. Press Zhengzhou China 2022. (In Chinese) [Google Scholar]
  5. Wang, J.; Wang, H.; Wu, X.; Lu, T. A quantitative evaluation of the mechanism on sediment transport in the Yellow River Basin over the recent 70a. Yellow River. 2022, 44, 14–19. (In Chinese) [Google Scholar]
  6. Song, M.; Wang, Y.; Shi, Y. Characteristics of water resources and water environment in different sections of the Yellow River Basin and ecological protection paths. Water Resour. Dev. Manag. 2022, 6, 17–25. (In Chinese) [Google Scholar]
  7. Huang, J.; Zhang, G.; Yu, H.; Wang, S.; Guan, X.; Ren, Y. Characteristics of climate change in the Yellow River Basin during recent 40 years. J. Water Conserv. 2020, 51, 1048–1058. (In Chinese) [Google Scholar]
  8. Feng, Q.; Jia, Y. Analysis of Weihe autumn flood in 2011 in Weinan city of Shaanxi province. China Flood Drought Manag. 2012, 22, 57–58. (In Chinese) [Google Scholar]
  9. Cai, X.; Kang, L.; Sun, X.; Li, Q.; Mao, M. Study of circulation characteristics in autumn flood period over Weihe and Hanjiang River Basins and the causes of flood by the heavy rains in 2011. Torrential Rain Disasters 2013, 32, 120–125. (In Chinese) [Google Scholar]
  10. Wei, X.; Zhao, L. Review of flood and drought disaster prevention in the Yellow River Basin in 2021. China Flood Drought Manag. 2021, 31, 16–18. (In Chinese) [Google Scholar]
  11. Yasuda, H.; Berndtsson, R.; Saito, T.; Anyoji, H.; Zhang, X. Prediction of Chinese Loess Plateau summer rainfall using Pacific Ocean spring sea surface temperature. Hydrol. Process. 2009, 23, 719–729. [Google Scholar] [CrossRef]
  12. Yuan, F.; Yasuda, H.; Berndtsson, R.; Uvo, C.B.; Zhang, L.; Hao, Z.; Wang, X. Regional sea-surface temperatures explain spatial and temporal variation of summer precipitation in the source region of the Yellow River. Hydrol. Sci. J. 2016, 61, 1383–1394. [Google Scholar] [CrossRef] [Green Version]
  13. Yuan, F.; Berndtsson, R.; Uvo, C.B.; Zhang, L.; Jiang, P. Summer precipitation prediction in the source region of the Yellow River using climate indices. Hydrol. Res. 2016, 47, 847–856. [Google Scholar] [CrossRef] [Green Version]
  14. Zhang, J.; Li, D.; Li, L.; Deng, W. Decadal variability of droughts and floods in the Yellow River basin during the last five centuries and relations with the North Atlantic SST. Int. J. Climatol. 2013, 33, 3217–3228. [Google Scholar] [CrossRef]
  15. Chang, J.; Shi, H.; Zuo, X. Response analysis of precipitation in the Yellow River Basin and the circulation in autumn to ENSO and IOD. Meteorol. Environ. Sci. 2013, 36, 15–20. (In Chinese) [Google Scholar]
  16. Entin, J.K.; Robock, A.; Vinnikov, K.Y.; Hollinger, S.E.; Liu, S.X.; Namkhai, A. Temporal and spatial scales of observed soil moisture variations in the extratropics. J. Geophys. Res. Atmos. 2000, 105, 11865–11877. [Google Scholar] [CrossRef]
  17. Douville, H.; Conil, S.; Tyteca, S.; Voldoire, A. Soil moisture memory and West African monsoon predictability: Artefact or reality? Clim. Dyn. 2007, 28, 723–742. [Google Scholar] [CrossRef] [Green Version]
  18. Moon, S.; Ha, K.J. Early Indian summer monsoon onset driven by low soil moisture in the Iranian desert. Geophys. Res. Lett. 2019, 46, 10568–10577. [Google Scholar] [CrossRef] [Green Version]
  19. Ullah, W.; Wang, G.; Gao, Z.; Hagan, D.F.T.; Bhatti, A.S.; Zhu, C. Observed linkage between Tibetan Plateau soil moisture and South Asian summer precipitation and the possible mechanism. J. Clim. 2020, 34, 361–377. [Google Scholar] [CrossRef]
  20. He, K.; Liu, G.; Wu, R.; Nan, S.; Li, J.; Yue, X.; Wang, H.; Wei, X.; Li, R. Effect of preceding soil moisture-snow cover anomalies around Turan Plain on June precipitation over the southern Yangtze River valley. Atmos. Res. 2021, 264, 105853. [Google Scholar] [CrossRef]
  21. Dong, X.; Zhou, Y.; Chen, H.; Zhou, B.; Sun, S. Lag impacts of the anomalous July soil moisture over southern China on the August rainfall over the Huang-Huai River Basin. Clim. Dyn. 2021, 58, 1737–1754. [Google Scholar] [CrossRef]
  22. Giannini, A.; Saravanan, R.; Chang, P. Oceanic forcing of Sahel rainfall on interannual to interdecadal time scales. Science 2003, 302, 1027–1030. [Google Scholar] [CrossRef] [PubMed] [Green Version]
  23. Liu, G.; Zhao, P.; Chen, J.; Yang, S. Preceding factors of summer Asian-Pacific Oscillation and the physical mechanism for their potential influences. J. Clim. 2015, 28, 2531–2543. [Google Scholar] [CrossRef]
  24. Wang, H.; Liu, G.; Wang, S.; He, K. Precursory signals (SST and soil moisture) of summer surface temperature anomalies over the Tibetan Plateau. Atmosphere 2021, 12, 146. [Google Scholar] [CrossRef]
  25. He, K.; Liu, G.; Wu, R.; Nan, S.; Wang, S.; Zhou, C.; Qi, D.; Mao, X.; Wang, H.; Wei, X. Oceanic and land relay effects in the link between spring sea surface temperatures in the Indian Ocean and summer precipitation over the Tibetan Plateau. Atmos. Res. 2022, 266, 105953. [Google Scholar] [CrossRef]
  26. Chen, Z.; Wu, R.; Zhao, Y.; Wang, Z. Different responses of Central Asian precipitation to strong and weak El Niño events. J. Clim. 2022, 35, 1497–1514. [Google Scholar] [CrossRef]
  27. Xie, P.; Arkin, P.A. Global precipitation: A 17-year monthly analysis based on gauge observations, satellite estimates, and numerical model outputs. Bull. Am. Meteorol. Soc. 1997, 78, 2539–2558. [Google Scholar] [CrossRef]
  28. Kalnay, E.; Kanamitsu, M.; Kistler, R.; Collins, W.; Deaven, D.; Gandin, L.; Iredell, M.; Saha, S.; White, G.; Woollen, J.; et al. The NCEP/NCAR 40-year reanalysis project. Bull. Am. Meteorol. Soc. 1996, 77, 437–472. [Google Scholar] [CrossRef]
  29. Rayner, N.A.; Parkerd, D.E.; Horton, E.B.; Folland, C.K.; Alexander, L.V.; Rowell, D.P.; Kent, E.C.; Kaplan, A. Global analyses of sea surface temperature, sea ice, and night marine air temperature since the late nineteenth century. J. Geophys. Res. Atmos. 2003, 108, 1063–1082. [Google Scholar] [CrossRef] [Green Version]
  30. Hersbach, H.; Bell, B.; Berrisford, P.; Hirahara, S.; Horányi, A.; Muñoz-Sabater, J.; Nicolas, J.; Peubey, C.; Radu, R.; Schepers, D.; et al. The ERA5 global reanalysis. Q. J. R. Meteorol. Soc. 2020, 146, 1999–2049. [Google Scholar] [CrossRef]
  31. Hu, M.; Gong, D.; Wang, L.; Zhou, T. Possible influence of January–March Arctic Oscillation on the convection of tropical North Pacific and North Atlantic. Acta Meteorol. Sin. 2012, 70, 479–491. (In Chinese) [Google Scholar]
  32. Yue, X.; Liu, G.; Chen, J.; Zhou, C. Synergistic regulation of the interdecadal variability in summer precipitation over the Tianshan mountains by sea surface temperature anomalies in the high-latitude Northwest Atlantic Ocean and the Mediterranean Sea. Atmos. Res. 2020, 233, 104717. [Google Scholar] [CrossRef]
  33. Wu, R.; Kinter, J.L., III; Kirtman, B.P. Discrepancy of interdecadal changes in the Asian region among the NCEP-NCAR reanalysis, objective analyses, and observations. J. Clim. 2005, 18, 3048–3067. [Google Scholar] [CrossRef]
  34. Wu, R.; Yang, S.; Wen, Z.; Huang, G.; Hu, K. Interdecadal change in the relationship of southern China summer rainfall with tropical Indo-Pacific SST. Theor. Appl. Climatol. 2012, 108, 119–133. [Google Scholar] [CrossRef]
  35. Betts, A.K.; Ball, J.H.; Beljaars, A.C.M.; Miller, M.J.; Viterbo, P.A. The land surface-atmosphere interaction: A review based on observational and global modeling perspectives. J. Geophys. Res. Atmos. 1996, 101, 7209–7225. [Google Scholar] [CrossRef] [Green Version]
  36. Schär, C.; Lüthi, D.; Beyerle, U.; Heise, E. The soil–precipitation feedback: A process study with a regional climate model. J. Clim. 1999, 12, 722–741. [Google Scholar] [CrossRef]
  37. Eltahir, E.A.B. A soil moisture–rainfall feedback mechanism: 1. Theory and observations. Water Resour. Res. 1998, 34, 765–776. [Google Scholar] [CrossRef]
  38. Matsuno, T. Quasi-geostrophic motions in the equatorial area. J. Meteorol. Soc. Jpn. 1966, 44, 25–42. [Google Scholar] [CrossRef] [Green Version]
  39. Gill, A.E. Some simple solutions for heat-induced tropical circulation. Q. J. R. Meteorol. Soc. 1980, 106, 447–462. [Google Scholar] [CrossRef]
  40. Yue, S.; Wang, B.; Yang, K.; Xie, Z.; Lu, H.; He, J. Mechanisms of the decadal variability of monsoon rainfall in the southern Tibetan Plateau. Environ. Res. Lett. 2021, 16, 014011. [Google Scholar] [CrossRef]
  41. Lu, R. Interannual variation of North China rainfall in rainy season and SSTs in the equatorial eastern Pacific. Chin. Sci. Bull. 2005, 50, 2069–2073. [Google Scholar] [CrossRef]
  42. Qiu, S.; Zhou, W. Variation in summer rainfall over the Yangtze River region during warming and Hiatus periods. Atmosphere 2019, 10, 173. [Google Scholar] [CrossRef]
  43. Chen, D.; Nan, S.; Liu, G.; Zhou, C.; Shi, R.; Ao, Y.; Li, X. Improvement in the Prediction of Summer Precipitation in the North China–Hetao Region Using the Tropospheric Temperature Over the Tibetan Plateau in Spring. Front. Earth Sci. 2021, 9, 708567. [Google Scholar] [CrossRef]
  44. Zhao, Y.; Yu, X.; Yao, J.; Dong, X.; Li, H. The concurrent effects of the South Asian monsoon and the plateau monsoon over the Tibetan Plateau on summer rainfall in the Tarim Basin of China. Int. J. Climatol. 2019, 39, 74–88. [Google Scholar] [CrossRef]
Figure 1. (a) The map showing the location of the study area. The blue lines in the north and south of China denote the Yellow and Yangtze Rivers, respectively. The black bold borderline around the Yellow River represents the MRYR region, in which 66 observational stations are highlighted in red dots. The thick gray contour denotes the Tibetan Plateau (3000 m above sea level); (b) Time series of the September observational MRYR precipitation index (blue line) and the CMAP-based one (red line) during the period 1979–2021.
Atmosphere 13 01737 g001
Figure 2. (a) Anomalies of September 200 hPa geopotential heights (contours; units: gpm) and winds (vectors; units: m s−1) obtained by regressing upon the simultaneous observational MRYR precipitation index during the period 1979–2021; (b,c) As in (a), but for 500- and 700-hPa levels. Shadings represent anomalies in geopotential heights significant at the 90 and 95% confidence levels. Red vectors denote anomalous winds significant at the 95% confidence level. The black bold borderline around the Yellow River (the blue curve in north China) represents the MRYR region and the thick gray contour denotes the Tibetan Plateau (3000 m above sea level).
Atmosphere 13 01737 g002
Figure 3. (a) Distribution of correlation coefficients between the September observational MRYR precipitation index and the preceding July–August SMs during the period 1979–2021; (b) As in (a), but for that on interannual time scales. Shadings denote the correlation significant at the 90% and 95% confidence levels, as shown by the color bars. The black bold borderline around the Yellow River (the blue curve in northern China) represents the MRYR region and the thick gray contour denotes the Tibetan Plateau (3000 m above sea level).
Atmosphere 13 01737 g003
Figure 4. (a) Distribution of correlation coefficients between the July–August YGP SM index and September precipitation during the period 1979–2021; (b) As in (a), but for that on interannual time scales. Shadings denote the correlation significant at the 90% and 95% confidence levels, as shown by the color bars. The black bold borderline around the Yellow River (the blue curve in northern China) represents the MRYR region and the thick gray contour denotes the Tibetan Plateau (3000 m above sea level); (c) Standardized time series of the September observational MRYR precipitation index (blue line) and the July–August YGP SM index (red line) during the period 1979–2021; (d) As in (c), but for those on interannual time scales.
Atmosphere 13 01737 g004
Figure 5. As in Figure 2, but for the anomalies of September geopotential heights and winds obtained by regressing upon the July–August YGP SM index.
Atmosphere 13 01737 g005
Figure 6. (a) Distribution of correlation coefficients between the July–August YGP SM index and SM during the subsequent September SMs during the period 1979–2021. Shadings denote the correlation significant at the 90 and 95% confidence levels, as shown by the color bars. The black bold borderline around the Yellow River (the blue curve in northern China) represents the MRYR region and the thick gray contour denotes the Tibetan Plateau (3000 m above sea level); (b) September vertical circulation anomalies regressed upon the simultaneous YGP SM index on a meridional–vertical cross section along 110° E. The September area-mean SM averaged in the YGP region (24–30.5° N, 102.5–111° E; see the black box in (a)) was defined as the September YGP SM index. The gray shading in (b) represents the terrain.
Atmosphere 13 01737 g006
Figure 7. (a) Distribution of correlation coefficients between the September observational MRYR precipitation index and July–August SSTs during the period 1979–2021; (b) As in (a), but for that between the July–August YGP SM index and simultaneous SSTs. Shadings denote the correlation significance at the 90 and 95% confidence levels, as shown by the color bars. The black boxes indicate the key regions for the definition of the SPSP index.
Atmosphere 13 01737 g007
Figure 8. Distribution of correlation coefficients between the July–August individual SPSP index and (a) simultaneous and (b) September SSTs during the period 1979–2021. Shadings in (a,b) denote the correlation significant at the 90 and 95% confidence levels; (c) Anomalies of September 200 hPa geopotential heights (contours; units: gpm) and winds (vectors; units: m s−1) obtained by regressing upon the July–August individual SPSP index. Shadings in (c) represent anomalies in geopotential heights significant at the 90 and 95% confidence levels. Red vectors denote anomalous winds significant at the 95% confidence level.
Atmosphere 13 01737 g008
Figure 9. As in Figure 2, but for the anomalies of September geopotential heights and winds (a,b,c) obtained by regressing upon the July–August individual SPSP index and those (d,e,f) obtained by regressing upon the July–August SPSP-YGPSM joint index.
Atmosphere 13 01737 g009
Figure 10. (a) Distribution of correlation coefficients between the July–August individual SPSP index and September precipitation during the period 1979–2021; (b) As in (a), but for that between the July–August SPSP-YGPSM joint index and September precipitation. Shadings denote the correlation significant at the 90 and 95% confidence levels, as shown by the color bars. The black bold borderline around the Yellow River (the blue curve in northern China) represents the MRYR region and the thick gray contour denotes the Tibetan Plateau (3000 m above sea level).
Atmosphere 13 01737 g010
Figure 11. Schematic diagram summarizing the processes linking the precursory SPSP and YGP SM signals and September precipitation over the MRYR region.
Atmosphere 13 01737 g011
Publisher’s Note: MDPI stays neutral with regard to jurisdictional claims in published maps and institutional affiliations.

