1. Summary
Precipitation is a fundamental component of the climate system, and the accurate estimation of precipitation is of the utmost importance in hydrometeorological studies [
1,
2,
3]. However, ground observations are often missing in such studies, and a ground observation station can only represent and reflect the precipitation characteristics within a certain radius. Therefore, the surface precipitation data obtained via interpolation based on precipitation data from the ground observation station have significant errors and limited resolution [
4]. The estimated precipitation signals emitted by meteorological radar are susceptible to terrain environments and tall buildings, and the obtained precipitation data will be greatly limited in detection range, despite offering better spatial and temporal continuity [
5]. Remote sensing provides a revolutionary method for obtaining estimated data on raster precipitation [
6].
In the last three decades, satellite measurements of precipitation have proven to be cost-effective, uninterrupted, and reliable sources over large data-void regions [
7,
8]. The first dedicated meteorological precipitation satellite, the Tropical Precipitation Measuring Mission (TRMM), which was launched from Japan on 27 November 1997 and retired in April 2015, was designed to monitor and study tropical precipitation and also used to collect data. This satellite enhanced our understanding of weather systems and the real-time monitoring of monsoons and extreme weather events [
9,
10]. Numerous scholars have conducted accuracy assessments and runoff simulation studies of TRMM in mainland China [
11,
12], the Sichuan basin [
13,
14], and the Yellow River basin [
15] and obtained better analysis and simulation results, but the coarse spatial and temporal resolution and large topographic errors of TRMM make it unable to function for precipitation analysis and applications in small-scale regions. GPM builds on TRMM’s remarkable achievements and was launched in February 2014 to assist researchers in improving the prediction of extreme events and studying global climate [
16]. Three critical improvements in GPM are as follows: (1) the orbital inclination was increased from 35° to 65°, affording coverage of important additional climate zones; (2) the radar was upgraded to two frequencies, adding sensitivity to light precipitation; and (3) “high-frequency” channels (165.5 and 183.3 GHz) were included in the GPM Microwave Imager (GMI), providing key information for sensing light and solid precipitation to detect light precipitation and all types of precipitation (precipitation and snowfall) [
17]. Integrated Multisatellite Retrievals for Global Precipitation Measurement (IMERG), one of the mainstream precipitation data sources in the GPM era, was upgraded in March 2019 (IMERG V06 release). Three different precipitation datasets are available for different observation periods: Early-Run and Late-Run for near-real time and Final-Run for delayed time (IMERG-E, IMERG-L, IMERG-F).
The performance of the TRMM and IMERG precipitation product inversion algorithms can be affected in different regions, time scales, and topographic conditions, leading to errors in outputs [
18,
19,
20,
21,
22,
23,
24,
25]. Several studies have shown that the bias of these products varies across seasons and is more pronounced in winter than in summer [
26,
27]. Elevation and topography are other important factors that affect the estimation of rainfall [
19,
28]. However, current studies on the accuracy assessment and error analysis of IMERG precipitation datasets suffer from the problem of short data time series, and although studies related to the IMERG V06 time scale have been conducted in the Chinese region, the effects of seasonality and topography have not been considered [
29], in addition to the regional accuracy assessment of nea-real-time IMERG-E and IMERG-L. In addition, there are still few studies on the regional accuracy assessment of near-real-time IMERG-E and IMERG-L and the hydrological utility of the basin.
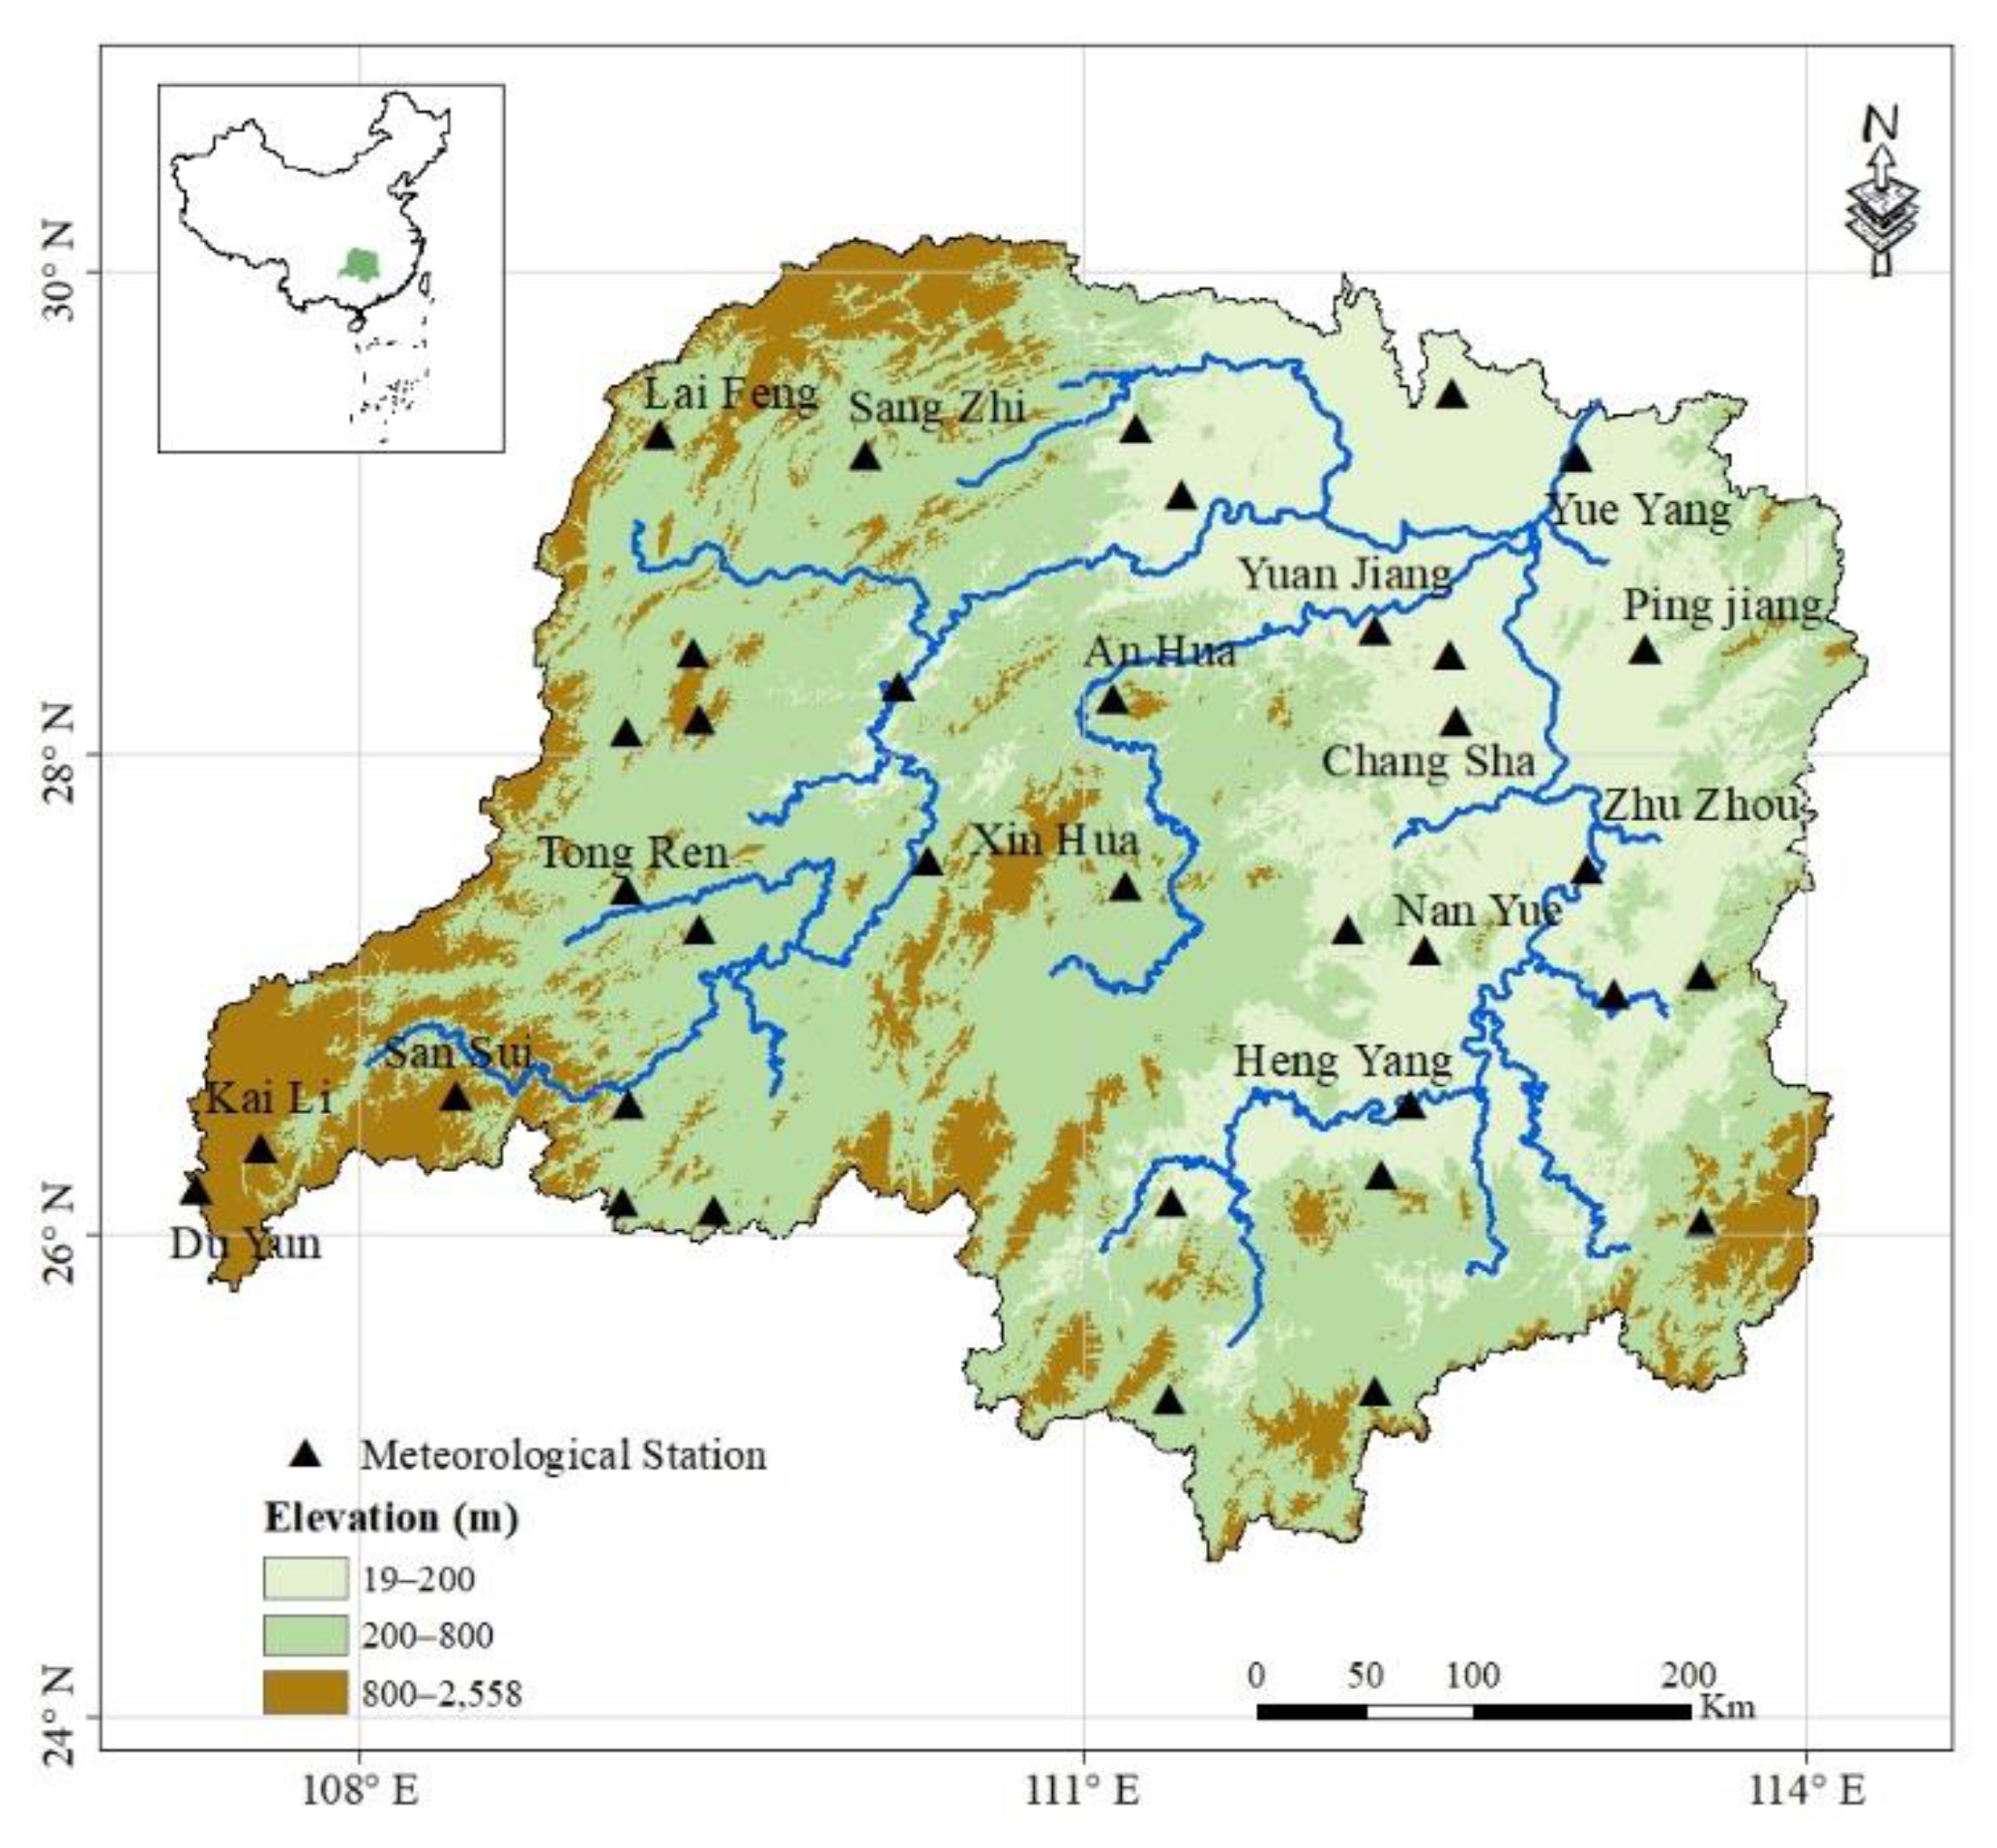
Dongting Lake is the second largest freshwater lake in China and also an important through-river lake in the middle reaches of the Yangtze River. The area with the greatest increase in precipitation in the entire Yangtze River basin is the Dongting Lake basin [
18]. In the context of climate warming, rainfall resources are changing in parallel, making Dongting Lake prone to flooding or water depletion. Satellite precipitation data can provide more accurate services for future hydrometeorological studies in the Dongting Lake basin under extreme weather. The applicability of annual, seasonal, and monthly precipitation data from four different data sources, ERA-INTERIM, CRU, GPCP, and TRMM, in the Dongting Lake basin was previously studied [
30], but the effects of spatial scales, as well as topography, were not evaluated. TRMM (3B43V7) was evaluated based on measured precipitation data from 27 meteorological stations at monthly and seasonal scales. We additionally analyzed the accuracy and reliability of precipitation data at monthly, seasonal, and spatial scales but did not consider daily precipitation at small scales, annual precipitation at large scales, or the influence of topography [
31]. Nevertheless, no scholars have evaluated the latest IMERG precipitation data for adaptation studies in the Dongting Lake basin or used classification indices to assess the ability of satellite data to analyze the occurrence of daily precipitation events in the Dongting Lake basin.
Overall, this study aims to evaluate the performance of IPPs in showing precipitation variations over the Dongting Lake basin using surface observations from the period of September 2014 to February 2021. The analyses focus on the frequently discussed climatological spatial–temporal features of daily, monthly, seasonal, annual, and extreme rainfall event variations in precipitation rates. The study area and data are described in
Section 2. The methodology is shown in
Section 3. The evaluation results for the IPPs are provided in
Section 4, and a summary and conclusion appear in the final section.
3. Methods
In this study, two methods were used to compare the estimated precipitation values from actual weather station measurements and satellite precipitation products. One method involves directly comparing the latitude and longitude corresponding to the weather station values and the satellite data raster values; the other involves a comparative analysis using satellite precipitation for spatial overlay. Based on the values of 36 meteorological stations, the spatial distribution of precipitation in the whole study area was obtained via kriging interpolation. The evaluation and comparison of the three IMERG precipitation products (IPPs) were conducted based on a general assessment (continuous statistical metrics) and the precipitation detection capabilities (categorical statistical metrics) (
Table 1). The evaluation was performed on a certain time scale for one extreme precipitation event to assess the temporal–spatial performance of the IPPs.
The correlation coefficient (CC) was used to measure the degree of linear correlation between observed precipitation and IPPs, with values ranging from −1 to 1. Here, values between 0 and 0.3 (0 and −0.3) indicate a weakly positive (negative) linear relationship; values between 0.3 and 0.7 (−0.3 and −0.7) indicate a moderately positive (negative) linear relationship through a fuzzy–firm linear rule, and those between 0.7 and 1.0 (−0.7 and −1.0) indicate a strongly positive (negative) linear relationship through a firm linear rule [
38]. The Root Mean Square Error (RMSE) was used to assess the overall error, where a value of 0 indicates that the data are appropriate. In general, a lower RMSE is superior to a higher RMSE. The smaller the RMSE value, the closer the IPP measurements are to the precipitation gauges. C-RMS is the ratio of the difference between IPPs and observed precipitation. The standard deviation (SD) reflects the standard error and the dispersion degree of the IPPs.
The POD, FAR, and CSI are used to reflect the ability of IPPs to detect daily precipitation events [
39]. POD indicates the detection hit ratio of IMERG precipitation compared to the occurrence of daily precipitation events. The higher the value, the higher the detection hit ratio of satellite precipitation, and the stronger the ability to reflect daily precipitation events. The smaller the FAR, the smaller the false alarm and false alarm degree of satellite precipitation. CSI comprehensively reflects the ability of satellite precipitation to estimate the occurrence of precipitation events. For this study, we set a precipitation threshold of 0.1 mm/day to establish whether or not it had rained that day. Daily precipitation exceeding this value was judged to indicate rain; otherwise, it was judged to indicate no rain.
Greenwich Mean Time was used in the IPPs, and the extracted grid data were then converted into Beijing time (UTC + 8 h). Daily precipitation data were obtained by summing 0.5 h data based on the time of observed precipitation (20:00 to 20:00). Monthly and seasonal precipitation data were also obtained by summation.
4. Results
4.1. Overall Assessment
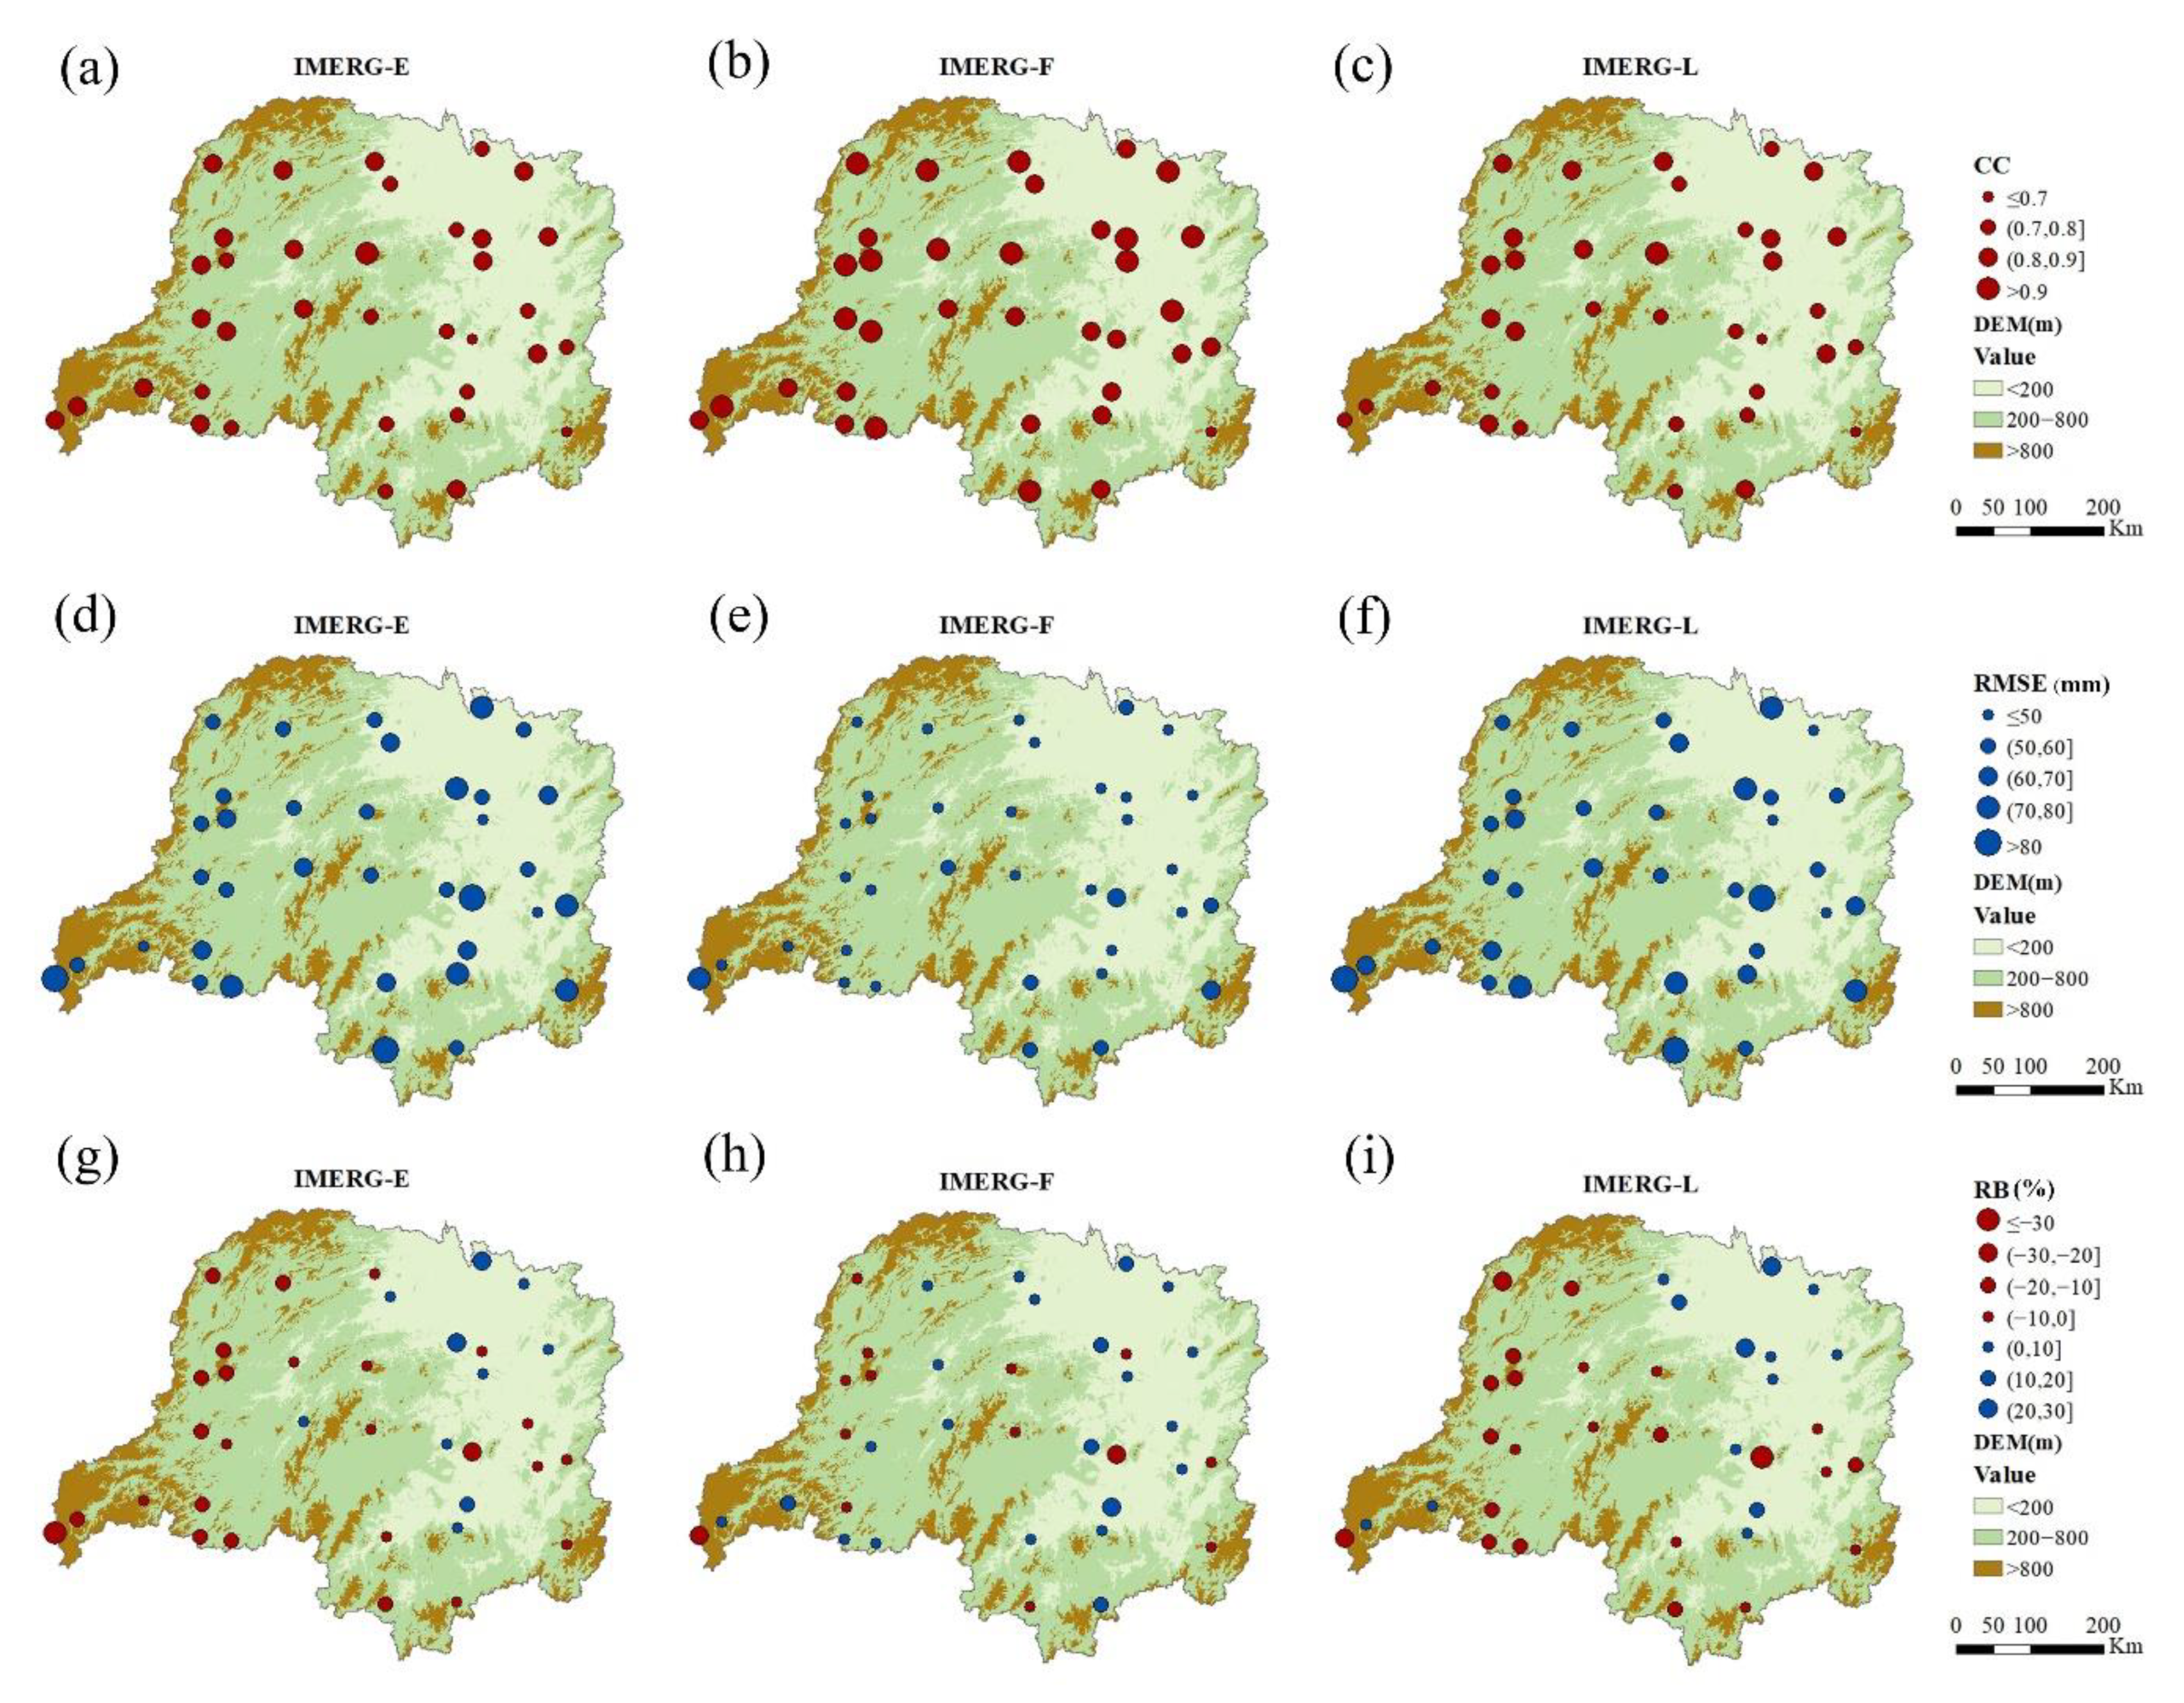
Table 2 partitions all the rainfall station sites by elevation into above 800 m, 200–800 m, and below 200 m. The CC values of the medium and low elevation areas were not significantly different; all values were found to be higher than those of the high elevation areas, with the CC of IMERG-F being the highest. The RB of the high elevation areas was double that of the medium and low altitude areas, and the IMERG-F RB was the smallest. According to
Figure 2, the IPPs have a good correlation with the observed precipitation data at a daily scale. The station with the largest CC value was Anhua station, with 0.81 for IMERG-F, and the smallest was Nanyue station, with 0.49 for IMERG-E. Sites with high CC values were found to be mainly distributed in the northwest of the basin, while sites with small RMSE values were also mainly distributed in the northwest of the basin. This result is consistent with the spatial distribution of the CC values and has good applicability in the Dongting Lake basin.
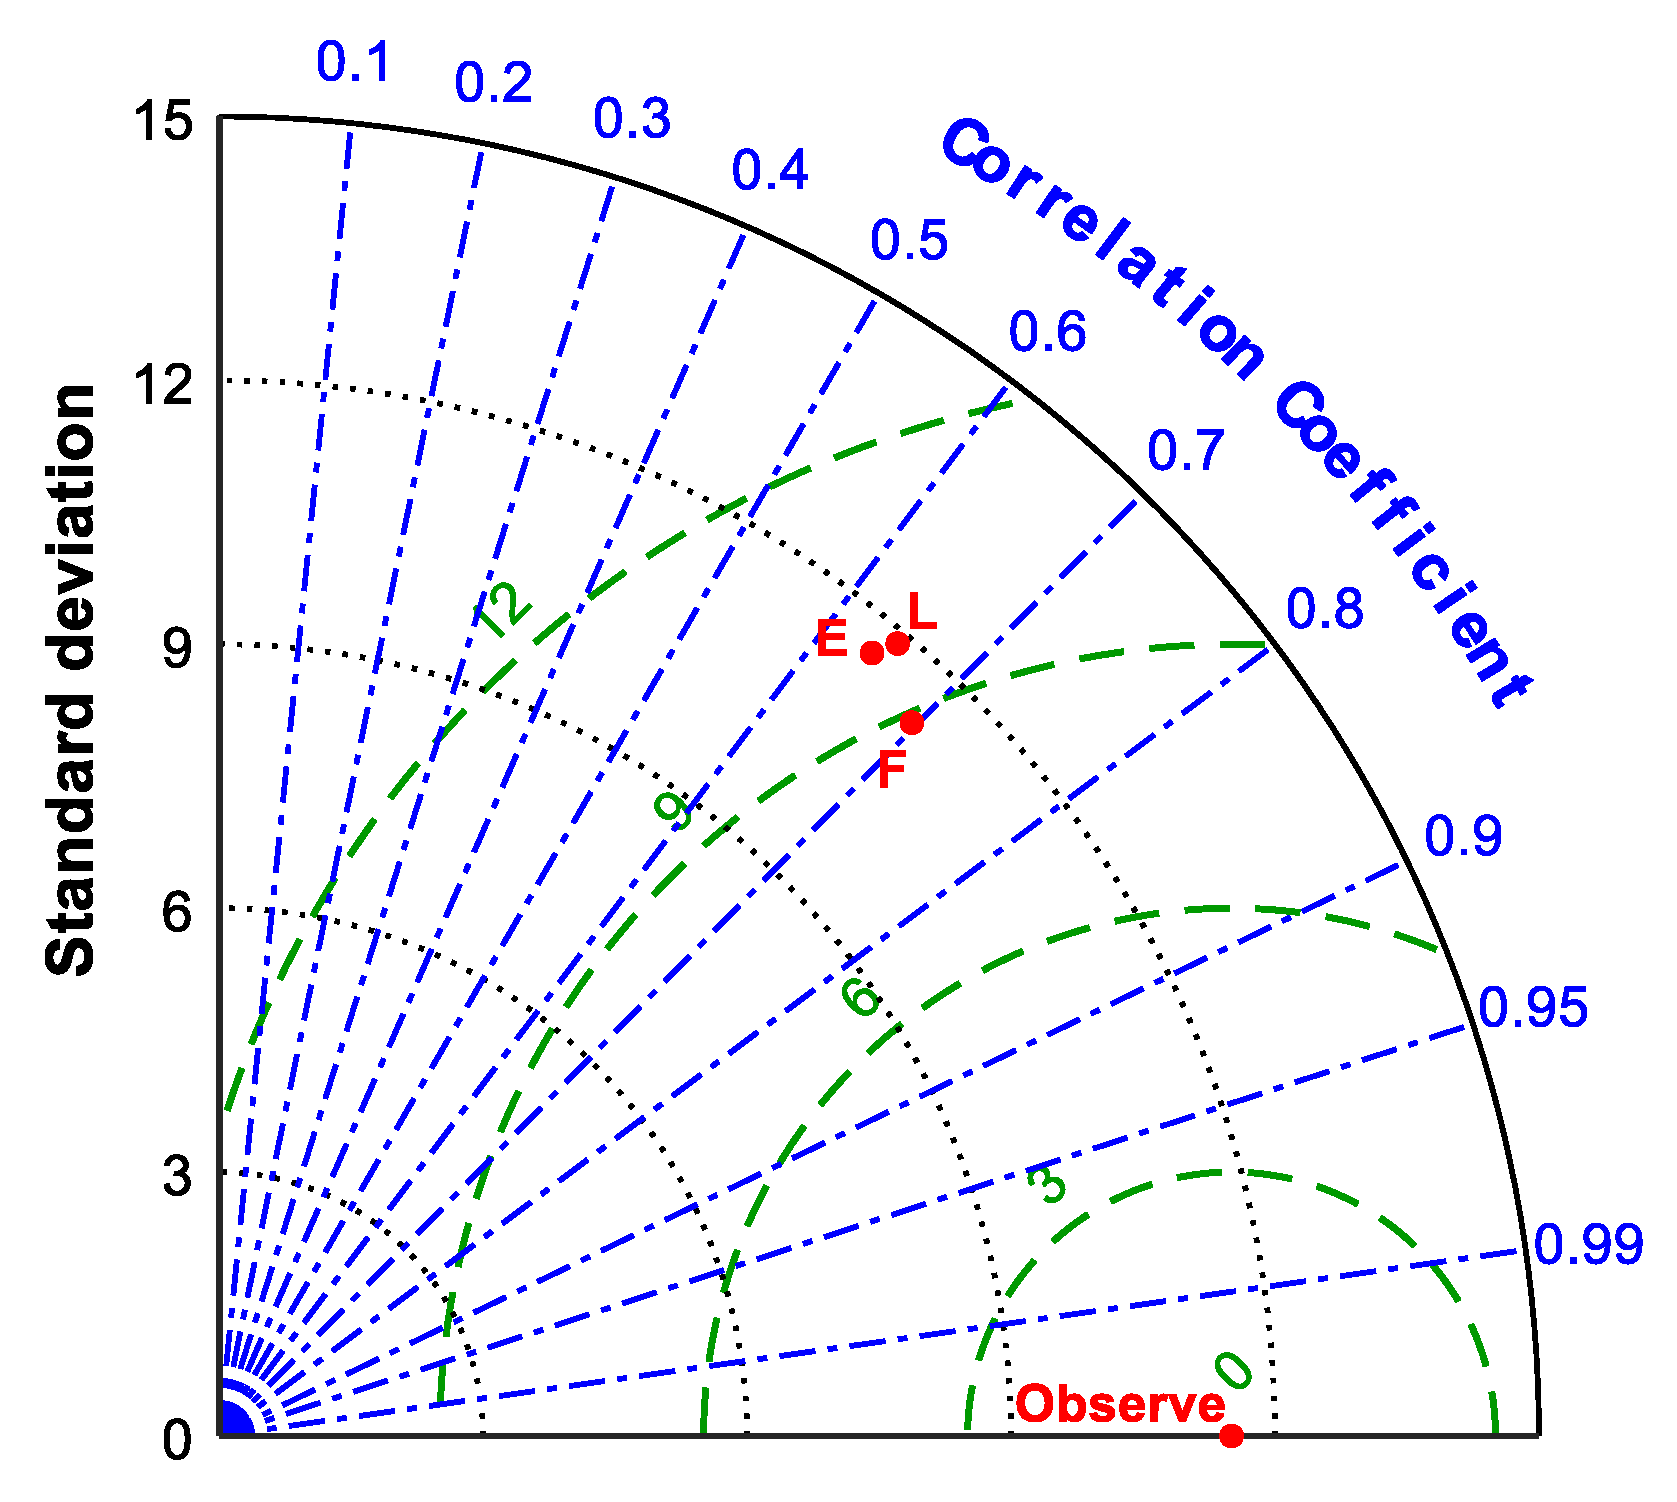
To compare the average daily precipitation in the Dongting Lake basin from September 2014 to February 2021, a Taylor diagram [
35,
38,
39,
40] was plotted, as shown in
Figure 3. The Taylor diagram depicts the SD, CC, and C-RMS values of the IPPs relative to the observation data from the meteorological stations. The degree of coincidence between the IPPs and observed data reflects the degree of matching and closeness between them. In the Taylor diagram, a smaller distance between the point of the satellite product and station indicates a closer agreement.
There was an obvious correlation between satellite precipitation data and observation data. The CC daily value of IMERG-F reached 0.70, slightly higher than that of IMERG-E (about 0.64) and IMERG-L (about 0.65). IMERG-F had a C-RMS of 8.89 mm and an SD of 11.30 mm, which were lower values than those of the other satellite products. The respective RB values of IMERG-E, IMERG-L, and IMERG-F were −5.57, −5.93, and 3.75. IMERG-F overestimated the values, while the other satellite products underestimated the values. Overall, at a daily scale, the three products were very close to the data from the ground observation sites. IMERG-F performed better than other satellite products.
4.2. Monthly Assessment
Here, the CC monthly value of IMERG-F is 0.9, which is significantly higher than the values of IMERG-E (CC = 0.78) and IMERG-L (CC = 0.78). This value is also significantly higher than Yang Dong’s results after fitting TRMM and measured data (CC = 0.89) at a monthly scale from 1998 to 2011 [
31]. Additionally, the RB and RMSE values of IMERG-F were found to be lower than those of the other two satellite products. This result is consistent with the daily data analysis.
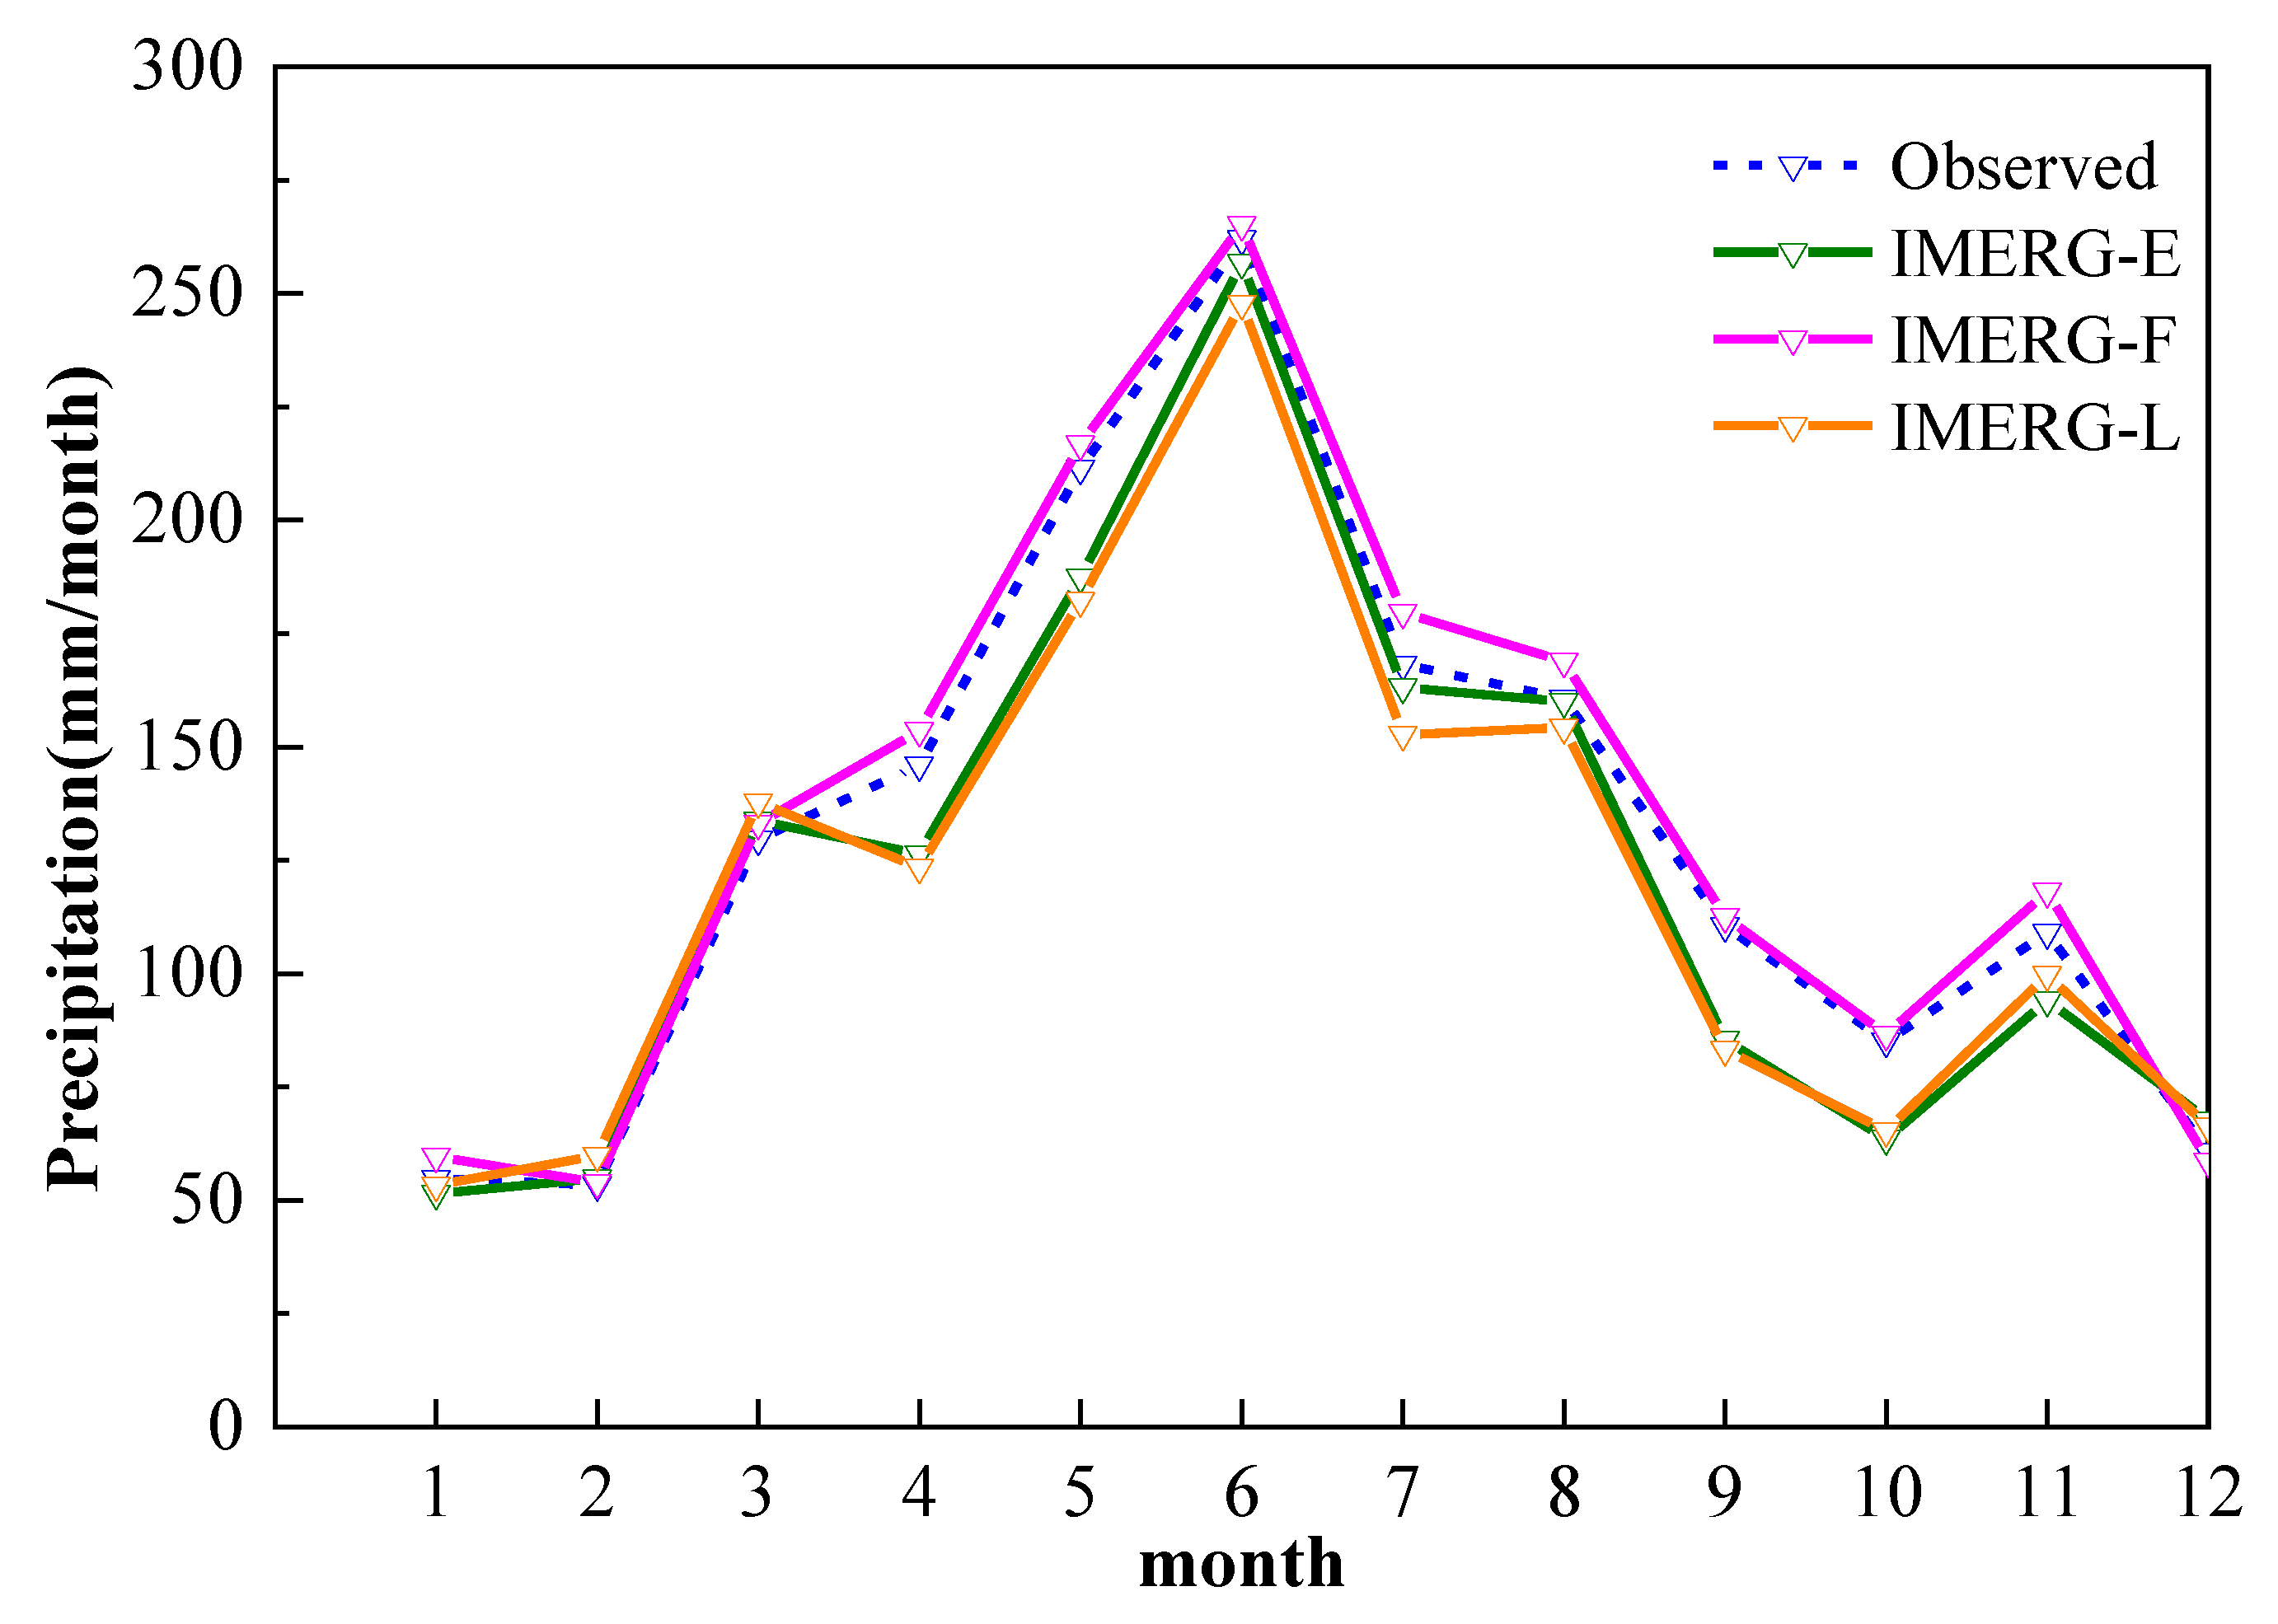
Table 3 shows that the CC monthly value of IPPs is higher than the daily value, but the RB values are similar. A time series of monthly precipitation averaged over the Dongting Lake basin from January 2015 to December 2020 is presented in
Figure 4. All IPPs present an overall similar trend, there was greater precipitation in the warm months (May to October) than in the cold months (November to April next year), with a peak in June. Precipitation concentrated over the period April–June for the lake basin is affected by a subtropical monsoon.
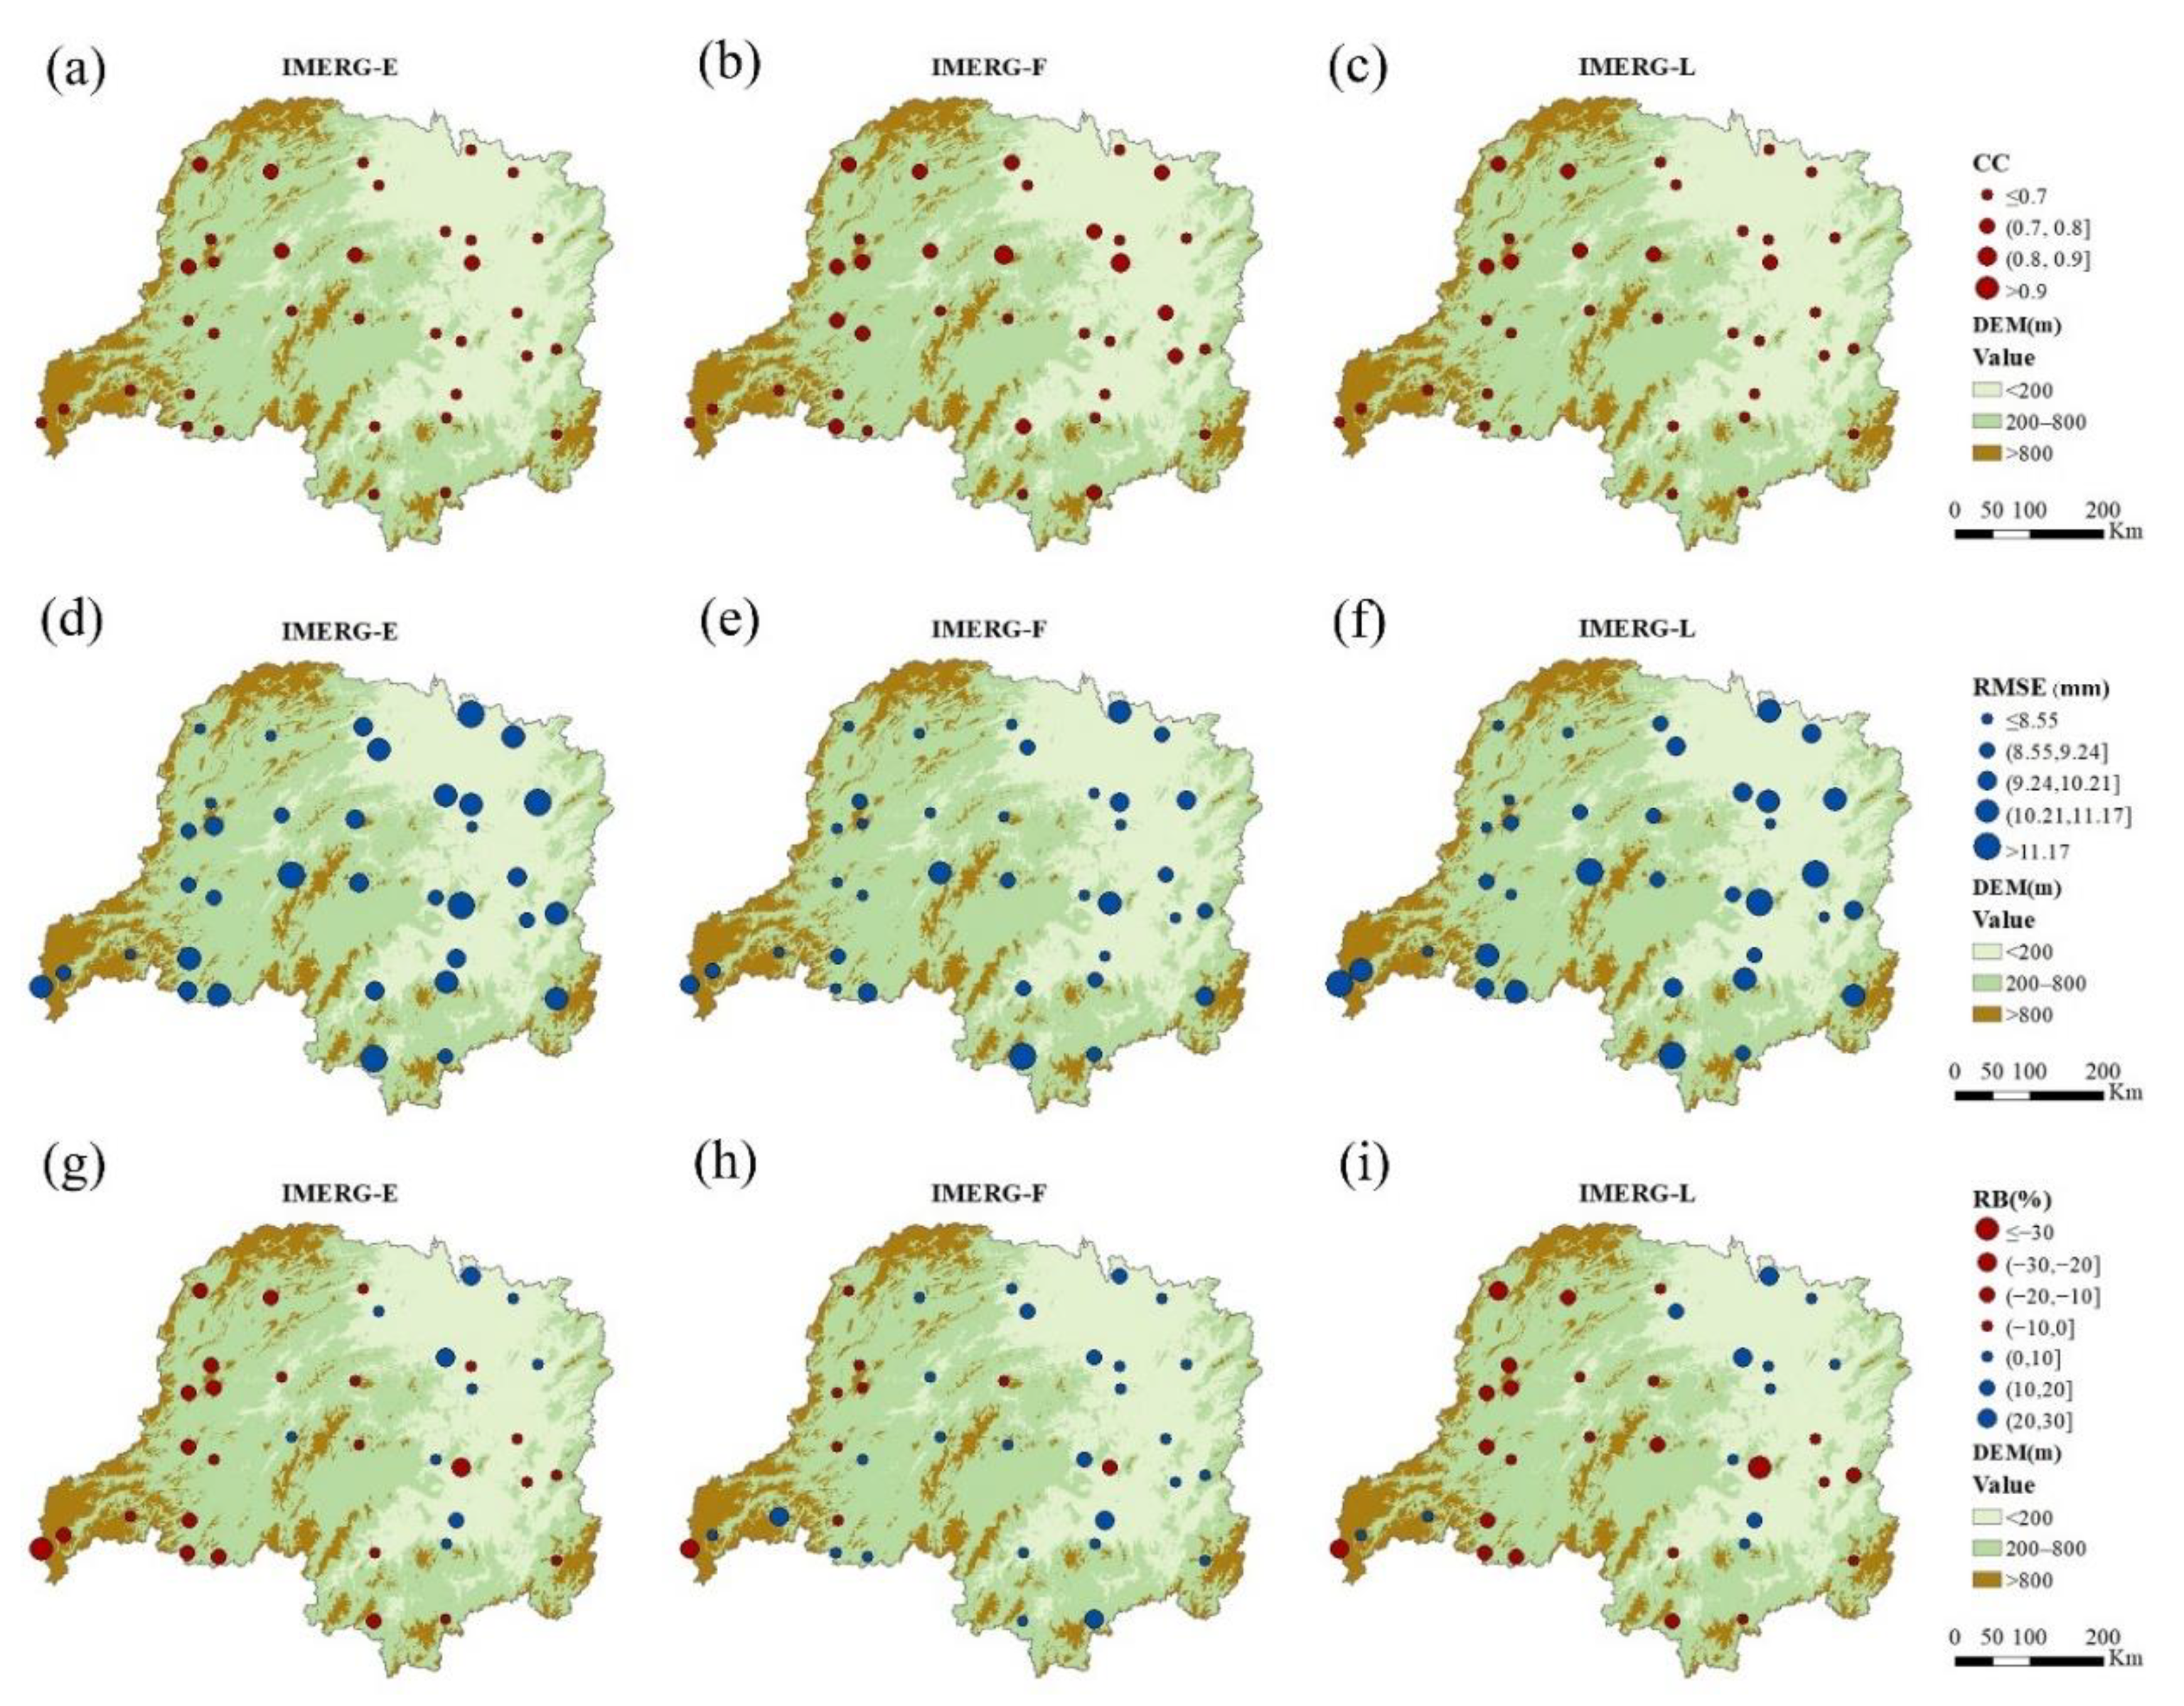
Figure 5 shows the spatial distributions of CC and RMSE values at a monthly scale for each station in the study area. For CC, the IPPs are characterized by the northern area, and IMERG-F performed better than the other satellite products. The station with the highest CC value was Sangzhi station, with 0.97 in IMERG-F, and the lowest was Nanyue station, with 0.53 in IMERG-E. The same improvement can be seen in the RMSE. In the IPPs, most of the Dongting Lake basin was found to be overestimated. The underestimated area was smaller than the overestimated area from the western mountains to the eastern part of the basin. Combined with the topography of the basin, the overestimated extremes of the precipitation data were observed to occur in the western and southern mountainous areas with high topography, while the underestimated extremes were observed in the Hengyang basin centered on Nanyue station.
4.3. Seasonal Assessment
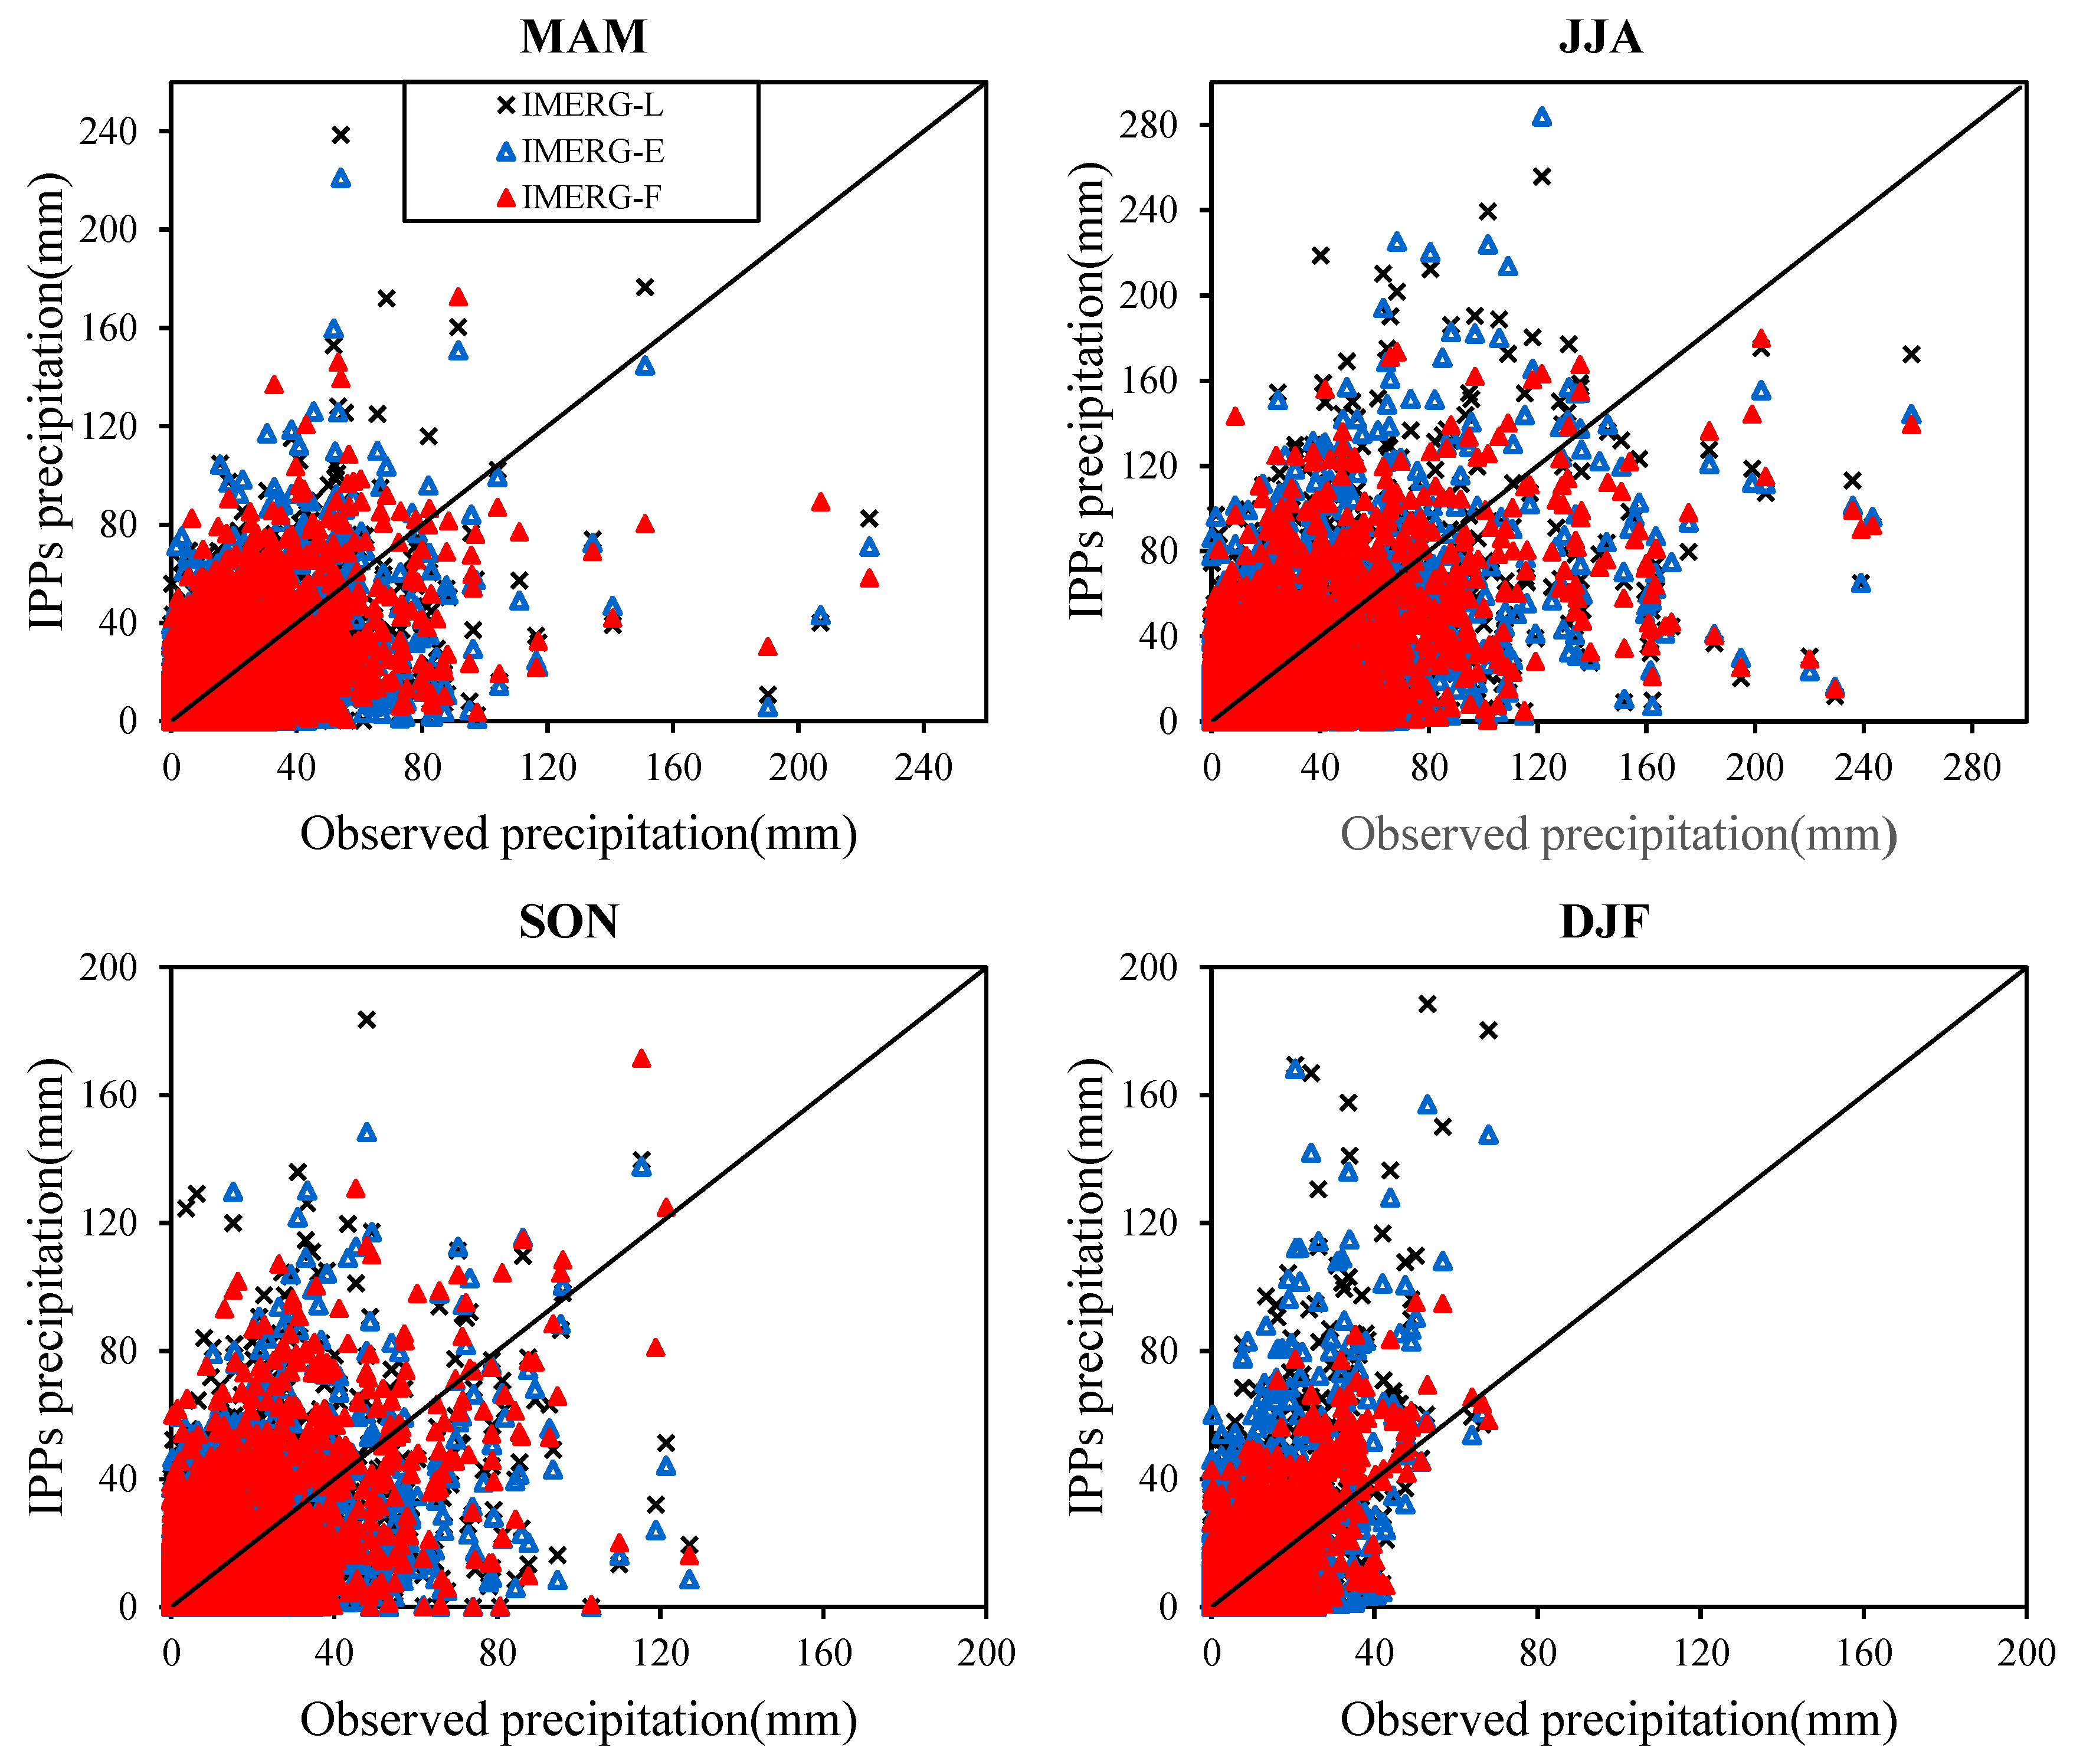
To determine the regional differences in the ability of IMERG to depict the seasonal evolution of precipitation, we examined the horizontal distribution of precipitation over the Dongting Lake basin for the four seasons: spring (March to May, MAM), summer (June to August, JJA), autumn (September to November, SON), and winter (December to the following February, DJF). The scatter plots shown in
Figure 6 were generated based on the seasonal daily precipitation values estimated by observed and IMERG data from March 2015 to February 2021.
Figure 6 shows the scatter plots of IMERG-F, IMERG-L, and IMERG-E against the rain gauge precipitation during the whole period and at a seasonal scale. Here, IMERG-F is the closest to the 1:1 line and was found to be strongly correlated with rain gauge precipitation every season. In DJF, when there was less precipitation, IMERG-F presented the most strongly concentrated distribution of precipitation. The fitting effect was also better than that of the other satellite products.
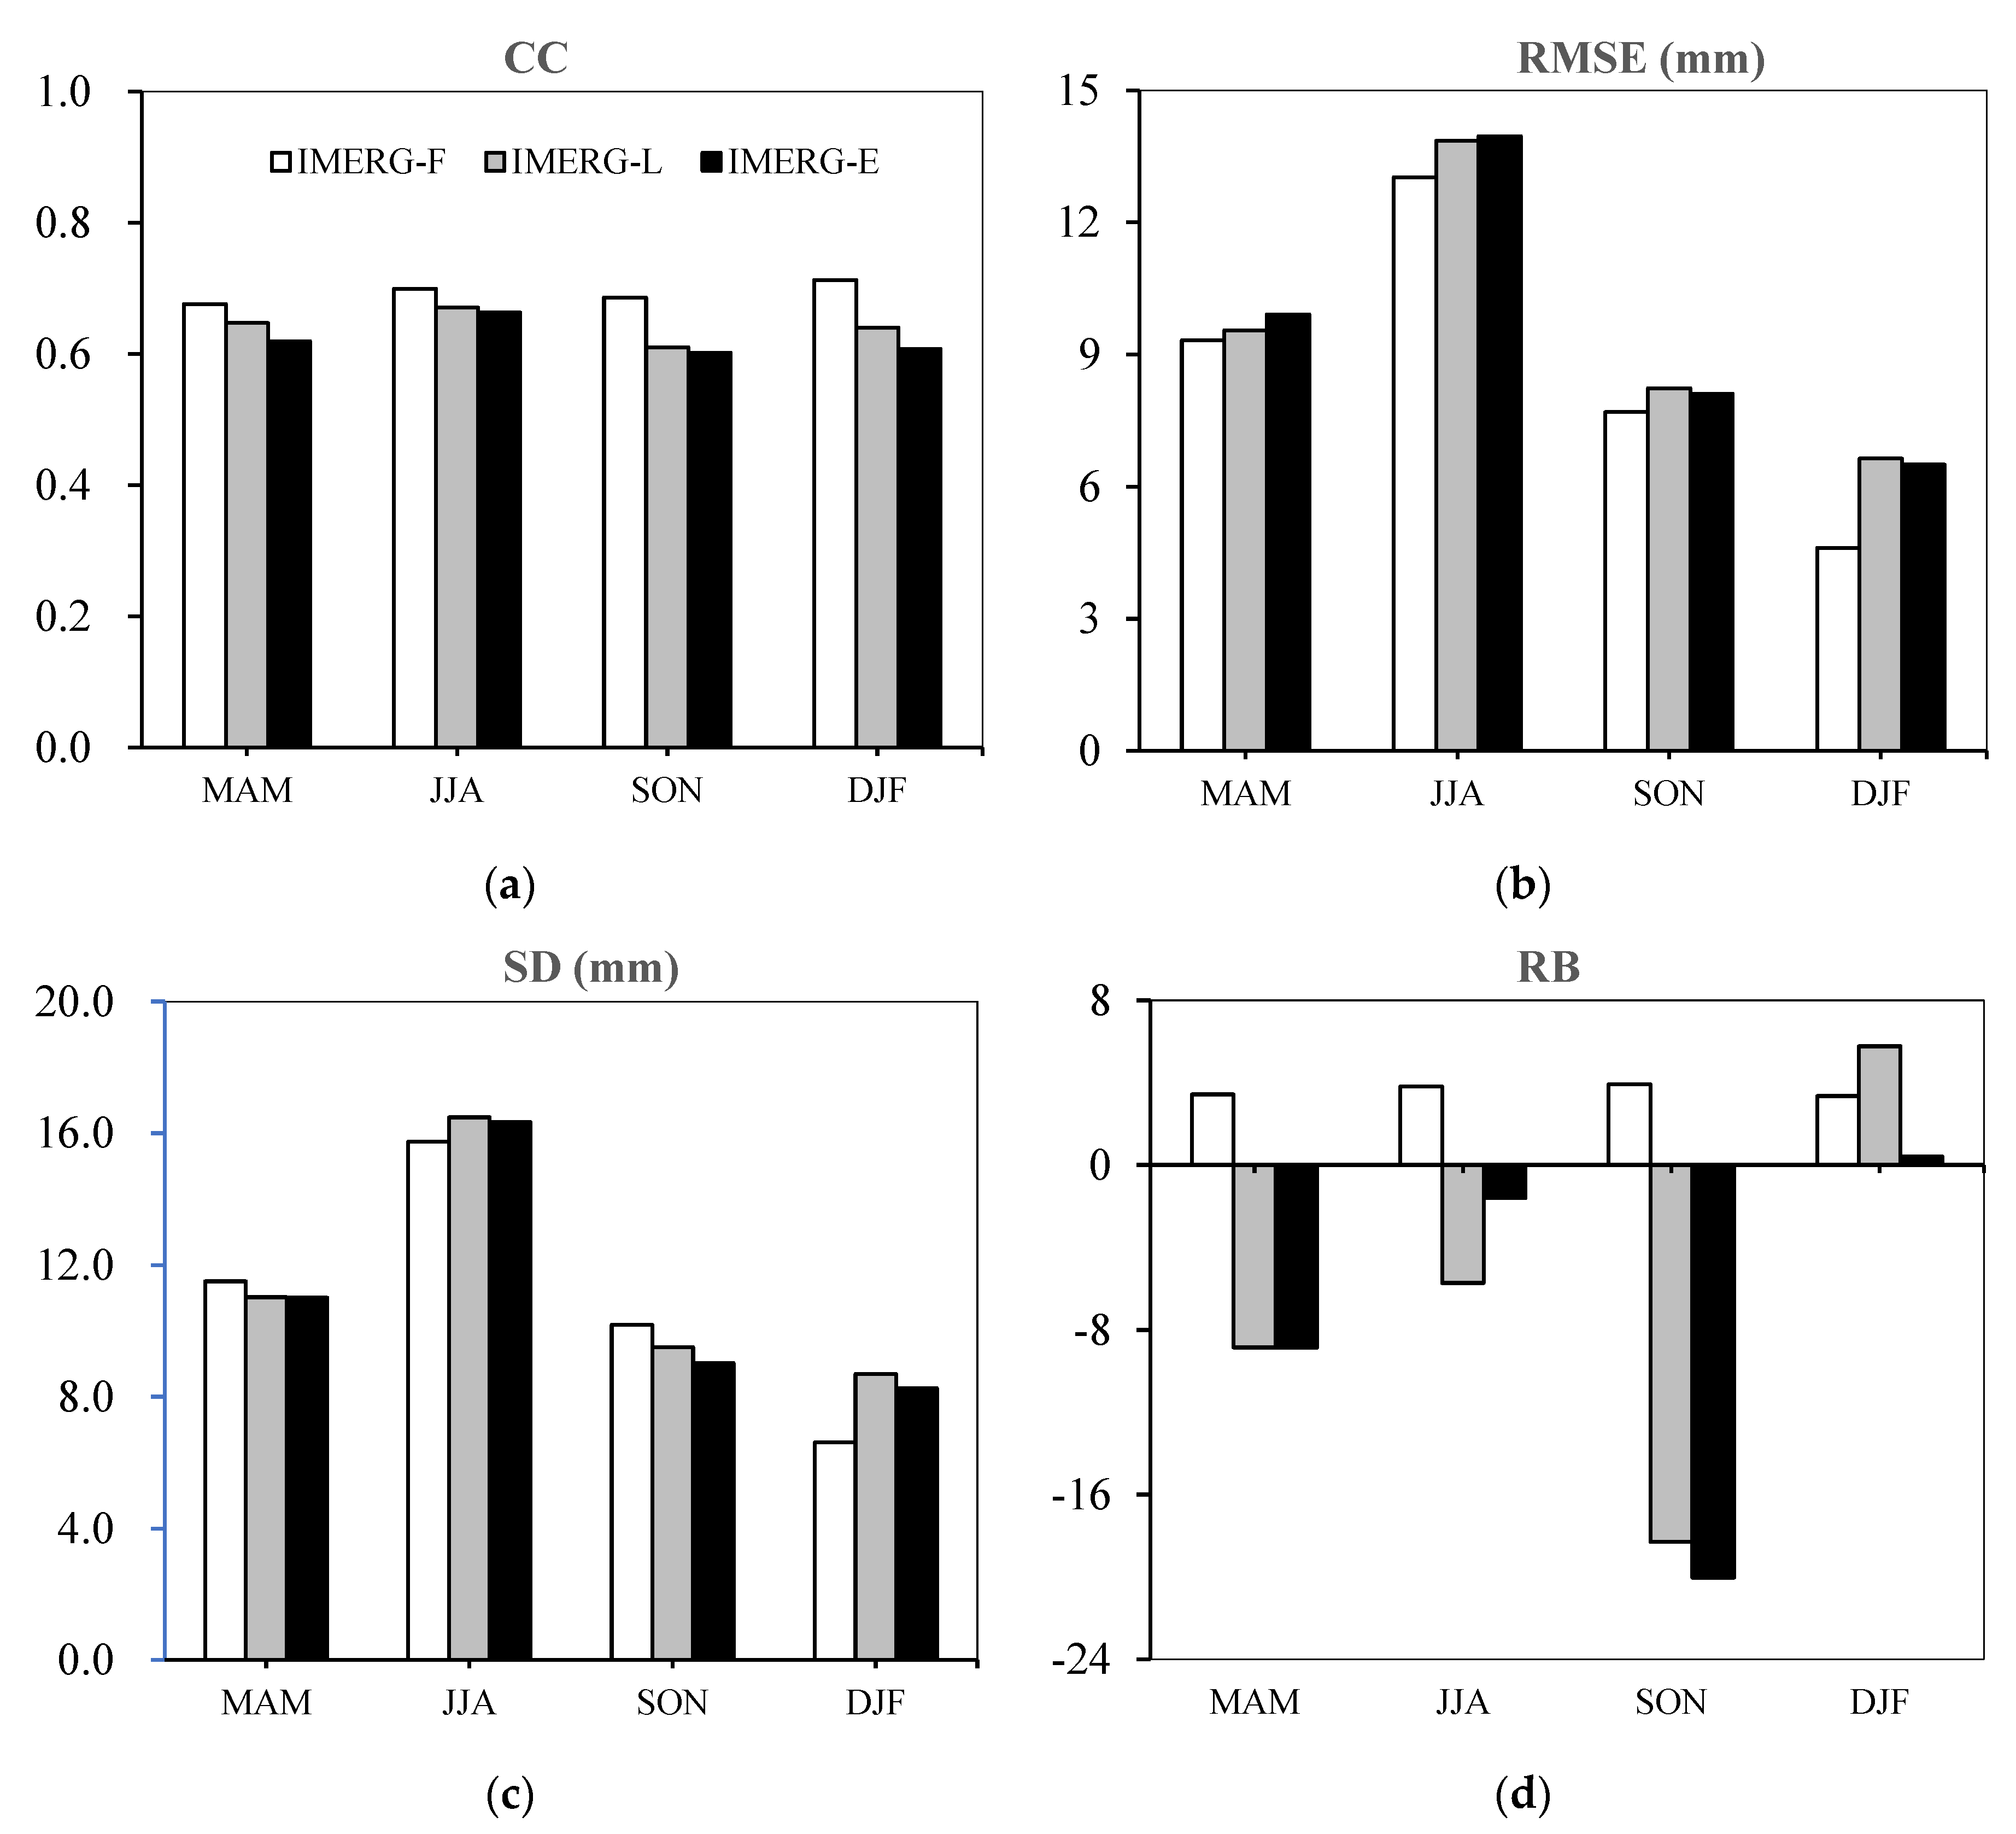
Figure 7 shows the statistics of CC, RMSE, SD, and RB. The CC of the IMERG-F in any season related to the observed precipitation was the best, followed by that of IMERG-L. The goodness of fit was the highest in DJF with IMERG-F (CC = 0.70) and the lowest in SON IMERG-E (CC = 0.56). Furthermore, the highest RMSE and SD in JJA were observed for IMERG-E, with 13.96 and 16.34 mm, respectively. This result indicates that the fluctuation between summer data and measured precipitation data was the greatest, with the winter being the most stable. There are two reasons for this result. First, the precipitation in the study area is concentrated in summer, due to the uneven distribution of annual mean precipitation and the diversity of precipitation types (e.g., convection, fronts, and topography). Second, this result may be due to the variation in precipitation, temperature, and radar reflectance across seasons. IPP products overestimate winter precipitation in terms of RB values, while IMERG-F provides overestimations in every season (3.43% in spring, 3.81% in summer, 3.91% in autumn, and 3.34% in winter). In contrast, negative IMERG-E and IMERG-L RB values were found to underestimate spring, summer, and fall precipitation. This underestimation was most severe in fall, with −20.04 and −18.30, respectively. The RB values of JJA and DJF were the smallest, indicating that IMERG offers better performance in detecting extreme precipitation. For the seasonal RMSE, IMERG-F had lower values than IMERG-E and IMERG-L in all seasons, indicating that IMERG-F estimates better agreed with the station observations. Overall, IMERG-F provided the best observations of seasonal precipitation among all IPPs.
To analyze the spatial distribution of errors between satellite precipitation data and ground observation data in the basin, the Kriging interpolation method was used to interpolate the ground seasonal precipitation data to obtain the spatial distribution of measured seasonal precipitation, as shown in
Figure 8. Under the influence of the monsoon climate, the precipitation distribution in the Dongting Lake basin varies significantly in different seasons and regions. the precipitation of the IMERG-F product was found to be closest to the ground precipitation, with an average relative error of only 3.6%, while that of the IMERG-L product was as high as −8.7%. The four statistical values of CC, RB, RMSE, and SD of the IPP product in winter indicate that the winter IPPs have higher accuracy in precipitation estimation, while the highest accuracy of precipitation estimation is obtained by the MERG-F product. The deviation is the highest in summer and lowest in autumn. The seasonal average of the daily data shows that IPPs perform well in DJF, with high accuracy in the Dongting Lake basin. The deviations between satellite precipitation and ground observations were largest in MAM and JJA and smaller in SON and DJF.
Seasonal averaging of the daily data indicates that IMERG-F performs well in all seasons in the central Dongting Lake basin, while other satellite products are not accurate. The precipitation centers are different in each season due to different rainfall types. The runoff in the Dongting Lake basin is of the rainfall recharge type. Although there is a small amount of snow in winter, most snow is lost due to evaporation and infiltration, and the recharge in the river is very small. Due to the influence of monsoon circulation, precipitation is mostly concentrated in spring and summer, and floods occur in the rivers accordingly. The concentration and occurrence of precipitation vary due to physical and geographical conditions. Overall, our analysis of seasonal biases shows that the IMERG-F average daily precipitation in the Dongting Lake basin outperformed the IMERG-E and IMERG-L daily products from March 2015 to February 2021, offering high accuracy in each season and making IMERG-F a good candidate dataset for water-management studies.
4.4. Annual Assessment
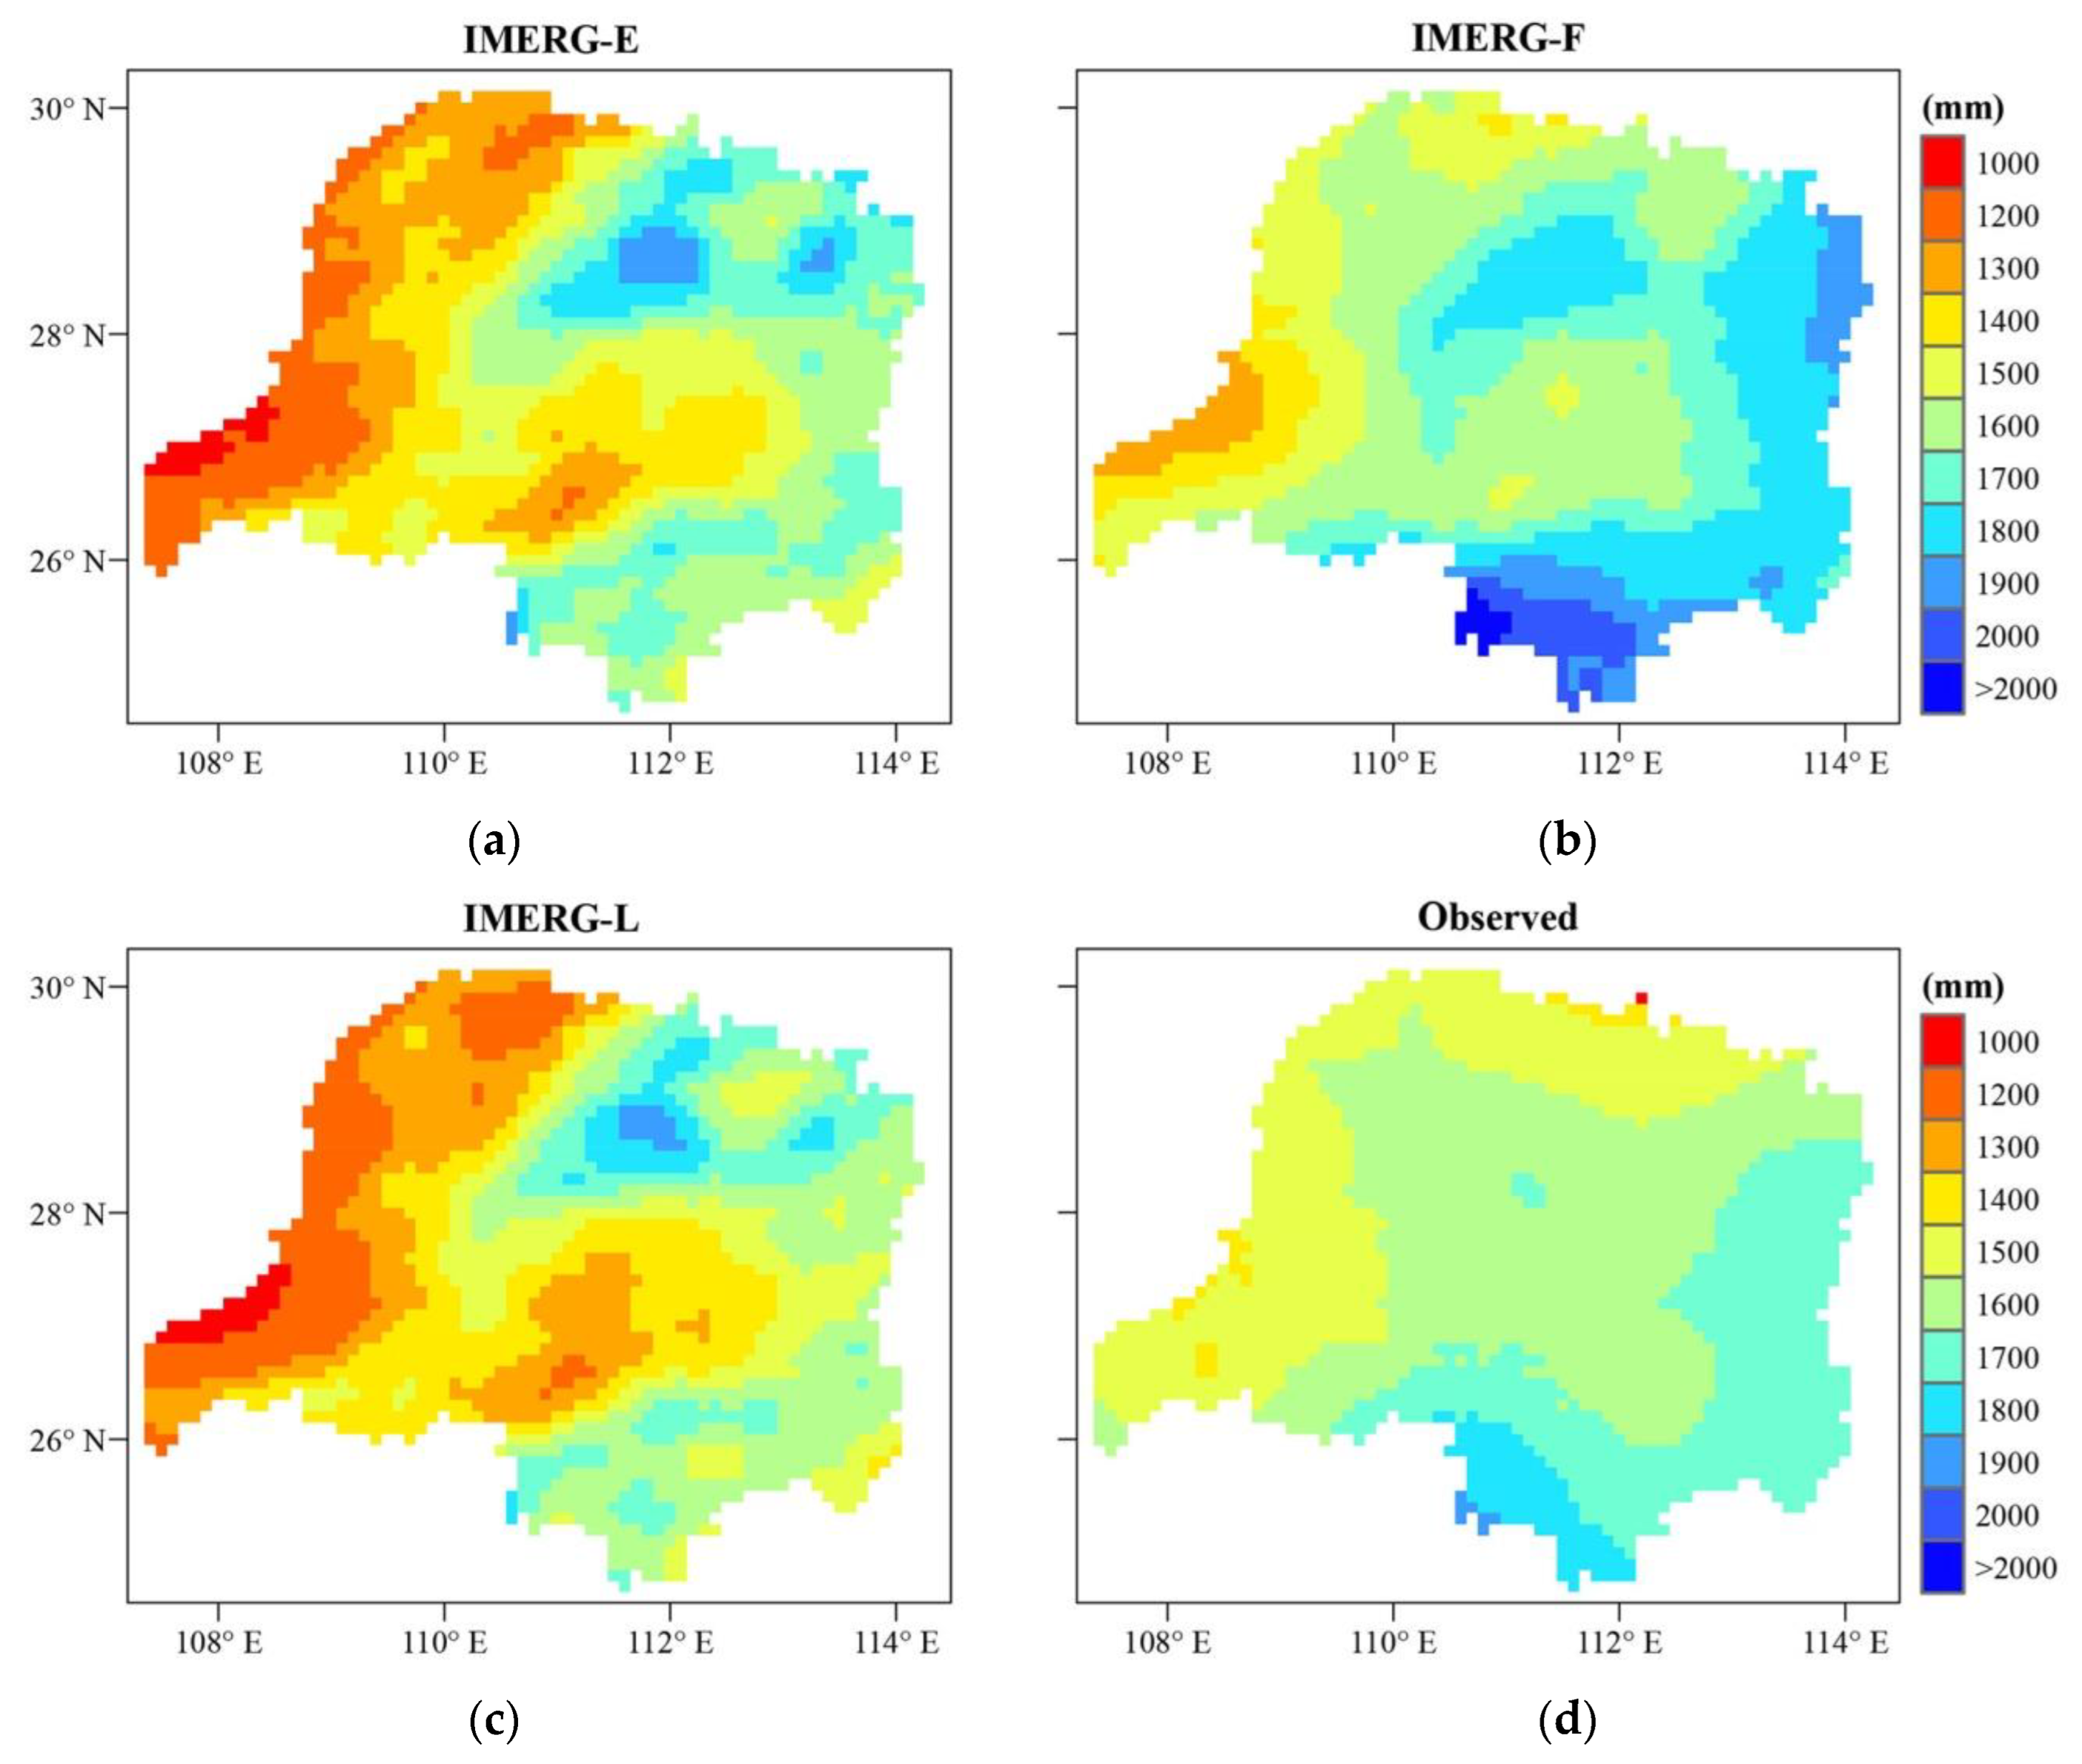
Based on the measured data of 36 meteorological stations in the Dongting Lake basin, simple kriging interpolation was used to generate the average annual precipitation spatial distribution map of the basin from 2015 to 2020. This map was then compared with the annual precipitation spatial distribution map of the IPPs.
Figure 9 shows that the spatial patterns of the four data sets are similar, with more abundant precipitation in the central, southern, and eastern parts of the basin and less precipitation in the western and northern parts of the basin, with precipitation decreasing from southeast to northwest. Anhua, Pingjiang, and Zhuzhou have greater annual precipitation compared to other places, with an average annual precipitation of more than 1500 mm, which is consistent with the actual precipitation distribution in the Dongting Lake basin. Here, IMERG-F mostly overestimates precipitation (ranging from 1185 to 2153 mm), mainly in the southeastern part of the Dongting Lake basin. In addition, IMERG-E and IMERG-L underestimate precipitation over space, and IMERG-F most accurately represents the spatial distribution characteristics of annual precipitation. Overall, the IMERG-F products show a good ability to capture the spatial characteristics of annual mean precipitation compared to station observations.
4.5. Precipitation Detection Capability Assessment
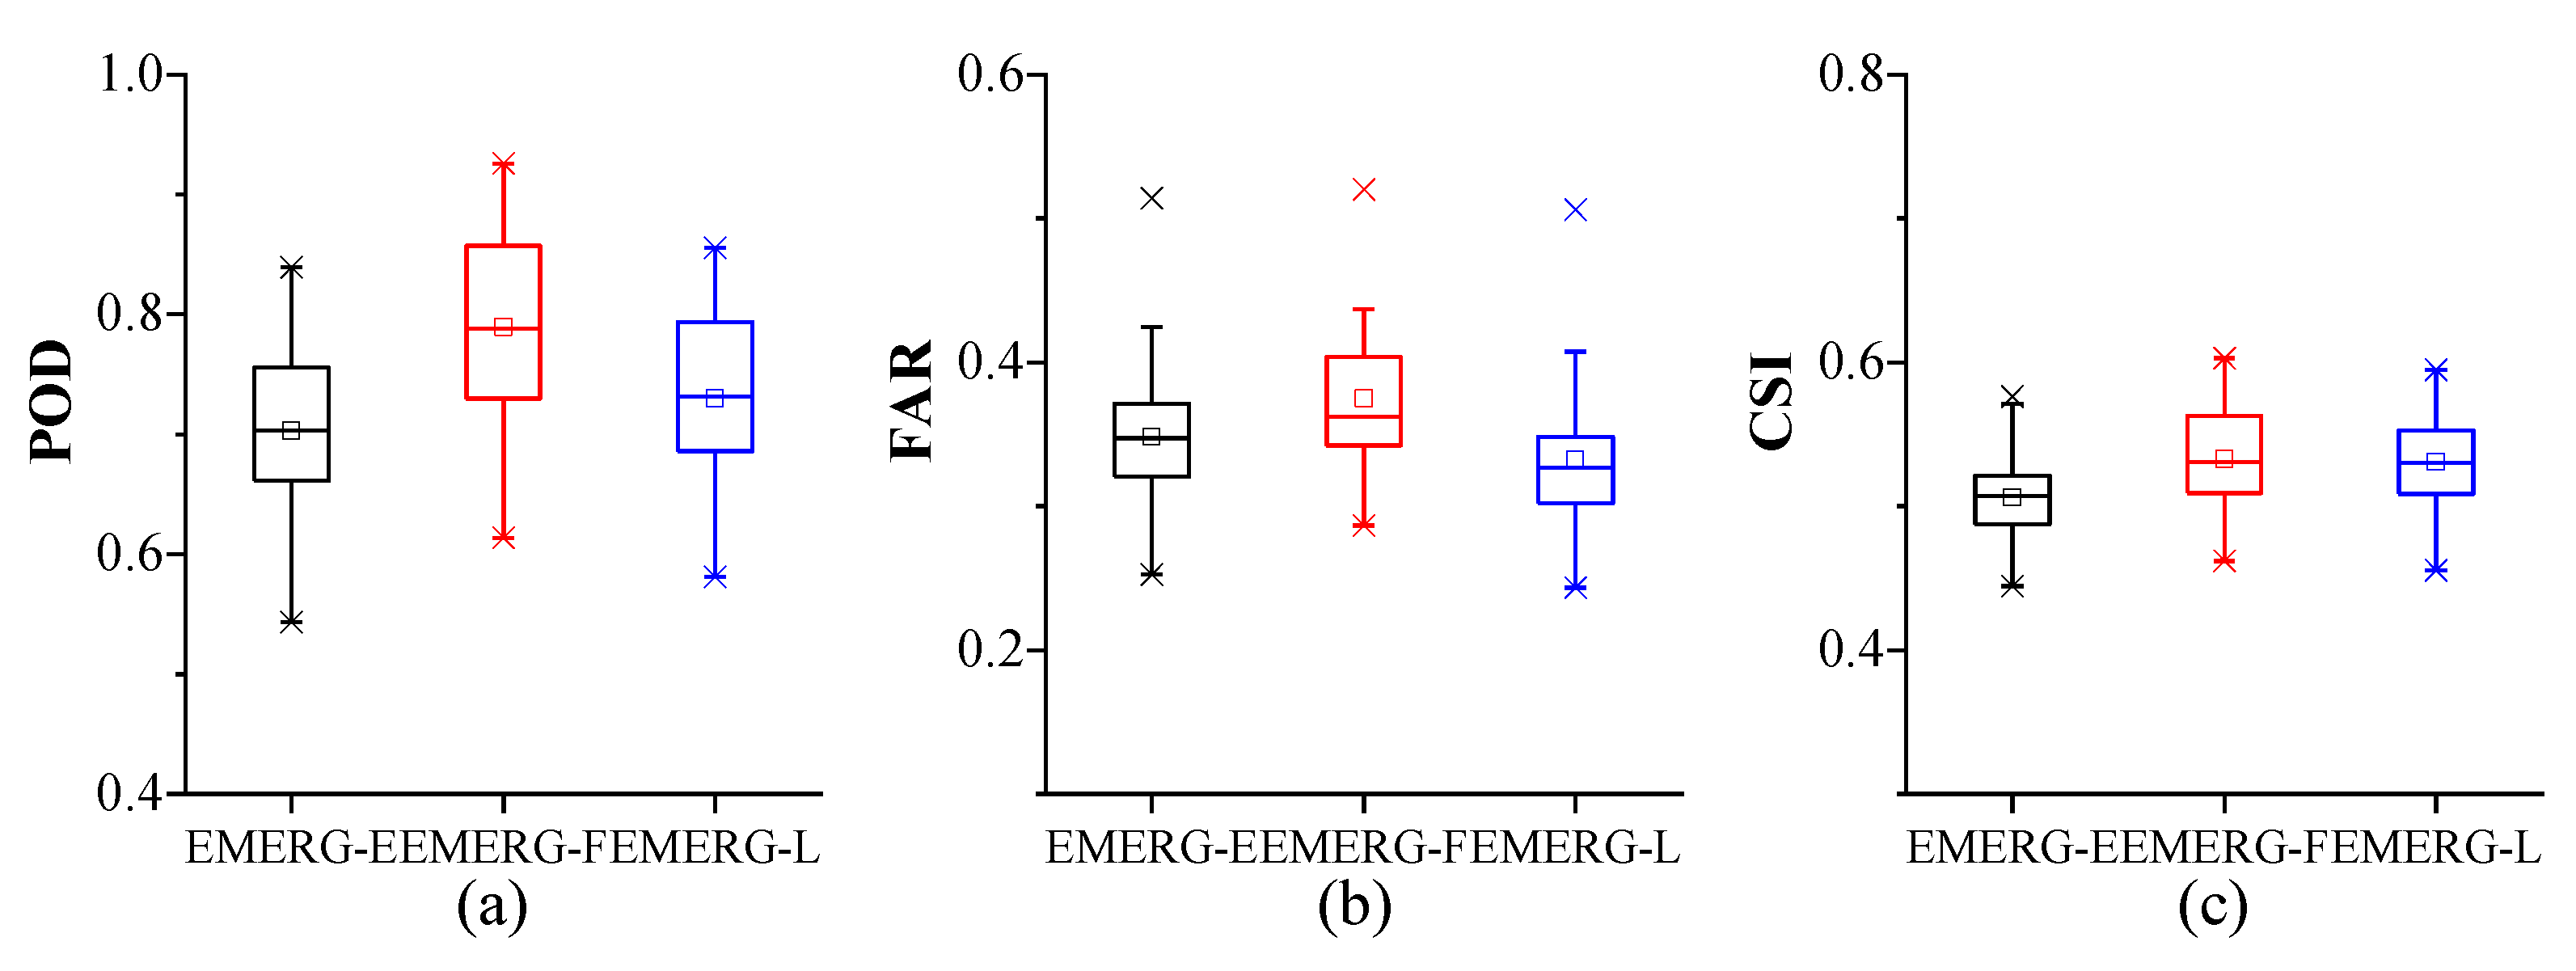
Concerning the detection of 1 mm/d as the precipitation threshold shown in
Figure 10, the three detection metrics in boxplots indicate the median detection capability between the IPPs and ground sites and the first and third quartiles (the bottom and top of the box, respectively). The size of the median POD value increased from 0.7 in IMERG-E to 0.79 in IMERG-F. However, IMERG-F showed an improvement over IMERG-E, with a value difference of 0.09. The median FAR in IMERG-L was lower than that of the other satellite products (0.34 for IMERG-L, 0.35 for IMERG-E, and 0.38 for IMERG-F), indicating a decreased error in IMERG-L. CSI, however, showed a minor improvement in IMERG-F compared to IMERG-E, yielding median values of 0.53 and 0.51, which indicates that the ability of IMERG-F satellite precipitation to estimate the occurrence of precipitation events is relatively high.
With 1 mm/d as the precipitation threshold, IPPs showed a similar ability to capture precipitation events; overall, the POD and CSI of IMERG-F were better than those of IMERG-E and IMERG-L, indicating slightly higher detection and success rates in micro-precipitation.
4.6. Daily Comparisons for One Extreme Rainfall Event
To better evaluate the accuracy of the IMERG products for extreme rainfall events in Dongting Lake, we chose a regional extreme precipitation event as a case study. Three heavy precipitation events occurred from 22 June to 4 July 2017. The cumulative precipitation in the Dongting Lake system of the Yangtze River basin during these 13 days was nearly 90% higher than that during the normal period, ranking first for the same period since continuous data collection began in 1961 [
41].
The performance of the IPPs in estimating the precipitation of the latest major flood in the Dongting Lake basin, which occurred between 22 June and 4 July in 2017, is evaluated in this section.
Figure 11 shows the results of the statistical metrics of the IPPs during the 2017 extreme rainfall event. The correlation performance of IMERG-F was better than that of the others, and the highest CC was 0.98 during the flood period. RMSE exhibited the same characteristics, and the lowest RMSE was 7.67 mm. In addition, all the IPPs overestimated the precipitation amount in the flood period. IMERG-F had the highest systematic bias among the products. In contrast, IMERG near-real-time products, IMERG-E, and IMERG-L presented lower bias than IMERG-F in estimating precipitation during the flood season.
Table 4 partitions all rainfall station sites by elevation into those above 800 m, those at 200–800 m, and those below 200 m, as shown in
Table 4. The three indicators were found to perform best at 200–800 m, indicating that both high and low elevation areas are not conducive to the satellite detection of extreme precipitation. However, regardless of elevation changes, among the three IMERG products, the CC value of IMERG_F was the best, and the RB value IMERG_F was the worst. The RMSE values did not change much, but IMERG_F performed the best.
Similar to the whole period assessment, the IMERG-F product correlated best with the precipitation gauges in the Dongting Lake basin. IMERG-E and IMERG-L had the lowest overestimation of the precipitation amount, especially in areas frequently affected by monsoon flood events. In general, the ability of the satellites to identify rainstorms during the flood period was poor.
5. Discussion
Based on the results of our applicability analysis in the Dongting Lake basin, the IMERG-F precipitation product generally outperformed IMERG-E, IMERG-L, and its predecessor TRMM 3B42V7. IMERG-F correlated better than IMERG-E and IMERG-L, with rain gauge observations at all time scales (
Figure 2,
Figure 5,
Figure 7 and
Figure 9), and on monthly scales, the CC value of IMERG-F was significantly higher than that of Yang Dong’s fit to the TRMM and the measured data from 1998 to 2011. Notably, IPPs had the lowest correlation at a daily scale, and the correlation gradually increased with an increase in time scale, which is consistent with the studies of Mantas [
42] and Tan et al. [
43]. Moreover, we compared the station precipitation with that obtained from satellite grid interpolation and found that the IMERG-F estimates were closer to the rain gauge data.
IMERG provided overestimations in spring, summer, and autumn, mainly because heavy rainfall events during winter in the Dongting Lake basin occurred less frequently and with lower rain intensity compared to those in spring, summer, and autumn, in addition to the inadequacy of IMERG for monitoring high-rain-intensity events, leading to seasonal differences in the overestimation interval. Many studies have shown that using ground-based data as a reference is prone to underestimating IMERG performance. Moreover, IMERG uncorrected data IMERG-E and IMERG-L overestimated low rain intensity and underestimated high rain intensity [
44]. Additionally, IMERG-F offers a reprocessed and gauged-adjusted product; the correction algorithm over-adjusted the precipitation value of the uncorrected data to improve the underestimation of high rainfall intensity, thus increasing the amount of various precipitation events and resulting in a relatively high false-alarm rate for heavy rainfall and heavy rainfall events. This high false-alarm rate caused the peak of the precipitation contribution of IMERG data to be shifted to the high rainfall intensity interval, which led to the peak intervals of ground and satellite data, further aggravating the overestimation problems of the IMERG data during extreme rainfall. In addition, the BIAS values of IMERG-E and IMERG-L were negative, while those of IMERG-F were positive, which means that the near-real-time IMERG products underestimated precipitation, whereas IMERG-F overestimated precipitation [
18].
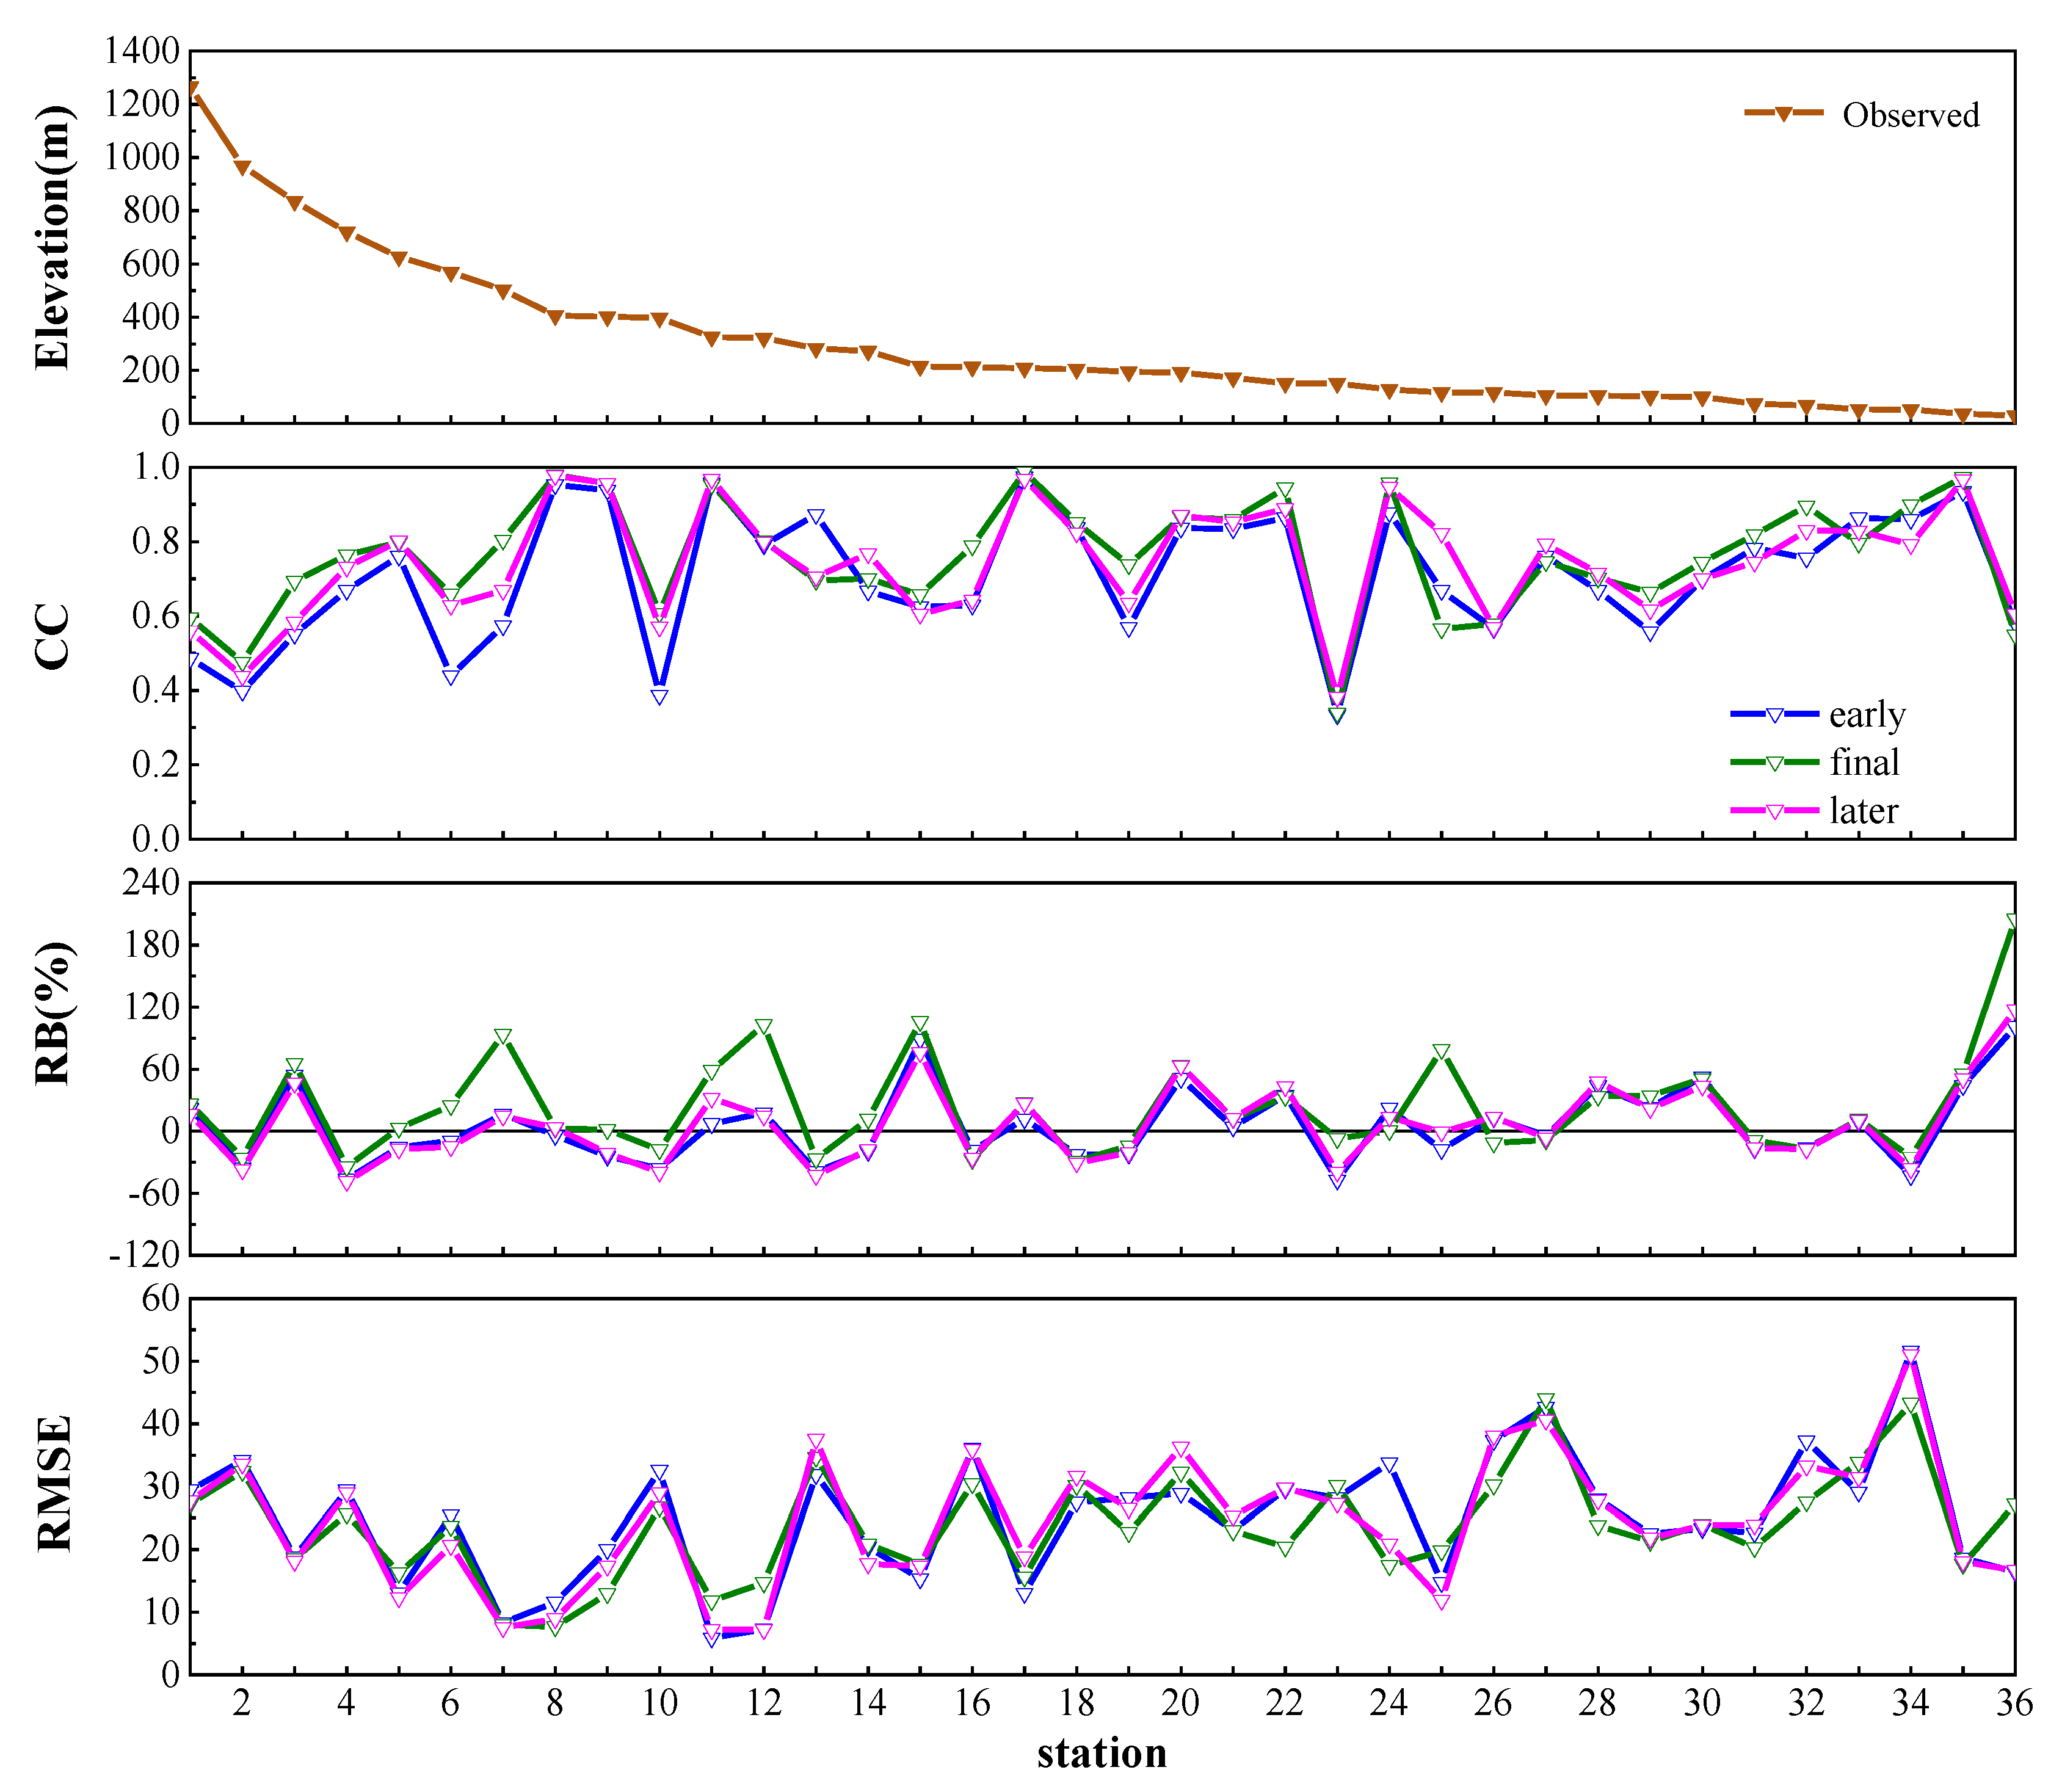
The results of the correlation analysis between daily and monthly precipitation and the altitude of IMERG data (
Table 2 and
Table 3) showed a significant negative correlation between the two, indicating that, as the altitude increased, the more the reanalyzed rainfall was underestimated, which might be related to the increase in actual rainfall due to altitude, which was not captured by satellite remote sensing. Within a certain altitude range, the degree of overestimation of precipitation by IMERG increased with an increase in altitude, which may be related to factors such as systematic errors and interpolation errors in the model. The significant relationship between the absolute values of RB and altitude in the three reanalyzed data further indicated that altitude is an important factor affecting the accuracy of reanalyzed precipitation data. In addition, the correlation between the rain gauge and IMERG was severely constrained by altitude. The best performance was obtained at mid-altitude (200–800 m). The correlation between satellite precipitation products and ground rainfall stations is related to the altitude and amount of precipitation, with weaker correlation at high altitudes and stronger correlations at low altitudes, similar to the findings of Qingfang Hu [
45]. The correlation was weaker in areas with low average annual precipitation and stronger in areas with high average annual precipitation, which is generally consistent with the conclusions reached by Linyong Wei [
46]. Due to topographic convection, IMERG can misestimate heavy precipitation, making the time series of all three IMERG products inaccurate. In addition to the influence of the complex topography of the study area, two factors should be considered: (1) the inherent differences between point gauge estimates (spatial points of temporal accumulation) and regional satellite precipitation (temporal snapshots of spatial aggregation); and (2) the inherent uncertainty of rain gauge data due to the high spatial and temporal variability of extreme rainfall.
To date, performance evaluations of IMERG satellite precipitation products have been carried out in several watersheds. The best correlation between IPPs and ground reference data was found for IMERG-F in the Dongting Lake basin. IMERG products offered the best performance in the upper Huaihe River basin in China with IMERG-F, while IMERG-E provided statistical performance comparable to that of IMERG-L, which is consistent with our results. However, in the study, IMERG-F provided acceptable performance in daily hydrological simulations, while both IMERG-E and IMERG-L offered poor hydrological utility [
47]. In contrast, the IMERG product provided a high correlation and the lowest estimation errors only with ground data from the TSL River Basin, where runoff was evaluated through the SWAT modeling application. Additionally, IMERG precipitation showed excellent potential for hydrologic impact assessments [
48]. This phenomenon may be attributed to the fact that IMERG precipitation estimates are influenced by topographic conditions, land and sea position, and monsoon climate. In a future study, we will explore the hydrological effects of IMERG satellite products, as well as the hydrological effects of rainfall products from satellite fused ground sites, in the Dongting Lake basin.
6. Conclusions
Based on the precipitation data of 36 meteorological stations in the Dongting Lake basin from September 2014 to February 2021, the present study focused on the accuracy of IPPs in the same area over the same time period. The precision research results of IMERG-E, IMERG-F, and IMERG-L precipitation data in the Dongting Lake basin were obtained by analyzing different statistical indexes at daily, monthly, seasonal, and annual scales from point and surface perspectives. To better understand the performance of extreme precipitation, a specific rainfall event (22 June to 4 July 2017) was selected as a case study. The conclusions are as follows.
(1) At a monthly time scale, IMERG-F (2014–2021) data with precipitation data from ground stations had a CC value of 0.9, which is better than the value of TRMM (1998–2011) data (CC = 0.89) [
49], as well as IMERG-E (CC = 0.79) and IMERG-L (CC = 0.79), over the same period. With an increase in the time scale, the difference between the accuracy of satellite precipitation products and that of observation stations gradually narrowed. At the overall time scale, the average spatial correlation coefficient between IMERG-F and the observed station was significantly higher than that between IMERG-E and IMERG-L. After comparing the RMSE and RB indicators in the IPPs, IMERG-F was found to more capable of reflecting the spatial patterns of precipitation.
(2) According to the analysis of the spatial and temporal distribution characteristics of precipitation, IMERG-F had the tendency to overestimate monthly and quarterly precipitation, while IMERG-E and IMERG-L showed the tendency to underestimate precipitation. IPPs were able to present the spatial distribution characteristics of higher precipitation in the southeast and lower precipitation in the northwest of the Dongting Lake basin. The spatial distribution also showed high correlation with the site data.
(3) IMERG satellite precipitation was found to offer strong daily precipitation event acquisition and tracking capabilities and could detect the occurrence of most precipitation events. IMERG-F had a stronger ability to capture precipitation than the other products. Additionally, IMERG-F provided only small overestimates when estimating the occurrence of precipitation events, while IMERG-E and IMERG-L usually provided large underestimates. The false-alarm ratio of IMERG-F was also lower.
(4) When analyzing the accuracy of the satellite products at different elevations, the trends of precipitation estimation by the three sets of products within different elevation zones were as follows: overestimated precipitation at low elevations, better precipitation prediction capabilities at medium elevations, and underestimated precipitation at high elevations. The deviations of precipitation in high altitude areas were also larger.

 ,
, 


