

Rainfall in the Urban Area and Its Impact on Climatology and Population Growth
 ,
,  , ,
, ,  , ,
, ,  ,
,  ,
,  , , , , , ,
  , and
, and 
Abstract
:1. Introduction
2. Materials and Methods
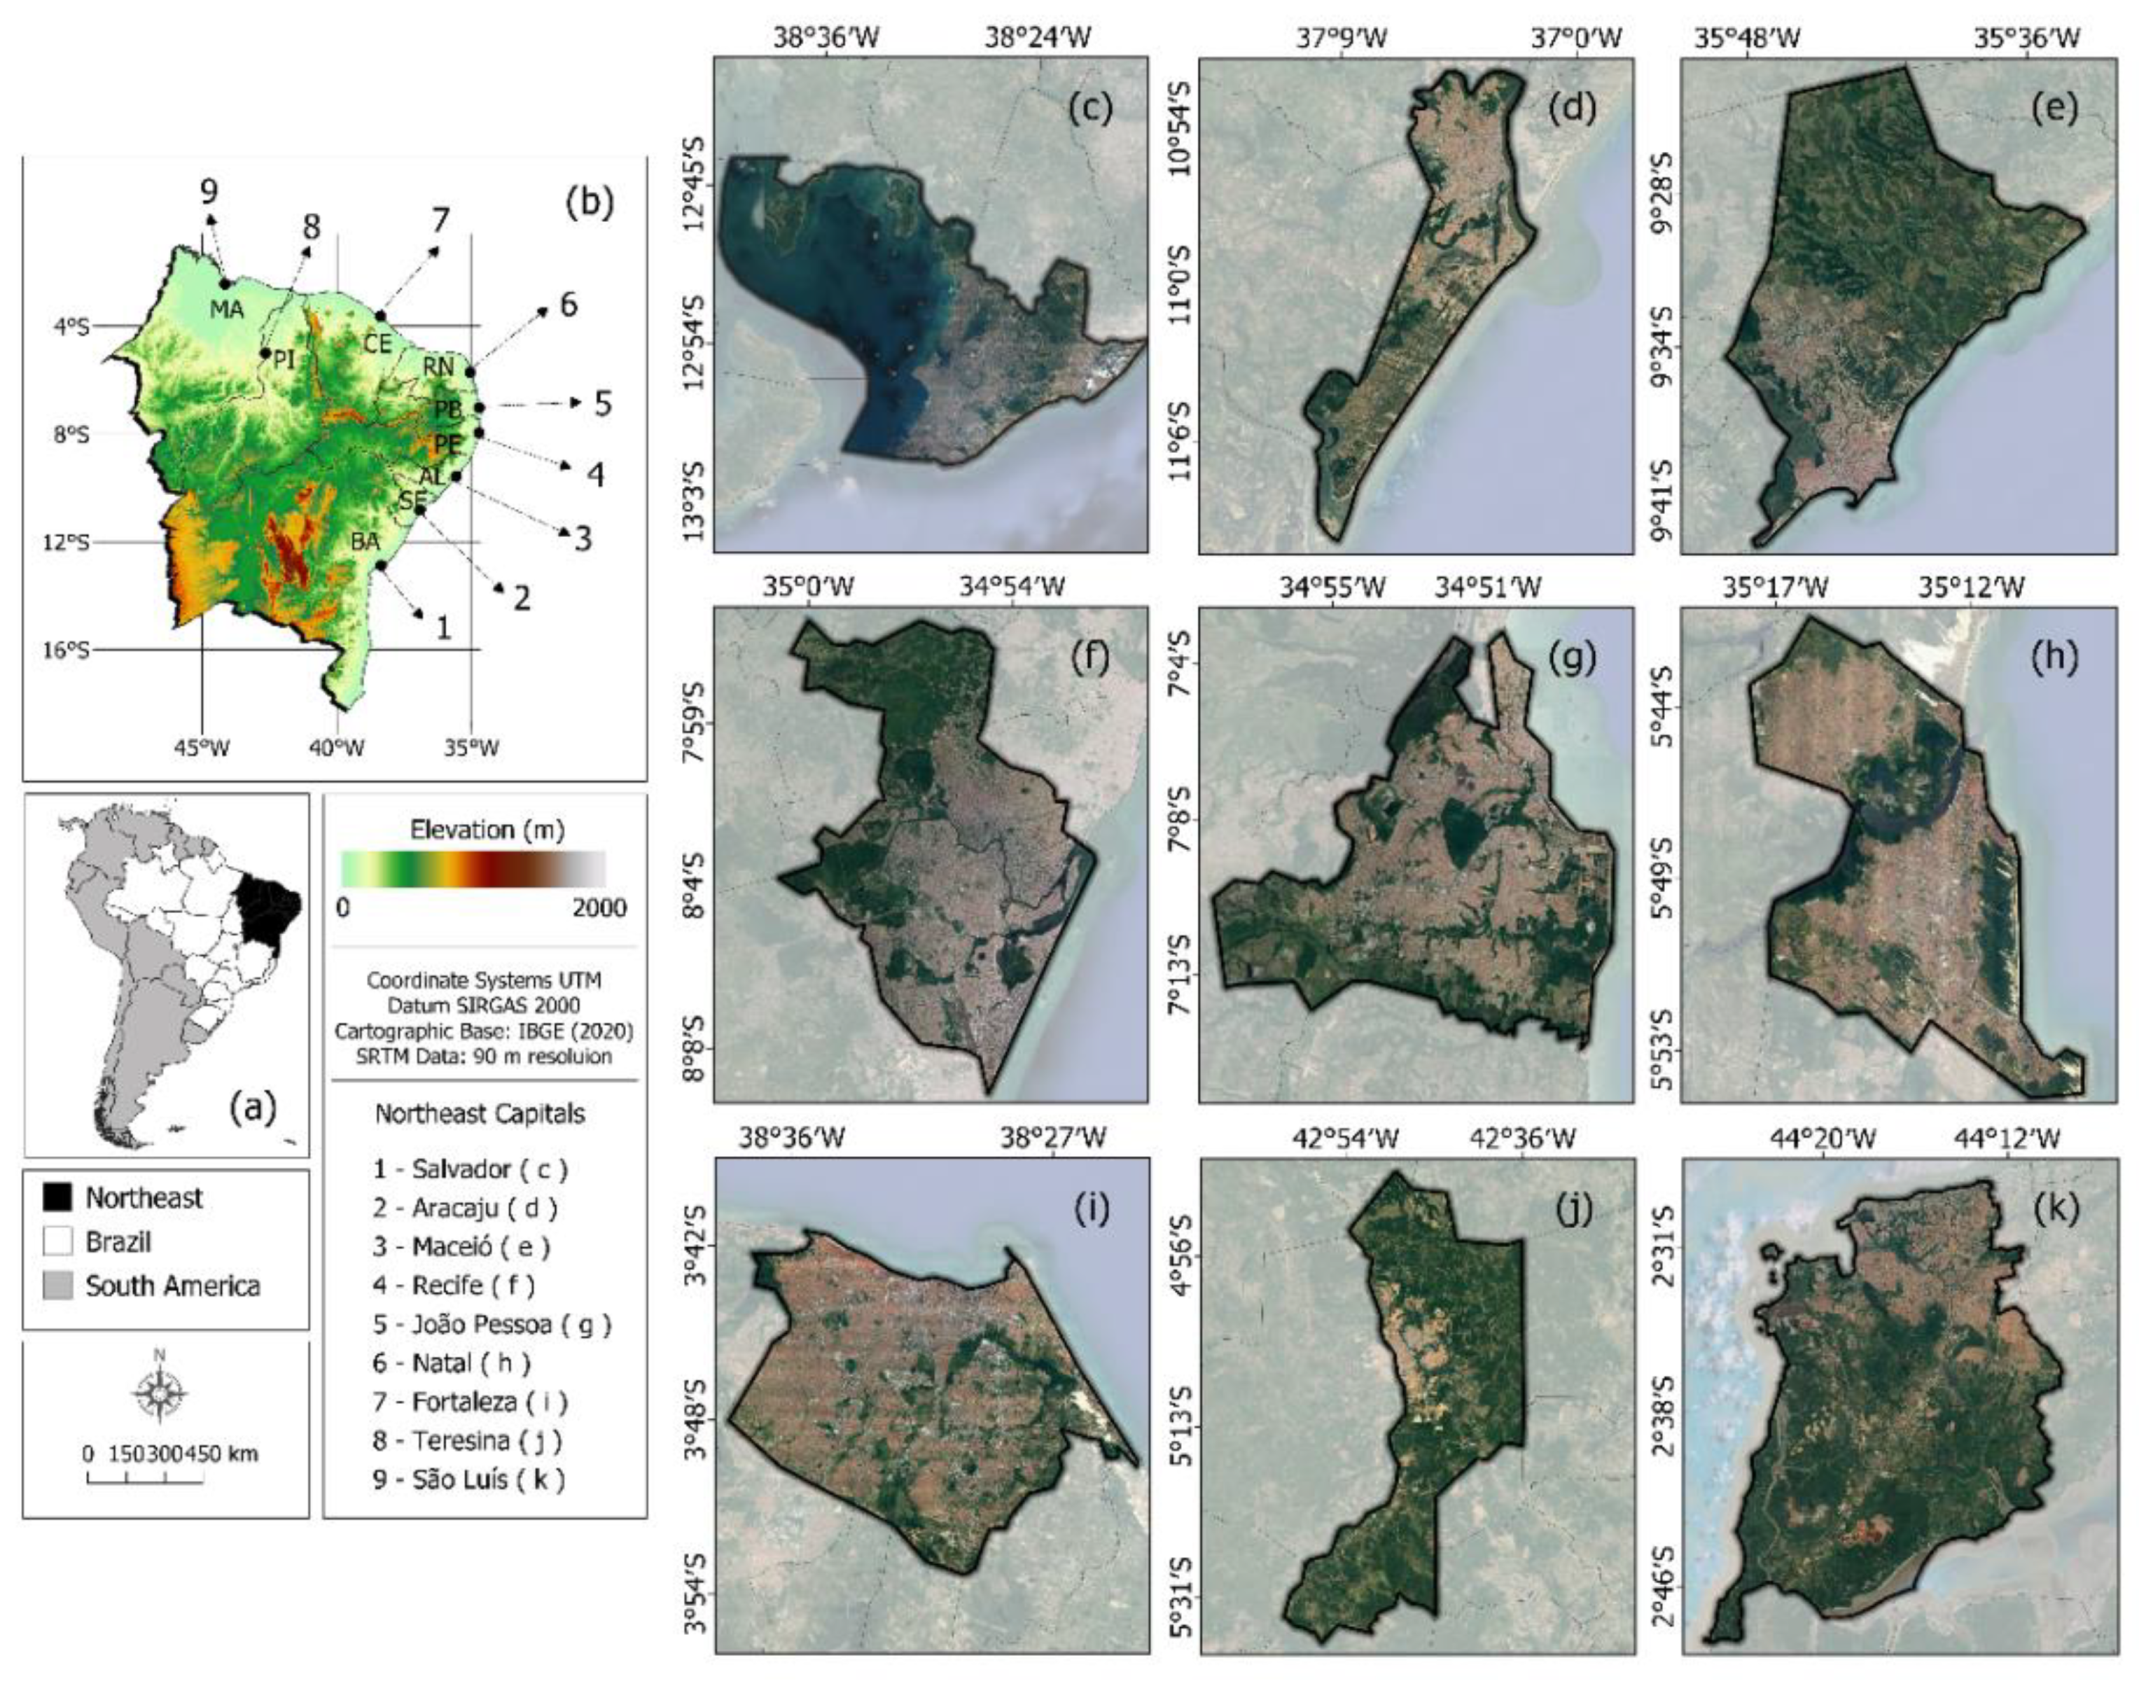
2.1. Study Area
2.2. Rainfall Data and Evaluation
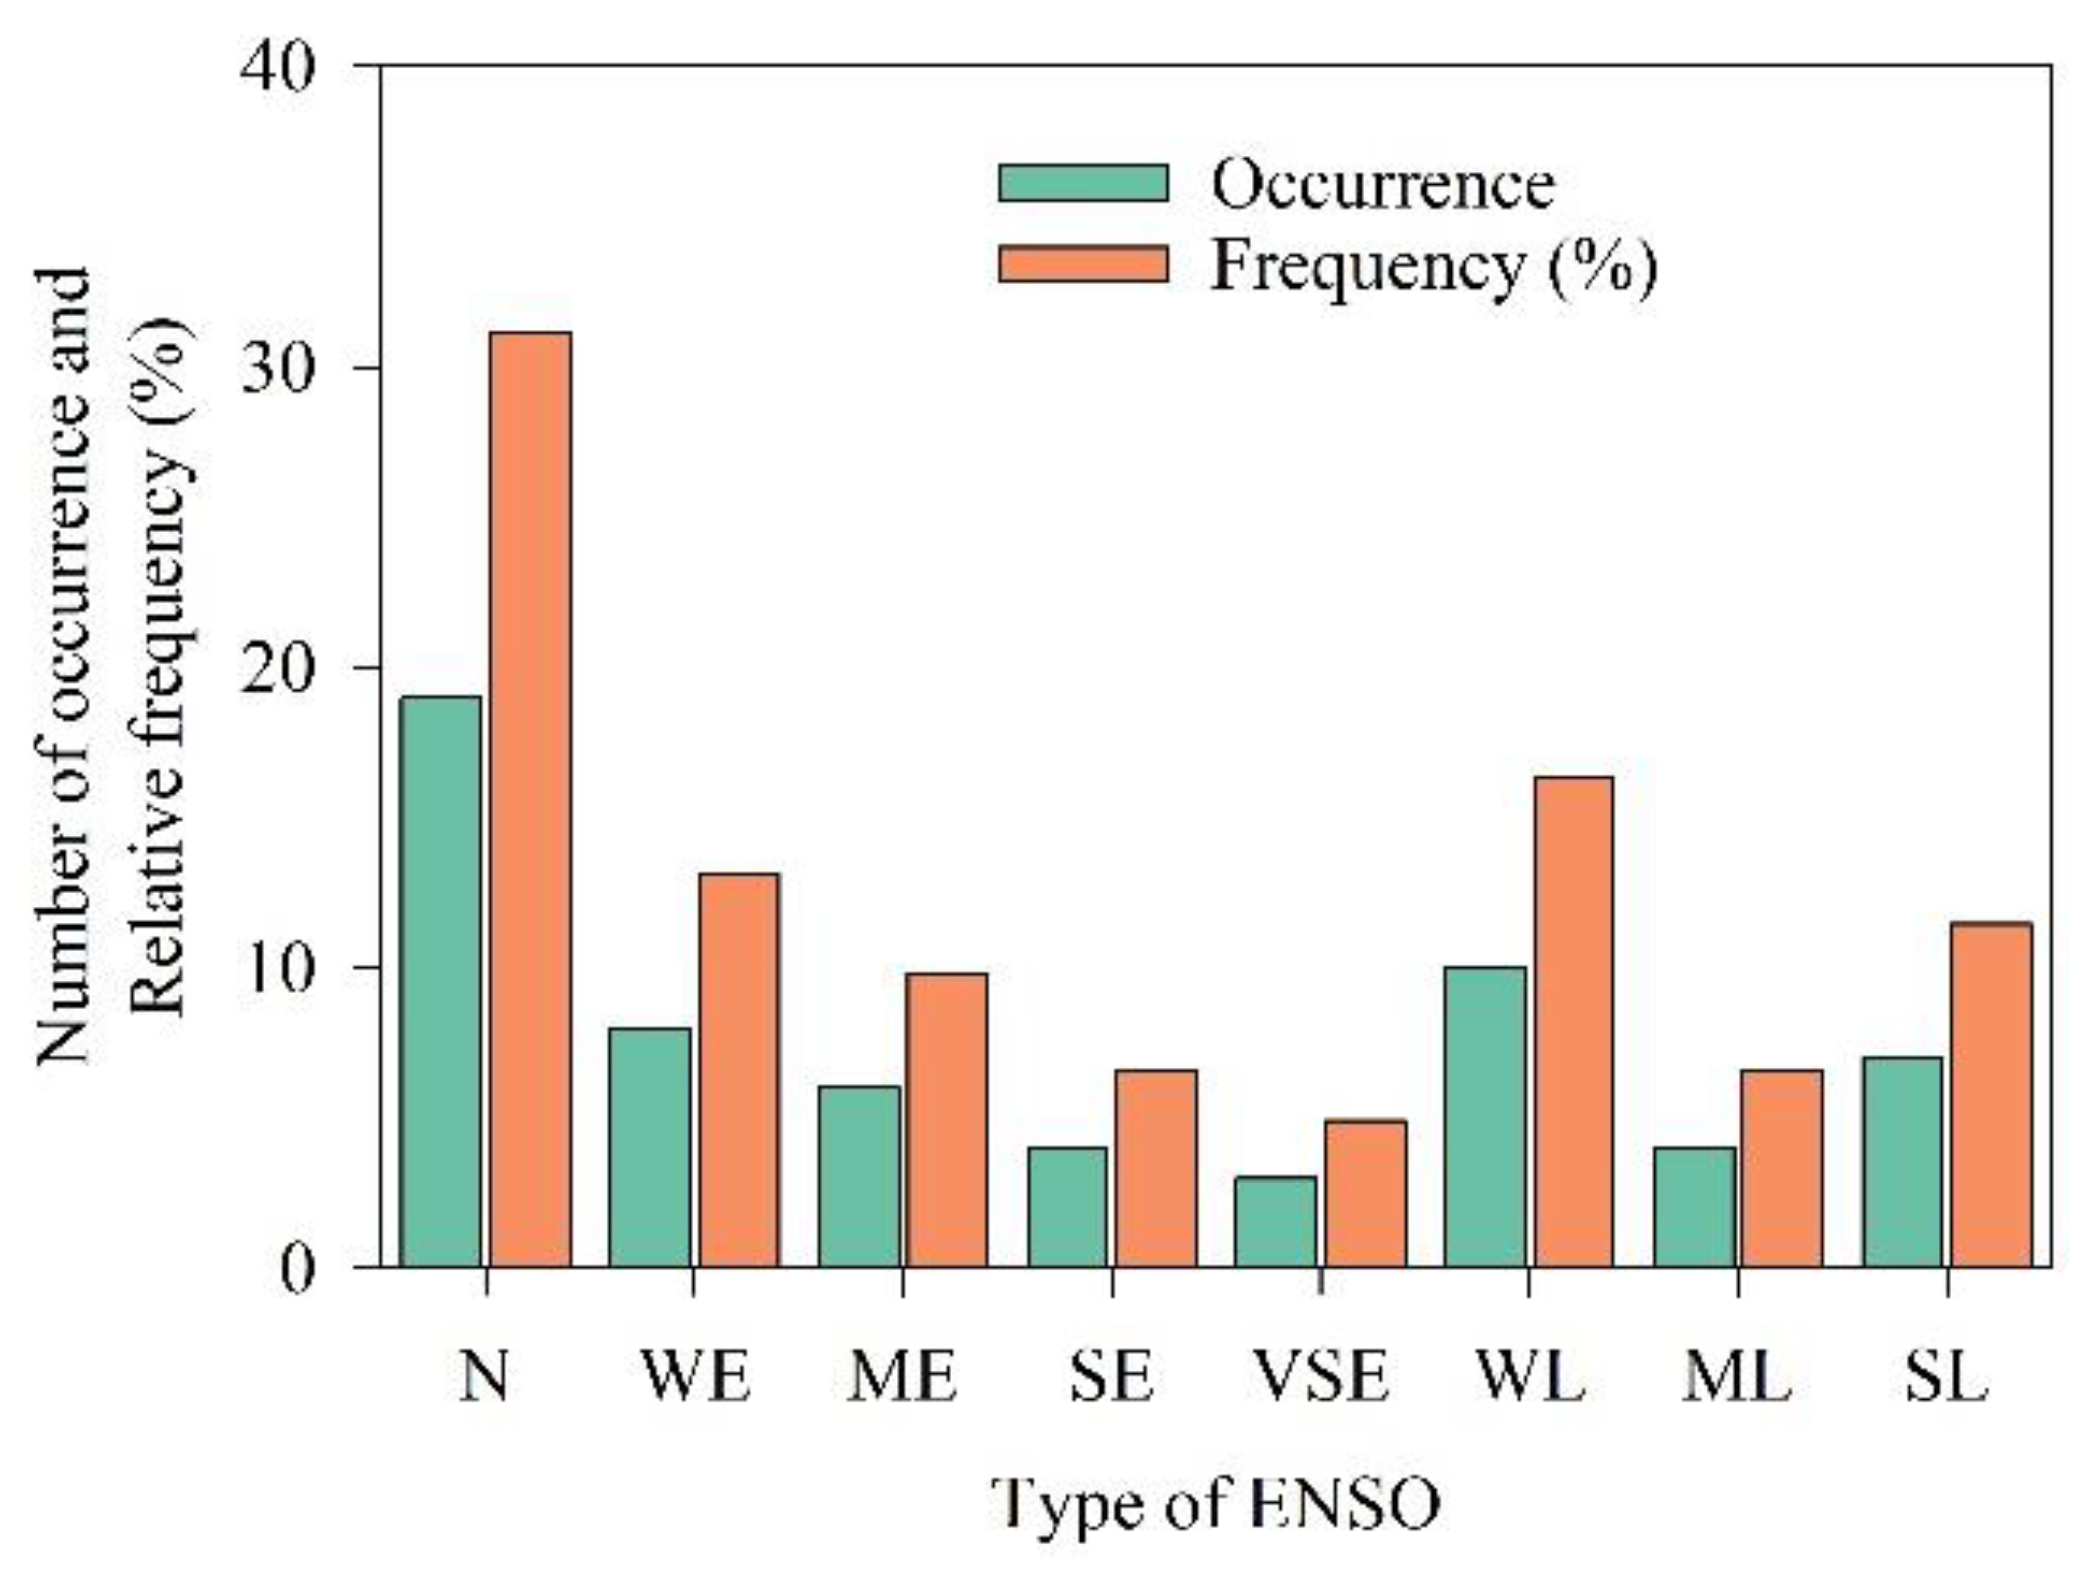
2.3. ENSO and PDO
2.4. Mann–Kendall Test
3. Results and Discussion
3.1. Analysis of Rainfall in NEB Capitals
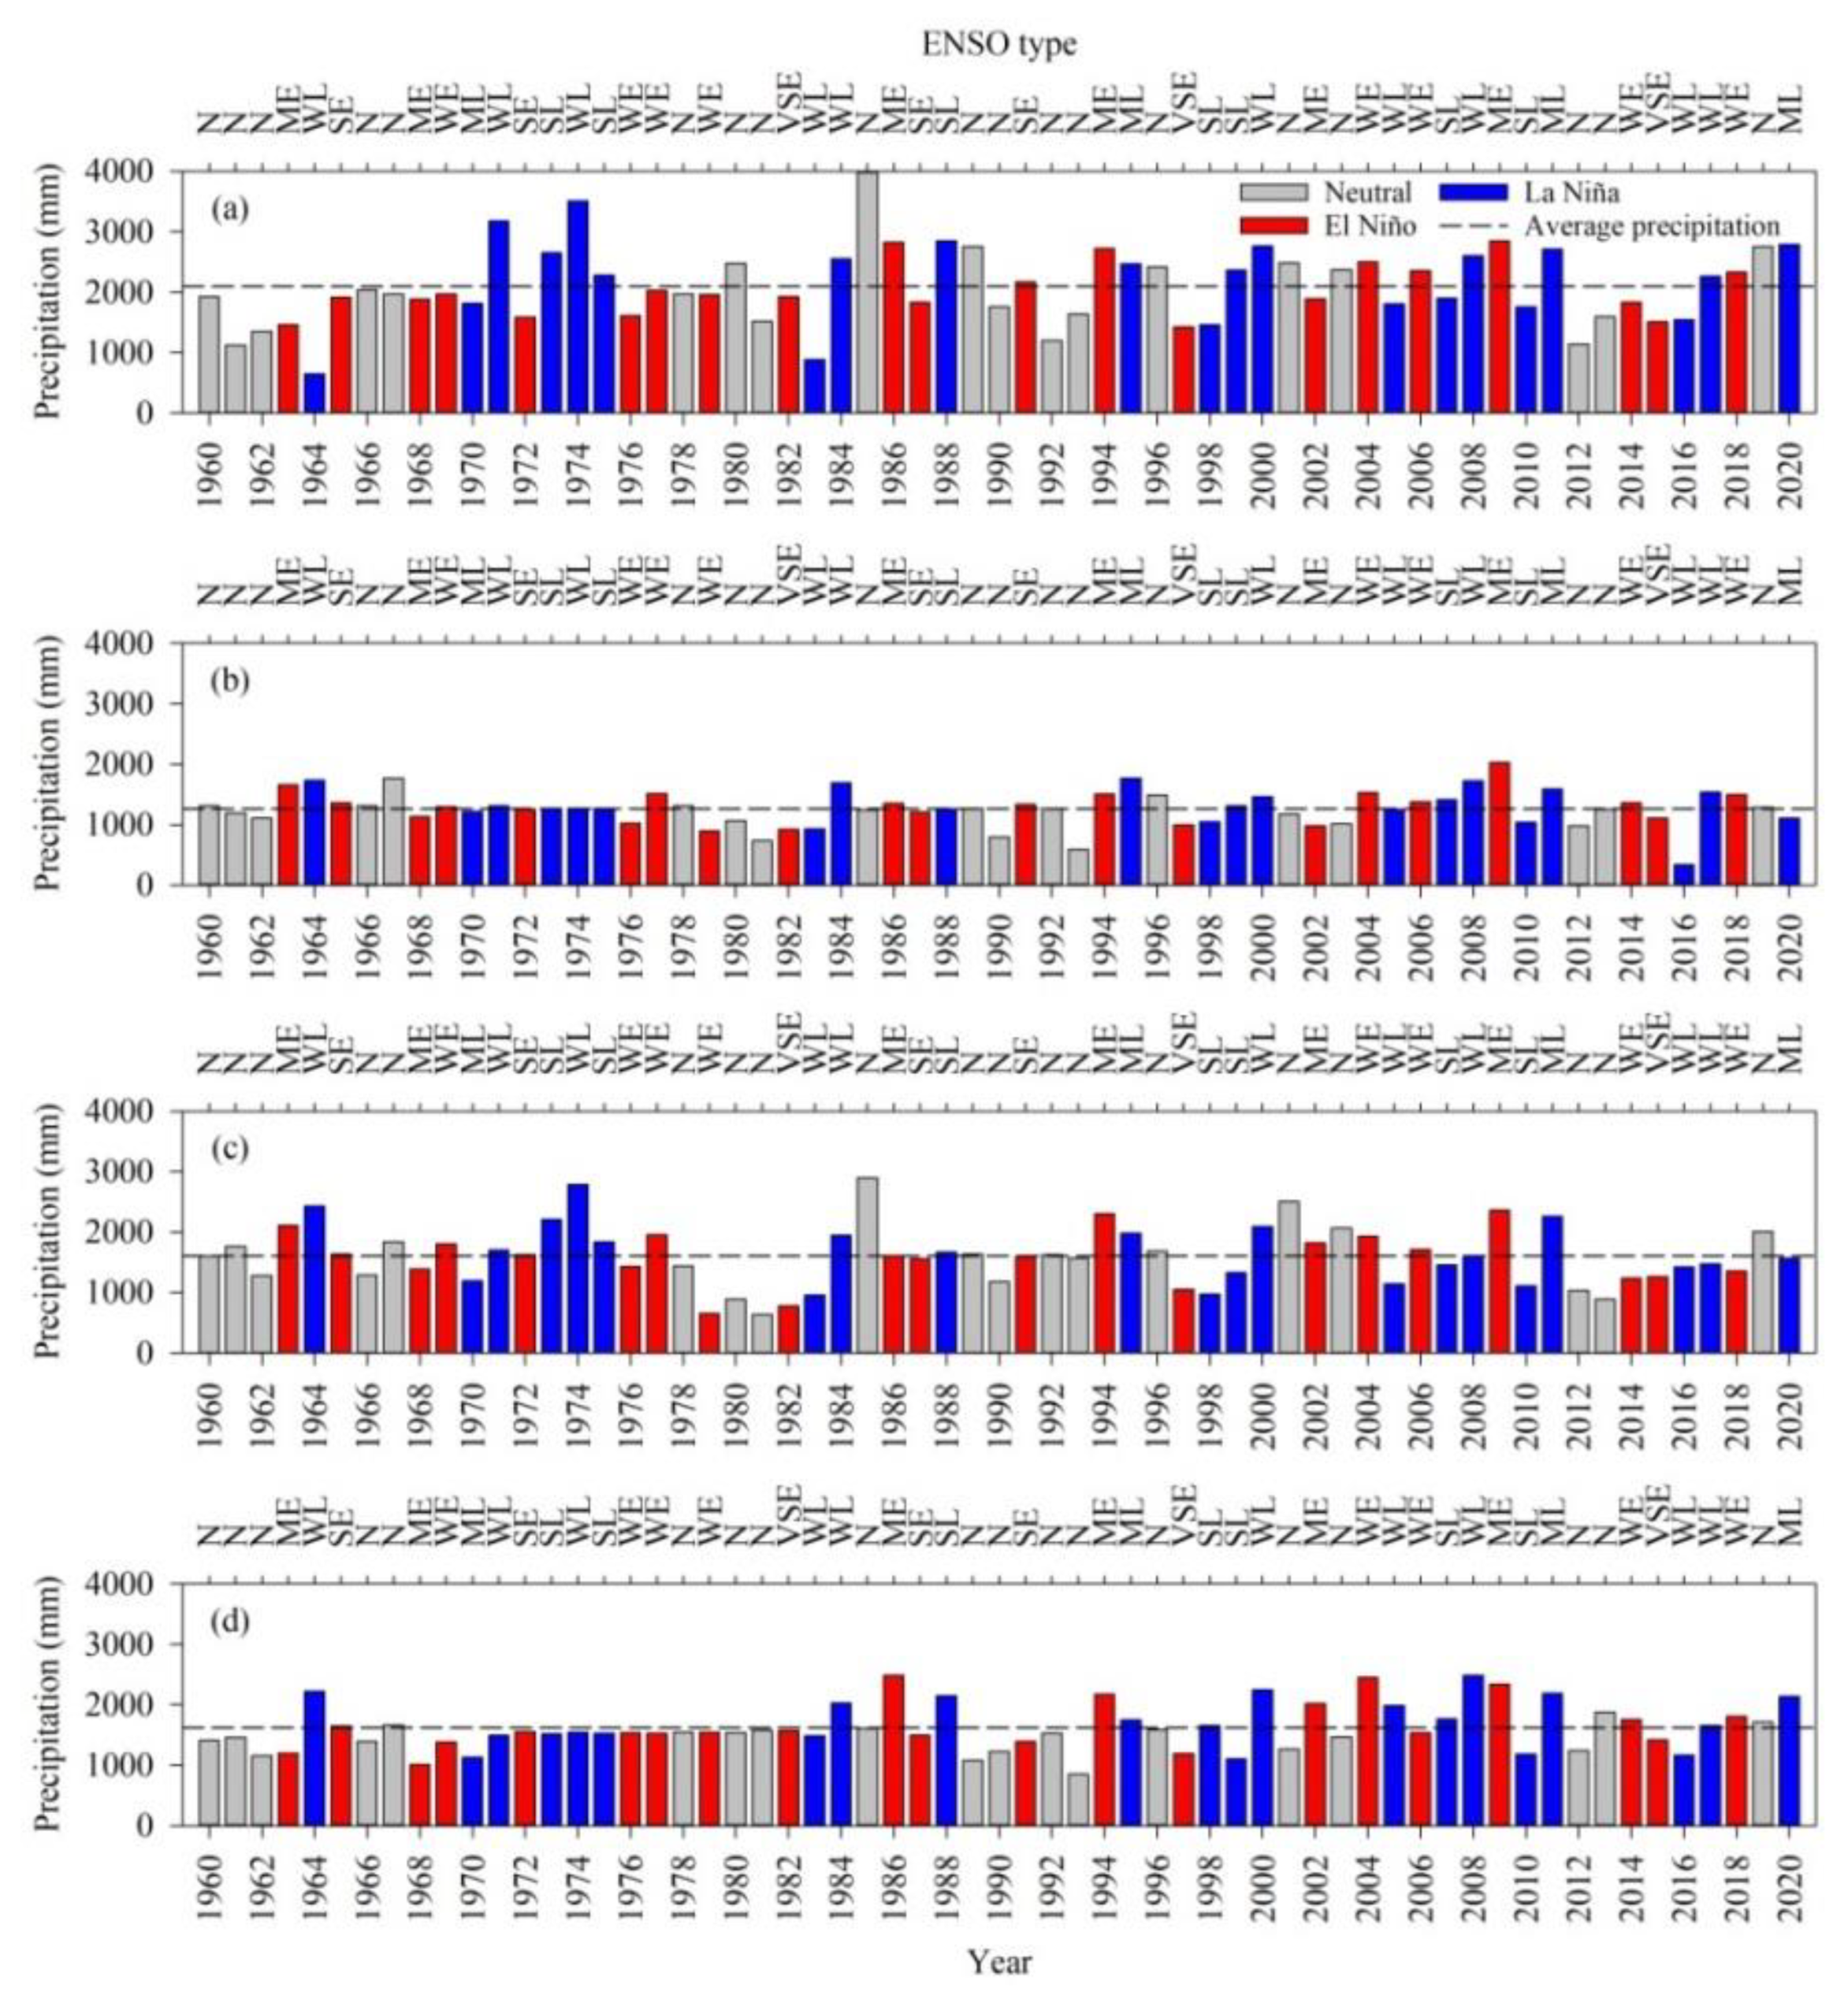
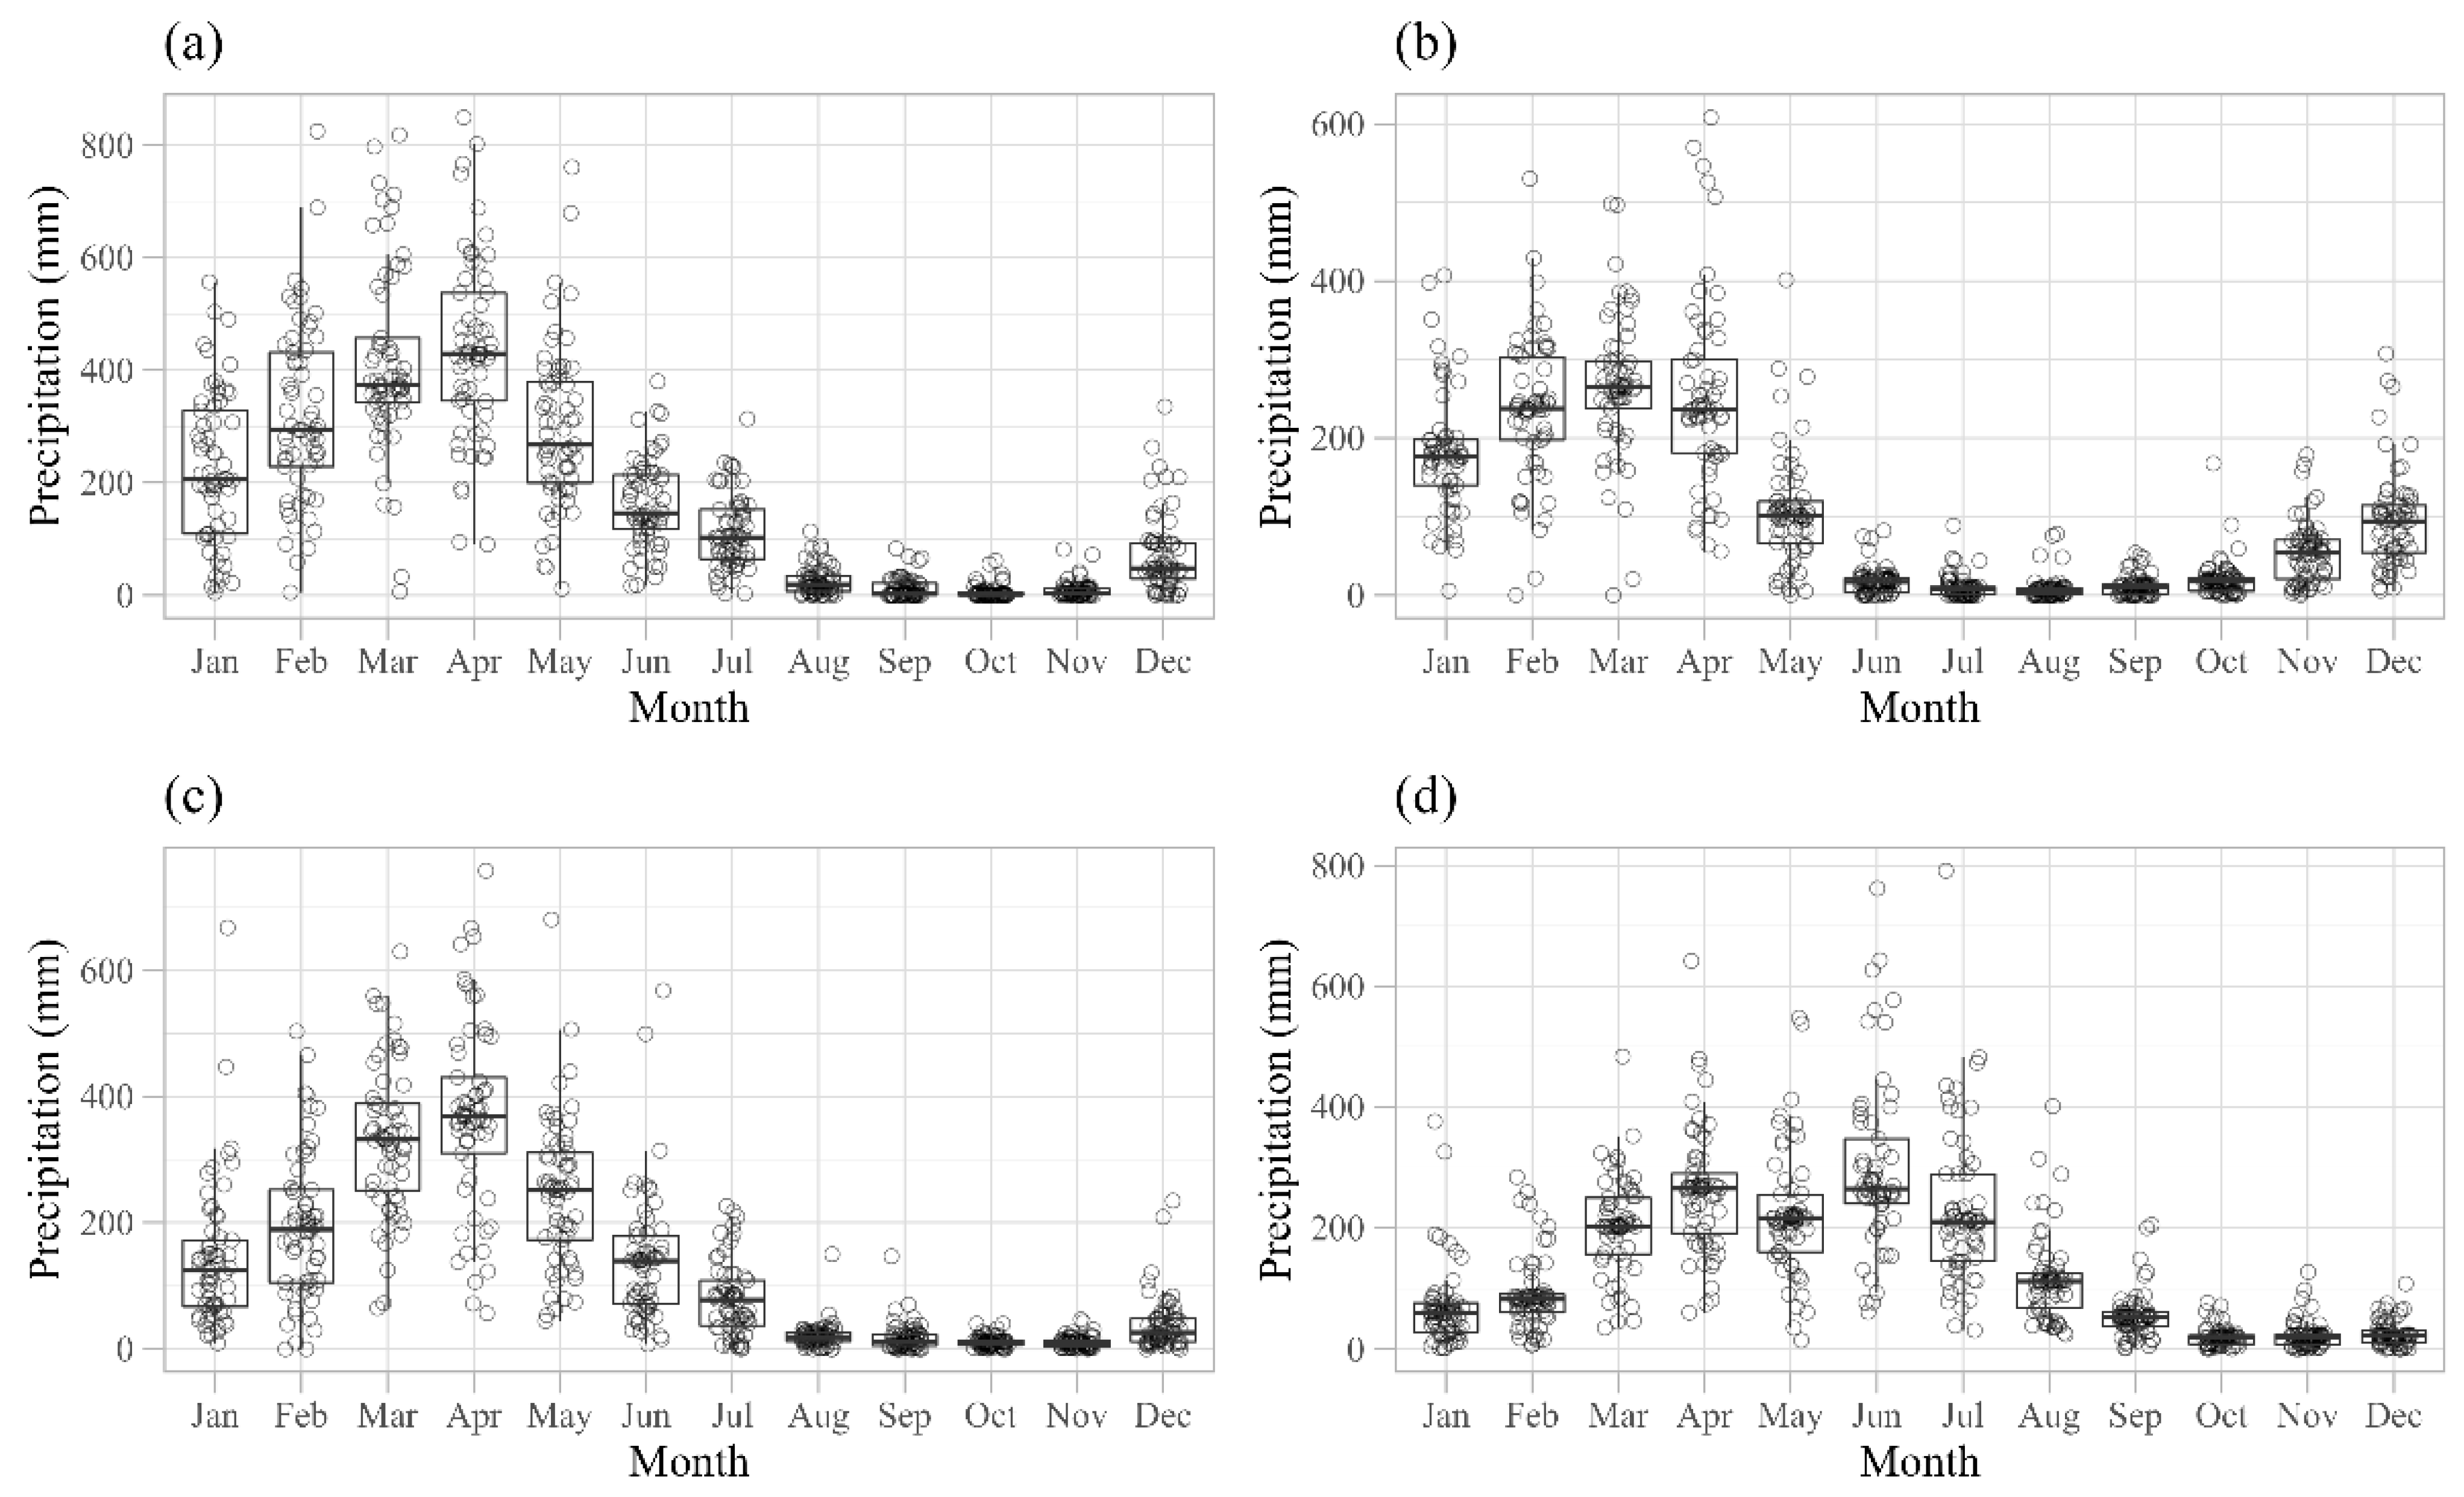
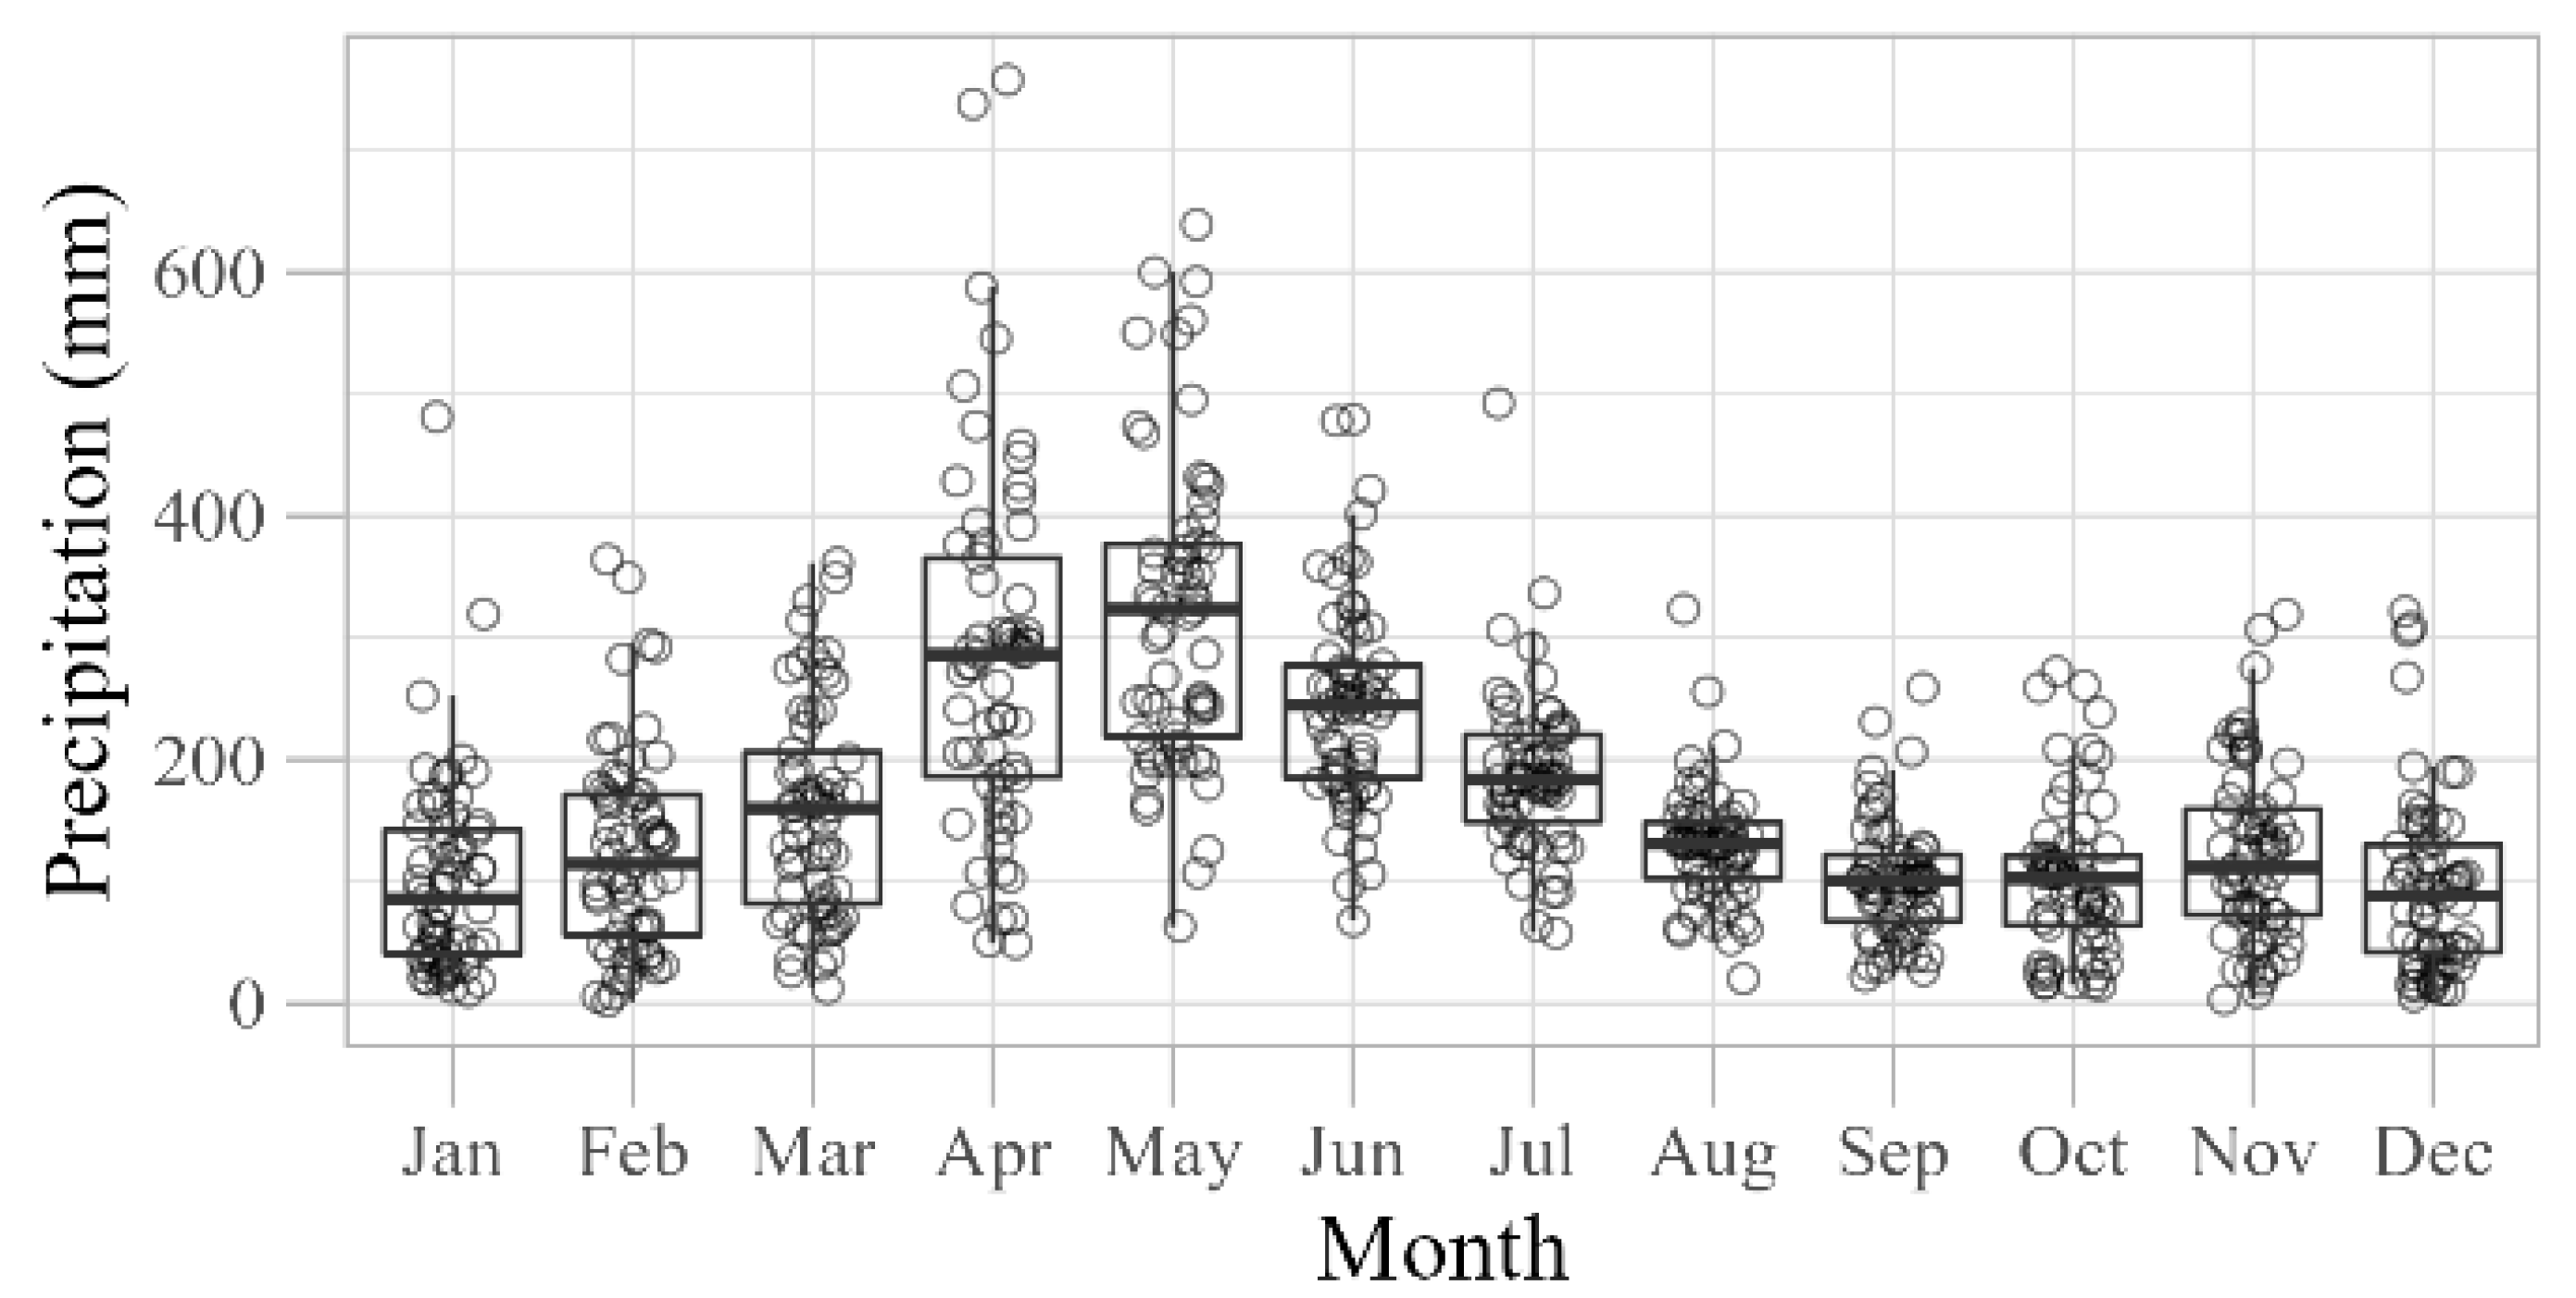
3.1.1. Annual
- (a)
- East of the NEB (ENEB)
- (b)
- North of the NEB (NNEB)
- (c)
- South of the NEB (SNEB)
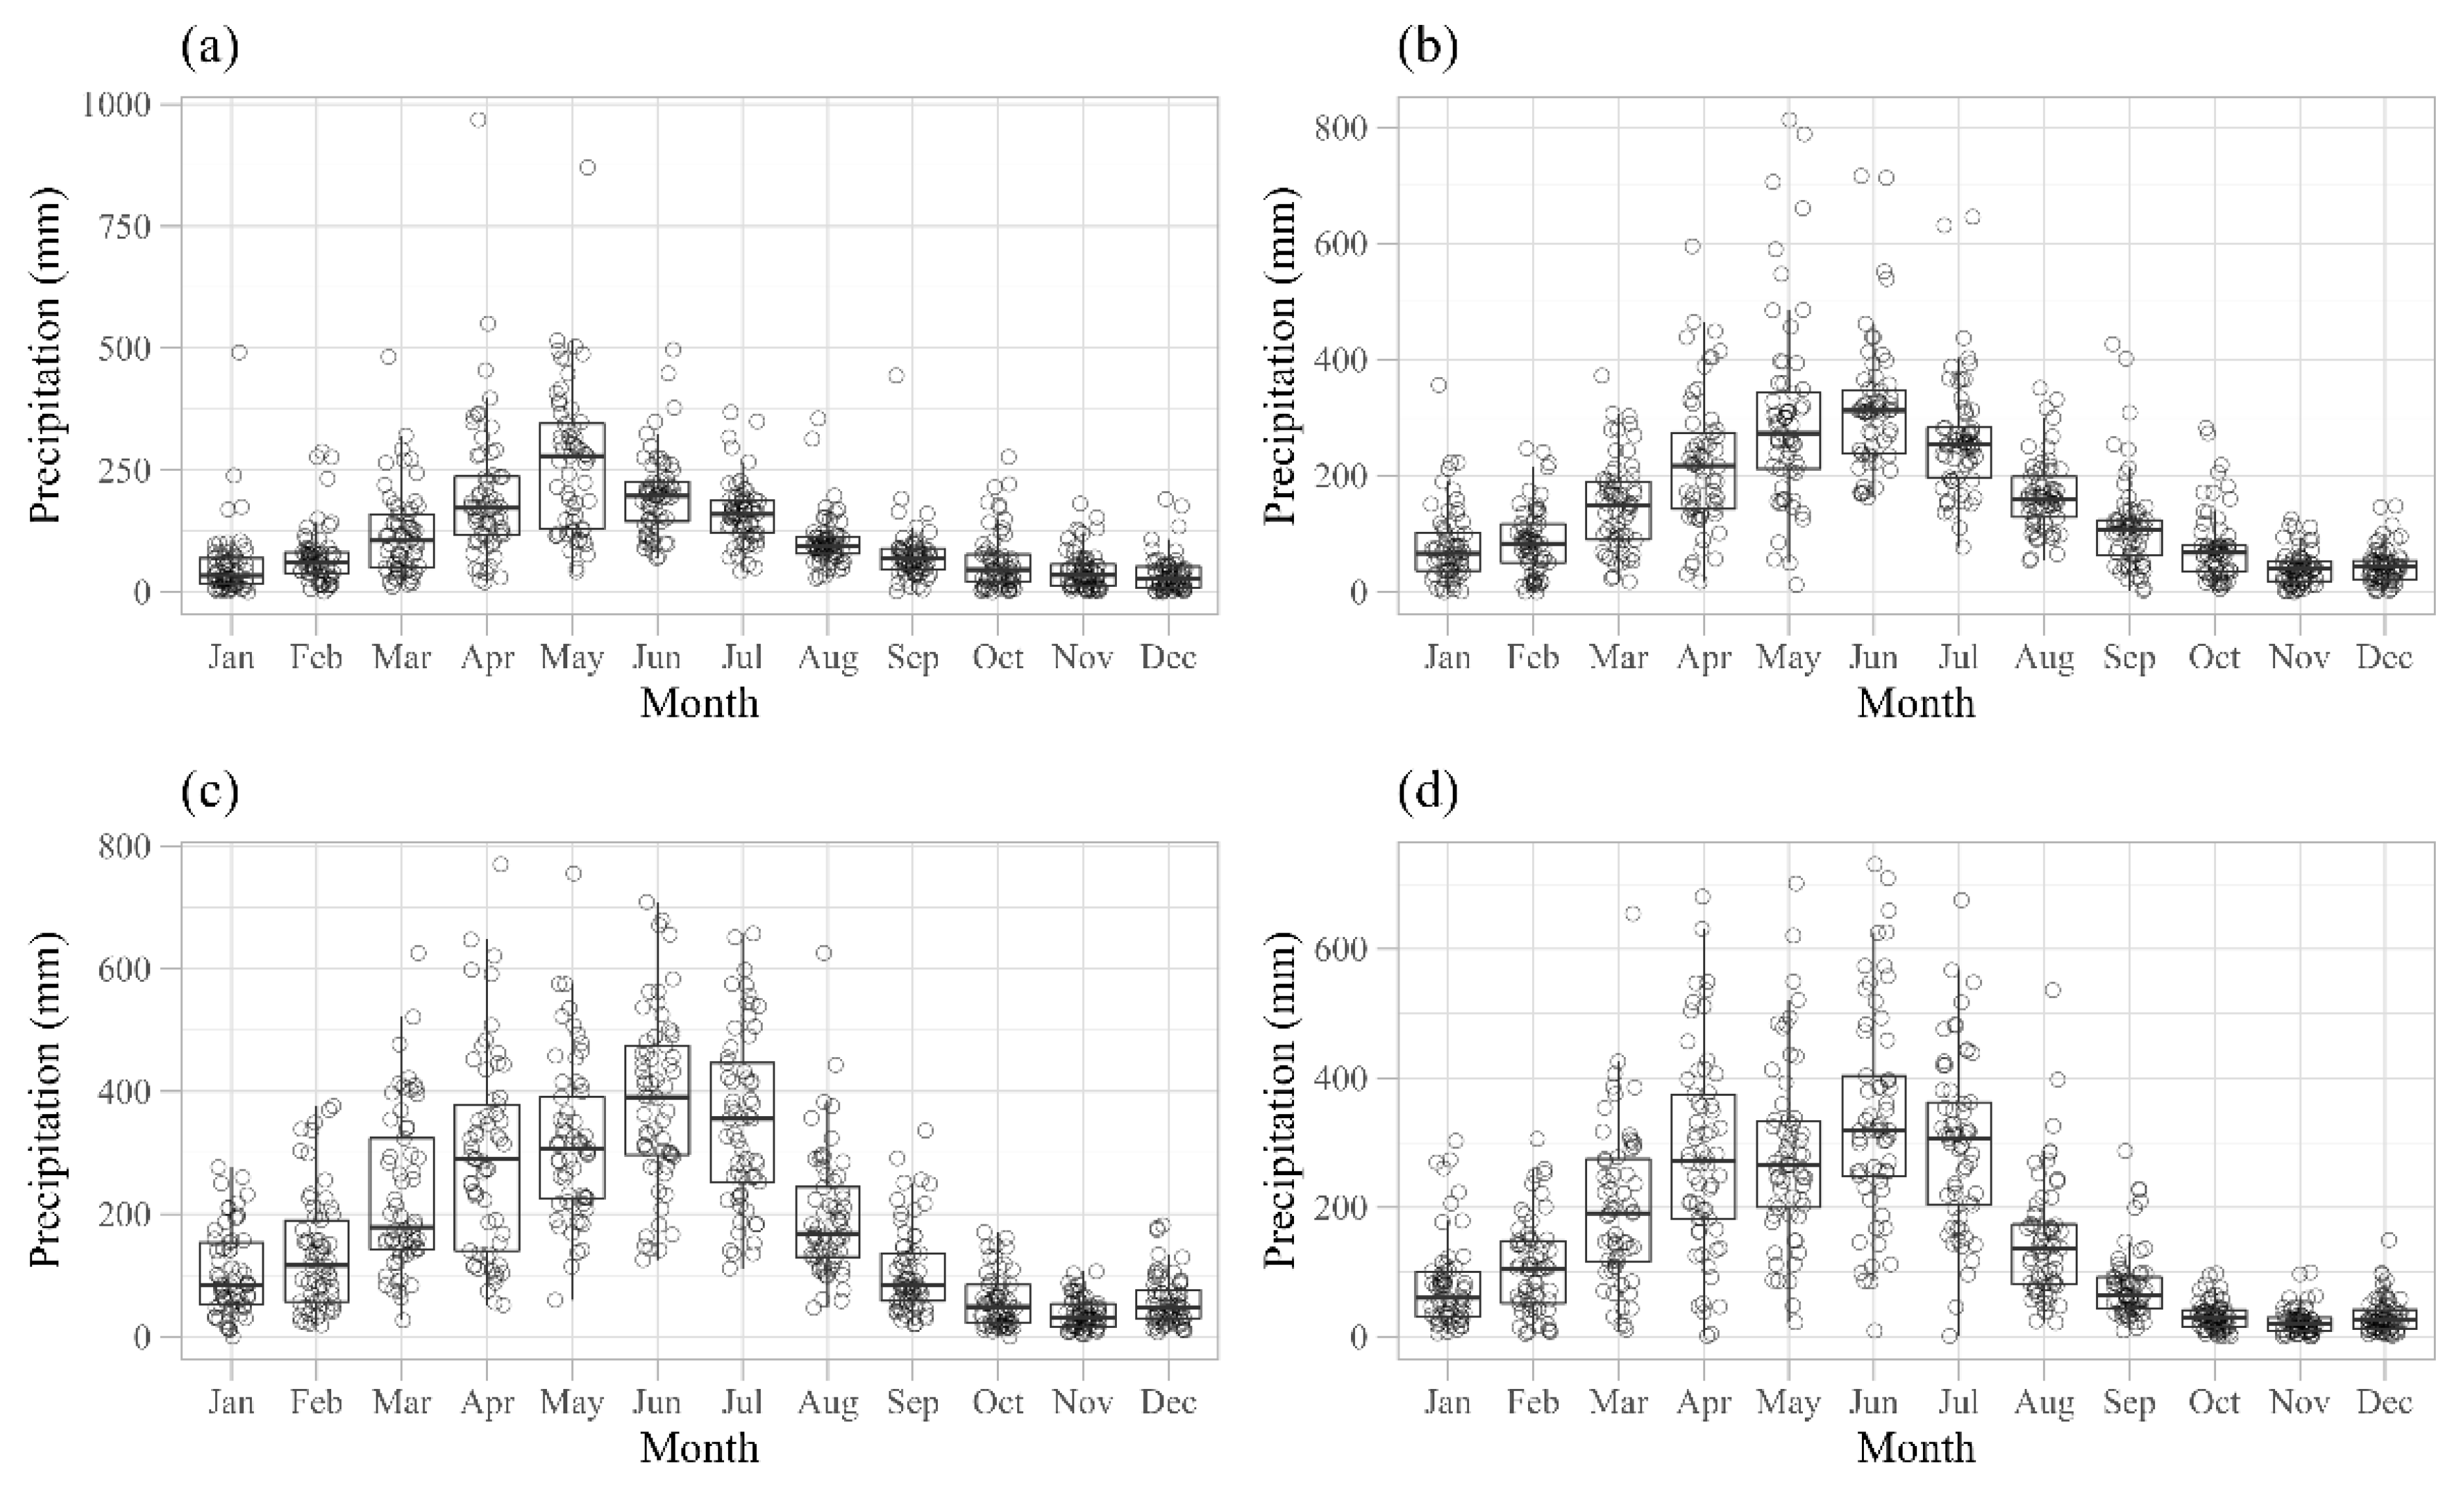
3.1.2. Seasonal
3.2. Rainfall Trend in NEB Capitals
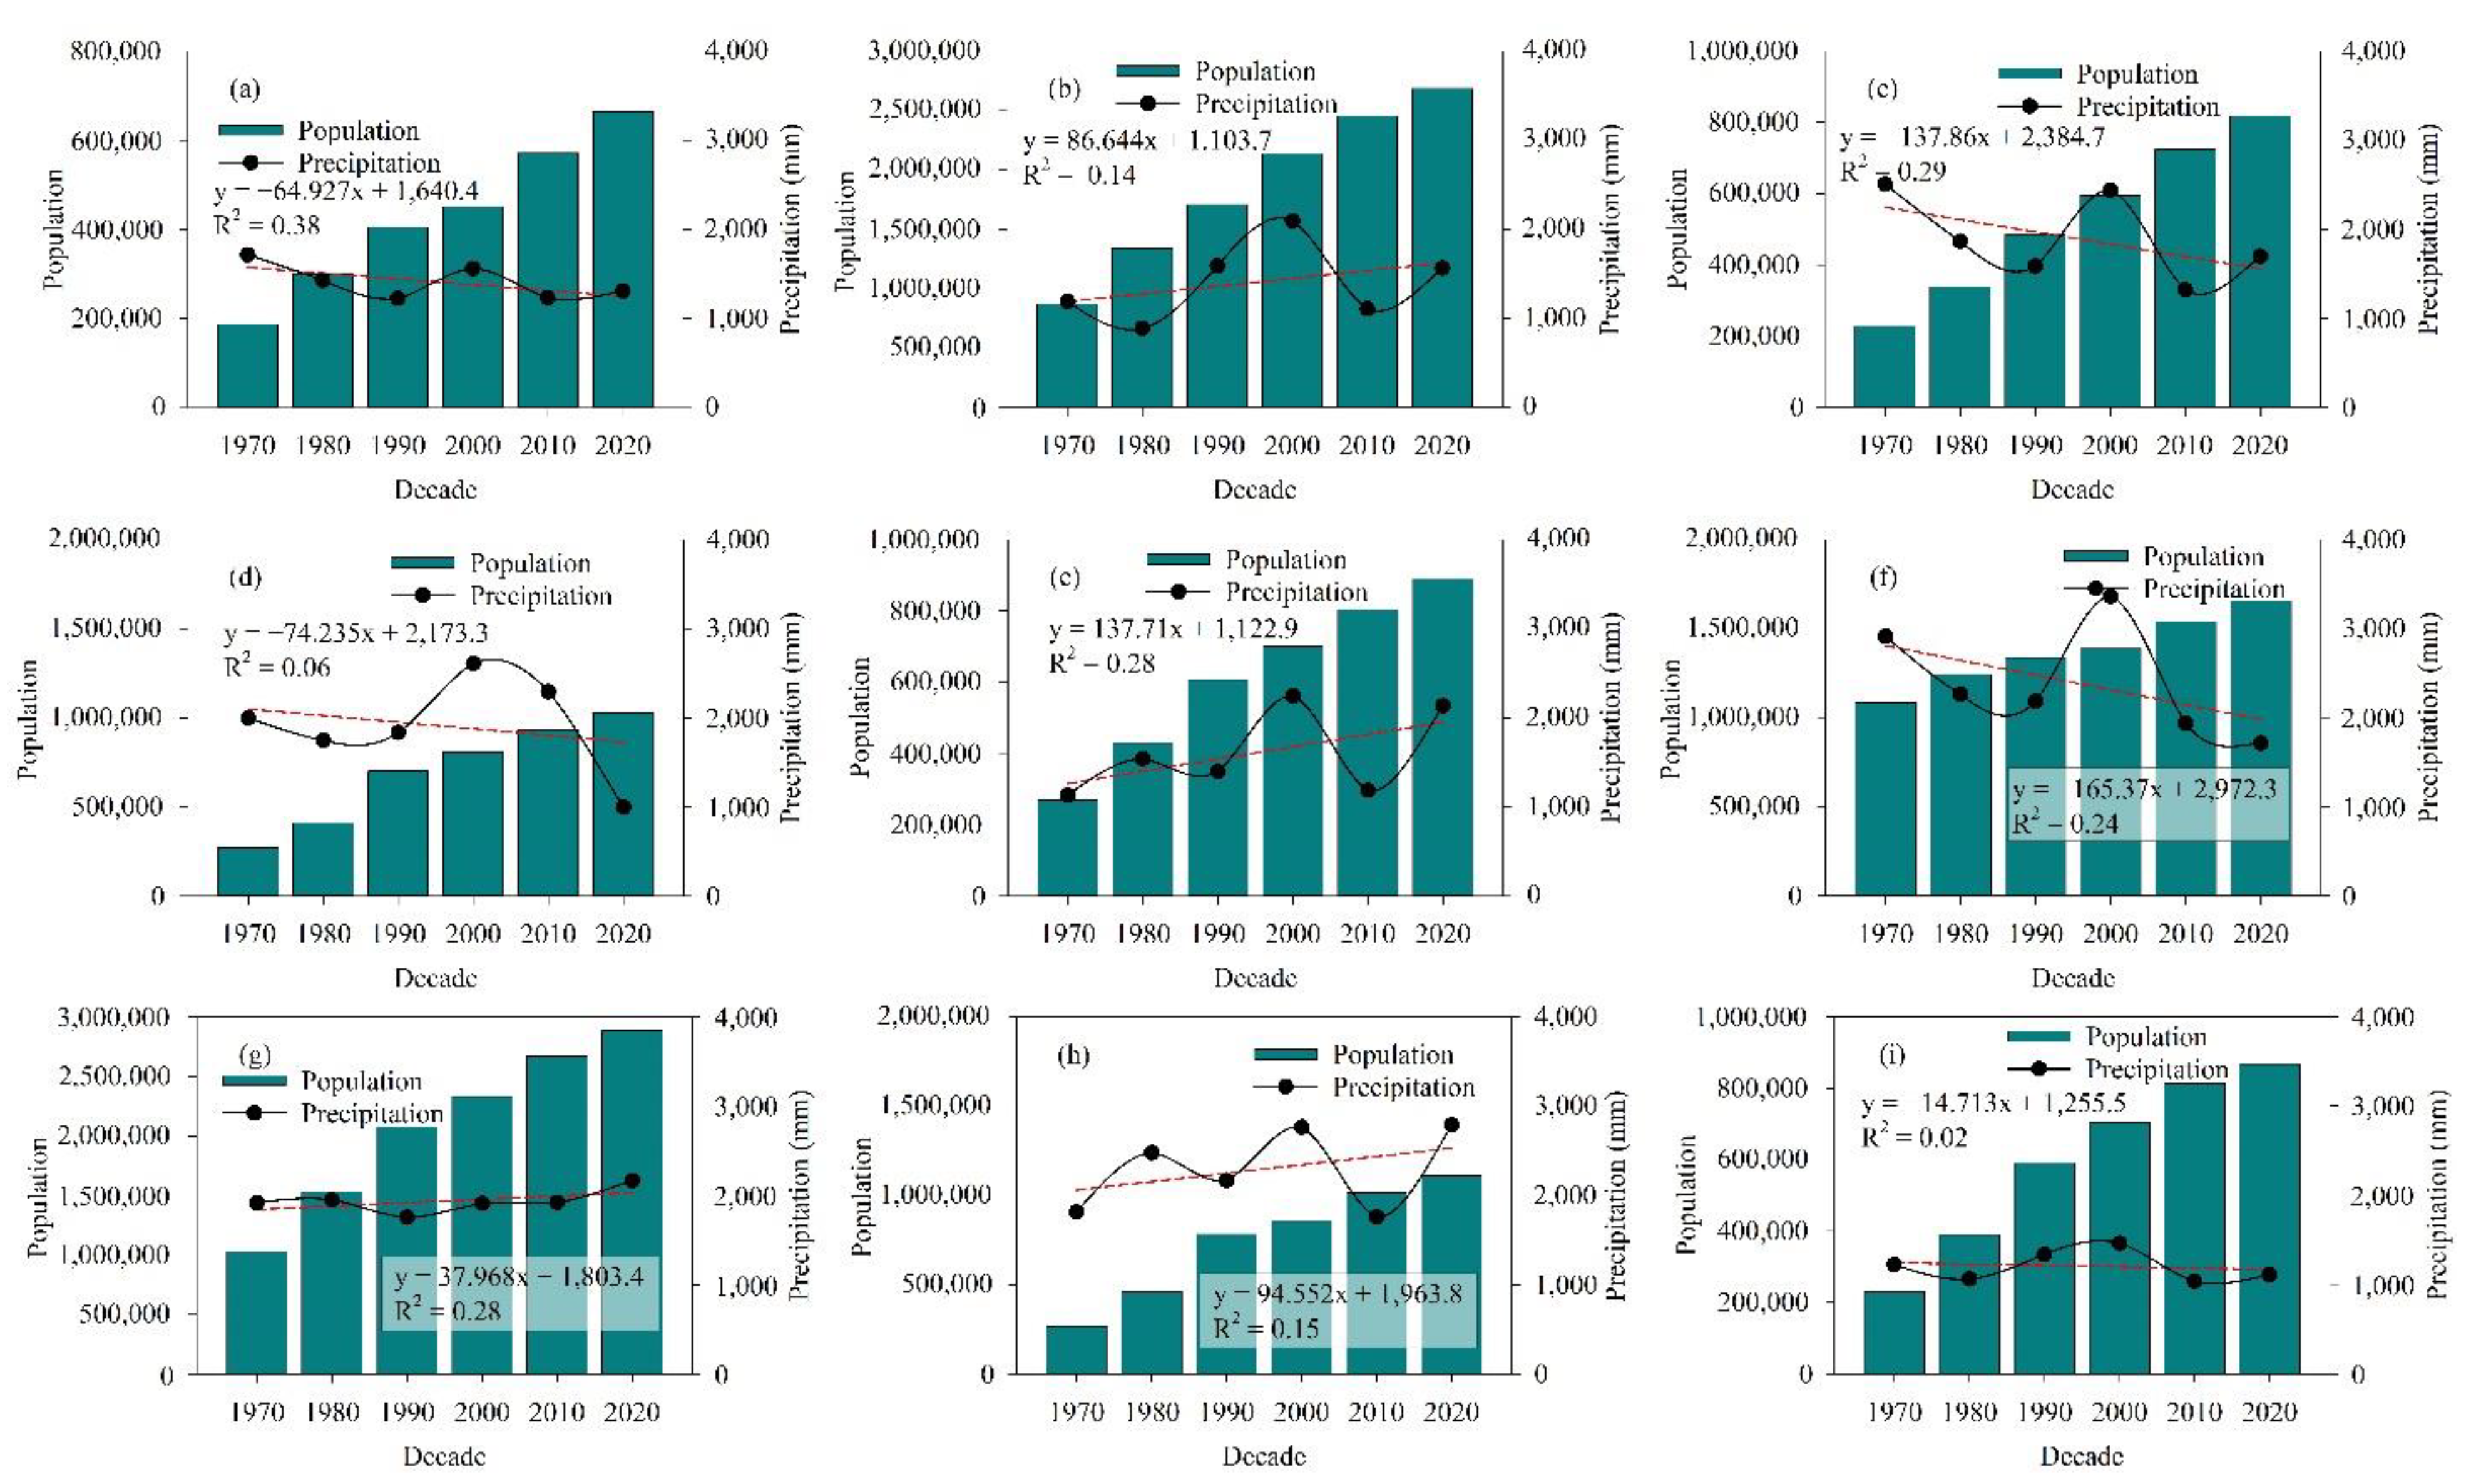
3.3. Relationship between Population and Average Rainfall
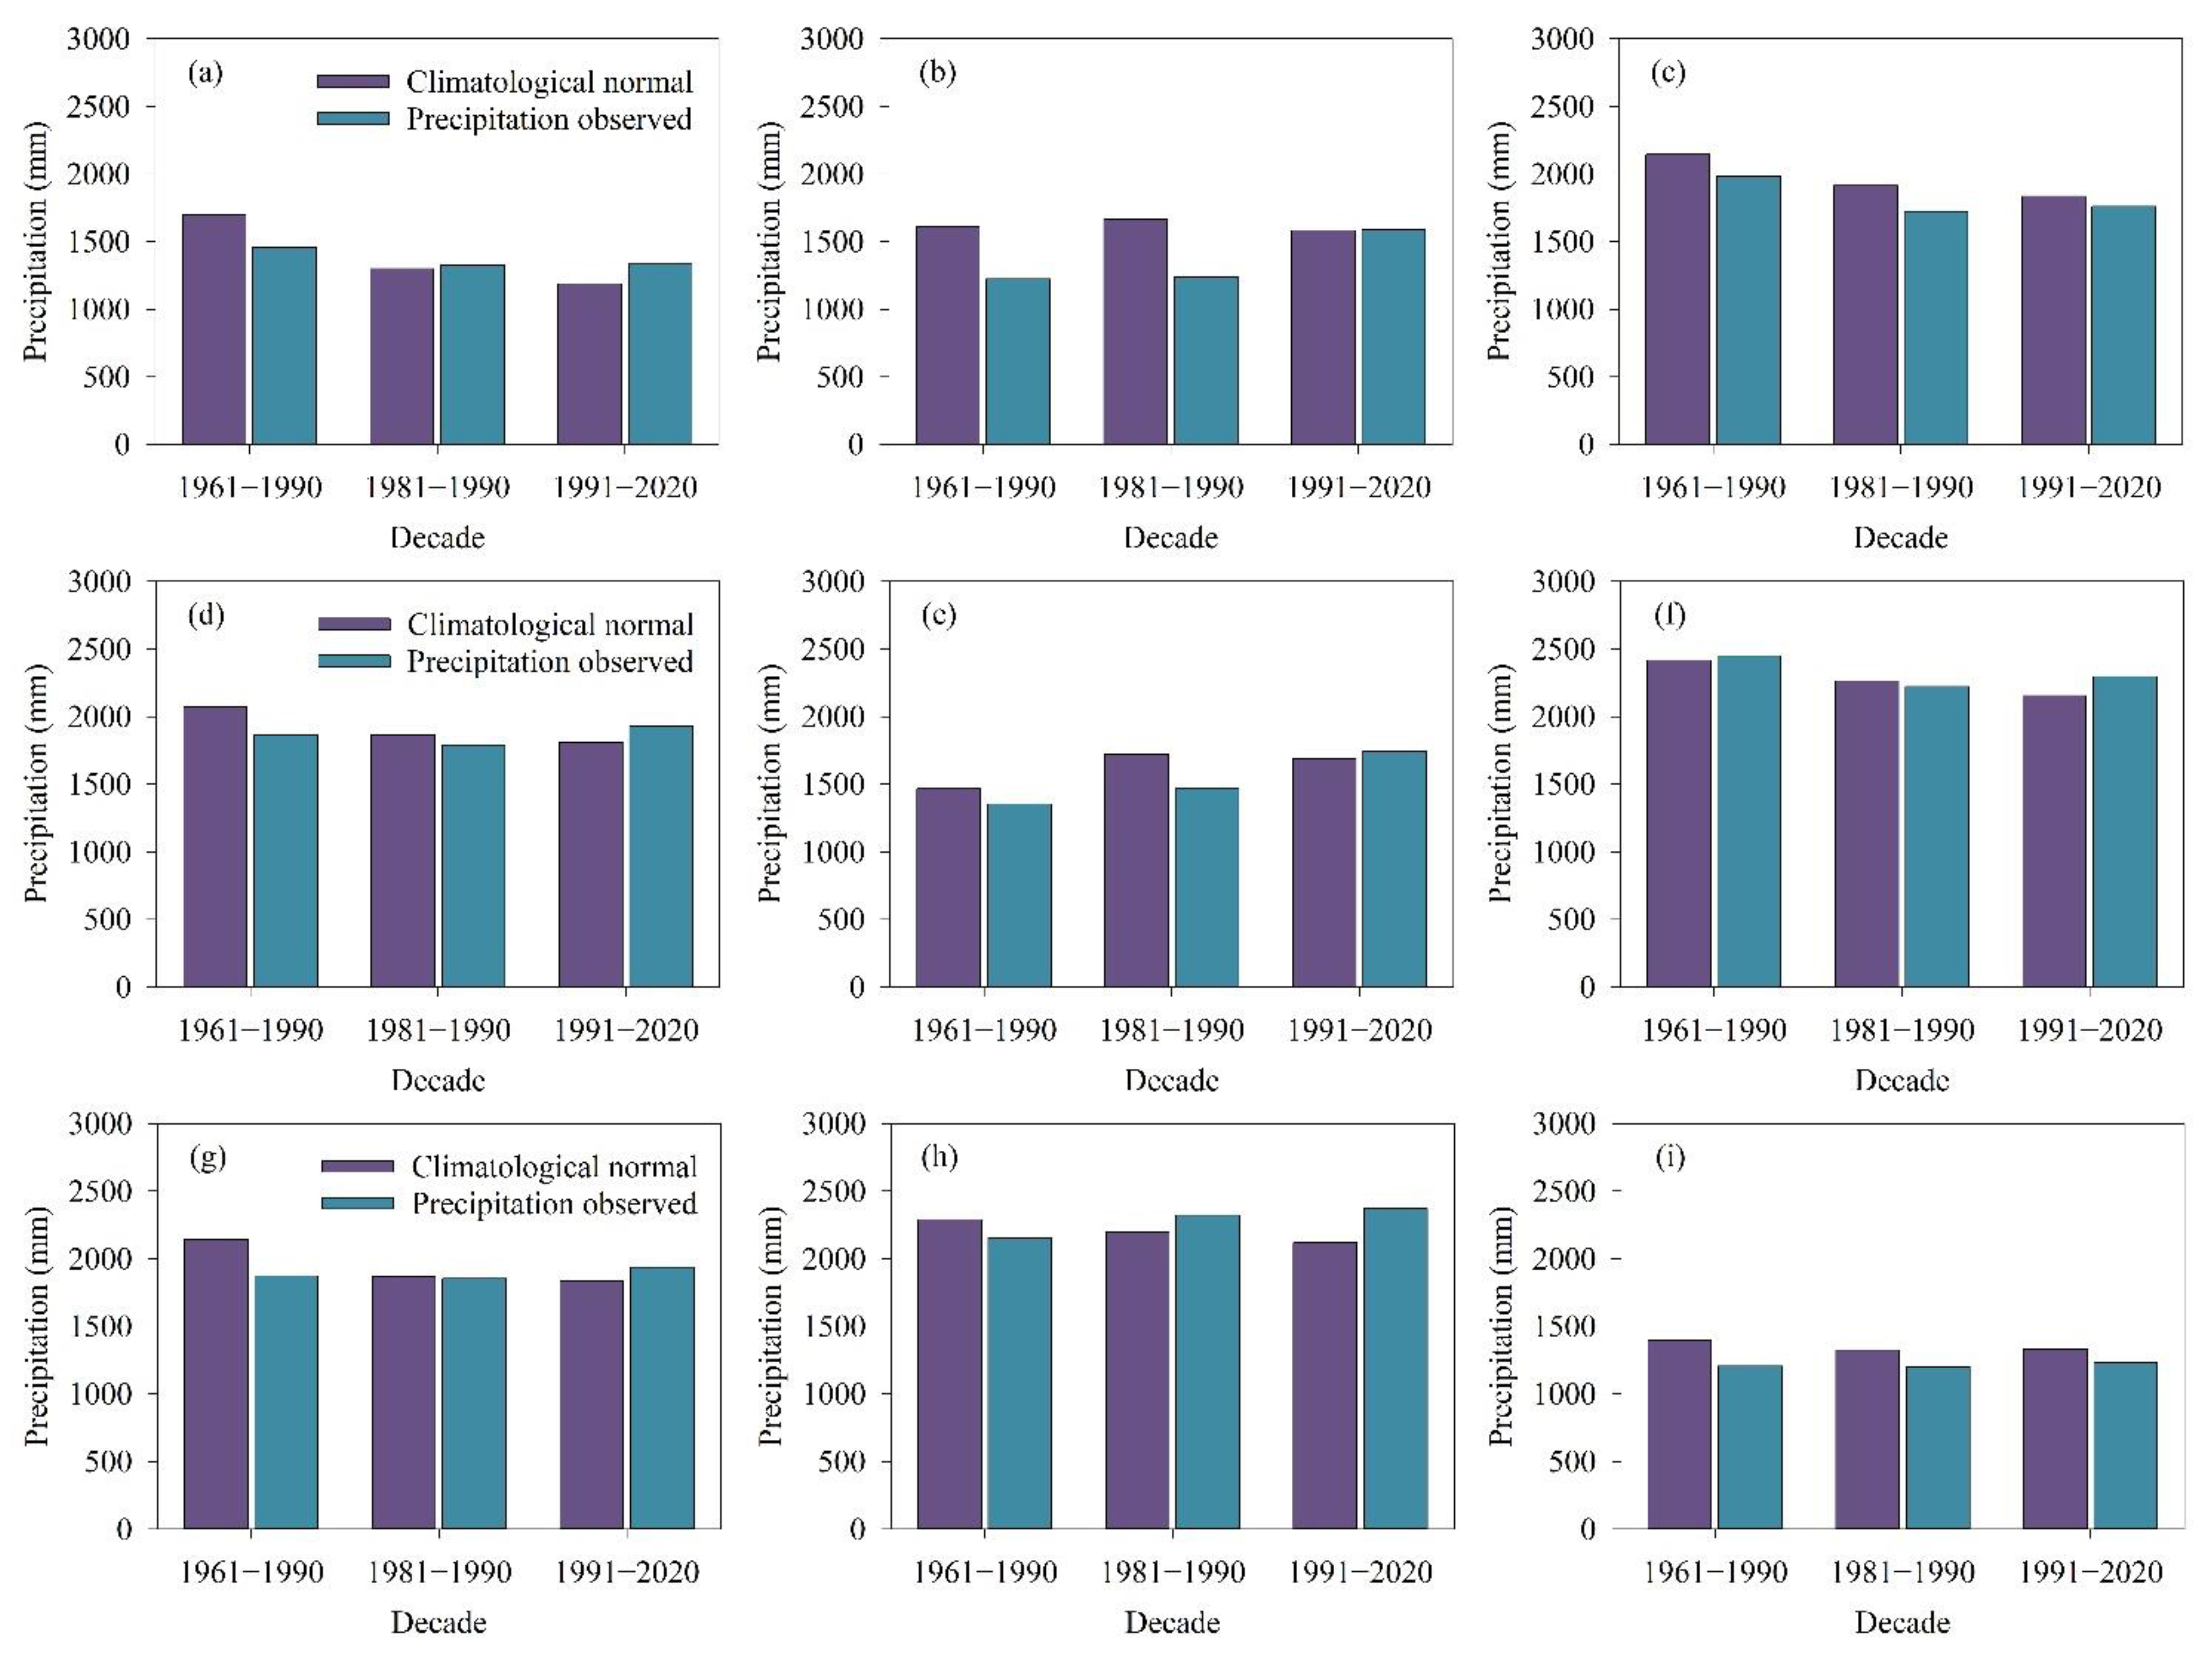
3.4. Relationship between Climatological Normal and Observed Rainfall
4. Conclusions
Author Contributions
Funding
Institutional Review Board Statement
Informed Consent Statement
Data Availability Statement
Acknowledgments
Conflicts of Interest
References
- Ullah, I.; Aslam, B.; Shah, S.H.I.A.; Tariq, A.; Qin, S.; Majeed, M.; Havenith, H.-B. An Integrated Approach of Machine Learning, Remote Sensing, and GIS Data for the Landslide Susceptibility Mapping. Land 2022, 11, 1265. [Google Scholar] [CrossRef]
- Khalil, U.; Imtiaz, I.; Aslam, B.; Ullah, I.; Tariq, A.; Qin, S. Comparative analysis of machine learning and multi-criteria decision making techniques for landslide susceptibility mapping of Muzaffarabad district. Front. Environ. Sci. 2022, 10, 1–19. [Google Scholar] [CrossRef]
- Sharifi, A.; Mahdipour, H.; Moradi, E.; Tariq, A. Agricultural Field Extraction with Deep Learning Algorithm and Satellite Imagery. J. Indian Soc. Remote Sens. 2022, 50, 417–423. [Google Scholar] [CrossRef]
- Bera, D.; Das Chatterjee, N.; Mumtaz, F.; Dinda, S.; Ghosh, S.; Zhao, N.; Bera, S.; Tariq, A. Integrated Influencing Mechanism of Potential Drivers on Seasonal Variability of LST in Kolkata Municipal Corporation, India. Land 2022, 11, 1461. [Google Scholar] [CrossRef]
- Fu, C.; Cheng, L.; Qin, S.; Tariq, A.; Liu, P.; Zou, K.; Chang, L. Timely Plastic-Mulched Cropland Extraction Method from Complex Mixed Surfaces in Arid Regions. Remote Sens. 2022, 14, 4051. [Google Scholar] [CrossRef]
- Majeed, M.; Lu, L.; Haq, S.M.; Waheed, M.; Sahito, H.A.; Fatima, S.; Aziz, R.; Bussmann, R.W.; Tariq, A.; Ullah, I.; et al. Spatiotemporal Distribution Patterns of Climbers along an Abiotic Gradient in Jhelum District, Punjab, Pakistan. Forests 2022, 13, 1244. [Google Scholar] [CrossRef]
- Costa, M.S.; Oliveira Júnior, J.F.; Santos, P.J.; Correia Filho, W.L.F.; Gois, G.; Blanco, C.J.C.; Teodoro, P.O.E.; Silva Junior, C.A.; Santiago, D.B.; Souza, E.O.; et al. Rainfall extremes and drought in Northeast Brazil and its relationship with El Niño-Southern Oscillation. Int. J. Climatol. 2021, 41, E2111–E2135. [Google Scholar] [CrossRef]
- Molion, L.C.B.; Bernardo, S.O. Uma Revisão da Dinâmica das Chuvas no Nordeste Brasileiro. Rev. Bras. De Meteorol. 2002, 17, 1–10. [Google Scholar]
- Costa, M.D.S.; Levit, V.; Federova, N. Padrões de circulação atmosférica no nordeste Brasileiro dos eventos de Vórtice Ciclônico de altos Níveis com Corrente de Jato. Rev. Bras. Geo. Fis. 2013, 6, 794–804. [Google Scholar] [CrossRef] [Green Version]
- Reboita, M.S.; Gan, M.A.; Rocha, R.P.; Ambrizzi, T. Regimes de precipitação na América do Sul: Uma revisão bibliográfica. Rev. Bras. Meteorol. 2010, 25, 185–204. [Google Scholar] [CrossRef]
- Lyra, G.B.; Oliveira Júnior, J.F.; Zeri, M. Cluster analysis applied to the spatial and temporal variability of monthly rainfall in Alagoas state, Northeast of Brazil. Int. J. Climatol. 2014, 34, 3546–3558. [Google Scholar] [CrossRef]
- Hounsou-Gbo, G.A.; Servain, J.; Araújo, M.; Martins, E.S.; Bourles, B.; Canaix, G. Oceanic Indices for Forecasting Seasonal Rainfall over the Northern Part of Brazilian Northeast. Am. J. Clim. Change 2016, 5, 261–274. [Google Scholar] [CrossRef] [Green Version]
- Costa, R.L.; Souza, E.P.D.; Silva, F.D.D.S. Aplicação de uma teoria termodinâmica no estudo de um Vórtice Ciclônico de Altos níveis sobre o Nordeste do Brasil. Rev. Bras. Meteorol. 2014, 29, 96–104. [Google Scholar] [CrossRef] [Green Version]
- Silva, E.B.; Raposo, J.C.S.; Oliveira Júnior, J.F.; Correia Filho, W.L.F.; Santiago, D.B. Diagnóstico dos Casos de Dengue nas Capitais do Nordeste do Brasil entre 2000 e 2017. Cad. Geo. 2021, 31, 546–556. [Google Scholar] [CrossRef]
- Souza, E.O.; Costa, M.S.; Oliveira Júnior, J.F.; Gois, G.; Mariano, G.L.; Costa, C.E.D.S.; Santiago, D.B. Estimativa e Espacialização da Erosividade em Mesorregiões Climáticas no Estado de Alagoas. Rev. Bras. Meteorol. 2020, 35, 769–783. [Google Scholar] [CrossRef]
- Tariq, A.; Yan, J.; Gagnon, A.S.; Riaz Khan, M.; Mumtaz, F. Mapping of cropland, cropping patterns and crop types by combining optical remote sensing images with decision tree classifier and random forest. Geo-Spat. Inf. Sci. 2022, 1–19. [Google Scholar] [CrossRef]
- Jalayer, S.; Sharifi, A.; Abbasi-Moghadam, D.; Tariq, A.; Qin, S. Modeling and Predicting Land Use Land Cover Spatiotemporal Changes: A Case Study in Chalus Watershed, Iran. IEEE J. Sel. Top. Appl. Earth Obs. Remote Sens. 2022, 15, 5496–5513. [Google Scholar] [CrossRef]
- Ávila, P.L.R.; Brito, J.I.B. Relação entre a Oscilação Decadal do Pacífico e a variabilidade de precipitação de Campina Grande, PB. Ciência E Nat. 2015, 37, 159–162. [Google Scholar] [CrossRef] [Green Version]
- Oliveira Júnior, J.F.; Correia Filho, W.L.F.; Monteiro, L.S.; Shah, M.; Hafeez, A.; Gois, G.; Lyra, G.B.; Abreu, M.C.; Santiago, D.D.B.; Souza, A.; et al. Urban rainfall in the Capitals of Brazil: Variability, trend, and wavelet analysis. Atmos. Res. 2022, 267, 105984. [Google Scholar] [CrossRef]
- Wahla, S.S.; Kazmi, J.H.; Sharifi, A.; Shirazi, S.A.; Tariq, A.; Joyell Smith, H. Assessing spatio-temporal mapping and monitoring of climatic variability using SPEI and RF machine learning models. Geocarto Int. 2022, 1–20. [Google Scholar] [CrossRef]
- Tariq, A.; Mumtaz, F.; Zeng, X.; Baloch, M.Y.J.; Moazzam, M.F.U. Spatio-temporal variation of seasonal heat islands mapping of Pakistan during 2000–2019, using day-time and night-time land surface temperatures MODIS and meteorological stations data. Remote Sens. Appl. Soc. Environ. 2022, 27, 100779. [Google Scholar] [CrossRef]
- Tariq, A.; Siddiqui, S.; Sharifi, A.; Hassan, S.; Ahmad, I. Impact of spatio - temporal land surface temperature on cropping pattern and land use and land cover changes using satellite imagery, Hafizabad District, Punjab, Province of Pakistan. Arab. J. Geosci. 2022, 15, 1045. [Google Scholar] [CrossRef]
- Tariq, A.; Shu, H. CA-Markov chain analysis of seasonal land surface temperature and land use landcover change using optical multi-temporal satellite data of Faisalabad, Pakistan. Remote Sens. 2020, 12, 3402. [Google Scholar] [CrossRef]
- Tariq, A.; Shu, H.; Gagnon, A.S.; Li, Q.; Mumtaz, F.; Hysa, A.; Siddique, M.A.; Munir, I. Assessing Burned Areas in Wildfires and Prescribed Fires with Spectral Indices and SAR Images in the Margalla Hills of Pakistan. Forests 2021, 12, 1371. [Google Scholar] [CrossRef]
- Tariq, A.; Shu, H.; Kuriqi, A.; Siddiqui, S.; Gagnon, A.S.; Lu, L.; Linh, N.T.T.; Pham, Q.B. Characterization of the 2014 Indus River Flood Using Hydraulic Simulations and Satellite Images. Remote Sens. 2021, 13, 2053. [Google Scholar] [CrossRef]
- Tariq, A.; Riaz, I.; Ahmad, Z. Land surface temperature relation with normalized satellite indices for the estimation of spatio-temporal trends in temperature among various land use land cover classes of an arid Potohar region using Landsat data. Environ. Earth Sci. 2020, 79, 40. [Google Scholar] [CrossRef]
- Ahmad, A.; Ahmad, S.R.; Gilani, H.; Tariq, A.; Zhao, N.; Aslam, R.W.; Mumtaz, F. A Synthesis of Spatial Forest Assessment Studies Using Remote Sensing Data and Techniques in Pakistan. Forests 2021, 12, 1211. [Google Scholar] [CrossRef]
- Hu, P.; Sharifi, A.; Tahir, M.N.; Tariq, A.; Zhang, L.; Mumtaz, F.; Shah, S.H.I.A. Evaluation of Vegetation Indices and Phenological Metrics Using Time-Series MODIS Data for Monitoring Vegetation Change in Punjab, Pakistan. Water 2021, 13, 2550. [Google Scholar] [CrossRef]
- Sousa, F.D.A.S.; Vieira, V.R.; Vicente de Paulo, R.; Silva Melo, V.; Souza Guedes, R.W. Estimativas dos riscos de chuvas extremas nas capitais do Nordeste do Brasil. Rev. Bras. Geo. Fis. 2016, 9, 430–439. [Google Scholar] [CrossRef] [Green Version]
- Da Silva, D.F.; Lima, M.J.S.; Souza Neto, P.F.; Gomes, H.B.; Silva, F.D.S.; Almeida, H.R.R.C.; Costa, R.L. Caracterização de eventos extremos e de suas causas climáticas com base no índice Padronizado de Precipitação Para o Leste do Nordeste. Rev. Bras. Geo. Fis. 2020, 13, 449–464. [Google Scholar] [CrossRef]
- Mandú, T.B. Variabilidade da intensidade da precipitação no período chuvoso em Recife-PE. Braz. J. Develop. 2020, 6, 69045–69053. [Google Scholar]
- IBGE—Instituto Brasileiro de Geografia e Estatística, 2022. Censos 2000 e 2010. Available online: https://ww2.ibge.gov.br/home/estatistica/populacao/censo2010/indicadores_sociais_municipais/ (accessed on 13 February 2022).
- Harrel, F. Regression Modeling Strategies: With Applications to Linear Models, Logistic Regression, and Survival Analysis; Chapter 5: Resampling, Validating, and Simplifying the Model; Springer: Berlin/Heidelberg, Germany, 2001; Volume 3, pp. 88–103. [Google Scholar]
- Junger, W.; Ponce de Leon, A. Mtsdi: Multivariate Time Series Data Imputation: R Package Version 0.3.5. 2018. Available online: https://CRAN.R-project.org (accessed on 20 April 2022).
- Gois, G.; Freitas, W.K.; Terassi, P.M.B.; Oliveira-Júnior, J.F.; Portz, A. Variabilidade Anual e Mensal da Chuva e da Temperatura do Ar no Município de Resende, Rio de Janeiro. Rev. Bras. Climatol. 2019, 24, 67–88. [Google Scholar] [CrossRef] [Green Version]
- Gois, G.; Oliveira-Júnior, J.F.; Silva Junior, C.A.; Sobral, B.S.; Terassi, P.M.B.; Leonel Junior, A.H.S. Statistical normality and homogeneity of a 71-year rainfall dataset for the state of Rio de Janeiro-Brazil. Theor. Appl. Climatol. 2020, 141, 1573–1591. [Google Scholar] [CrossRef]
- NOAA/CPC—National Oceanic and Atmospheric Administration/Climate Prediction Center. Available online: http://www.cpc.ncep.noaa.gov/products/analysis_monitoring/ensostuff/ensoyears.shtml (accessed on 20 January 2022).
- Mann, H.B. Nonparametric tests against trend. Econom. J. Econom. Soc. 1954, 13, 245–259. [Google Scholar] [CrossRef]
- Kendall, M. Rank Correlation Measures; Charles Griffin: London, UK, 1975; Volume 202, p. 15. [Google Scholar]
- Hänsel, S.; Medeiros, D.M.; Matschullat, J.; Petta, R.A.; de Mendonça Silva, I. Assessing homogeneity and climate variability of temperature and precipitation series in the capitals of north-eastern Brazil. Front. Earth Sci. 2016, 4, 29. [Google Scholar] [CrossRef] [Green Version]
- Oliveira-Júnior, J.F.; Correia Filho, W.L.F.; Santiago, D.B.; Gois, G.; Costa, M.; Silva Junior, C.A.; Teodoro, P.E.; Freire, F.M. Rainfall in Brazilian Northeast via in situ data and CHELSA product: Mapping, trends, and socio-environmental implications. Environ. Monit. Assess. 2021, 193, 263–281. [Google Scholar] [CrossRef] [PubMed]
- Jimenez, J.C.; Libonati, R.; Peres, L.F. Droughts over Amazonia in 2005, 2010, and 2015: A cloud cover perspective. Front. Earth Sci. 2018, 6, 227. [Google Scholar] [CrossRef] [Green Version]
- Xie, X.; He, B.; Guo, L.; Huang, L.; Hao, X.; Zhang, Y.; Wang, S. Revisiting dry season vegetation dynamics in the Amazon rainforest using different satellite vegetation datasets. Agric. For. Meteorol. 2022, 312, 108704. [Google Scholar] [CrossRef]
- Aragão, R.D.; Santana, G.R.D.; Da Costa, C.E.F.F.; Cruz, M.A.S.; Figueiredo, E.D.; Srinivasan, V.S. Chuvas intensas para o estado de Sergipe com base em dados desagregados de chuva diária. Rev. Bras. Eng. Agríc. Amb. 2013, 17, 243–252. [Google Scholar] [CrossRef]
- Oliveira Júnior, J.F.; Lyra, G.B.; Gois, G.; Brito, T.T.; Moura, N.S.H. Análise de homogeneidade de séries pluviométricas para determinação do índice de seca IPP no estado de Alagoas. Flor. Amb. 2012, 19, 101–112. [Google Scholar] [CrossRef] [Green Version]
- Oliveira Júnior, J.F.; Gois, G.; Silva, I.J.L.; Jardim, A.M.R.F.; Silva, M.V.; Shah, M.; Jamjareegulgarn, P. Wet and dry periods in the state of Alagoas (Northeast Brazil) via Standardized Precipitation Index. J. Atmos. Sol. Terr. Phys. 2021, 224, 105746. [Google Scholar] [CrossRef]
- Rodrigues, E.L.; Lopes, R.F.C.; Sousa, F.A.S. Análise estatística da variabilidade da precipitação para o Município de João Pessoa-PB. Braz. J. Dev. 2021, 7, 73263–73271. [Google Scholar] [CrossRef]
- Zhang, L.; Huang, M.; Li, M.; Lu, S.; Yuan, X.; Li, J. Experimental Study on Evolution of Fracture Network and Permeability Characteristics of Bituminous Coal Under Repeated Mining Effect. Nat. Resour. Res. 2021, 31, 463–486. [Google Scholar] [CrossRef]
- Zhang, L.; Huang, M.; Xue, J.; Li, M.; Li, J. Repetitive Mining Stress and Pore Pressure Effects on Permeability and Pore Pressure Sensitivity of Bituminous Coal. Nat. Resour. Res. 2021, 30, 4457–4476. [Google Scholar] [CrossRef]
- Gao, C.; Hao, M.; Chen, J.; Gu, C. Simulation and design of joint distribution of rainfall and tide level in Wuchengxiyu Region, China. Urban Clim. 2021, 40, 101005. [Google Scholar] [CrossRef]
- Quan, Q.; Gao, S.; Shang, Y.; Wang, B. Assessment of the sustainability of Gymnocypris eckloni habitat under river damming in the source region of the Yellow River. Sci. Total Environ. 2021, 778, 146312. [Google Scholar] [CrossRef] [PubMed]
- Zhang, K.; Wang, S.; Bao, H.; Zhao, X. Characteristics and influencing factors of rainfall-induced landslide and debris flow hazards in Shaanxi Province, China. Nat. Hazards Earth Syst. Sci. 2019, 19, 93–105. [Google Scholar] [CrossRef] [Green Version]
- Pinheiro, J.M.; Araújo, R.R. Impactos do fenômeno El Niño e La Niña no município de São Luís-Maranhão. Rev. GeoUECE 2019, 8, 124–136. [Google Scholar]
- Chaves, R.R.; Cavalcanti, I.F.A. Atmospheric circulation features associated with rainfall variability over southern Northeast Brazil. Mon. Weather Rev. 2001, 129, 2614–2626. [Google Scholar] [CrossRef]
- Oliveira, D.H.M.C.; Lima, K.C. What is the return period of intense rainfall events in the capital cities of the northeast region of Brazil? Atmos. Sci. Lett. 2019, 20, e934. [Google Scholar] [CrossRef] [Green Version]
- Uvo, C.R.B.; Berndtsson, R. Regionalization and Spatial Properties of Ceará State Rainfall in Northeast Brazil. J. Geophys. Res. Atmos. 1996, 101, 4221–4233. [Google Scholar] [CrossRef] [Green Version]
- Kousky, V.E. Frontal influences on northeast Brazil. Mon. Weather Rev. 1979, 107, 1140–1153. [Google Scholar] [CrossRef]
- Li, Z.; Zhang, K. Comparison of Three GIS-Based Hydrological Models. J. Hydrol. Eng. 2008, 13, 364–370. [Google Scholar] [CrossRef]
- Xie, W.; Li, X.; Jian, W.; Yang, Y.; Liu, H.; Robledo, L.F.; Nie, W.A. Novel Hybrid Method for Landslide Susceptibility Mapping-Based GeoDetector and Machine Learning Cluster: A Case of Xiaojin County, China. ISPRS Int. J. Geo-Inf. 2021, 10, 93. [Google Scholar] [CrossRef]
- Xie, W.; Nie, W.; Saffari, P.; Robledo, L.F.; Descote, P.; Jian, W. Landslide hazard assessment based on Bayesian optimization–support vector machine in Nanping City, China. Nat. Hazards 2021, 109, 931–948. [Google Scholar] [CrossRef]
- Zhu, Z.; Wu, Y.; Liang, Z. Mining-Induced Stress and Ground Pressure Behavior Characteristics in Mining a Thick Coal Seam with Hard Roofs. Front. Earth Sci. 2022, 10, 843191. [Google Scholar] [CrossRef]
- Guo, Y.; Yang, Y.; Kong, Z.; He, J.; Wu, H. Development of Similar Materials for Liquid-Solid Coupling and Its Application in Water Outburst and Mud Outburst Model Test of Deep Tunnel. Geofluids 2022, 2022. [Google Scholar] [CrossRef]
- Kousky, V.E. Diurnal rainfall variation in northeast Brazil. Mon. Weather Rev. 1980, 108, 488–498. [Google Scholar] [CrossRef]
- Silva, V.P.R. On climate variability in Northeast of Brazil. J. Arid Environ. 2004, 58, 574–596. [Google Scholar] [CrossRef]
- Correia Filho, W.L.F.; Oliveira-Júnior, J.F.; Santos, C.T.B.; Batista, B.A.; Barros Santiago, D.; Silva Junior, C.A.; Teodoro, P.E.; Costa, C.E.S.; Silva, E.B.; Freire, F.M. The influence of urban expansion in the socio-economic, demographic, and environmental indicators in the City of Arapiraca-Alagoas, Brazil. Remote Sens. Appl. Soc. Environ. 2022, 25, 100662. [Google Scholar] [CrossRef]
- da Silva, M.V.; Pandorfi, H.; Jardim, A.M.D.R.F.; Oliveira-Júnior, J.F.; Divincula, J.S.; Giongo, P.R.; Silva, T.G.F.; Almeida, G.L.P.; Moura, G.B.A.; Lopes, P.M.O. Spatial modeling of rainfall patterns and groundwater on the coast of northeastern Brazil. Urban Clim. 2021, 38, 100911. [Google Scholar] [CrossRef]
- Chen, Z.; Liu, Z.; Yin, L.; Zheng, W. Statistical analysis of regional air temperature characteristics before and after dam construction. Urban Clim. 2022, 41, 101085. [Google Scholar] [CrossRef]
- Yin, L.; Wang, L.; Keim, B.D.; Konsoer, K.; Zheng, W. Wavelet Analysis of Dam Injection and Discharge in Three Gorges Dam and Reservoir with Precipitation and River Discharge. Water 2022, 14, 567. [Google Scholar] [CrossRef]
- Yin, L.; Wang, L.; Zheng, W.; Ge, L.; Tian, J.; Liu, Y.; Liu, S. Evaluation of Empirical Atmospheric Models Using Swarm-C Satellite Data. Atmosphere 2022, 13, 294. [Google Scholar] [CrossRef]
- Zhao, T.; Shi, J.; Lv, L.; Xu, H.; Chen, D.; Cui, Q.; Zhang, Z. Soil moisture experiment in the Luan River supporting new satellite mission opportunities. Remote Sens. Environ. 2020, 240, 111680. [Google Scholar] [CrossRef]
- Zhao, T.; Shi, J.; Entekhabi, D.; Jackson, T.J.; Hu, L.; Peng, Z.; Kang, C.S. Retrievals of soil moisture and vegetation optical depth using a multi-channel collaborative algorithm. Remote Sens. Environ. 2021, 257, 112321. [Google Scholar] [CrossRef]
- Chen, J.; Du, L.; Guo, Y. Label constrained convolutional factor analysis for classification with limited training samples. Inf. Sci. 2021, 544, 372–394. [Google Scholar] [CrossRef]
- Li, Y.; Du, L.; Wei, D. Multiscale CNN Based on Component Analysis for SAR ATR. IEEE Trans. Geosci. Remote Sens. 2022, 60, 1–12. [Google Scholar] [CrossRef]
- Liao, L.; Du, L.; Guo, Y. Semi-Supervised SAR Target Detection Based on an Improved Faster R-CNN. Remote Sens. 2021, 14, 143. [Google Scholar] [CrossRef]
- Tian, H.; Qin, Y.; Niu, Z.; Wang, L.; Ge, S. Summer Maize Mapping by Compositing Time Series Sentinel-1A Imagery Based on Crop Growth Cycles. J. Indian Soc. Remote Sens. 2021, 49, 2863–2874. [Google Scholar] [CrossRef]
- Tian, H.; Wang, Y.; Chen, T.; Zhang, L.; Qin, Y. Early-Season Mapping of Winter Crops Using Sentinel-2 Optical Imagery. Remote Sens. 2021, 13, 3822. [Google Scholar] [CrossRef]
- Zhao, M.; Zhou, Y.; Li, X.; Cheng, W.; Zhou, C.; Ma, T.; Huang, K. Mapping urban dynamics (1992–2018) in Southeast Asia using consistent nighttime light data from DMSP and VIIRS. Remote Sens. Environ. 2020, 248, 111980. [Google Scholar] [CrossRef]
- Zhao, M.; Zhou, Y.; Li, X.; Zhou, C.; Cheng, W.; Li, M.; Huang, K. Building a Series of Consistent Night-Time Light Data (1992–2018) in Southeast Asia by Integrating DMSP-OLS and NPP-VIIRS. IEEE Trans. Geosci. Remote Sens. 2020, 58, 1843–1856. [Google Scholar] [CrossRef]
- Jiang, S.; Zuo, Y.; Yang, M.; Feng, R. Reconstruction of the Cenozoic tectono-thermal history of the Dongpu Depression, Bohai Bay Basin, China: Constraints from apatite fission track and vitrinite reflectance data. J. Pet. Sci. Eng. 2021, 205, 108809. [Google Scholar] [CrossRef]
- Zuo, Y.; Jiang, S.; Wu, S.; Xu, W.; Zhang, J.; Feng, R.; Santosh, M. Terrestrial heat flow and lithospheric thermal structure in the Chagan Depression of the Yingen-Ejinaqi Basin, north central China. Basin Res. 2020, 32, 1328–1346. [Google Scholar] [CrossRef]
- Zhang, Z.; Luo, C.; Zhao, Z. Application of probabilistic method in maximum tsunami height prediction considering stochastic seabed topography. Nat. Hazards 2020, 104, 2511–2530. [Google Scholar] [CrossRef]


| Capitals | Population (1991) | Population (2000) | Population (2010) | Population (2020) |
|---|---|---|---|---|
| Aracaju | 404,828 | 451,027 | 571,149 | 664,908 |
| Fortaleza | 1,708,741 | 2,139,372 | 2,452,185 | 2,686,612 |
| João Pessoa | 484,291 | 594,968 | 723,515 | 817,511 |
| Maceió | 699,760 | 806,167 | 932,748 | 1,025,360 |
| Natal | 606,276 | 699,339 | 803,739 | 890,480 |
| Recife | 1,335,684 | 1,388,193 | 1,537,704 | 1,653,461 |
| Salvador | 2,075,392 | 2,331,612 | 2,675,656 | 2,886,698 |
| São Luís | 781,374 | 855,442 | 1,014,837 | 1,108,975 |
| Teresina | 591,164 | 703,796 | 814,230 | 868,075 |
| ID | Capitals | Lat. (°) | Long. (°) | Alt. (m) | Average Rainfall (mm) | Percentage of Failures ** (%) |
|---|---|---|---|---|---|---|
| 1 | Aracaju | −10.95 | −37.05 | 3.68 | 1403.13 | 16.12 |
| 2 | Fortaleza | −3.82 | −38.54 | 29.89 | 1607.61 | 20.08 |
| 3 | João Pessoa | −7.10 | −34.85 | 9.67 | 1906.07 | 10.79 |
| 4 | Maceió | −9.55 | −35.77 | 84.12 | 1867.25 | 26.64 |
| 5 | Natal | −5.84 | −35.21 | 47.68 | 1616.26 | 25.82 |
| 6 | Recife | −8.06 | −34.96 | 11.3 | 2276.68 | 3.28 |
| 7 | Salvador | −13.01 | −38.51 | 47.35 | 1968.17 | 18.85 |
| 8 | São Luís | −2.53 | −44.21 | 32.58 | 2094.54 | 13.93 |
| 9 | Teresina | −5.03 | −42.80 | 75.73 | 1262.36 | 31.56 |
| El Niño | La Niña | |||||
|---|---|---|---|---|---|---|
| Weak | Moderate | Strong | Very Strong | Weak | Moderate | Strong |
| 1952–53 | 1951–52 | 1957–58 | 1982–83 | 1954–55 | 1955–56 | 1973–74 |
| 1953–54 | 1963–64 | 1965–66 | 1997–98 | 1964–65 | 1970–71 | 1975–76 |
| 1958–59 | 1968–69 | 1972–73 | 2015–16 | 1971–72 | 1995–96 | 1988–89 |
| 1969–70 | 1986–87 | 1987–88 | 1974–75 | 2011–12 | 1998–99 | |
| 1976–77 | 1994–95 | 1991–92 | 1983–84 | 2020–21 | 1999–00 | |
| 1977–78 | 2002–03 | 1984–85 | 2007–08 | |||
| 1979–80 | 2009–10 | 2000–01 | 2010–11 | |||
| 2004–05 | 2005–06 | |||||
| 2006–07 | 2008–09 | |||||
| 2014–15 | 2016–17 | |||||
| 2018–19 | 2017–18 | |||||
| Category | Scale |
|---|---|
| Significant trend of increase (STI) | ZMK > +1.96 |
| Non-significant increasing trend (NSIT) | ZMK < +1.96 |
| No trend (NT) | ZMK = 0 |
| Non-significant downward trend (NSDT) | ZMK > −1.96 |
| Significant downward trend (SDT) | ZMK < −1.96 |
| Capitals | (mm) | |||||
|---|---|---|---|---|---|---|
| Aracaju | 1382.7 | 1328.1 | 432.3 | 3126.3 | 738.0 | 31% |
| Fortaleza | 1607.6 | 1620.8 | 513.9 | 2900.1 | 636.2 | 32% |
| João pessoa | 1906.1 | 1971.5 | 637.8 | 3888.4 | 501.2 | 33% |
| Maceió | 1867.3 | 1825.4 | 436.3 | 3033.1 | 997.2 | 23% |
| Natal | 1616.3 | 1527.3 | 349.3 | 2485.9 | 849.0 | 22% |
| Recife | 2276.7 | 2260.4 | 468.4 | 3527.1 | 1249.7 | 21% |
| Salvador | 1968.2 | 1999.6 | 393.1 | 3223.2 | 1233.2 | 20% |
| São luís | 2094.5 | 1966.4 | 627.0 | 3981.3 | 647.0 | 30% |
| Teresina | 1262.4 | 1267.0 | 296.1 | 2028.0 | 334.8 | 23% |
| Capitals | |
|---|---|
| Aracaju | −4.24 |
| Fortaleza | −1.43 |
| João Pessoa | −1.32 |
| Maceió | −2.22 |
| Natal | −1.01 |
| Recife | −1.44 |
| Salvador | −4.64 |
| São Luís | −0.29 |
| Teresina | −1.14 |
Publisher’s Note: MDPI stays neutral with regard to jurisdictional claims in published maps and institutional affiliations. |
© 2022 by the authors. Licensee MDPI, Basel, Switzerland. This article is an open access article distributed under the terms and conditions of the Creative Commons Attribution (CC BY) license (https://creativecommons.org/licenses/by/4.0/).
Share and Cite
da Silva Monteiro, L.; de Oliveira-Júnior, J.F.; Ghaffar, B.; Tariq, A.; Qin, S.; Mumtaz, F.; Correia Filho, W.L.F.; Shah, M.; da Rosa Ferraz Jardim, A.M.; da Silva, M.V.; et al. Rainfall in the Urban Area and Its Impact on Climatology and Population Growth. Atmosphere 2022, 13, 1610. https://doi.org/10.3390/atmos13101610
da Silva Monteiro L, de Oliveira-Júnior JF, Ghaffar B, Tariq A, Qin S, Mumtaz F, Correia Filho WLF, Shah M, da Rosa Ferraz Jardim AM, da Silva MV, et al. Rainfall in the Urban Area and Its Impact on Climatology and Population Growth. Atmosphere. 2022; 13(10):1610. https://doi.org/10.3390/atmos13101610
Chicago/Turabian Styleda Silva Monteiro, Lua, José Francisco de Oliveira-Júnior, Bushra Ghaffar, Aqil Tariq, Shujing Qin, Faisal Mumtaz, Washington Luiz Félix Correia Filho, Munawar Shah, Alexandre Maniçoba da Rosa Ferraz Jardim, Marcos Vinícius da Silva, and et al. 2022. "Rainfall in the Urban Area and Its Impact on Climatology and Population Growth" Atmosphere 13, no. 10: 1610. https://doi.org/10.3390/atmos13101610