
Airborne Bacteria in Gliwice—The Industrialized City in Poland
 ,
, 
Abstract
:1. Introduction
2. Materials and Methods
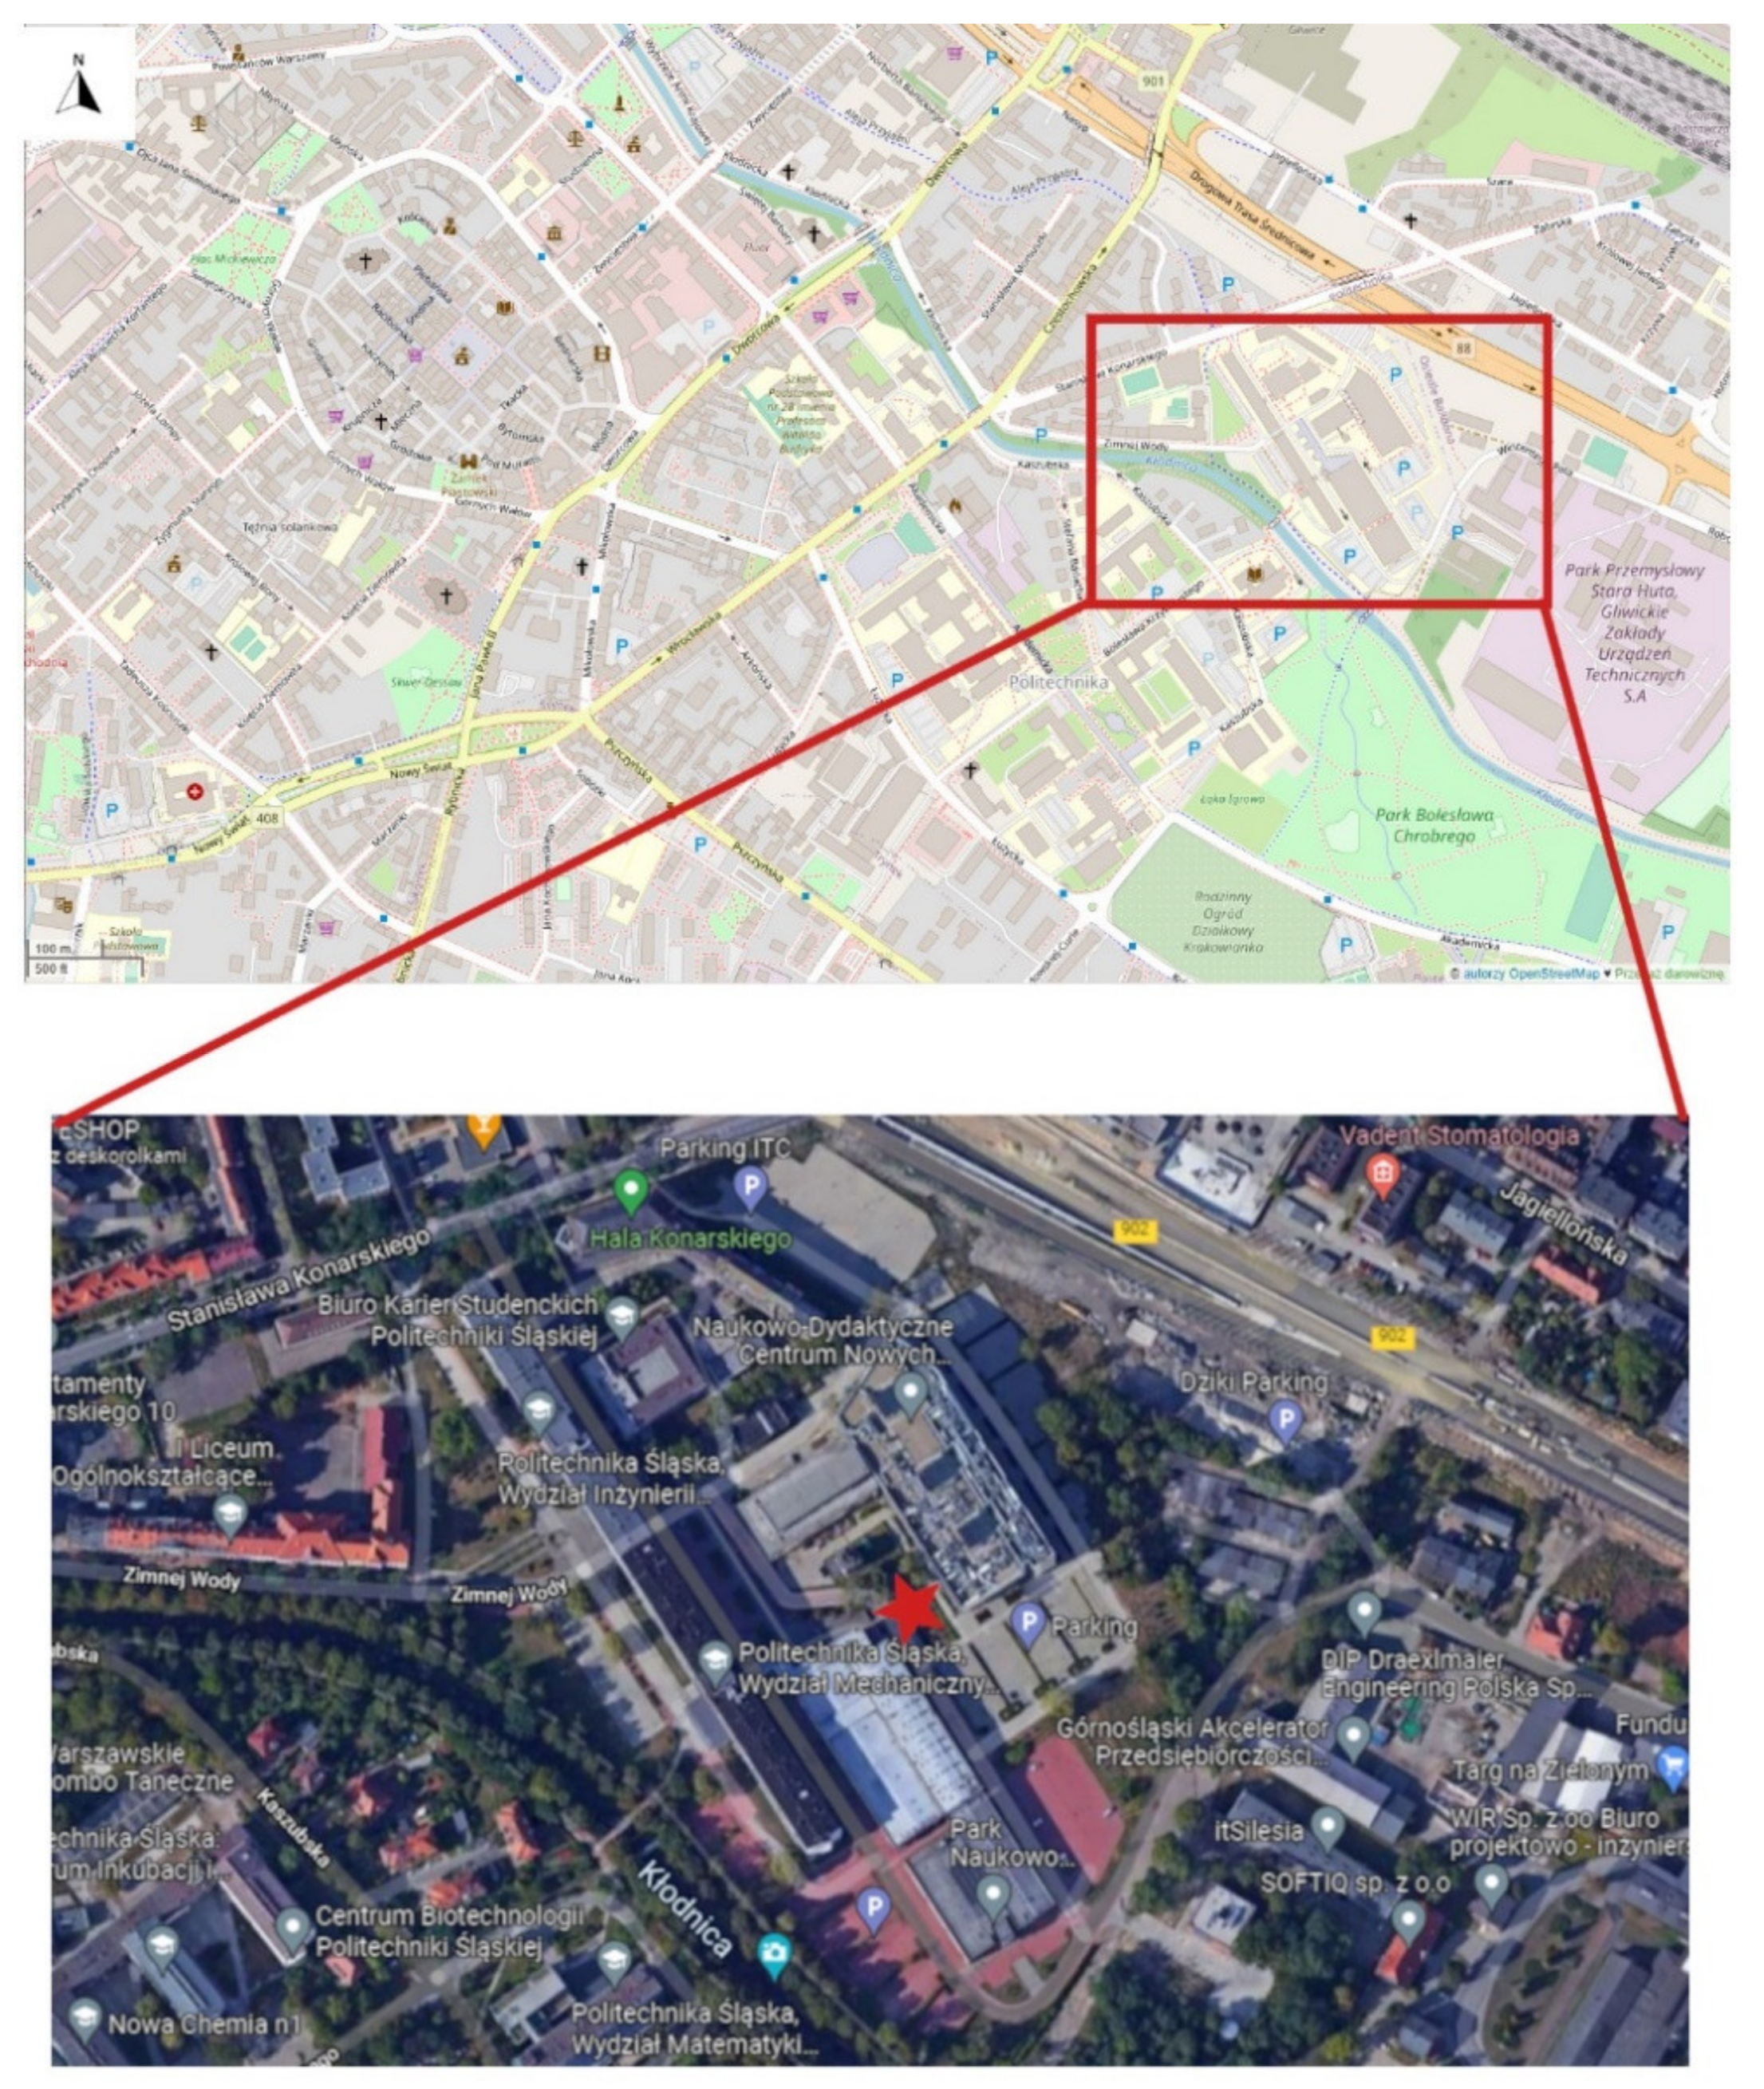
2.1. Study Site and Weather Conditions
2.2. Sampling and Determination of the Concentration of Viable Bacteria
2.3. Species Identification
2.4. Total Bioaerosol Concentration
2.5. Sterilization Phenomenon
2.6. Statistical Analysis
3. Results and Discussion
4. Conclusions
Author Contributions
Funding
Institutional Review Board Statement
Informed Consent Statement
Data Availability Statement
Acknowledgments
Conflicts of Interest
Abbreviations
| ACFM | Actual cubic feet per minute |
| ANOVA | Analysis of variance |
| API | Analytical profile index |
| CFU | Colony Forming Units |
| DAPI | 4′,6-diamidino-2-phenylindole |
| ISO | International Organization for Standardization |
| NAD(P)H | Nicotinamide adenine dinucleotide |
| n.i. | not identified |
| STD | Standard deviation |
| S-W | Shapiro-Wilk test |
| TSA | Trypticase soy agar |
| TYGA | Tryptone Glucose Yeast Extract Agar |
| UV | Ultraviolet |
References
- Douwes, J.; Thorne, P.; Pearce, N.; Heederik, D. Bioaerosol health effects and exposure assessment: Progress and prospects. Ann. Occup. Hyg. 2003, 47, 187–200. [Google Scholar] [CrossRef] [PubMed] [Green Version]
- Ghosh, B.; Lal, H.; Srivastava, A. Review of bioaerosols in indoor environment with special reference to sampling, analysis and control mechanisms. Environ. Intern. 2015, 85, 254–272. [Google Scholar] [CrossRef] [PubMed]
- Lee, T.; Grinshpun, S.A.; Martuzevicius, D.; Adhikari, A.; Crawford, C.M.; Reponen, T. Culturability and concentration of indoor and outdoor airborne fungi in six single-family homes. Atmos. Environ. 2006, 40, 2902–2910. [Google Scholar] [CrossRef] [Green Version]
- Den Boer, J.W.; Yzerman, E.P.F.; Schellekens, J.; Lettinga, K.D.; Boshuizen, H.C.; Van Steenbergen, J.E.; Bosman, A.; Van den Hof, S.; Van Vliet, H.A.; Peeters, M.F.; et al. A large outbreak of Legionnaires’ disease at a flower show, the Netherlands, 1999. Emer. Inf. Dis. 2002, 8, 37–43. [Google Scholar] [CrossRef] [Green Version]
- Mahoney, F.J.; Hoge, C.W.; Farley, T.A.; Barbaree, J.M.; Breiman, R.F.; Benson, R.F.; Mcfarland, L.M. Community-wide outbreak of legionnaires-disease associated with a grocery store mist machine. J. Infect. Dis. 1992, 165, 36–739. [Google Scholar] [CrossRef]
- Ostro, B.; Lipsett, M.; Mann, J.; Braxton-Owens, H.; White, M. Air pollution and exacerbation of asthma in African-American children in Los Angeles. Epidemiology 2001, 12, 200–208. [Google Scholar] [CrossRef]
- Vogelzang, P.F.J.; van der Gulden, J.W.J.; Folgering, H.; Kolk, J.J.; Heederik, D.; Preller, L.; Tielen, M.J.M.; van Schayck, C.P. Endotoxin exposure as a major determinant of lung function decline in pig farmers. Am. J. Resp. Critic. Care Med. 1998, 157, 15–18. [Google Scholar] [CrossRef] [PubMed] [Green Version]
- Khuder, S.A.; Mutgi, A.B.; Schaub, E.A. Meta-analyses of brain cancer and farming. Am. J. Indus. Med. 1998, 34, 252–260. [Google Scholar] [CrossRef]
- Mbareche, H.; Morawska, L.; Duchaine, C. On the interpretation of bioaerosol exposure measurements and impacts on health. J. Air Waste Managem. Assoc. 2019, 69, 789–804. [Google Scholar] [CrossRef] [Green Version]
- Thorne, P.S.; Adamcakova-Dodd, A.; Kelly, K.M.; O’Neill, M.E.; Duchaine, C. Metalworking fluid with mycobacteria and endotoxin induces hypersensitivity pneumonitis in mice. Am. J. Resp. and Critic. Care Med. 2006, 173, 759–768. [Google Scholar] [CrossRef]
- Donderski, W.; Walczak, M.; Pietrzak, M. Microbial contamination of air within the city of Toruń. Pol. J. Environ. Stud. 2005, 14, 223–230. [Google Scholar]
- Abshire, R.L.; Dunton, H. Resistance of selected strains of Pseudomonas aeruginosa to low-intensity ultraviolet radiation. Appl. Environ. Microbiol. 1981, 41, 1410–1423. [Google Scholar] [CrossRef] [Green Version]
- Xi, Z.; Qi, J.; Li, H.; Dong, L.; Gao, D. Seasonal distribution of microbial activity in bioaerosols in the outdoor environment of the Qingdao coastal region. Atmos. Environ. 2016, 140, 506–513. [Google Scholar] [CrossRef]
- Ehrenberg, E.O. Neue Beobachtungen über blauartige Erscheinungen in Aegypten und Siberien nebst einer Ubersicht und Kritik der fr üher bekannten. Ann. Phys. Chem. 1830, 18, 477–514. [Google Scholar] [CrossRef] [Green Version]
- Pasteur, L. Nouvelles experiences relatives aux générations dites spontanées. Mallet-Bachelier. 1860. Available online: http://visualiseur.bnf.fr/Visualiseur?Destination=Gallica&O=NUMM-3008 (accessed on 13 October 2022).
- Pasteur, L. Suite à une précédente communication relative aux générations dites spontanées. Académie des Sciences. 1860. Available online: https://www.academie-sciences.fr/archivage_site/fondations/lp_pdf/CR1860_p303.pdf (accessed on 13 October 2022).
- Gong, J.; Qi, J.; Beibei, E.; Yin, Y.; Gao, D. Concentration, viability and size distribution of bacteria in atmospheric bioaerosols under different types of pollution. Environ. Poll. 2020, 257, 113485. [Google Scholar] [CrossRef] [PubMed]
- Pastuszka, J.S.; Paw, U.K.T.; Lis, D.O.; Wlazło, A.; Ulfig, K. Bacterial and fungal aerosol in indoor environment in Upper Silesia, Poland. Atmos. Environ. 2000, 34, 3833–3842. [Google Scholar] [CrossRef]
- Brągoszewska, E.; Mainka, A.; Pastuszka, J.S.; Lizończyk, K.; Desta, Y.G. Assessment of bacterial aerosol in a preschool, primary school and high school in Poland. Atmosphere 2018, 9, 87. [Google Scholar] [CrossRef] [Green Version]
- Jones, A.M.; Harrison, R.M. The effects of meteorological factors on atmospheric bioaerosol concentrations—A review. Sci. Total Environ. 2004, 326, 151–180. [Google Scholar] [CrossRef]
- Van Leuken, J.P.G.; Swart, A.N.; Droogers, P.; van Pul, A.; Heederik, D.; Havelaar, A.H. Climate change effects on airborne pathogenic bioaerosol concentrations: A scenario analysis. Aerobiologia 2016, 32, 607–617. [Google Scholar] [CrossRef] [Green Version]
- Fröhlich-Nowoisky, J.; Kampf, C.J.; Weber, B.; Huffman, J.A.; Pöhlker, C.; Andreae, M.O.; Lang-Yona, N.; Burrows, S.M.; Gunthe, S.S.; Elbert, W.; et al. Bioaerosols in the Earth system: Climate, health, and ecosystem interactions. Atmos. Res. 2016, 182, 346–376. [Google Scholar] [CrossRef] [Green Version]
- Gorgoń, J. (Ed.) Urban and Industrial Areas in the Face of Climate Change on the Example of Cities in the Central Part of the Metropolis GZM; Institute of Environmental Engineering of the Polish Academy of Sciences: Zabrze, Poland, 2019. (In Polish) [Google Scholar]
- Griffin, D.W. Atmospheric movement of microorganisms in clouds of desert dust and implications for human health. Clin. Microbiol. Rev. 2007, 20, 459–477. [Google Scholar] [CrossRef] [PubMed]
- Li, X.; Cheng, X.; Wu, W.; Wang, Q.; Tong, Z.; Zhang, X.; Deng, D.; Li, Y. Forecasting of bioaerosol concentration by a Back Propagation neural network model. Sci. Total Environ. 2020, 698, 134315. [Google Scholar] [CrossRef] [PubMed]
- Nevalainen, A.; Willeke, K.; Liebhaber, F.; Pastuszka, J.; Burge, H.; Henningson, E. Bioaerosol sampling. In Aerosol Measurement: Principles, Techniques and Applications; Willeke, K., Baron, P., Eds.; Van Nostrand Reinhold: New York, NY, USA, 1993; pp. 471–492. [Google Scholar]
- Amann, R.I.; Ludwig, W.; Schleifer, K.H. Phylogenetic identification and in situ detection of individual microbial cells without cultivation. Microb. Rev 1995, 59, 143–164. [Google Scholar] [CrossRef] [PubMed]
- Peccia, J.; Hernandez, M. Incorporating polymerase chain reaction-based identification, population characterization, and quantification of microorganisms into aerosol science: A review. Atmos. Environ. 2006, 40, 3941–3961. [Google Scholar] [CrossRef]
- Thorne, P.S. Inhalation toxicology models of endotoxin- and bioaerosol-induced inflammation. Toxicology 2000, 152, 13–23. [Google Scholar] [CrossRef]
- Glazer, C.S.; Martyny, J.W.; Lee, B.; Sanchez, T.L.; Sells, T.M.; Newman, L.S.; Murphy, J.; Heifets, L.; Rose, C.S. Nontuberculous mycobacteria in aerosol droplets and bulk water samples from therapy pools and hot tubs. J. Occup. Environ. Hyg. 2007, 4, 831–840. [Google Scholar] [CrossRef]
- Girard, M.; Lacasse, Y.; Cormier, Y. Hypersensitivity pneumonitis. Allergy 2009, 64, 322–334. [Google Scholar] [CrossRef] [Green Version]
- Blais-Lecours, P.; Perrott, P.; Duchaine, C. Non-culturable bioaerosols in indoor settings: Impact on health and molecular approaches for detection. Atmos. Environ. 2015, 110, 45–53. [Google Scholar] [CrossRef]
- Haig, C.W.; Mackay, W.G.; Walker, J.T.; Williams, C. Bioaerosol sampling: Sampling mechanisms, bioefficiency and field studies. J. Hosp. Inf. 2016, 93, 242–255. [Google Scholar] [CrossRef]
- Pöhlker, C.; Huffman, J.A.; Pöschl, U. Autofluorescence of atmospheric bioaerosols: Spectral fingerprints and taxonomic trends of pollen. Atmos. Meas. Tech. 2013, 6, 3369–3392. [Google Scholar] [CrossRef] [Green Version]
- Roshchina, V. Autofluorescence of plant secreting cells as a biosensor and bioindicator reaction. J. Fluores. 2003, 13, 403–420. [Google Scholar] [CrossRef]
- Roshchina, V.; Yashin, V.A.; Kononov, A.V. Autofluorescence of developing plant vegetative icrospores studied by confocal microscopy and microspectrofluorimetry. J. Fluores. 2004, 14, 745–750. [Google Scholar] [CrossRef] [PubMed]
- Pastuszka, J.S.; Talik, E.; Hacura, A.; Słoka, J.; Wlazło, A. Chemical characterization of airborne bacteria using X-ray photoelectron spectroscopy (XPS) and Fourier transform infrared spectroscopy (FTIR). Aerobiologia 2005, 21, 181–192. [Google Scholar] [CrossRef]
- PN-EN 12322; In Vitro Diagnostic Medical Devices. Culture Media for Microbiology. Performance Criteria for Culture Media. 2005. Available online: https://ec.europa.eu/growth/single-market/european-standards/harmonised-standards/iv-diagnostic-medical-devices_en (accessed on 1 June 2017).
- ISO 11133; Microbiology of Food, Animal Feed and Water—Preparation, Production, Storage and Performance Testing of Culture Media. 2014. Available online: https://www.iso.org/standard/53610.html (accessed on 1 June 2017).
- Hyvärinen, A.M.; Martikanen, P.J.; Nevalainen, A.I. Suitability of poor medium in counting total viable airborne bacteria. Grana 1991, 30, 414–417. [Google Scholar] [CrossRef]
- Commission of the European Communities. Biological Particles in Indoor Environments. In European Collaborative Action Indoor Air Quality & its Impact on Man; Environment and Quality of Life; Report No. 12, EUR 14988EN; Comission of the European Communities: Luxembourg, 1993; Available online: https://www.aivc.org/sites/default/files/members_area/medias/pdf/Inive/ECA/ECA_Report12.pdf (accessed on 5 January 2022).
- Reed, N.G. The history of ultraviolet germicidal irradiation for air disinfection. Public Health Rep. 2010, 125, 15–27. [Google Scholar] [CrossRef]
- Sharp, D.G. The effects of ultraviolet light on bacteria suspended in the air. J. Bacteriol. 1940, 39, 535–547. [Google Scholar] [CrossRef] [Green Version]
- Xu, C.; Chen, H.; Liu, Z.; Sui, G.; Li, D.; Kan, H.; Zhao, Z.; Hu, W.; Chen, J. The decay of airborne bacteria and fungi in a constant temperature and humidity test chamber. Environ. Intern. 2021, 157, 106816. [Google Scholar] [CrossRef]
- Zajic, J.E.; Inculet, I.I.; Martin, P. Basic concept in microbial aerosols. Adv. Biochem. Eng. 1982, 22, 51–91. [Google Scholar]
- Menetrez, M.Y.; Foarde, K.K.; Dean, T.R.; Betancourt, D.A. The effectiveness of UV irradiation on vegetative bacteria and fungi surface contamination. Chem. Eng. J. 2010, 157, 443–450. [Google Scholar] [CrossRef]
- Fang, Z.; Ouyang, Z.; Zheng, H.; Wang, X. Concentration and size distribution of culturable airborne microorganisms in outdoor environments in Beijing, China. Aerosol Sci. Technol. 2008, 42, 325–334. [Google Scholar] [CrossRef] [Green Version]
- Adhikari, A.; Sen, M.M.; Gupta-Bhattacharya, S.; Chanda, S. Airborne viable, non-viable, and allergenic fungi in a rural agricultural area of India: A 2-year study at five outdoor sampling stations. Sci. Total Environ. 2004, 326, 123–141. [Google Scholar] [CrossRef] [PubMed]
- Woo, A.C.; Brar, M.S.; Chan, Y.; Lau, M.C.Y.; Leung, F.C.C.; Scott, J.A.; Vrijmoed, L.L.P.; Zawar-Reza, P.; Pointing, S.B. Temporal variation in airborne microbial populations and microbially-derived allergens in a tropical urban landscape. Atmos. Environ. 2013, 74, 291–300. [Google Scholar] [CrossRef]
- Raisi, L.; Aleksandropoulou, V.; Lazaridis, M.; Katsivela, E. Size distribution of viable, cultivable, airborne microbes and their relationship to particulate matter concentrations and meteorological conditions in a Mediterranean site. Aerobiologia 2013, 29, 233–248. [Google Scholar] [CrossRef]
- Li, M.; Qi, J.; Zhang, H.; Huang, S.; Li, L.; Gao, D. Concentration and size distribution of bioaerosols in an outdoor environment in the Qingdao coastal region. Sci. Total Environ. 2011, 409, 3812–3819. [Google Scholar] [CrossRef] [PubMed]
- Brągoszewska, E. Bacterial Aerosol in the Atmosphere of Gliwice and Its Contribution to the Total Human Exposure to Bacteria Absorbed by Inhalation. Ph.D. Thesis, Silesian University of Technology, Gliwice, Poland, 2014. (In Polish). [Google Scholar]
- Gangamma, S. Characteristics of airborne bacteria in Mumbai urban environment. Sci. Total Environ. 2014, 488, 70–74. [Google Scholar] [CrossRef]
- Spracklen, D.V.; Heald, C.I. The contribution of fungal spores and bacteria to regional and global aerosol number and ice nucleation immersion freezing rates. Atmos. Chem. and Phys. 2014, 14, 9051–9059. [Google Scholar] [CrossRef] [Green Version]
- Yin, Y.; Qi, J.; Gong, J.; Gao, D. Distribution of bacterial concentration and viability in atmospheric aerosols under various weather conditions in the coastal region of China. Sci. Total Environ. 2021, 795, 148713. [Google Scholar] [CrossRef]
- Kowalski, M.; Pastuszka, J.S. Effect of ambient air temperature and solar radiation on changes in bacterial and fungal aerosols concentration in the urban environment. An. Agric. and Environ. Med. 2018, 25, 259–261. [Google Scholar] [CrossRef] [Green Version]
- Kowalski, M. Survival rate of bacterial and fungal microorganisms in ambient air and its effect on the bioaerosol structure. Ph.D. Thesis, Silesian University of Technology, Gliwice, Poland, 2017. (In Polish). [Google Scholar]
- Gates, F.L. A study of the bacterial action of ultra violet light III. The absorption of ultra violet light by bacteria. J. Gen. Physiol. 1930, 14, 31–42. [Google Scholar] [CrossRef]
- Luckiesh, M. Application of Germicidal Erythemal and Infrared Energy; Van Nostrand Company, Inc.: New York, NY, USA, 1946. [Google Scholar]
- Van Ossdell, D.; Foarde, K. Defining the Effectiveness of UV Lamps Installed in Circulating Air Ductwork; Air-Conditioning and Refrigeration Technology Institute: Arlington, TX, USA, 2002. [Google Scholar]
- Hara, K.; Zhang, D.; Yamada, M.; Matsusaki, H.; Arizono, K. A detection of airborne particles carrying viable bacteria in an urban atmosphere in Japan. Asian J. Atmos. Environ. 2011, 5, 152–156. [Google Scholar] [CrossRef] [Green Version]
- Pastuszka, J.S.; Nevalainen, A.; Täubel, M.; Hyvärinen, A. Analysis of the known synergistic effects of the exposure to selected air pollutants. In Synergic Influence of Gaseous, Particulate, and Biological Pollutants on Human Health; Pastuszka, J.S., Ed.; CRC Press, Taylor & Francis Group: Boca Raton, FL, USA, 2016; pp. 245–264. [Google Scholar]
- Hu, W.; Murata, K.; Fan, C.; Huang, S.; Matsusaki, H.; Fu, P.; Zhang, D. Abundance and viability of particle-attached and free-floating bacteria in dusty and nondusty air. Biogeosciences 2020, 17, 4477–4487. [Google Scholar] [CrossRef]


| Season | Temperature of Ambient Air °C | Relative Humidity % | Atmospheric Pressure hPa | Wind Speed m s−1 | Solar Radiation Radiation W m−2 | |||||
|---|---|---|---|---|---|---|---|---|---|---|
| Mean | STD * | Mean | STD * | Mean | STD * | Mean | STD * | Mean | STD * | |
| Spring | 20.9 | 6.3 | 33.1 | 14.4 | 991.3 | 6.3 | 1.3 | 1.3 | 446.0 | 232.5 |
| Summer | 28.8 | 4.8 | 36.2 | 10.7 | 996.2 | 4.2 | 1.4 | 0.9 | 502.9 | 193.2 |
| Autumn | 11.5 | 5.7 | 52.7 | 17.6 | 1000.7 | 5.2 | 1.4 | 0.8 | 147.2 | 165.5 |
| Winter | 3.7 | 4.7 | 61.2 | 15.2 | 996.6 | 13.5 | 1.3 | 0.6 | 144.3 | 78.8 |
| Meteorological Factor | Months in 2015 | ||||||||
|---|---|---|---|---|---|---|---|---|---|
| Apr. | May | June | July | Aug. | Sept. | Oct. | Nov. | Dec. | |
| Average temperature, °C | 8.8 | 13 | 17.2 | 20.3 | 21.9 | 15 | 7.9 | 5.8 | 4.2 |
| Deviation of air temperature, °C (average from the multi-year value) | −0.1 | 0.9 | −0.7 | −1.7 | −4.0 | −1.6 | 0.9 | −2.2 | −4.7 |
| Average wind speed, ms−1 | 2.6 | 2.0 | 2.0 | 2.3 | 2.3 | 2.0 | 2.2 | 2.9 | 3.6 |
| Wind speed multi-year average, ms−1 | 2.7 | 2.4 | 2.3 | 2.2 | 2.1 | 2.3 | 2.6 | 2.9 | 3.2 |
| Wind stillness rate, % | 2.9 | 7.7 | 5.0 | 6.0 | 8.1 | 9.6 | 9.7 | 4.2 | 4.0 |
| Wind stillness multi-year average, % | 9.2 | 11.1 | 11.1 | 12.5 | 15.2 | 13.6 | 11.7 | 7.5 | 6.8 |
| Precipitation sum, mm | 13.5 | 57.7 | 46.9 | 44.5 | 15.3 | 41.8 | 25.2 | 80.6 | 14.2 |
| Number of days with precipitation | 10.0 | 16.0 | 11.0 | 12.0 | 8.0 | 11.0 | 10.0 | 18.0 | 12.0 |
| Multi-year average number of days with precipitation | 13.0 | 15.0 | 16.0 | 14.0 | 13.0 | 13.0 | 14.0 | 16.0 | 18.0 |
| Insolation, h | 205.0 | 175.3 | 207.3 | 289.5 | 280.7 | 142.6 | 137.9 | 93.5 | 83.2 |
| Multi-year average insolation, h | 159.3 | 213.7 | 208.1 | 232.4 | 218.4 | 143.2 | 112.5 | 55.1 | 35.1 |
| Months in 2016 | |||||||||
| Jan. | Feb. | Mar. | Apr. | May | June | July | Aug. | Sept. | |
| Average temperature, °C | −1.7 | 4.0 | 4.5 | 9.0 | 14.3 | 18.3 | 19.0 | 17.6 | 15.8 |
| Deviation of air temperature, °C (average from the multi-year value) | 0.1 | −4.4 | −1.2 | −0.3 | −0.4 | −1.8 | −0.4 | 0.3 | −2.4 |
| Average wind speed, ms−1 | 2.8 | 3.4 | 2.3 | 2.1 | 2.1 | 1.8 | 2.0 | 1.7 | 17 |
| Wind speed multi-year average, ms−1 | 3.4 | 3.3 | 3.2 | 2.7 | 2.4 | 2.3 | 2.2 | 2.1 | 2.3 |
| Wind stillness rate, % | 6.3 | 3.6 | 5.4 | 8.2 | 9.1 | 12.3 | 8.2 | 12.8 | 18.6 |
| Wind stillness multi-year average, % | 6.3 | 5.2 | 5.7 | 9.2 | 11.1 | 11.1 | 12.5 | 15.2 | 13.6 |
| Precipitation sum, mm | 34.7 | 90.9 | 26.7 | 49.0 | 32.7 | 77.7 | 195.3 | 67.9 | 26.2 |
| Number of days with precipitation | 5.0 | 11.0 | 13.0 | 12.0 | 10.0 | 14.0 | 17.0 | 9.0 | 6.0 |
| Multi-year average number of days with precipitation | 18.0 | 17.0 | 15.0 | 13.0 | 15.0 | 16.0 | 14.0 | 13.0 | 13.0 |
| Insolation, h | 59.3 | 54.2 | 101.0 | 156.6 | 214.0 | 254.0 | 215.7 | 240.7 | 224.1 |
| Multi-year average insolation, h | 159.3 | 213.7 | 208.1 | 232.4 | 218.4 | 143.2 | 112.5 | 55.1 | 35.1 |
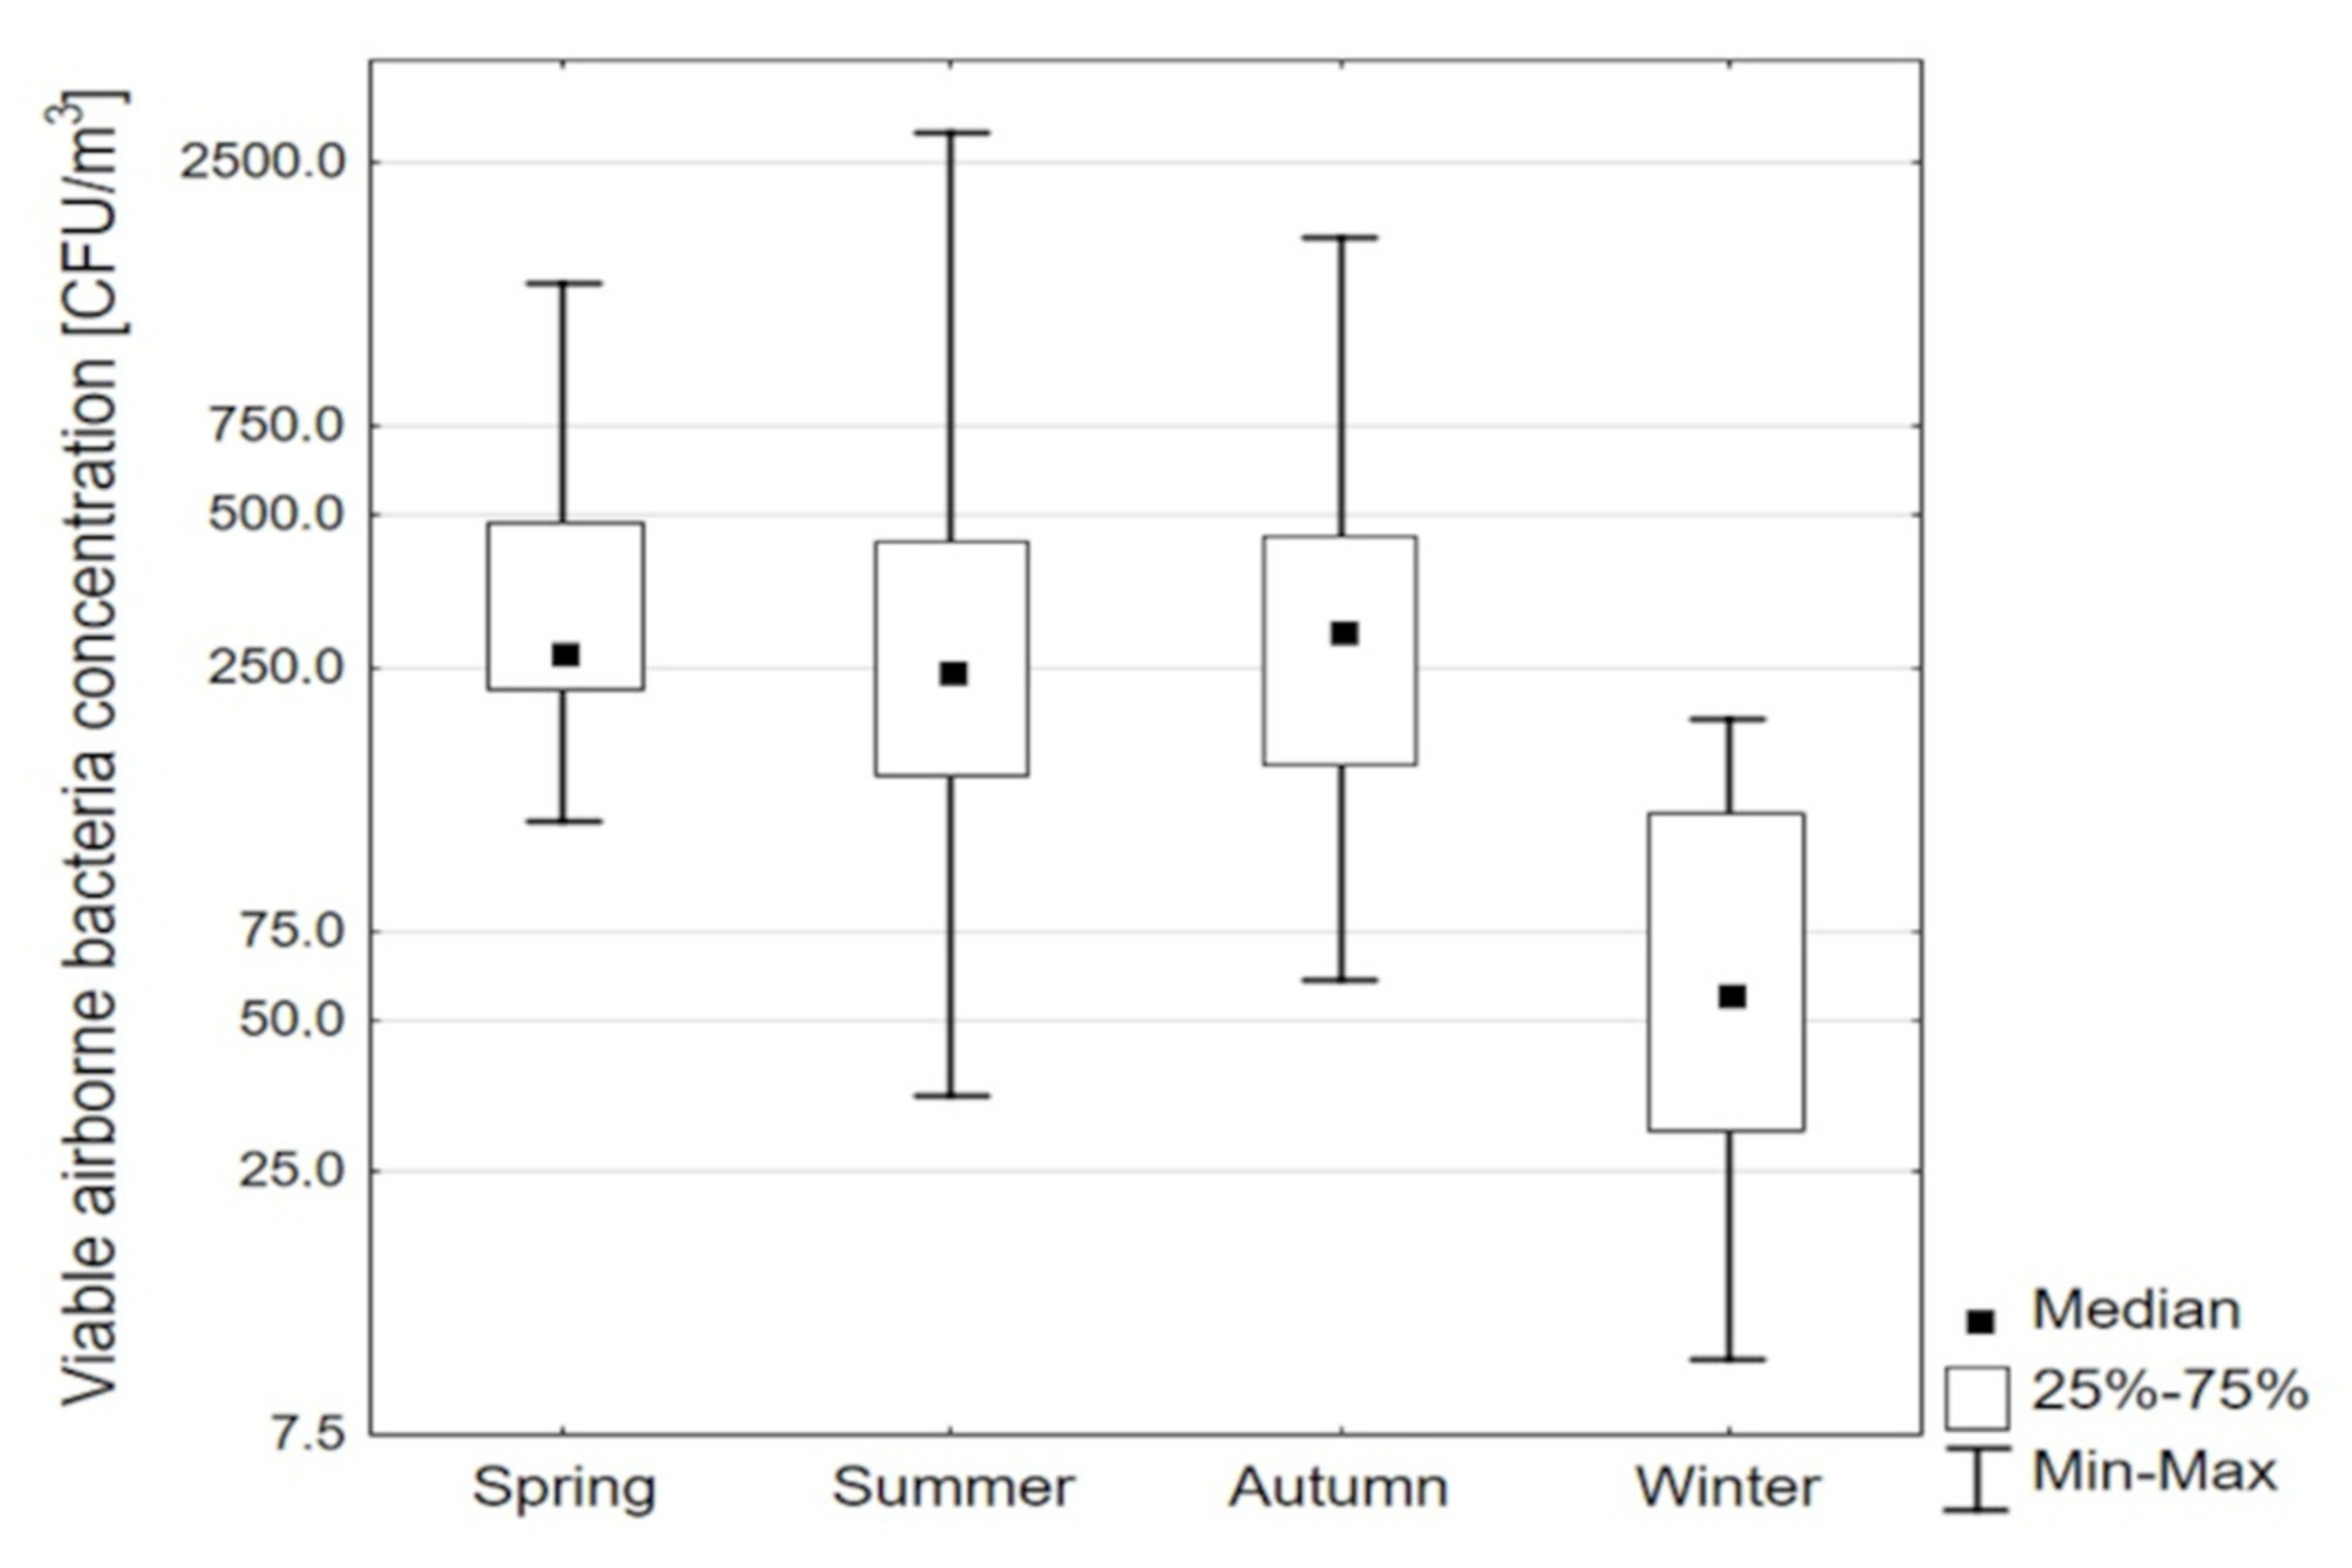
| Season | Number of Samples | Concentration of Viable Bacteria, CFU m−3 | ||||||
|---|---|---|---|---|---|---|---|---|
| Geometric Mean | Min | Q1 | Median | Q3 | Max | IQR | ||
| Spring | 24 | 305 | 124 | 226 | 269 | 481 | 1449 | 254 |
| Summer | 53 | 265 | 35 | 152 | 247 | 445 | 2880 | 293 |
| Autumn | 16 | 283 | 60 | 161 | 297 | 425 | 1780 | 265 |
| Winter | 16 | 57 | 11 | 31 | 57 | 121 | 198 | 90 |
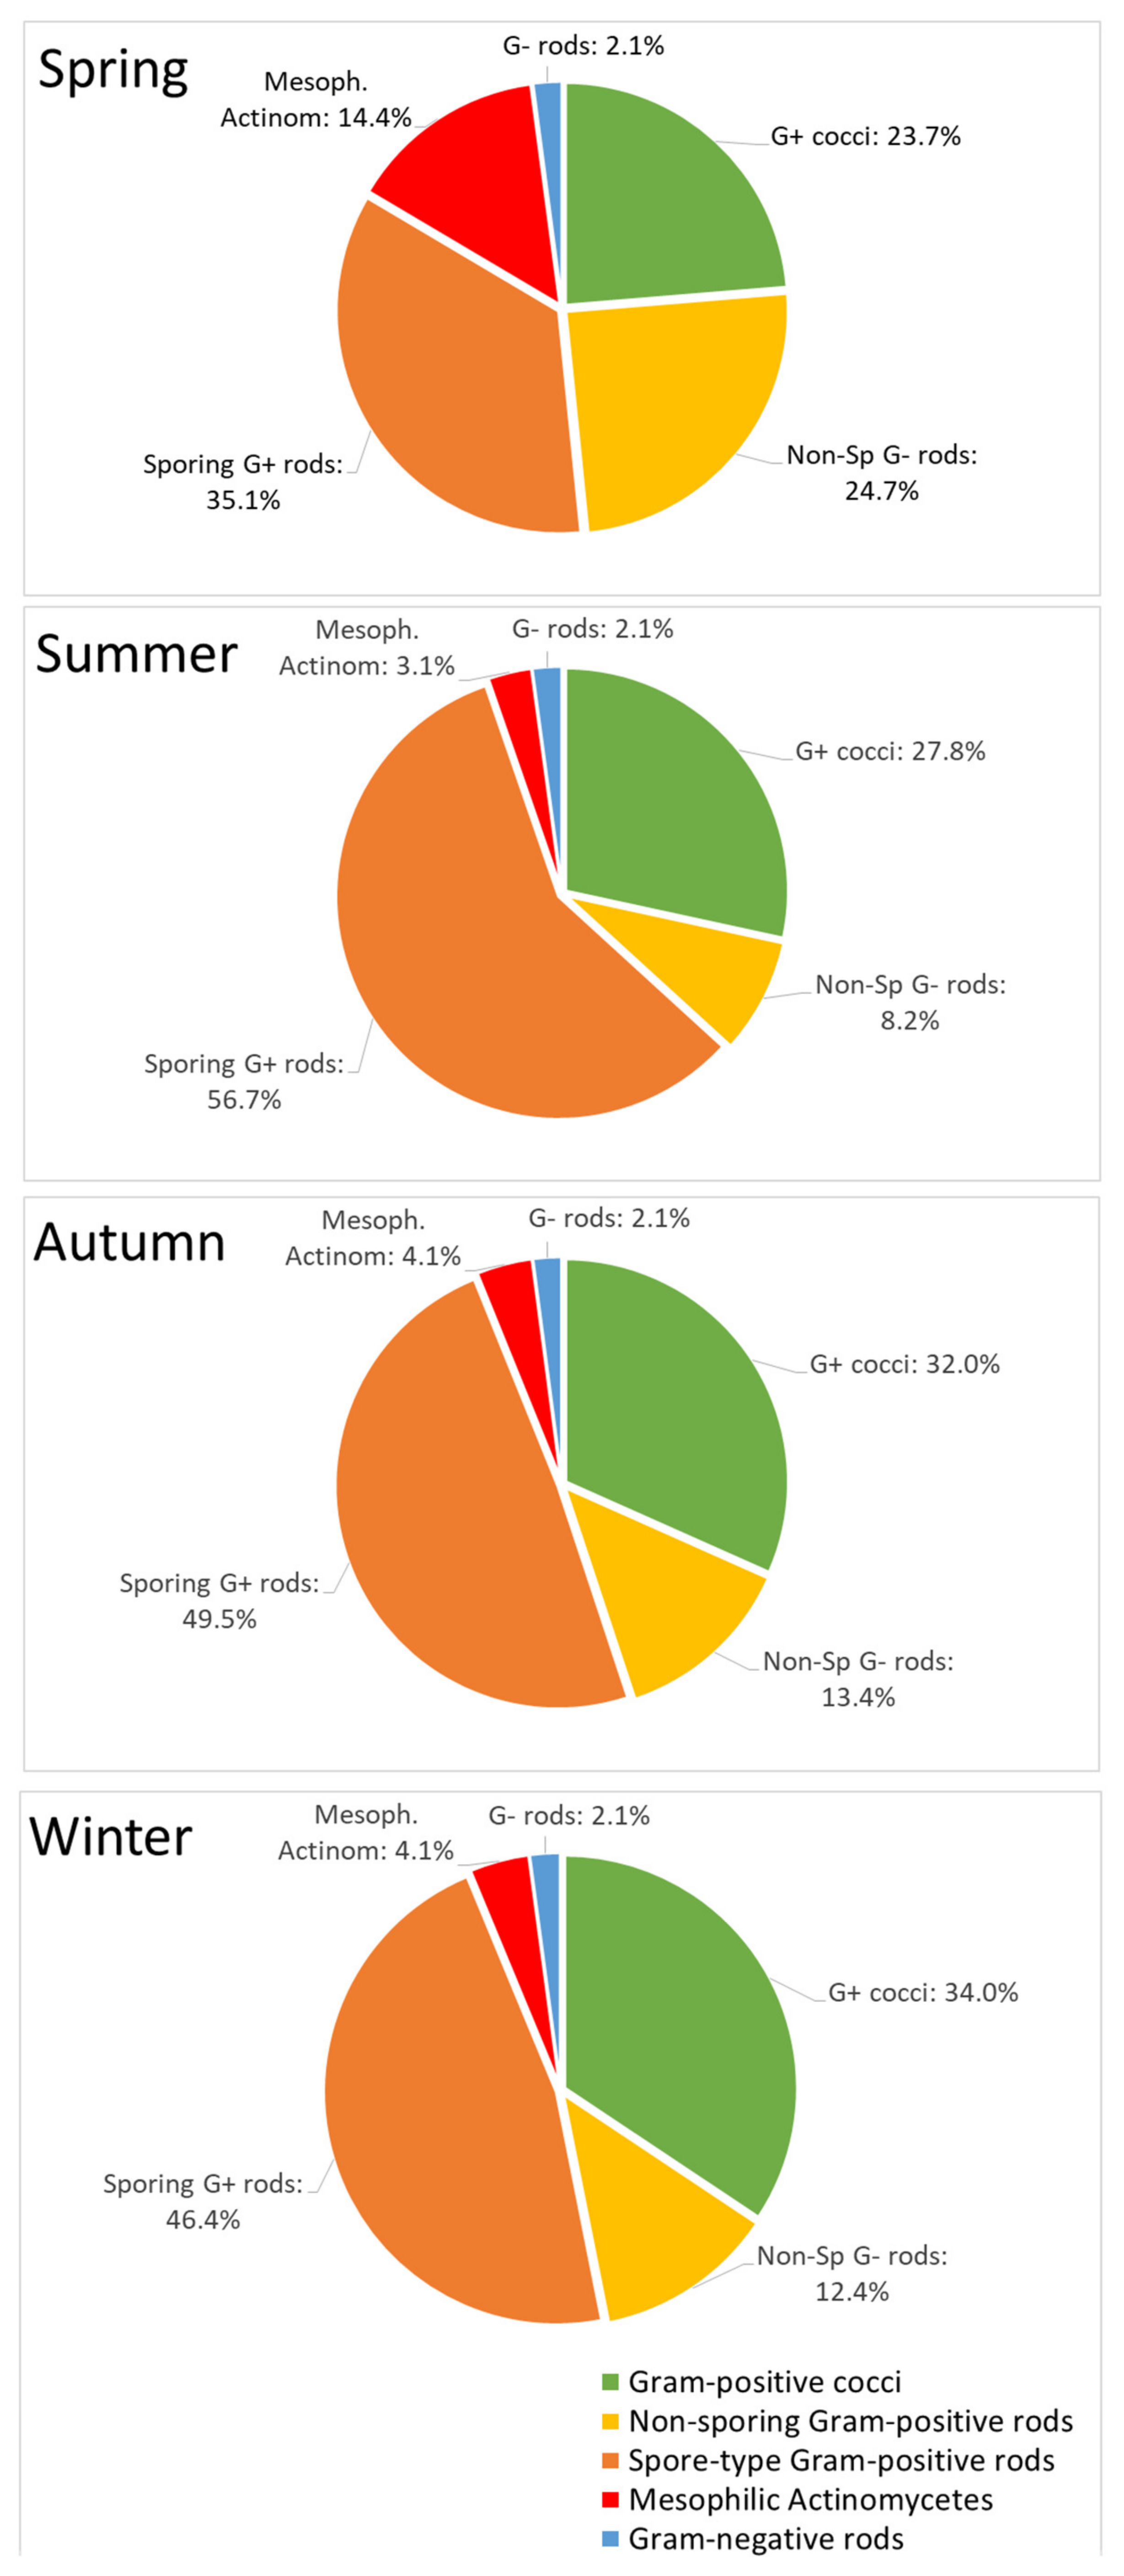
| Bacteria Species and Genera | Contribution to the Total Bacteria Genera in Season, % | |||
|---|---|---|---|---|
| Spring | Summer | Autumn | Winter | |
| Gram-positive cocci | 23 | 27 | 31 | 33 |
| including: Micrococcus spp. | 18 | 15 | 17 | 16 |
| Staphylococcus sciuri | 2 | 5 | 8 | 9 |
| Staphylococcus lentus | 2 | 6 | 4 | 8 |
| Kocuria rosea | 1 | 1 | 2 | n.i. |
| Non-sporing Gram-positive rods | 24 | 8 | 13 | 12 |
| including: Brevibacterium spp. | 14 | 5 | 3 | 12 |
| Corynobacterium auris | 10 | 3 | 7 | n.i. |
| Arthorobacter | n.i | n.i. | 3 | n.i. |
| Spore-type Gram-positive roads, family Bacillacae | 34 | 55 | 48 | 45 |
| including: Bacillus cereus | 17 | 14 | 8 | 15 |
| Bacillus pumilus | 14 | 17 | 16 | 14 |
| Bacillus circulans | 3 | n.i. | 11 | n.i. |
| Bacillus subtilis | n.i. | 243 | 9 | 14 |
| Bacillus mycoides | n.i. | n.i. | 4 | 2 |
| Mesophilic Actinomecytes | 14 | 3 | 4 | 4 |
| including: Streptomyces spp. | 9 | n.i. | 2 | 4 |
| Rhodococcus spp. | 5 | 3 | 2 | n.i. |
| Gram-negative rods | 2 | 2 | 2 | 2 |
| including: Pseudomonas spp. | 2 | 2 | 2 | 2 |
| Season | Autumn | Winter | Spring | Summer | |
|---|---|---|---|---|---|
| Day | 14 October 2015 | 4 January 2016 | 10 May 2016 Morning (9:30) | 8 July 2016 Noon (12:30) | |
| Temperature [°C] | 9.2 | −3.7 | 20.9 | 21.6 | 25 |
| Relative humidity [%] | 82 | 63 | 35 | 39 | 32 |
| Concentration of total airborne bacteria [m−3] | 25,520 | 298 | 24,266 | 13,968 | 14,148 |
| Concentration of viable bacteria [CFU m−3] | 205 | 46 | 481 | 233 | 141 |
| Viable/total ratio [%] | 0.8 | 15.4 | 2.0 | 1.7 | 1.0 |
| k, cm2 W−1s−1 | ||||
|---|---|---|---|---|
| N | Geometric Mean (SD) | Median (IQR) | Q1–Q3 | Min–Max |
| 13 | 9.20 (7.58) | 10.96 (14.78) | 4.42–19.20 | 2.14–24.24 |
Publisher’s Note: MDPI stays neutral with regard to jurisdictional claims in published maps and institutional affiliations. |
© 2022 by the authors. Licensee MDPI, Basel, Switzerland. This article is an open access article distributed under the terms and conditions of the Creative Commons Attribution (CC BY) license (https://creativecommons.org/licenses/by/4.0/).
Share and Cite
Kowalski, M.; Pastuszka, J.S.; Brąszewska, A.; Cyrys, J.; Brągoszewska, E. Airborne Bacteria in Gliwice—The Industrialized City in Poland. Atmosphere 2022, 13, 1721. https://doi.org/10.3390/atmos13101721
Kowalski M, Pastuszka JS, Brąszewska A, Cyrys J, Brągoszewska E. Airborne Bacteria in Gliwice—The Industrialized City in Poland. Atmosphere. 2022; 13(10):1721. https://doi.org/10.3390/atmos13101721
Chicago/Turabian StyleKowalski, Michał, Jozef S. Pastuszka, Agnieszka Brąszewska, Josef Cyrys, and Ewa Brągoszewska. 2022. "Airborne Bacteria in Gliwice—The Industrialized City in Poland" Atmosphere 13, no. 10: 1721. https://doi.org/10.3390/atmos13101721