
Impact of the Different Grid Resolutions of the WRF Model for the Forecasting of the Flood Event of 15 July 2020 in Palermo (Italy)
 , ,
, ,  , , , and
Abstract
:1. Introduction
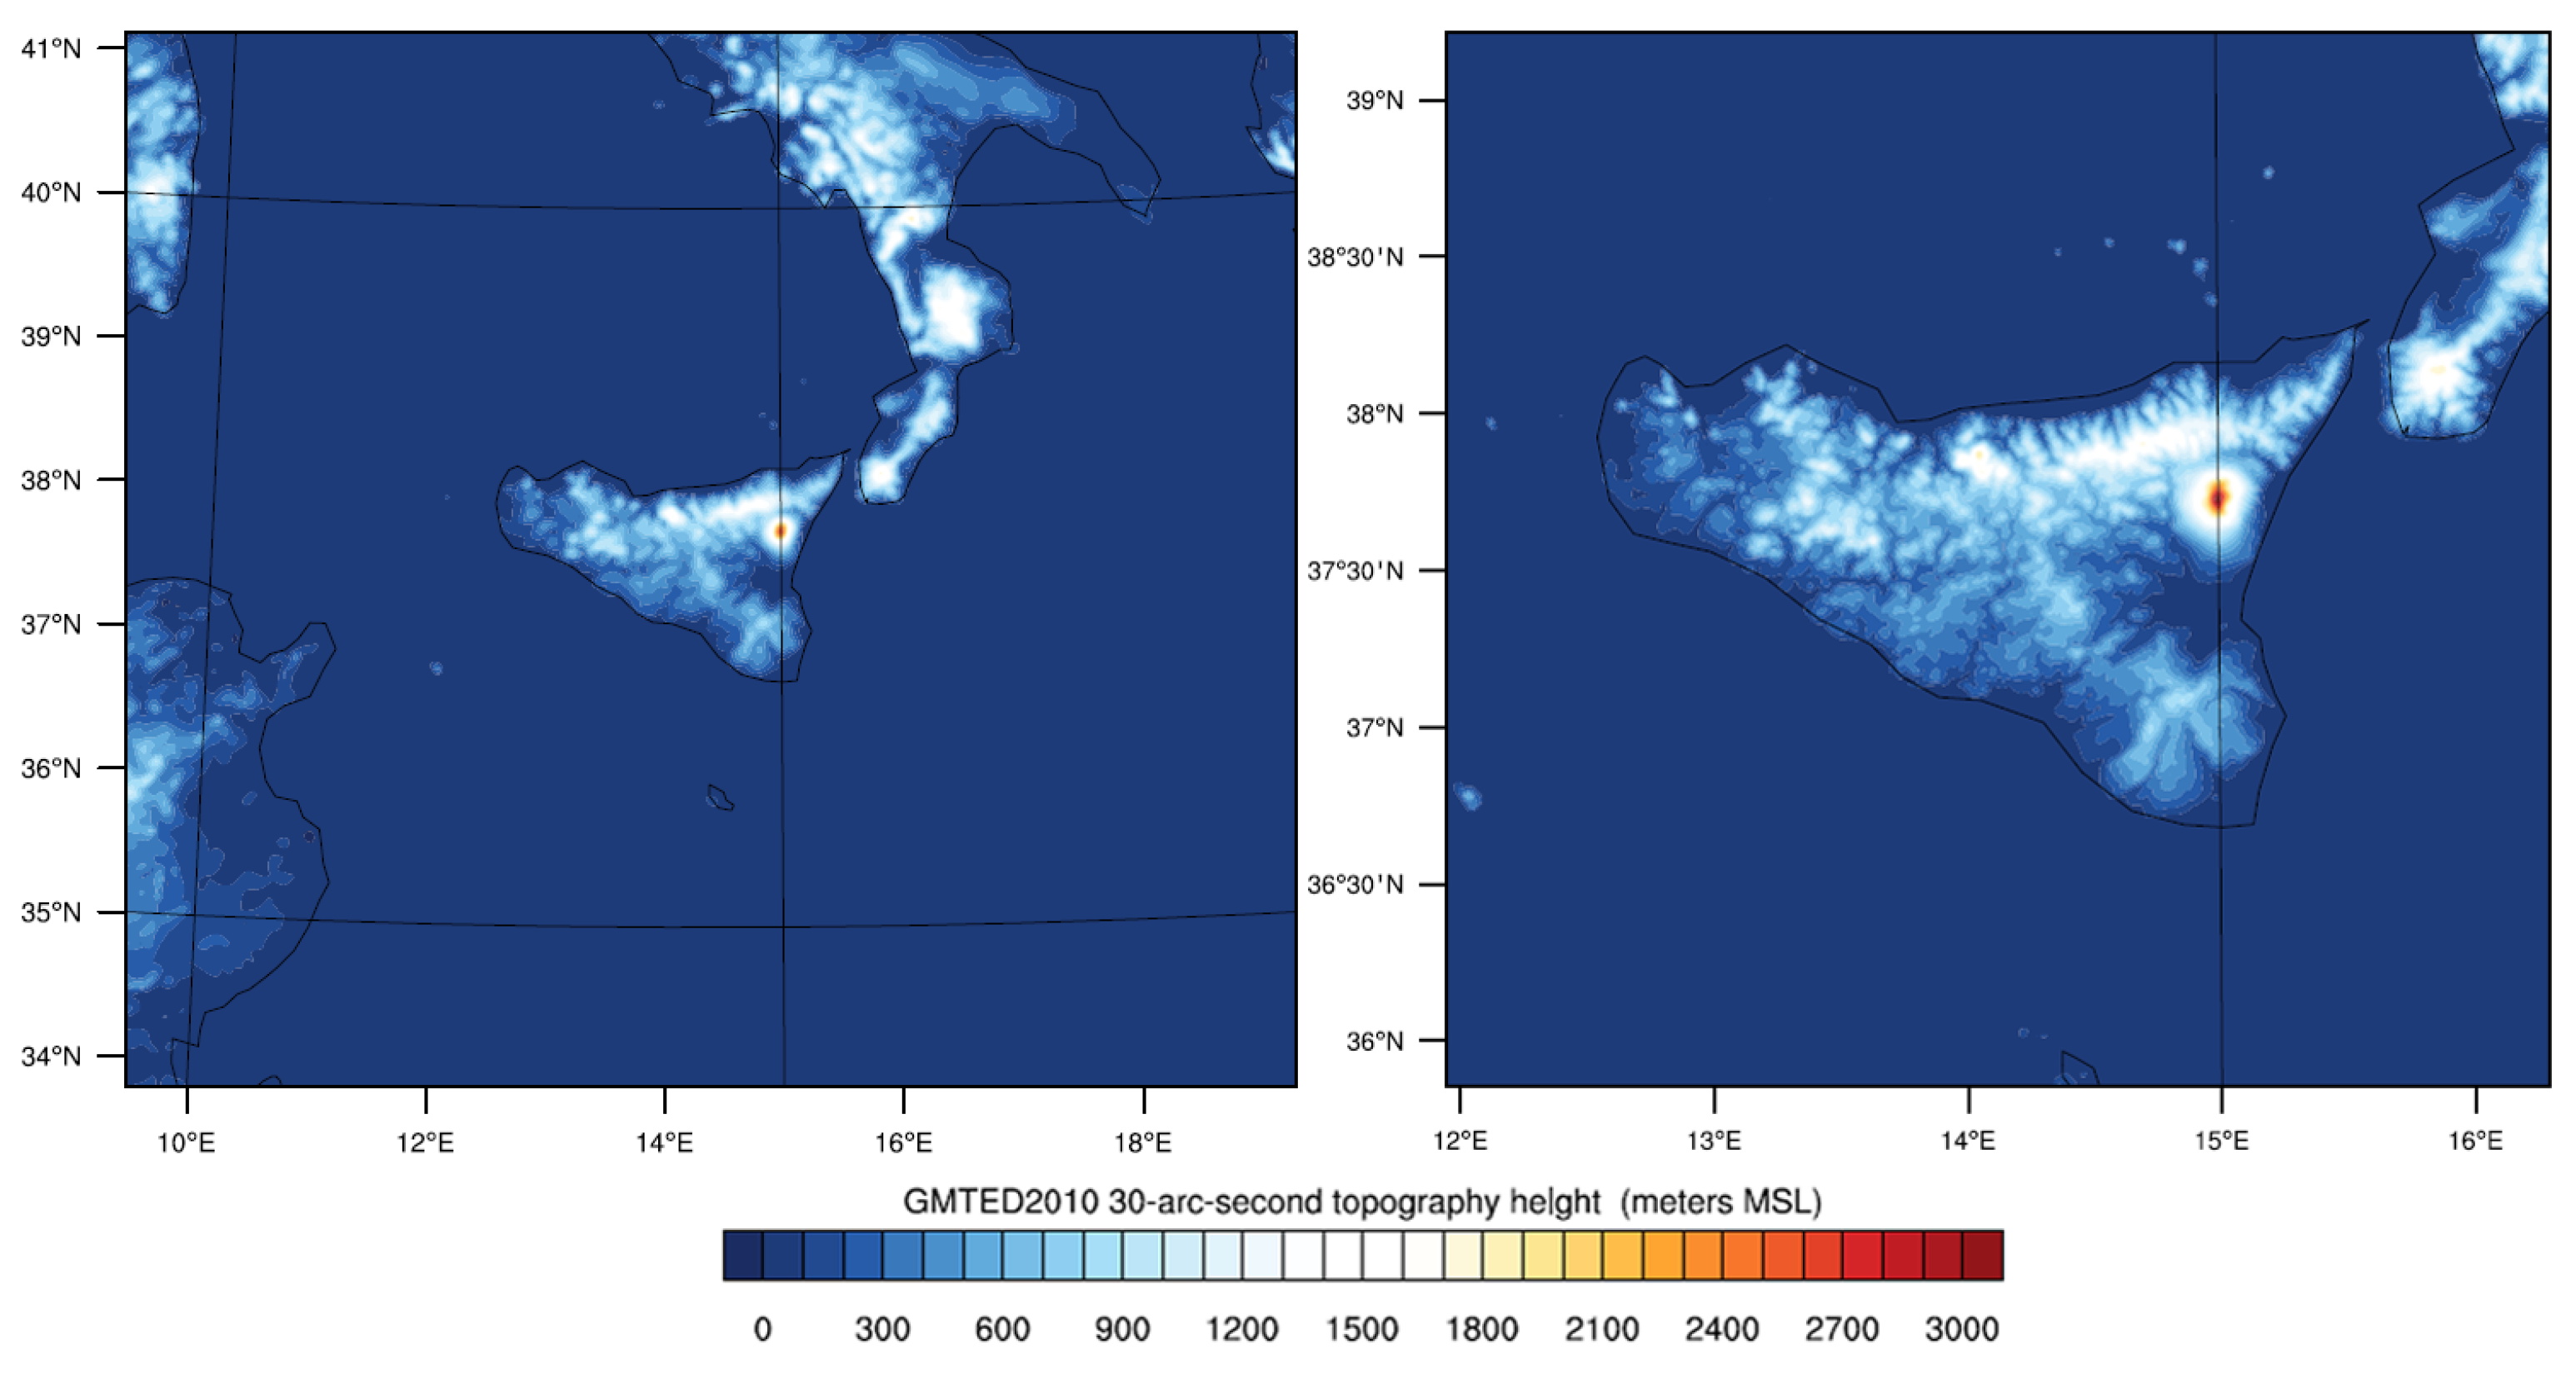
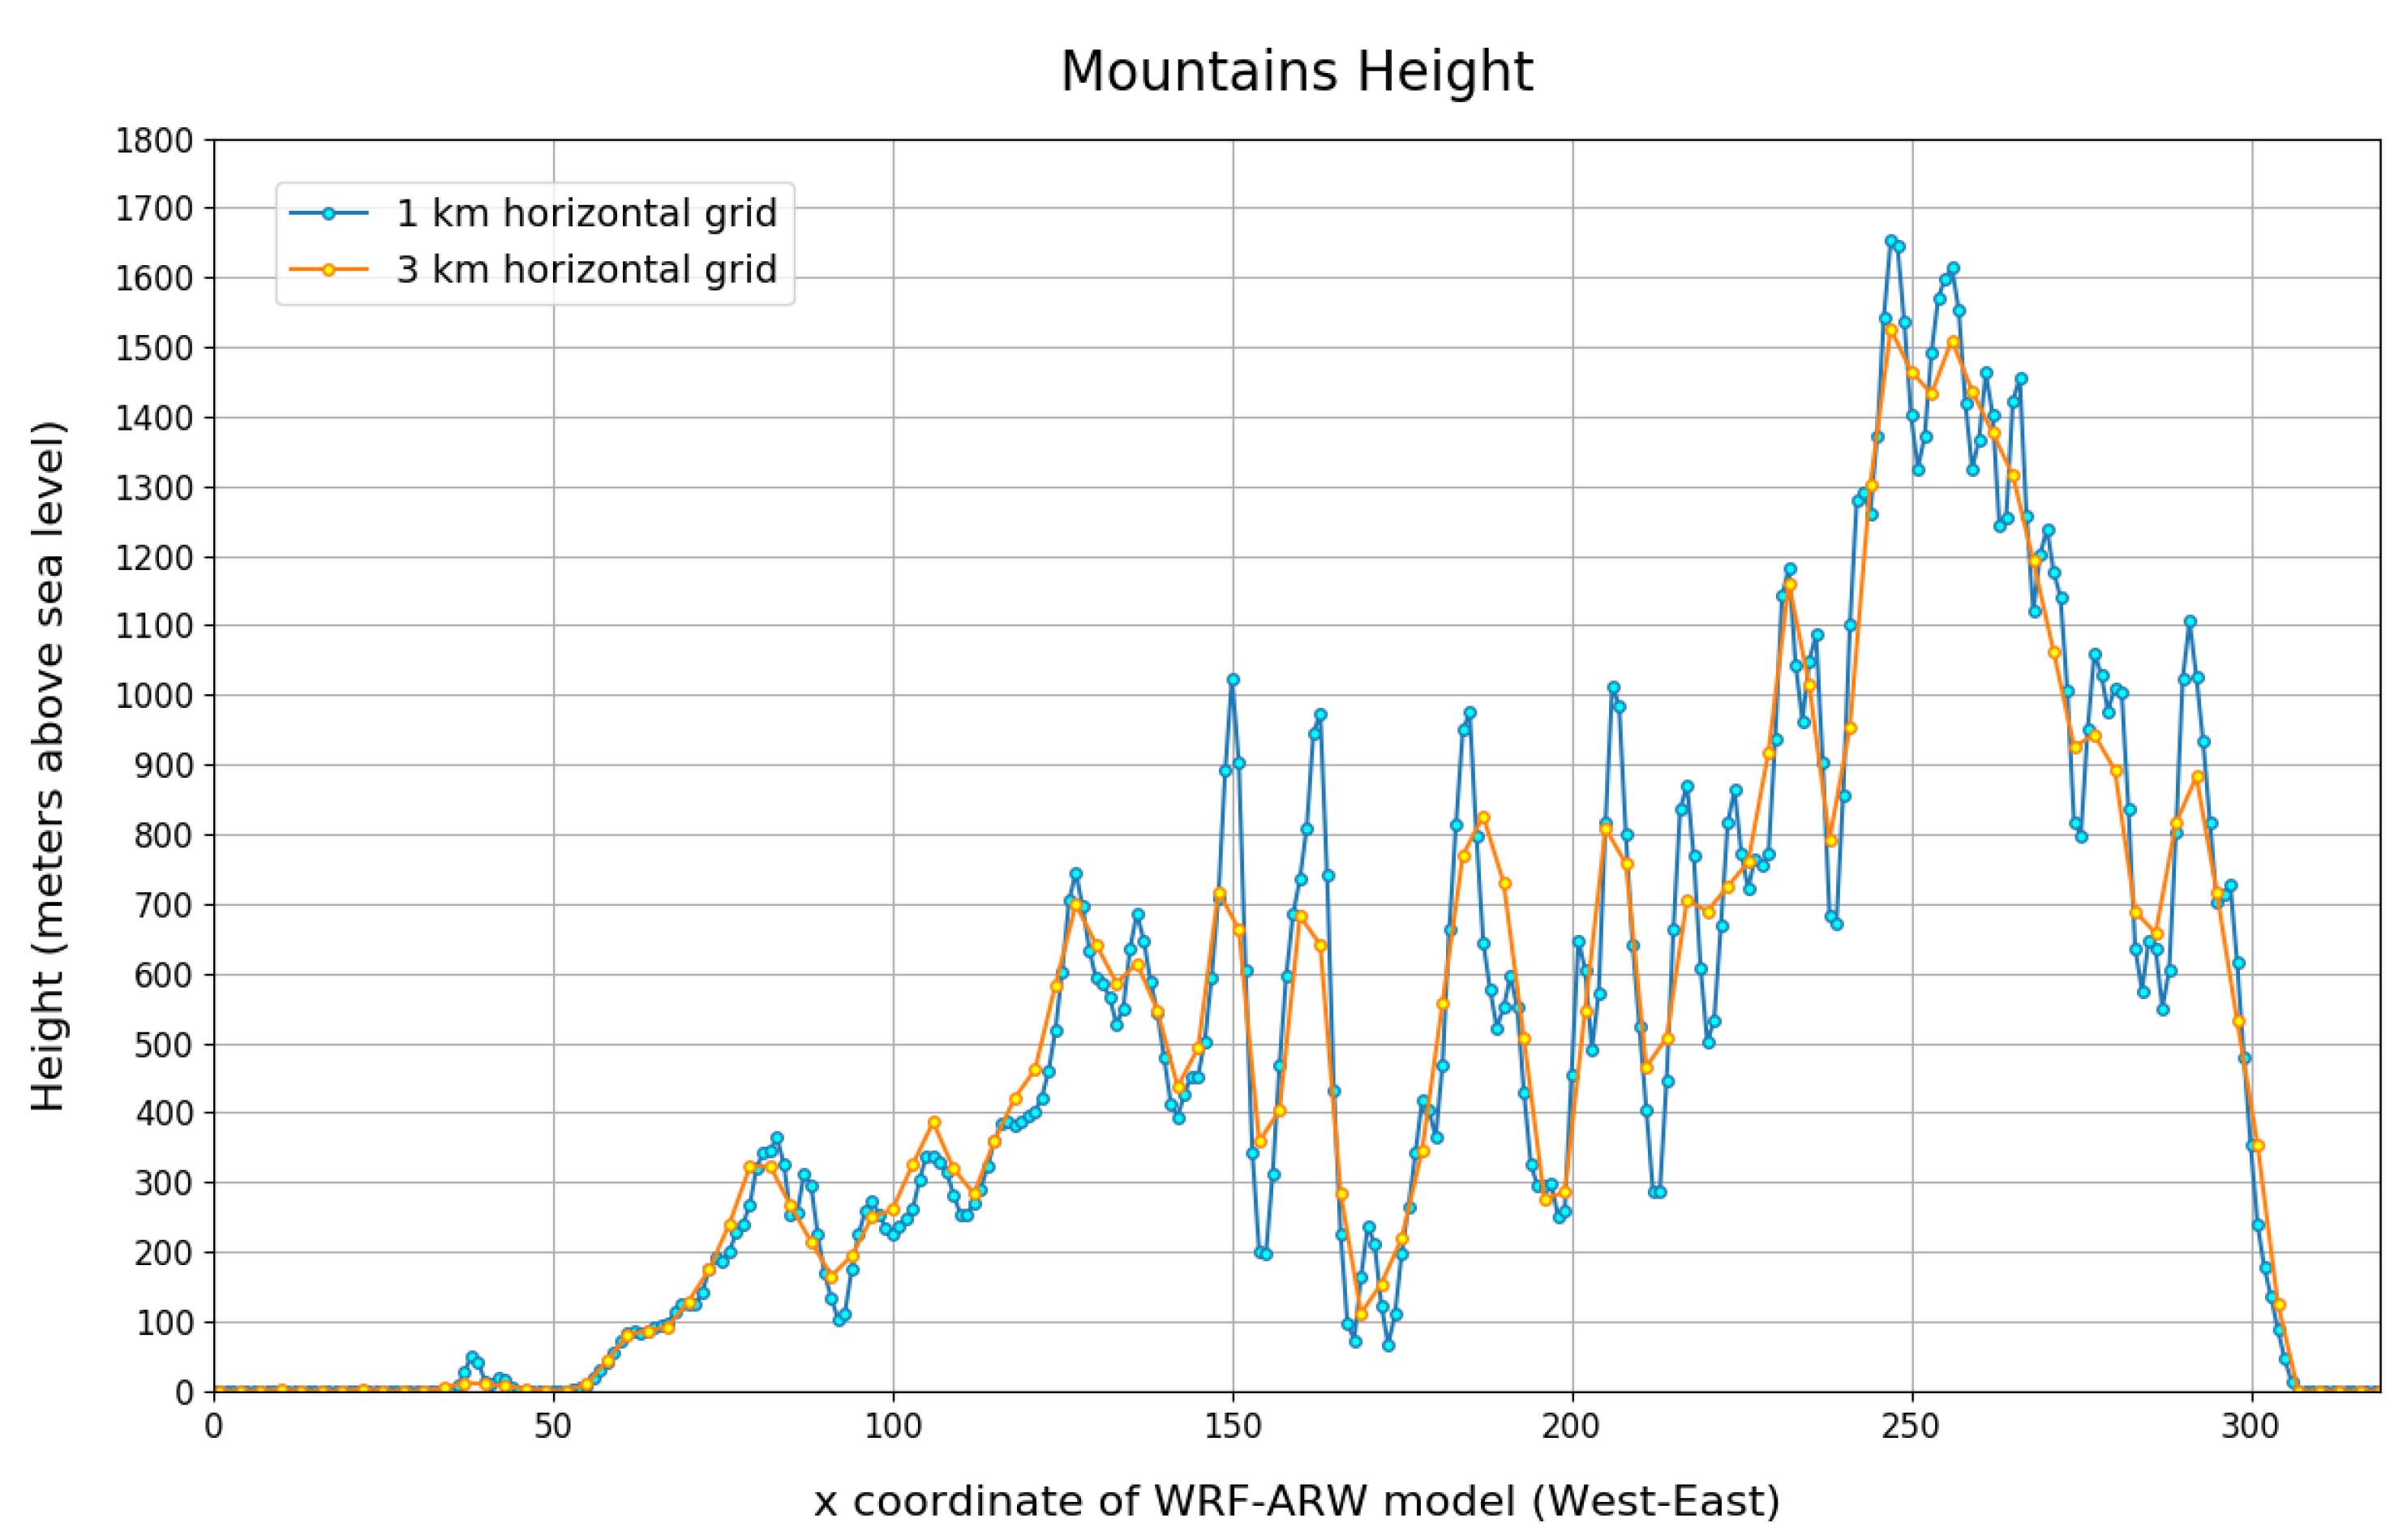
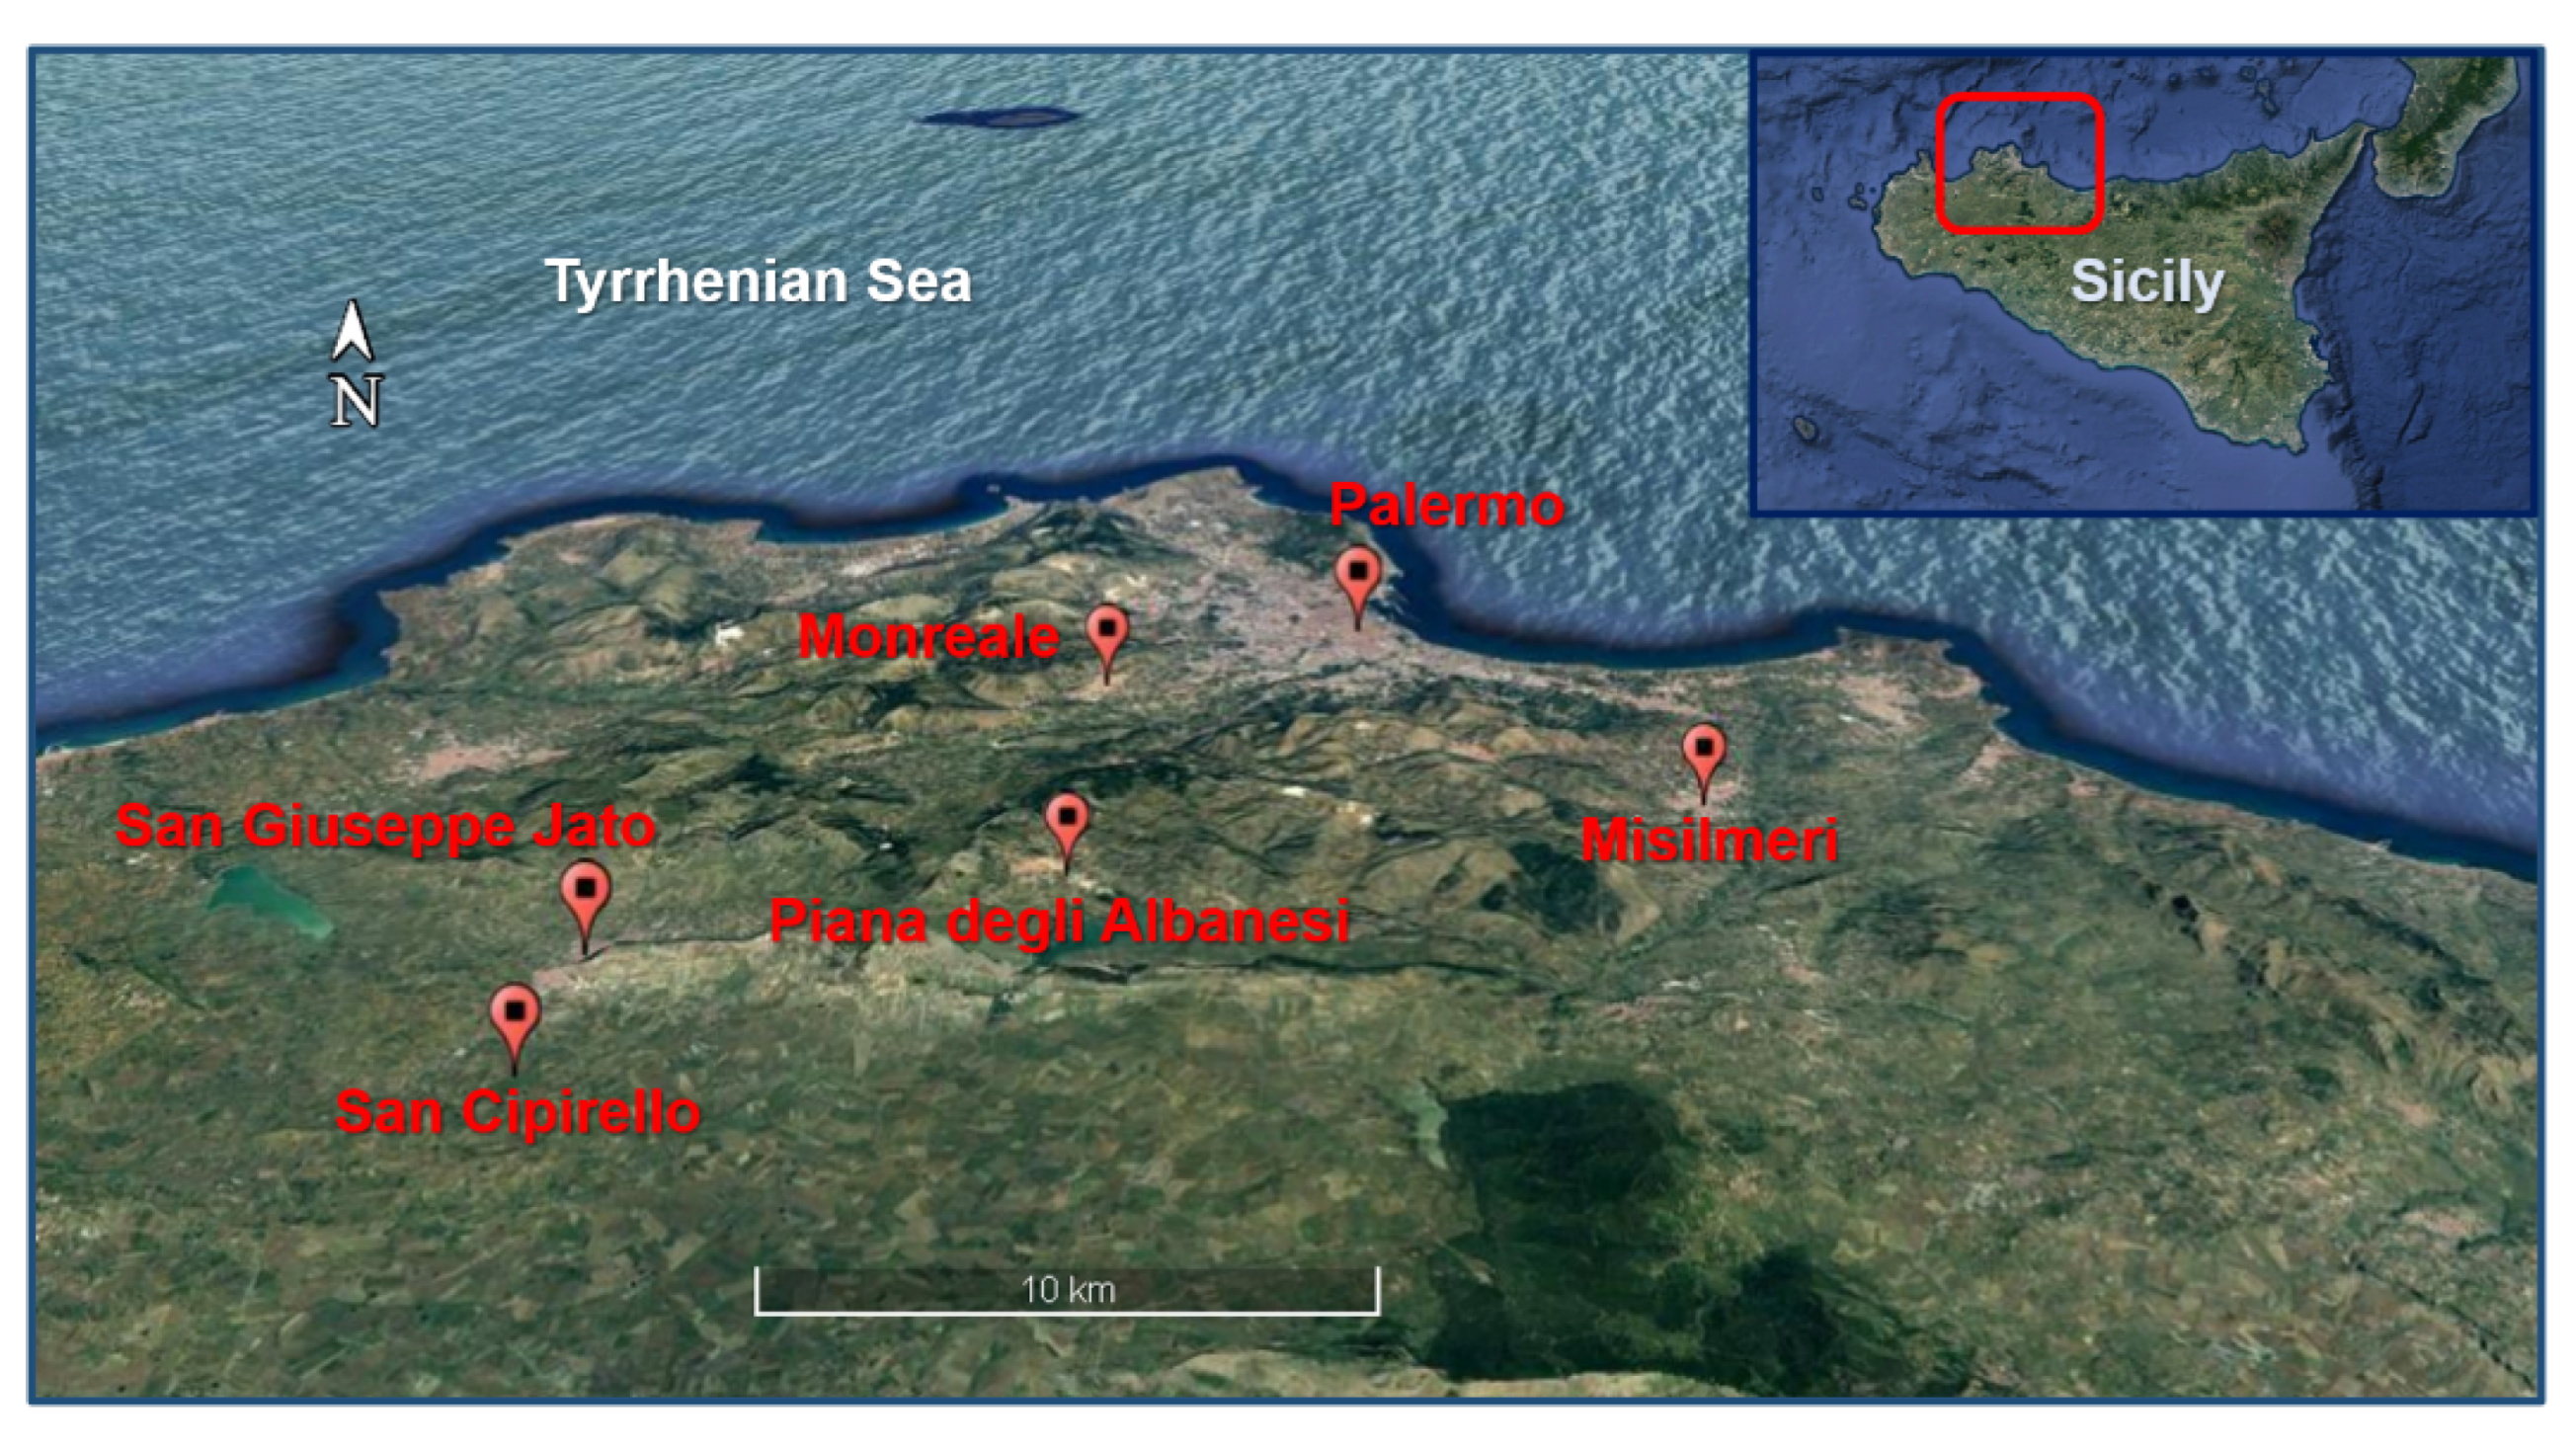
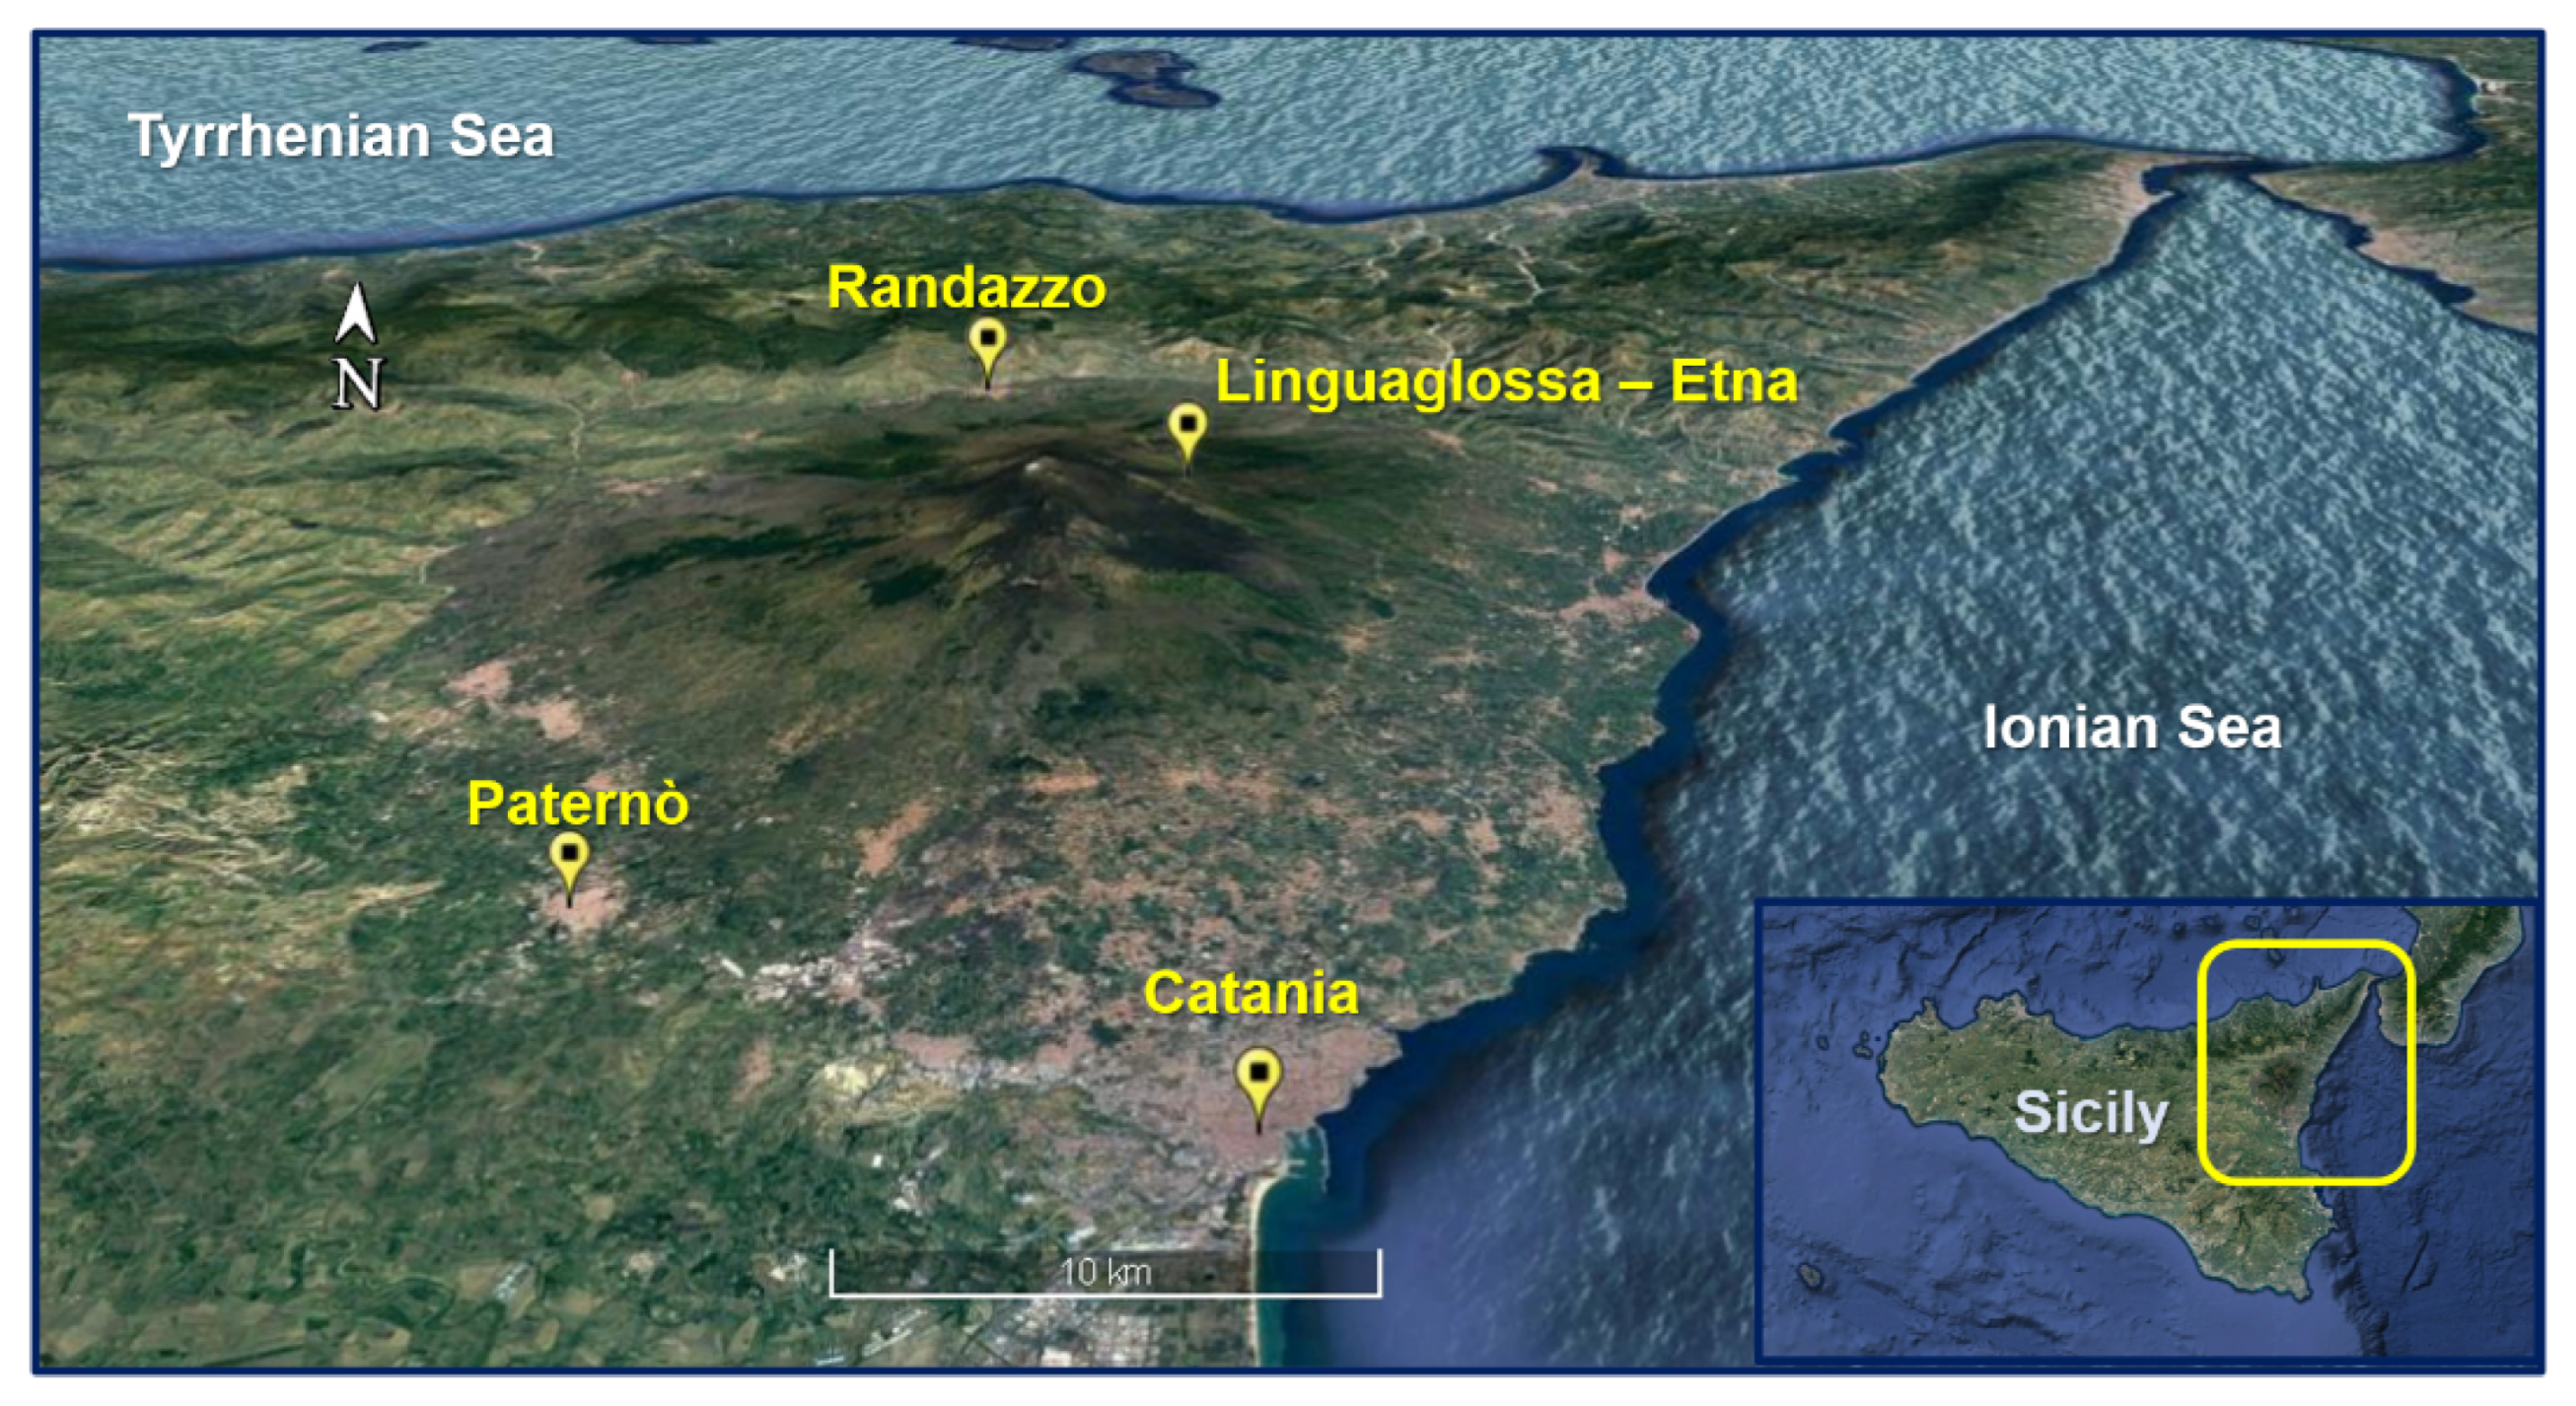
2. Description of the Case Study
2.1. The Weather Research and Forecasting Model
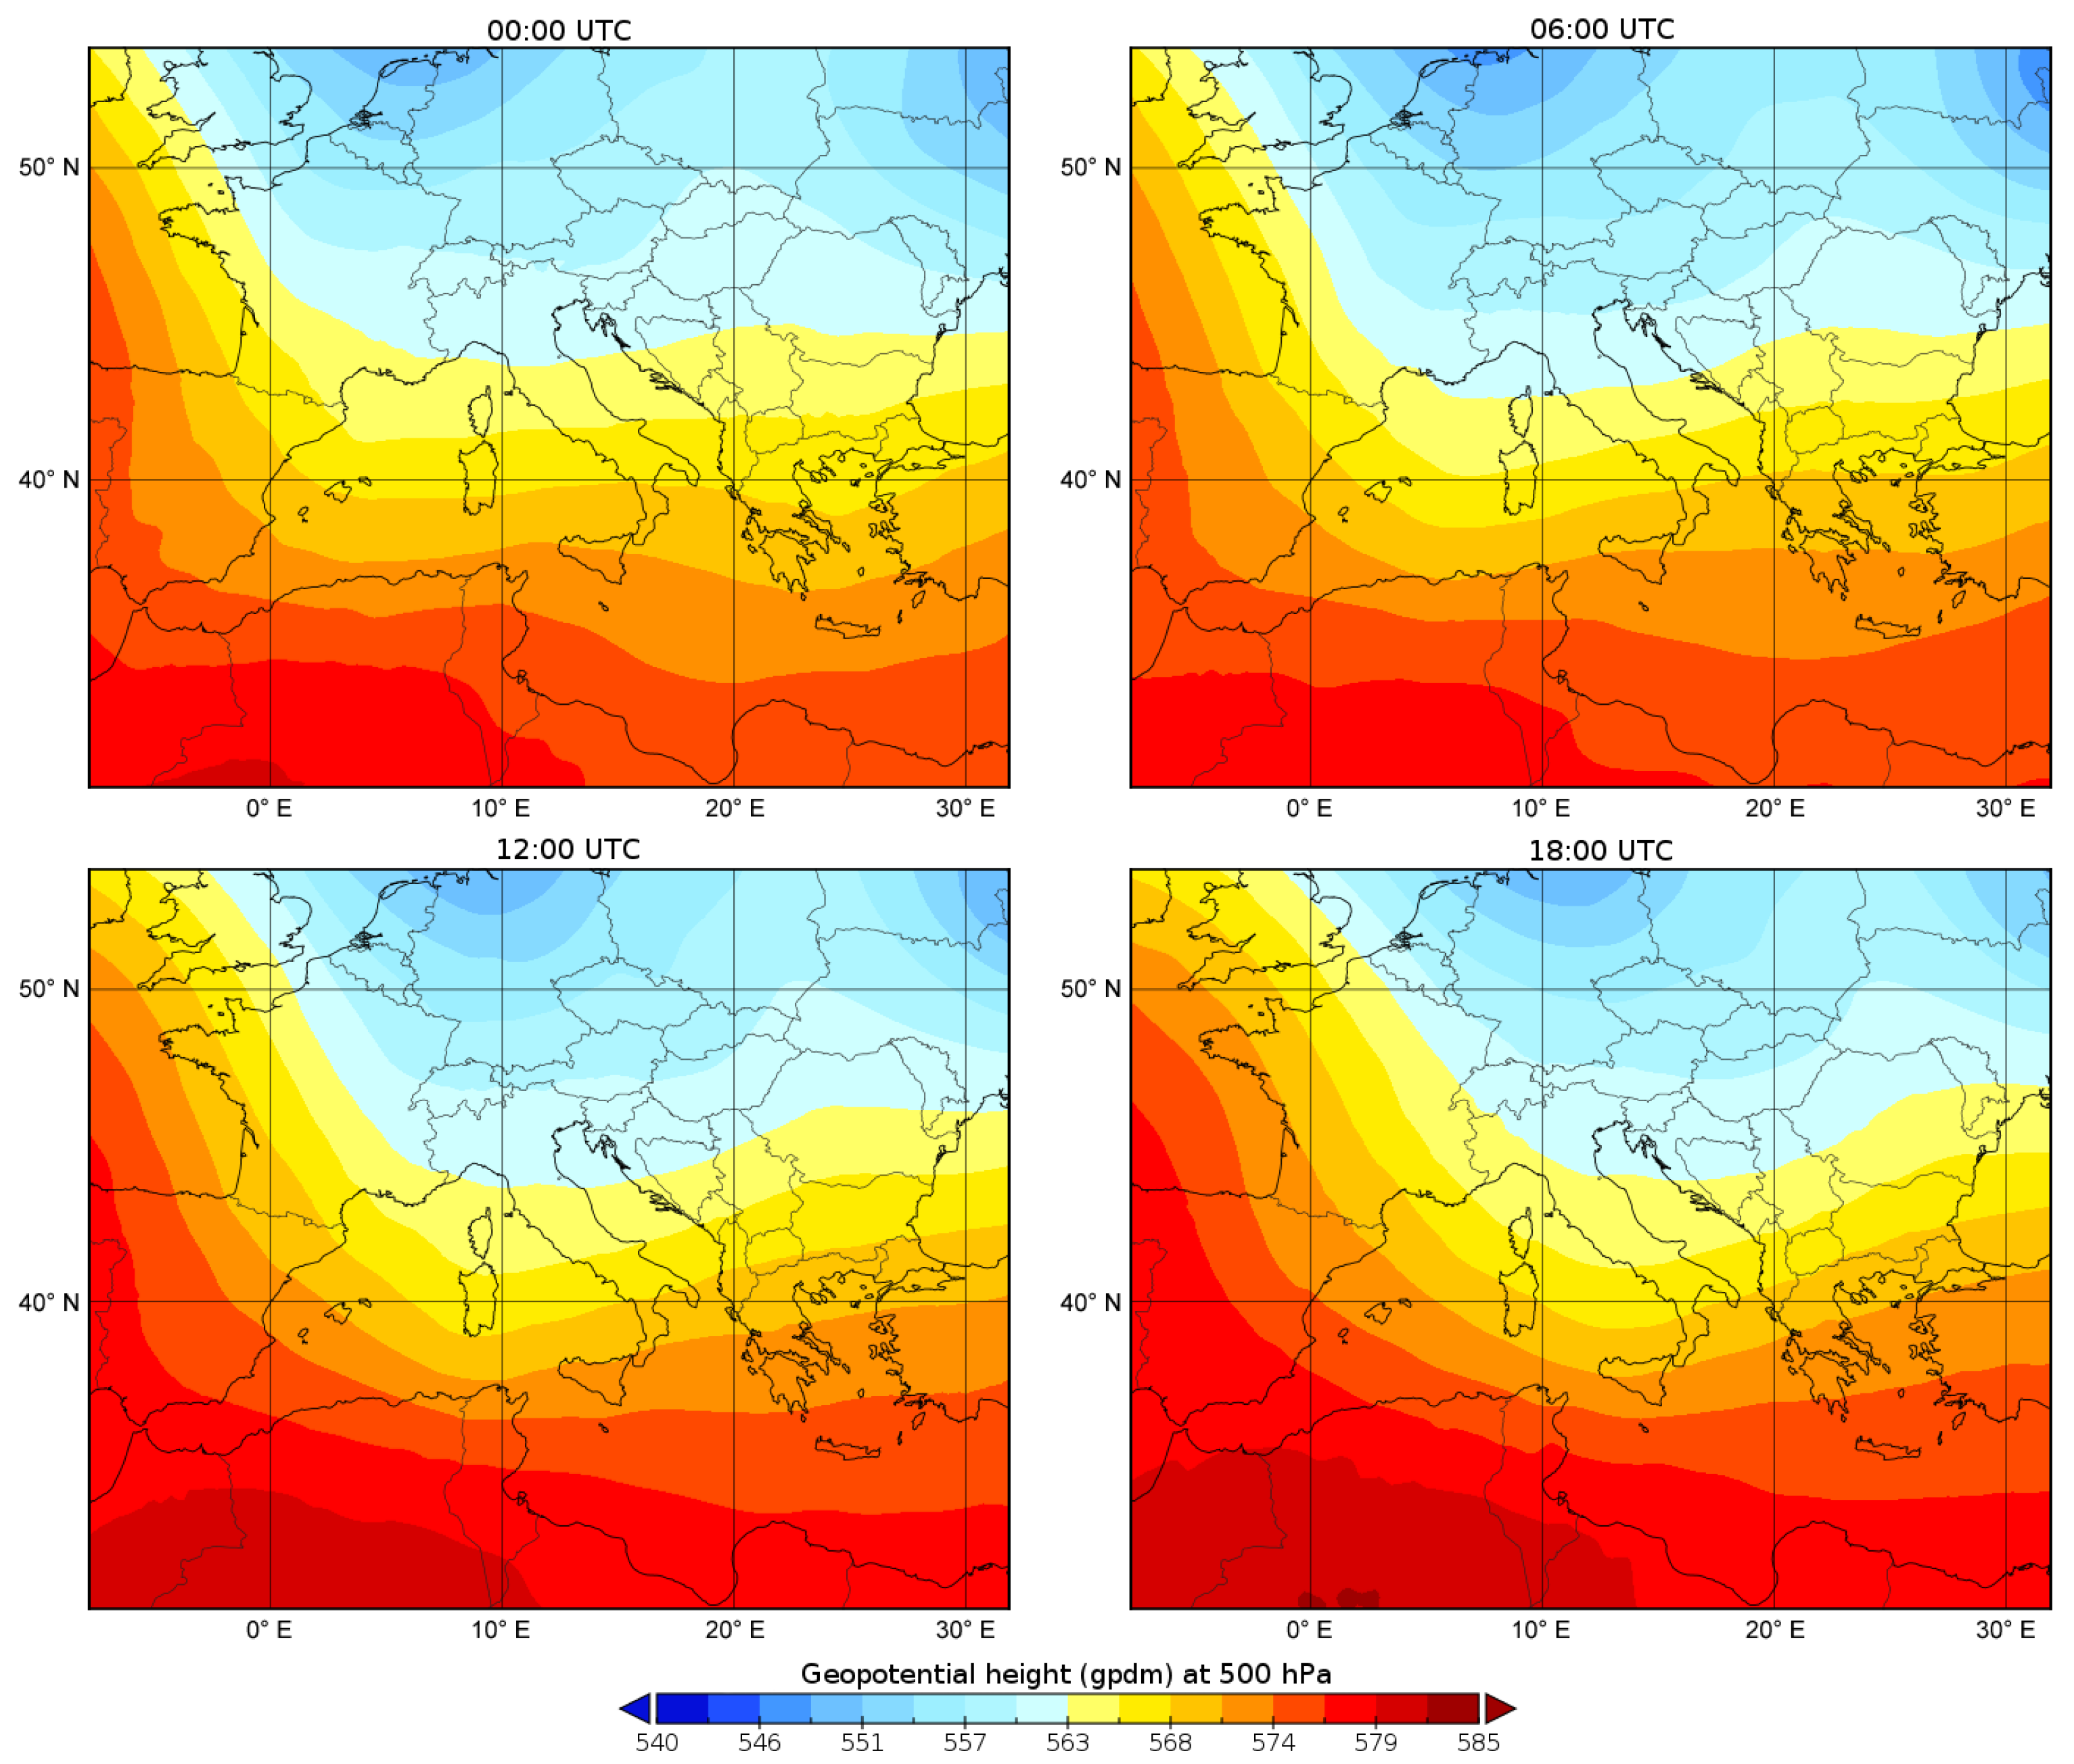
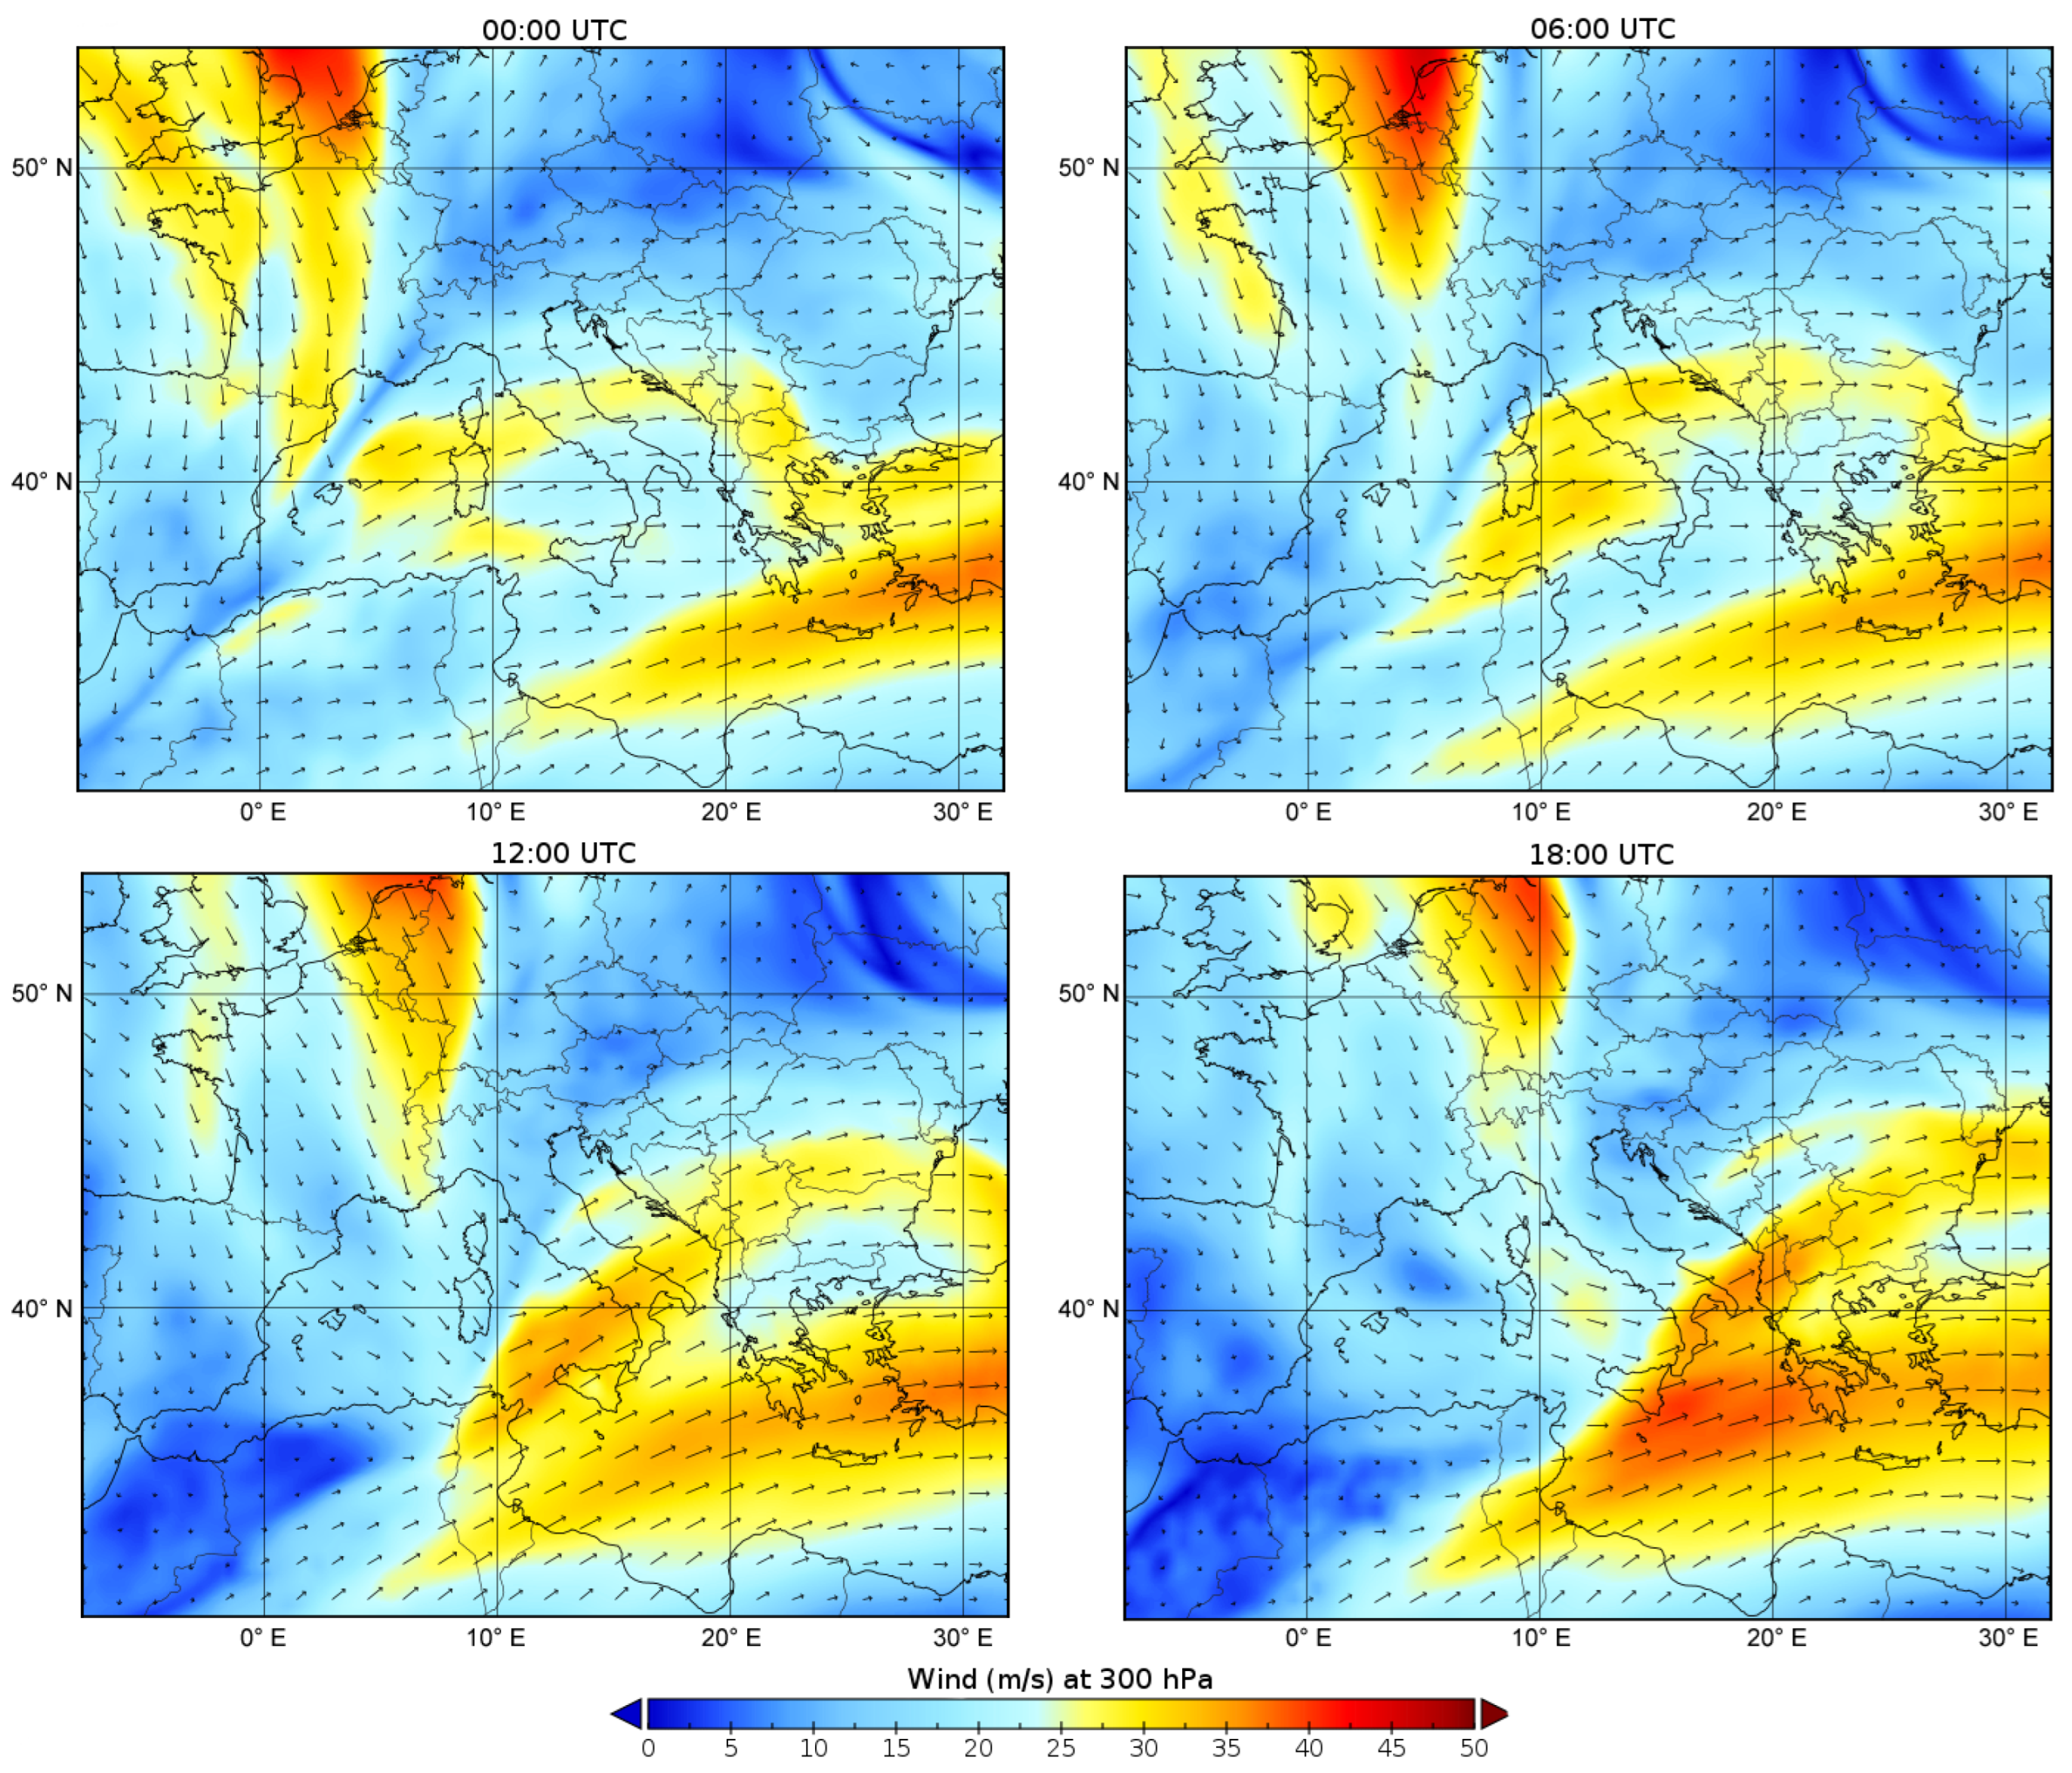
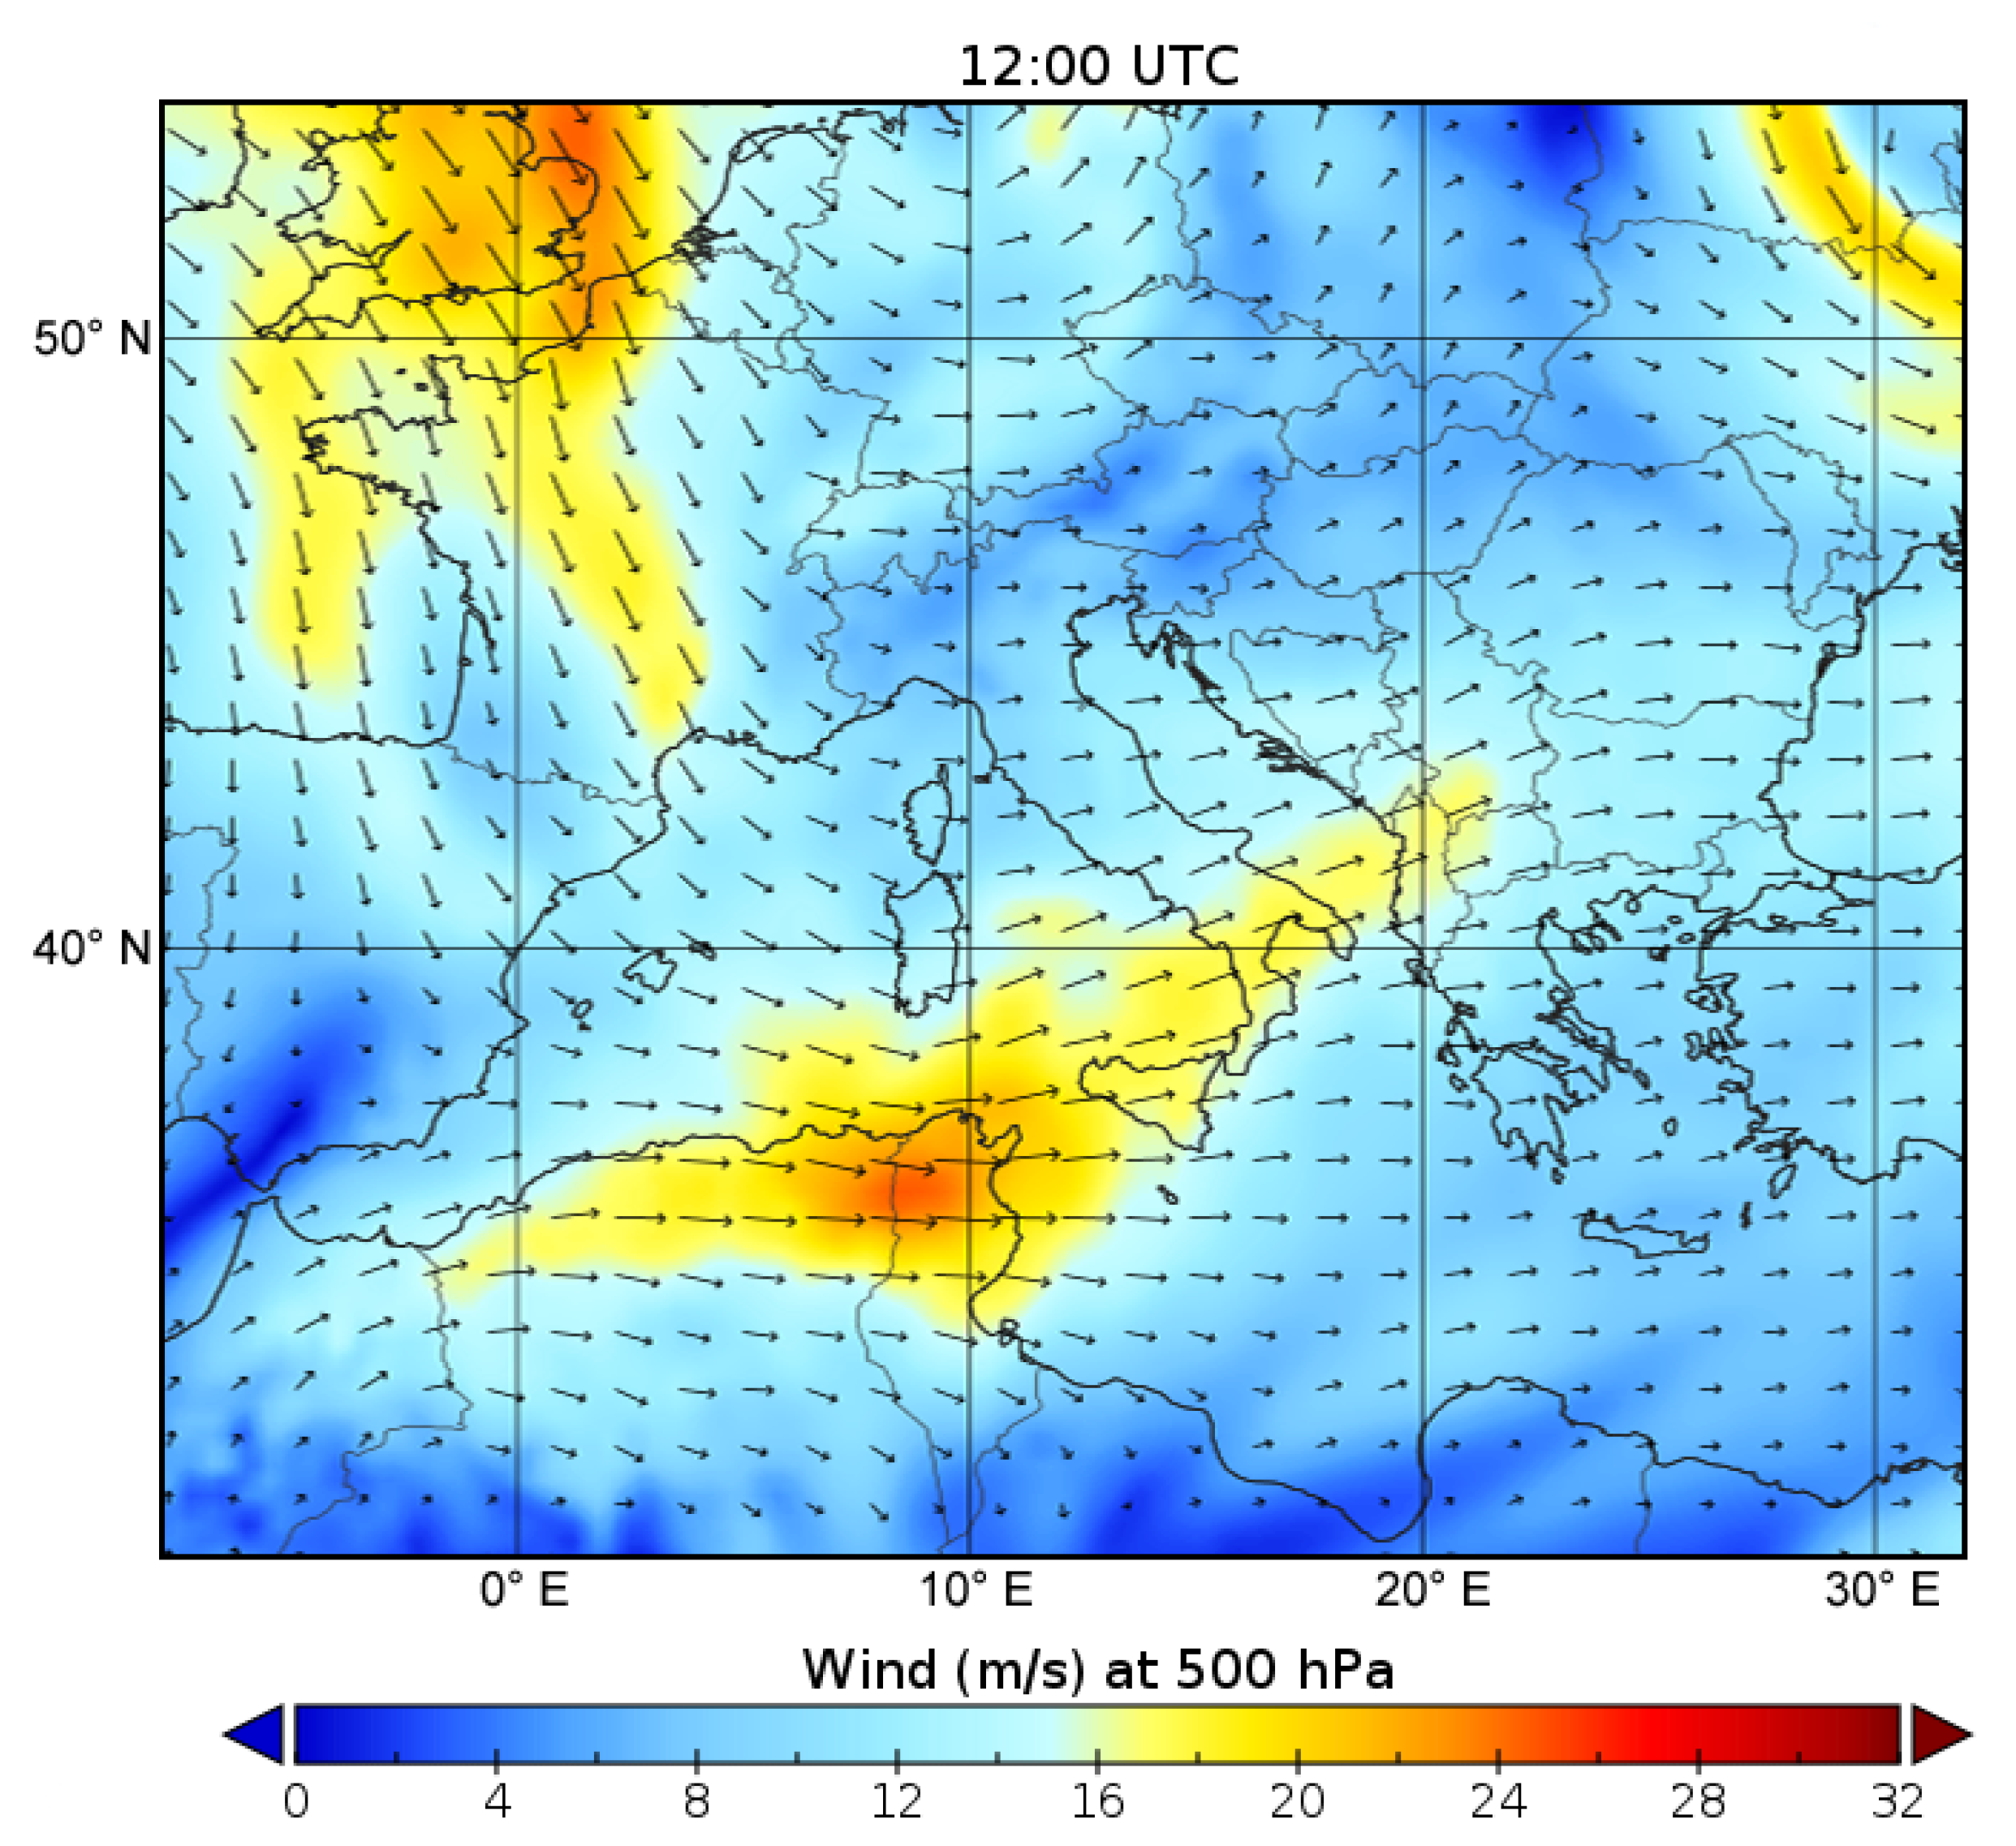
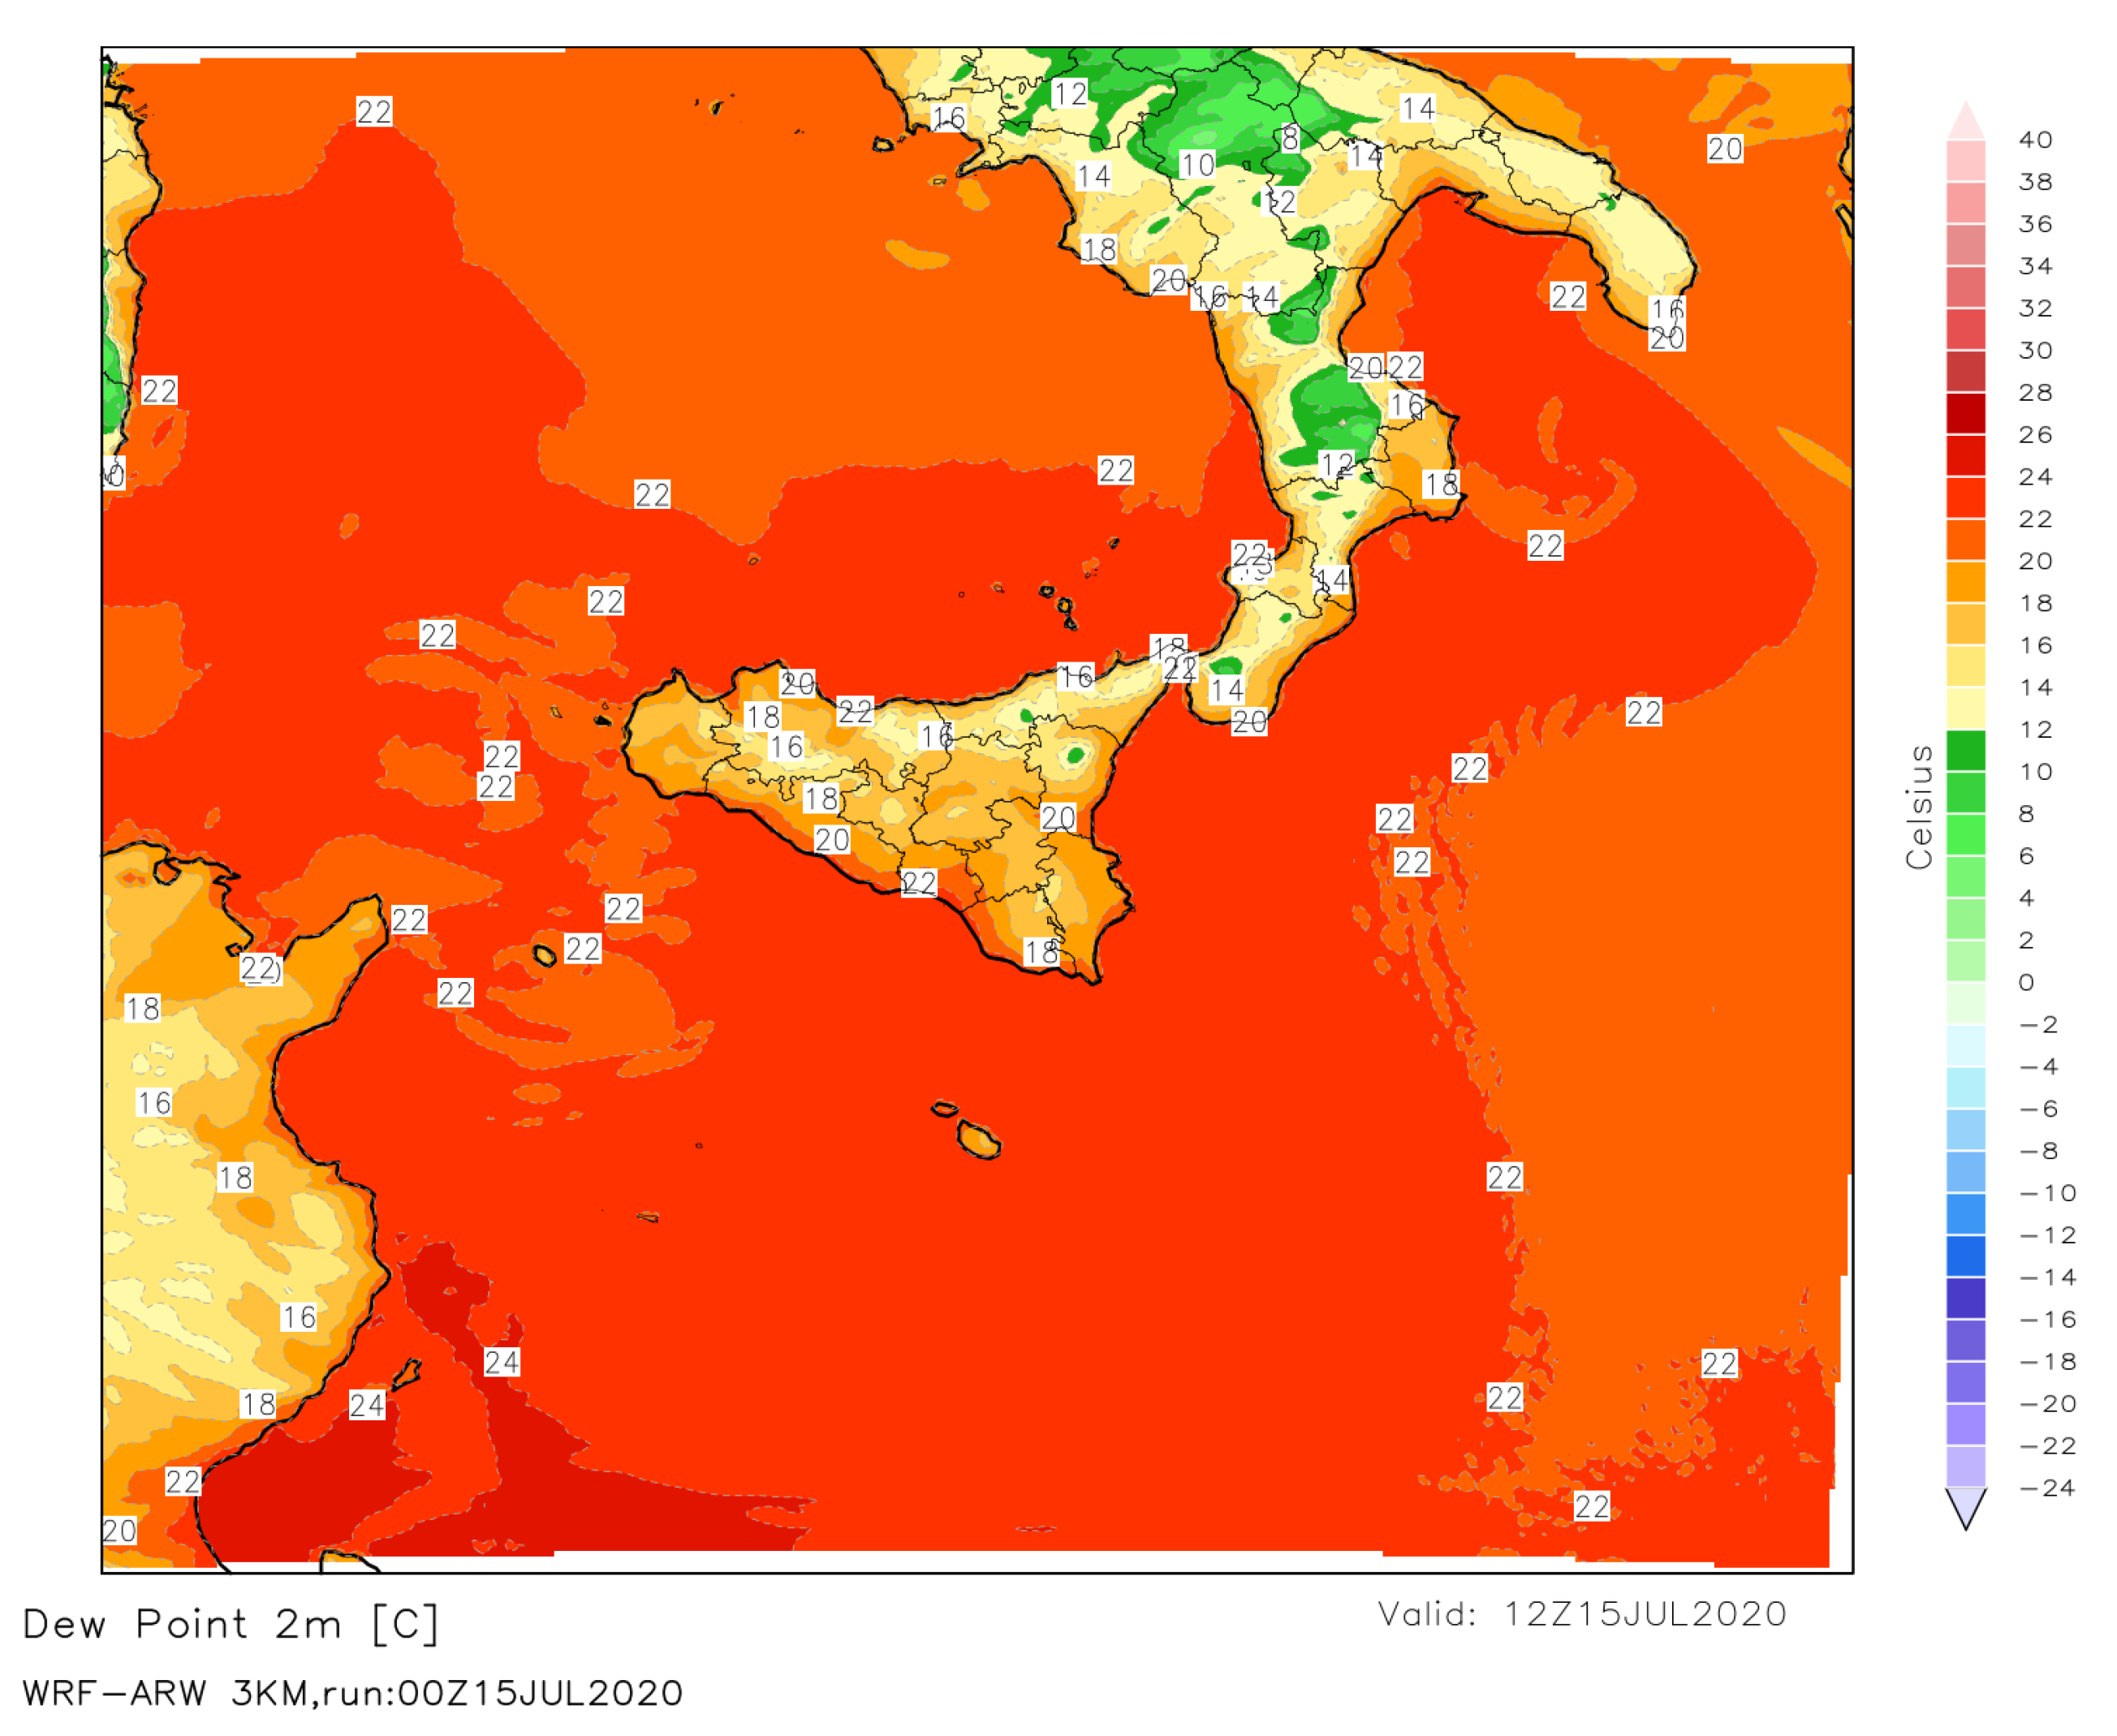
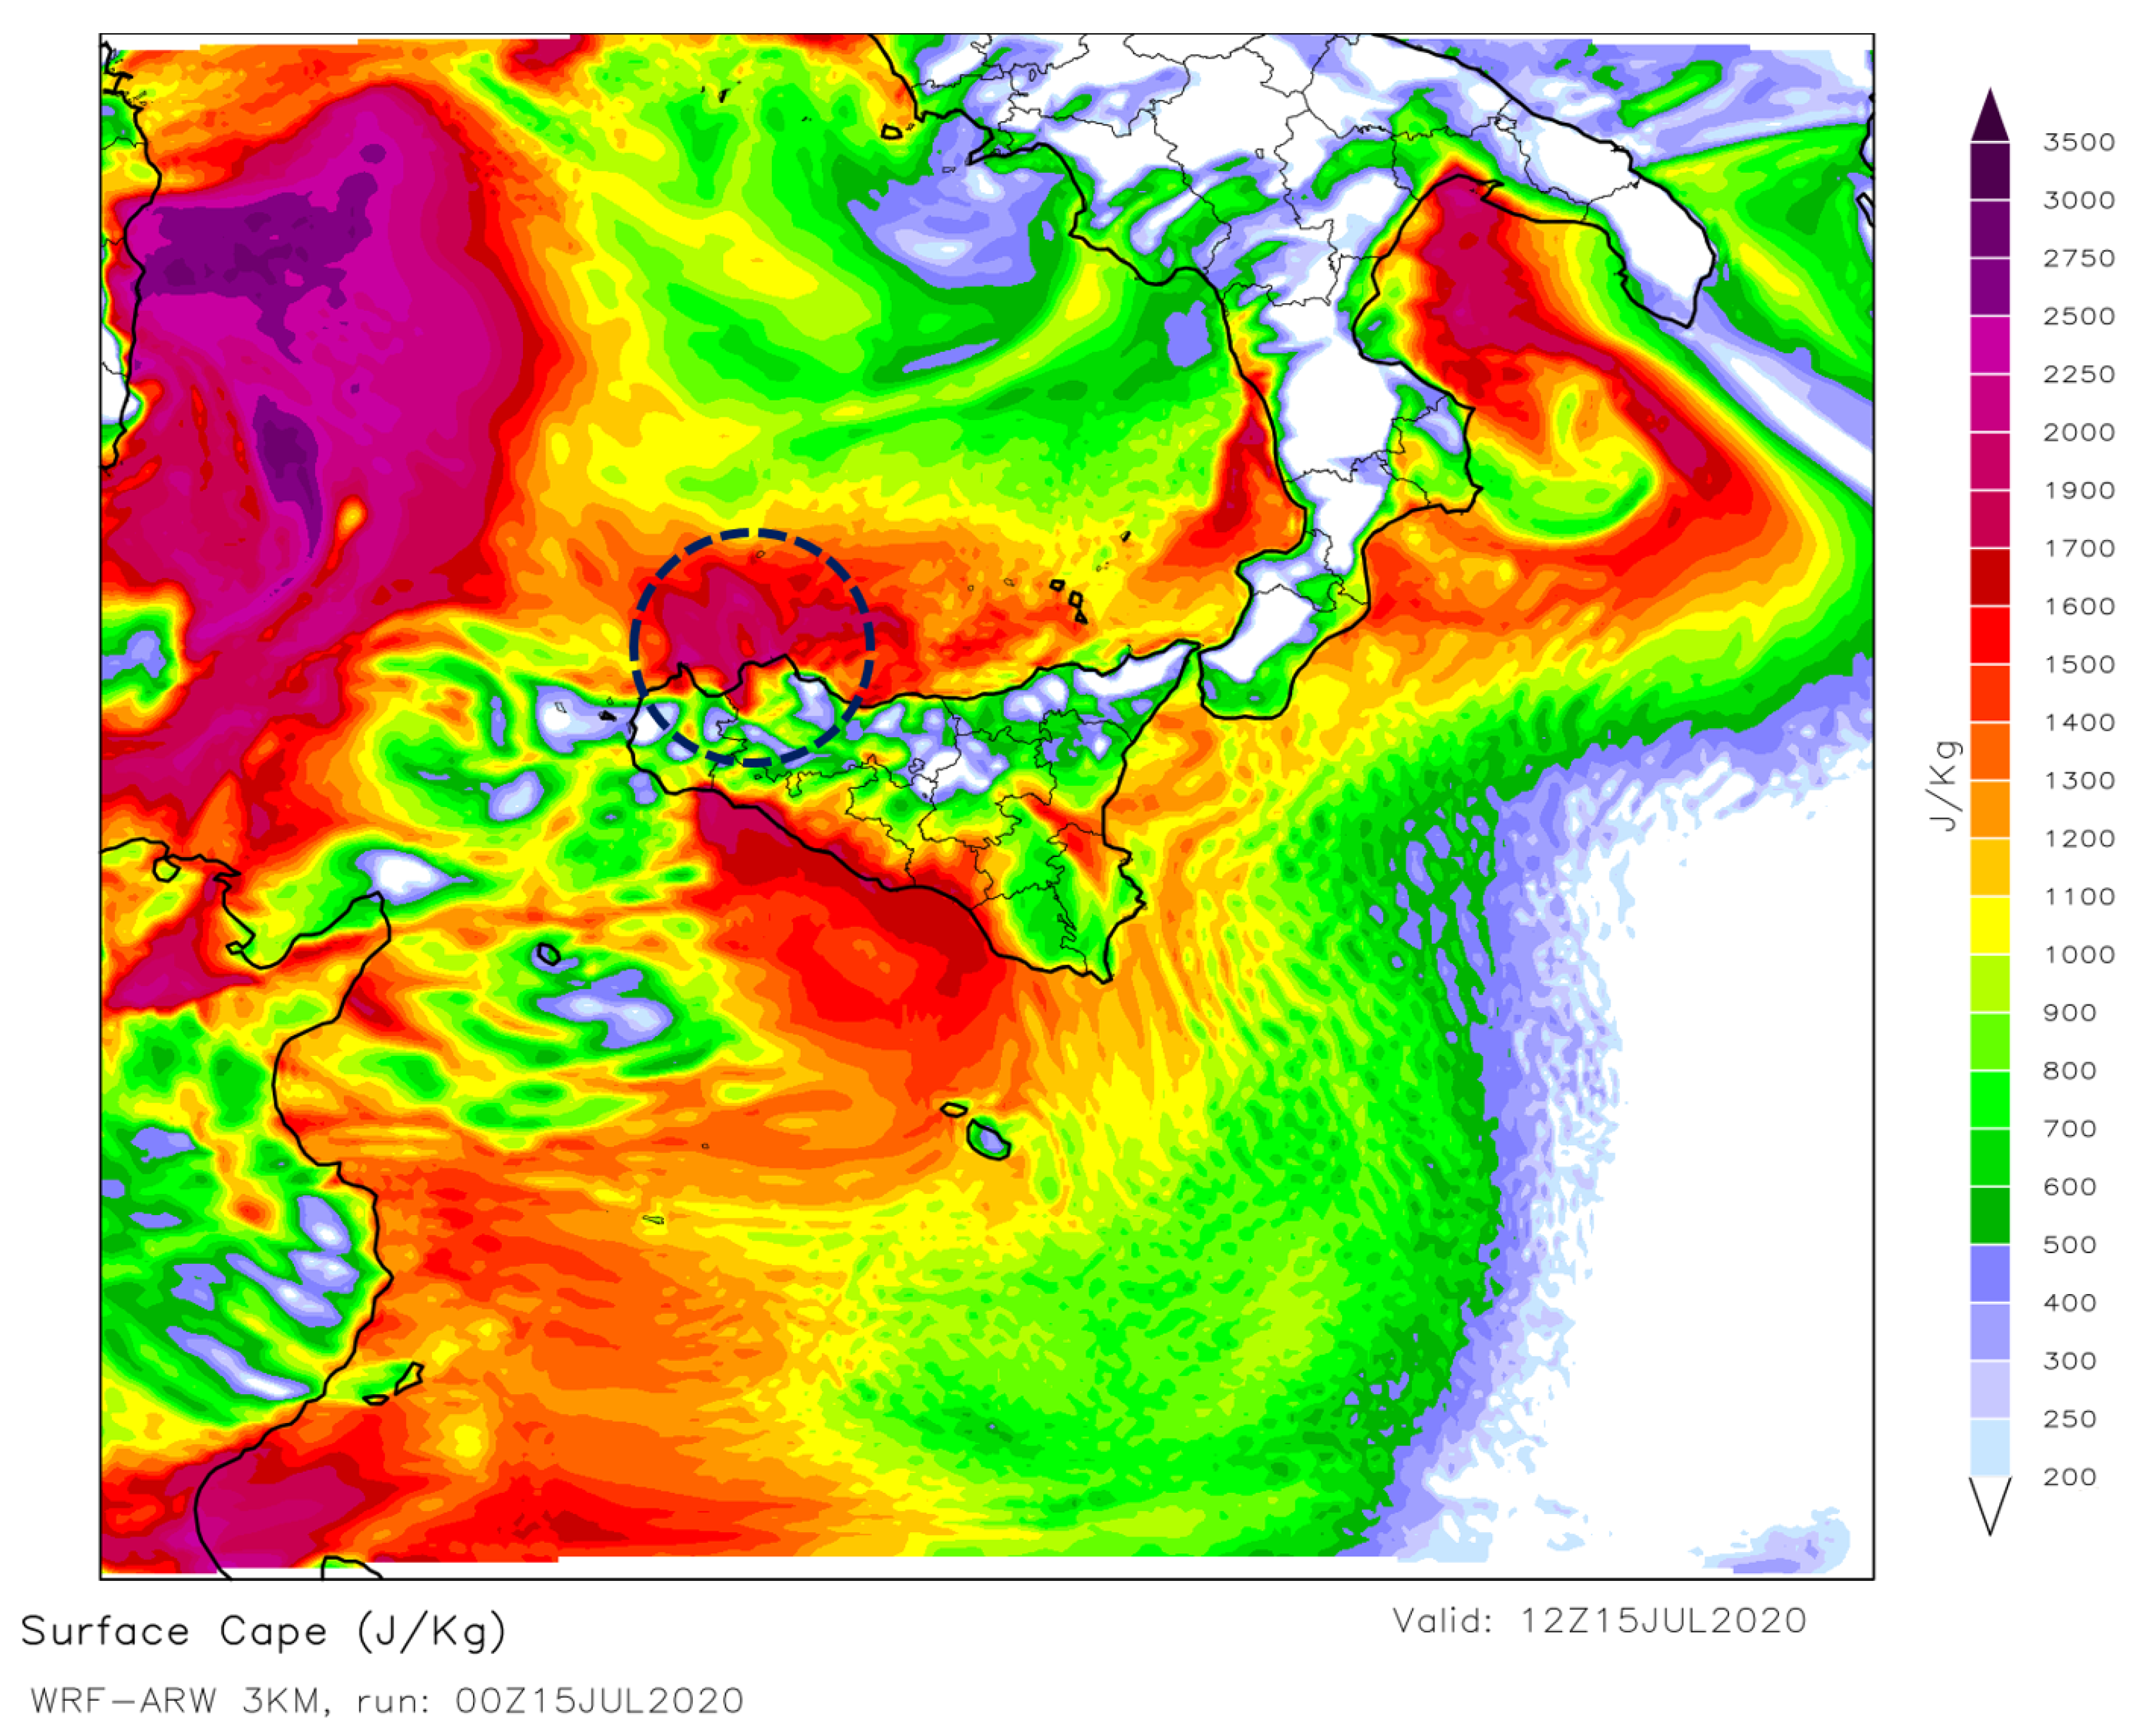
2.2. Synoptic Analysis
3. Results and Discussion
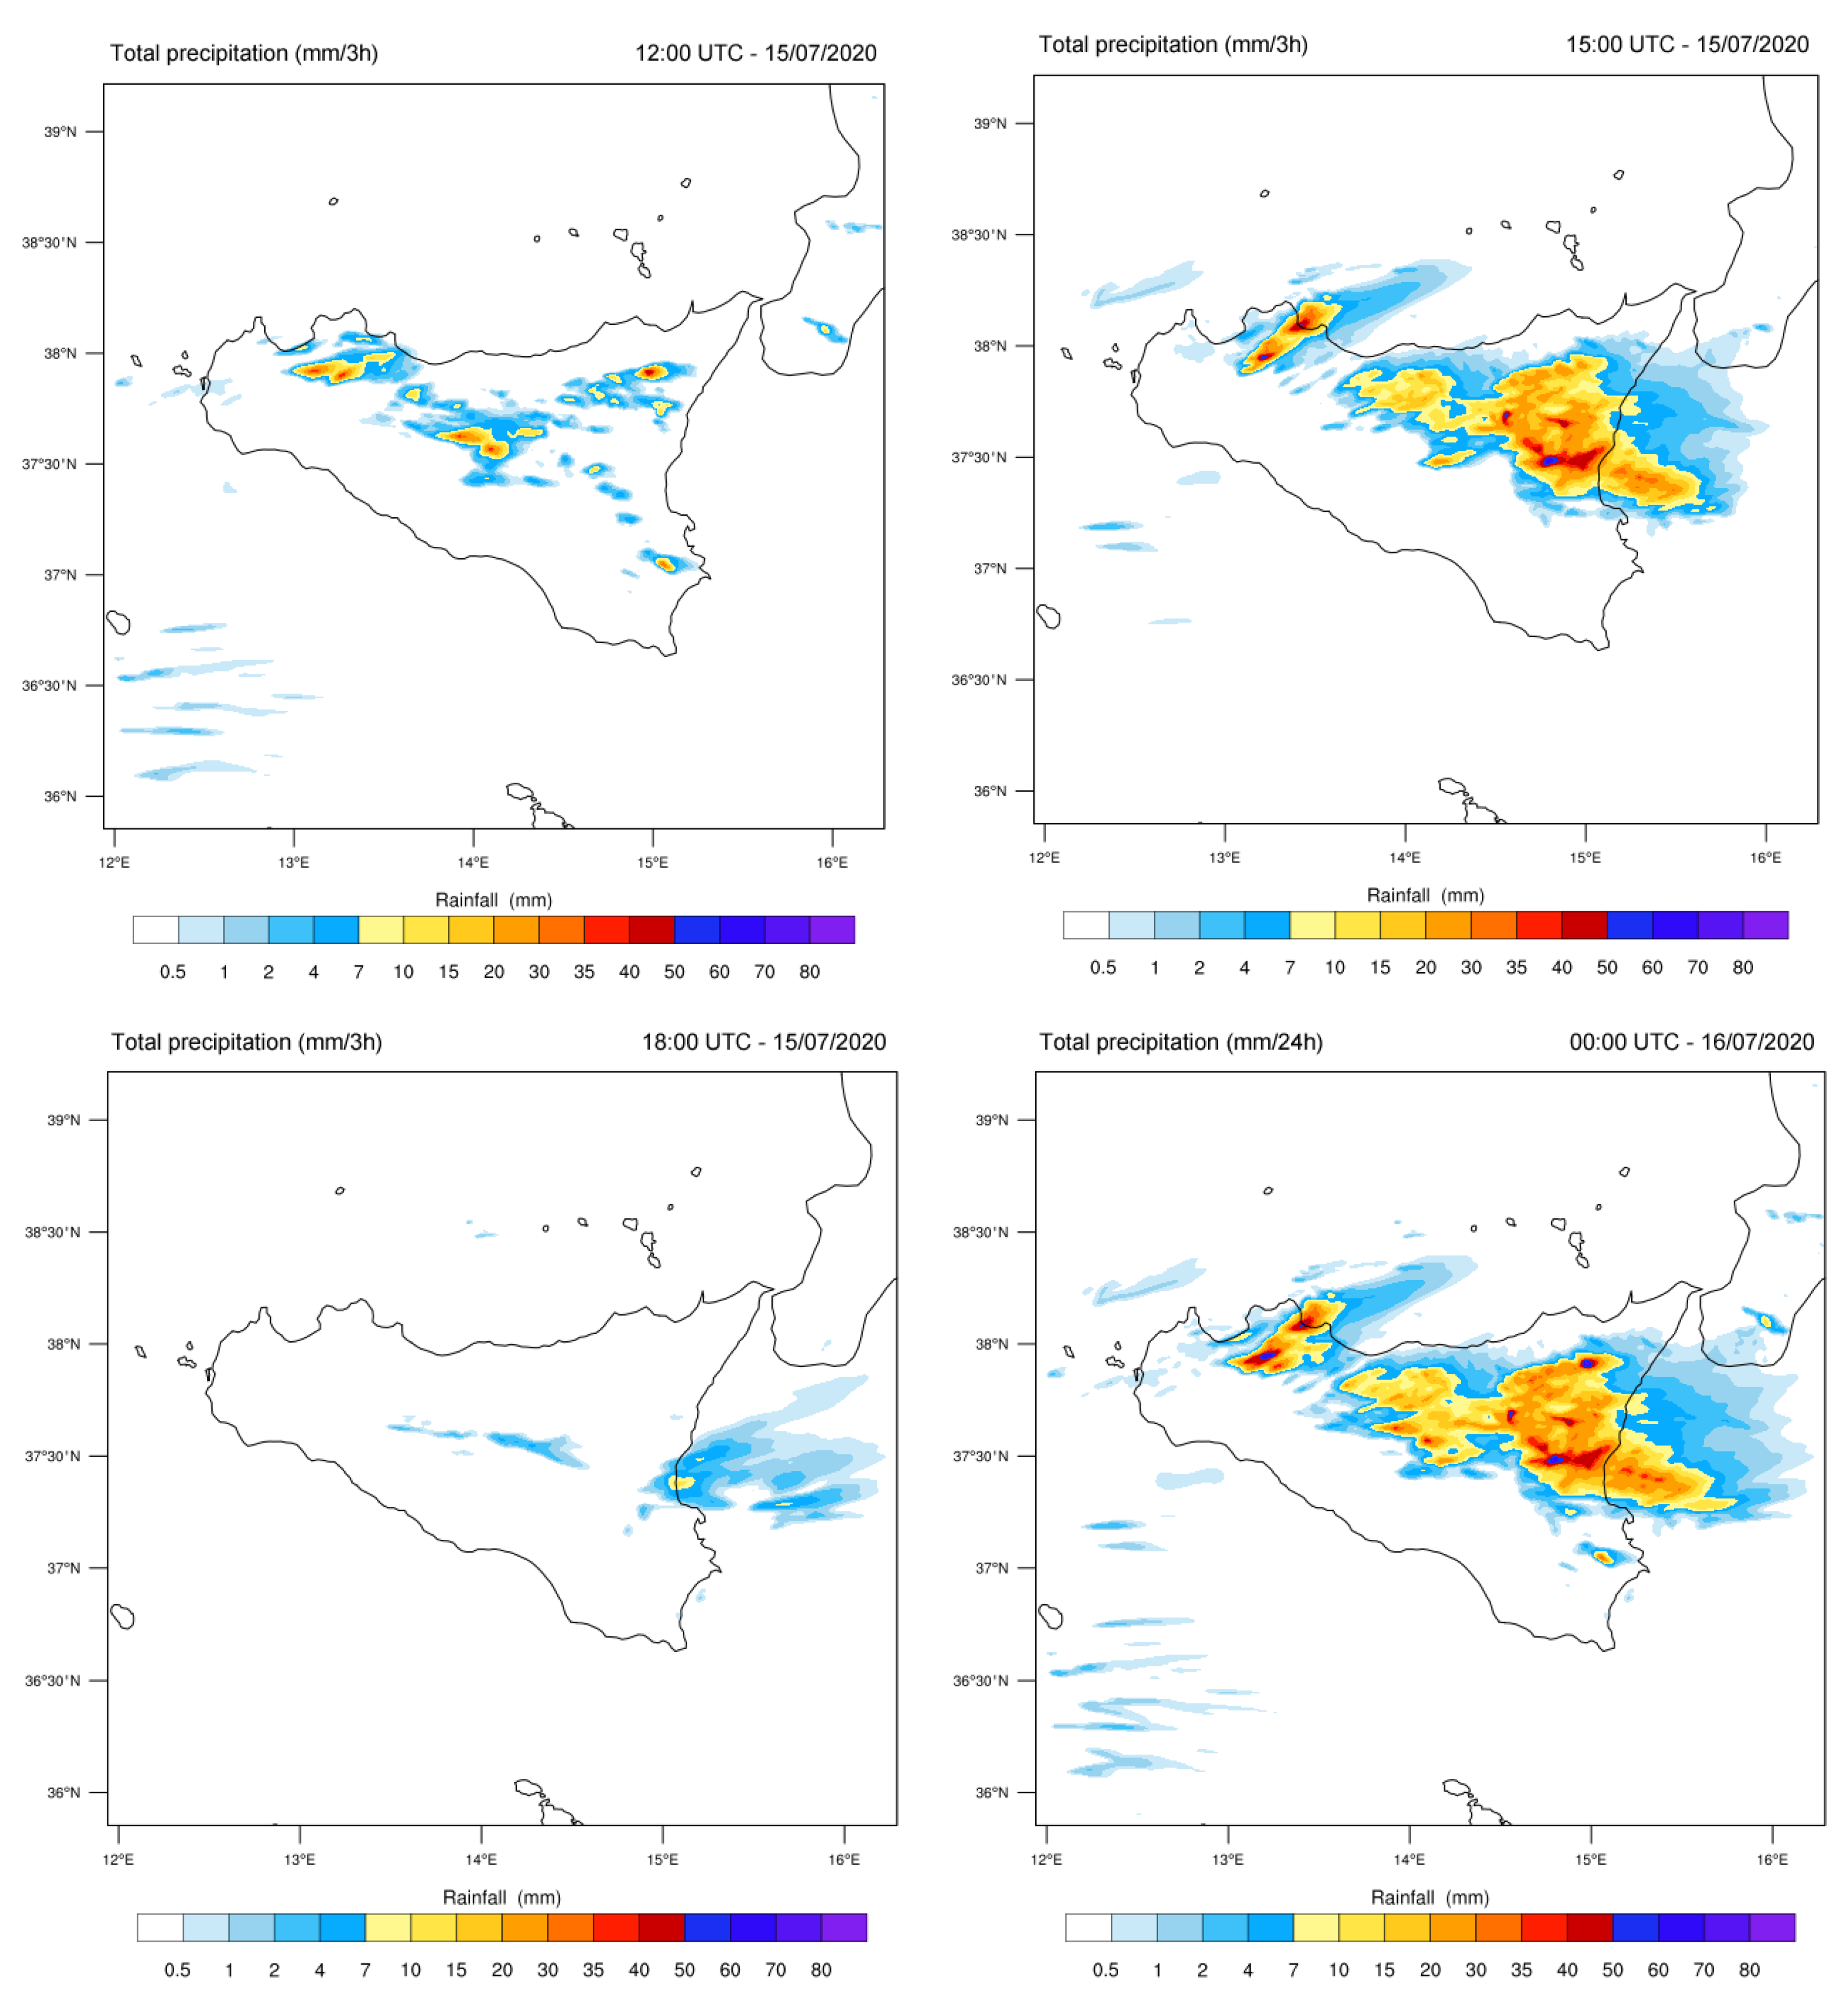
Analysis of Flash Flood Scenario
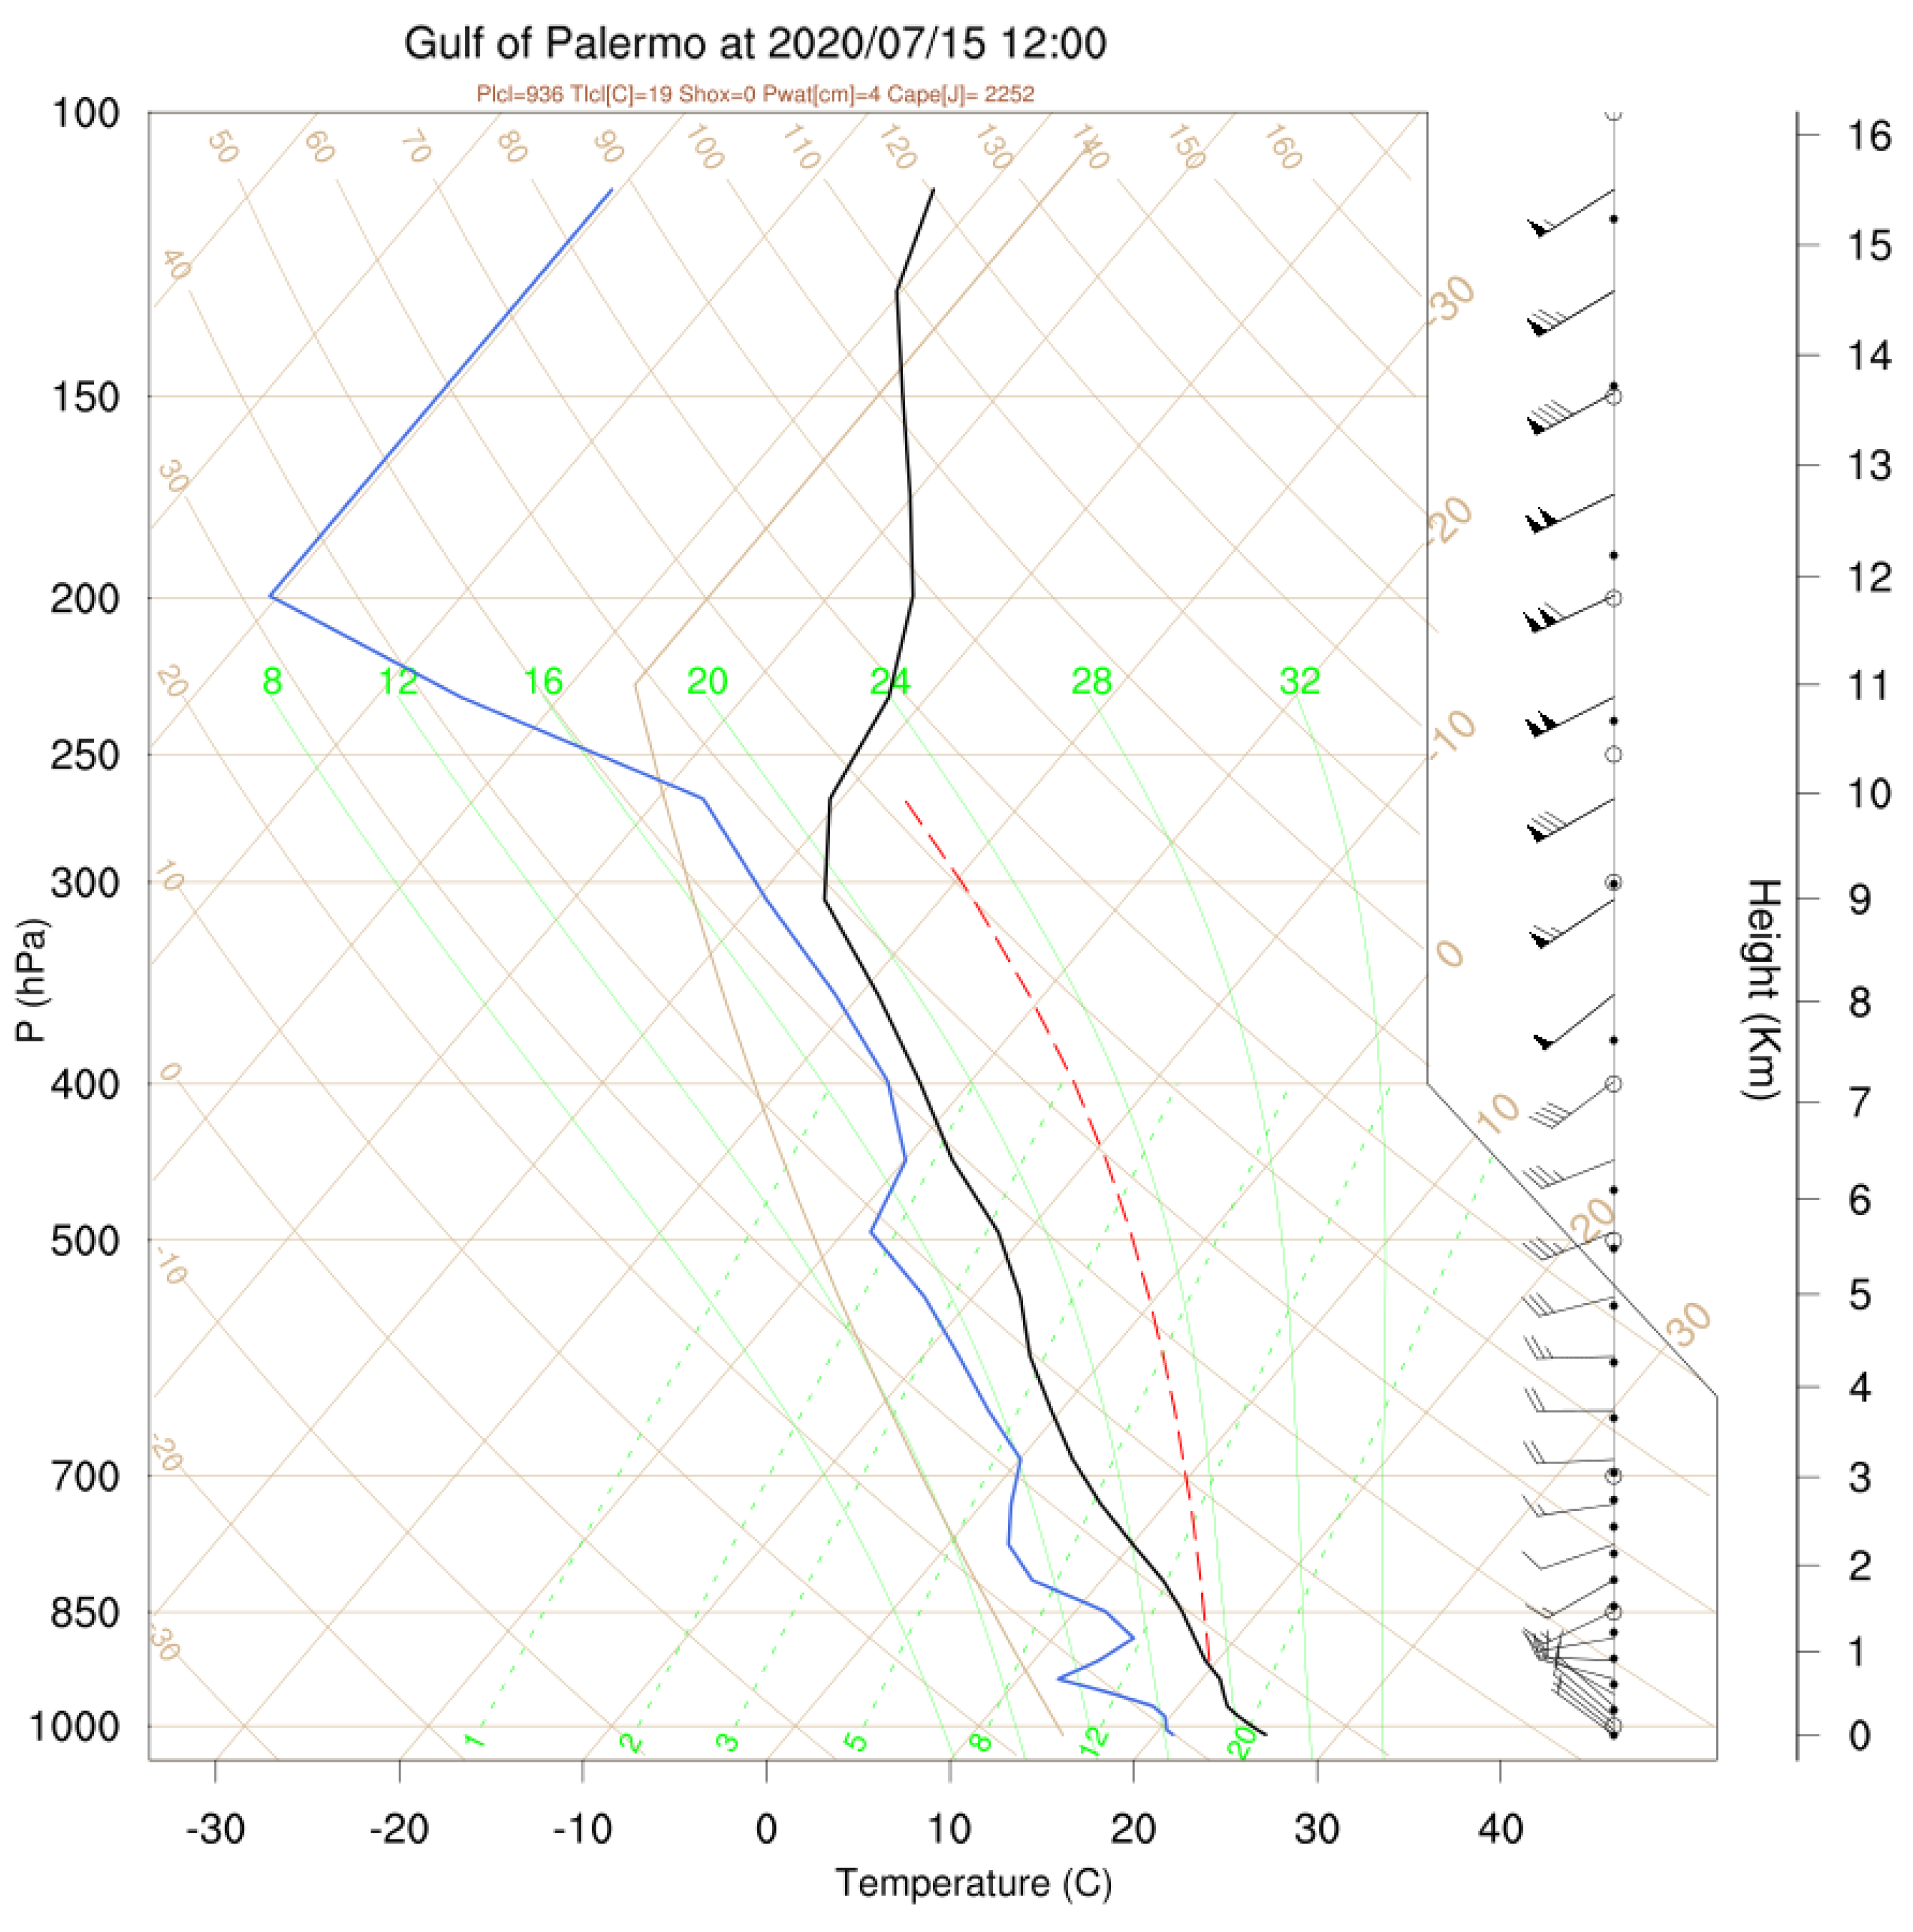
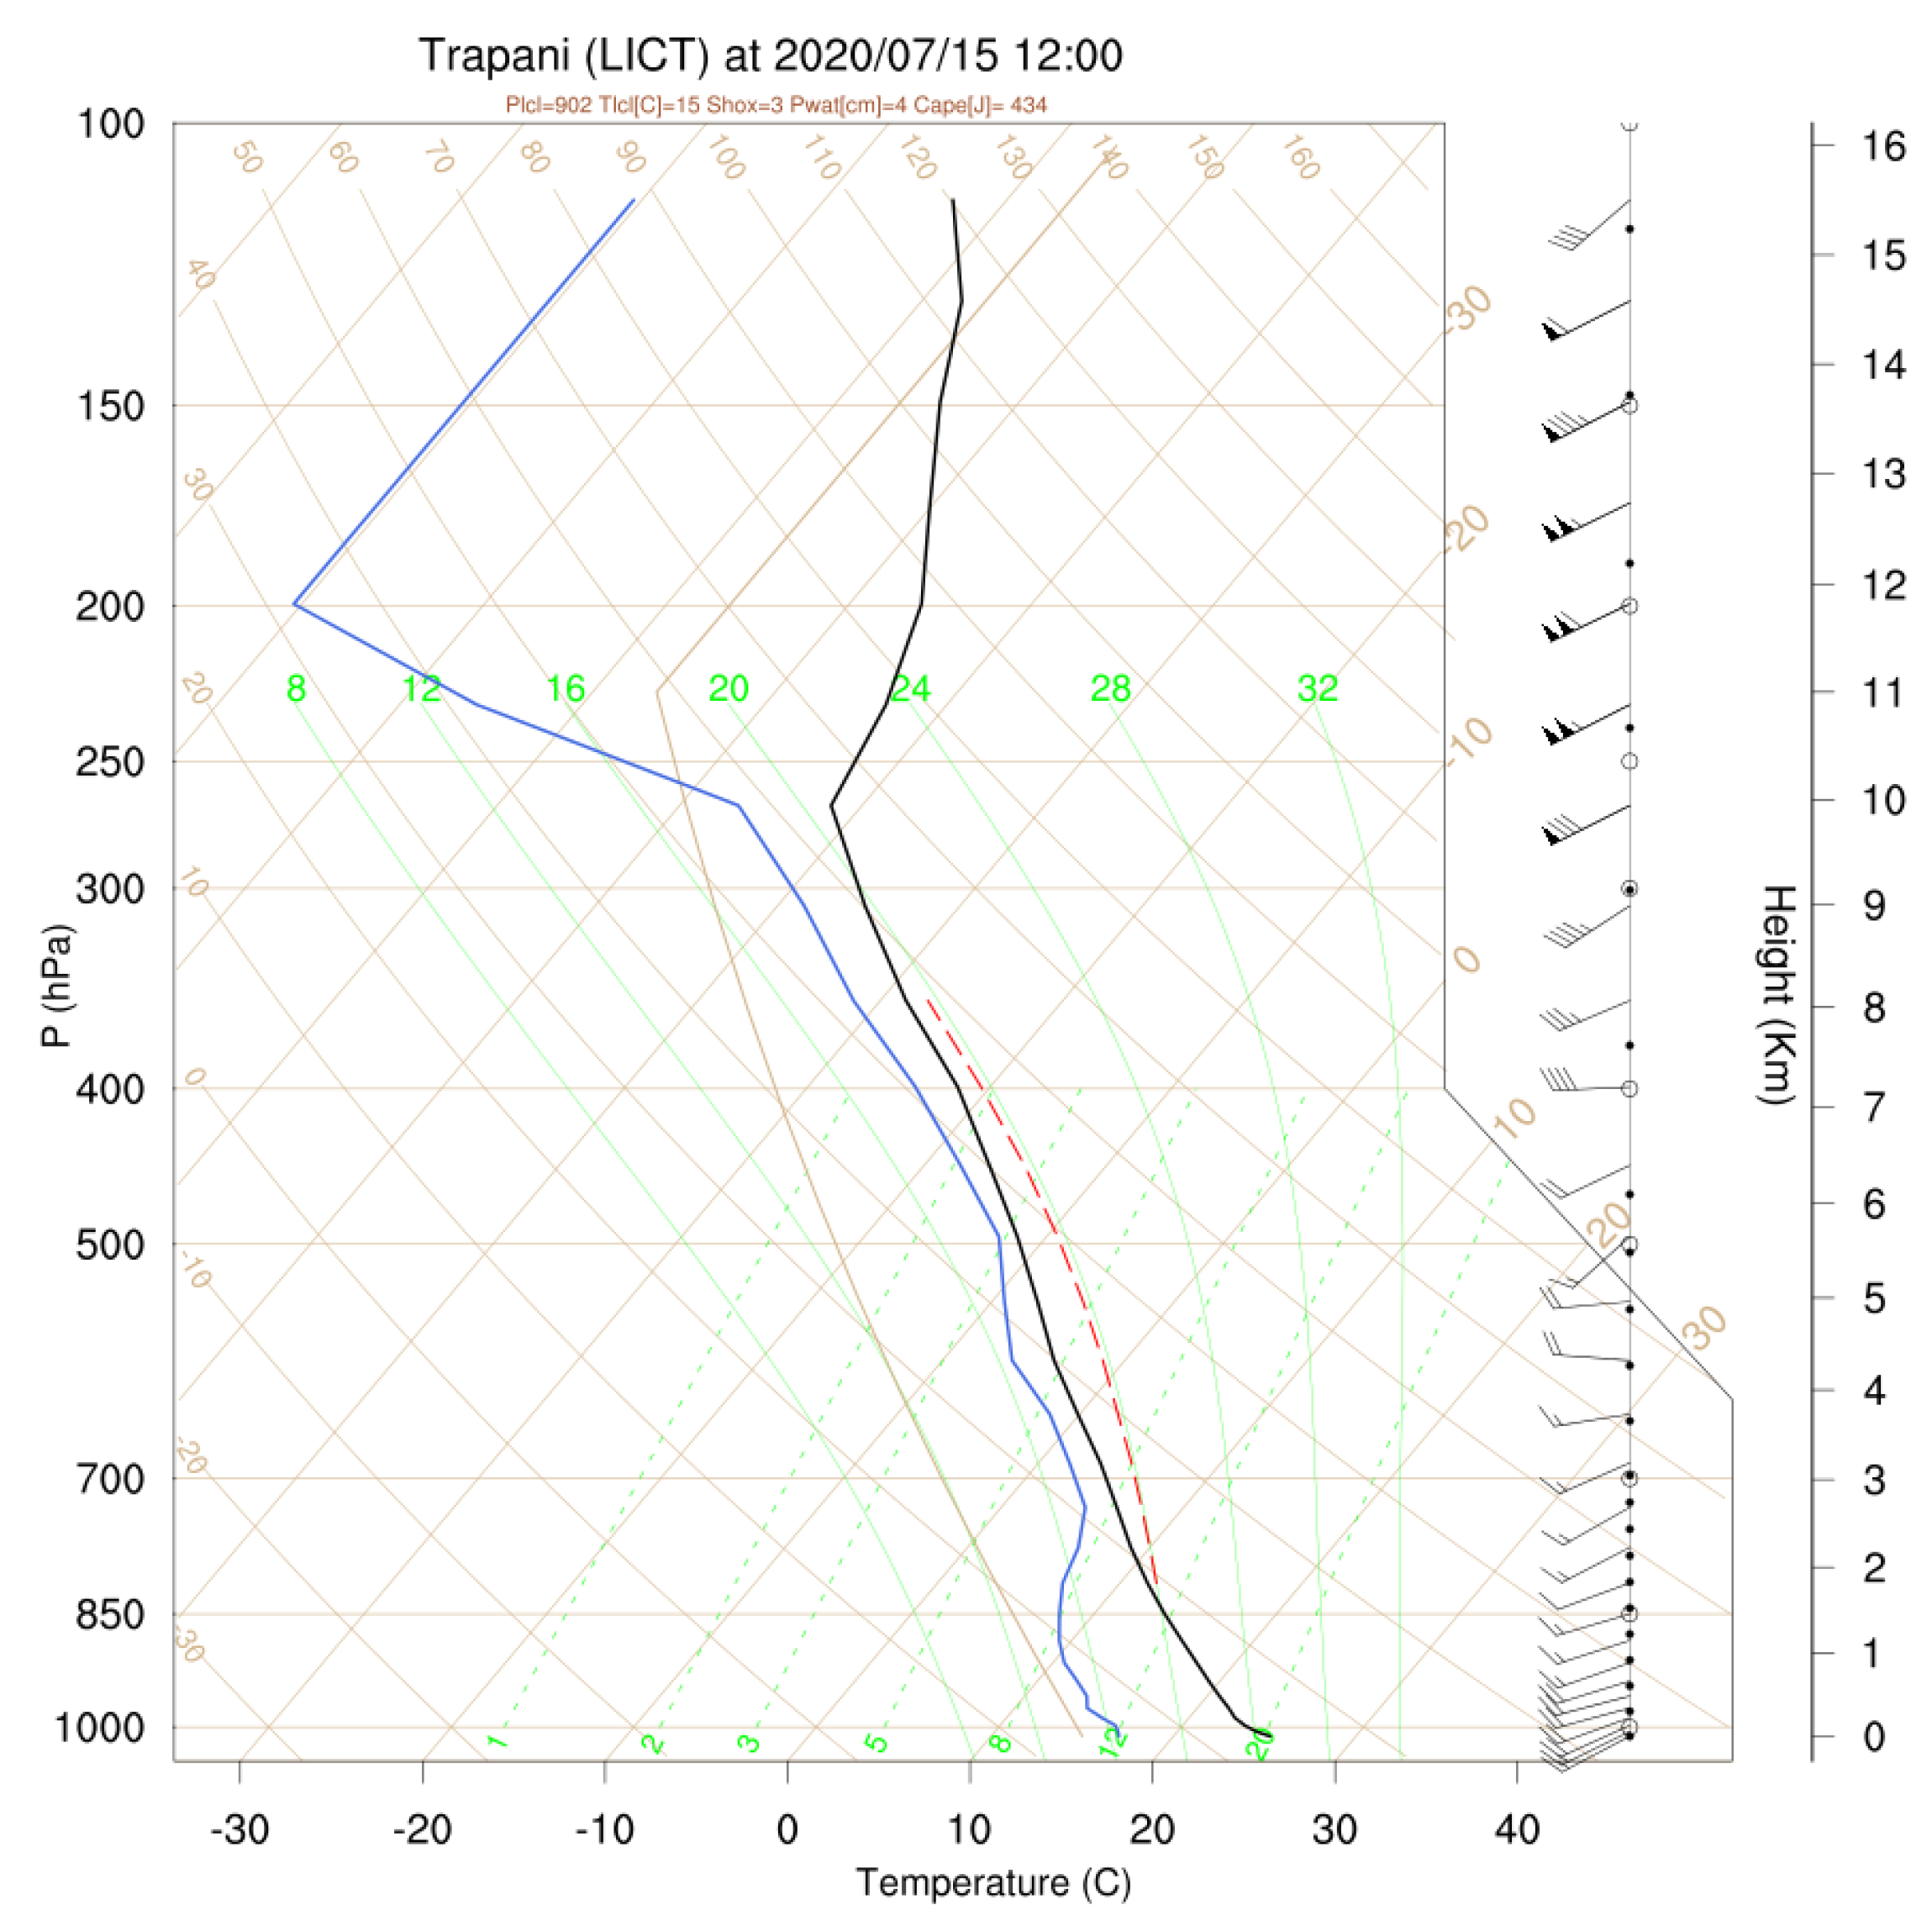
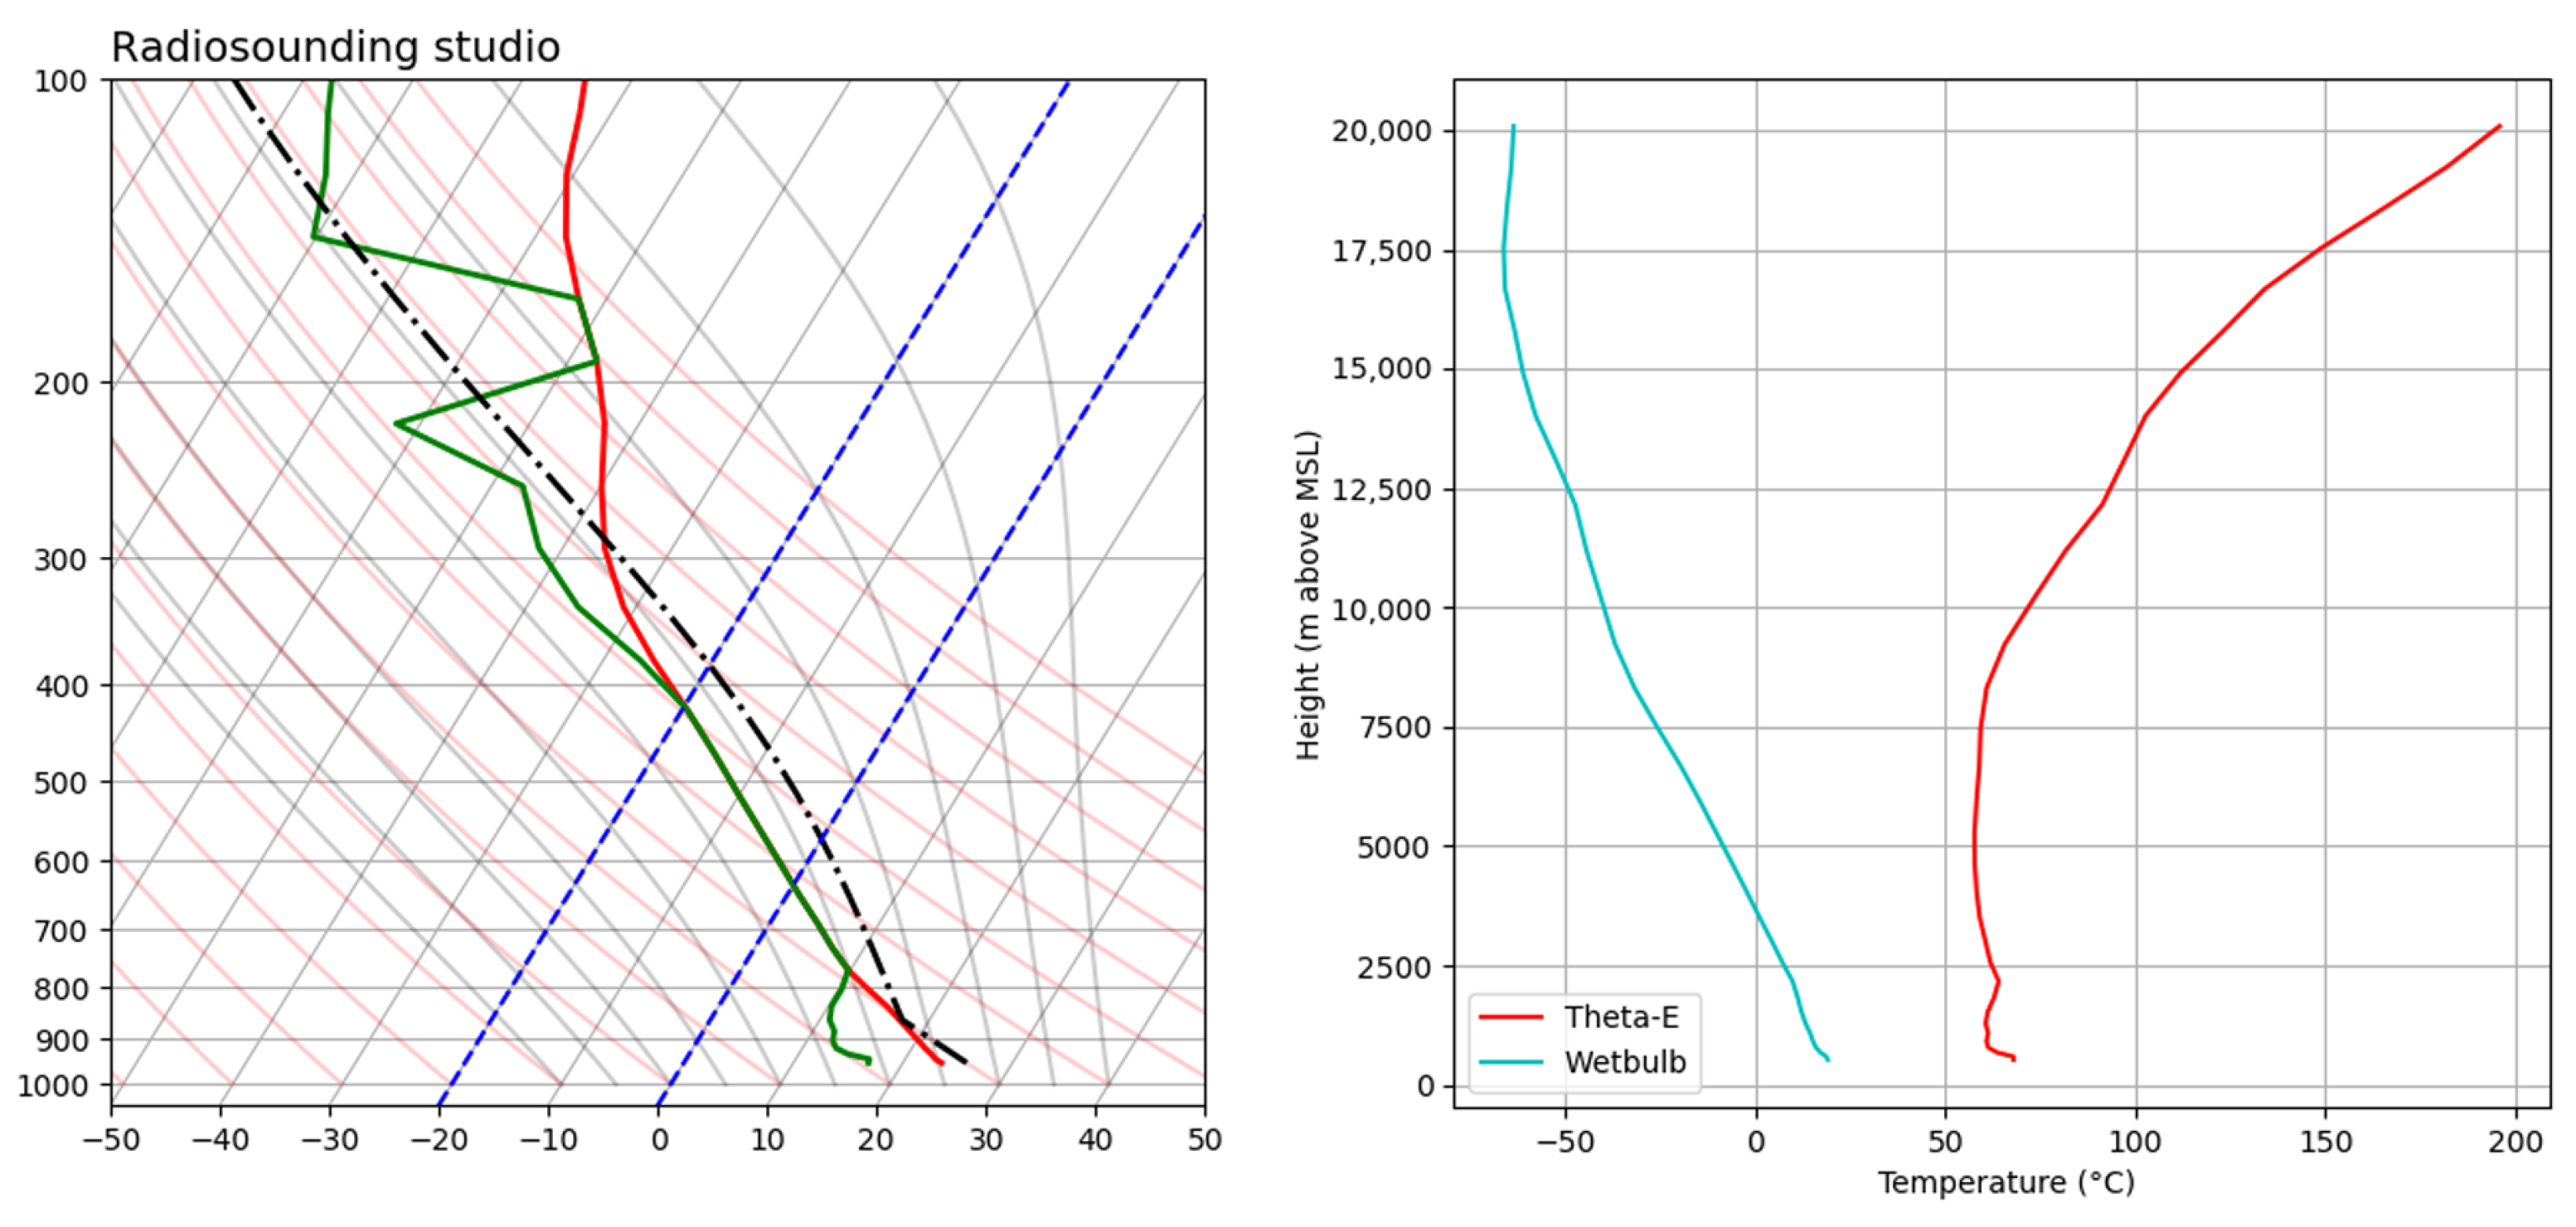
- tall skinny CAPE profile;
- uniformly deep moisture profile;
- high value of precipitable water;
- thick warm cloud depth.
- available moisture / K index / TT Index;
- slow storm movement;
- upper-level divergence;
- nearby surface boundary;
- poor lapse rate.
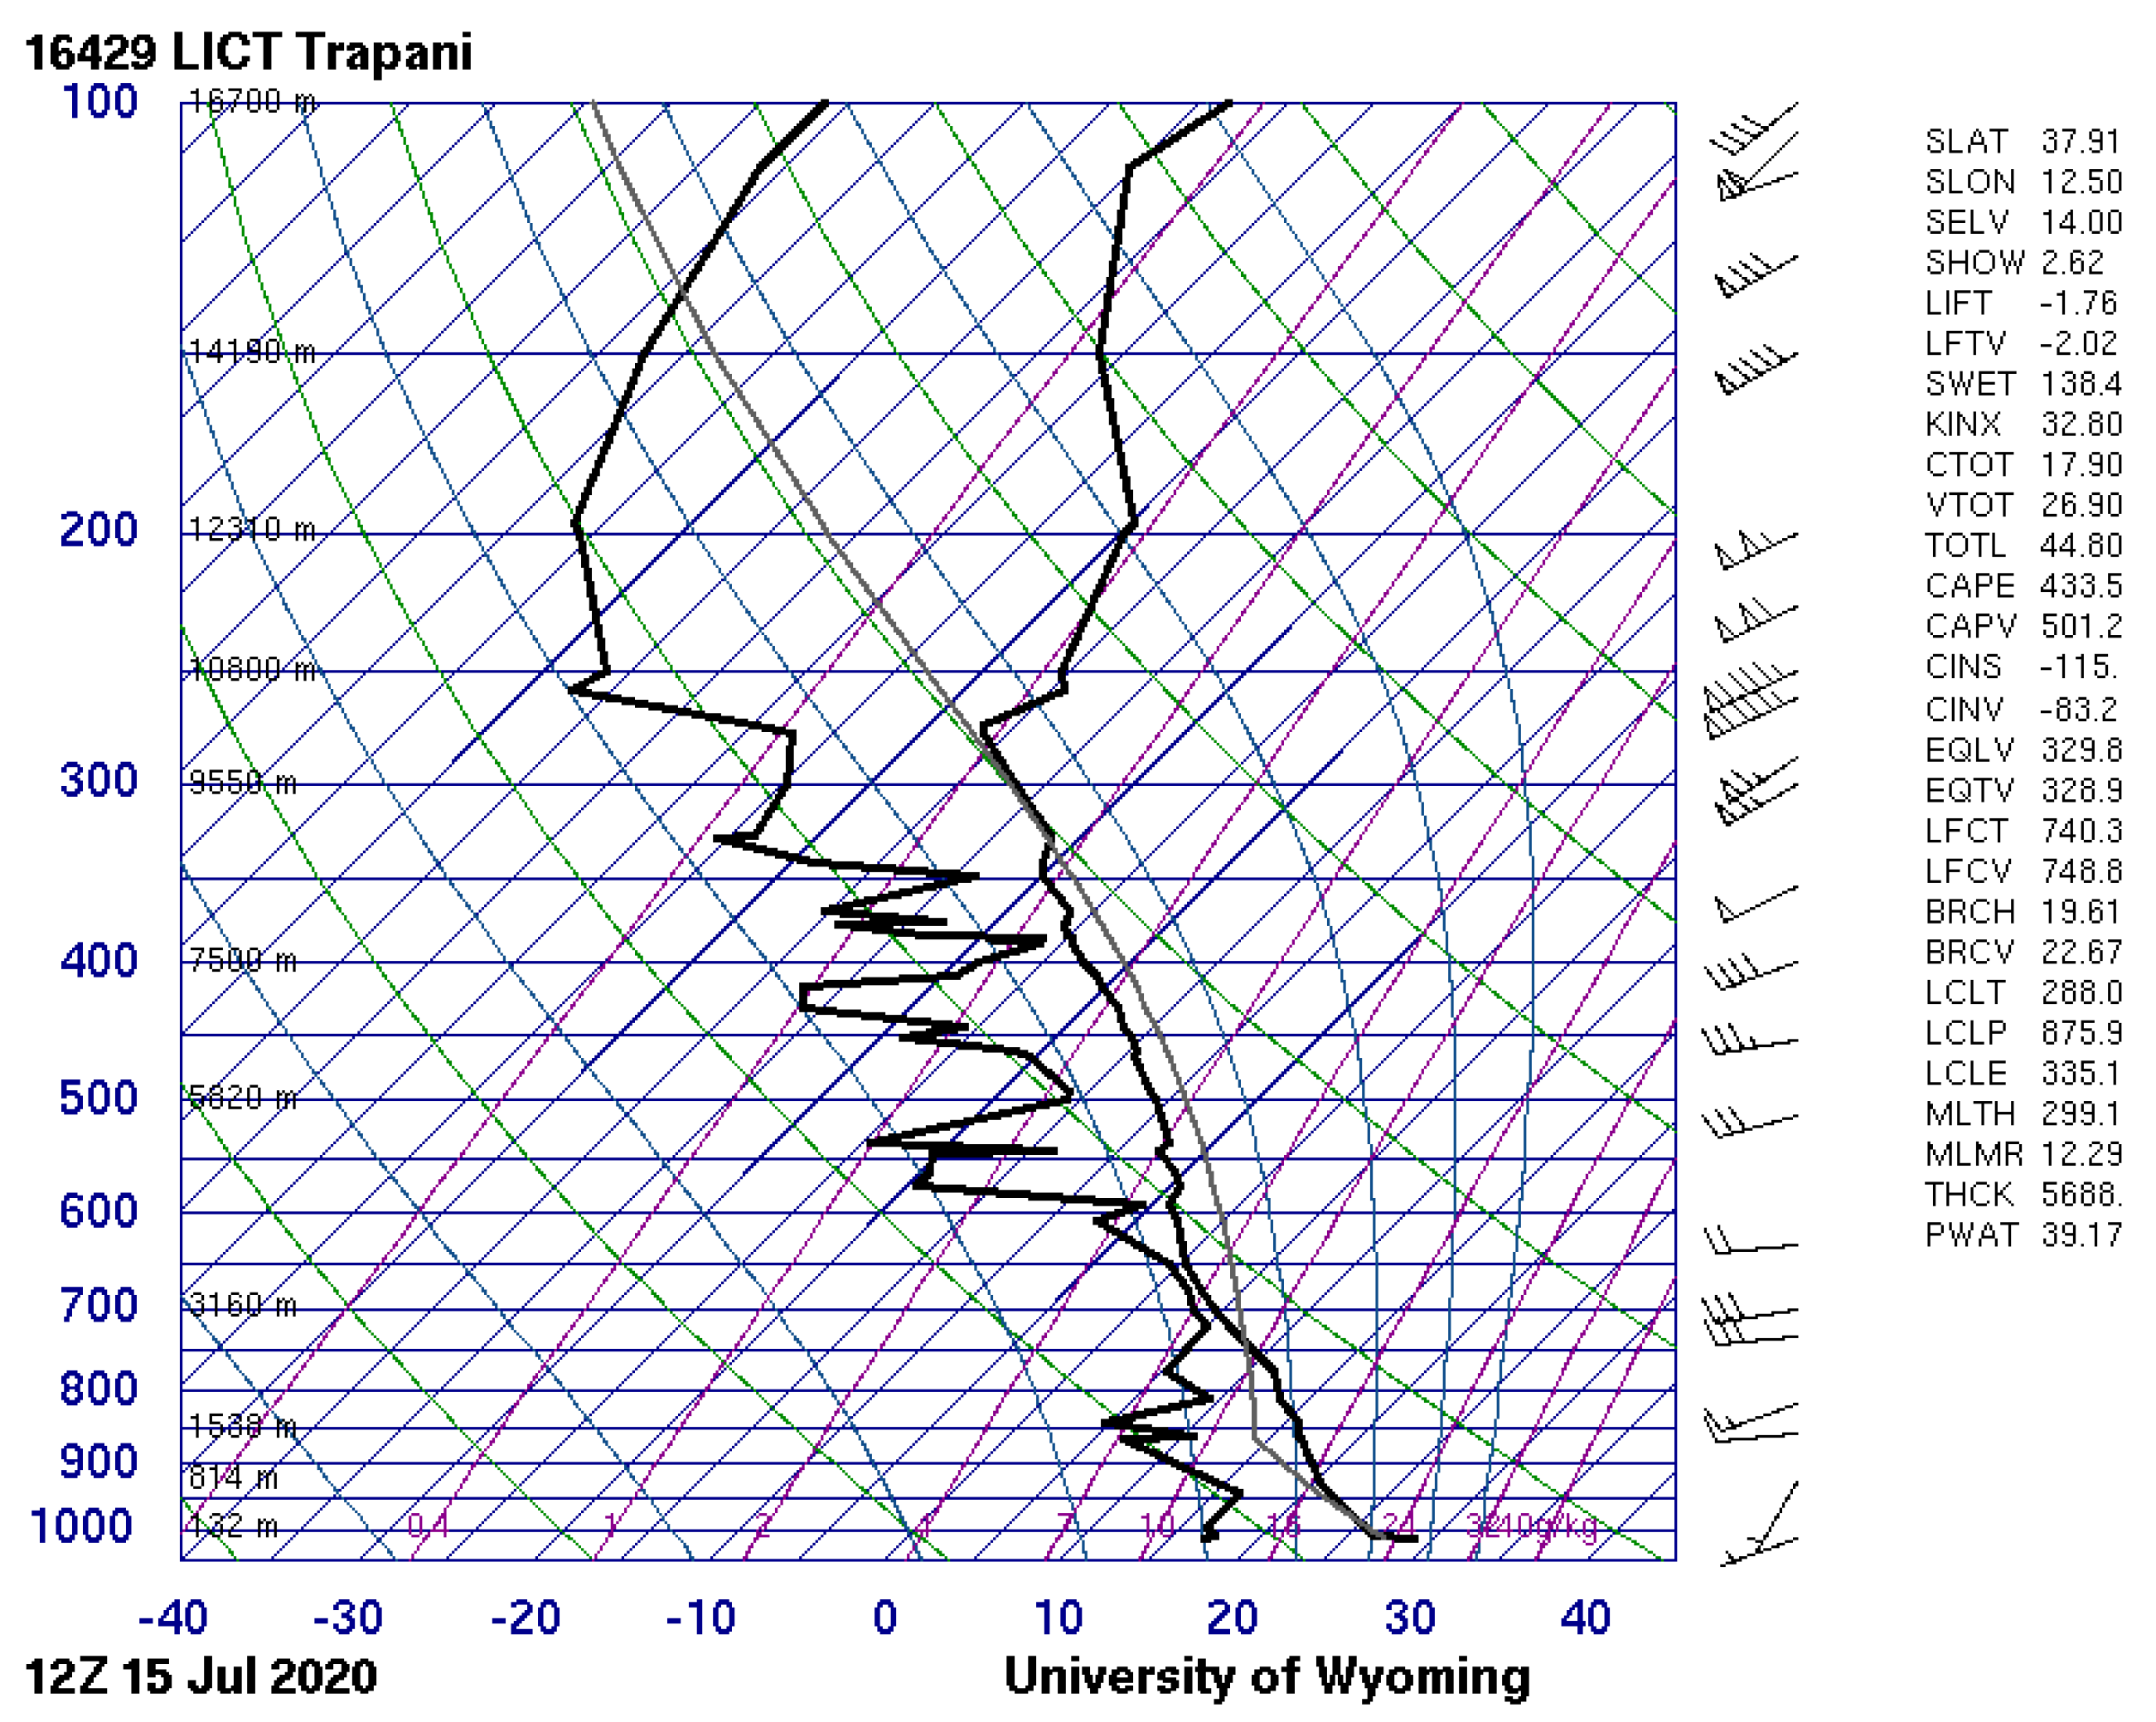
- our custom script;
- real radiosounding for LICT from Wyoming University; and
- reanalysis sounding from GFS/ERA5.
4. Conclusions
Author Contributions
Funding
Informed Consent Statement
Data Availability Statement
Acknowledgments
Conflicts of Interest
References
- Cassola, F.; Ferrari, F.; Mazzino, A.; Lacorata, G.; Rotunno, R. Numerical simulations of Mediterranean heavy precipitation events with the WRF model: A verification exercise using different approaches. Atmos. Res. 2015, 164, 210–225. [Google Scholar] [CrossRef]
- Hong, S.Y.; Lee, J.W. Assessment of the WRF model in reproducing a flash-flood heavy rainfall event over Korea. Atmos. Res. 2009, 93, 818–831. [Google Scholar] [CrossRef]
- Liu, J.; Bray, M.; Han, D. Sensitivity of the Weather Research and Forecasting (WRF) model to downscaling ratios and storm types in rainfall simulation. Hydrol. Process. 2012, 26, 3012–3031. [Google Scholar] [CrossRef]
- Chawla, I.; Osuri, K.K.; Mujumdar, P.P.; Niyogi, D. Assessment of the Weather Research and Forecasting (WRF) model for simulation of extreme rainfall events in the upper Ganga Basin. Hydrol. Earth Syst. Sci. 2018, 22, 1095–1117. [Google Scholar] [CrossRef] [Green Version]
- Avolio, E.; Federico, S. WRF simulations for a heavy rainfall event in southern Italy: Verification and sensitivity tests. Atmos. Res. 2018, 209, 14–35. [Google Scholar] [CrossRef]
- Mesinger, F. Limited Area Modeling: Beginnings, state of the art, outlook. In 50th Anniversary of Numerical Weather Prediction Commemorative Symposium, Book of Lectures; European Meteorological Society: Bonn, Germany, 2021; pp. 91–118. [Google Scholar]
- Coleman, J.; Law, K. Meteorology. In Reference Module in Earth Systems and Environmental Sciences; Elsevier: Amsterdam, The Netherlands, 2015. [Google Scholar] [CrossRef]
- Rontu, L. Studies on Orographic Effects in a Numerical Weather Prediction Model; Finnish Meteorological Institute: Helsinki, Finland, 2007.
- Ntwali, D.; Ogwang, B.A.; Ongoma, V. The impacts of topography on spatial and temporal rainfall distribution over Rwanda based on WRF model. Atmos. Clim. Sci. 2016, 6, 145–157. [Google Scholar] [CrossRef] [Green Version]
- Lee, J.W.; Hong, S.Y. A numerical simulation study of orographic effects for a heavy rainfall event over Korea using the WRF model. Atmosphere 2006, 16, 319–332. [Google Scholar]
- Moya-Álvarez, A.S.; Martínez-Castro, D.; Kumar, S.; Estevan, R.; Silva, Y. Response of the WRF model to different resolutions in the rainfall forecast over the complex Peruvian orography. Theor. Appl. Climatol. 2019, 137, 2993–3007. [Google Scholar] [CrossRef]
- Mastrantonas, N.; Herrera-Lormendez, P.; Magnusson, L.; Pappenberger, F.; Matschullat, J. Extreme precipitation events in the Mediterranean: Spatiotemporal characteristics and connection to large-scale atmospheric flow patterns. Int. J. Climatol. 2021, 41, 2710–2728. [Google Scholar] [CrossRef]
- Dayan, U.; Nissen, K.; Ulbrich, U. Review Article: Atmospheric conditions inducing extreme precipitation over the eastern and western Mediterranean. Nat. Hazards Earth Syst. Sci. 2015, 15, 2525–2544. [Google Scholar] [CrossRef]
- Iriza, A.; Dumitrache, R.C.; Lupascu, A.; Stefan, S. Studies regarding the quality of numerical weather forecasts of the WRF model integrated at high-resolutions for the Romanian territory. Atmósfera 2016, 29, 11–21. [Google Scholar] [CrossRef] [Green Version]
- Uddin, M.J.; Samad, M.; Mallik, M. Impact of Horizontal Grid Resolutions for Thunderstorms Simulation over Bangladesh Using WRF-ARW Model. Dhaka Univ. J. Sci. 2021, 69, 43–51. [Google Scholar] [CrossRef]
- Powers, J.G. The Weather Research and Forecasting Model Overview, System Efforts, and Future Directions. Bull. Am. Meteorol. Soc. 2017, 98, 1717–1737. [Google Scholar] [CrossRef]
- Skamarock, W.C.; Klemp, J.B.; Dudhia, J.; Gill, D.O.; Liu, Z.; Berner, J.; Wang, W.; Powers, J.G.; Duda, M.G.; Barker, D.M.; et al. A Description of the Advanced Research WRF Model Version 4; Mesoscale and Microscale Meteorology Laboratory NCAR: Boulder, CO, USA, 2019. [Google Scholar]
- Castorina, G.; Colombo, F.; Caccamo, M.T.; Cannuli, A.; Insinga, V.; Maiorana, E.; Magazù, S. Cultural Heritage and Natural Hazard: How WRF Model Can Help to Protect and Safe Archaeological Sites. Int. J. Res. Environ. Sci. 2017, 3, 37–42. [Google Scholar]
- Colombo, F.; Castorina, G.; Caccamo, M.T.; Insinga, V.; Maiorana, E.; Magazù, S. IT Technologies for Science Application: Using Meteorological Local Area Model to Contrast the Hydrogeological Risks. Hydrol. Curr. Res. 2017, 8, 4. [Google Scholar] [CrossRef] [Green Version]
- Caccamo, M.T.; Castorina, G.; Catalano, F.; Magazù, S. Rüchardt’s experiment treated by Fourier transform. Eur. J. Phys. 2019, 40, 025703. [Google Scholar] [CrossRef]
- Castorina, G.; Caccamo, M.T.; Magazù, S. A new approach to the adiabatic piston problem through the arduino board and innovative frequency analysis procedures. In New Trends in Physics Education Research; Magazù, S., Ed.; Nova Science Publishers: Hauppauge, NY, USA, 2018; pp. 133–156. [Google Scholar]
- Grell, G.A.; Peckham, S.E.; Schmitz, R.; McKeen, S.A.; Frost, G.; Skamarock, W.C.; Eder, B. Fully coupled “online” chemistry within the WRF model. Atmos. Environ. Atmos. Environ. 2005, 39, 6957–6975. [Google Scholar] [CrossRef]
- Rizza, U.; Brega, E.; Caccamo, M.T.; Castorina, G.; Morichetti, M.; Munaò, G.; Passerini, G.; Magazù, S. Analysis of the ETNA 2015 Eruption Using WRF-Chem Model and Satellite Observations. Atmosphere 2020, 11, 1168. [Google Scholar] [CrossRef]
- Rizza, U.; Donnadieu, F.; Magazu, S.; Passerini, G.; Castorina, G.; Semprebello, A.; Morichetti, M.; Virgili, S.; Mancinelli, E. Effects of Variable Eruption Source Parameters on Volcanic Plume Transport: Example of the 23 November 2013 Paroxysm of Etna. Remote Sens. 2021, 13, 4037. [Google Scholar] [CrossRef]
- Roger, S.R.; Pielke, A. Mesoscale Meteorological Modeling; Academic Press Inc: Cambridge, MA, USA, 2013; Volume 98. [Google Scholar]
- Holton, J.R. An Introduction to Dynamic Meteorology, 4th ed.; Elsevier Academic Press: Burlington, NJ, USA, 2004; Volume 88. [Google Scholar]
- Sarah, N.; Robert, S.; Ray, P.; Chen, K.; Lassman, A.; Brownlee, J. Grids in Numerical Weather and Climate Models. In Climate Change and Regional/Local Responses; InTech: London, UK, 2013. [Google Scholar]
- Caccamo, M.T.; Castorina, G.; Colombo, F.; Insinga, V.; Maiorana, E.; Magazù, S. Weather forecast performances for complex orographic areas: Impact of different grid resolutions and of geographic data on heavy rainfall event simulations in Sicily. Atmos. Res. 2017, 198, 22–33. [Google Scholar] [CrossRef]
- Ooyama, K.V. A thermodynamic foundation for modeling the moist atmosphere. J. Atmos. Sci. 1990, 47, 2580–2593. [Google Scholar] [CrossRef]
- Laprise, R. The Euler equations of motion with hydrostatic pressure as an independent variable. Mon. Weather Rev. 1992, 120, 197–207. [Google Scholar] [CrossRef]
- Skamarock, W.C.; Klemp, J.B.; Dudhia, J. Prototypes for the WRF (Weather Research and Forecasting) model. Am. Meteorol. Soc. 2001. J11–J15, preprints. [Google Scholar]
- Wang, S.; Huang, S.; Li, Y. Sensitive numerical simulation and analysis of rainstorm using nested WRF model. J. Hydrodyn. 2006, 18, 578–586. [Google Scholar] [CrossRef]
- Jee, J.B.; Kim, S. Sensitivity Study on High-Resolution WRF Precipitation Forecast for a Heavy Rainfall Event. Atmosphere 2017, 8, 96. [Google Scholar] [CrossRef] [Green Version]
- Wang, W.; Gill, D. WRF nesting. In WRF Tutorial; NCAR: Boulder, CO, USA, 2012. [Google Scholar]
- Emmanouil, G.; Vlachogiannis, D.; Sfetsos, A. Exploring the ability of the WRF-ARW atmospheric model to simulate different meteorological conditions in Greece. Atmos. Res. 2021, 247, 105226. [Google Scholar] [CrossRef]
- Iacono, M.J.; Delamere, J.S.; Mlawer, E.J.; Shephard, M.W.; Clough, S.A.; Collins, W.D. Radiative forcing by long-lived greenhouse gases: Calculations with the AER radiative transfer models. J. Geophys. Res. Atmos. 2008, 113, D13103. [Google Scholar] [CrossRef]
- Janjić, Z.I. The Step-Mountain Eta Coordinate Model: Further Developments of the Convection, Viscous Sublayer, and Turbulence Closure Schemes. Mon. Weather Rev. 1994, 122, 927–945. [Google Scholar] [CrossRef]
- Mesinger, F. Forecasting upper tropospheric turbulence within the framework of the Mellor-Yamada 2.5 closure. In Research Activities in Atmospheric and Oceanic Modelling; CAS/JSC WGNE Rep. No. 18; WMO: Geneva, Switzerland, 1993; pp. 4.28–4.29. [Google Scholar]
- Mukul Tewari, N.; Tewari, M.; Chen, F.; Wang, W.; Dudhia, J.; LeMone, M.; Mitchell, K.; Ek, M.; Gayno, G.; Wegiel, J.; et al. Implementation and verification of the unified NOAH land surface model in the WRF model. In Proceedings of the 20th Conference on Weather Analysis and Forecasting/16th Conference on Numerical Weather Prediction, Seattle, WA, USA, 10 January 2004; pp. 11–15. [Google Scholar]
- Thompson, G.; Field, P.R.; Rasmussen, R.M.; Hall, W.D. Explicit Forecasts of Winter Precipitation Using an Improved Bulk Microphysics Scheme. Part II: Implementation of a New Snow Parameterization. Mon. Weather Rev. 2008, 136, 5095–5115. [Google Scholar] [CrossRef]
- Kain, J.S. The Kain-Fritsch Convective Parameterization: An Update. J. Appl. Meteorol. 2004, 43, 170–181. [Google Scholar] [CrossRef]
- Villalba-Pradas, A.; Tapiador, F.J. Empirical values and assumptions in the convection schemes of numerical models. Geosci. Model Dev. 2022, 15, 3447–3518. [Google Scholar] [CrossRef]
- Somses, S.; Bopape, M.J.M.; Ndarana, T.; Fridlind, A.; Matsui, T.; Phaduli, E.; Limbo, A.; Maikhudumu, S.; Maisha, R.; Rakate, E. Convection Parametrization and Multi-Nesting Dependence of a Heavy Rainfall Event over Namibia with Weather Research and Forecasting (WRF) Model. Climate 2020, 8, 112. [Google Scholar] [CrossRef]
- Castorina, G.; Caccamo, M.T.; Magazù, S. Study of convective motions and analysis of the impact of physical parametrization on the WRF-ARW forecast model. Atti della Accademia Peloritana 2019, 97, A19. [Google Scholar]
- Castorina, G.; Caccamo, M.T.; Colombo, F.; Magazù, S. The Role of Physical Parameterizations on the Numerical Weather Prediction: Impact of Different Cumulus Schemes on Weather Forecasting on Complex Orographic Areas. Atmosphere 2021, 12, 616. [Google Scholar] [CrossRef]
- Castorina, G.; Caccamo, M.T.; Magazù, S.; Restuccia, L. Multiscale mathematical and physical model for the study of nucleation processes in meteorology. Atti della Accademia Peloritana 2018, 96, A6. [Google Scholar]
- Hersbach, H.; Bell, B.; Berrisford, P.; Horányi, A.; Sabater, J.M.; Nicolas, J.; Radu, R.; Schepers, D.; Simmons, A.; Soci, C.; et al. Global reanalysis: Goodbye ERA-Interim, hello ERA5. ECMWF Newsl. 2019, 159, 17–24. [Google Scholar]
- Giuliacci, M.; Corazzon, P.; Giuliacci, A. Prevedere il Tempo con Internet; Alpha Test: Milano, Italy, 2007. [Google Scholar]
- Francipane, A.; Pumo, D.; Sinagra, M.; La Loggia, G.; Noto, L.V. A paradigm of extreme rainfall pluvial floods in complex urban areas: The flood event of 15 July 2020 in Palermo (Italy). Nat. Hazards Earth Syst. Sci. 2021, 21, 2563–2580. [Google Scholar] [CrossRef]
- Blumberg, W.G.; Halbert, K.T.; Supinie, T.A.; Marsh, P.T.; Thompson, R.L.; Hart, J.A. SHARPpy: An open-source sounding analysis toolkit for the atmospheric sciences. Bull. Am. Meteorol. Soc. 2017, 98, 1625–1636. [Google Scholar] [CrossRef]
- Thompson, R.L.; Smith, B.T.; Grams, J.S.; Dean, A.R.; Broyles, C. Convective Modes for Significant Severe Thunderstorms in the Contiguous United States. Part II: Supercell and QLCS Tornado Environments. Weather Forecast. 2012, 27, 1136–1154. [Google Scholar] [CrossRef] [Green Version]
- Bunkers, M.J.; Barber, D.A.; Thompson, R.L.; Edwards, R.; Garner, J. Choosing a Universal Mean Wind for Supercell Motion Prediction. J. Oper. Meteorol. 2014, 2, 115–129. [Google Scholar] [CrossRef]
- Daley, W.M.; Baker, D.J.; Kelly, J.J., Jr. Service Assessment-Central Florida Tornado Outbreak February 22–23; National Oceanic and Atmospheric Administration: Washington, DC, USA, 1998.
- Miller, R.C. Notes on Analysis and Severe-Storm Forecasting Procedures of the Air Force Global Weather Central; AWS: Ashburn, VA, USA, 1975; Volume 200. [Google Scholar]


| CAPE < 500 | Absence of thunderstorms |
| 500 < CAPE < 1000 | Possibility of thunderstorms isolates |
| 1000 < CAPE < 2000 | Thunderstorms probable enough |
| CAPE > 2000 | Strong enough probable storms |
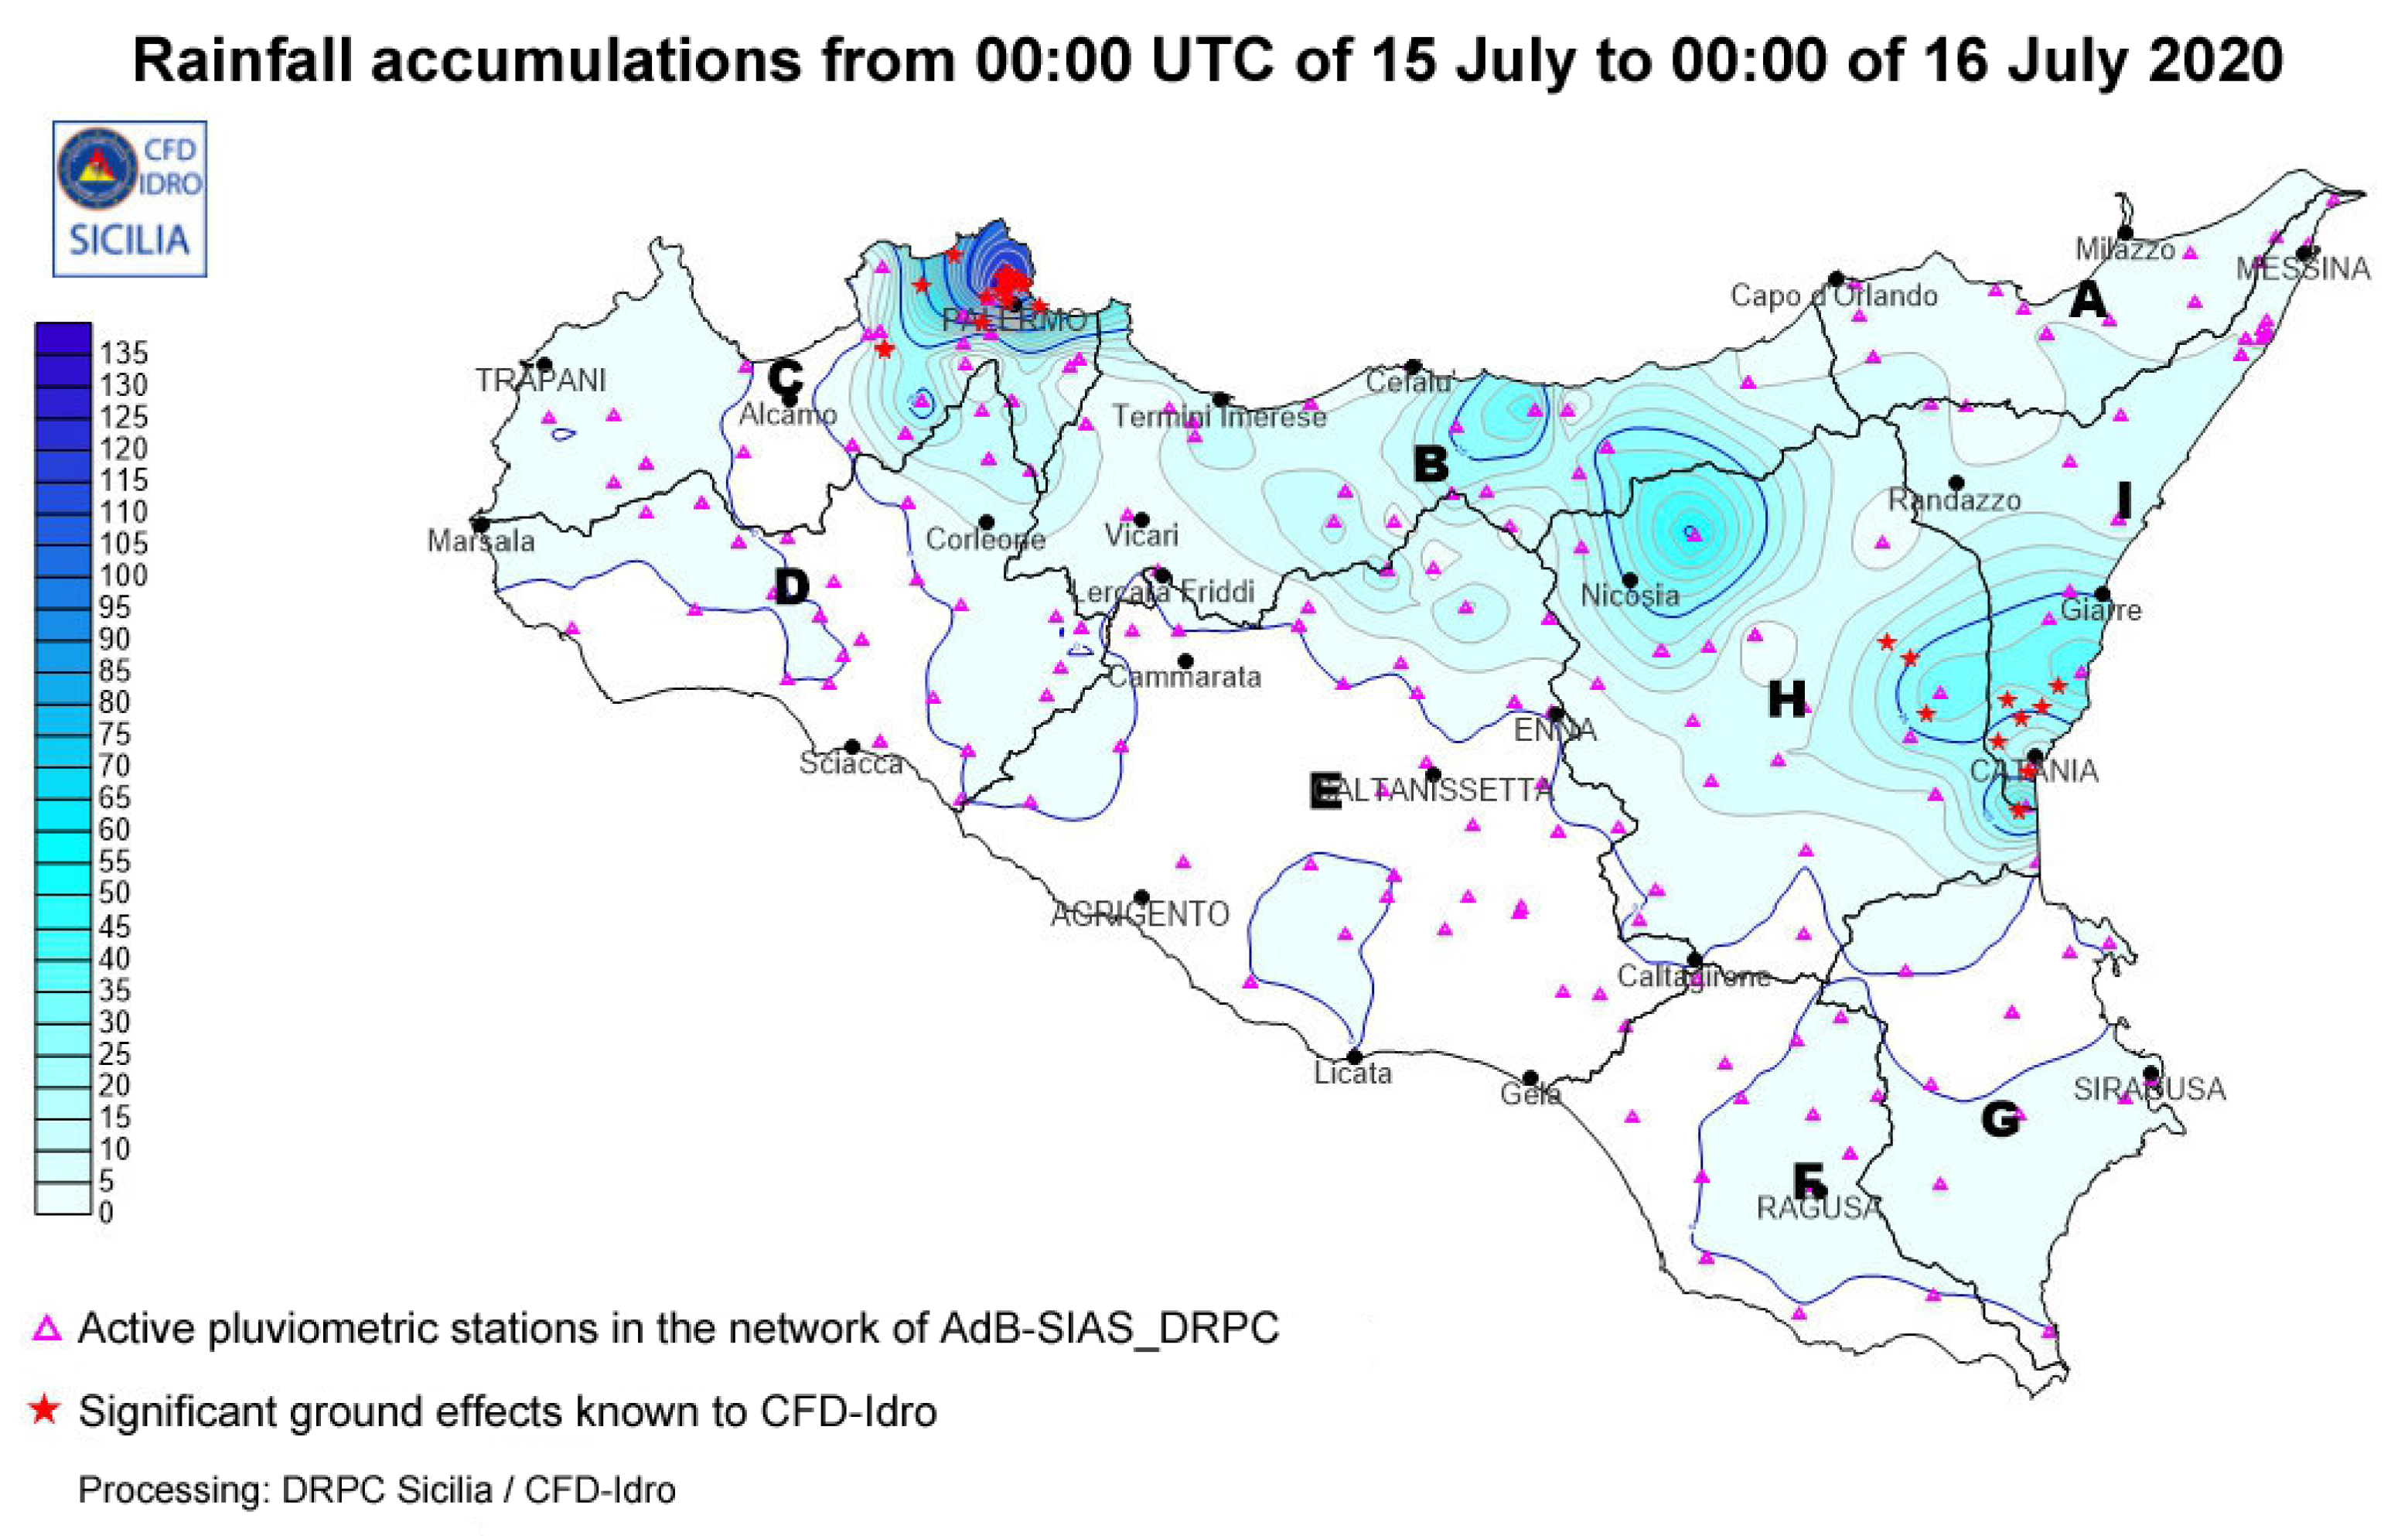
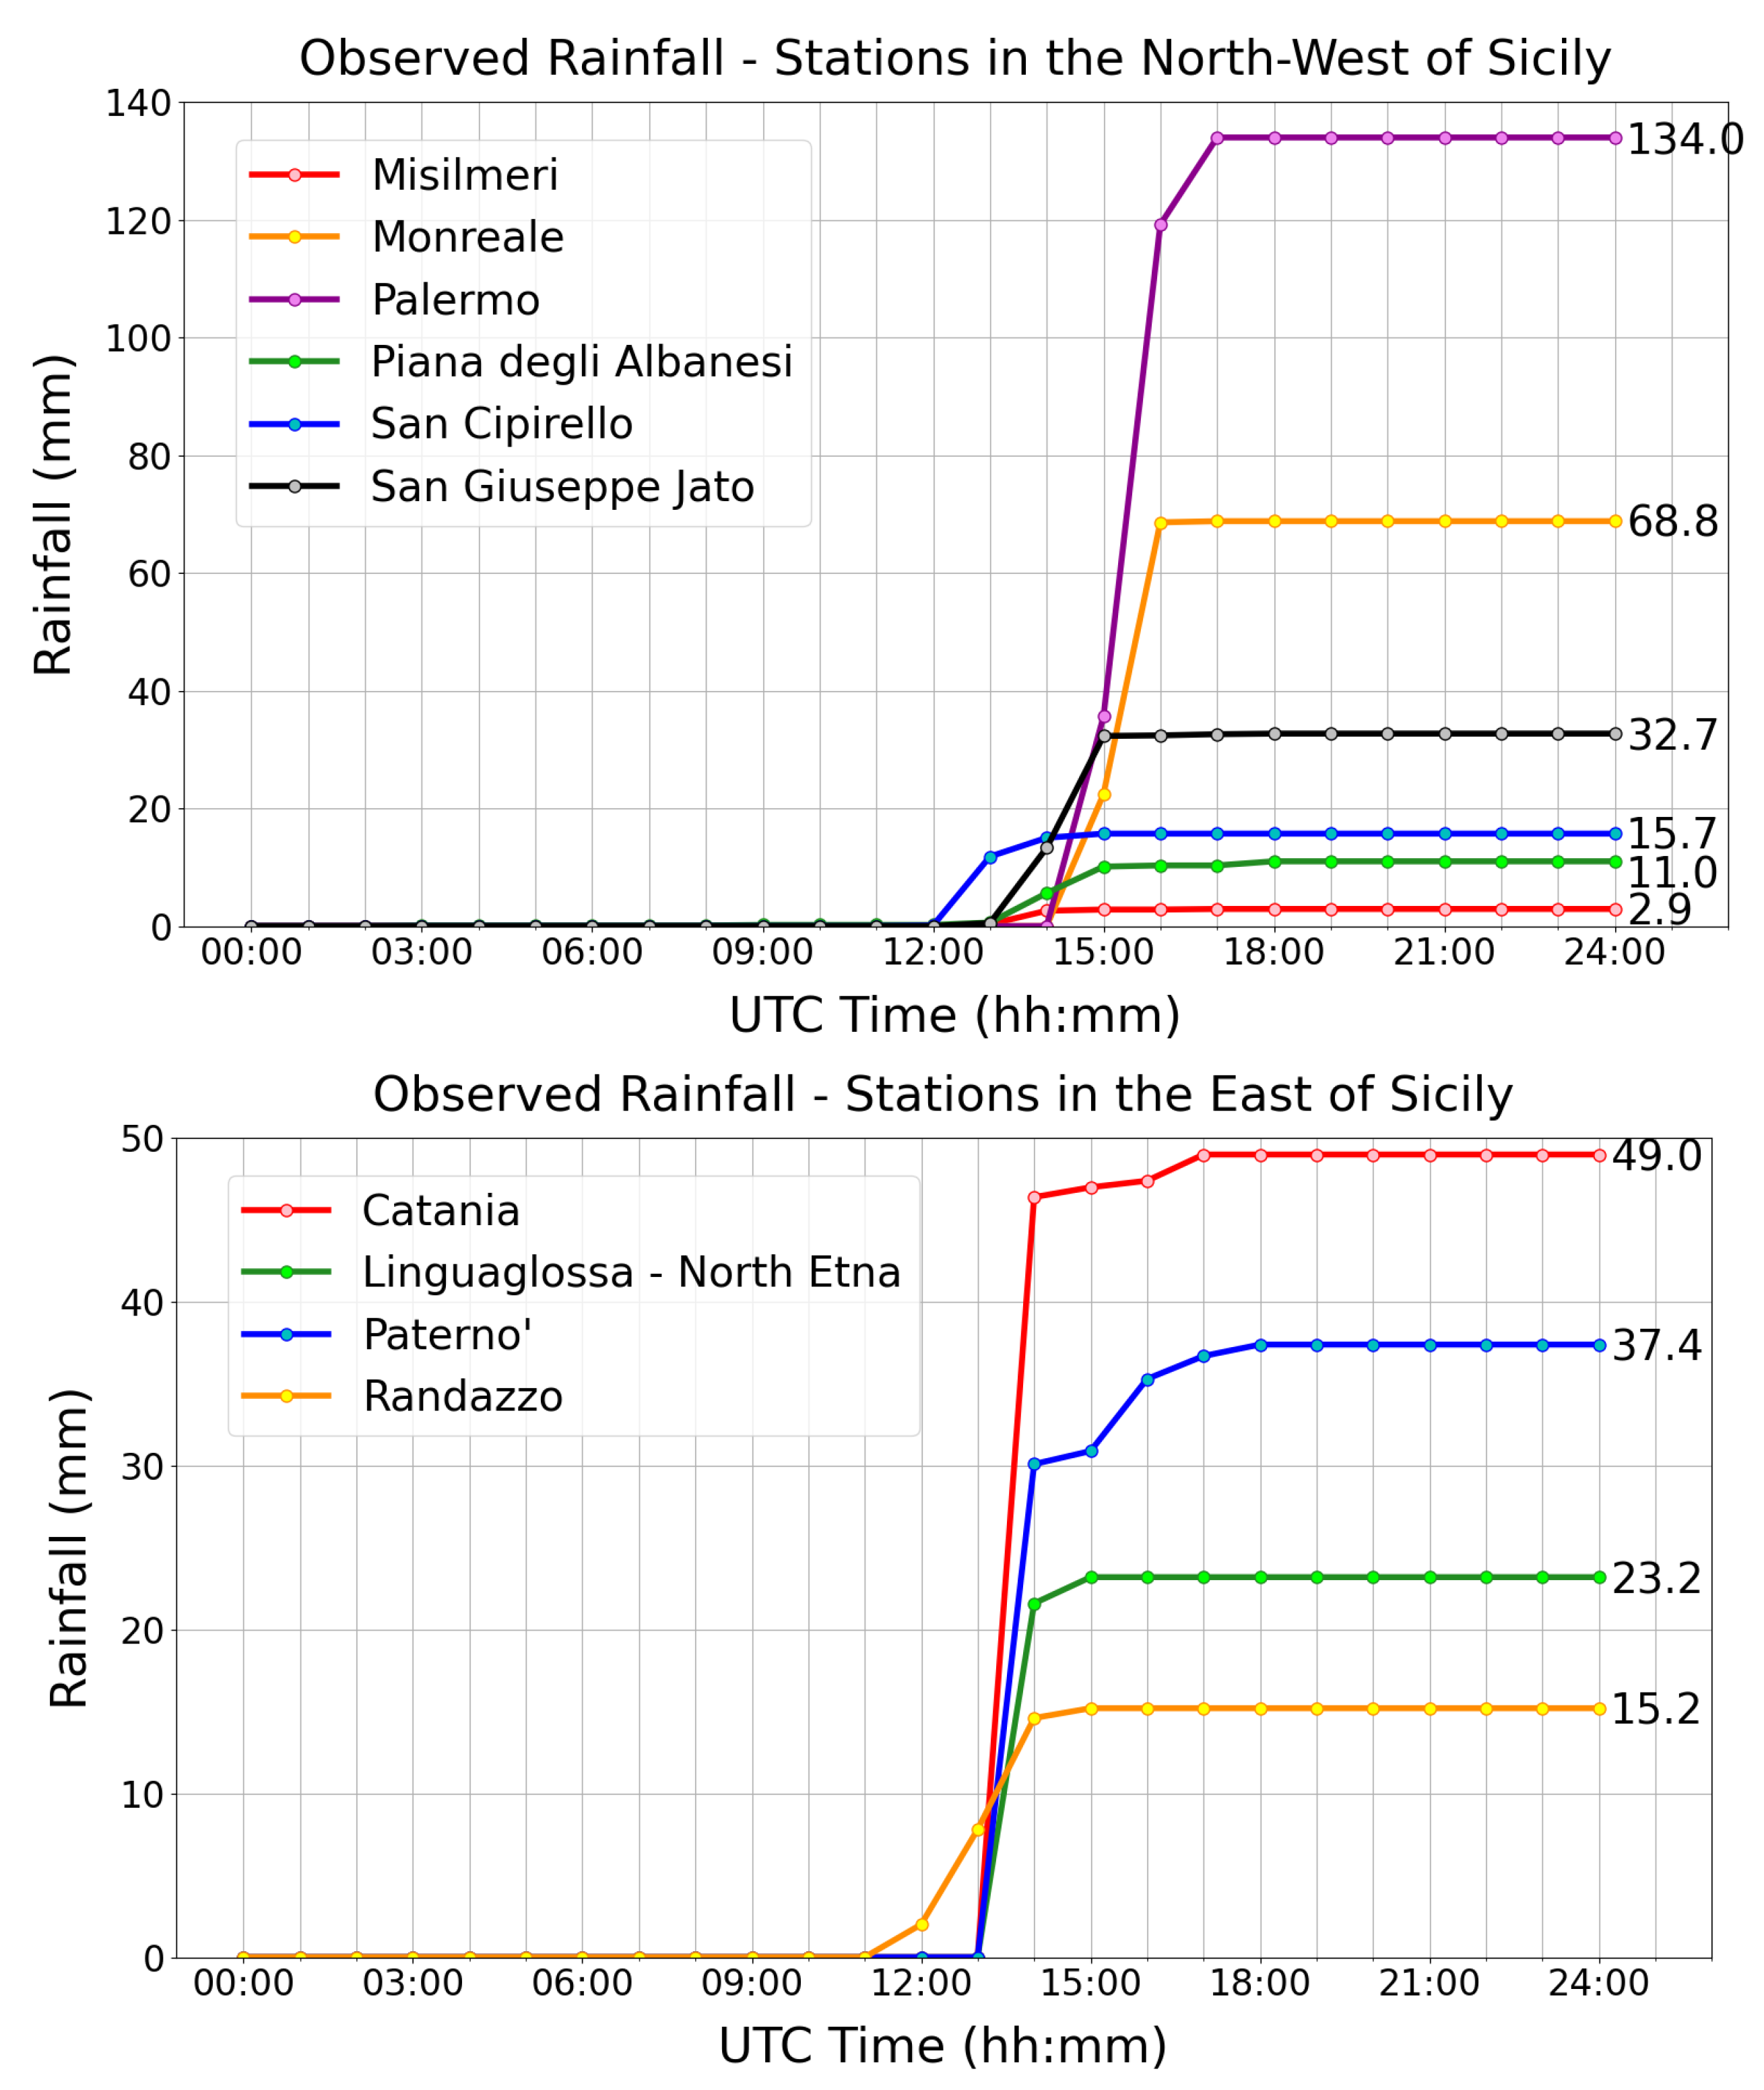
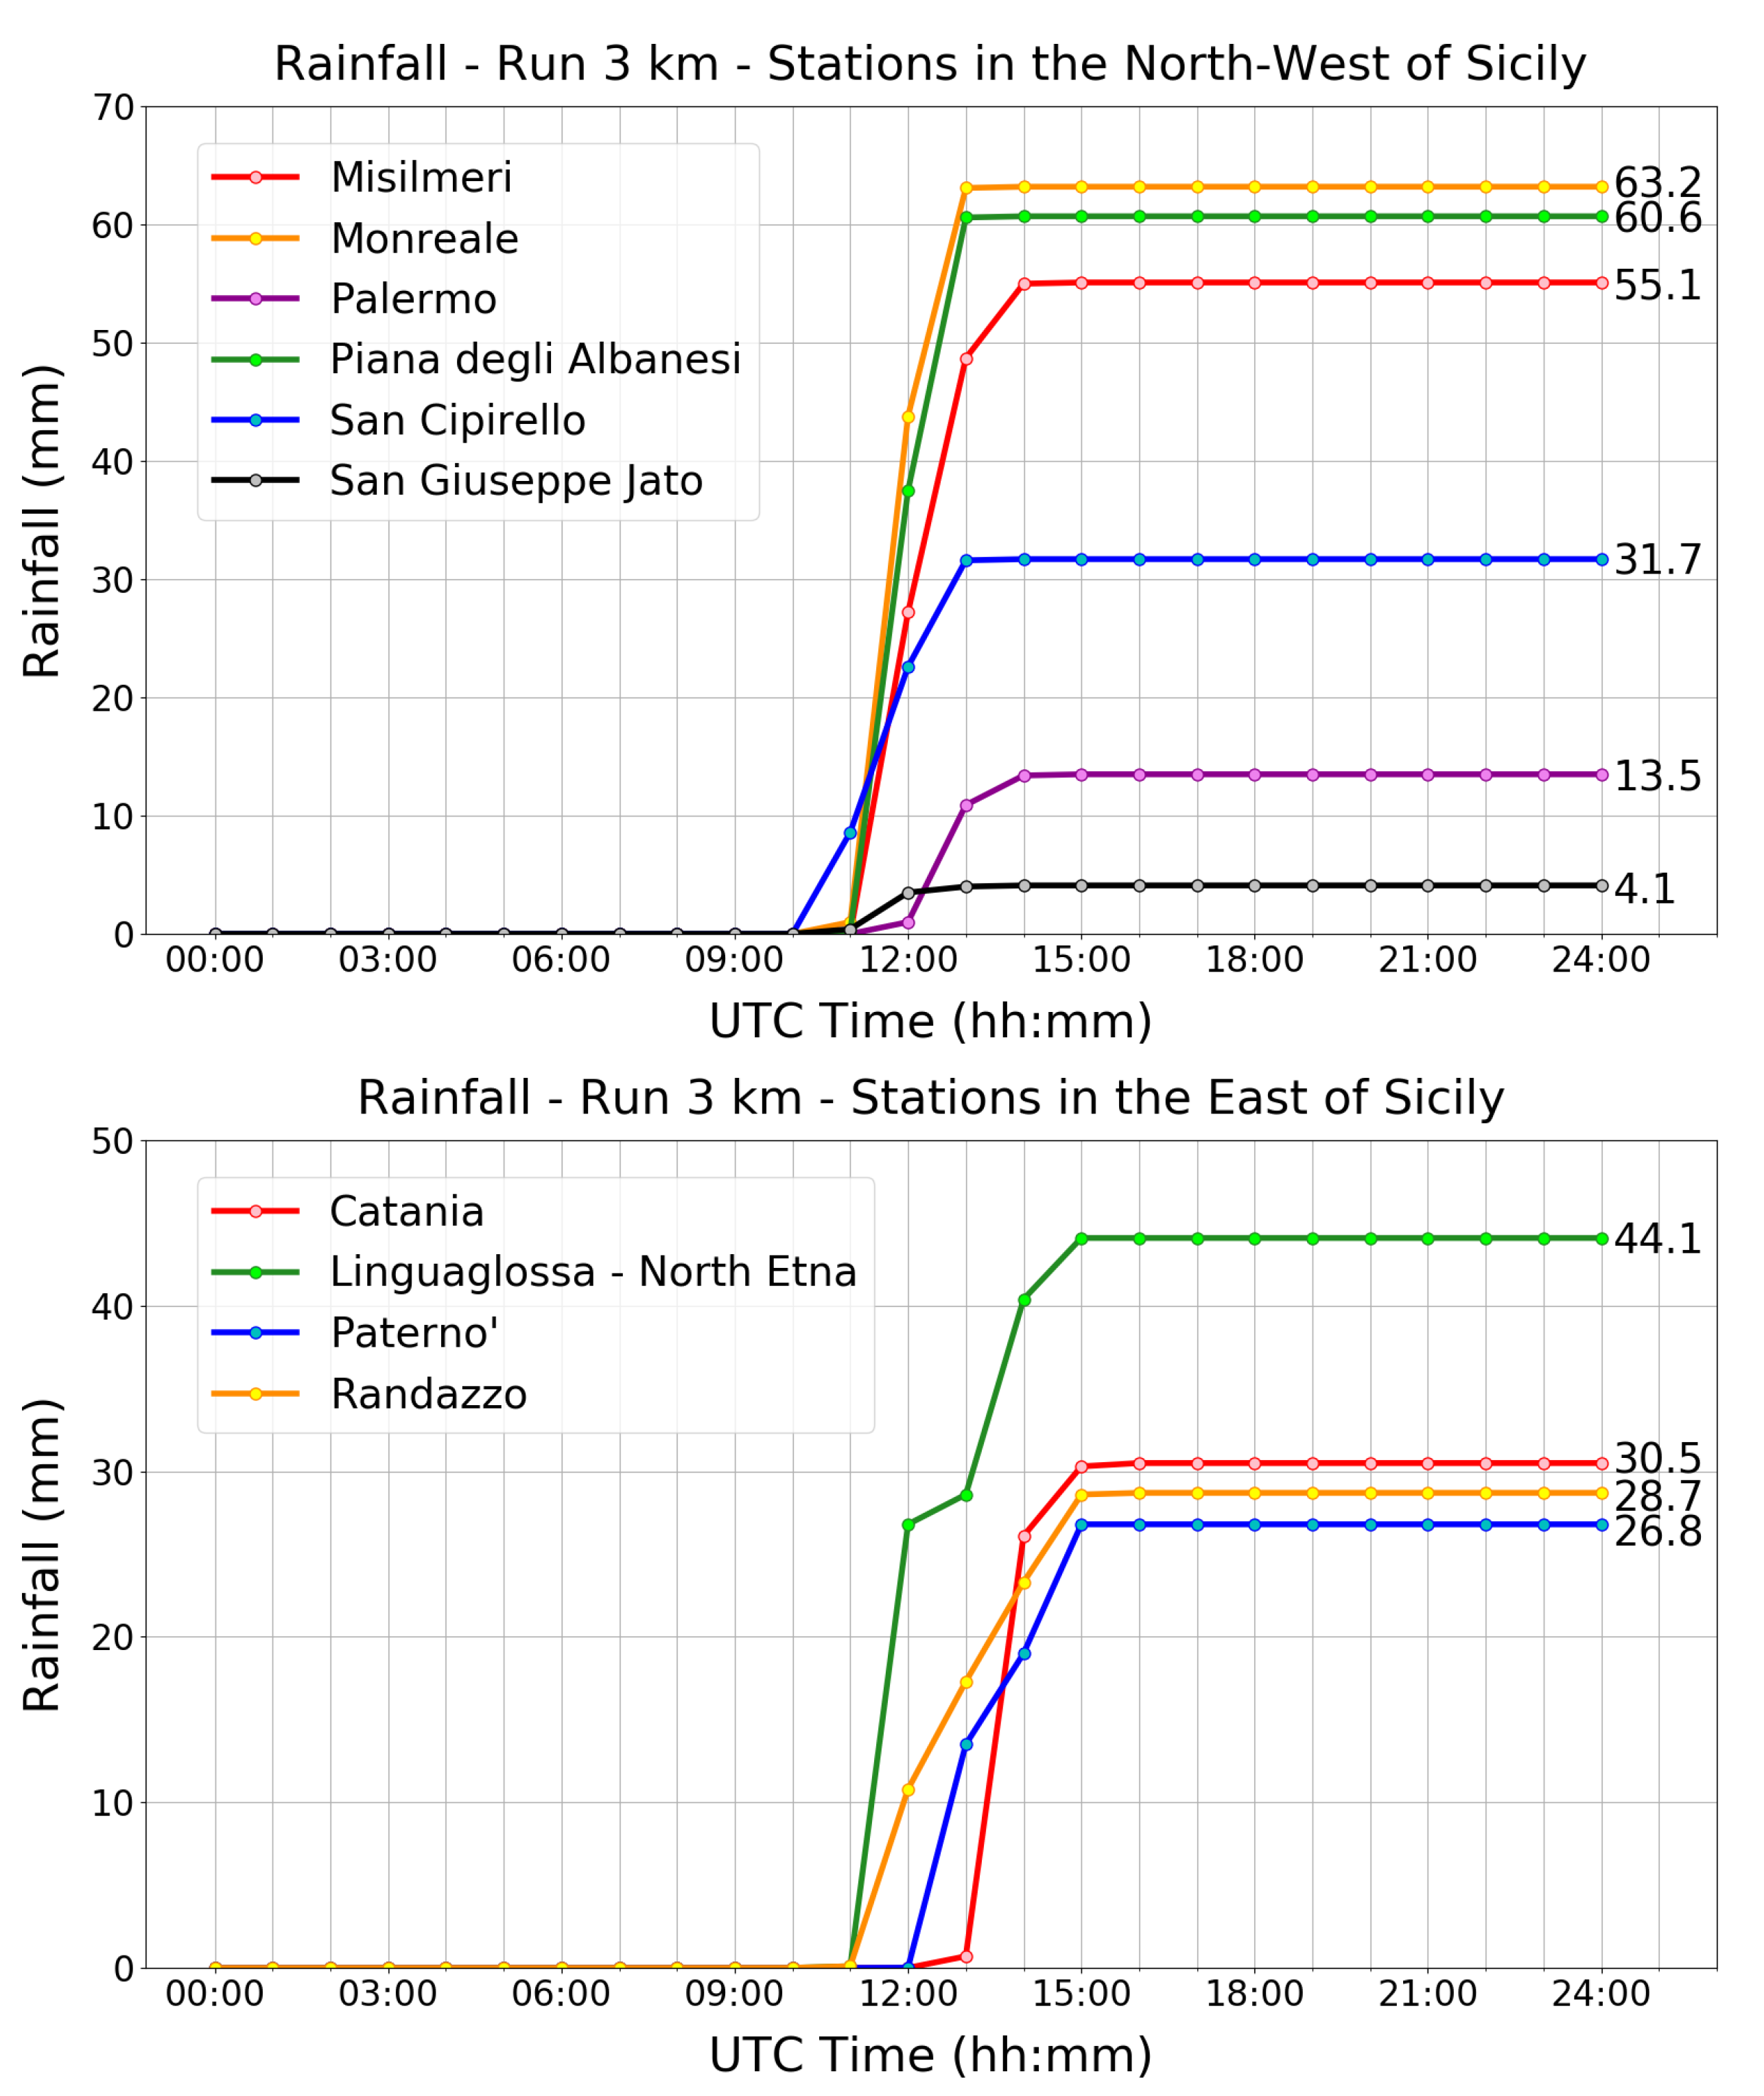
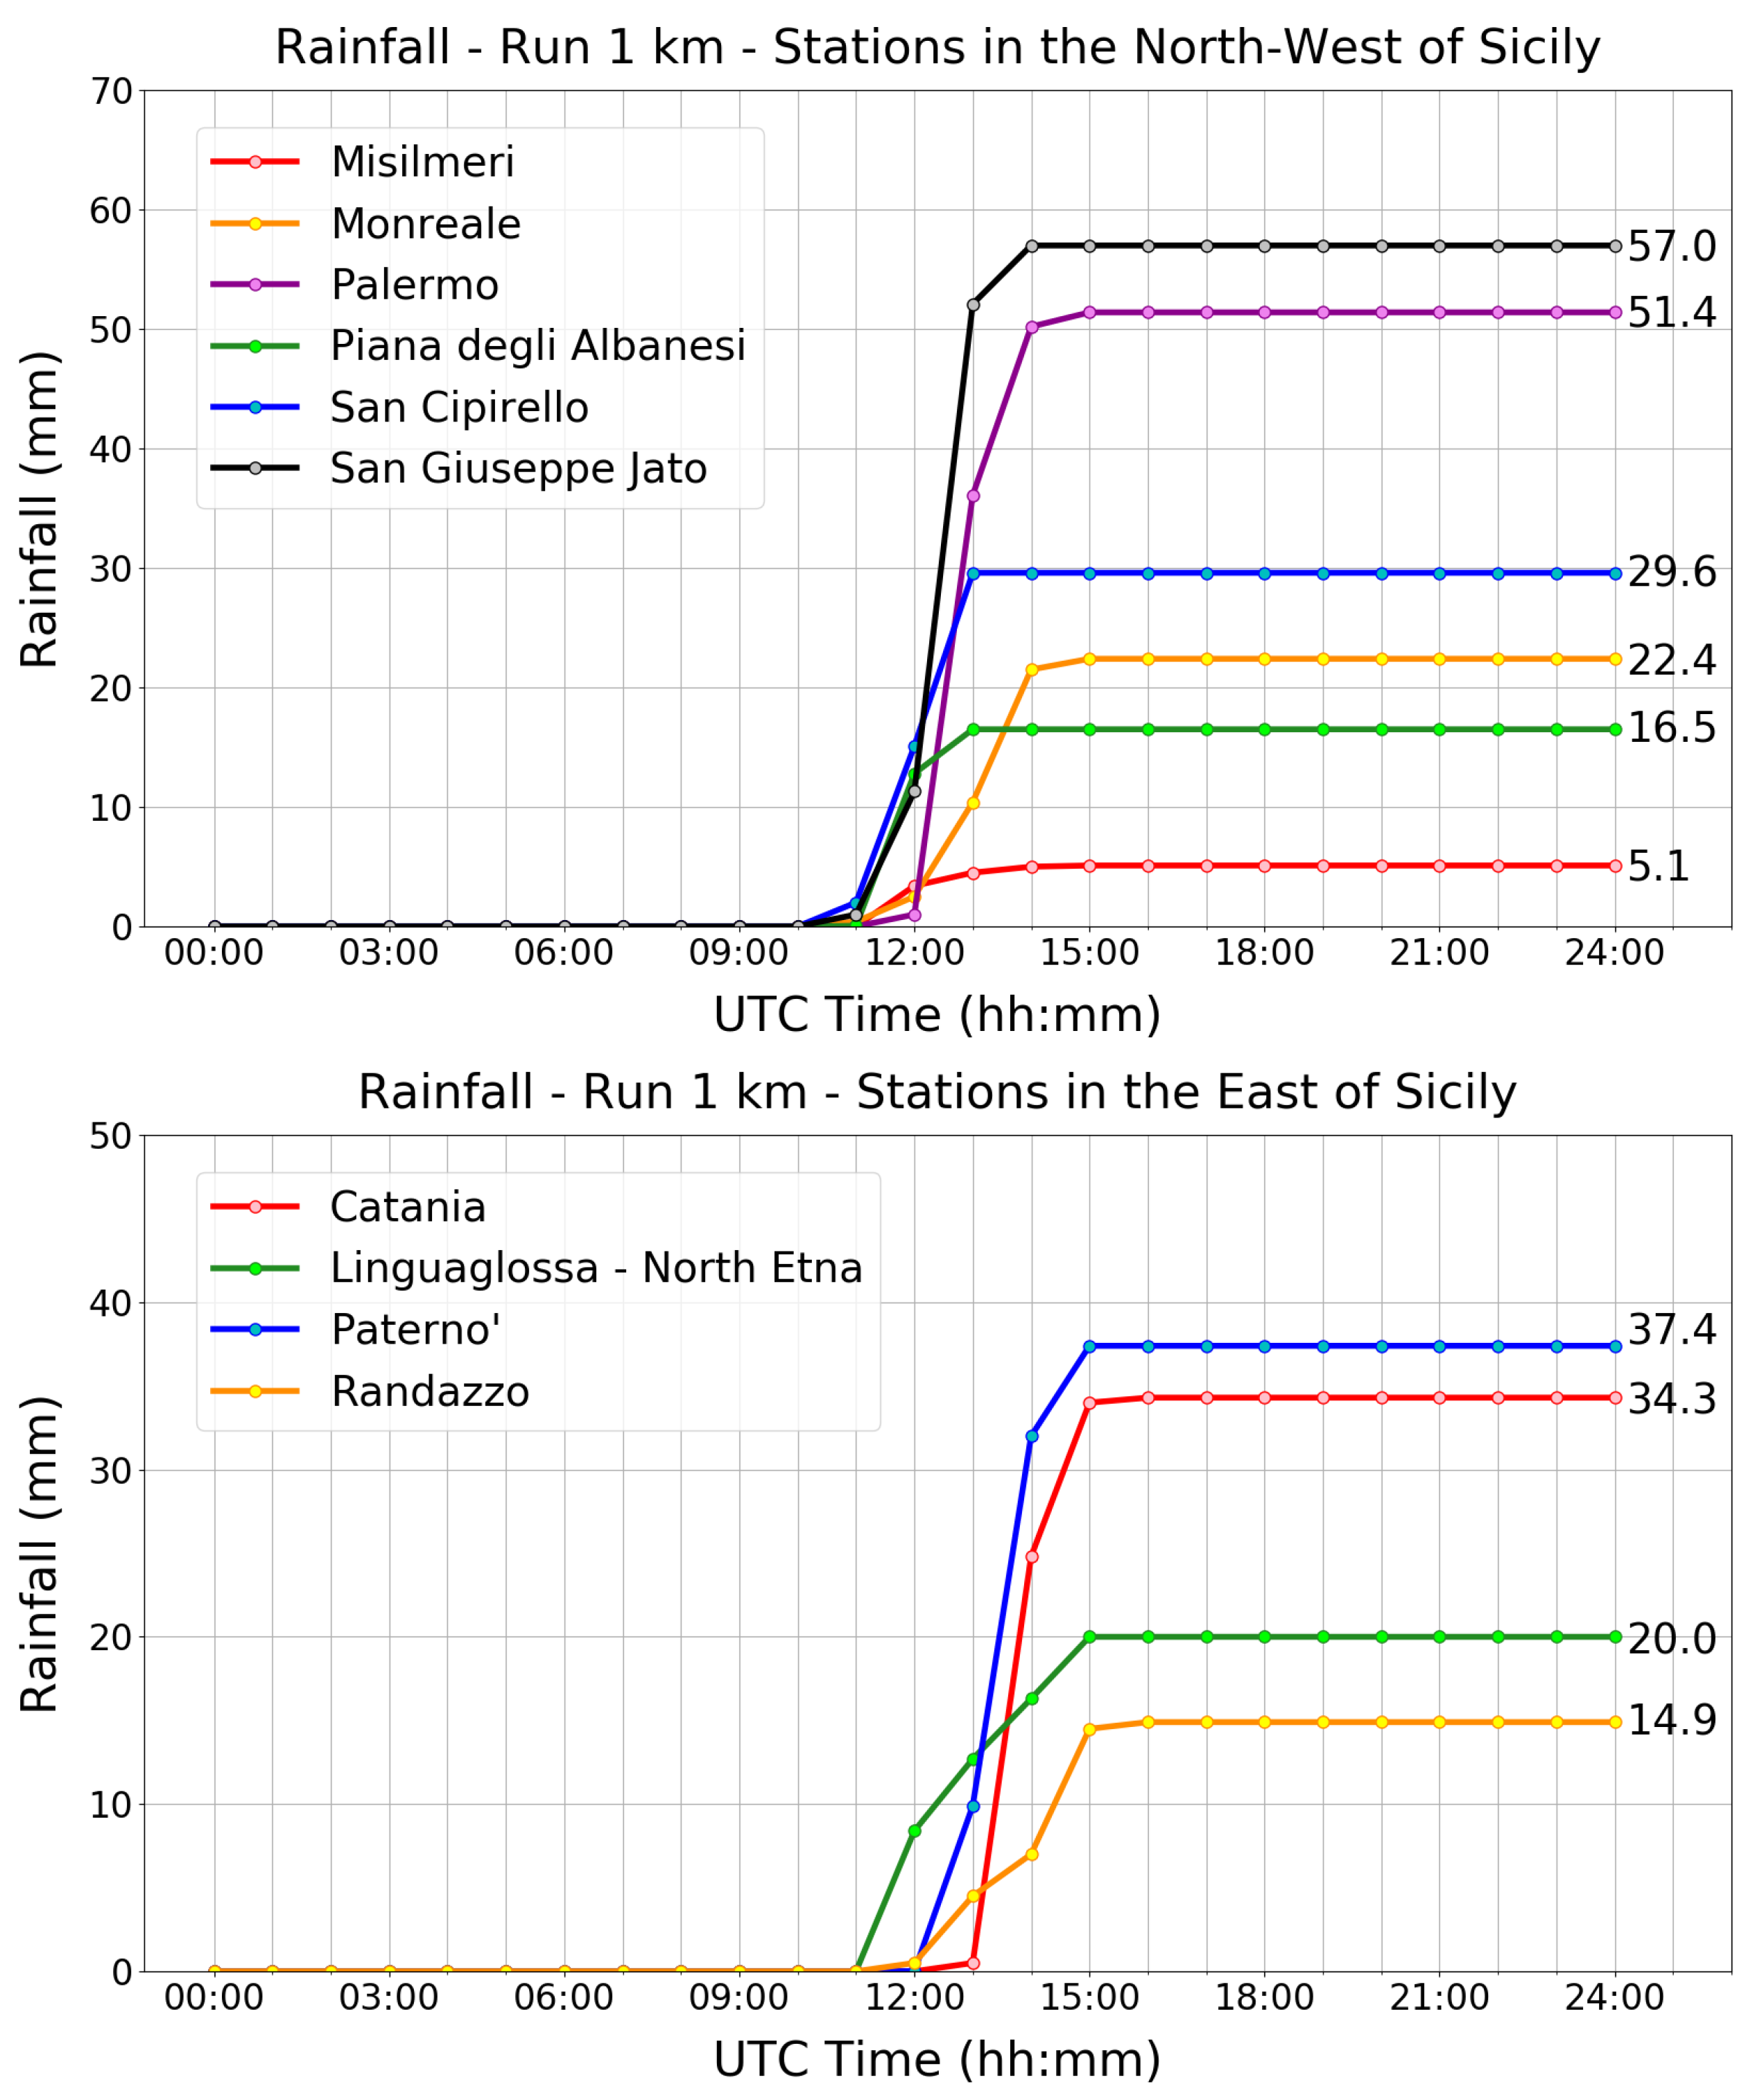
| East Stations | Observed | 3-km Domain | 1-km Domain |
| Paternò | 37 | 27 | 37 |
| Catania | 49 | 30 | 34 |
| Randazzo | 15 | 29 | 15 |
| Linguaglossa | 23 | 44 | 20 |
| North-West Stations | Observed | 3-km Domain | 1-km Domain |
| Misilmeri | 3 | 55 | 5 |
| Piana degli Albanesi | 11 | 61 | 16 |
| San Cipirello | 16 | 32 | 30 |
| Monreale | 69 | 63 | 22 |
| San Giuseppe Jato | 33 | 4 | 57 |
| Palermo | 134 | 13 | 51 |
| Calculated Parameters | Values |
|---|---|
| td500 | −11.521 |
| deltatheta | 3.041 |
| mixratio | 12.848 |
| pwat | 36.608 |
| CIN | −24.747 |
| brn | 69.613 |
| srh01 | 43.337 |
| srh03 | 64.509 |
| ship | 0.261 |
| WRF 1 km | GFS | ERA5 | |
|---|---|---|---|
| Moisture | |||
| Surface Td | 18 | 22 | 20 |
| 850 Td | 12 | 12 | 5 |
| PW | 40 | 35 | 28 |
| K index | 38 | 30 | 16 |
| Instability | |||
| CAPE | >1200 | 150 | 921 |
| LI | −5 | −7 | −3 |
| TT | 49 | 46 | 40 |
| Storm Motion [kt] | 13 | 18 | 19 |
| Thetae850 | 62 | 54 | 52 |
| ULJ [kt] | 35 | 60 | 46 |
Publisher’s Note: MDPI stays neutral with regard to jurisdictional claims in published maps and institutional affiliations. |
© 2022 by the authors. Licensee MDPI, Basel, Switzerland. This article is an open access article distributed under the terms and conditions of the Creative Commons Attribution (CC BY) license (https://creativecommons.org/licenses/by/4.0/).
Share and Cite
Castorina, G.; Caccamo, M.T.; Insinga, V.; Magazù, S.; Munaò, G.; Ortega, C.; Semprebello, A.; Rizza, U. Impact of the Different Grid Resolutions of the WRF Model for the Forecasting of the Flood Event of 15 July 2020 in Palermo (Italy). Atmosphere 2022, 13, 1717. https://doi.org/10.3390/atmos13101717
Castorina G, Caccamo MT, Insinga V, Magazù S, Munaò G, Ortega C, Semprebello A, Rizza U. Impact of the Different Grid Resolutions of the WRF Model for the Forecasting of the Flood Event of 15 July 2020 in Palermo (Italy). Atmosphere. 2022; 13(10):1717. https://doi.org/10.3390/atmos13101717
Chicago/Turabian StyleCastorina, Giuseppe, Maria Teresa Caccamo, Vincenzo Insinga, Salvatore Magazù, Gianmarco Munaò, Claudio Ortega, Agostino Semprebello, and Umberto Rizza. 2022. "Impact of the Different Grid Resolutions of the WRF Model for the Forecasting of the Flood Event of 15 July 2020 in Palermo (Italy)" Atmosphere 13, no. 10: 1717. https://doi.org/10.3390/atmos13101717