Article

Assessment of Bacterial Aerosols in a Herbal Processing Plant

Department of Microbiology and Biomonitoring, Faculty of Agriculture and Economics, University of Agriculture in Krakow, 31-120 Krakow, Poland
*
Author to whom correspondence should be addressed.
Atmosphere 2023, 14(1), 123; https://doi.org/10.3390/atmos14010123
Submission received: 17 December 2022 / Revised: 2 January 2023 / Accepted: 4 January 2023 / Published: 5 January 2023
(This article belongs to the Special Issue Biological and Toxicological Effects of Bioaerosols)

Abstract

:
The aim of this study was to assess bacterial aerosols in a herbal processing plant in Poland. Bioaerosol measurements of indoor and outdoor air of the herbal processing plant were performed in four measurement rounds, in a seasonal cycle—in spring, summer, autumn, and winter—using a six-stage Andersen’s cascade air sampler. At each measuring point, during the bioaerosol sampling, the values of relative humidity and air temperature were simultaneously measured using the Kestrel 4000 device, and the concentration of particulate matter (fractions 1.0 μm, 2.5 μm, 4.0 µm, and 10.0 µm) using a DustTrak II dust analyzer. The results showed that the production process affects the bacterial aerosol concentrations in the tested plant. There were statistically significant differences in the concentrations of bacterial aerosol between indoor and outdoor air, and between production rooms, taking into account the seasons of the year. The concentrations of bacterial aerosol in the production rooms did not exceed 7.6 ×·103 cfu·m−3 and were lower than the permissible concentration values proposed for production rooms contaminated with organic dust. The calculations showed a significant correlation between the concentration of bacterial aerosol and air temperature. Qualitative analysis of microorganisms isolated from the air of production rooms showed the dominance of Gram-positive cocci of the genus Micrococcus and spore-forming rods of the Bacillus genus. The study confirmed that herbal processing plants may be related to exposure to microbiological agents.

1. Introduction

Nowadays, raw plant materials are increasingly used in many industries, primarily in food processing, cosmetology, and medicine. Care for health and safety at work means that, in recent years, more and more attention has been paid to the fact that employees of plants processing raw materials of plant origin may be exposed to many harmful factors (chemical and biological pollution, mechanical vibrations, noise, electromagnetic fields, lighting, static electricity, and changing microclimate). Because the production rooms of plants processing raw plant materials are a specific environment, concerns expressed by employees are increasingly related to the health effects associated with exposure to biological aerosols.
“Biological aerosol” means a collection of biological particles dispersed in air or another gas phase. Bioaerosol particles can be single spores of microorganisms, pollen, bacterial vegetative cells, viruses, aggregates composed of several spores of microorganisms or bacterial vegetative cells, aggregates formed by several spores of microorganisms or bacterial vegetative cells with other biological material, products of microbial origin, fragments of bacterial cells or fungal spores, and multigrain structures composed of non-biological particles transporting material of biological origin [1,2]. Some of the microorganisms in bioaerosols may be pathogenic, allergic, or toxic. Their presence in the environment can lead to adverse health effects (for example, simple irritation, allergic reactions, the occurrence of infections, or toxic reactions) [3].
Microbiological contamination of indoor air can be associated with microbial emissions in the room or may come from the external environment. Bioaerosol concentrations usually increase when rooms are occupied [4]. In industry, additional sources of biological aerosol are production and processing [5,6]. It is very difficult to characterize the employee’s risk from exposure to bioaerosols connected with work activities [3,7]. The exposure to harmful biological agents may be variable because of the indoor building construction and equipment, ventilation system or air movement, occupant density and activity, and cleaning procedures [6,8]. Microbiological air pollution in plants processing raw plant materials mainly depends on employees’ activities, the operations of using devices, technological processes, the type and microbiological purity of processed materials of plant origin, and hygienic or sanitary rooms’ conditions [9,10,11,12]. In this situation, it is necessary to determine the degree of microbiological pollution of the work environment in this type of plant and the potential health effects resulting from the inhalation of microbial particles.
Due to the fact that the microbiological quality of air is a very important factor in the workplace, the aim of the study was to assess bacterial aerosols in a herbal processing plant in Poland.

2. Materials and Methods

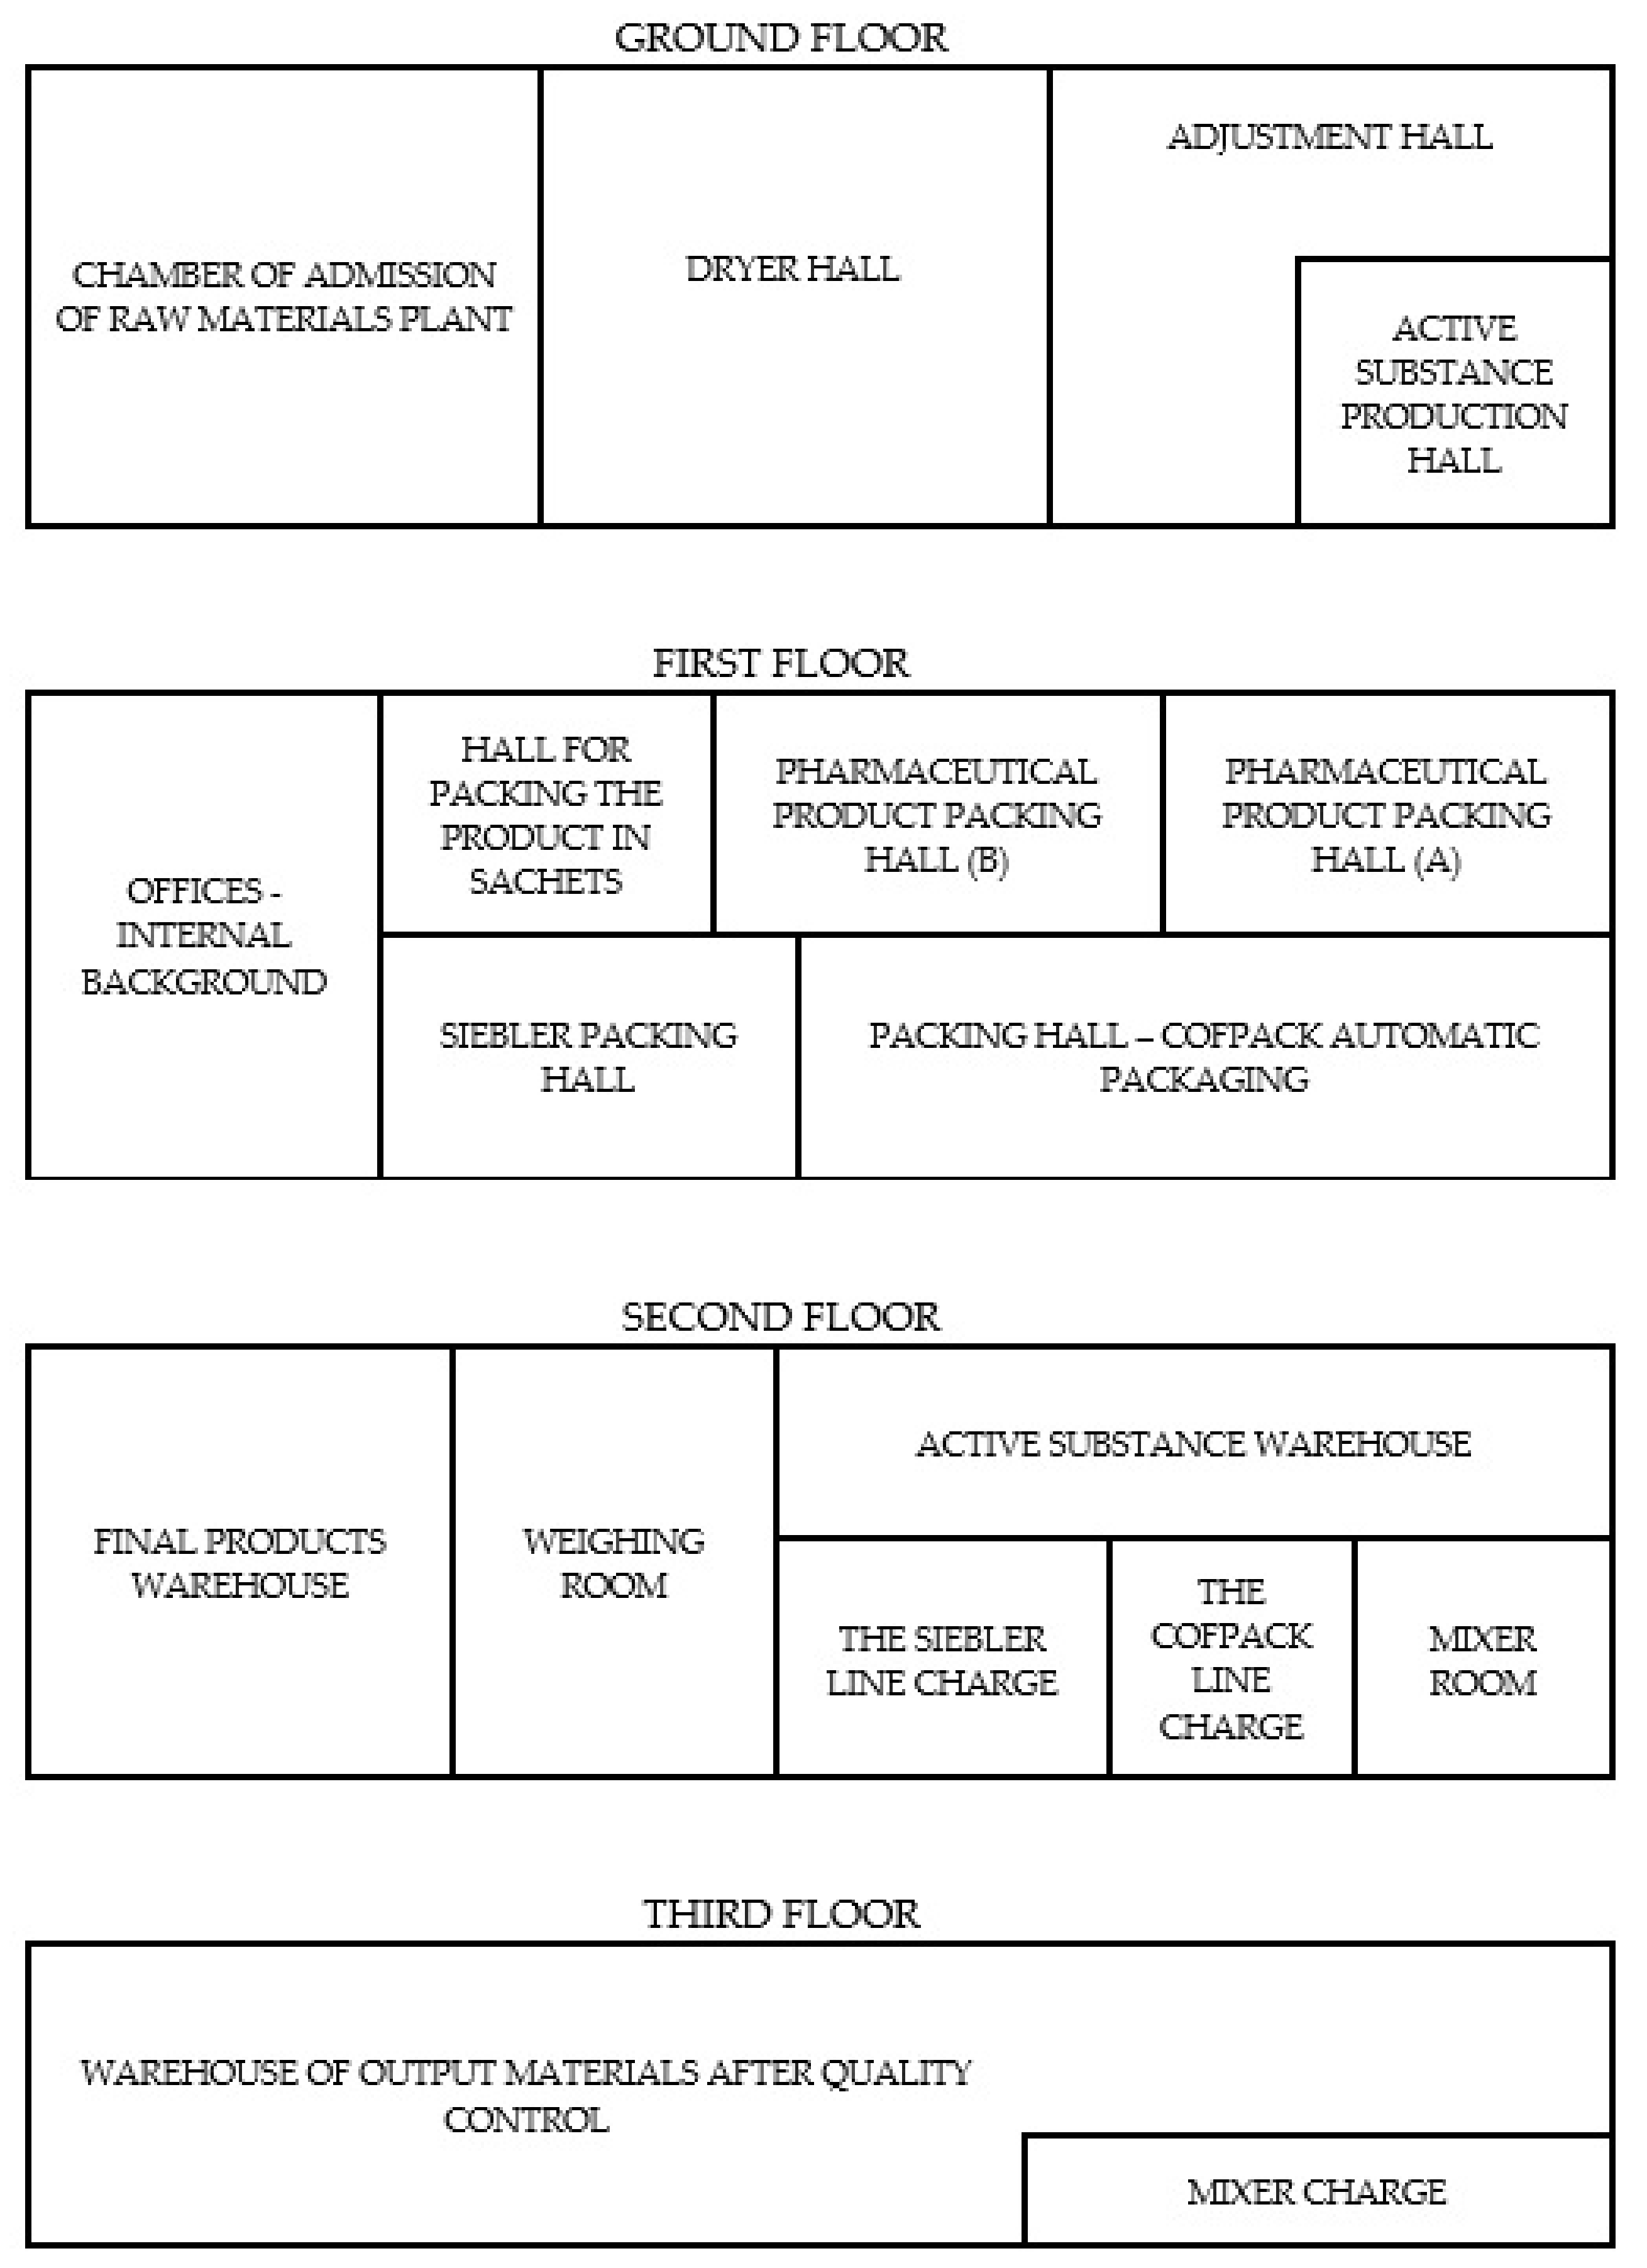
2.1. Characteristics of a Plant Processing Raw Plant Materials

The study was carried out on the premises of a herbal processing plant in Poland. The selected herbal processing plant produces food and medicinal products based on herbs. Production is based on the Good Manufacturing Practice (GMP) and Good Hygienic Practice (GHP) systems as well as current legal regulations and international standards (ISO 9001, ISO 22000, ISO 22176) for medicinal products, food products, and cosmetics [13,14,15]. The study object was a 3-storey production building. In the plant, 17 measuring points were selected, located along the plant’s technological line, starting from the admission chamber for raw plant materials and ending with the final product warehouse. Bioaerosol samples were also collected at a point designated outside the plant for the determination of the “external background” and inside the plant, in a room separate from the production rooms for the determination of the “internal background” (a total of 19 measuring points). The following codes were assigned to the measuring points: 1—hall for packing the product in sachets; 2—external background; 3—mixer charge; 4—active substance warehouse; 5—pharmaceutical product packing hall (A); 6—adjustment hall; 7—dryer hall; 8—Siebler packing hall; 9—pharmaceutical product packing hall (B); 10—packing hall—Cofpack automatic packaging; 11—offices—internal background; 12—chamber of admission of raw materials plant; 13—active substance production hall; 14—warehouse of output materials after quality control; 15—final products warehouse; 16—mixer room; 17—the Cofpack line charge; 18—the Siebler line charge; 19—weighing room. A detailed scheme of a herbal plant is presented in Figure 1.
The conducted research included bioaerosol sampling for quantitative and qualitative analysis, measurements of the concentration of particulate matter to assess its impact on microbiological air pollution, and measurements of relative humidity and air temperature to determine the impact of these parameters on the contamination with harmful microbiological factors in the production rooms, halls, and warehouses.

2.2. Bioaerosol Sampling

Bioaerosol measurements were carried out in four measurement rounds, in a seasonal cycle—in spring, summer, autumn, and winter—twice each season. Bioaerosol samples at each of the measuring points were collected during the day and during plant operating hours with the normal routine production process. Measuring points were determined taking into account all production rooms, technological line, raw material warehouses, and final product warehouses.
The air samples were collected by using a six-stage Andersen’s cascade sampler (model 10-710, Graseby-Andersen, Inc., Atlanta, GA, USA). The sampler was placed at a height of 1.5 m above the floor or ground (outdoor measurements) to simulate the aspiration from the human breathing zone. A 5 min sampling period and a flow rate of 28.3 dm3ꞏmin−1 were applied for the collection of air samples. Before each measurement, the impactor was cleaned and disinfected (with isopropyl alcohol and a stream of hot air). Bacteria were collected on tryptic soy agar with a 5% addition of defibrinated sheep blood (TSA LAB-AGARTM + 5% SB, Biomaxima, Lublin, Poland) [16]. Before each air sampling, the sterility of the prepared microbiological media was controlled—TSA medium was incubated in incubators at 37 °C. The Petri plates with microbiological media were transported in a heat-insulating transport container that kept the temperature constant (4 °C) and prevented their possible physical damage.
After air sampling, Petri plates were incubated in laboratory incubators with natural air circulation (CLN53 model, Pol-Eko, Wodzisław Śląski, Poland). The conditions of incubation of air samples for bacteria were as follows: 1 day (37 °C) + 3 days (22 °C) + 3 days (4 °C). Prolonged incubation of bacterial cultures allowed the growth of strains that grew slowly in the lower temperature range [17]. After incubation, the bacterial colonies were counted. The concentration of bioaerosol was calculated as the number of colony-forming units per cubic meter of air (cfu·m−3). The number of colonies grown on a microbiological media was verified by using the conversion table (developed by the impactor manufacturer), which allowed us to convert of the empirical results into the actual number of microorganisms in the air.

2.3. Identification of Isolated Strains

The analysis of the bacterial aerosol was based on the macro- and microscopic observation, as well as the physiological and biochemical characteristics of the isolated strains. The macroscopic analysis included the determination of the morphological characteristics of the colonies (size, shape, elevation or profile, transparency, fluorescence, the color of the colony, its structure, and its smell), and the growth characteristics of the strains isolated on blood agar. The microscopic characterization was based on the morphological evaluation of the Gram-stained preparations. Staining was performed after 24 h incubation of the pure strain isolated on blood agar. The microscopic analysis provided data about the size of the cells, their shape, and their arrangement with each other.
All bacterial strains isolated from the air were identified using the MALDI-TOF MS technique (Bruker Daltonik, Germany). Automatic spectral measurement and its comparative analysis with microbial standard spectra were performed by the ultraflextreme mass spectrometer in conjunction with the MALDI-Biotyper 3.0 software (Bruker Daltonik) containing 3672 microbial profiles in the database. Based on this program, the spectral protein profile of the selected microorganisms was also determined. The probability of correct identification was expressed in the form of a score index: 2.300–3.000 reliable identification of the microorganism to the species level; 2.000–2.299 reliable identification of the microorganism to genus level and probable result to species level; 1.700–1.999 the probable result of identification to the genus level; 0–1.699 unreliable identification result.

2.4. Monitoring of Particulate Matter and Microclimatic Parameters

At each measuring point, during the bioaerosol sampling, the relative humidity and air temperature were simultaneously measured using the Kestrel 4000 device (Nielsen-Kellerman, USA), and the concentration of particulate matter (fraction 1.0 μm, 2.5 μm, 4.0 µm, and 10.0 µm) was measured using a DustTrak II dust analyzer (model 8530, TSI Inc., Shoreview, MN, USA).

2.5. Statistical Analysis

Statistical analysis of the data was performed using the computer program Statistica data analysis software system, version 13.1–2018 (StatSoft, Inc., Tulsa, OK, USA). After taking into account the fulfillment of the assumptions about the normality of the distribution of variables (Shapiro–Wilk’s test) and the homogeneity of variance (Levene’s test), the analysis of variance (ANOVA) was performed, and the significance of differences between the means was verified with Tukey’s test and Scheffe’s test. The values for which the probability of “p” was lower than 0.05 were considered statistically significant. The impact of microclimatic parameters (air temperature and relative humidity) and particulate matter on the quantitative presence of microorganisms in the air was assessed using Pearson’s correlation coefficient, assuming statistically significant values at p < 0.05.

3. Results

3.1. Quantitative Analysis of Bacterial Aerosol

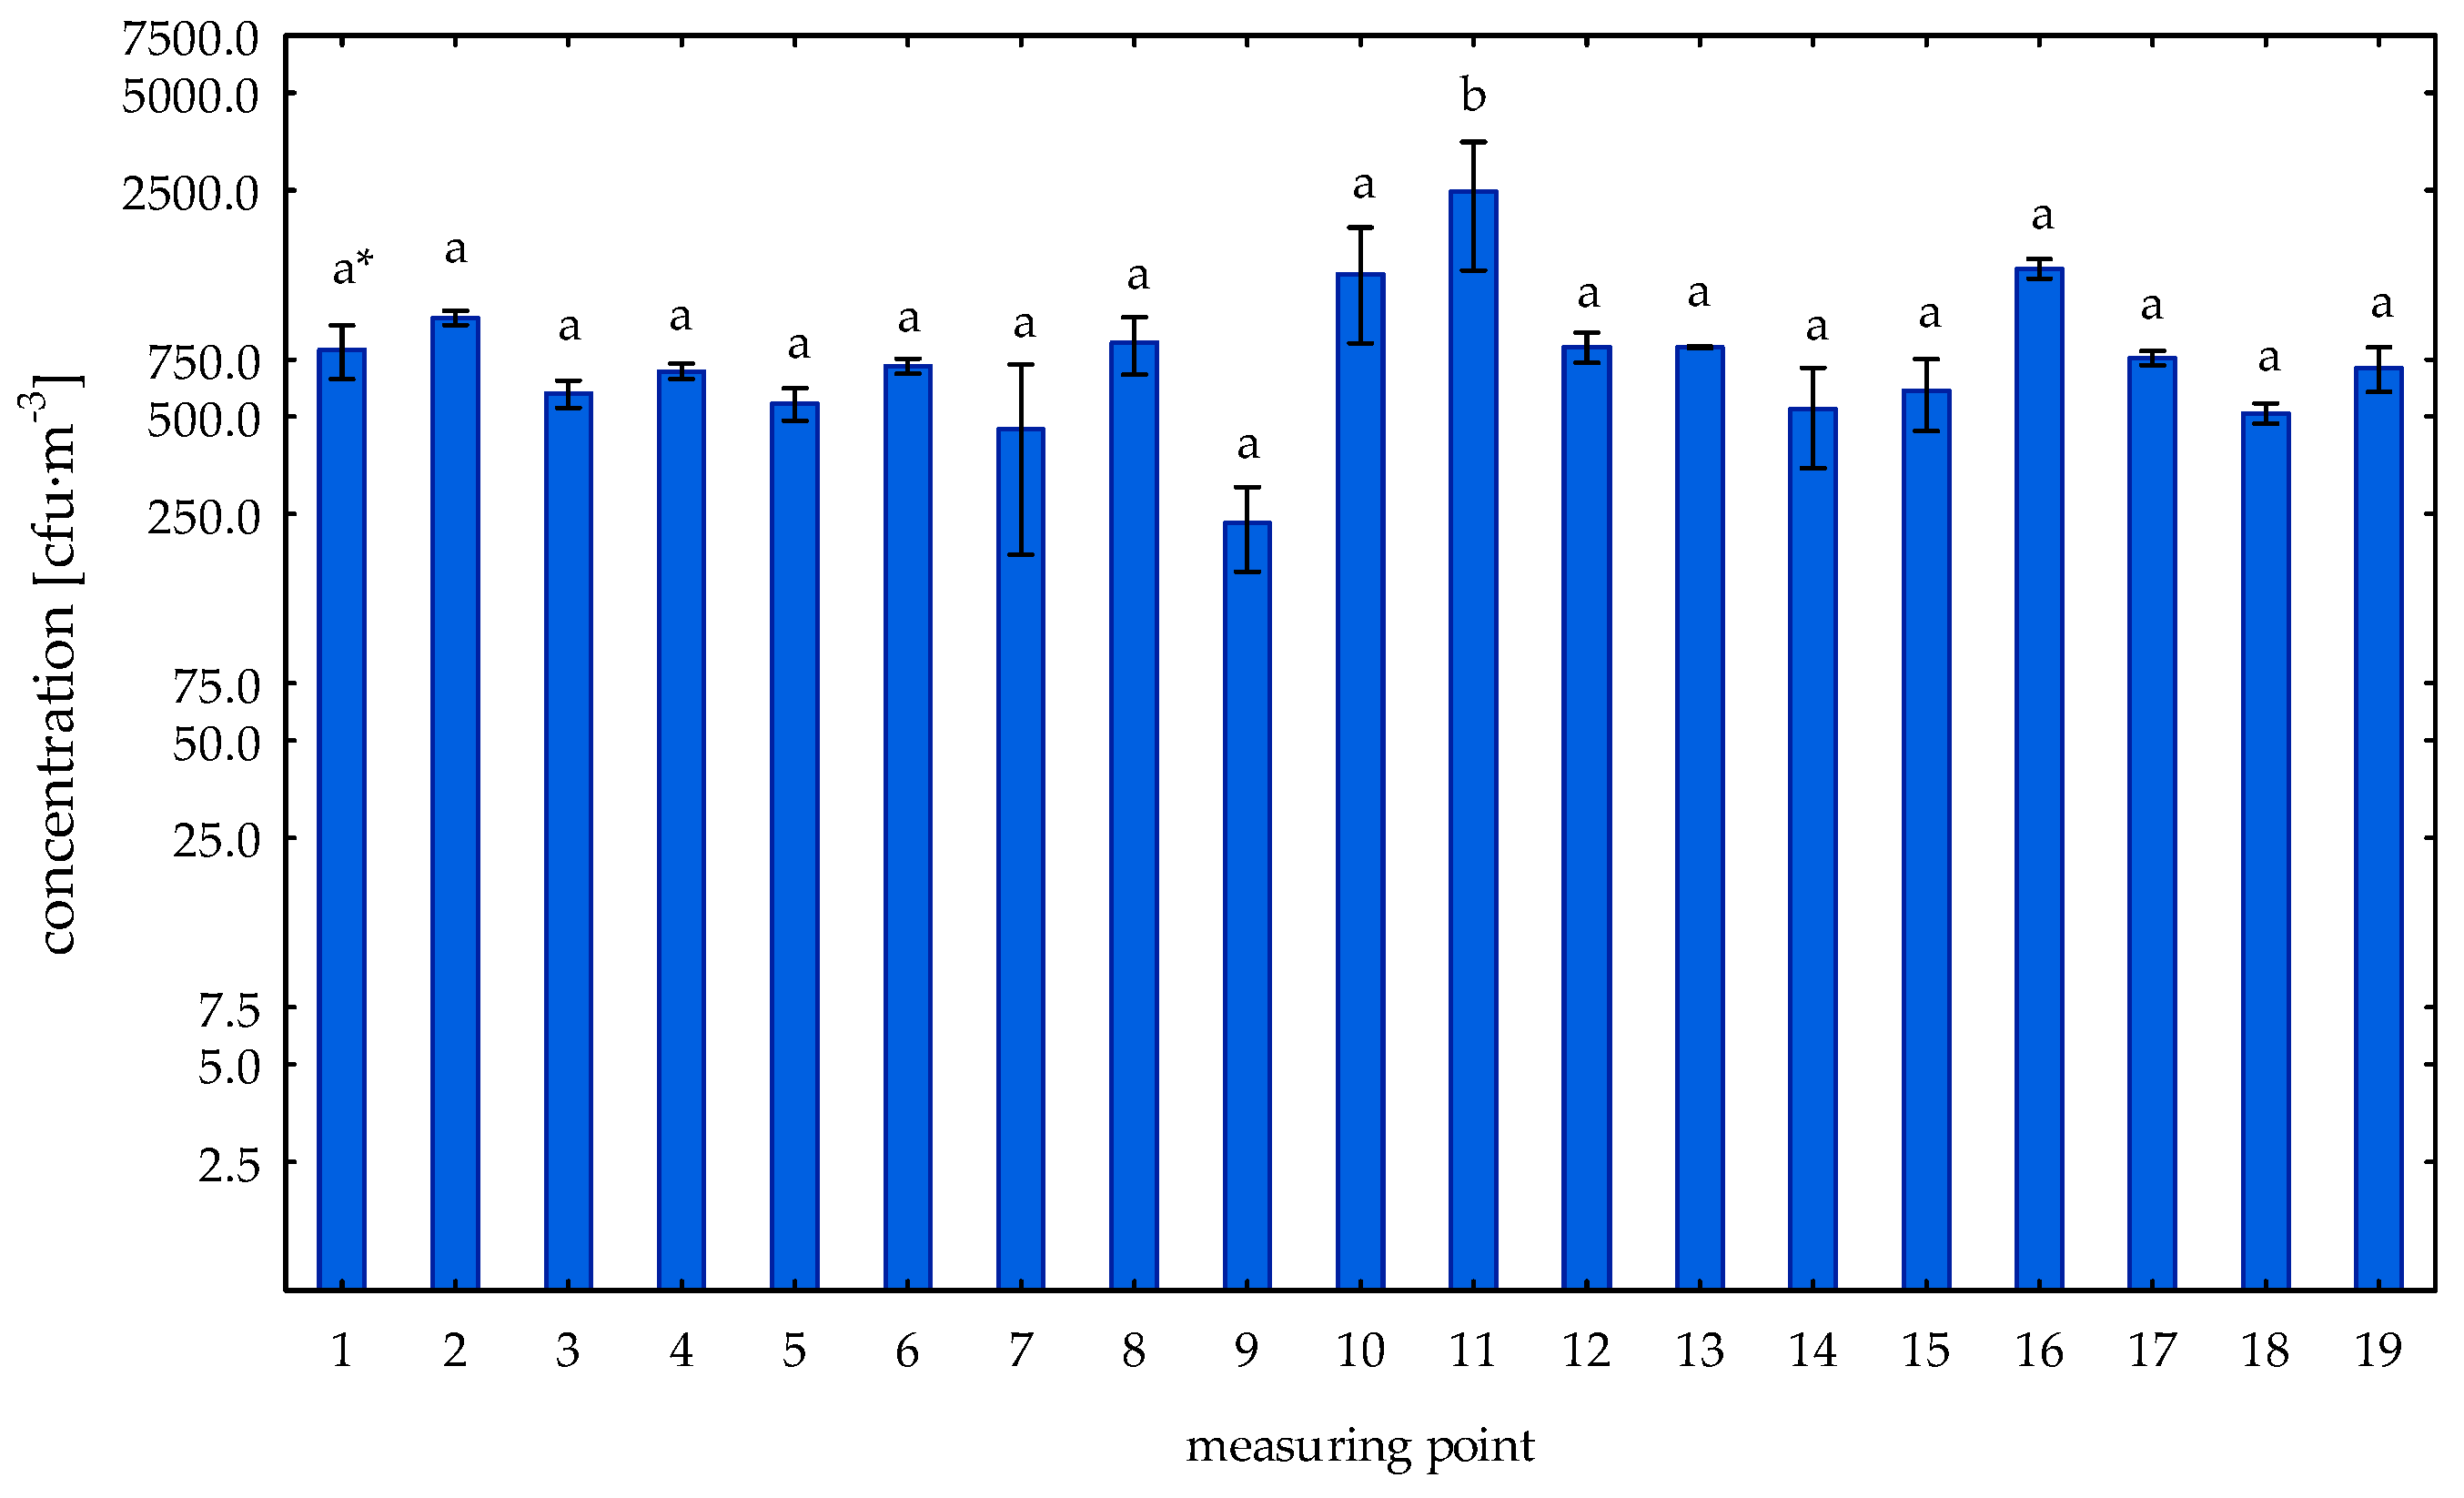
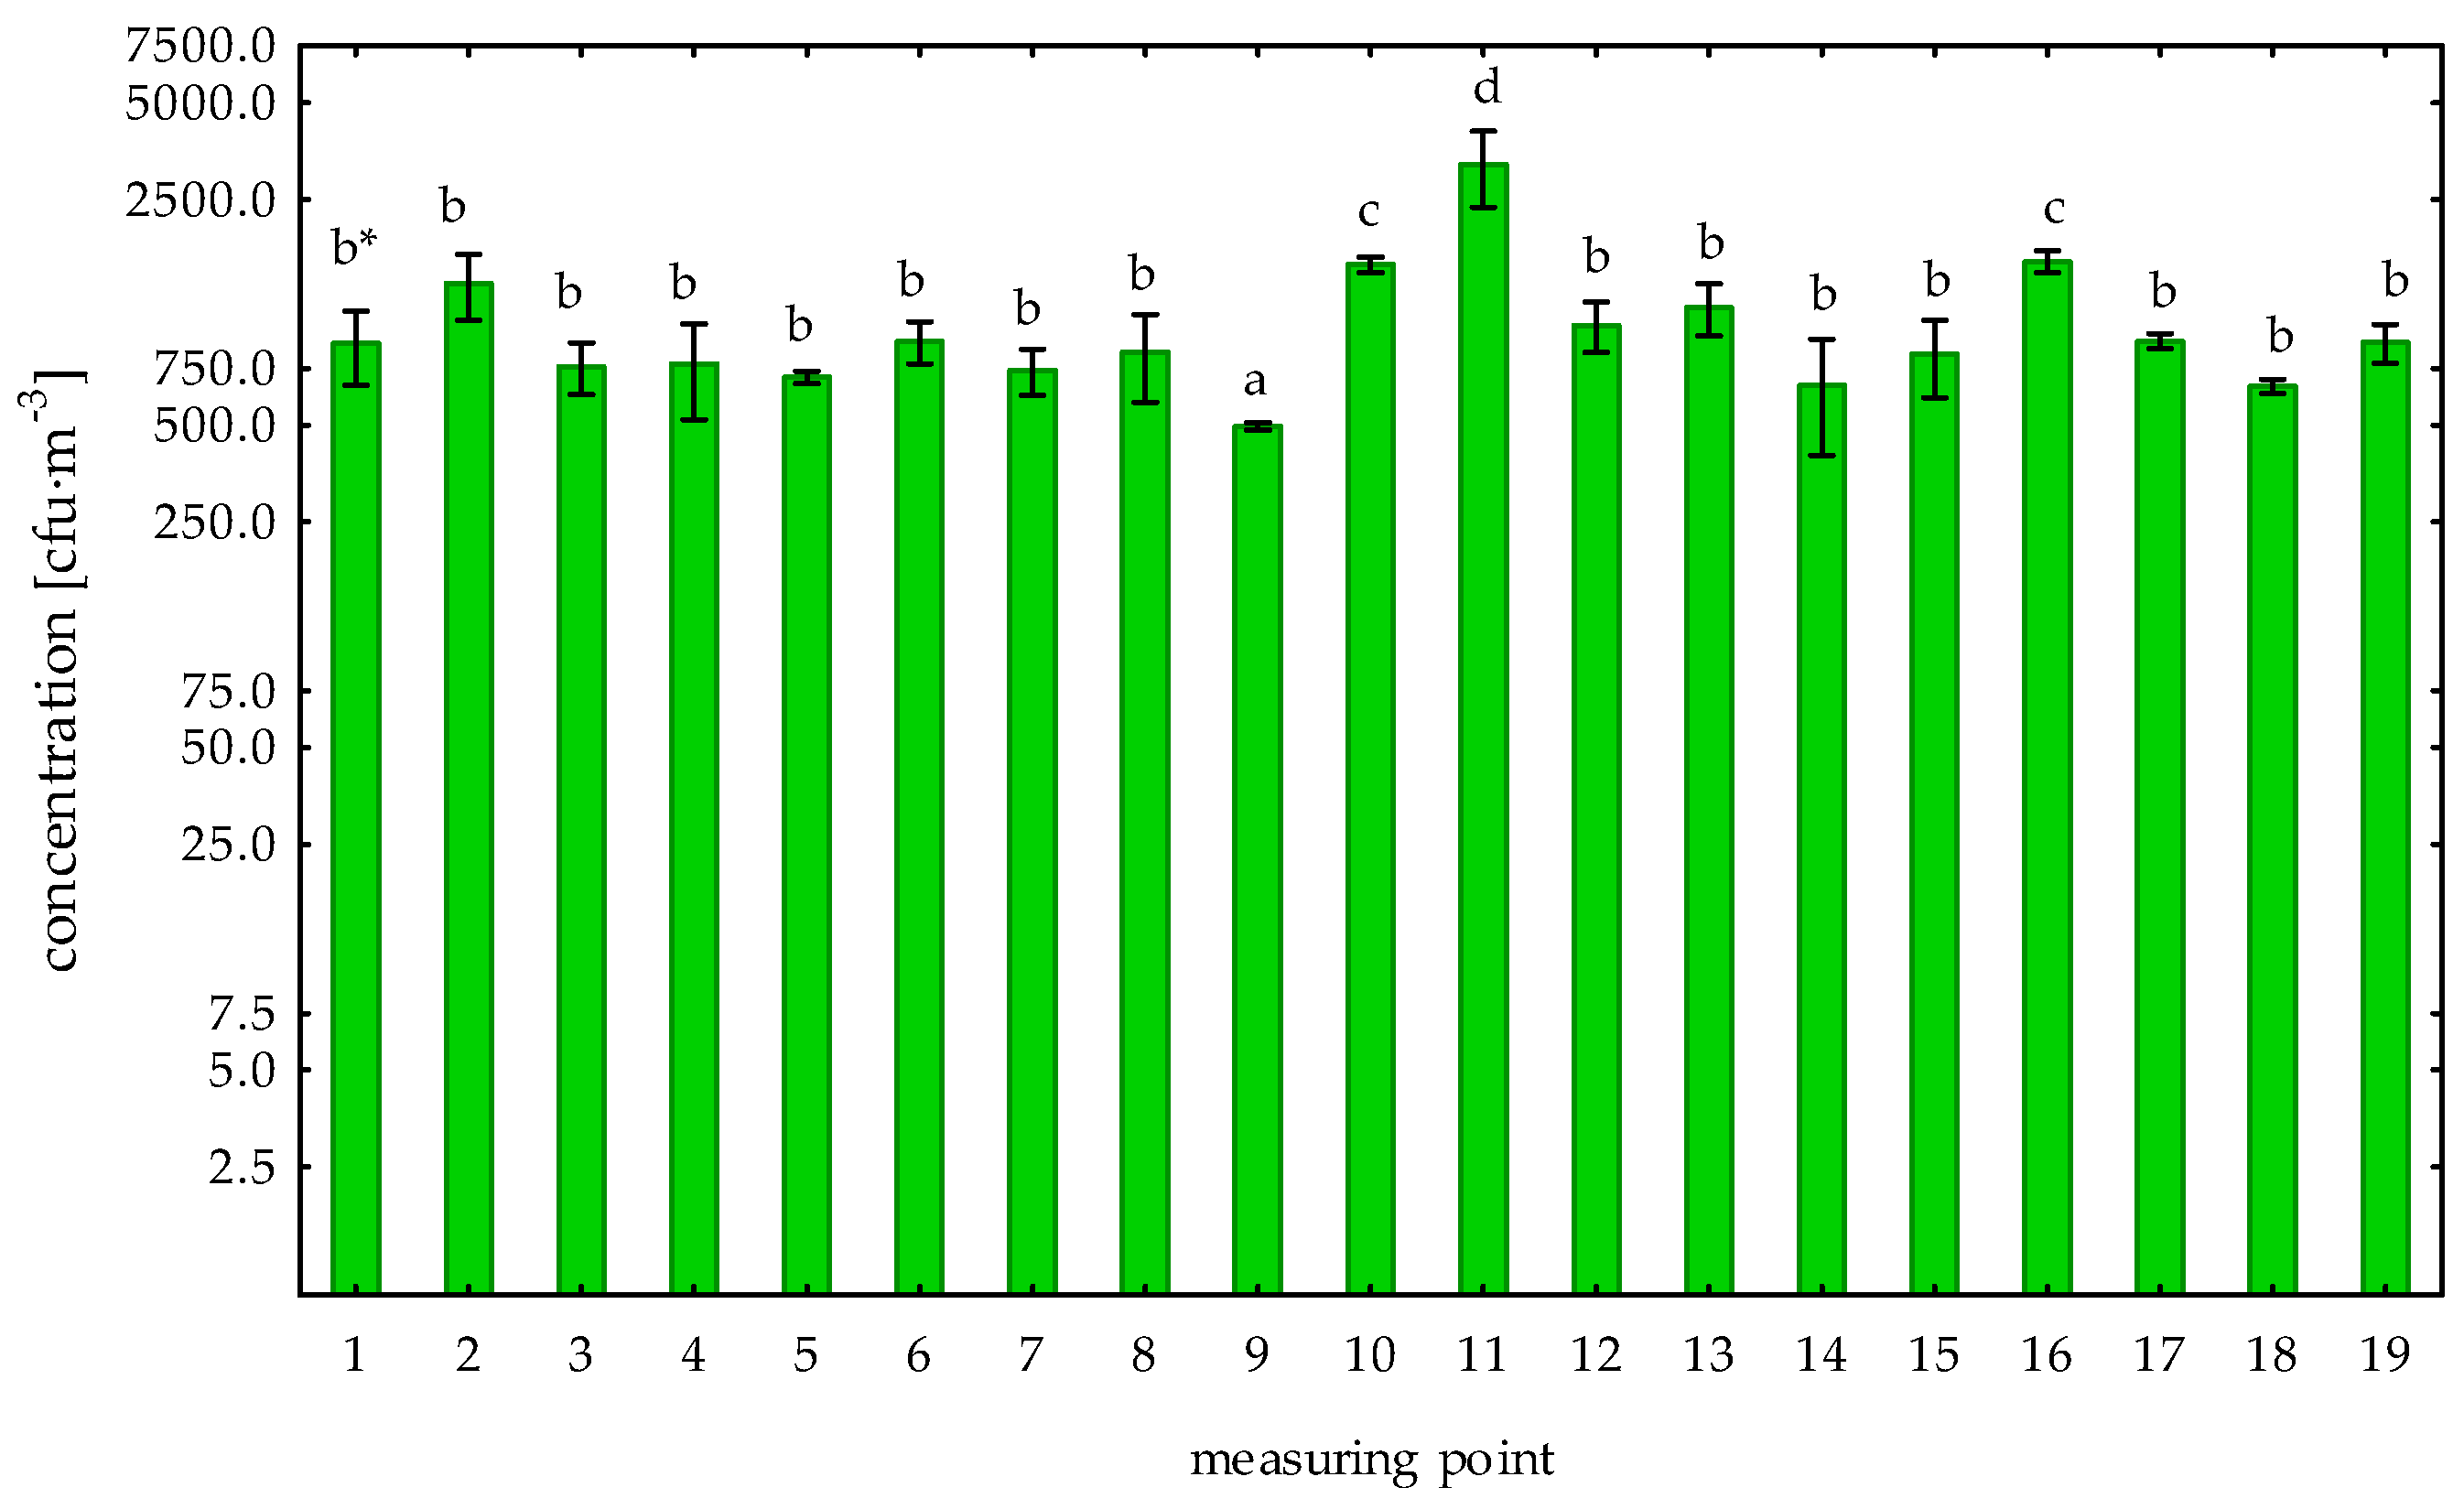
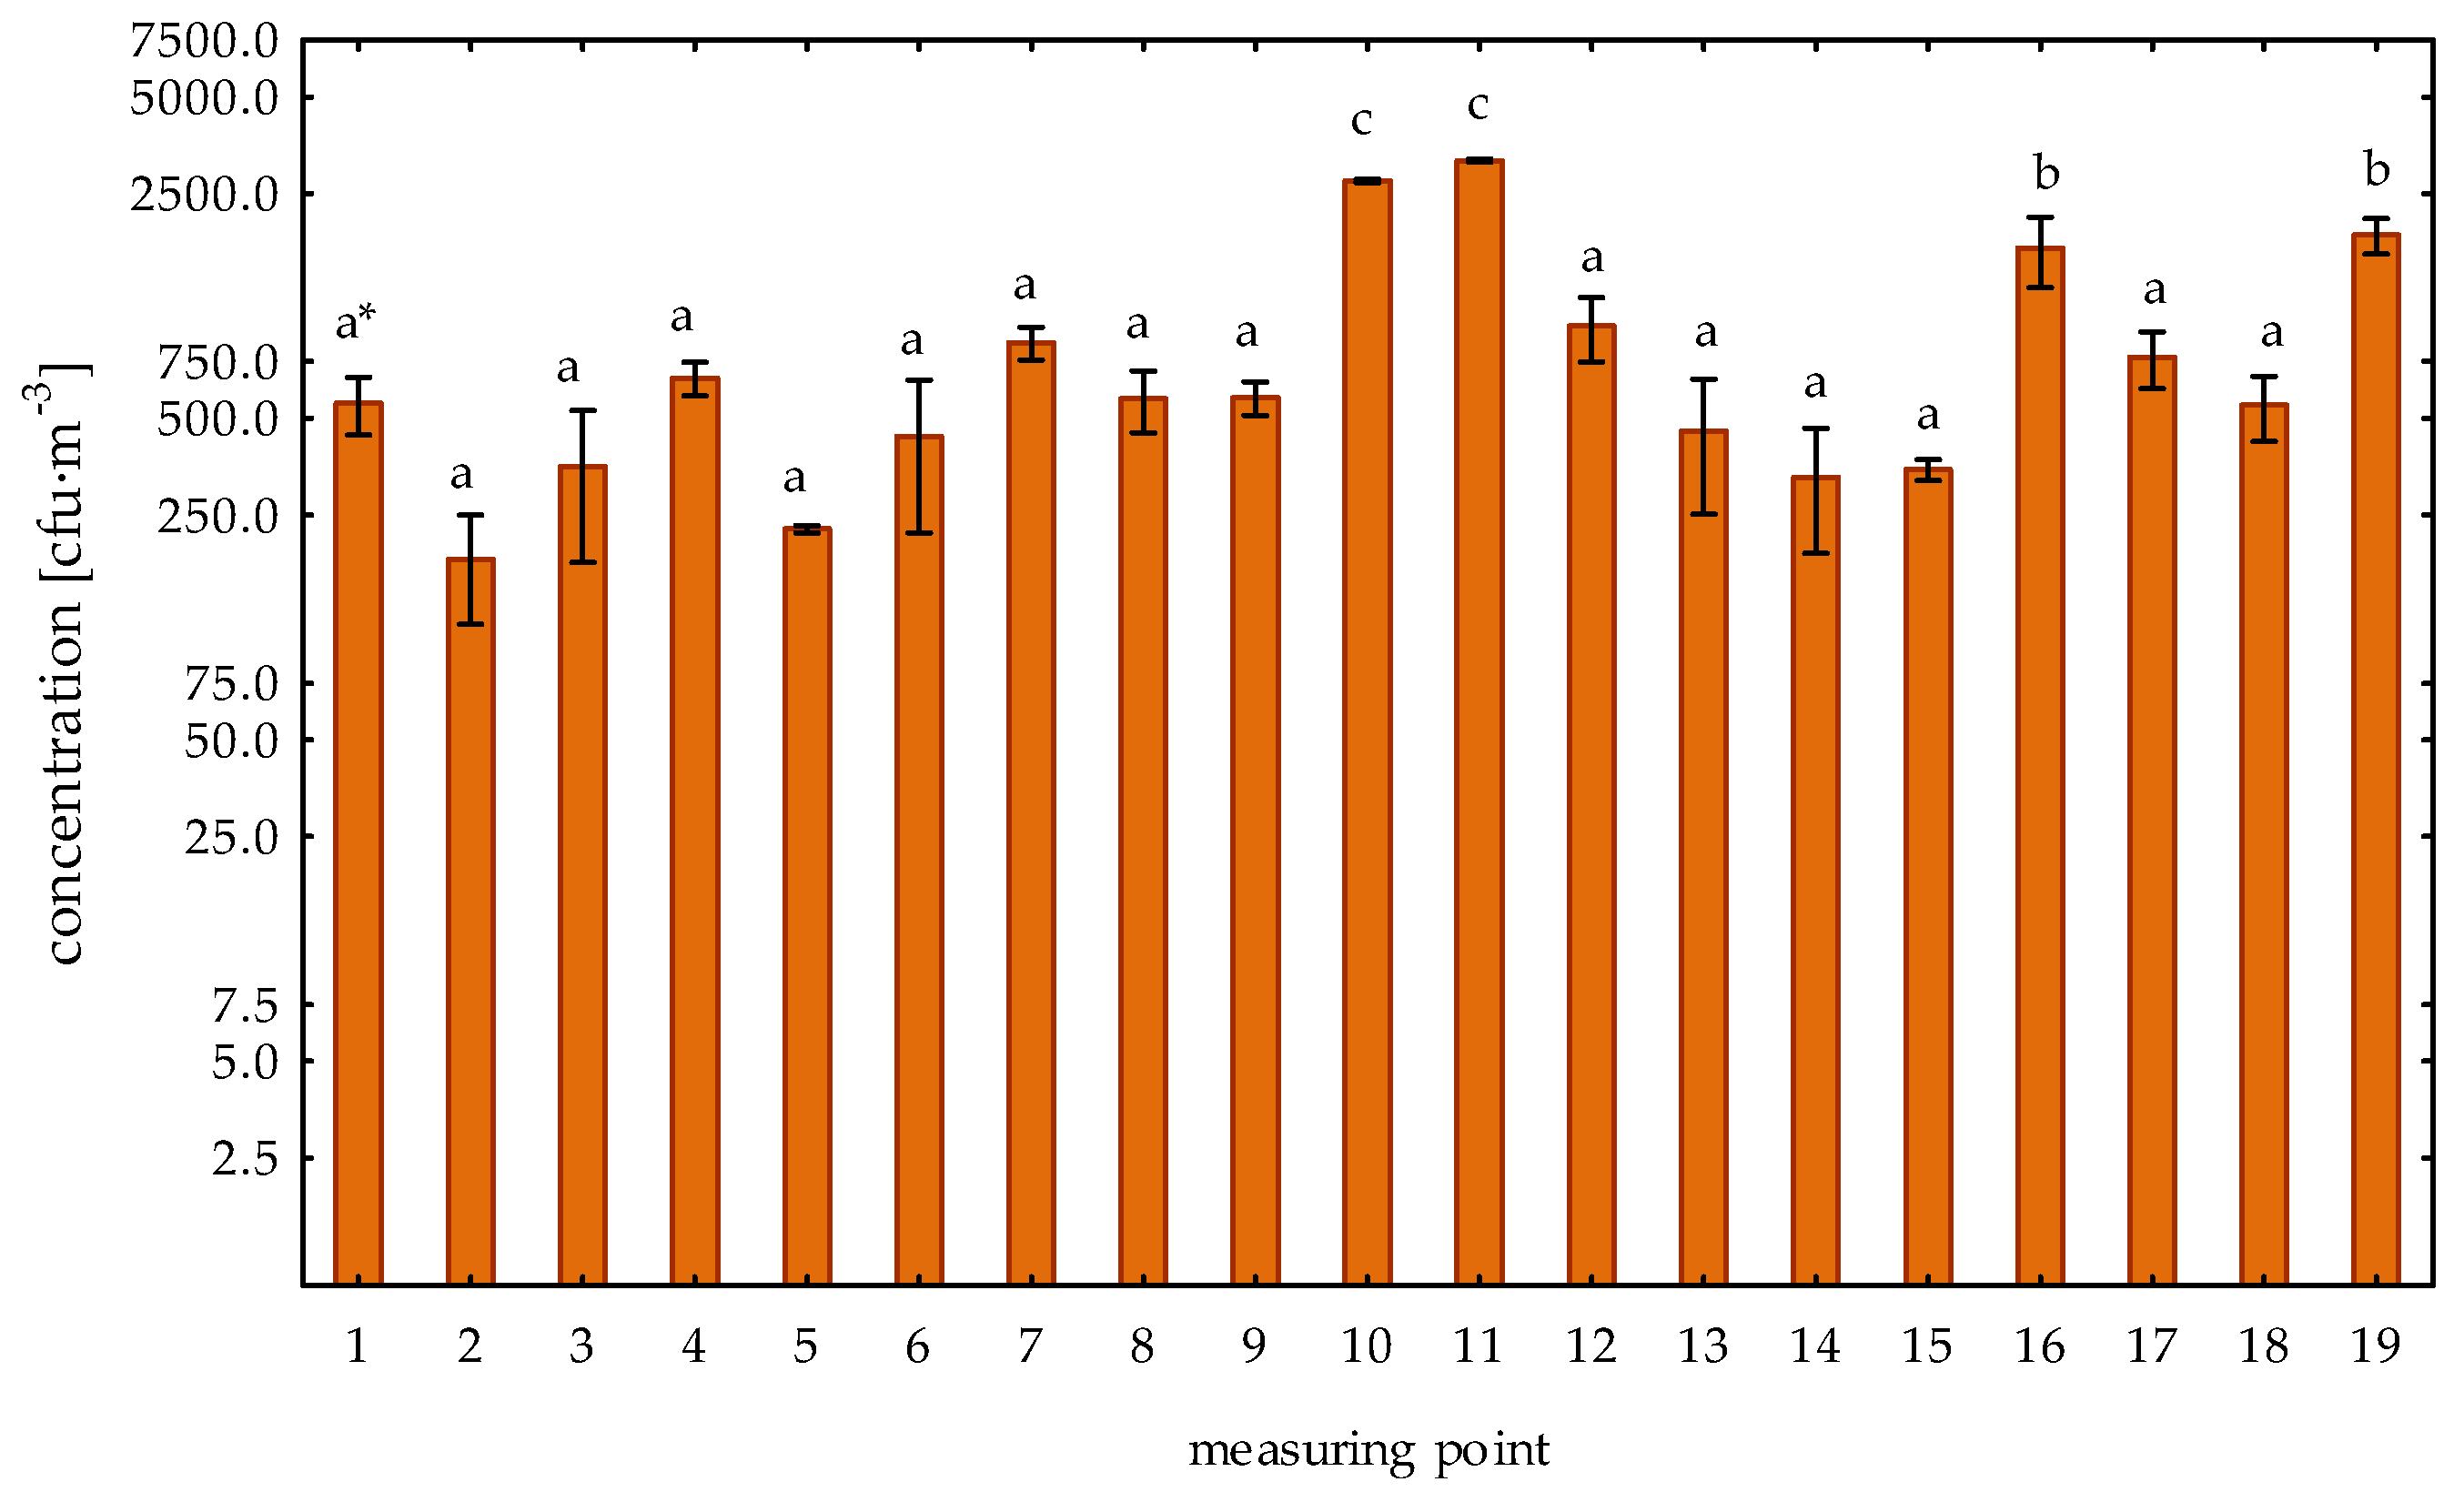
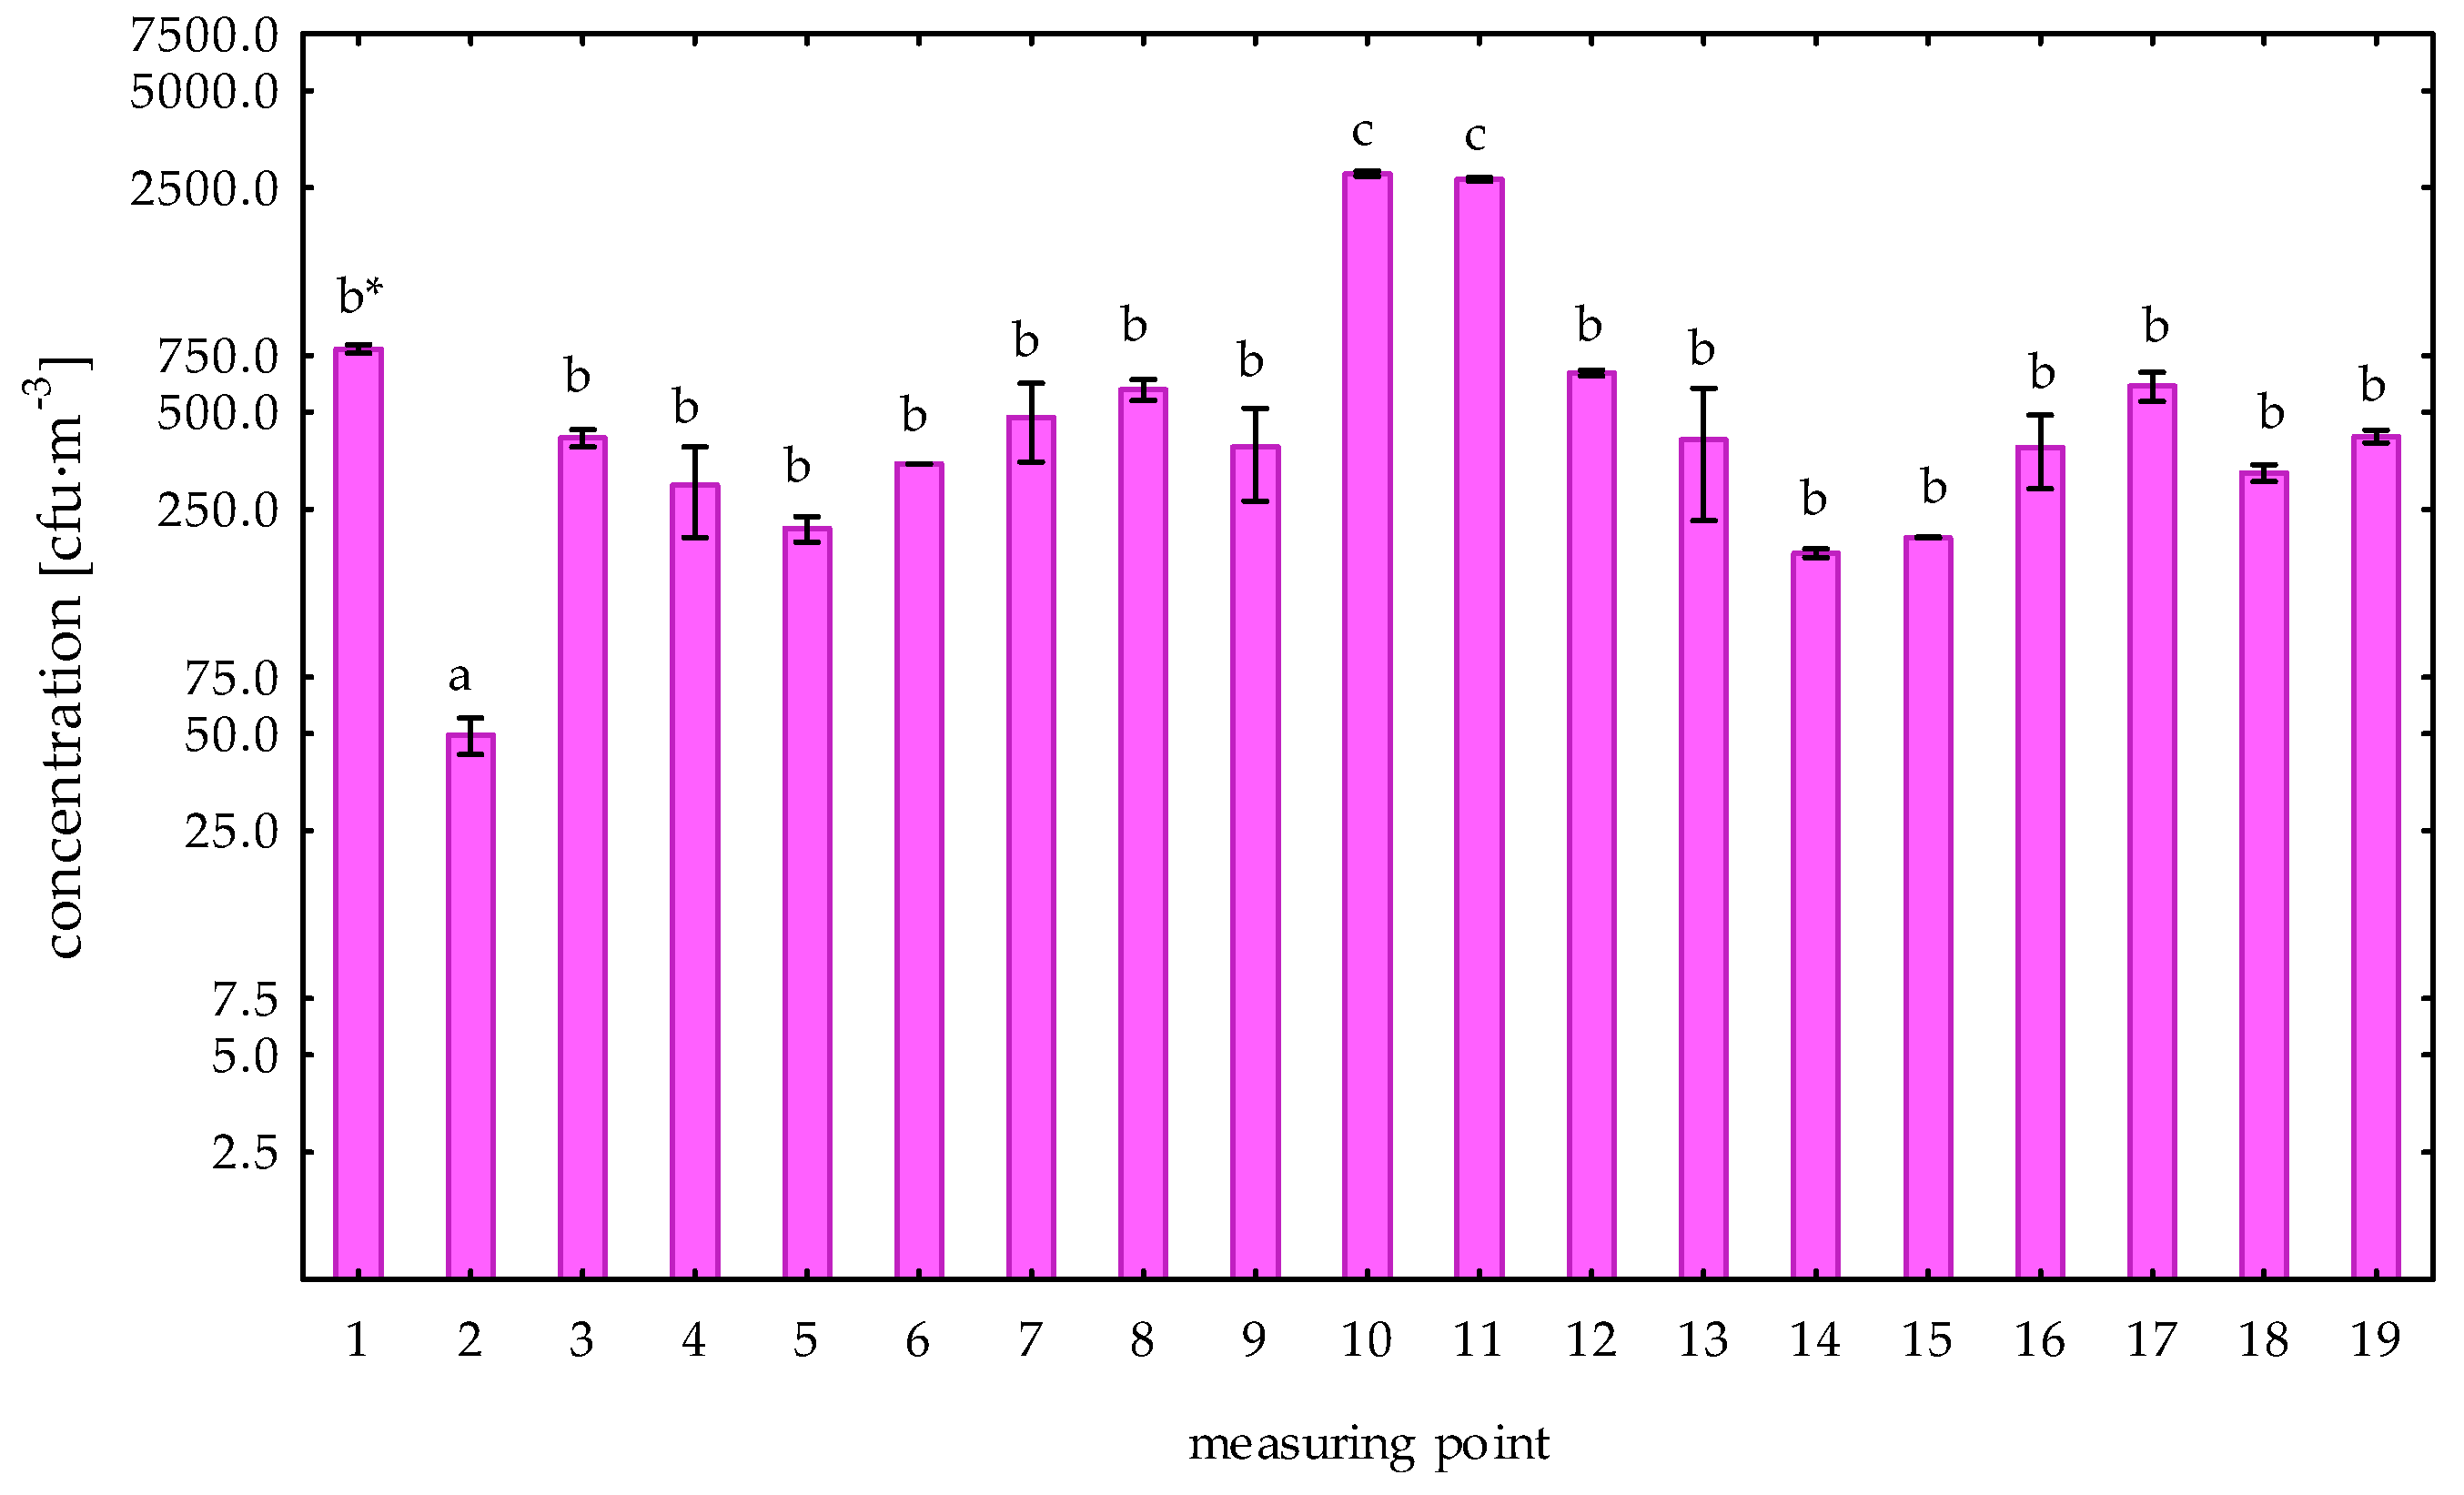
3.1.1. Analysis of Spatial Variability of Bioaerosol Concentrations in the Same Seasons

The results of bacterial aerosol concentration measurements in the herbal processing plant are presented in Table 1 and Figure 2, Figure 3, Figure 4 and Figure 5.
The concentration of total bacteria during the spring season (Table 1, Figure 2) ranged from 186 cfu·m−3 to 3214 cfu·m−3. Taking into account the plant’s production line, the lowest average concentration of bacteria in the spring season was recorded at point no. 9 (235 cfu·m−3), and the highest at point no. 16 (1431 cfu·m−3). Statistical analysis showed no significant differences in the concentration of bacterial aerosol between the tested points of the production line (Tukey’s test: p > 0.05). On the other hand, a significantly higher concentration of bacteria was found at point no. 11 (2468 cfu·m−3) compared to the concentrations found at all other measurement points located along the production line (Tukey’s test: p < 0.05). When analyzing the values of bacterial aerosol concentrations in the herbal processing plant and the outdoor air, no statistically significant differences were found (Scheffe’s test: p > 0.05). In the spring season, a significantly higher concentration of total bacteria in the internal background was found compared to the external background (Tukey’s test: p < 0.05).
The analysis of the obtained results showed that the concentration of the total number of bacteria in the summer (Table 1, Figure 3) ranged from 479 cfu·m−3 to 3817 cfu·m−3. As in the case of the spring season, the lowest mean concentration of bacteria in the summer was recorded at point no. 9 (485 cfu·m−3), and the highest at point no. 16 (1608 cfu·m−3) (taking into account a plant’s production line). Statistically significant differences were found in the concentration of bacterial aerosol between points no. 9, 10, and 16 (Tukey’s test: p < 0.05). The results of the analysis showed a significantly higher concentration of bacteria at point no. 11 (3216 cfu·m−3) compared to all other measurement points (Tukey’s test: p < 0.05). No statistically significant differences were found in the concentration of bacterial aerosol between production rooms and outdoor air (Scheffe’s test: p > 0.05). On the other hand, a significantly higher concentration of the total number of bacteria in the internal background was noted compared to the external background (Tukey’s test: p < 0.05).
The concentration of the total number of bacteria in the autumn season (Table 1, Figure 4) in the examined plant ranged from 134 cfu·m−3 to 3189 cfu·m−3. The lowest average concentration of bacteria in the autumn was recorded at point no. 5 (226 cfu·m−3), and the highest at point no. 10 (3163 cfu·m−3) and it was significantly higher compared to the bacterial aerosol concentrations observed at other measuring points (Tukey’s test: p < 0.05). Taking into account the external and internal background, the lowest concentration of bacteria was noticed at point no. 2 (182 cfu·m−3), and significantly higher at point no. 11 (3163 cfu·m−3). Statistically significant differences were found in the concentration of the bacterial aerosol between point no. 16 and 19, and other measuring points (Tukey’s test: p < 0.05). An analysis of the concentration of bacterial aerosol in the production rooms and the outdoor air showed no significant differences (Scheffe’s test: p > 0.05). However, the analysis showed a significantly higher concentration of the total number of bacteria in the internal background compared to the external background (Tukey’s test: p < 0.05).
The concentration of the total number of bacteria in the winter season (Table 1, Figure 5) ranged from 45 cfu·m−3 to 2800 cfu·m−3. The lowest average concentration of bacteria in the winter season was recorded at point no. 2 (50 cfu·m−3), and the highest at point no. 10 (2762 cfu·m−3), and it was significantly higher compared to the bacterial aerosol concentration in the other measuring points (Tukey’s test: p < 0.05), except for point no. 11 (Tukey’s test: p > 0.05). However, the analysis showed a significantly higher concentration of the total number of bacteria in the internal background compared to the external background (Tukey’s test: p < 0.05).

3.1.2. Analysis of the Seasonal Variability of Bacterial Aerosol Concentrations

The analysis of the obtained results showed statistically significant differences in bacterial aerosol concentrations between the seasons in the following points: no. 2, 5, 6, 9, 10, 13, 15, 16, 18, and 19 (Scheffe test: p < 0.05). The analysis of bacteria concentrations in the premises of a plant and the outdoor air did not show any significant differences between the seasons (Scheffe’s test: p > 0.05). In the case of the external background, statistically significant differences in bacterial concentration occurred between the winter and summer seasons (Scheffe’s test: p < 0.05).

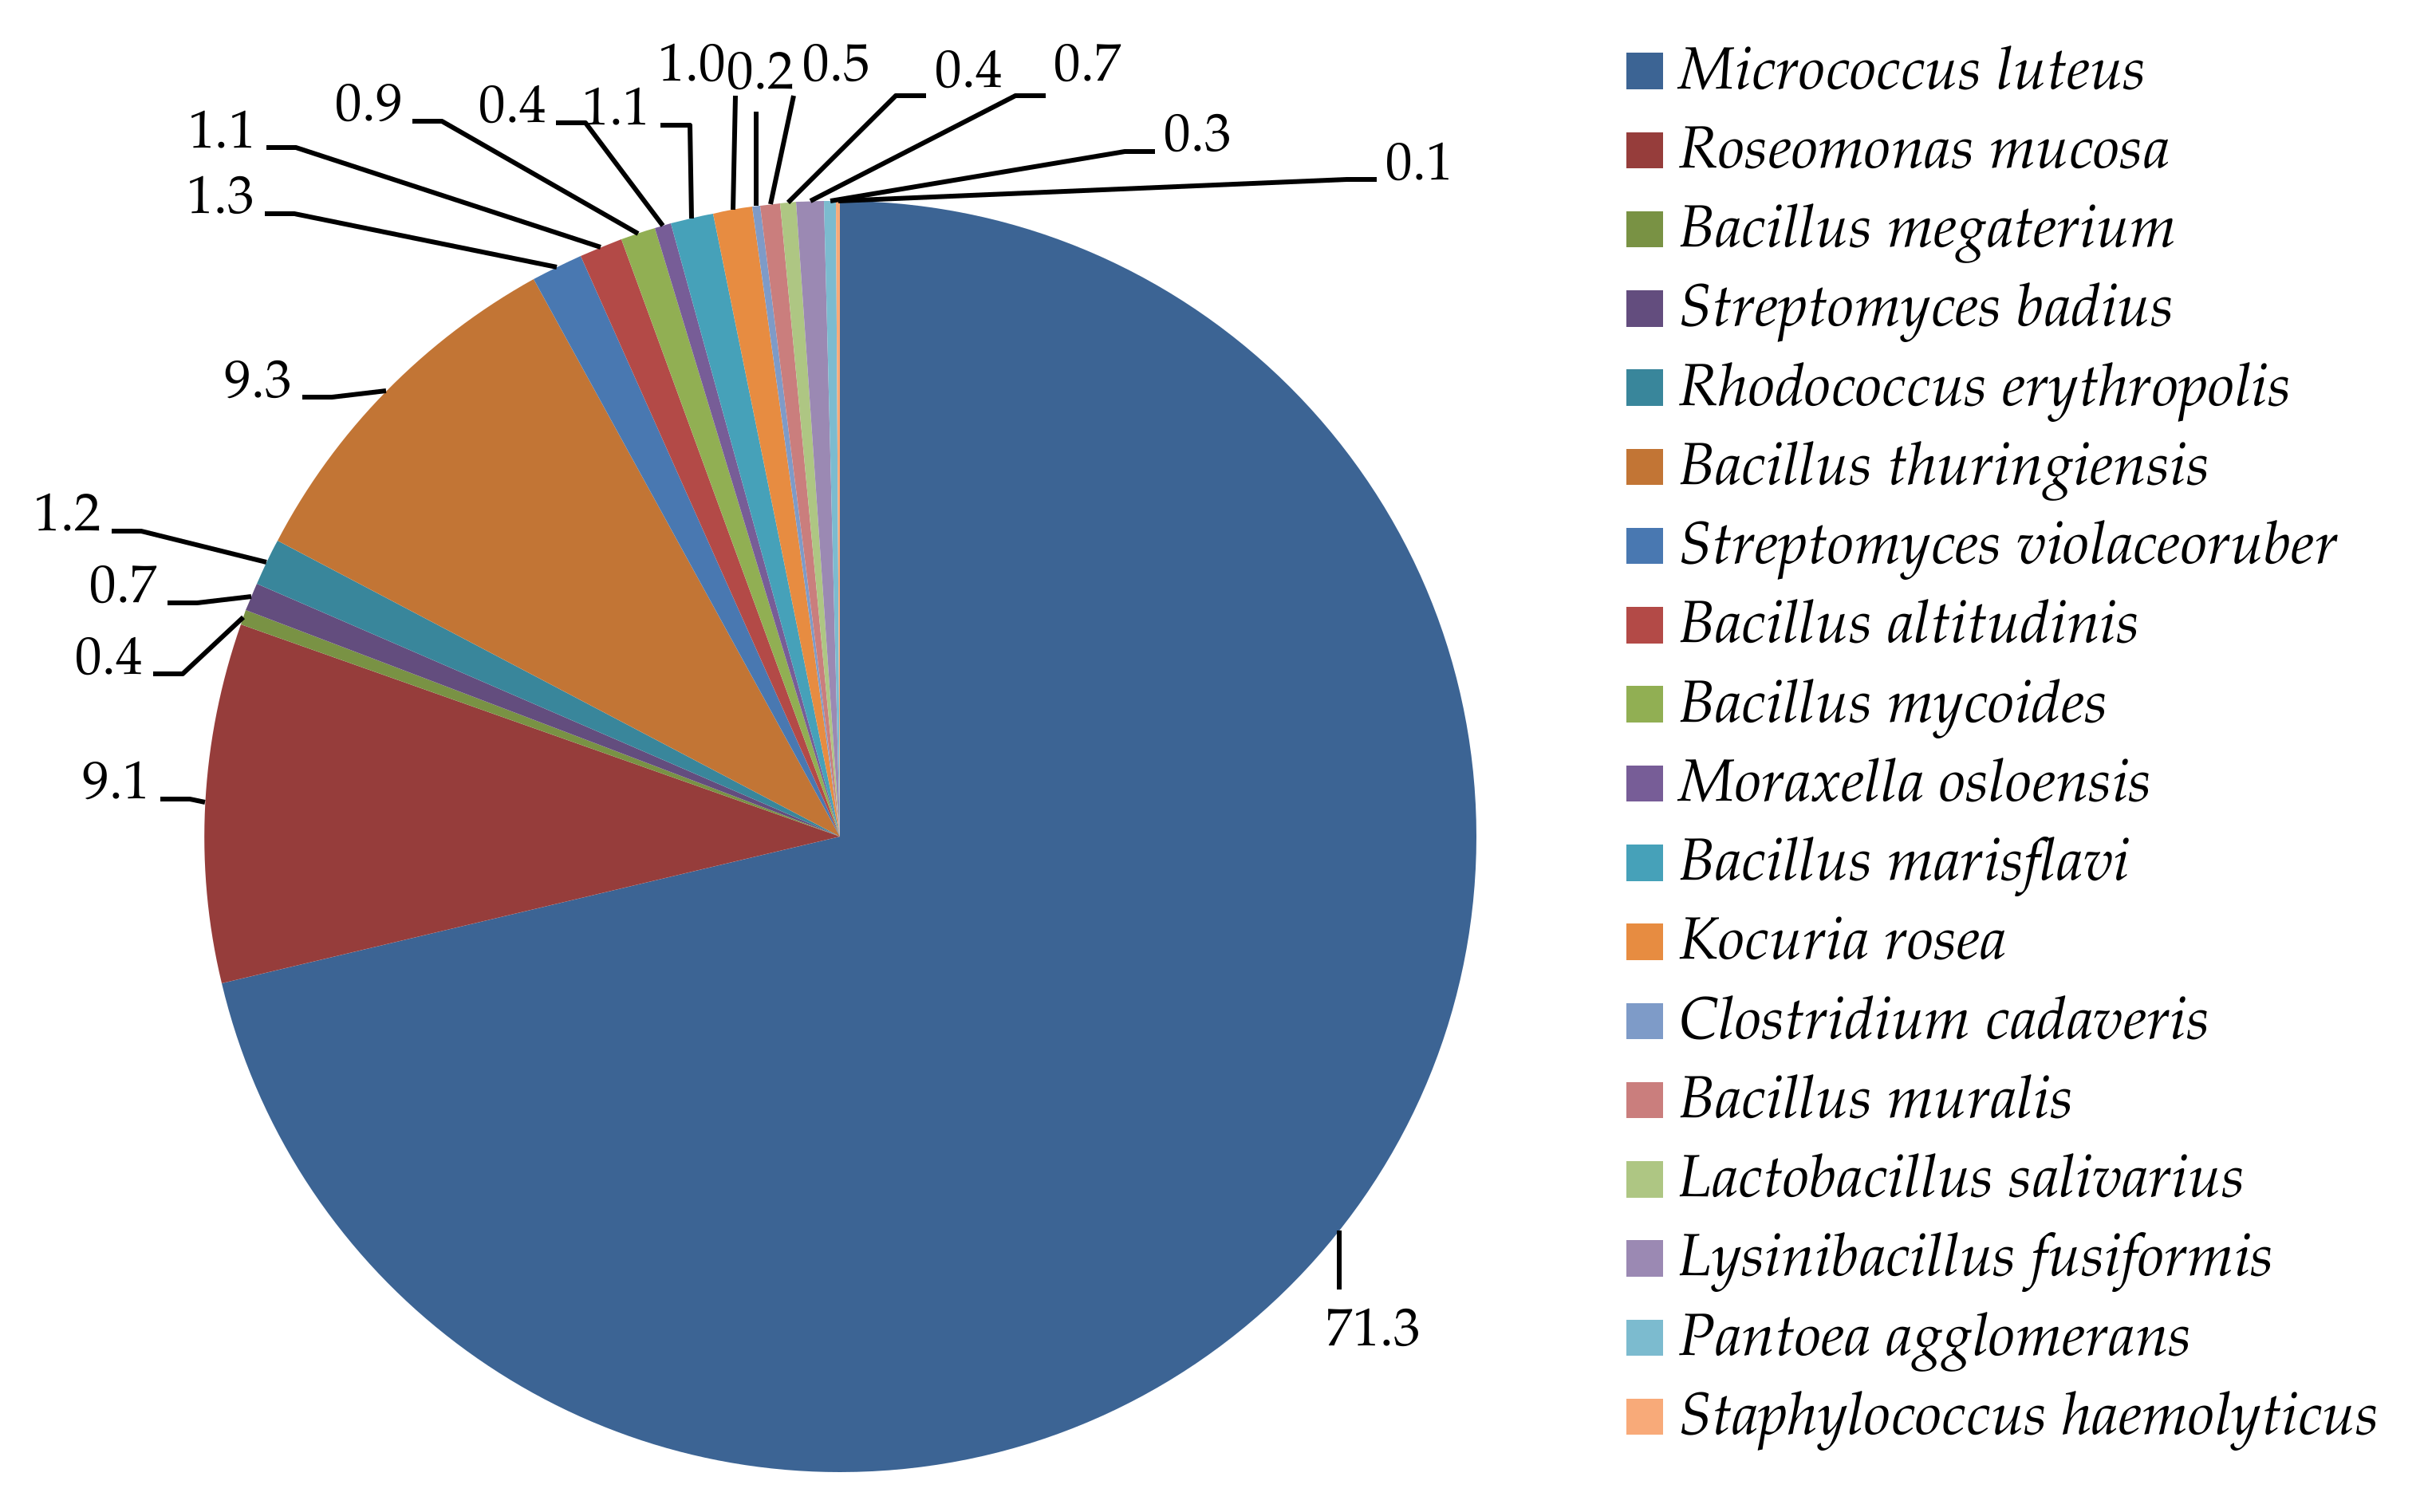
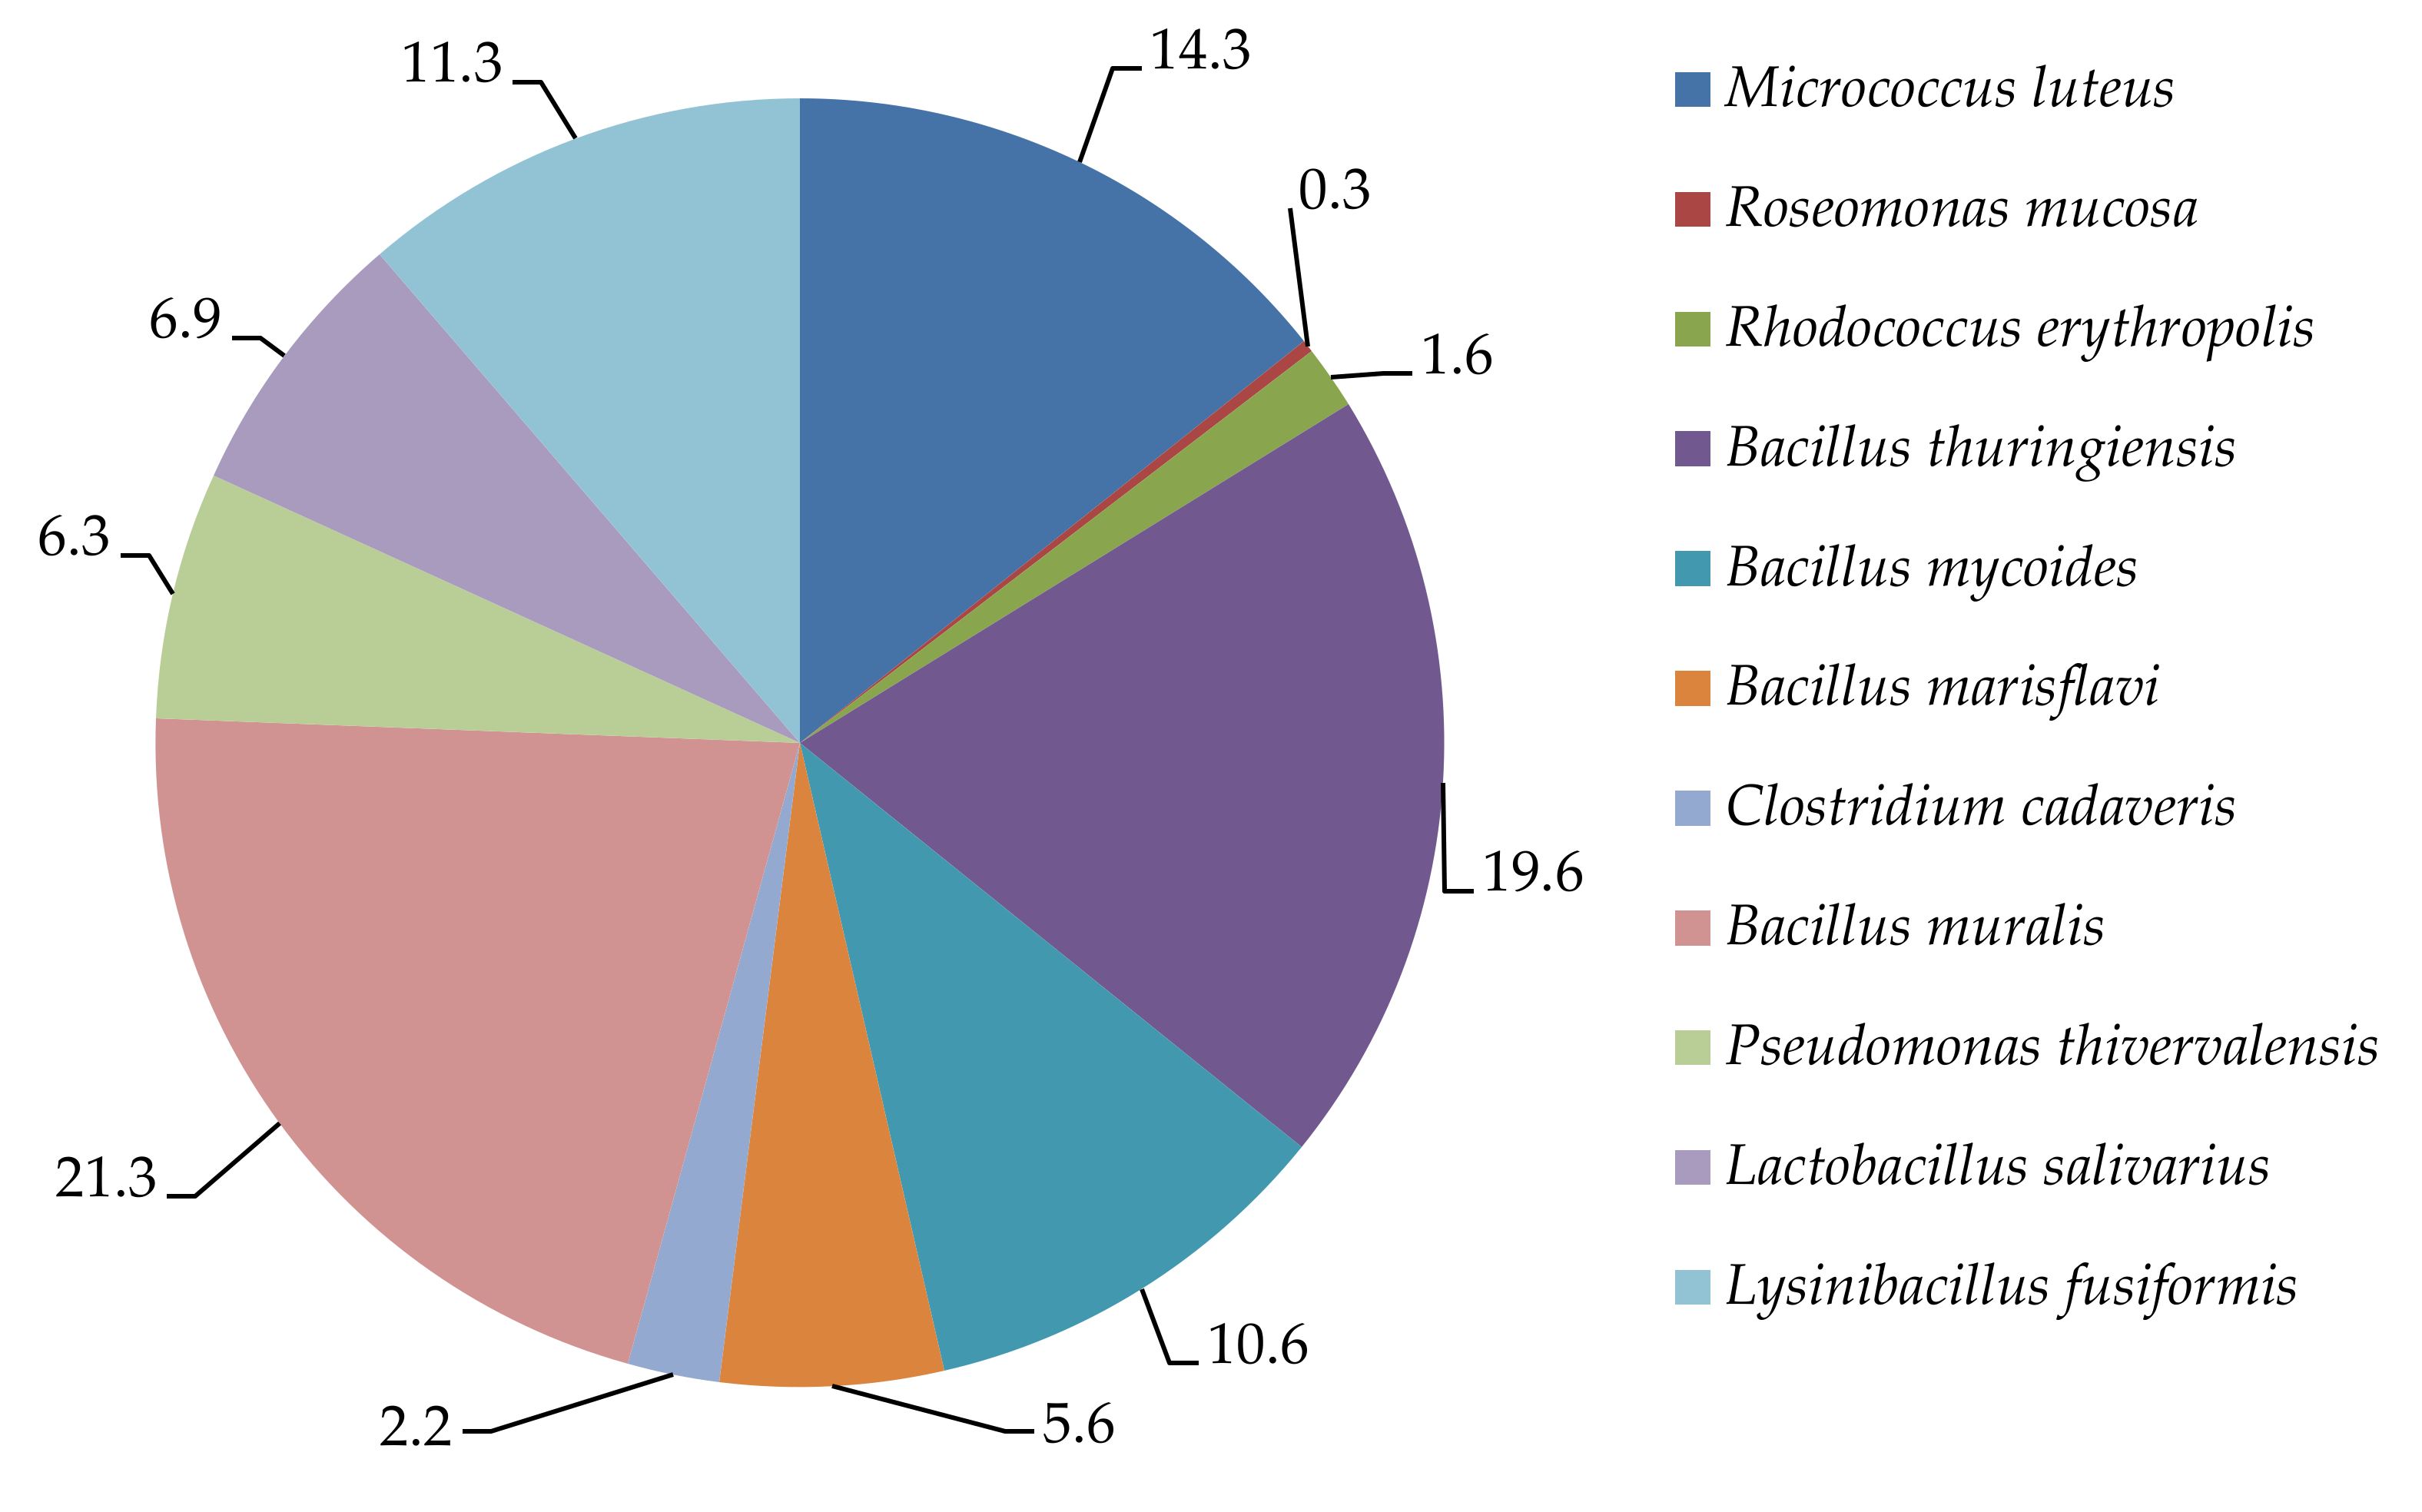
3.2. Qualitative Analysis of Bacterial Biota in Air Samples—Taxonomic Identification

The results of the qualitative analysis of microorganisms isolated from the indoor and outdoor air are presented in Figure 6 and Figure 7. In the indoor air, 16 species of bacteria from 10 genera were identified. In terms of species, the most numerous were bacteria of the genera Micrococcus, Bacillus, and Roseomonas. In the outdoor air, 11 species of bacteria from seven genera were identified. In this case, the most numerous were bacteria of the Micrococcus and Bacillus genera.

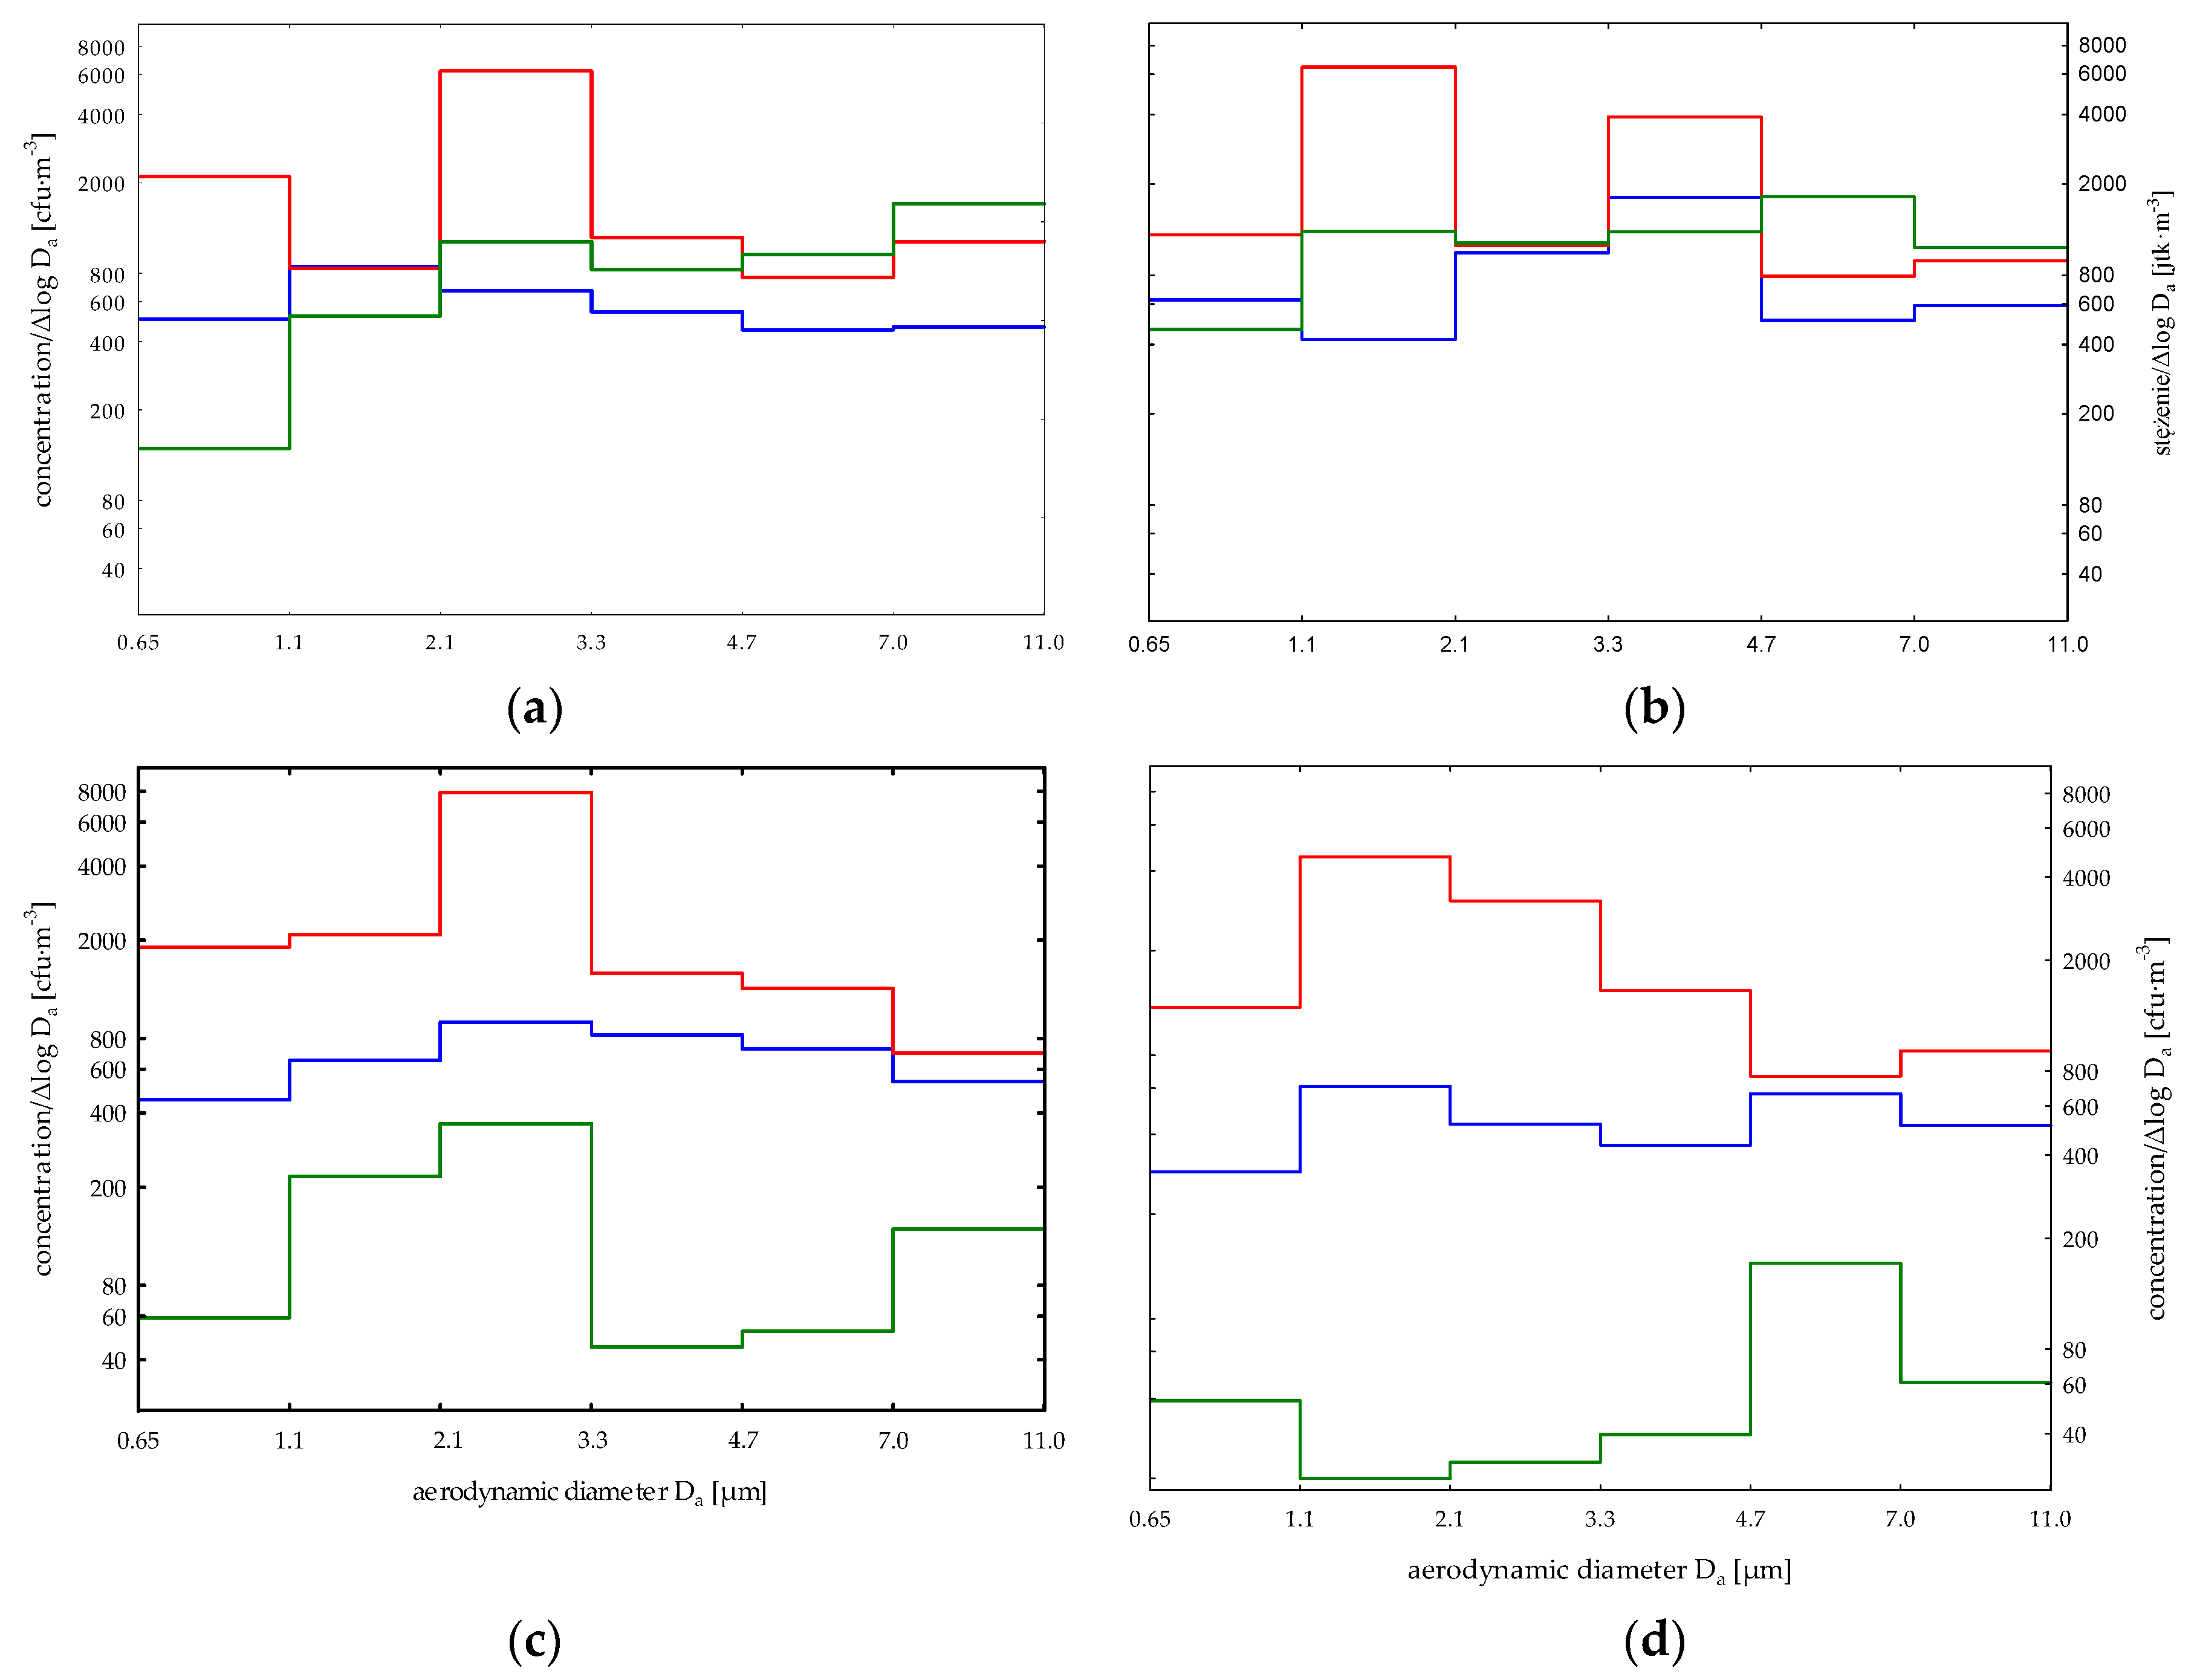
3.3. Analysis of Particle Size Distributions

The particle distributions of bacterial aerosol in three groups of measuring points in the spring, summer, autumn, and winter seasons are presented in Figure 8a–d. The analysis of the size distributions of bacterial particles present in the air of production rooms in the spring season indicates the presence of these microorganisms mainly in the form of single cells (with aerodynamic diameters of 1.1–2.1 µm). In the summer and autumn seasons, these microorganisms were present in the production rooms in the form of small bacterial or bacterial–dust aggregates, and in winter—in the form of single cells and small bacterial or bacterial–dust aggregates. The described size distributions and the actual size of bacteria from the group of Gram-positive cocci (with aerodynamic diameters in the range of 1.1–2.1 μm) present in the indoor air may indicate additional emission of these bacteria in the spring and winter seasons from their main source, which is the human body.
The analysis of the size distribution curve for the internal background in the spring and autumn seasons showed that the bacterial aerosol reached maximum concentrations in the diameter range of 2.1–3.3 µm, while in the summer and winter seasons, the bacterial aerosol reached maximum concentrations in the diameter range of 1.1–2.1 µm. These observations indicate that bacteria were present in the air mainly in the form of single cells and small bacterial or bacterial–dust aggregates.
The analysis for the external background showed that in the spring season, the concentration of the bacterial aerosol reached maximum values in the diameter range above 7.0 µm; in the summer and winter seasons, 4.7–7.0 µm; and in the autumn: 2.1–3.3 µm. This means that bacteria were present in the atmospheric air in the form of small and large bacterial or bacterial–dust aggregates (which may be related to low-emission sources).

3.4. The Effect of Microclimatic Parameters on the Concentration of Bacterial Aerosol in the Environment of the Herbal Processing Plant

The range and median values of air temperature and relative humidity in three groups of measuring points (external background, internal background, and production rooms) are presented in Table 2. The impact of microclimatic parameters on the concentration of bacterial aerosol was assessed using Pearson’s correlation coefficient. The analysis showed that air temperature had a significant impact on the concentration of bacterial biota in the air. The correlation analysis showed that an increase in air temperature caused an increase in the concentration of the total number of bacteria (Pearson’s correlation coefficient R = 0.55 with p < 0.05).

3.5. The Effect of Particulate Matter Concentration on the Concentration of Bacterial Aerosol in the Environment of the Herbal Processing Plant

The range and median values of the particulate matter concentrations of 10.0 µm, 4.0 µm, 2.5 µm, and 1.0 µm in three groups of measuring points (external background, internal background, and production rooms) are presented in Table 3a–c. The impact of the particulate matter concentration on the concentration of bacterial aerosol was assessed using Pearson’s correlation coefficient. Based on the results of the analysis, it was found that the concentration of particulate matter of each tested fraction did not significantly determine the concentrations of bacterial aerosol, which proved that the most of suspended dust were particles of granular dust, not biological particles.

4. Discussion

Bioaerosols are an important factor in occupational hazards. In Poland, occupational exposure to harmful biological agents occurs in many sectors of the economy. This problem is not always properly assessed, mainly due to insufficient knowledge about the scale of the problem. Therefore, the most important tasks should include establishing the criteria for the assessment of exposure to harmful biological agents in the work environment and recognizing limit values for concentrations of biological aerosols in the air. Because the quality of air at workplaces in the plant processing plant materials is an important parameter determining the health condition of employees, the next task should be the implementation of prophylaxis, consisting of reducing exposure by using safer machines and devices, implementing new production technologies, improving the ventilation systems of production rooms, and promoting the use of personal protection. These activities are crucial for occupational health and safety, work efficiency, and market competitiveness.
The analysis showed that the concentration of bacterial aerosol in the herbal processing plant did not exceed the level of 7.6·103 cfu·m−3. Research carried out by other scientists showed that the range of concentrations of bacterial aerosols in plants processing raw plant materials is usually 103–106 cfu·m−3 [18,19,20,21,22,23,24,25,26]. Lower concentrations of bacterial aerosol, observed in a herbal processing plant, may be related to the production based on the Good Manufacturing Practice (GMP) and Good Hygienic Practice (GHP) systems and the mechanical ventilation applied in the building [27,28,29,30].
Based on the results, it was found that the concentrations of bacterial aerosol in the production rooms of the herbal processing plant depend on the individual stage of the technological production process. Higher concentrations of bacterial aerosol were observed in the mixer room, weighing room, dryer hall, and packing halls. The impact of technological production process on the concentration of bioaerosol is also confirmed by other studies conducted in a potato processing plant, dairy, farm mill, meat plant, or fish processing plant [31,32,33,34,35].
Based on the results, it was found that, in the herbal processing plant, there are differences in the concentrations of bacterial aerosol in the production rooms between seasons of the year. Statistically significantly higher concentrations of bacteria (in indoor and outdoor air) were observed in summer compared to the winter season. Lower concentrations of bioaerosols in winter are associated with unfavorable environmental conditions (including low temperature and low air humidity), which inhibit the growth of microorganisms [36]. Seasonal variability is also a very important factor that impacts the concentration of bioaerosols [37,38].
Quantitative interpretation of the results of bacterial aerosol concentrations in the studied environment is difficult due to the lack of generally accepted normative or reference values for harmful biological agents. The reasons are the lack of standardization of measurement methods and difficulties in determining the effects of bioaerosols on humans. Therefore, the hygienic assessment of the studied environment was made based on the recommended permissible concentration values of the most common categories of microorganisms in workplaces contaminated with organic dust, as designated by the Team of Experts for Biological Agents of the Interministerial Committee for the Maximum Allowable Concentrations and Intensity of Factors Harmful to Health in the Workplace. The proposed normative values were developed as a result of environmental research, taking into account the potential harmfulness of a specific biological factor [1,39]. The values of bacterial aerosol concentration obtained in the study were lower than the recommended limit values for bacteria in workplaces contaminated with organic dust (1.0·105 cfu·m−3).
Air temperature and relative humidity may have a significant impact on the concentration of bioaerosol in the air [40,41]. The results showed that air temperature had a statistically significant positive effect on the levels of bacterial aerosol concentrations. This means that an increase in the concentration of bacteria in the air of the studied plant was observed during the increase in temperature of the air.
Microorganisms may adsorb on the surface of particulate matter and—when penetrating the respiratory system—may contribute an adverse health effect among employees. Respiratory problems, bacterial or fungal infections of the lungs, and the spread of biotoxins through the bloodstream are some of the most dangerous medical problems of aerogenic etiology [38]. Plants processing raw plant materials are facilities where employees may come into contact with particulate matter of plant origin. This dust, generated during the processing of plant materials, may contain microorganisms [42]. The conducted research did not show a significant correlation between the concentration of bacterial aerosol and the concentration of particulate matter, which proves that the main component of suspended dust in a herbal processing plant was granular dust.
In the assessment of microbiological air quality, not only is the number of microorganisms (described in colony-forming units) important, but so is the quality of microbes, i.e., their type and species [43]. In this study, the air bacterial biota consisted of many species and types of microorganisms that were characteristic for this type of work environment. The air was dominated by Gram-positive cocci of the genus Micrococcus and spore-forming rods of the genus Bacillus. Bacteria from the genera Bacillus, Micrococcus, Lactobacillus, and Clostridium present in the air are epiphytic microbiota, i.e., microorganisms living on the surface of plants [44]. The main source of these bacteria in the indoor air could be raw materials of plant origin, processed in the plant. The main environment for the Bacillus bacteria is the external environment (e.g., soil, plants) from which these microorganisms can be transported by the atmospheric air or by people (clothes, shoes).
In the indoor air of the tested plant, Gram-negative bacteria were found. The presence of bacteria of the genus Moraxella and Pantoea was found in the indoor air. Gram-negative bacteria are a source of immunologically active endotoxins, which are a particular threat to the health of people working in plants processing raw plant materials. The pathogenic effect manifests mainly in the form of fever with chills or inflammatory reactions of the respiratory system. Bacterial endotoxins are also one of the most important factors in the toxic syndrome caused by organic dust [45,46]. The conducted research confirms that people working in a herbal processing plant may be exposed to Gram-negative bacteria present in the air of this type of workplace.
Mesophilic actinobacteria were isolated from the air of the studied plant. Actinobacteria generally make up about 5% of the bacteria isolated from the air [47]. Actinobacteria are characterized by remarkable metabolic activity. These microorganisms are also able to form spores, characterized by high resistance to stress caused by dehydration. Actinobacteria of the genus Streptomyces were identified in the air of the herbal processing plant. These microorganisms are considered to be one of the main causes of allergic alveolitis and other respiratory symptoms [48].
The use of the six-stage Andersen’s cascade air sampler allowed us to obtain data on the size distribution of bacterial biota. As a result, it was possible to determine the forms of bacterial biota and the potential depth of penetration in the respiratory system. The analysis of the size distribution showed that bacteria were present in the air mainly in the form of single cells and bacterial or bacterial–dust aggregates of various sizes. It proves that the largest “load” of bacteria can reach the pharynx, trachea, primary, secondary, and terminal bronchi in the human respiratory system. It was also found that the curves of the particle size distribution of bacterial aerosol showed seasonal variability. According to the literature, the health effect of the inhalation of microbial particles depends, inter alia, on the possibility of penetration of the respiratory tract and interaction with cells or tissues at the deposition site. The particle deposition mechanism in the respiratory system is influenced by its size, shape, density, chemical composition, and reactivity. The type of breathing, the speed of airflow through the respiratory system, and the lung ventilation also affect the depth of penetration of the respiratory tract by microorganisms [49].

5. Conclusions

The concentrations of bacterial aerosol in the production rooms of a herbal processing plant depend on the individual stages of the technological production process. The concentrations of bacterial aerosol in the production rooms did not exceed 7.6·103 cfu·m−3 and were lower than the permissible concentration values proposed for production rooms contaminated with organic dust. The results indicate that seasonal variability is a very important factor that impacts the concentrations of bacterial aerosols in the environment of herbal processing plants. In forecasting, possible health effects resulting from exposure to bacterial aerosols in this type of work environment should be based on the results of measurements collected in individual seasons. The qualitative analysis of microorganisms isolated from the air showed the dominance of Gram-positive cocci of the Micrococcus genus and spore-forming rods of the Bacillus genus, i.e., microorganisms typical for an indoor environment. Among the isolated microorganisms, the bacteria of the Pantoea and Moraxella genus were found, which indicates that workers may be exposed to direct contact with harmful biological agents. The analysis of particle size distribution showed that the “load” of bacterial particles can reach the throat, trachea, and bronchi in the human respiratory system. This may cause adverse health effects in the form of irritation, inflammation, and allergic reactions. The control of basic microclimatic parameters, i.e., air temperature and relative humidity, and the determination of particulate matter concentrations in production rooms are necessary conditions for the proper microbiological analysis of the air in a herbal processing plant.

Author Contributions

K.B. and K.F.: conceptualization and methodology; K.B.: investigation, visualization, statistical analysis, writing—original draft preparation; K.F.: supervision. All authors have read and agreed to the published version of the manuscript.

Funding

The authors received funding from the Ministry of Science and Higher Education: subsidy for the University of Agriculture in Krakow no. 010014-D014 and no. 010014-D011.

Institutional Review Board Statement

Not applicable.

Informed Consent Statement

Not applicable.

Data Availability Statement

Not applicable.

Conflicts of Interest

The authors declare no conflict of interest.

References

  1. Górny, R.L. Biological aerosols—A role of hygienic standards in the protection of environment and health. Environ. Med. 2010, 13, 41–51. [Google Scholar]
  2. Brągoszewska, E.; Biedroń, I.; Kozielska, B.; Pastuszka, J.S. Microbiological indoor air quality in an office building in Gliwice, Poland: Analysis of the case study. Air Qual. Atmos. Health 2018, 11, 729–740. [Google Scholar] [CrossRef] [Green Version]
  3. Górny, R.L. Microbial Aerosols: Sources, Properties, Health Effects, Exposure Assessment—A Review. KONA Powder Part. J. 2019, 37, 64–84. [Google Scholar] [CrossRef] [Green Version]
  4. Adams, R.I.; Bhangar, S.; Pasut, W.; Arens, E.A.; Taylor, J.W.; Lindow, S.E.; Nazaroff, W.W.; Bruns, T.D. Chamber bioaerosol study: Outdoor air and human occupants as sources of indoor airborne microbes. PLoS ONE 2015, 10, e0128022. [Google Scholar] [CrossRef] [PubMed] [Green Version]
  5. Kim, K.H.; Kabir, E.; Jahan, S.A. Airborne bioaerosols and their impact on human health. J. Environ. Sci. 2018, 67, 23–35. [Google Scholar] [CrossRef]
  6. Bulski, K. Bioaerosols at plants processing material of plant origin—A review. Environ. Sci. Pollut. Res. 2020, 27, 27507–27514. [Google Scholar] [CrossRef]
  7. Paśmionka, I. Evaluation of microbiological quality of atmospheric air in a selected sewage treatment plant in Lesser Poland. Aerobiologia 2020, 36, 249–260. [Google Scholar] [CrossRef] [Green Version]
  8. Kozdrój, J.; Frączek, K.; Ropek, D. Assessment of bioaerosols in indoor air of glasshouses located in a botanical garden. Build. Environ. 2019, 166, 106436. [Google Scholar] [CrossRef]
  9. Gutarowska, B.; Piotrowska, M. Methods of mycological analysis in buildings. Build. Environ. 2007, 42, 1843–1850. [Google Scholar] [CrossRef]
  10. Ziajka, S. Dairying; Publishing House: Olsztyn, Poland, 2008. [Google Scholar]
  11. Juszczak, L. What’s hidden in food? Microbiological, environmental and technological hazards in food of plant origin. Agro Przem. 2011, 5, 44–49. [Google Scholar]
  12. Bawiec, A.J.; Pawęska, K.; Jarząb, A. Changes in the microbial composition of municipal wastewater treated in biological processes. J. Ecol. Eng. 2016, 17, 41–46. [Google Scholar] [CrossRef]
  13. Cândido, C.J.F.; Coelho, L.M.S.; Peixinho, R.M.T. The financial impact of a withdrawn ISO 9001 certificate. Int. J. Oper. Prod. Manag. 2016, 36, 23–41. [Google Scholar] [CrossRef]
  14. Wysokińska-Senekus, A. The process of implementation and operation of the food safety management system according to ISO 22000 in a meat processing plant. Zesz. Nauk. Uniw. Przyr. -Humanist. Siedlcach 2010, 87, 131–141. [Google Scholar]
  15. ISO Online Browsing Platform: ISO/TS 22176:2020(en) Cosmetics—Analytical methods—Development of a Global Approach for Validation of Quantitative Analytical Methods. Available online: https://www.iso.org/obp/ui/#iso:std:iso:ts:22176:ed-1:v1:en (accessed on 2 January 2023).
  16. Atlas, R.M.; Parks, L.C. Handbook of Microbiological Media; CRC Press: New York, NY, USA, 1997. [Google Scholar]
  17. Jensen, P.A.; Schafer, M.P. Sampling and characterization of bioaerosols. NIOSH Man. Anal. Methods 1998, 1, 82–112. [Google Scholar]
  18. Jain, A.K. Survey of bioaerosol in different indoor working environments in central India. Aerobiologia 2000, 16, 221–225. [Google Scholar] [CrossRef]
  19. Dutkiewicz, J.; Krysińska-Traczyk, E.; Prażmo, Z.; Skórska, C.; Sitkowska, J. Exposure to airborne microorganisms in Polish sawmills. Ann. Agric. Environ. Med. 2001, 8, 71–80. [Google Scholar]
  20. Dutkiewicz, J.; Krysińska-Traczyk, E.; Skórska, C.; Sitkowska, J.; Prażmo, Z.; Urbanowicz, B. Exposure of agricultural workers to airborne microorganisms and endotoxin during handling of various vegetable products. Aerobiologia 2000, 16, 193–198. [Google Scholar] [CrossRef]
  21. Adhikari, A.; Reponen, T.; Lee, S.A.; Grinshpun, S.A. Assessment of human exposure to airborne fungi in agricultural confinements: Personal inhalable sampling versus stationary sampling. Ann. Agric. Environ. Med. 2004, 11, 269–277. [Google Scholar]
  22. Dacarro, C.; Grisoli, P.; Del Frate, G.; Villani, S.; Grignani, E.; Cottica, D. Microorganisms and dust exposure in an Italian grain mill. J. Appl. Microbiol. 2005, 98, 163–171. [Google Scholar] [CrossRef]
  23. Góra, A.; Skórska, C.; Sitkowska, J.; Prażmo, Z.; Krysińska-Traczyk, E.; Urbanowicz, B.; Dutkiewicz, J. Exposure of hop growers to bioaerosols. Ann. Agric. Environ. Med. 2004, 11, 129–138. [Google Scholar]
  24. Krysińska-Traczyk, E.; Pande, B.N.; Skórska, C.; Sitkowska, J.; Prażmo, Z.; Cholewa, G.; Dutkiewicz, J. Exposure of Indian agricultural workers to airborne microorganisms, dust and endotoxin during handling of various plant products. Ann. Agric. Environ. Med. 2005, 12, 268–275. [Google Scholar]
  25. Skórska, C.; Golec, M.; Mackiewicz, B.; Góra, A.; Dutkiewicz, J. Health effects of exposure to herb dust in valerian growing farmers. Ann. Agric. Environ. Med. 2005, 12, 247–252. [Google Scholar] [PubMed]
  26. Tsapko, V.G.; Chudnovets, A.J.; Sterenbogen, M.J.; Papach, V.V.; Dutkiewicz, J.; Skórska, C.; Krysińska-Traczyk, E.; Golec, M. Exposure to bioaerosols in the selected agricultural facilities of the Ukraine and Poland—A review. Ann. Agric. Environ. Med. 2011, 18, 19–27. [Google Scholar]
  27. Czerwińska, E.; Piotrowski, W. Evaluation of the microbiological contamination risk in bakery taking into account processing of light rye bread. Nauka Przyr. Technol. 2010, 4, 2–14. [Google Scholar]
  28. Świątkowska, B. Occupational hazards of healthcare workers: What is known and what can be done? Probl. Hig. Epidemiol. 2010, 91, 522–529. [Google Scholar]
  29. Marchand, G.; Lavoie, J.; Lazure, L. Evaluation of Bioaerosols in a Municipal Solid Waste Recycling and Composting Plant. J. Air Waste Manage. Assoc. 2012, 45, 778–781. [Google Scholar] [CrossRef] [Green Version]
  30. Breza-Boruta, B.; Kroplewska, M.; Pastewska, A.; Szala, B. Sources of indoor air contamination and harmful effects of bioaerosol in agri-food processing plants. Res. Pap. Wrocław Univ. Econ. 2017, 494, 31–42. [Google Scholar] [CrossRef]
  31. Dutkiewicz, J.; Krysińska-Traczyk, E.; Skórska, C.; Cholewa, G.; Sitkowska, J. Exposure to airborne microorganisms and endotoxin in a potato processing plant. Ann. Agric. Environ. Med. 2002, 9, 225–235. [Google Scholar]
  32. Olborska, K.; Lewicki, P.P. Organization of Diary Products’ Packaging Process and It’s Influence for Microbiological Air Contamination in Production’s Rooms. Żywność Nauka-Technol. -Jakość 2006, 2, 246–254. [Google Scholar]
  33. Awad, A.H.A. Airborne dust, bacteria actinomycetes and fungi at a flourmill. Aerobiologia 2007, 23, 59–69. [Google Scholar] [CrossRef]
  34. Breza-Boruta, B.; Szala, B.; Kroplewska, M. Air on production lines of a meat processing plant as a source of microbial contamination. Res. Pap. Wrocław Univ. Econ. 2016, 461, 42–54. [Google Scholar]
  35. Marosz, A.; Breza-Boruta, B.; Kroplewska, M. Occurrence of Potentially Pathogenic Bacteria In The Air on Production Lines of The Fish Processing Plant. Res. Pap. Wrocław Univ. Econ. 2017, 494, 132–142. [Google Scholar] [CrossRef]
  36. Rożej, A.; Dudzińska, M.; Gąska-Jędruch, U. Seasonal Variation and Size Distribution of Bioaerosols in the Air-Conditioned Auditorium. In Management of Indoor Air Quality; Dudzińska, M., Ed.; Taylor & Francis Group: London, UK, 2011. [Google Scholar]
  37. Tseng, C.H.; Wang, H.C.; Xiao, N.Y.; Chang, Y.M. Examining the feasibility of prediction models bymonitoring data and management data for bioaerosols inside office buildings. Build. Environ. 2011, 46, 2578–2589. [Google Scholar] [CrossRef]
  38. Frąk, M.; Majewski, G.; Zawistowska, K. Analysis of the quantity of microorganisms adsorbed on particulate matter PM10. Sci. Rev. Eng. Env. Sci. 2014, 64, 140–149. [Google Scholar]
  39. Augustyńska, D.; Pośniak, M. Interministerial Commission for the Maximum Allowable Concentrations and Intensity of Factors Harmful to Health in the Work Environment: Harmful Factors in the Work Environment—Limit Values; CIOP-PIB: Warsaw, Poland, 2016. [Google Scholar]
  40. Coccia, A.M.; Gucci, P.M.B.; Lacchetti, I.; Paradiso, T.; Scaini, F. Airborne microorganisms associated with waste management and recovery: Biomonitoring methodologies. Ann. Ist. Super. Sanita. 2010, 46, 288–292. [Google Scholar] [CrossRef]
  41. Frączek, K.; Górny, R.L. Microbial air quality at Szczawnica sanatorium, Poland. Ann. Agric. Environ. Med. 2011, 18, 63–71. [Google Scholar]
  42. Mackiewicz, B. Organic dust in the work environment and its influence on human organism. Bezpieczeństwo Pr. 2014, 4, 32–34. [Google Scholar]
  43. Pastuszka, J.S.; Ulfig, K.; Wlazło, A.; Brągoszewska, E. Occupational exposure to bacterial and fungal aerosol of the municipal landfill workers: Case-study for the landfill in Sosnowiec. Ochr. Powietrza Probl. Odpad. 2011, 45, 103–113. [Google Scholar]
  44. Kucharska, K.; Wachowska, U. The microbiome on the leaves of crop plants. Post. Mikrobiol. 2014, 53, 352–359. [Google Scholar]
  45. Sykes, P.; Morris, R.H.K.; Allen, J.A.; Wildsmith, J.D.; Jones, K.P. Workers’ exposure to dust, endotoxin and β-(1–3) glucan at four large-scale composting facilities. Waste Manag. 2011, 31, 423–430. [Google Scholar] [CrossRef]
  46. Michalak, A.; Pawlas, K. Endotoxins as a source of environmental and occupational hazard to human health. Environ. Med. 2013, 16, 7–13. [Google Scholar]
  47. Libudzisz, Z.; Kowal, K.; Żakowska, Z. Technical microbiology. In Microorganisms and Their Environment; PWN: Warsaw, Poland, 2009. [Google Scholar]
  48. Gołofit-Szymczak, M.; Ławniczek-Wałczyk, A. Biomass as a source of biological hazards. Bezpieczeństwo Pr. 2011, 12, 17–19. [Google Scholar]
  49. Clauß, M. Particle size distribution of airborne microorganisms in the environment—A review. Appl. Agric. Forestry Res. 2015, 65, 77–100. [Google Scholar] [CrossRef]
Figure 1. Herbal plant scheme (top view on the respective floors of the plant).
Atmosphere 14 00123 g001
Figure 2. Average concentrations of bacterial aerosols (cfu·m−3) (± standard deviation, SD) in the external environment and the production rooms of a herbal processing plant: spring season. * averages marked with the same letters are not significantly different by Tukey’s test (α = 0.05).
Atmosphere 14 00123 g002
Figure 3. Average concentrations of bacterial aerosols (cfu·m−3) (± standard deviation, SD) in the external environment and the production rooms of the herbal processing plant: summer season. * averages marked with the same letters are not significantly different by Tukey’s test (α = 0.05).
Atmosphere 14 00123 g003
Figure 4. Average concentrations of bacterial aerosols (cfu·m−3) (± standard deviation, SD) in the external environment and the production rooms of the herbal processing plant: autumn season. * averages marked with the same letters are not significantly different by Tukey’s test (α = 0.05).
Atmosphere 14 00123 g004
Figure 5. Average concentrations of bacterial aerosols [cfu·m−3] (± standard deviation, SD) in the external environment and the production rooms of the herbal processing plant: winter season. * averages marked with the same letters are not significantly different by Tukey’s test (α = 0.05).
Atmosphere 14 00123 g005
Figure 6. Percentage of bacterial species isolated from the air collected at the measuring points in the herbal processing plant: indoor air.
Atmosphere 14 00123 g006
Figure 7. Percentage of bacterial species isolated from the air collected at the measuring points in the herbal processing plant: outdoor air.
Atmosphere 14 00123 g007
Figure 8. Particle size distributions of bacterial aerosols in the measuring seasons—(a) spring, (b) summer, (c) autumn, (d) winter—in three groups of measuring points: ¬ external background, ¬ internal background, ¬ production rooms in a herbal processing plant.
Atmosphere 14 00123 g008
Table 1. The concentration of bacteria (median and range, cfu·m−3) at a herbal processing plant in four seasons.
MicroorganismsConcentration (cfu·m−3)
SpringSummerAutumnWinter
MedianRangeMedianRangeMedianRangeMedianRange
total number of bacteria720186–3214884479–3817619134–318940345–2800
Table 2. Values of air microclimatic parameters in the external and internal environment of a herbal processing plant in four seasons.
Measuring PointSeasonTemperature (°C)Relative Humidity (%)
MedianRangeMedianRange
External backgroundspring19.018.3–19.355.649.6–61.1
summer21.920.4–27.248.944.3–56.7
autumn14.412.8–15.063.351.2–69.4
winter2.71.9–4.661.451.2–69.8
Internal backgroundspring19.919.1–20.542.740.4–46.8
summer21.821.2–24.451.842.4–59.9
autumn18.418.1–18.863.355.5–70.1
winter17.616.4–18.137.732.2–52.3
Production roomsspring22.220.0–26.352.946.7–64.6
summer23.320.6–25.353.349.4–61.6
autumn18.615.9–19.845.132.8–76.0
winter15.212.9–20.145.125.8–54.8
Table 3. The particulate matter concentration (mg·m−3) in the external and internal environment of a herbal processing plant in four seasons: (a)—external background, (b)—internal background, (c)—production rooms.
(a)
Particulate
Matter Fraction
Concentration (mg·m−3)
SpringSummerAutumnWinter
MedianRangeMedianRangeMedianRangeMedianRange
10.0 µm0.1910.184–0.1990.1080.088–0.1260.0610.050–0.0710.1700.156–0.178
4.0 µm0.1900.178–0.1970.1070.087–0.1240.0600.045–0.0690.1640.151–0.172
2.5 µm0.0790.070–0.0880.1060.085–0.1220.0590.044–0.0660.1560.150–0.159
1.0 µm 0.0100.009–0.0210.0970.081–0.1200.0590.043–0.0630.1330.123–0.139
(b)
10.0 µm0.1290.120–0.1330.1180.094–0.1300.0920.081–0.1030.1250.120–0.129
4.0 µm0.1190.107–0.1250.1140.091–0.1280.0750.059–0.0900.1240.118–0.127
2.5 µm0.1170.105–0.1200.1090.090–0.1150.0740.058–0.0880.1160.110–0.125
1.0 µm 0.1050.090–0.1110.1030.088–0.1130.0670.055–0.0780.1030.101–0.106
(c)
10.0 µm0.0820.045–0.1520.1500.085–0.8700.0800.056–0.0890.2460.150–0.256
4.0 µm0.0770.043–0.1000.1480.080–0.4170.0750.054–0.0850.2360.146–0.250
2.5 µm0.0730.042–0.0970.1420.078–0.4150.0740.053–0.0840.2330.144–0.250
1.0 µm 0.0650.040–0.0820.1410.075–0.3950.0730.052–0.0790.2190.133–0.235
Disclaimer/Publisher’s Note: The statements, opinions and data contained in all publications are solely those of the individual author(s) and contributor(s) and not of MDPI and/or the editor(s). MDPI and/or the editor(s) disclaim responsibility for any injury to people or property resulting from any ideas, methods, instructions or products referred to in the content.

