Article

Evaluation of Advanced Diesel Particulate Filter Concepts for Post Euro VI Heavy-Duty Diesel Applications

1
Corning GmbH, 65189 Wiesbaden, Germany
2
Corning Inc., Painted Post, NY 14870, USA
3
European Commission, Joint Research Centre, 21027 Ispra, Italy
*
Author to whom correspondence should be addressed.
Atmosphere 2022, 13(10), 1682; https://doi.org/10.3390/atmos13101682
Submission received: 21 September 2022 / Revised: 7 October 2022 / Accepted: 12 October 2022 / Published: 14 October 2022
(This article belongs to the Special Issue Vehicle Emissions: New Challenges and Potential Solutions)

Abstract

:
The European Commission (EC) is in the process of finalizing the proposal for the upcoming legislative stage for light- and heavy-duty vehicles. The emission performance over extended operating conditions is under consideration. Furthermore, a tightening of the Solid Particle Number (SPN) limits with a parallel shift of the lowest detectable size from 23 to 10 nm has been suggested. This paper investigates the SPN emission performance of a Euro VI step E HDV and the potential offered by an advanced Diesel Particulate Filter (DPF) to meet the upcoming regulations. Cold start emissions at clean DPF state were found to be as high as 1.3 × 10¹² #/kWh, while passive regeneration events could lead to hot start emissions of 3 × 10¹¹ #/kWh. Improvements in the filtration efficiencies at clean state, similar to those offered by the advanced DPF (>99%), will be needed to tackle these operating conditions. The measurements also revealed the formation of 10 nm SPN in the Selective Catalytic Reduction (SCR) system, at a rate of ~1.2 × 10¹¹ #/kWh. These levels lie above the proposed limit of 1011 #/kWh, highlighting the need to also control these non-volatile nanosized particles.

1. Introduction

Airborne Particulate Matter (PM) is one of the most detrimental pollutants to human health. Both short- and long-term exposure have been linked to increased mortality [1,2]. Road traffic was long identified as a main source of ambient PM concentrations [3], especially in urban areas where it was reported to exceed 50% in some cases [4]. Heavy-Duty Vehicles (HDV) were reported to contribute from 40 to 60% of the road transport PM, despite constituting less than 5% of the vehicle fleet [5]. The introduction of progressively stricter emission standards has proven to be very efficient in decreasing road-transport PM [6]. The widespread application of Diesel Particulate Filters (DPFs) has been identified as an essential technology in enabling further reductions in traffic-related PM emissions [7].
The number concentration of the ambient ultrafine particles is drawing more attention. The latest guidelines from the World Health Organization (WHO) recommend the measurement of their number concentration at monitoring stations and, in addition, further specified 1000 cm−3 as a low 24-h average concentration, even if urban background levels typically exceed 10,000 cm−3 [8]. The number of ultrafine particles was found to be more directly affected by road transport, while mass was dominated by aged and transported aerosols [9].
The European Commission (EC) was the first to regulate exhaust particle number emissions, initially in 2011 for diesel light duty vehicles [10] and subsequently for heavy-duty engines [11,12], direct-injection gasoline vehicles [13] and non-road engines [14], in 2013, 2014 and 2019, respectively. The (chassis/engine) dynamometer-based methodology was later augmented to also include on-board measurements using Portable Emission Measurement Systems (PEMS) [11,15,16,17,18,19,20]. Since then, regulatory authorities in other regions of the world, including Korea, Singapore, India and China, have implemented various aspects of the European regulation [21].
The particle number methodology is targeting Solid Particle Number (SPN) emissions. These are defined as the particles thermally treated in an evaporation tube at 300–400 °C, and a size of approximately 23 nm and larger, hereinafter SPN23. Over the last few years, the specifications have been subject to thorough review and recently a number of improvements have been documented in an updated Global Technical Regulation (GTR) [21]. A notable addition is the provisions for measurements with a particle counter counting from 10 nm (SPN10) and the inclusion of a catalytically active evaporation tube [22]. Work is currently underway to harmonize the specifications for laboratory and PEMS instrumentation.
The EC is in the process of elaborating the next regulatory step (Euro 7). While the final proposal is not yet published, the key elements were presented in workshops organized by the EC [23,24,25,26]. In the heavy-duty sector, a reduction in both NOx and SPN limits was considered, together with the transition from SPN23 to SPN10 [23,26]. In addition, there were provisions for extension of the In-Service Conformity (ISC) testing to cover a wider range of operating conditions. On-road measurements with PEMS and evaluation with the Moving Average Window (MAW) will continue to form the basis for the assessment of the emission performance, however, without restrictions applied on the duration of the test. A distinction is foreseen between short and long trips, with a budget value (2 × 10¹¹ #/kWh) suggested for the former. In the case of long trips, separate limits were proposed for the 100th percentile (5 × 10¹¹ #/kWh) and 90th percentile (1011 #/kWh) of MAWs from the entire test. The proposed limits are stricter than the current limit of 6 × 10¹¹ #/kWh which is based on a weighting of cold-start and hot-start emissions of 14% and 86%, respectively. Furthermore, no provision for the measurement uncertainty of PEMS instrumentation (currently allowing for an extra margin of 63% [27]) is anticipated [23].
The tightening of the limits accompanied with the shift to SPN10 is expected to necessitate performance improvements in heavy-duty Diesel Particulate Filters (DPF). For example, a study [28] summarized experimental SPN results from 17 Euro VI technology heavy-duty trucks and buses tested both on a chassis dyno and on the road. The reported SPN23 emission levels ranged from 5 × 10¹⁰ #/kWh to 2 × 10¹² #/kWh depending on the DPF fill state, test cycle and ambient temperature. Elevated formation of sub-23 nm particles during hot operation was reported, with SPN10 exceeding SPN23 by up to 200% at SPN23 levels of 1011 #/kWh. This increase was attributed to particles forming inside the Selective Catalytic Reduction (SCR) system.
Particle formation inside the SCR has been the subject of several recent studies. The particle formation was attributed to both the gas-phase production of nitrates and sulfates [29], but also to byproducts of urea decomposition [30]. Changes in the particle charge state as a function of exhaust temperature were also reported, potentially indicating different formation pathways depending on the exhaust conditions [31]. Size distribution measurements suggested a mode below 20 nm, with typical exhaust SPN10 concentrations in the range of several tenths of thousand #/cm3 [31,32]. Some studies [33,34] reported considerably higher concentrations under specific operating conditions, although these were associated with volatile artefacts.
The main objective of this paper is to thoroughly characterize the SPN emissions of a late technology Euro VI step E diesel truck and identify critical operating conditions in view of the post Euro VI regulation. The emission improvement potential offered by a novel DPF, capable of achieving more than 99% filtration efficiency at clean state, is also assessed both in place of the original filter but also as a dedicated technical solution for the particles forming in the SCR. Measurements are conducted on a chassis dyno as it offers a tighter control of the operating conditions between repetitions with different aftertreatment layouts. In addition, it allows for the use of laboratory grade instrumentation, capable of handling the overpressures introduced by the aftertreatment components. Four SPN instruments of the same design, each capable of parallel 10 nm and 23 nm measurements, are installed at different sections of the aftertreatment layout, allowing for an accurate quantification of the filtration efficiencies and the concentrations of particles forming inside the SCR. The parallel measurement of SPN10 and SPN23 also provides quantitative information on the size of emitted particles. Adjustments of the operating temperatures of the SPN instruments also allow for the assessment of the volatility of particles produced in the SCR.

2. Materials and Methods

2.1. Vehicle

The HDV tested was a 4 × 2 tractor equipped with a 12.8 L diesel engine homologated to Euro VI step E. The rated power of the engine was 375 kW at 1700 rpm. The reference work over the World Harmonized Transient Cycle (WHTC) was calculated in accordance to regulation 595/2009 [35] to be 37.5 kWh. The vehicle had an accumulated mileage of ~22,000 km at the start of the campaign. All tests were performed with commercial diesel fuel (fulfilling EN590 specifications) and AdBlue urea solution.

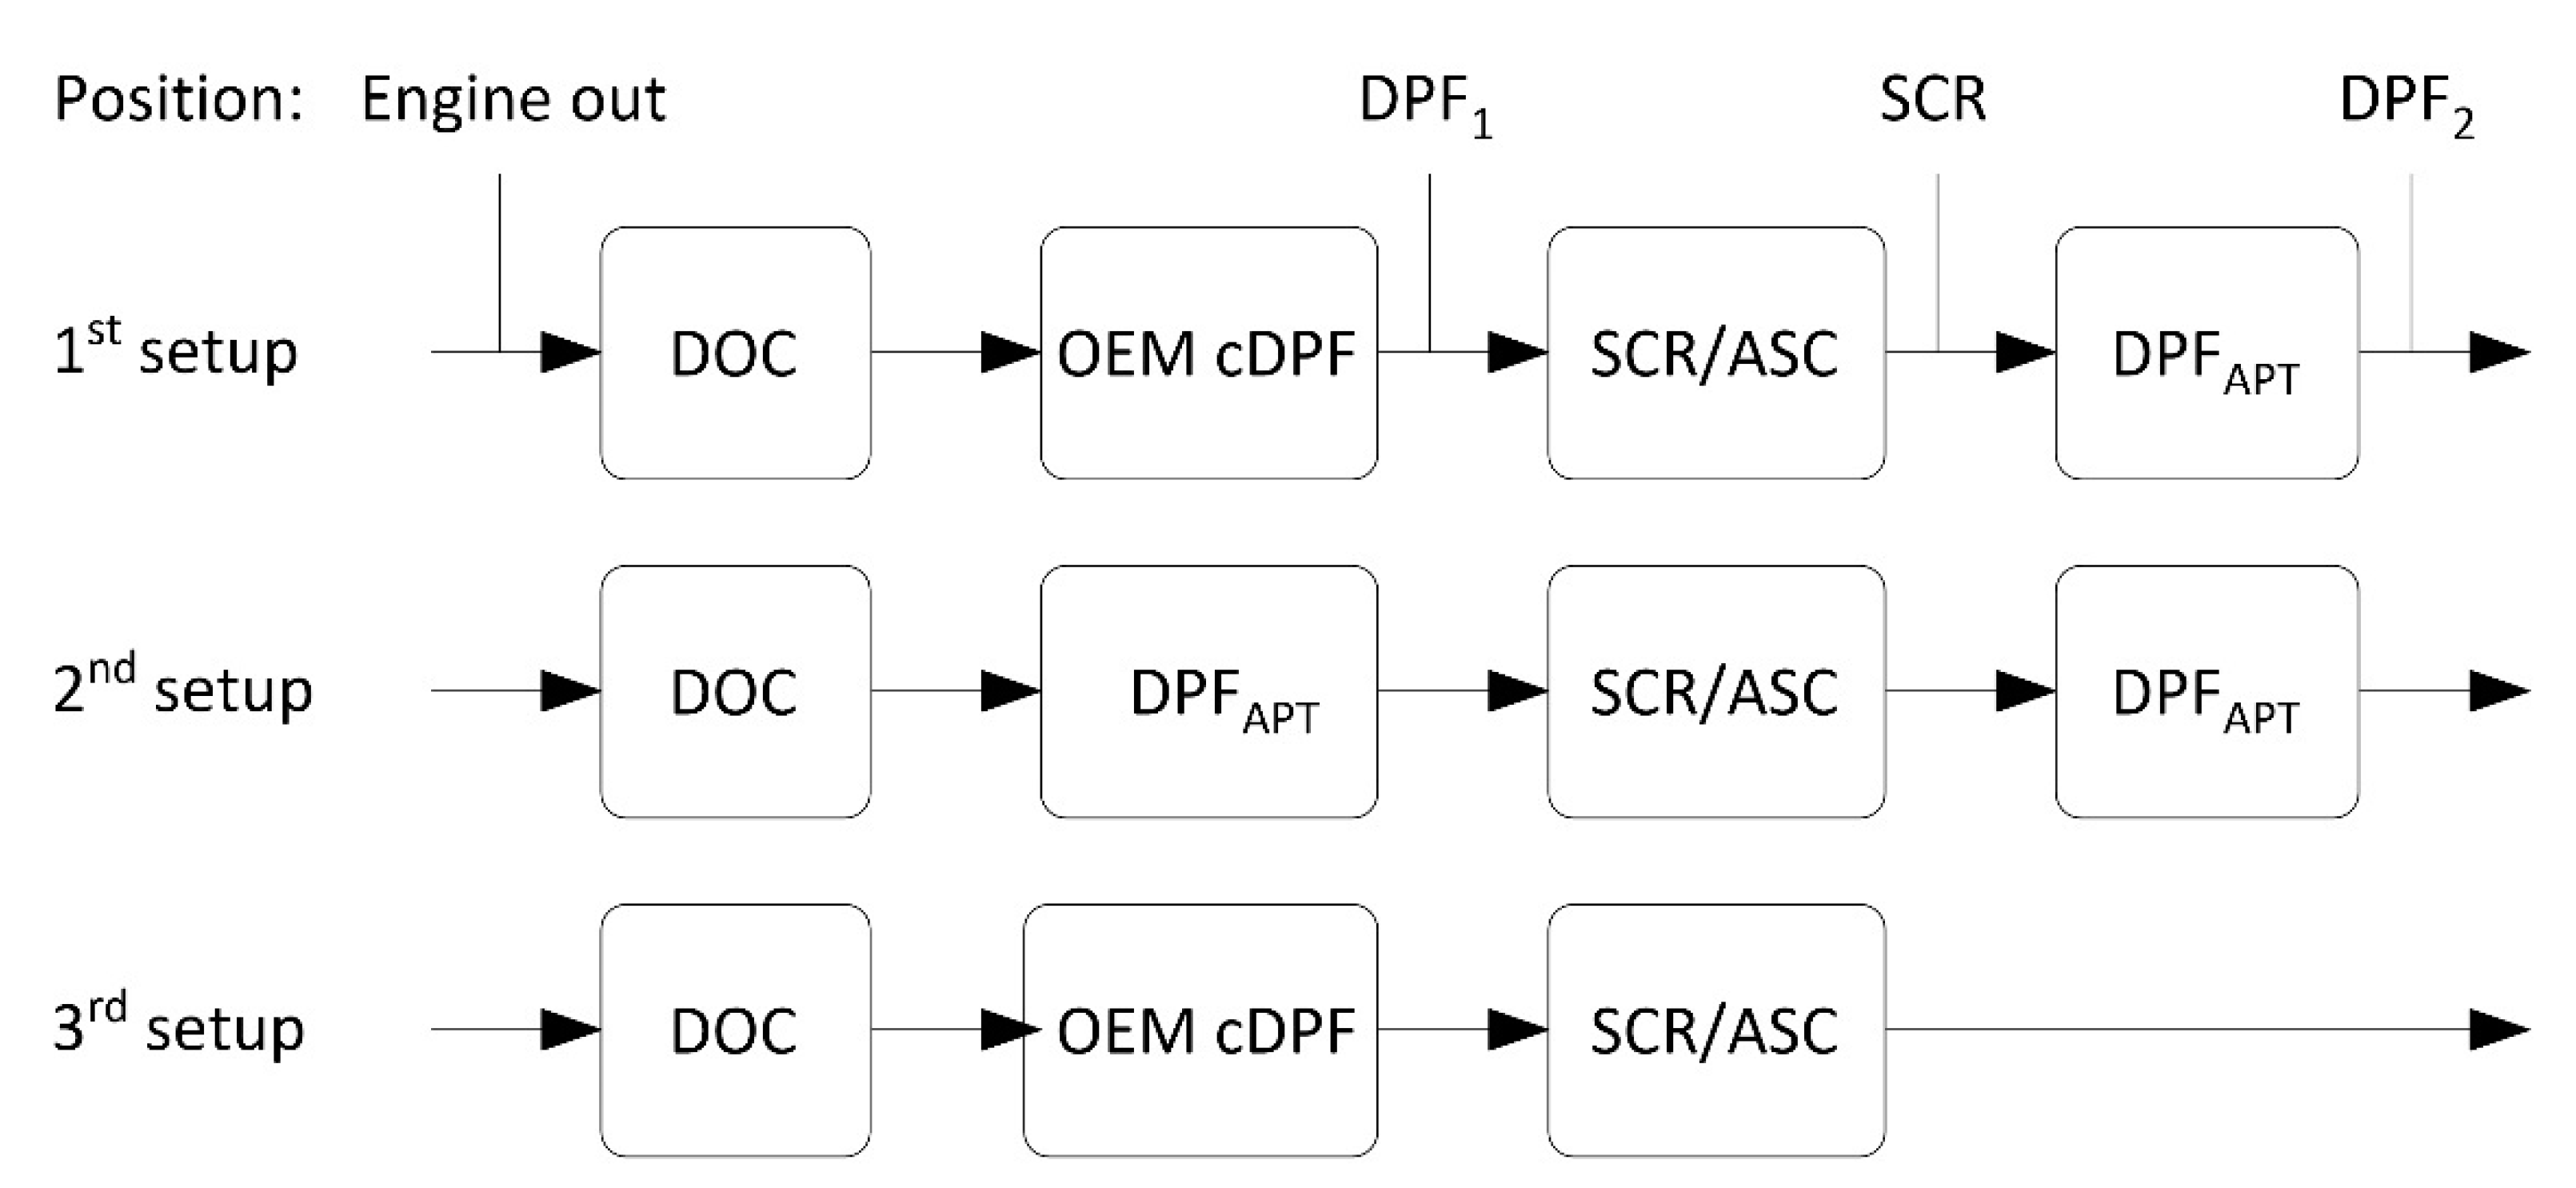
2.2. Emission Control System

The Original Equipment Manufacturer (OEM) aftertreatment system of the vehicle consisted of a Diesel Oxidation Catalyst (DOC) followed by a catalyzed DPF (cDPF) (DPF1 position) and an SCR plus Ammonia Slip Catalyst (ASC) (SCR position).
Two prototype 11.25″ × 6″ cordierite wall-flow filters with a cell density of 300 cpsi and a nominal web thickness of 9 mil were tested, one downstream of the ASC (DPF2 position) and the other in place of the original 12″ × 12″ DPF. The two filters were processed via Corning’s proprietary Accelerated Purification Technology (APT), resulting in a hierarchical microstructure with smaller pore sizes at the surface compared to the bulk of the wall [36]. This technology allows for enhanced filtration efficiency of unloaded filters at a target pressure drop. The tested DPFAPT concept samples were uncoated, since coated samples were not available at the time of testing. However, the same advanced technology will be available for coated samples and will be used in future studies.
Three different aftertreatment layouts were tested. These are summarized in Figure 1, which also illustrates the different sampling locations. One DPFAPT was assembled in a dedicated canning installed at the outlet of the vehicle aftertreatment box (first setup). The other DPFAPT was assembled using the same canning used for the OEM cDPF allowing installation in its place (second setup). Selected tests were performed with the OEM configuration (third setup) to allow for an evaluation of the fuel consumption penalty introduced by the second DPFAPT.

2.3. Test Protocol

The truck was tested under the Worldwide Harmonized Vehicle Cycle (WHVC) and a pre-determined In-Service Conformity (ISC) cycle developed at JRC for this class of vehicles, namely N3 [37]. The cycle is split into an urban (27.1%), a rural (26.4%) and a motorway (46.5%) section with the average speeds being 22.9, 58.8 and 79.8 km/h, respectively. The WHVC is a chassis dynamometer test which is based on the same database used for the development of the engine type approval World Harmonized Transient Cycle (WHTC) [38]. No slope was added over the WHVC cycle. Dedicated speed ramp tests in the sequence of 30, 60, 90, 60 and finally 30 km/h were additionally performed to investigate the volatility of particles formed in the SCR (Section 4.2). Figure 2 compares the velocity profiles and corresponding engine operating maps of the ISC and WHVC cycles. Tests were run with cold engine (i.e., coolant temperature close to the ambient temperature, so always below 30 °C, as prescribed by the Regulation) or with hot engine (i.e., coolant temperature > 70 °C).
The aftertreatment system was conditioned at the end of each measuring day by running the truck at 80 km/h and with a full load to force passive regeneration. The duration of the conditioning ranged between 10 and 30 min, until the Electronic Control Unit (ECU) signal for the soot loading in the first DPF dropped to 10%. The real time SPN signals served as a visual inspection of the progress of the regeneration, with the concentrations gradually increasing and then stabilizing for at least 5 min to the peak concentration corresponding to a given aftertreatment configuration. At the end of the conditioning, the vehicle was soaked at the targeted test temperature for at least 12 h.
The exact test sequence is summarized in Table 1. Each measurement day started with either a WHVC or an ISC cycle following soaking at the targeted temperature. Besides the conditioning tests, all measurements were performed with a simulated 29 ton payload on the dyno, which corresponded to ~66% of the maximum permissible laden mass of the truck (44 tons).

2.4. Measurement Instrumentation

SPN emissions were measured with four in total Advanced Particle Counters (APC model 489) (AVL GmbH, Graz, Austria), each equipped with both a 10 nm and 23 nm Condensation Particle Counter (CPC). The APC consisted of a chopper diluter operating at 150 °C, followed by a Volatile Particle Remover (VPR) at 350 °C and a simple mixer diluter at ambient temperature [39]. Three APCs were equipped with a Catalytic Stripper (CSi, i = 1, 2, 3) and were thus compliant with the requirements laid down in the consolidated resolution for 10 nm SPN measurements for heavy-duty vehicles [21]. One APC employed an Evaporating Tube (ET). However, due to indications of volatile artefacts (Section 4.3) it was augmented with an external Catalytic Stripper (ext. CS) (Catalytic Instruments GmbH) at the inlet of the 10 nm CPC and was shifted to engine out position. The Particle Concentration Reduction Factors (PCRF) were set at 3000 upstream of the DPF1 and 500 in all post-DPF1 positions. Not all APCs were available from the beginning of the program. Table 2 provides an overview of the instrumentation layout during the campaign.
Additional pressure sensors and thermocouples were employed to monitor the pressure and temperature at the inlet of the DOC, the inlet of the SCR as well as the inlet and outlet of the second DPF. An additional thermocouple was installed close to the tip of the urea injector. The sharp drop in the thermocouple temperature reading during urea injection allowed for the identification of the start of urea dosing.
Criteria gas pollutants such as NOx, CO, HC and CH4, as well as CO2 and O2, were also measured using two AVL AMA i60 analyzers sampling raw exhaust from different measurement locations. The gaseous emissions are discussed elsewhere. In the frame of this study, the analyzers were used to compare the CO2 emissions for the different configurations evaluated.

2.5. Evaluation Methodology

The concentrations reported from the APCs were corrected with the calibrated average Particle Concentration Reduction Factors (PCRF) at 30, 50 and 100 nm and the slopes of the connected CPCs. An additional correction of the average losses at 30, 50 and 100 nm in the ext. CS was employed for the 10 nm CPC of the ET. The combined losses for this configuration (ET + ext. CS) exceeded the thresholds specified in the global technical regulation [21] for 10 nm measurements. However, this configuration was only employed for the quantification of engine-out emission levels where the fraction of sub-23 nm particles was low (SPN10/SPN23 ratios of ~1.2) and therefore the effect of excessive losses in the sub-23 nm range was anticipated to be minor. All concentrations were normalized at 0 °C and 1 atm. The necessary exhaust flow, brake-torque and engine speed signals for the calculation of the brake-specific emissions were obtained from the ECU.
Two approaches were followed for the calculation of the emissions to account for the differences between the type-approval Euro VI step E regulation and the proposed post Euro VI methodology [23]. In all cases, the SPN concentrations were first time aligned with the exhaust flow signal and, subsequently, multiplied to calculate the instantaneous emission rates in s−1.

2.5.1. Euro VI Step E Approach

The Moving Average Window (MAW) methodology as described in the Euro VI step E regulation [19] was used for the evaluation of the ISC emission results. MAWs of a length equal to the reference work were calculated, starting from the time when the engine coolant temperature reached 30 °C (which took less than 10 min in all tests) and proceeding at increments of 1 s. The average brake power from all MAWs was above the 10% of the maximum engine power and therefore all MAWs were included in the analysis. The largest value of the MAWs during the period where the coolant temperature remained below 70 °C defined the cold-start emissions. The 90th cumulative percentile of all valid MAWs of windows obtained after the coolant reached 70 °C constituted the hot-start emissions. Final results were derived by weighting the cold- and hot-start results by 14% and 86%, respectively.
WHVC tests were treated as surrogates of the engine type-approval WHTC procedure. In that respect, the brake-specific emissions over the entire cycle were derived by summing the instantaneous emission rates and dividing with the total brake-work over the cycle. A weighting of 14% and 86% was applied over the WHVC cold and WHVC hot cycles, respectively, in accordance to the regulation for engines.

2.5.2. Proposed Post Euro VI Approach

Based on the proposals during the stakeholders’ meetings, the MAW also forms the basis for the quantification of emissions. The main difference compared to the Euro VI step E approach is that the evaluation starts from engine ignition and includes all the windows. Furthermore, a distinction is made between short and long trips, depending on whether the total engine work is less than three times the reference work (Wref) over the World Harmonized Test Cycle (WHTC). It was proposed that the total number of SPN10 particles during short tests should lie below a budget value of 2 × 10¹¹ #/kWh × 3 × Wref. Longer tests should comply with both a MAW 90th and a 100th cumulative percentile limit of 1 × 10¹¹ #/kWh and 5 × 10¹¹ #/kWh, respectively.
Accordingly, the ISC is a long trip, so the results were processed using the 100th and 90th cumulative percentile. The WHVC on the other hand corresponds to a short-trip and as such a budget limit would be applicable. The WHVC emissions were therefore evaluated as the sum of instantaneous emission rates divided by three times the reference work.

3. Results

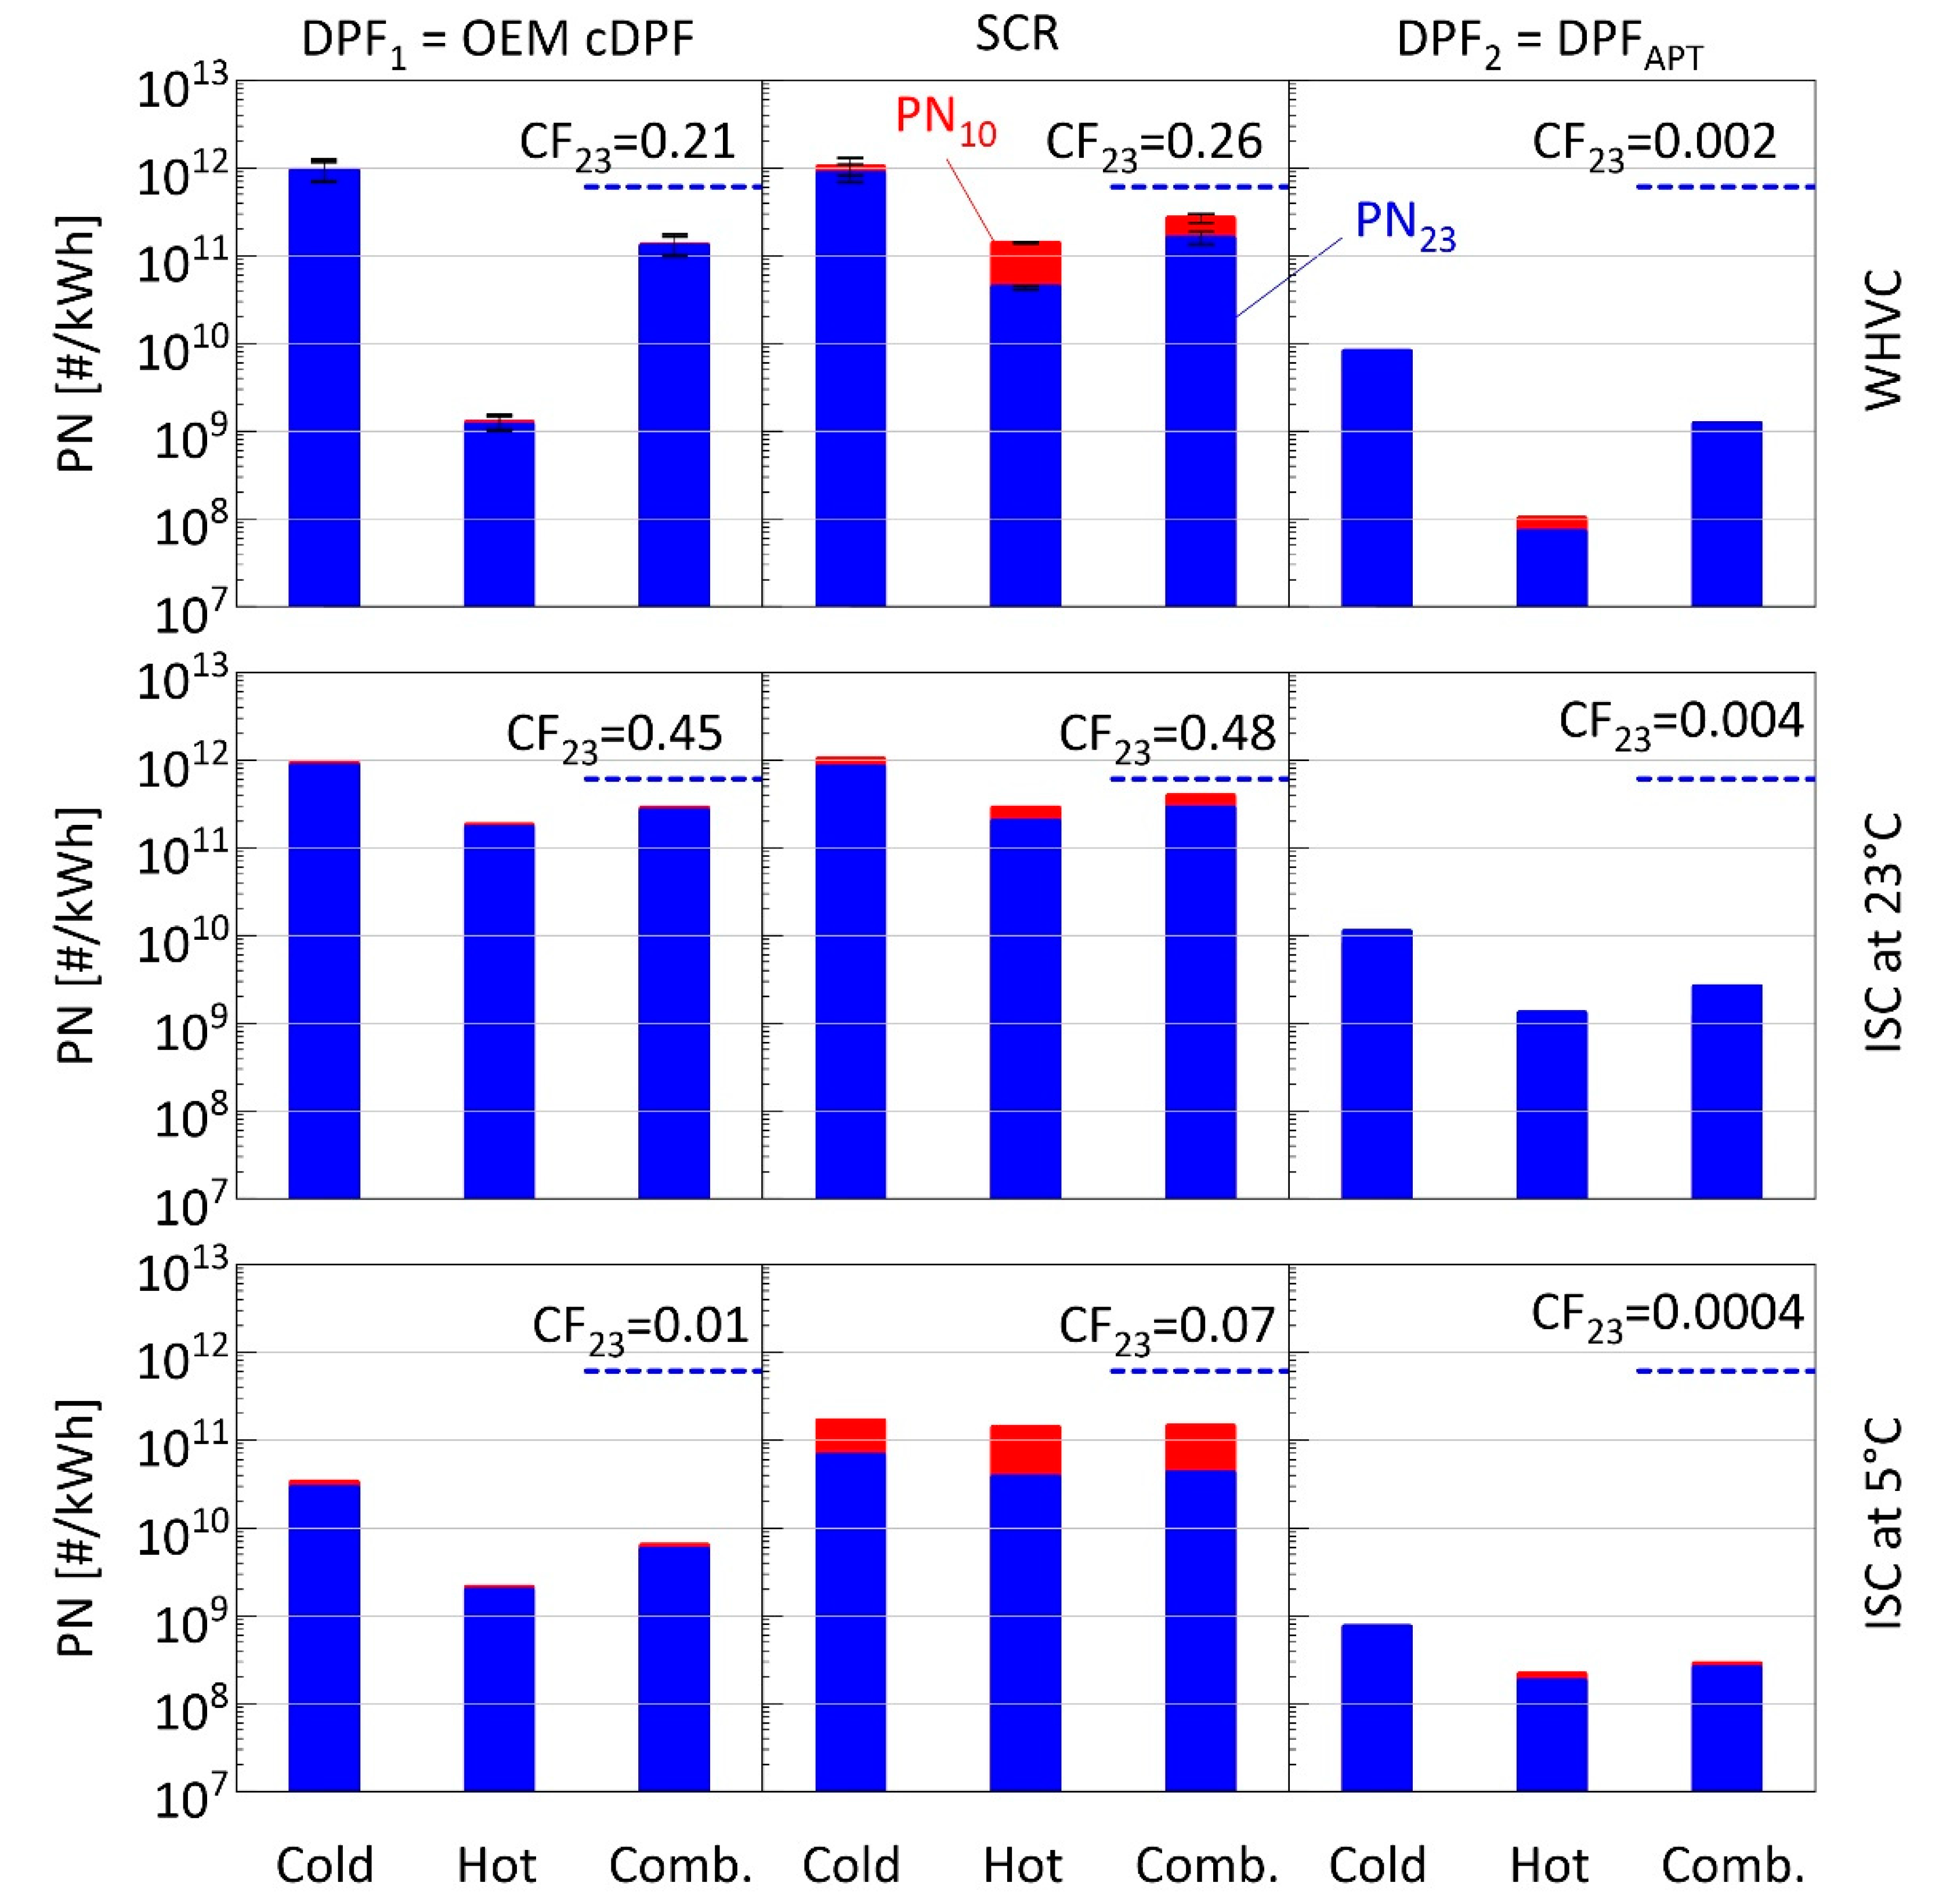
3.1. Emission Performance of the OEM Aftertreatment Layout following the Euro VI Step E Evaluation

Figure 3 provides a summary of the emission results evaluated according to the Euro VI step E methodology for the tests with the OEM cDPF. The SPN23 emissions of the vehicle in its OEM aftertreatment configuration (SCR out) were found to be below the currently applicable emission limits under all operating conditions.
The four repetitions of the WHVC tests revealed a strong effect of cold-start operations at DPF1 location, with cold-start WHVC SPN23 emissions averaging at 9.1 × 10¹² #/kWh compared to 1.2 × 10⁹ #/kWh over the hot-start tests. SPN10 emissions were only ~5% higher than SPN23 at this location for the cold-start WHVC. A large increase in SPN23 (~3600%) and especially in SPN10 (~11,000%) took place inside the SCR over the WHVC-hot. The effect of SCR on the WHVC-cold results was modest (−6% for SPN23 and +5% for SPN10) and within the experimental accuracy of PN measurements [40,41]. Accordingly, the weighted results were little affected by the increase observed over the WHVC-hot owing to the still one order of magnitude higher emissions over WHVC-cold. The installation of a DPFAPT downstream the SCR brought the emissions at levels nearly three orders of magnitude below the Euro VI limit. The actual filtration efficiency was 99.2% over the WHVC-cold and 99.9% over the WHVC-hot.
Large differences were observed between the two repetitions of the ISC tests, with the one performed at 5 °C ambient temperature yielding approximately one order of magnitude lower results. It should be stressed that the cold ISC results only consider the MAW from the point where the coolant temperature reached 30 °C, as described in the Euro VI step E regulation. The coolant temperature at engine start was 30 °C and 7 °C for the tests at 23 °C and 5 °C, respectively. This effectively resulted in the exclusion of the first approximately 200 s from the ISC test at 5 °C while no data were excluded for the ISC test at 23 °C.

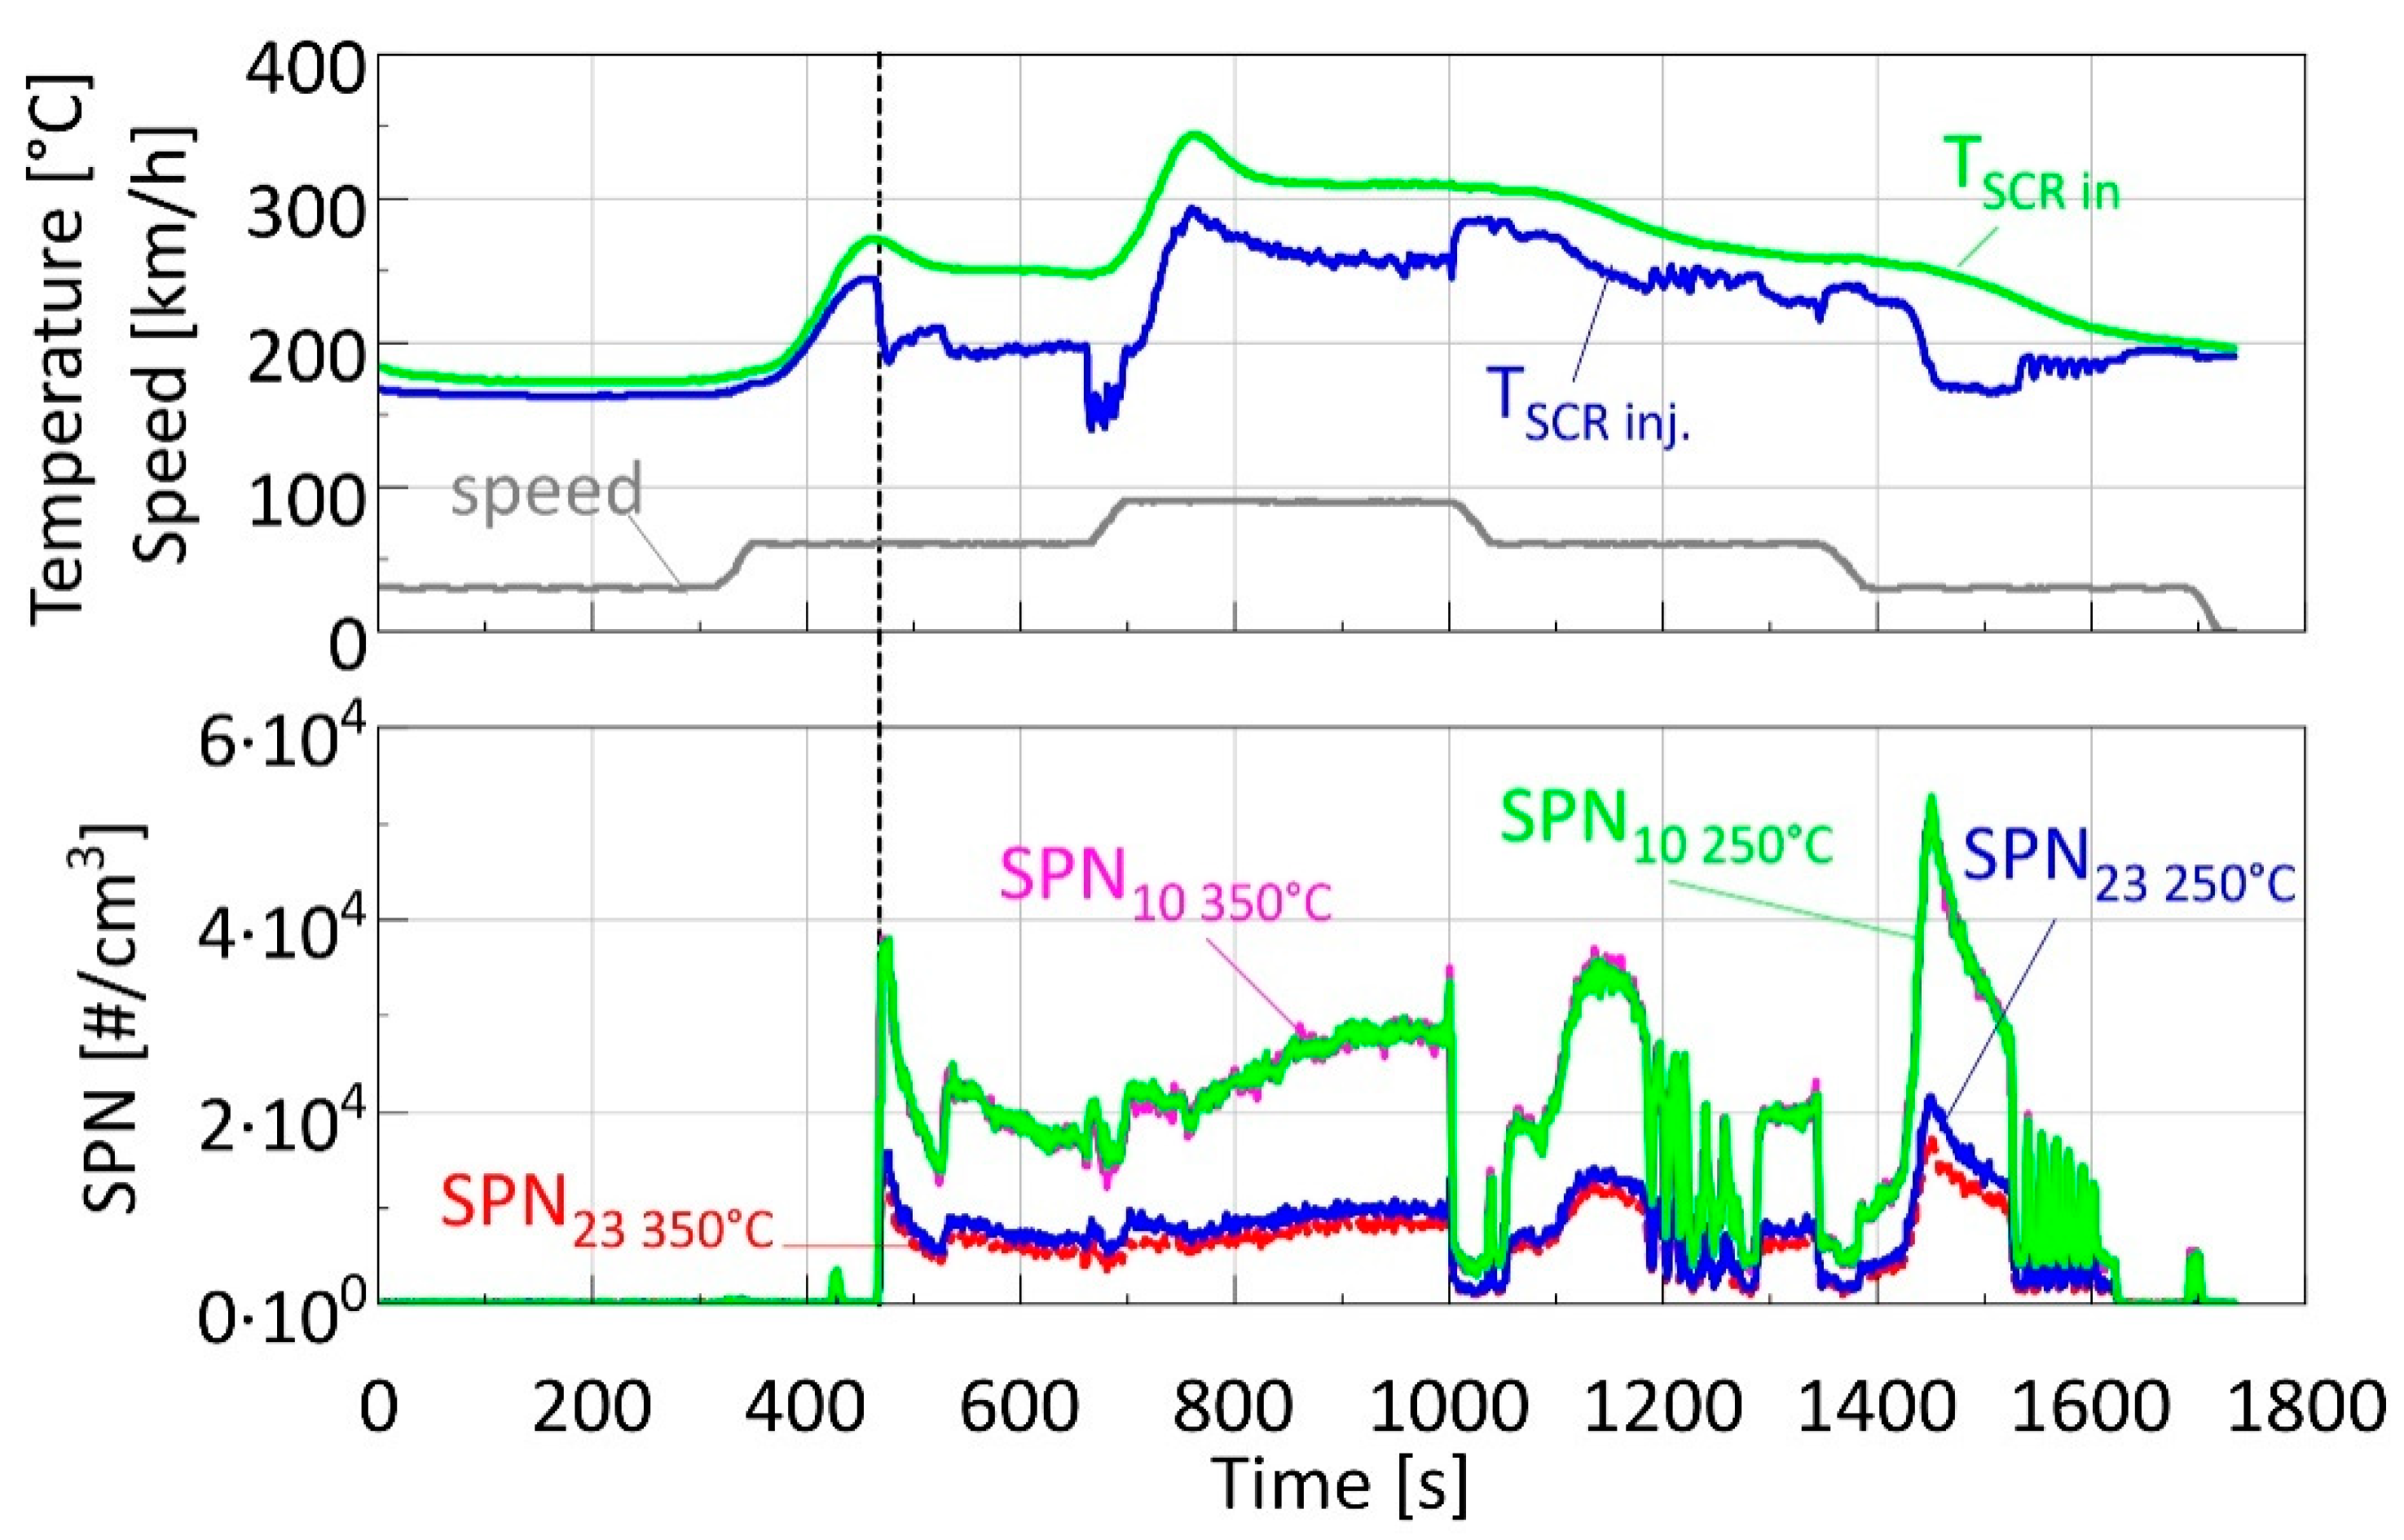
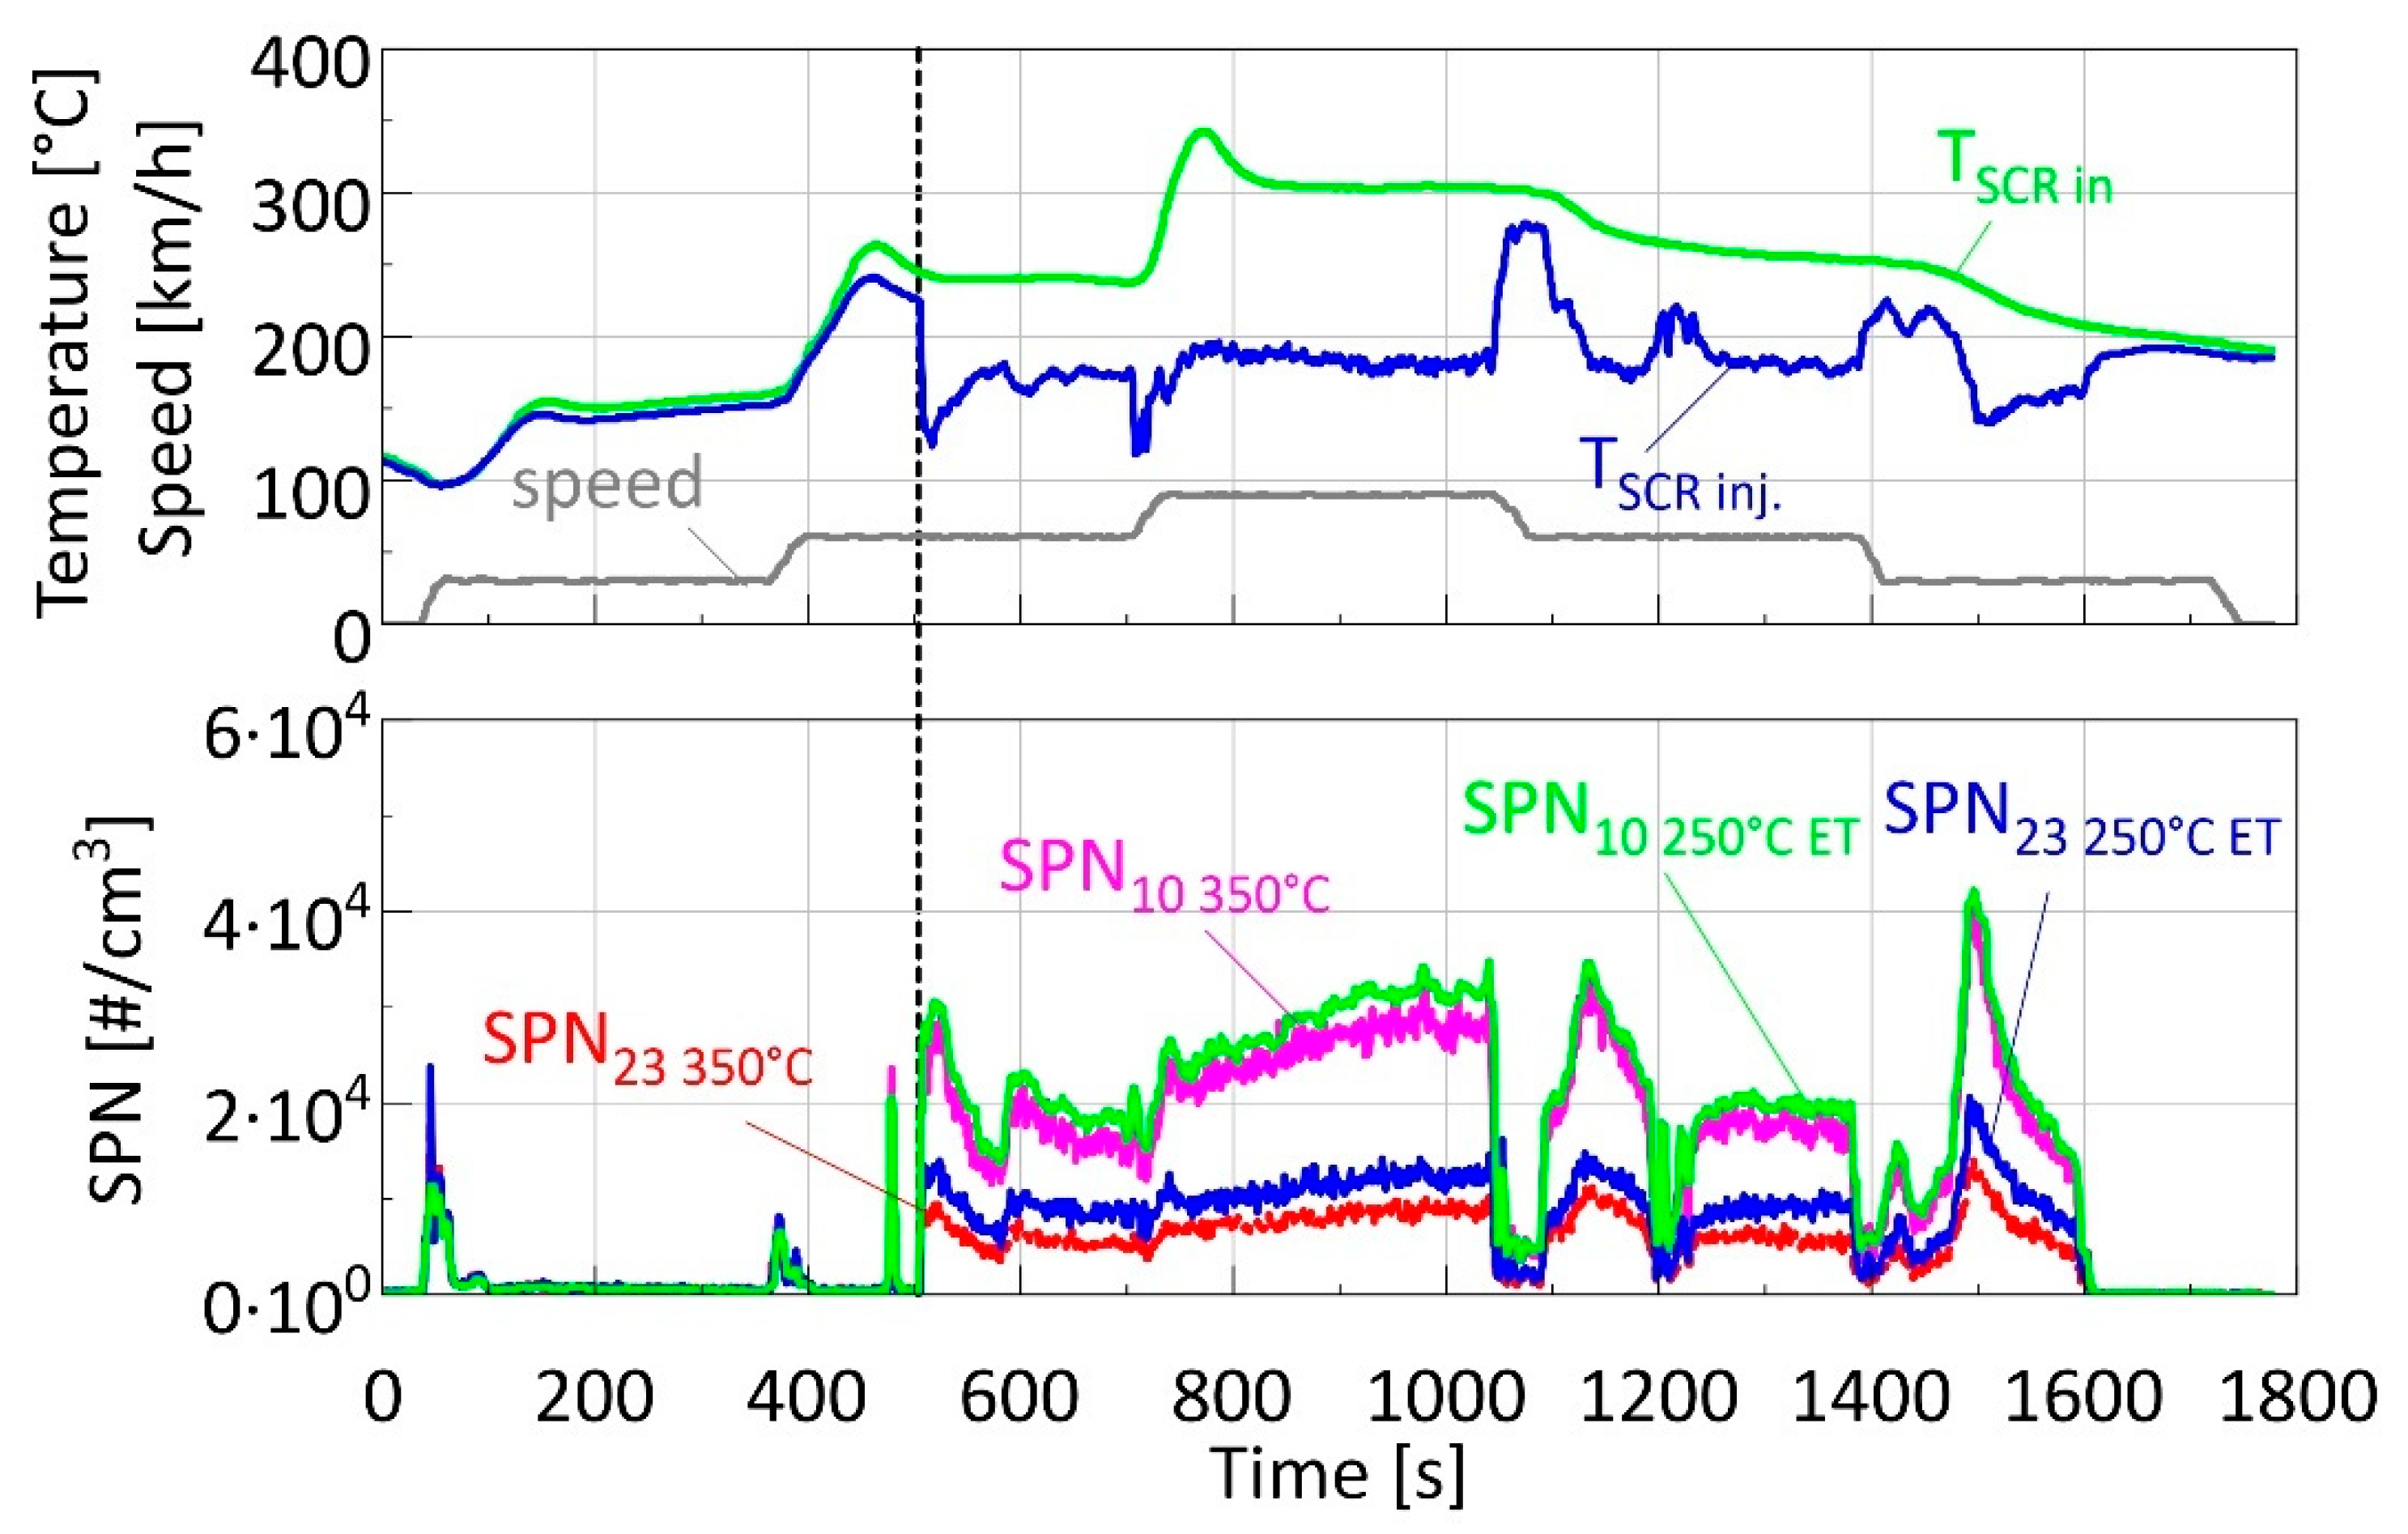
3.2. Emission Performance of the OEM Aftertreatment following the Proposed Post Euro VI Evaluation

Figure 4 shows the results from the same tests from Figure 3 (OEM cDPF) calculated following the proposed post Euro VI methodology targeting SPN10. The vehicle PN emissions in its OEM aftertreatment layout (SCR out) were above the proposed limits in all tests. It should be reminded that the cold-start tests were conducted having passively regenerated the filter the day before. The WHVC cycle would correspond to a short trip and thus the cold-start test would be weighted by the ratio of cycle work (29 kWh) to three times the reference work (3 × 37.5 = 112.5 kWh), i.e., approximately 26%. Therefore, the 1.0 × 10¹² #/kWh WHVC-cold SPN10 emissions would translate to 2.7 × 10¹¹ #/kWh, 33% above the suggested budget limit of 2 × 10¹¹ #/kWh. The average WHVC-hot SPN10 emissions of 1.4 × 10¹¹ #/kWh are already close to the target budget limit. Assuming that they are representative of the hot-start operation, prolonging the WHVC-cold would result in even larger exceedance.
The inclusion of the entire set of MAWs led to similar 100th percentile (in this case cold-start) results over both ISC tests, exceeding the targeted limit of 5 × 10¹¹ #/kWh by 154% and 93%, at 23 °C and 5 °C, respectively. The 90th percentile results also exceeded the target threshold of 1 × 10¹¹ #/kWh, although the cause was different in the two tests. The measurements at 23 °C resulted in exceedance of the threshold already at DPF1 position by ~50%, and therefore the origin was soot particles. On the other hand, the 90th percentile results at DPF1 outlet at 5 °C was nearly two orders of magnitude lower. The exceedance in this case was only due to the particles forming inside the SCR.

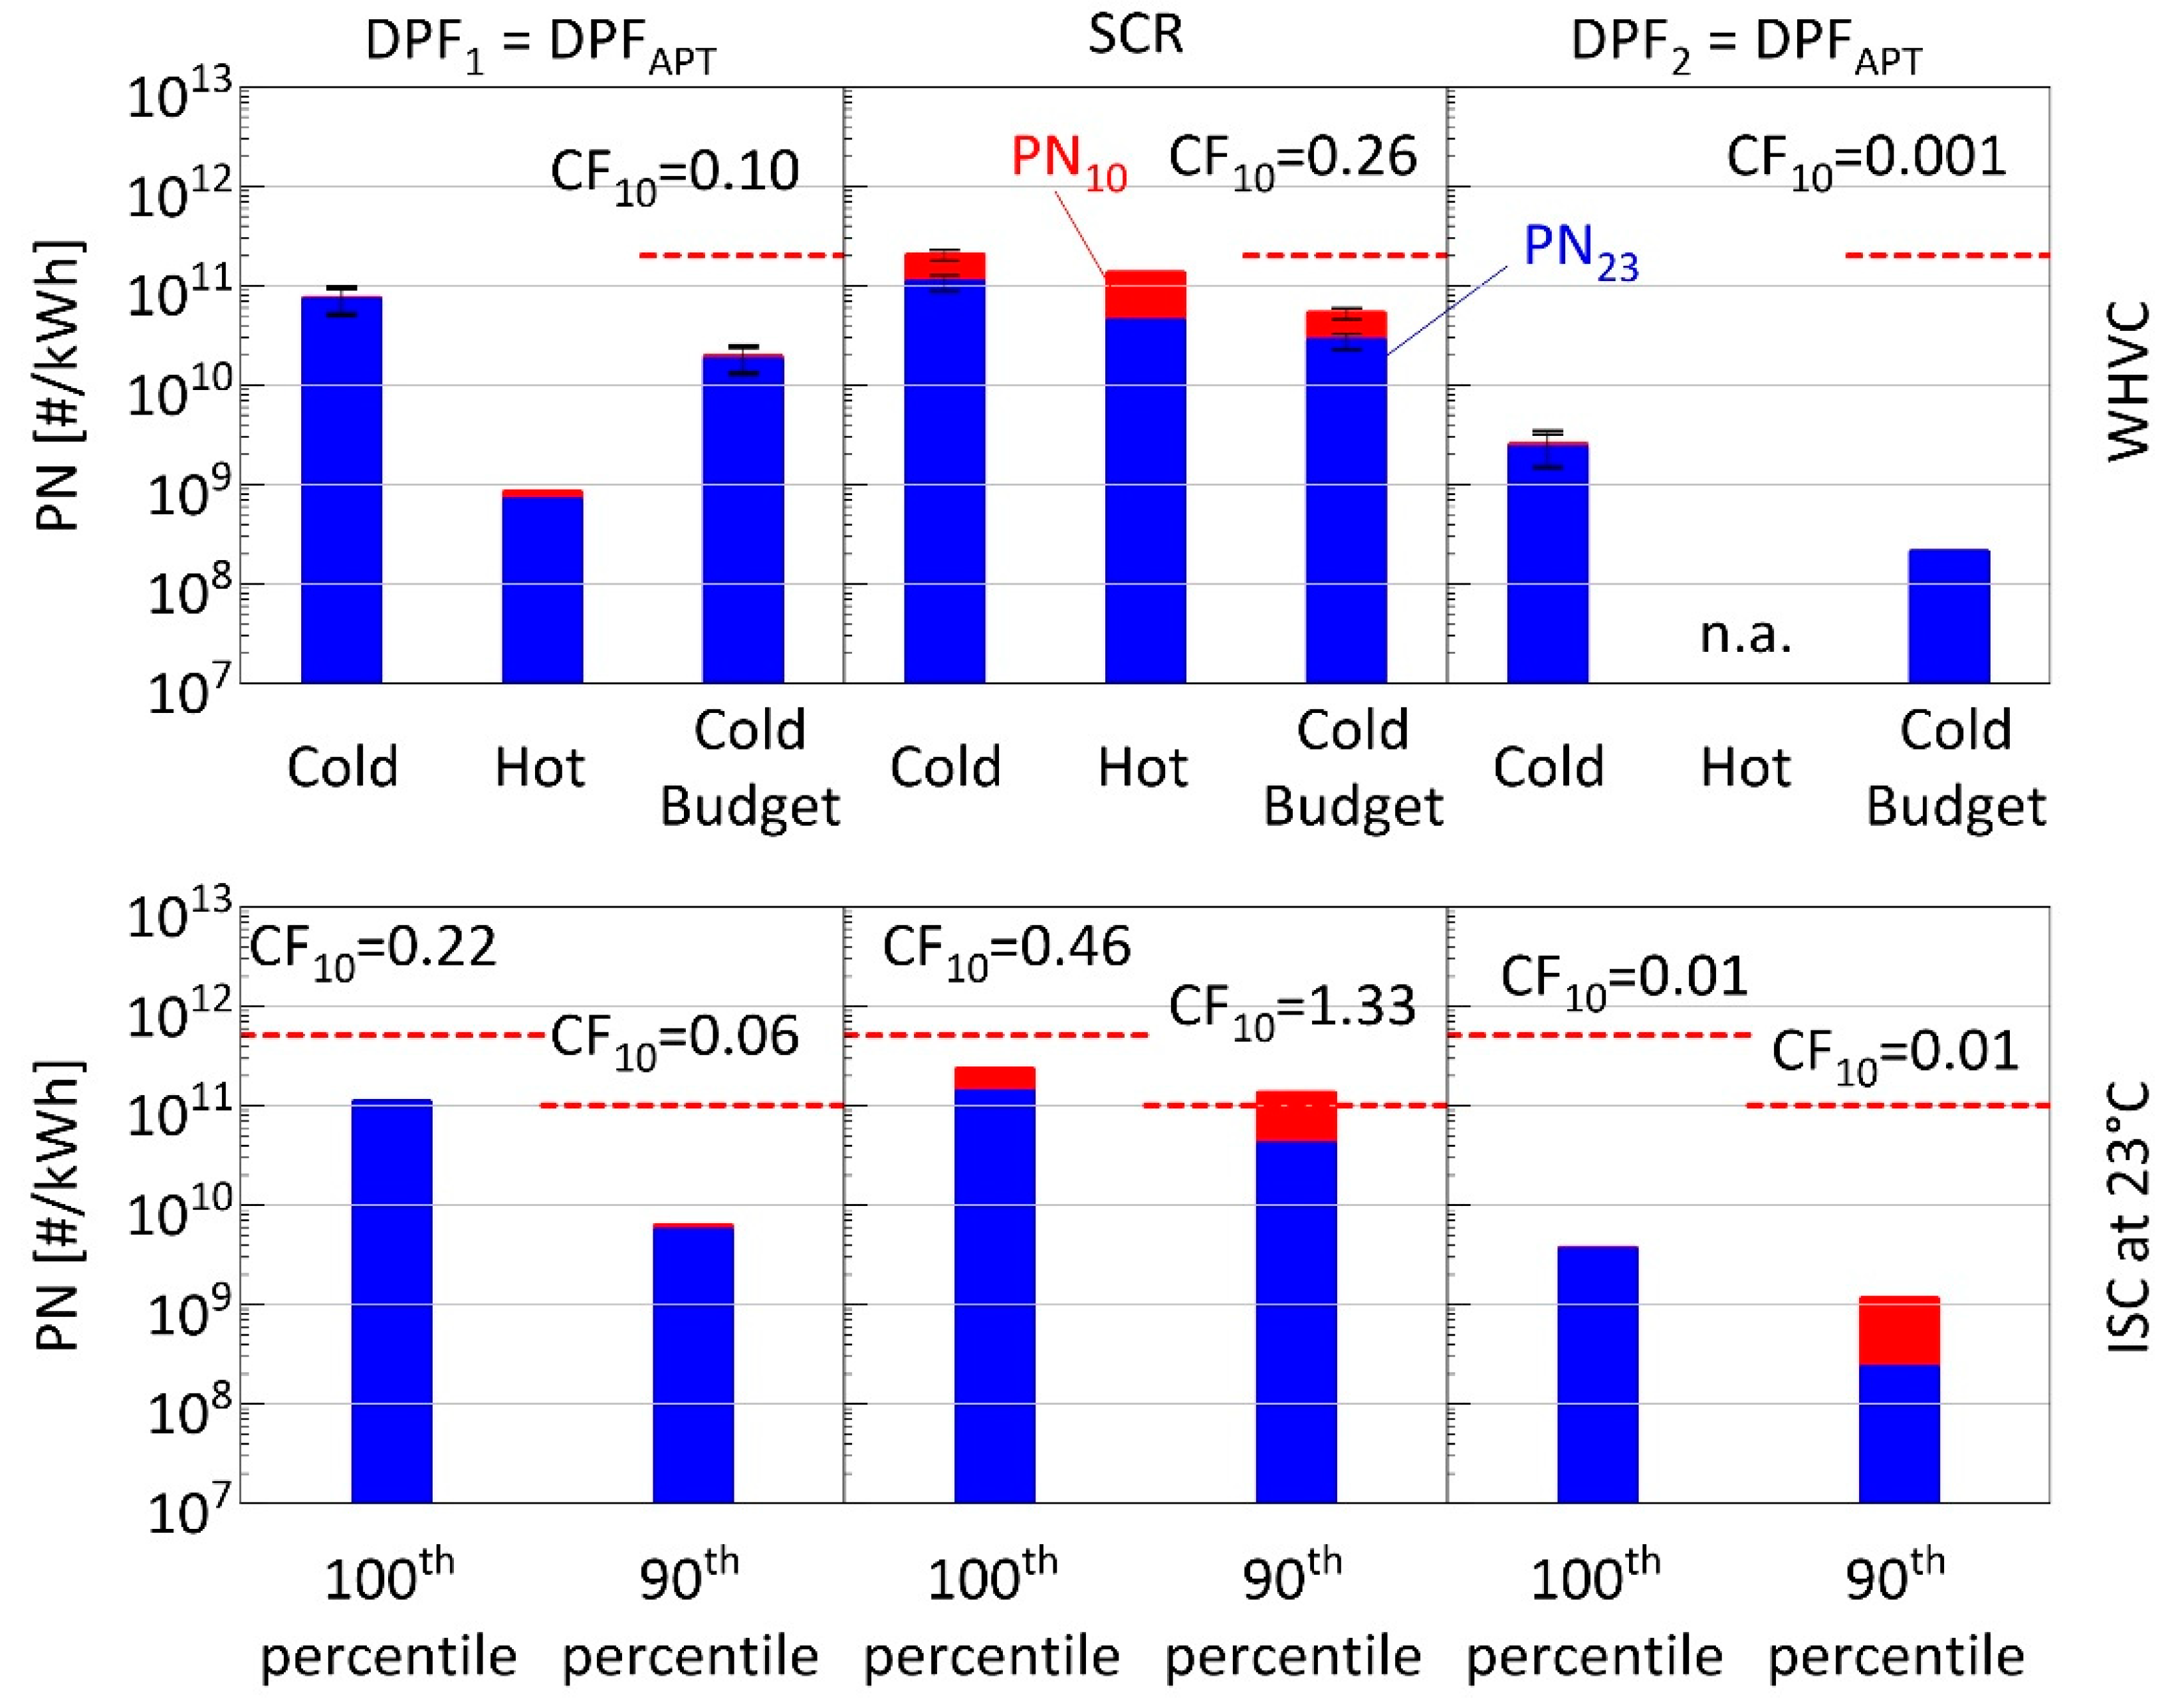
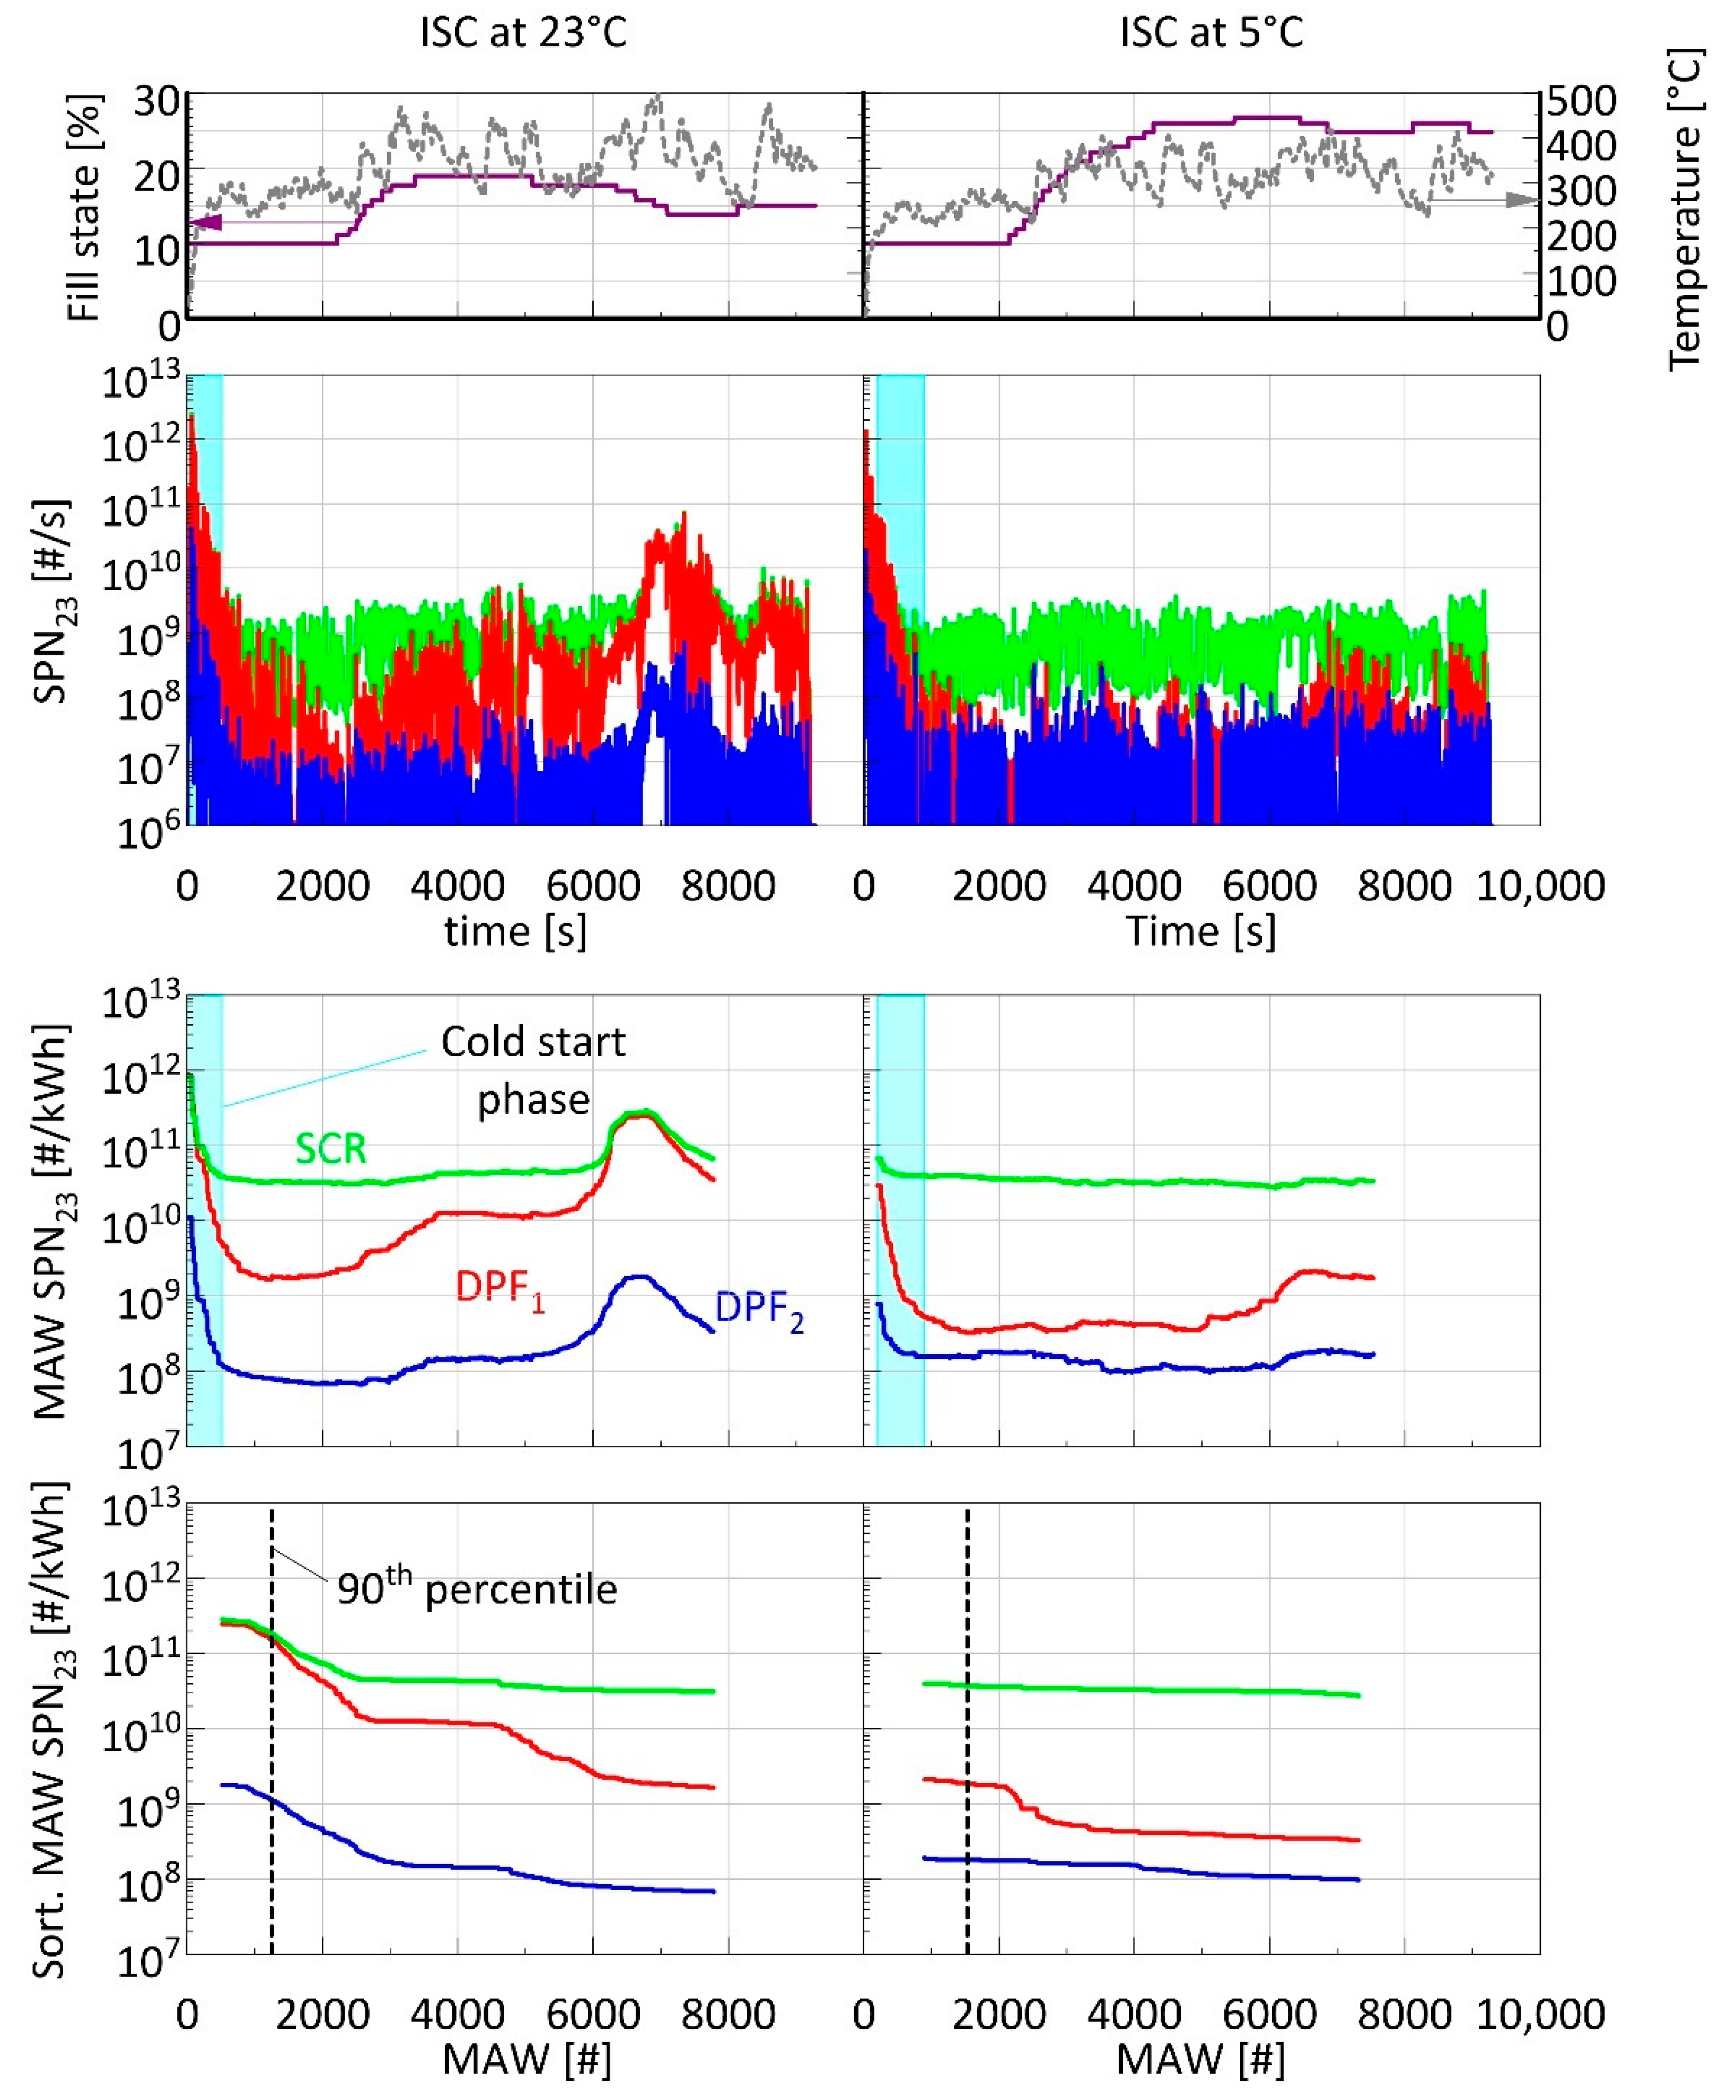
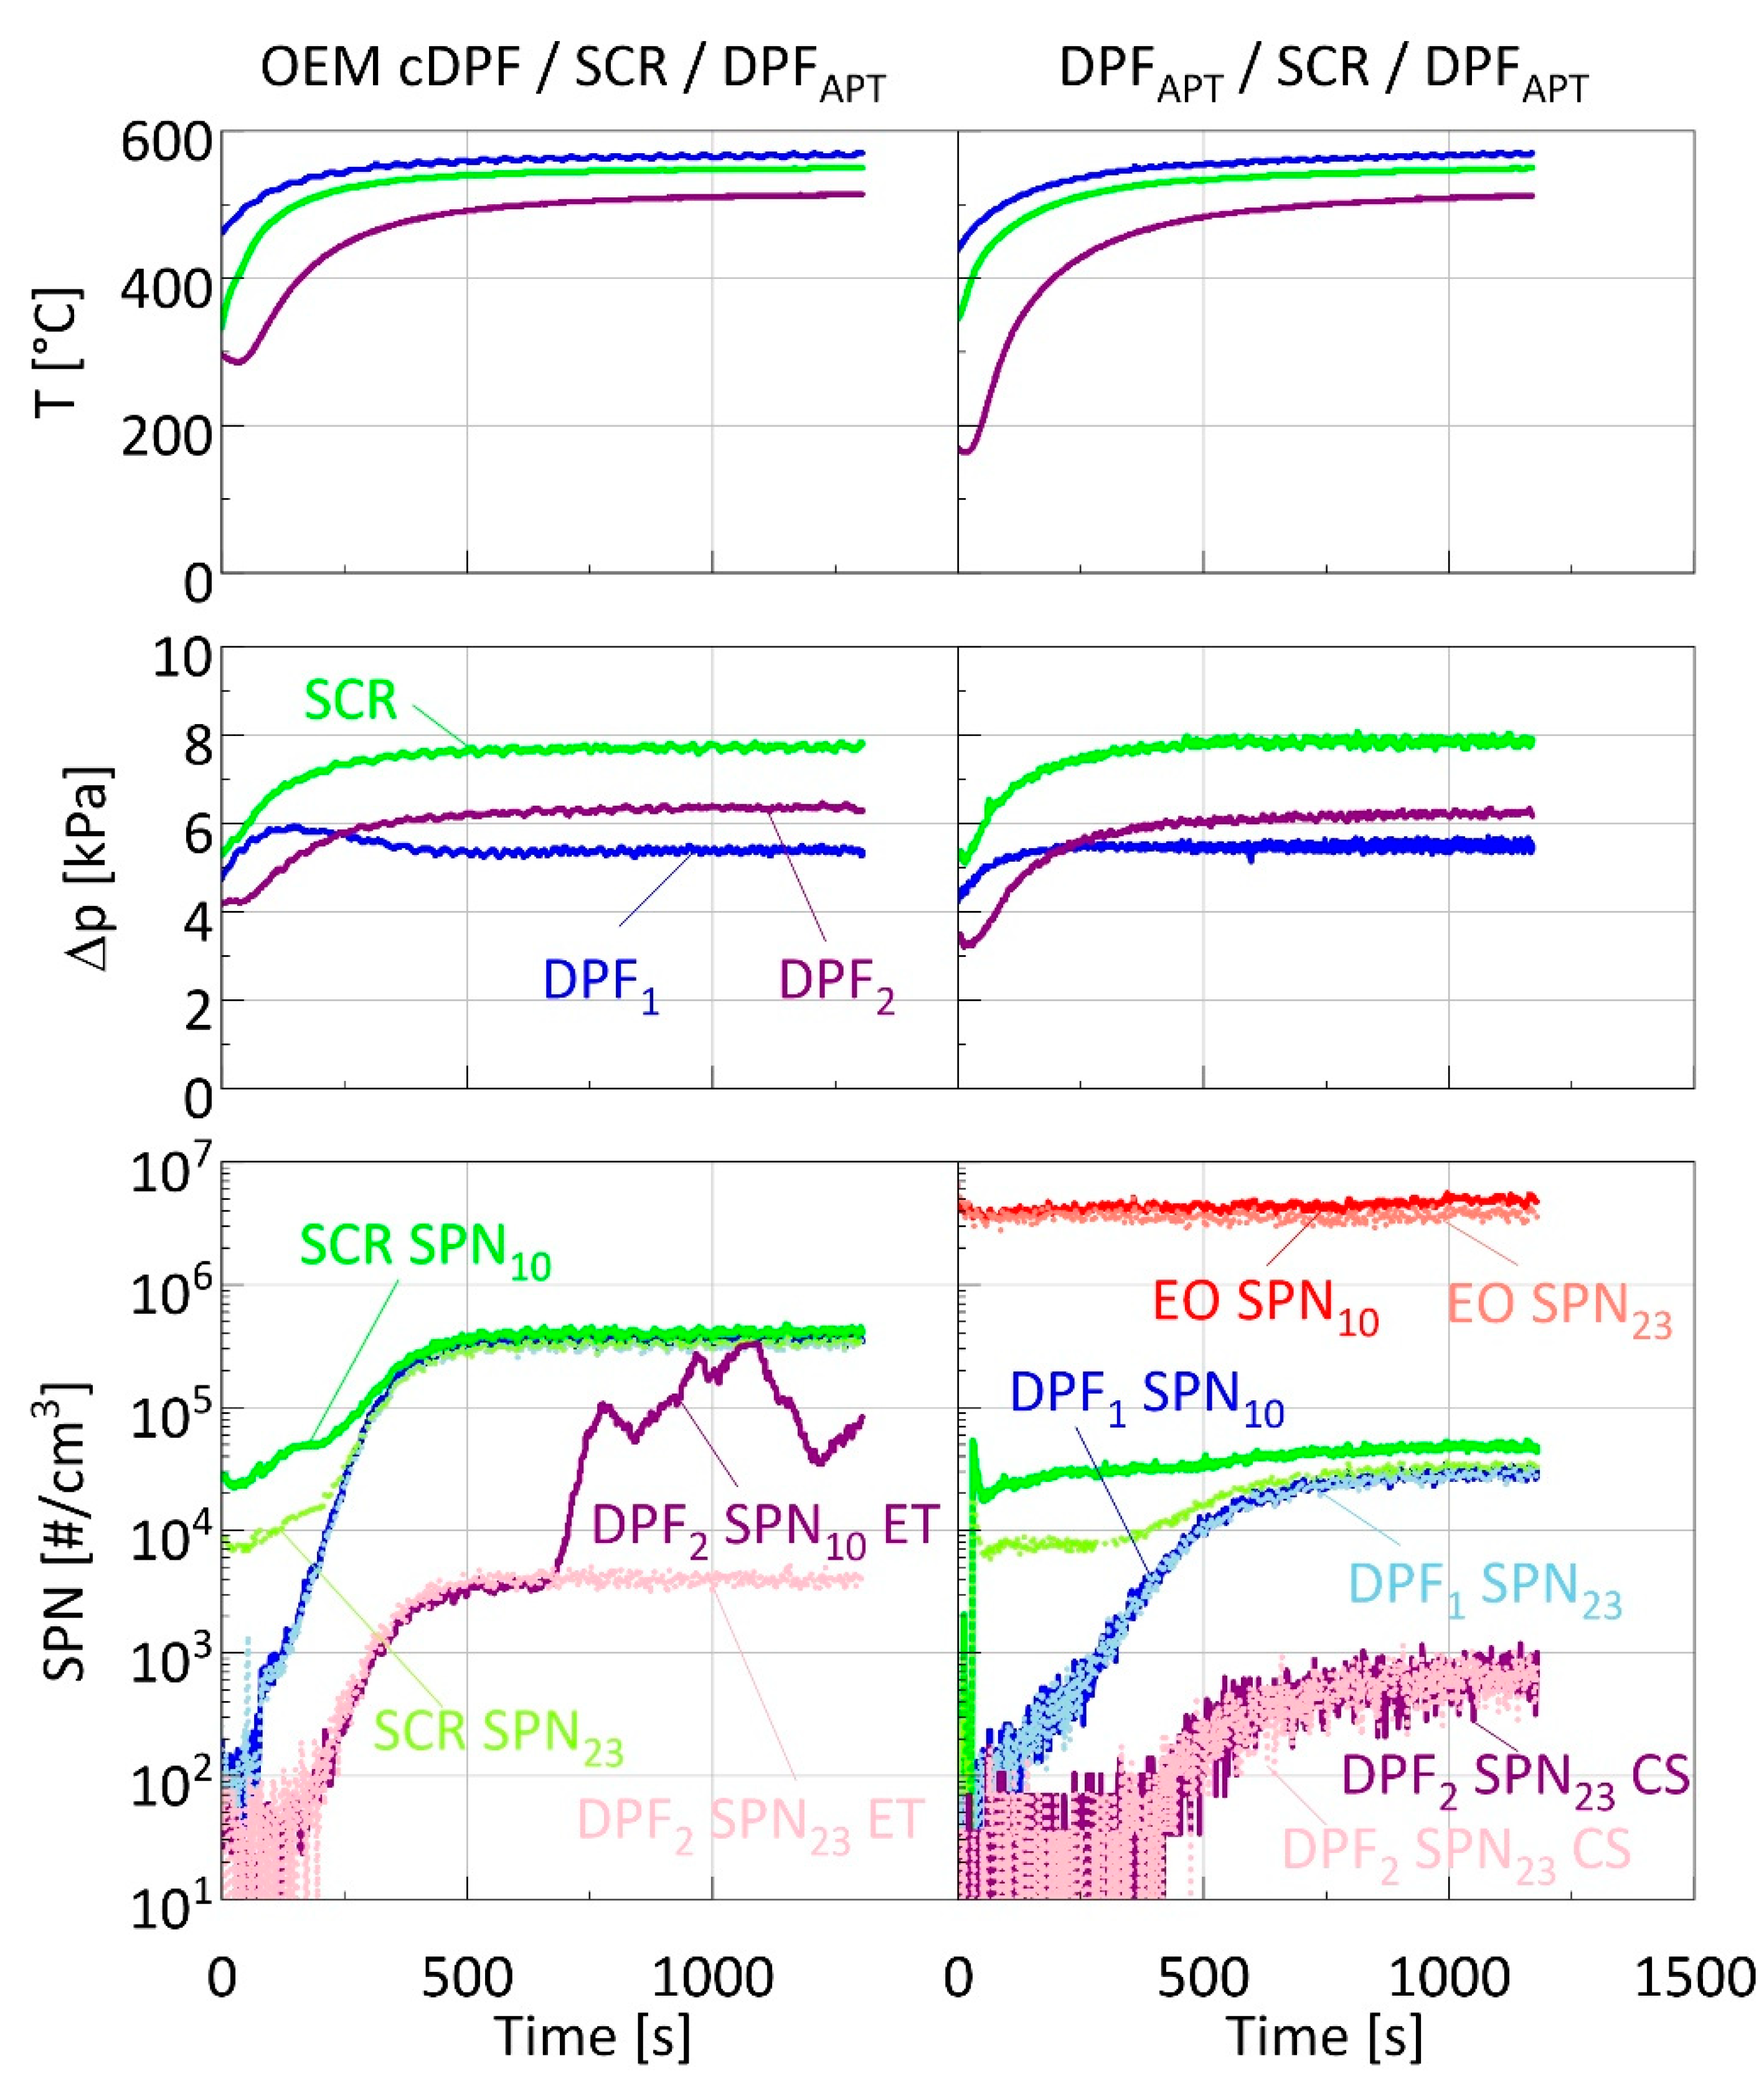
3.3. Assessment of DPFAPT in DPF1 location following the Post Euro VI Evaluation

Figure 5 provides a summary of the results obtained when the DPFAPT filter was installed at DPF1 location, following the post Euro VI methodology. The DPFAPT brought WHVC-cold SPN10 emissions below 1011 #/kWh, i.e., one order of magnitude below the OEM cDPF. WHVC-hot SPN10 emissions were at similar levels with the OEM cDPF (Figure 4), at approximately 109 #/kWh, suggesting that soot built-up over WHVC-cold was sufficient for cake filtration to become the dominant collection mechanism.
The emission levels at the outlet of DPF1 were lower than those forming over the SCR, which therefore became the dominant SPN10 source. The cycle-average SPN10 at the outlet of the SCR over the WHVC-cold and WHVC-hot, were 2 × 10¹¹ #/kWh and 1.3 × 10¹¹ #/kWh, respectively. Therefore, while the WHVC-cold results (29 kWh/112.5 kWh × 2 × 1011 #/kWh = 0.5 × 10¹¹ #/kWh) lie within the budget of 2 × 10¹¹ #/kWh, the actual performance over a short test is expected to scale with the duration of the test. For example, a combination of WHVC-cold with one WHVC-hot would lead to 0.9 × 10¹¹ #/kWh, while a WHVC-cold in tandem with two WHVC-hot would lead to 1.2 × 10¹¹ #/kWh.
The DPFAPT brought the engine-out SPN10 100th and 90th percentile results over the ISC at 22% and 6% of the respective thresholds (5 × 10¹¹ #/kWh and 1 × 10¹¹ #/kWh). Particles formed in the SCR resulted in approximately twice as high SPN10 100th percentile, though still within the suggested limit. The effect of particles forming in the SCR was more pronounced on the SPN10 90th percentile results which increased by 22 times, exceeding the targeted limit by 33%. In absolute terms the increase was 1.3 × 10¹¹ #/kWh, i.e., above the target value. Therefore, the use of a very efficient DPF upstream of the SCR would not be sufficient to achieve the proposed limits. Particles forming in the SCR would need to be addressed. The use of a DPFAPT was very efficient in reducing the levels to at least two orders of magnitude below the corresponding thresholds.

4. Discussion

4.1. Importance of Cold-Start and Passive Regeneration

Figure 6 compares the SPN23 real time emission rates as well as the MAW evaluations for the two ISC tests conducted with the OEM cDPF. The fill state of the OEM cDPF should be similar at the start of the tests (around 10%), according to the ECU signal and the pressure drop measurements over the preceding passive regeneration tests.
The cold-start operation had a profound effect on the SPN emissions in both tests. The total number of SPN23 particles at the outlet of the OEM cDPF over the first 900 s of the tests was 3.3 × 10¹³ # at 23 °C and 2.1 × 10¹³ # at 5 °C. These levels were approximately an order of magnitude higher than the maximum of previously reported levels of 10 Euro VI technology HDVs [28]. This difference reflects the clean state of the DPF at the start of the test. Engine-out SPN23 levels were only available from a subsequent ISC test at 23 °C, summing to 1.4 × 10¹⁵ # with the corresponding number downstream of the DPFAPT that was installed at DPF1 location being 0.3 × 10¹³ #. This suggests an average filtration efficiency over the first 900 s of ~98% for the OEM cDPF and 99.8% for the DPFAPT. Particle number emissions dropped sharply though after this period, leading to more than 99.99% filtration efficiency with both DPFs over the subsequent 900 s (900–1800 s) of the test.
The cold-start sections of the tests, as defined in the Euro VI step E ISC regulation, are also depicted in Figure 6. The requirement to consider only data from the point when the coolant temperature reaches 30 °C, resulted in an exclusion of the first ~200 s of the ISC test conducted at 5 °C, but no exclusion of data for the ISC at 23 °C (as the coolant temperature was 30 °C at the start of the specific test). Given the sharp drop in SPN emissions, the specific difference constituted the low temperature test as a less severe condition. The end effect was an order of magnitude lower cold-start MAW emissions at 5 °C compared to 23 °C (Figure 3).
The warm phase of the tests revealed two main sources of particle emissions. The SCR resulted in a relatively constant formation of particles as evident from the relatively stable MAW emissions of approximately 0.3 × 10¹¹ #/kWh SPN23. The corresponding SPN10 levels at the outlet of the SCR were 1.2 × 10¹¹ #/kWh, i.e., already surpassing the 1 × 10¹¹ #/kWh threshold for the 90th percentile. Therefore, meeting the suggested post Euro VI targets would require some control of the particles forming inside the SCR.
The ISC tests also indicated another potential mechanism of high SPN emissions during the warm phase of the cycle. The temperatures developed at the inlet of the DPF1 in both cycles were high enough to initiate passive regeneration with NO2 forming in the upstream DOC [42]. This was reflected in the measured ECU signals on the DPF fill state, which following a rise at approximately 2000 s, stabilized and eventually dropped in the 4000–6000 s segment of the cycle. The effect was more pronounced at 23 °C where higher temperatures were developed. Some soot slip at the outlet of the DPF1 could also be observed at 5 °C during this period, although it was more pronounced at 23 °C. The corresponding MAW fell in the warm phase of the cycle and thus directly affected the 90th percentile results.

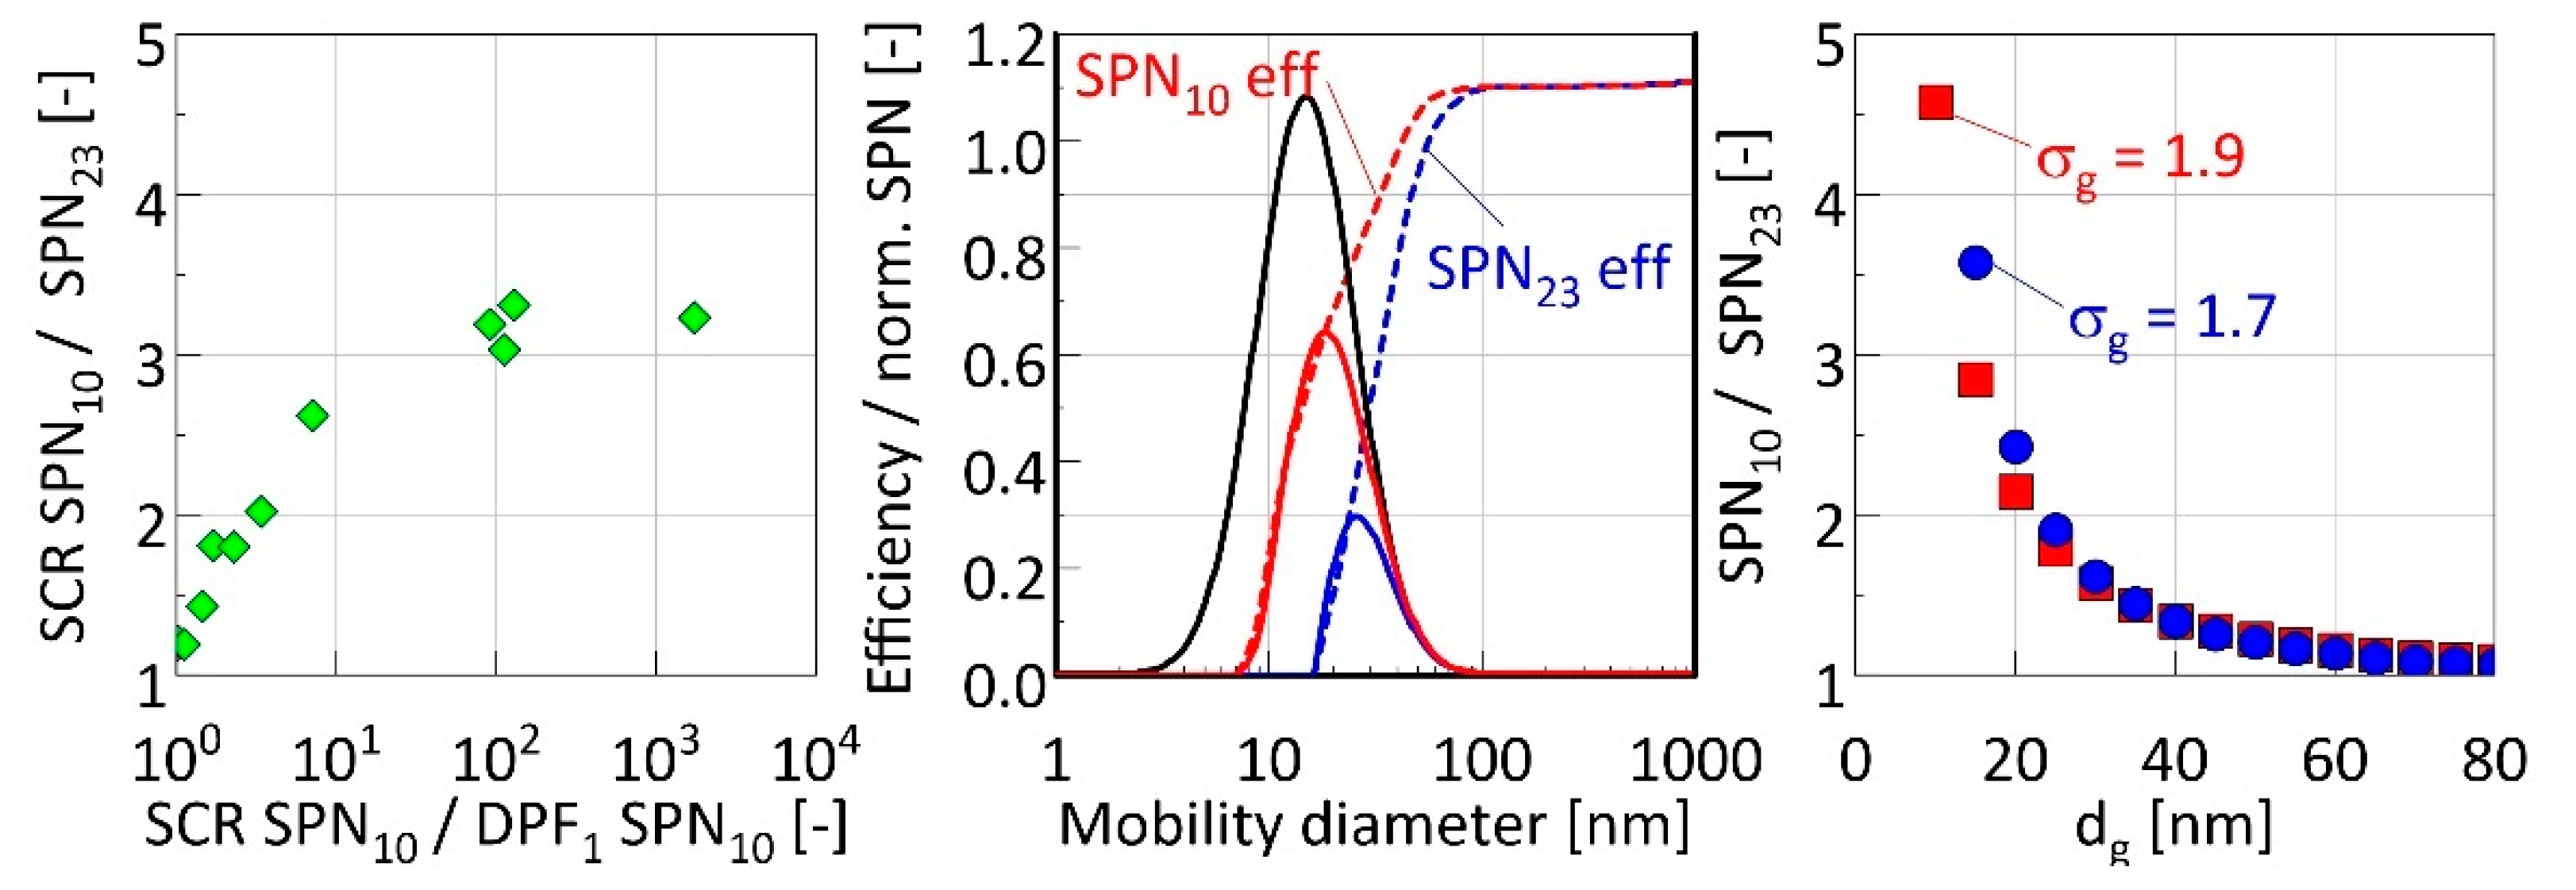
4.2. Properties of Particles Forming Inside the SCR

The left panel in Figure 7 summarizes the cycle-average ratios of SPN10 over SPN23 downstream of the SCR as a function of the SPN10 concentration ratios downstream and upstream of the SCR. The former is a function of the mean size of the emitted particles, while the latter is indicative of the relative contribution of particles forming inside the SCR. When particles forming inside the SCR dominate, the SPN10 over SPN23 ratio ranges between 3 and 3.3. As the contribution of particles forming inside the SCR is reduced, so the SPN10 over SPN23 ratio is reduced down to a value of 1.2. Figure 7 also presents calculated SPN10 over SPN23 ratios for different lognormal distributions based on typical counting efficiencies of SPN10 and SPN23 systems [43]. The computations suggest that particles formed in SCR should have a mean size in the range of 15 nm, while in their relative absence the mean size of emitted particles would lie in the 50 to 55 nm range. These figures are consistent with previously reported sizes for particles formed in SCR [31] and HDV soot [44], respectively.
The middle panel in Figure 7 also illustrates the estimated fraction of particles from a lognormal distribution peaking at 15 nm that is expected to be detected by SPN23 and SPN10 instruments. These calculations illustrate that both the SPN10 and particularly the SPN23 devices are only detecting the upper tail of the distribution.
The volatility of the particles formed inside the SCR was assessed during two speed ramp tests. In the first test, two SPN systems (CS1, CS2) were connected at the outlet of the SCR, with one (CS1) set to operate at a VPR temperature of 250 °C (the other had the default temperature of 350 °C). The results of these tests are summarized in Figure 8. A step increase in particle emissions took place midway through the first 60 km/h section. This rise coincided with a sharp drop in the reading of the thermocouple installed close to the tip of the urea injector. Similar SPN10 concentrations were recorded with both instruments over the entire duration of the test. The SPN23 concentrations recorded by the CS1 operating at a VPR temperature of 250 °C were approximately 10% higher than those recorded by the unmodified CS2 (350 °C).
Figure 9 shows the results of the second speed ramp test conducted with the CS2 and ET SPN systems, with the latter modified to operate at a VPR temperature of 250 °C. Similarly, the formation of particles in the SCR coincided with the start of injection, as identified by the temperature measurements. In this case, the system operating at 250 °C measured 10% higher SPN10 concentrations and 35% higher SPN23 concentrations.
The change in the operating temperature of the VPR could affect the calibrated PCRF because it could affect the thermophoretic losses in the VPR. However, this effect is expected to be small and also independent of particle diameter in the size range of interest. For example, the thermophoretic losses of aerosol streams at 350 °C and 250 °C through a tube maintained at ambient temperature are expected to be 16% and 14%, respectively [45]. It is also unlikely that the larger deviations with the ET system are due to re-nucleation of volatile precursors. Such nucleation events are expected to mostly affect the 10 nm measurements, and not the other way around.
The most probable cause of the observed deviations is differences in the losses and detection efficiencies of the instrumentation employed. Based on the ratio of SPN10 to SPN23 (3 to 3.5), the mean size of these particles was estimated to lie in the 15 nm range with SPN10 and SPN23 systems detecting approximately 50% and 15% of the total population (Figure 7). The use of a catalytic stripper is known to increase particle losses in this size range [46]. These increased losses in the area of 15 nm are not accounted for in the calibration of the devices, which is only based on the average losses at 30, 50 and 100 nm. This could explain the observed 10% differences in the SPN10 measurements between the ET and CS2 instruments. The detection efficiency of the SPN23 systems is mostly determined from the counting efficiency of the 23 nm CPCs employed. It is not uncommon for such CPCs to exhibit differences of as high as 10% in absolute terms in the calibrated counting efficiencies at 23 nm [47], while the regulation allows an even wider range (±12%).
Overall, the experimental results suggest that the particles forming inside the SCR were thermally stable and solid under the operational definition of the European regulation for 10 nm measurements. Some shrinkage of the particles affecting mostly the SPN23 measurements cannot be excluded. Robinson et al. [30] evaluated the effect of urea dosing on the SPN23 emissions of a 447 kW Euro VI heavy-duty engine equipped with a DOC, DPF and SCR. They also employed an AVL APC device equipped with an ET and modified the operating temperature in the 300 to 400 °C range. They reported a decrease in the SPN23 concentrations of 20% when moving from 300 to 400 °C.
Prasath et al. [34] tested a Euro VI heavy-duty engine with an aftertreatment composed of a DOC, DPF and SCR at different operating conditions and varied the amount of urea dosing until full conversion of NOx. They measured SPN10 and SPN23 emissions using two systems, both equipped with an ET operating at 350 °C. A consistent increase in SPN10 particles were reported under all conditions, while SPN23 increases occurred only at specific points. The absolute levels increased with dosing, reaching as high as 3 × 10⁴ #/cm3 for SPN23 and 8 × 10⁴ #/cm3 for SPN10. These levels are similar to those observed in the present work (Figure 8 and Figure 9) and in previous studies [30,31,48]. However, in one of the SPN systems, very large increases in SPN10 reaching as high as 7.5 × 10⁶ #/cm3 were observed [34] at the highest urea dosing rates examined. Legala et al. [33] measured the SPN23 emissions of a 2015 model year 6.7 L diesel engine equipped with DOC, DPF and SCR systems. For the measurements they employed two systems, both equipped with ET, with one operating at 300 °C while the other operated at 350 °C. They observed excessive numbers of SPN23 over specific sections of the WHVC and WHTC cycles when tested with EGR deactivated, where urea dosing was higher, but only with the system operating at 300 °C. The exact concentrations were not clear as the employed PCRF was not reported but, based on the systems employed, these should be at least 7.5 × 10⁵ #/cm3. Such high concentrations and differences between systems was not observed in the present campaign. However, the lack of a CS was found to lead to volatile artefacts as described in the following section.

4.3. Volatile Artefacts with the ET System

Figure 10 compares the SPN emissions from two passive regeneration tests. SPN measurements downstream of the DPF2 were performed in one test with ET while in the other test with CS3. When ET was employed (left-hand panels), a large increase in SPN10 was observed at ~700 s. By that point, the SPN emissions from all other locations stabilized suggesting consumption of the soot cake. The temperature at the inlet of DPF2 was approximately 500 °C, while even higher temperatures were recorded at the inlet of the DPF1 (550 °C) and the SCR (570 °C). Such release of particles was not observed with the corresponding SPN23 system, suggesting that these were very small particles, most probably formed by re-nucleation of gaseous precursors downstream of the ET. Such events were not observed after switching from ET to CS2, even when installing DPFAPT at DPF1 position (right-hand panel), which further reduced the concentration of soot particles that could act as condensation seeds (thus increasing the nucleation formation potential) by approximately one order of magnitude. Such volatile artifacts at systems employing ET have also been reported by other studies and highlight the need for a CS for sub-23 nm measurements [49,50].

4.4. Filtration Efficiencies and Pressure Drop

The results shown in Figure 10 also illustrate the performance differences between the OEM cDPF and DPFAPT at clean state. The engine out SPN10 concentrations of 4.8 × 10⁶ #/cm3 were reduced at DPF1 position to 3.6 × 10⁵ #/cm3 with the clean OEM cDPF and to 2.9 × 10⁴ #/cm3 with the DPFAPT in its place, i.e., more than an order of magnitude improvement. The corresponding filtration efficiencies were 92.6% and 99.4% for the OEM and DPFAPT filters, respectively. The DPFAPT at DPF2 position had a filtration efficiency of ~99% with both setups.
The specific tests also allow for the assessment of the relative performance of the filters with respect to pressure drop. Both the OEM cDPF and DPFAPT filters, once cleaned, introduced a similar pressure drop of 5.5 and 5.3 kPa, respectively, when installed at DPF1 position. The exhaust flow rate at the specific test condition was 1120 kg/h, which at the developed temperatures (~570 °C) and absolute pressures (19 kPa overpressure) corresponds to 2270 m3/h volumetric flow. To properly compare the performance however, it is important to account for the differences in the size as well as for the presence of wash-coating in the OEM cDPF. The available DPFAPT sample used in the campaign had a volume of 9.8 L compared to 22.5 L of the OEM cDPF. When similarly sized, the associated reduction in the wall velocity is calculated to reduce the pressure drop by approximately 0.4 kPa. The addition of wash-coating at typical levels of 30 g/L on the DPFAPT is calculated to introduce 1 kPa more back-pressure under the same conditions. Accordingly, the overall pressure drop performance is expected to be similar and therefore no fuel consumption penalty is anticipated.
In agreement with the pressure drop measurements, no fuel consumption penalty could be observed when switching from the OEM cDPF to the DPFAPT at DPF1 position. The installation of the DPFAPT at DPF2 location also showed no effect on fuel consumption and CO2 emissions over the WHVC cycles. It did lead, though, to a systematic 0.5 to 1% increase in CO2 emissions over the passive regeneration tests. The engine brake mean effective pressure during this operating condition was 1245 kPa, and therefore the additional 6 kPa pressure drop is expected to lead to a fuel consumption penalty of 6 kPa/1245 kPa = 0.5%, which is consistent with the CO2 measurements [51].

4.5. Performance and Sizing Requirements for a Downstream DPF

The viability of the use of second DPF to capture particles formed inside the SCR requires more research and will also depend on the emission performance of dual-SCR systems that are anticipated in order to meet the tighter post Euro VI NOx limits [23]. For example, the main DPF should be capable of capturing particles forming in the closed coupled SCR. The results of this work however provide some insights into the potential specifications of a downstream DPF targeting, such SCR-related particles. At their observed SPN10 levels (~1.3 × 10¹¹ #/kWh), a modest filtration efficiency is required to bring emissions within a safe engineering margin below the proposed 1011 #/kWh threshold for the 90th percentile, i.e., much lower than the employed DPFAPT in this study. Owing to the small size of these particles, a high porosity DPF could still capture them efficiently, allowing for low back-pressure implementation, potentially integrating some SCR or ASC functionality to further reduce pressure build-up [36]. For example, Noone et al. [52] have recently evaluated such a combined SCR+DPF system offering a 66% reduction over a baseline SCR system.
The proper sizing of such systems would require a better understanding of the necessary storage capacity which itself would require understanding of the necessary regeneration strategies. The total number of particles formed inside the SCR over the ISC cycles (taken as the difference between SCR out and DPF1 out) would correspond to a total mass of less than 0.25 mg, assuming a lognormal distribution peaking at 15 nm and a density of 2 g/cm3 (upper range of densities from potential urea biproducts spanning from 1.14 g/cm3 for isocyanic acid to 1.77 g/cm3 for ammonium sulphates). For comparison, and based on established correlations between SPN and PM for diesel soot [53], the mass of soot particles escaping DPF1 over the same ISC cycles was calculated to be 26 mg when using the OEM cDPF and 2 mg when using the DPFAPT. The corresponding mass of soot emitted from the engine over the ISC was calculated to be 4285 mg.
Therefore, the mass reaching the DPF downstream of the SCR (~2 to 26 mg) would be between 165 and 2150 times lower than that reaching the upstream DPF, depending on the filtration efficiency of the latter. Furthermore, owing to the small size of the particles formed in the SCR, soot will still be the dominant species collected on a back-up DPF. Similarly, limited slip of ash is expected from the main DPF suggesting that the ash storage capacity will not be a critical parameter for the sizing of the downstream DPF [54]. Robinson et al. [30] performed thermogravimetric analysis on several ammonium salts and urea decomposition byproducts, suggesting complete decomposition below 500 °C. More research is needed to understand whether the two to three orders of magnitude lower soot mass reaching the downstream DPF would suffice for their sustainable passive regeneration. That is, whether the reduced oxidation rates due to lower exhaust temperatures can be compensated for by the orders of magnitude slower accumulation of particles.

5. Conclusions

The proposals for post Euro VI heavy-duty standards foresee a shift of the lowest SPN detection size from 23 nm to 10 nm, as well as further tightening of the limits and an extension of the evaluation procedure to cover nearly all operating conditions from engine start onwards.
The present study evaluated the SPN emissions of a Euro VI step E heavy-duty vehicle and the potential offered by an advanced DPF filter in reaching the proposed limits for post Euro VI. The results identified a number of critical operating conditions, necessitating further improvements in the aftertreatment technology. An increase in the filtration efficiency at clean state was necessary to capture both cold-start emissions and soot slip during passive regeneration events. The >99% baseline filtration efficiency of the advanced DPF system tested was sufficient to bring engine out emissions within the proposed limits under all conditions tested.
The increase in the DPF filtration efficiency is not sufficient though, owing to nanosized particles forming in the downstream SCR at levels exceeding the targeted warm-phase emissions of 1011 #/kWh. DPF systems were shown to be very efficient in capturing these small particles allowing for optimized solutions with minimal fuel consumption penalty. The necessity of a dedicated DPF for urea-related particles will depend on the potential offered by the optimization of urea injection strategies or dual-SCR systems using the main DPF to capture particles forming in the closed-coupled SCR.

Author Contributions

Conceptualization, A.M. (Athanasios Mamakos), B.G., R.S.-B., M.C.B. and S.H.; methodology, A.M. (Athanasios Mamakos), M.C.B. and S.H.; formal analysis, A.M. (Athanasios Mamakos), M.C.B. and S.H.; resources, B.G., R.S.-B., D.R. and S.H.; data curation, A.M. (Athanasios Mamakos); writing—original draft preparation, A.M. (Athanasios Mamakos); writing—review and editing, all; supervision, B.G., R.S.-B., D.R. and S.H.; All authors have read and agreed to the published version of the manuscript.

Funding

This research received no external funding.

Institutional Review Board Statement

Not applicable.

Informed Consent Statement

Not applicable.

Data Availability Statement

Data are available from the corresponding author upon request.

Acknowledgments

The authors would like to acknowledge the JRC VELA technical staff (M. Cadario, D. Zanardini, R. Quattro) and AVL’s resident engineer A. Bonamin for their support in the experimental activities. The authors would also like to thank S. Ziehlke for his on-site support in setting up the different aftertreatment systems. Special acknowledgements to AVL (C. Dardiotis and R. Davok) for providing one of the APCs of this study.

Conflicts of Interest

A.M. and D.R. are employed by Corning GmbH and M.B. and S.H. by Corning Inc. The DPFAPT evaluated in this study served as a demonstrator prototype for the development of the commercial technical solution by Corning Inc. The opinions expressed in this manuscript are those of the authors and should not in no way be considered to represent an official opinion of the European Commission. Mention of trade names or commercial products does not constitute endorsement or recommendation by the authors or the European Commission.

Abbreviations

Acronyms
APCAVL Particle Counter
ASCAmmonia Slip Catalyst
CFConformity Factor
CPCCondensation Particle Counter
CSCatalytic Stripper
CVSConstant Volume Sampler
DOCDiesel Oxidation Catalyst
DPFDiesel Particulate Filter
ECEuropean Commission
ECUElectronic Control Unit
ETEvaporating Tube
GTRGlobal Technical Regulation
HDVHeavy-Duty Vehicle
ISCIn-Service Conformity
JRCJoint Research Centre
MAWMoving Average Window
OEMOriginal Equipment Manufacturer
PEMSPortable Emission Measurement System
PMParticulate Matter
PCRFParticle Concentration Reduction Factor
SCRSelective Catalytic Reduction
SPNSolid Particle Number
VPRVolatile Particle Remover
WHOWorld Health Organization
WHTCWorld Harmonized Transient Cycle
WHVCWorld Harmonized Vehicle Cycle
Subscripts
refreference
1010 nm or 10%
2323 nm
APTAccelerated Purification Technology

References

  1. Health Effects Institute. State of Global Air 2020; HEI: Boston, MA, USA, 2020. [Google Scholar]
  2. Pope, C.A.; Coleman, N.; Pond, Z.A.; Burnett, R.T. Fine particulate air pollution and human mortality: 25+ years of cohort studies. Environ. Res. 2020, 183, 108924. [Google Scholar] [CrossRef]
  3. Gonzalez Ortiz, A.; Guerreiro, C.; Soares, J.; European Environment Agency. Air Quality in Europe: 2020 Report; Publications Office of the European Union: Luxemburg, 2020; ISBN 978-92-9480-292-7.
  4. Chaloulakou, A.; Kassomenos, P.; Spyrellis, N.; Demokritou, P.; Koutrakis, P. Measurements of PM10 and PM2.5 particle concentrations in Athens, Greece. Atmos. Environ. 2003, 37, 649–660. [Google Scholar] [CrossRef]
  5. Wagner, V.; Rutherford, D. Survey of Best Practices in Emission Control of In-Use Heavy-Duty Diesel Vehicles; International Council on Clean Transportation (ICCT) Report; ICCT: Washington, DC, USA, 2013. [Google Scholar]
  6. Lorelei de Jesus, A.; Thompson, H.; Knibbs, L.D.; Kowalski, M.; Cyrys, J.; Niemi, J.V.; Kousa, A.; Timonen, H.; Luoma, K.; Petäjä, T.; et al. Long-term trends in PM2.5 mass and particle number concentrations in urban air: The impacts of mitigation measures and extreme events due to changing climates. Environ. Pollut. 2020, 263, 114500. [Google Scholar] [CrossRef] [PubMed]
  7. Harrison, R.M.; Vu, T.V.; Jafar, H.; Shi, Z. More mileage in reducing urban air pollution from road traffic. Environ. Int. 2021, 149, 106329. [Google Scholar] [CrossRef]
  8. World Health Organization. WHO Global Air Quality Guidelines: Particulate Matter (PM2.5 and PM10), Ozone, Nitrogen Dioxide, Sulfur Dioxide and Carbon Monoxide; World Health Organization: Geneva, Switzerland, 2021; ISBN 978-92-4-003422-8.
  9. de Jesus, A.L.; Rahman, M.M.; Mazaheri, M.; Thompson, H.; Knibbs, L.D.; Jeong, C.; Evans, G.; Nei, W.; Ding, A.; Qiao, L.; et al. Ultrafine particles and PM2.5 in the air of cities around the world: Are they representative of each other? Environ. Int. 2019, 129, 118–135. [Google Scholar] [CrossRef] [PubMed]
  10. European Commission. Commission Regulation (EC) No 692/2008 of 18 July 2008 Implementing and Amending Regulation (EC) No 715/2007 of the European Parliament and of the Council on Type-Approval of Motor Vehicles with Respect to Emissions from Light Passenger and Commercial Vehicles (Euro 5 and Euro 6) and on Access to Vehicle Repair and Maintenance Information (Text with EEA Relevance). Off. J. Eur. Union 2008, 199, 1–136. [Google Scholar]
  11. European Commission. Commission Regulation (EU) No 582/2011 of 25 May 2011 Implementing and Amending Regulation (EC) No 595/2009 of the European Parliament and of the Council with Respect to Emissions from Heavy Duty Vehicles (Euro VI) and Amending Annexes I and III to Directive 2007/46/EC of the European Parliament and of the Council Text with EEA Relevance. Off. J. Eur. Union 2011, 167, 1–168. [Google Scholar]
  12. European Commission. Commission Regulation (EU) No 133/2014 of 31 January 2014 Amending, for the Purposes of Adapting to Technical Progress as Regards Emission Limits, Directive 2007/46/EC of the European Parliament and of the Council, Regulation (EC) No 595/2009 of the European Parliament and of the Council and Commission Regulation (EU) No 582/2011 Text with EEA Relevance. Off. J. Eur. Union 2014, 47, 1–57. [Google Scholar]
  13. European Commission. Commission Regulation (EU) No 459/2012 of 29 May 2012 Amending Regulation (EC) No 715/2007 of the European Parliament and of the Council and Commission Regulation (EC) No 692/2008 as Regards Emissions from Light Passenger and Commercial Vehicles (Euro 6) Text with EEA Relevance. Off. J. Eur. Union 2012, 142, 16–24. [Google Scholar]
  14. European Commission. Commission Regulation (EU) No 2016/1628 of the European Parliament and of the Council of 14 September 2016 on Requirements Relating to Gaseous and Particulate Pollutant Emission Limits and Type-Approval for Internal Combustion Engines for Non-Road Mobile Machinery, Amending Regulations (EU) No 1024/2012 and (EU) No 167/2013, and Amending and Repealing Directive 97/68/EC (Text with EEA Relevance). Off. J. Eur. Union 2016, 252, 53–117. [Google Scholar]
  15. European Commission. Commission Regulation (EU) No 2016/427 of 10 March 2016 Amending Regulation (EC) No 692/2008 as Regards Emissions from Light Passenger and Commercial Vehicles (Euro 6) (Text with EEA Relevance). Off. J. Eur. Union 2016, 82, 1–98. [Google Scholar]
  16. European Commission. Commission Regulation (EU) No 2016/646 of 20 April 2016 Amending Regulation (EC) No 692/2008 as Regards Emissions from Light Passenger and Commercial Vehicles (Euro 6) (Text with EEA Relevance). Off. J. Eur. Union 2016, 109, 1–22. [Google Scholar]
  17. European Commission. Commission Regulation (EU) No 2017/1154 of 7 June 2017 Amending Commission Regulation (EU) 2017/1151 Supplementing Regulation (EC) No. 715/2007 of the European Parliament and of the Council on the Type-Approval of Motor Vehicles with Regard to Emissions from Light Passenger and Commercial Vehicles (Euro 5 and Euro 6) and on Access to Vehicle Repair and Maintenance Information, Amending Directive 2007/46/EC of the European Parliament and of the Council, Regulation (EC) No. 692/2008 of the Commission and Commission Regulation (EU) No. 1230/2012 and Repealing Regulation (EC) No. 692/2008 and Directive 2007/46/EC of the European Parliament and of the Council as Regards Real Driving Emissions from Light Passenger and Commercial Vehicles (Euro 6) (Text with EEA Relevance). Off. J. Eur. Union 2017, 175, 708–732. [Google Scholar]
  18. European Commission. Commission Regulation (EU) No 2018/1832 of 5 November 2018 Amending Directive 2007/46/EC of the European Parliament and of the Council, Commission Regulation (EC) No 692/2008 and Commission Regulation (EU) 2017/1151 for the Purpose of Improving the Emission Type Approval Tests and Procedures for Light Passenger and Commercial Vehicles, including Those for in-Service Conformity and Real-Driving Emissions and Introducing Devices for Monitoring the Consumption of Fuel and Electric Energy (Text with EEA Relevance). Off. J. Eur. Union 2018, 301, 1–314. [Google Scholar]
  19. European Commission. Commission Regulation (EU) No 2019/1939 of 7 November 2019 Amending Regulation (EU) No 582/2011 as Regards Auxiliary Emission Strategies (AES), access to Vehicle OBD Information and Vehicle Repair and Maintenance Information, Measurement of Emissions during Cold Engine Start Periods and Use of Portable Emissions Measurement Systems (PEMS) to Measure Particle Numbers, with Respect to Heavy Duty Vehicles (Text with EEA Relevance). Off. J. Eur. Union 2019, 303, 1–24. [Google Scholar]
  20. European Commission. Commission Delegated Regulation (EU) No 2017/655 of 19 December 2016 Supplementing Regulation (EU) 2016/1628 of the European Parliament and of the Council with Regard to the Monitoring of Emissions of Gaseous Pollutants from Non-Road Internal Combustion Engines in Use Certain Mobile Machinery (Text with EEA Relevance). Off. J. Eur. Union 2017, 102, 334–363. [Google Scholar]
  21. Giechaskiel, B.; Melas, A.; Martini, G.; Dilara, P. Overview of Vehicle Exhaust Particle Number Regulations. Processes 2021, 9, 2216. [Google Scholar] [CrossRef]
  22. Giechaskiel, B.; Melas, A.D.; Lähde, T.; Martini, G. Non-Volatile Particle Number Emission Measurements with Catalytic Strippers: A Review. Vehicles 2020, 2, 342–364. [Google Scholar] [CrossRef]
  23. Joshi, A. Review of Vehicle Engine Efficiency and Emissions. Available online: https://pesquisa.bvsalud.org/global-literature-on-novel-coronavirus-2019-ncov/resource/pt/covidwho-1259690 (accessed on 1 September 2022).
  24. Samaras, Z.; Hausberger, S.; Mellios, G. Preliminary Findings on Possible Euro 7 Emission Limits for LD and HD Vehicles. 2020. Available online: https://circabc.europa.eu/sd/a/fdd70a2d-b50a-4d0b-a92a-e64d41d0e947/CLOVE%20test%20limits%20AGVES%202020-10-27%20final%20vs2.pdf (accessed on 1 September 2022).
  25. Samaras, Z. Study on Post-EURO 6/VI Emission Standards in Europe: LDV Exhaust. 2021. Available online: https://circabc.europa.eu/ui/group/f57c2059-ef63-4baf-b793-015e46f70421/library/83a09cc8-7f8f-4ca6-9764-0b77da57d4cc/details (accessed on 13 October 2022).
  26. Hausberger, S.; Weller, K.; Ehrly, M. Scenarios for HDVs. Summary Emission Limits and Test Conditions. 2021. Available online: https://circabc.europa.eu/ui/group/f57c2059-ef63-4baf-b793-015e46f70421/library/b706ffba-f863-4d23-809d-20d9f18ecba4/details. (accessed on 13 October 2022).
  27. Giechaskiel, B.; Bonnel, P.; Perujo, A.; Dilara, P. Solid Particle Number (SPN) Portable Emissions Measurement Systems (PEMS) in the European Legislation: A Review. Int. J. Environ. Res. Public Health 2019, 16, 4819. [Google Scholar] [CrossRef] [Green Version]
  28. Giechaskiel, B. Solid Particle Number Emission Factors of Euro VI Heavy-Duty Vehicles on the Road and in the Laboratory. Int. J. Environ. Res. Public Health 2018, 15, 304. [Google Scholar] [CrossRef] [PubMed] [Green Version]
  29. Amanatidis, S.; Ntziachristos, L.; Giechaskiel, B.; Bergmann, A.; Samaras, Z. Impact of Selective Catalytic Reduction on Exhaust Particle Formation over Excess Ammonia Events. Environ. Sci. Technol. 2014, 48, 11527–11534. [Google Scholar] [CrossRef]
  30. Robinson, M.A.; Backhaus, J.; Foley, R.; Liu, Z.G. The Effect of Diesel Exhaust Fluid Dosing on Tailpipe Particle Number Emissions. Available online: https://www.sae.org/publications/technical-papers/content/2016-01-0995/ (accessed on 1 September 2022).
  31. Mamakos, A.; Schwelberger, M.; Fierz, M.; Giechaskiel, B. Effect of selective catalytic reduction on exhaust nonvolatile particle emissions of Euro VI heavy-duty compression ignition vehicles. Aerosol Sci. Technol. 2019, 53, 898–910. [Google Scholar] [CrossRef] [Green Version]
  32. Schwelberger, M.; Mamakos, A.; Fierz, M.; Giechaskiel, B. Experimental Assessment of an Electrofilter and a Tandem Positive-Negative Corona Charger for the Measurement of Charged Nanoparticles formed in Selective Catalytic Reduction Systems. Appl. Sci. 2019, 9, 1051. [Google Scholar] [CrossRef] [Green Version]
  33. Legala, A.; Premnath, V.; Chadwell, M.; Weber, P.; Khalek, I. Impact of Selective Catalytic Reduction Process on Nonvolatile Particle Emissions. Available online: https://www.sae.org/publications/technical-papers/content/2021-01-0624/ (accessed on 1 September 2022).
  34. Prasath, K.A.; Bernemyr, H.; Erlandsson, A. On the Effects of Urea and Water Injection on Particles across the SCR Catalyst in a Heavy—Duty Euro VI Diesel Engine. Available online: https://backend.orbit.dtu.dk/ws/portalfiles/portal/268931983/2020_01_2196.pdf (accessed on 1 September 2022).
  35. European Commission. Commission Regulation (EC) No 595/2009 of the European Parliament and of the Council of 18 June 2009 on type-approval of motor vehicles and engines with respect to emissions from heavy duty vehicles (Euro VI) and on access to vehicle repair and maintenance information and amending Regulation (EC) No 715/2007 and Directive 2007/46/EC and repealing Directives 80/1269/EEC, 2005/55/EC and 2005/78/EC (Text with EEA relevance). Off. J. Eur. Union 2009, 188, 1–13. [Google Scholar]
  36. Boger, T.; Glasson, T.; Rose, D.; Ingram-Ogunwumi, R.; Wu, H. Next Generation Gasoline Particulate Filters for Uncatalyzed Applications and Lowest Particulate Emissions. SAE Int. J. Adv. Curr. Prac. Mobil. 2021, 3, 2452–2461. [Google Scholar] [CrossRef]
  37. Selleri, T.; Gioria, R.; Melas, A.D.; Giechaskiel, B.; Forloni, F.; Mendoza Villafuerte, P.; Demuynck, J.; Bosteels, D.; Wilkes, T.; Simons, O.; et al. Measuring Emissions from a Demonstrator Heavy-Duty Diesel Vehicle under Real-World Conditions—Moving Forward to Euro VII. Catalysts 2022, 12, 184. [Google Scholar] [CrossRef]
  38. Steven, H. Development of a Worldwide Harmonised Heavy-Duty Engine Emissions Test Cycle. Final Report; TRANS/WP29/GRPE/2001/2; United Nations: Geneva, Switzerland, 2001.
  39. Giechaskiel, B.; Cresnoverh, M.; Jögl, H.; Bergmann, A. Calibration and accuracy of a particle number measurement system. Meas. Sci. Technol. 2010, 21, 045102. [Google Scholar] [CrossRef]
  40. Giechaskiel, B.; Mamakos, A.; Andersson, J.; Dilara, P.; Martini, G.; Schindler, W.; Bergmann, A. Measurement of Automotive Nonvolatile Particle Number Emissions within the European Legislative Framework: A Review. Aerosol Sci. Technol. 2012, 46, 719–749. [Google Scholar] [CrossRef]
  41. Khan, M.Y.; Shimpi, S.A.; Martin, W.T. The Repeatability and Reproducibility of Particle Number Measurements from a Heavy Duty Diesel Engine. Emiss. Control Sci. Technol. 2015, 1, 298–307. [Google Scholar] [CrossRef] [Green Version]
  42. Allansson, R.; Blakeman, P.G.; Cooper, B.J.; Hess, H.; Silcock, P.J.; Walker, A.P. Optimising the Low Temperature Performance and Regeneration Efficiency of the Continuously Regenerating Diesel Particulate Filter (CR-DPF) System. Available online: https://trid.trb.org/view/1793574 (accessed on 1 September 2022).
  43. Giechaskiel, B.; Lähde, T.; Melas, A.D.; Valverde, V.; Clairotte, M. Uncertainty of laboratory and portable solid particle number systems for regulatory measurements of vehicle emissions. Environ. Res. 2021, 197, 111068. [Google Scholar] [CrossRef]
  44. Kittelson, D.B. Engines and nanoparticles. J. Aerosol Sci. 1998, 29, 575–588. [Google Scholar] [CrossRef]
  45. Housiadas, C.; Drossinos, Y. Thermophoretic Deposition in Tube Flow. Aerosol Sci. Technol. 2005, 39, 304–318. [Google Scholar] [CrossRef]
  46. Samaras, Z.C.; Andersson, J.; Bergmann, A.; Hausberger, S.; Toumasatos, Z.; Keskinen, J.; Haisch, C.; Kontses, A.; Ntziachristos, L.D.; Landl, L.; et al. Measuring Automotive Exhaust Particles Down to 10 nm. SAE Int. J. Adv. Curr. Pract. Mobil. 2020, 3, 539–550. [Google Scholar] [CrossRef]
  47. Giechaskiel, B.; Bergmann, A. Validation of 14 used, re-calibrated and new TSI 3790 condensation particle counters according to the UN-ECE Regulation 83. J. Aerosol Sci. 2011, 42, 195–203. [Google Scholar] [CrossRef]
  48. Giechaskiel, B.; Schwelberger, M.; Kronlund, L.; Delacroix, C.; Locke, L.A.; Khan, M.Y.; Jakobsson, T.; Otsuki, Y.; Gandi, S.; Keller, S.; et al. Towards tailpipe sub-23 nm solid particle number measurements for heavy-duty vehicles regulations. Transp. Eng. 2022, 9, 100137. [Google Scholar] [CrossRef]
  49. Giechaskiel, B.; Lähde, T.; Schwelberger, M.; Kleinbach, T.; Roske, H.; Teti, E.; van den Bos, T.; Neils, P.; Delacroix, C.; Jakobsson, T.; et al. Particle Number Measurements Directly from the Tailpipe for Type Approval of Heavy-Duty Engines. Appl. Sci. 2019, 9, 4418. [Google Scholar] [CrossRef] [Green Version]
  50. Su, S.; Lv, T.; Lai, Y.; Mu, J.; Ge, Y.; Giechaskiel, B. Particulate emissions of heavy duty diesel engines measured from the tailpipe and the dilution tunnel. J. Aerosol Sci. 2021, 156, 105799. [Google Scholar] [CrossRef]
  51. Muntean, G. How Exhaust Emissions Drive Diesel Engine Fuel Efficiency. In Proceedings of the 10th Diesel Engine Emissions Reduction Conference (DEER), Coronado, CA, USA, 29 August–2 September 2004. [Google Scholar]
  52. Noone, P.; Hummel, N.; Lehrian, M.; Beidl, C.; Kunder, N.; Noll, H.; Hirtler, W.; Fiorini, C.; Dardiotis, C.; Wille, A.; et al. Investigations on the Impact of Urea-Dosing on Particulate Number Measurement for Heavy-Duty Applications. In Proceedings of the 9th International Engine Congress, Baden-Baden, Germany, 22 February 2022. [Google Scholar]
  53. Kirchner, U.; Vogt, R.; Maricq, M. Investigation of EURO-5/6 Level Particle Number Emissions of European Diesel Light Duty Vehicles. Available online: https://www.sae.org/publications/technical-papers/content/2010-01-0789/ (accessed on 1 September 2022).
  54. Viswanathan, S.; George, S.; Govindareddy, M.; Heibel, A. Advanced Diesel Particulate Filter Technologies for Next Generation Exhaust Aftertreatment Systems. Available online: https://www.sae.org/publications/technical-papers/content/2020-01-1434/ (accessed on 1 September 2022).
Figure 1. Layout of the aftertreatment configurations tested. APT = Accelerated Purification Technology; ASC = Ammonia Slip Catalyst; cDPF = Catalyzed Diesel Particulate Filter; DOC = Diesel Oxidation Catalyst; DPF = Diesel Particulate Filter; OEM = Original Equipment Manufacturer; SCR = Selective Catalytic Reduction.
Atmosphere 13 01682 g001
Figure 2. Operating engine maps and speed profiles of the WHVC (top panels) and ISC (bottom panels) test cycles. The slope applied over the ISC is also shown on a separate axis. ISC = In-Service Conformity Cycle; WHVC = Worldwide Harmonized Vehicle Cycle.
Atmosphere 13 01682 g002
Figure 3. Summary of Particle Number (PN) emissions following the Euro VI Step E evaluation methodology, for the tests where the OEM cDPF was used. Charts on the left, middle and right planes correspond to emission levels at DPF1 out, SCR and DPF2 out positions, respectively. Charts on the top, middle and bottom planes correspond to WHVC, ISC at 23 °C and ISC at 5 °C tests, respectively. Blue bars correspond to SPN23 while red bars correspond to SPN10. The error-bars indicate the maximum and minimum emissions, while the dashed lines indicate the applicable limit (6 × 10¹¹ #/kWh), while the numbers on top represent the conformity factor (ratio of average emissions over applicable limit). APT = Accelerated Purification Technology; cDPF = Catalyzed DPF; CF = Conformity Factor; DPF = Diesel Particulate Filter; ISC = In-Service Conformity Cycle; OEM = Original Equipment Manufacturer; SCR = Selective Catalytic Reduction; WHVC = Worldwide Harmonized Vehicle Cycle.
Atmosphere 13 01682 g003
Figure 4. Summary of Particle Number (PN) emissions following what has been proposed as post Euro VI evaluation methodology, for the tests where the OEM cDPF was used. Charts on the left, middle and right planes correspond to emission levels at DPF1 out, SCR and DPF2 out positions, respectively. Charts on the top, middle and bottom planes correspond to WHVC, ISC at 23 °C and ISC at 5 °C tests, respectively. Blue bars correspond to SPN23 while red bars correspond to SPN10. The error-bars indicate the maximum and minimum emissions, while the dashed lines indicate the proposed limits (2 × 10¹¹ #/kWh for budget, 5 × 10¹¹ #/kWh for 100th percentile, and 1 × 10¹¹ #/kWh for 90th percentile), while the numbers on top represent the conformity factor (ratio of average emissions over applicable limit). APT = Accelerated Purification Technology; cDPF = Catalyzed DPF; CF = Conformity Factor; DPF = Diesel Particulate Filter; ISC = In-Service Conformity Cycle; OEM = Original Equipment Manufacturer; SCR = Selective Catalytic Reduction; WHVC = Worldwide Harmonized Vehicle Cycle.
Atmosphere 13 01682 g004
Figure 5. Summary of Particle Number (PN) emissions following what has been proposed as post Euro VI evaluation methodology, for the tests where the DPFAPT filter was used in DPF1 position. Charts on the left, middle and right planes correspond to emission levels at DPF1 out, SCR and DPF2 out positions, respectively. Charts on the top and bottom planes correspond to WHVC and ISC at 23 °C tests, respectively. Blue bars correspond to SPN23 while red bars correspond to SPN10. The error-bars indicate the maximum and minimum emissions, while the dashed lines indicate the proposed limits (2 × 10¹¹ #/kWh for budget, 5 × 10¹¹ #/kWh for 100th percentile, and 1 × 10¹¹ #/kWh for 90th percentile), while the numbers on top represent the conformity factor (ratio of average emissions over applicable limit). APT = Accelerated Purification Technology; cDPF = Catalyzed DPF; CF = Conformity Factor; DPF = Diesel Particulate Filter; ISC = In-Service Conformity Cycle; OEM = Original Equipment Manufacturer; SCR = Selective Catalytic Reduction; WHVC = Worldwide Harmonized Vehicle Cycle.
Atmosphere 13 01682 g005
Figure 6. Comparison of the Solid Particle Number (SPN23) real time emission rates (2nd row panels), valid MAW (3rd row panels) and sorted MAW (bottom panels) over the ISC tests with the OEM cDPF at 23 °C (left-hand panels) and 5 °C (right-hand panels). Temperatures at the inlet of the OEM cDPF as well as ECU readings of its fill state are also shown in the top panels. The shaded colored area at the beginning of the tests illustrate the cold phase of the cycles as defined in the Euro VI step E regulation. cDPF = Catalyzed DPF; DPF = Diesel Particulate Filter; ECU = Electronic Control Unit; ISC = In-Service Conformity; OEM = Original Equipment Manufacturer; MAW = Moving Average Window.
Atmosphere 13 01682 g006
Figure 7. Left-hand panel: Quantified ratios of SPN10 to SPN23 as a function of the ratio of SPN10 concentrations at the outlet of the SCR to those at the outlet of the DPF1 for all cycles tested. Middle panel: example illustration of the fraction of a lognormal distribution detected by a SPN10 and SPN23 device based on typical detection efficiencies for a 15 nm size distribution. Right panel: Calculated ratios of SPN10 to SPN23 concentration ratios as a function of geometric mean diameters (dg) for two geometric standard deviations (σg). DPF = Diesel Particulate Filter; SCR = Selective Catalytic Reduction; SPN = Solid Particle Number.
Atmosphere 13 01682 g007
Figure 8. Solid Particle Number (SPN) concentrations (bottom panel) at the outlet of the SCR during the speed ramp tests, as measured with CS2 at its default VPR operating temperature of 350 °C and CS1 set at a VPR temperature of 250 °C. The corresponding velocity profile as well as the temperatures measured at the inlet of the SCR and in front of the urea injector are shown on the top panel. The dashed vertical line only serves as a guideline depicting the start of urea injection based on the temperature measurements. CS = Catalytic Stripper; SCR = Selective Catalytic Reduction; VPR = Volatile Particle Remover.
Atmosphere 13 01682 g008
Figure 9. SPN concentrations (bottom panel) at the outlet of the SCR during the speed ramp tests as measured with CS2 at its default VPR operating temperature of 350 °C and ET system set at a VPR temperature of 250 °C. The corresponding velocity profile as well as the temperatures measured at the inlet of the SCR and in front of the urea injector are shown on the top panel. The dashed vertical line only serves as a guideline depicting the start of urea injection based on the temperature measurements. CS = Catalytic Stripper; ET = Evaporation Tube; SCR = Selective Catalytic Reduction; VPR = Volatile Particle Remover.
Atmosphere 13 01682 g009
Figure 10. Temperatures (top panel), pressure drops (middle panel) and SPN concentrations (bottom panel) over two passive regeneration measurements with the OEM cDPF (left-hand panels) and DPFAPT (right-hand panel). In the tests with the OEM cDPF, the ET system was employed for the measurements of SPN downstream of the DPF2. cDPF = Catalyzed DPF; CS = Catalytic Stripper; DPF = Diesel Particulate Filter; EO = Engine Out; ET = Evaporation Tube; OEM = Original Equipment Manufacturer; SPN = Solid Particle Number.
Atmosphere 13 01682 g010
Table 1. Test protocol.
DayCycleSetupDPF1DPF2Temperature (°C)
1WHVC cold1st setupOEMDPFAPT23
1WHVC hot1st setupOEMDPFAPT23
1Speed ramp1st setupOEMDPFAPT23
1Conditioning1st setupOEMDPFAPT23
2ISC1st setupOEMDPFAPT23
2Conditioning1st setupOEMDPFAPT23
3ISC1st setupOEMDPFAPT5
3Conditioning1st setupOEMDPFAPT23
4WHVC cold 12nd setupDPFAPTDPFAPT23
4Conditioning2nd setupDPFAPTDPFAPT23
5ISC2nd setupDPFAPTDPFAPT23
5Speed ramp2nd setupDPFAPTDPFAPT23
5Conditioning2nd setupDPFAPTDPFAPT23
6WHVC cold2nd setupDPFAPTDPFAPT23
6WHVC hot2nd setupDPFAPTDPFAPT23
6WHVC cold 23rd setupOEMNone23
6WHVC hot3rd setupOEMNone23
6Conditioning3rd setupOEMNone23
7WHVC cold3rd setupOEMNone23
7WHVC hot3rd setupOEMNone23
1 Subsequent WHVC hot test lost due to problems with data logging; 2 Soaking period for the specific test was shortened to 4 h, with coolant and aftertreatment devices temperature being 30 °C at the start of the test.
Table 2. Instrumentation position.
DayEngine OutDPF1 OutletSCR OutletDPF2 Outlet
1 1NoneCS1CS2ET
2NoneCS1CS2ET
3NoneCS1CS2ET
4ET + ext. CSCS1CS2CS3
5 2ET + ext. CSCS1CS2CS3
6ET + ext. CSCS1CS2CS3
7ET + ext. CSCS1CS2CS3
1 During the speed ramp test the CS1 device was moved in SCR outlet position; 2 During the speed ramp test the ET device was moved in SCR outlet position. The external CS installed in the specific instrument was removed for the specific test. CS = Catalytic Stripper; DPF = Diesel Particulate Filter; ET = Evaporation Tube; SCR = Selective Catalytic Reduction for NOx unit.
Publisher’s Note: MDPI stays neutral with regard to jurisdictional claims in published maps and institutional affiliations.

