1. Introduction
Particle emissions are known to be detrimental to health, as shown by Kappos et al. [
1] and, more recently, by Dominski et al. [
2], de Marco et al. [
3], and Manisalidis et al. [
4]. To mitigate or prevent these effects, a greater understanding of particle emissions, including the sources of particle generation, is needed.
Traffic-generated emissions are one of the main sources of the total particle emissions in cities [
5], and may exceed exhaust emissions according to Harrison et al. [
6]. Airborne particles emitted from the transport sector can be divided into two main categories: exhaust emissions and non-exhaust emissions. A significant part of non-exhaust particle emissions in cities come from the wear of vehicle components such as tires and brakes.
Non-exhaust emissions tend to contain a significant proportion of heavy metals such as zinc, copper, and iron, among others, inducing a series of adverse health impacts such as lung inflammation and DNA damage [
7,
8,
9]. It is therefore suggested that they be included in the next European emission standards, Euro 7 (E-002194/2021).
Most of the studies on non-exhaust emissions have focused on brake and/or tire emissions (e.g., [
10,
11,
12]). However, very few studies in the literature seem to focus on dry-clutch particle emissions. The only paper found by the authors was published in the 1970s by Jacko et al. [
13], who studied airborne emissions from dry clutches and different kinds of brakes. However, this study focused on asbestos, which is no longer used. Since no recent studies can be found in the literature, there is a need for an investigation into airborne emissions from the wear of dry clutches used in today’s passenger cars.
Dry clutch transmissions are one of the most common types of transmissions in passenger vehicles [
14]. Clutches are worn down, primarily abrasively [
11] due to slip, which essentially occurs when the input and output shafts do not have the same rotational speed. Throughout this wear process, particles are generated and released into the surrounding gearbox housing. The mating surface is, in most cases, directly bolted against a combustion engine, with or without a seal (depending on the manufacturer), thereby resulting in a potential leak source.
It is, however, unclear whether dry clutch emissions become airborne. To be able to measure whether this leak source is substantial, or existent at all, there is a need for a testing rig that allows for accurate and reproducible particle emissions measurements in a controlled environment. The purpose of the current study is therefore: (1) to develop such a rig, and (2) to perform measurements to verify the reproducibility of the rig, as well as (3) to obtain preliminary results of size and concentration characteristics of airborne particle emissions from dry clutches.
2. Dry Clutches
Dry clutches are used in manual transmission passenger cars, as well as in automatic transmission passenger cars with a robotic transmission.
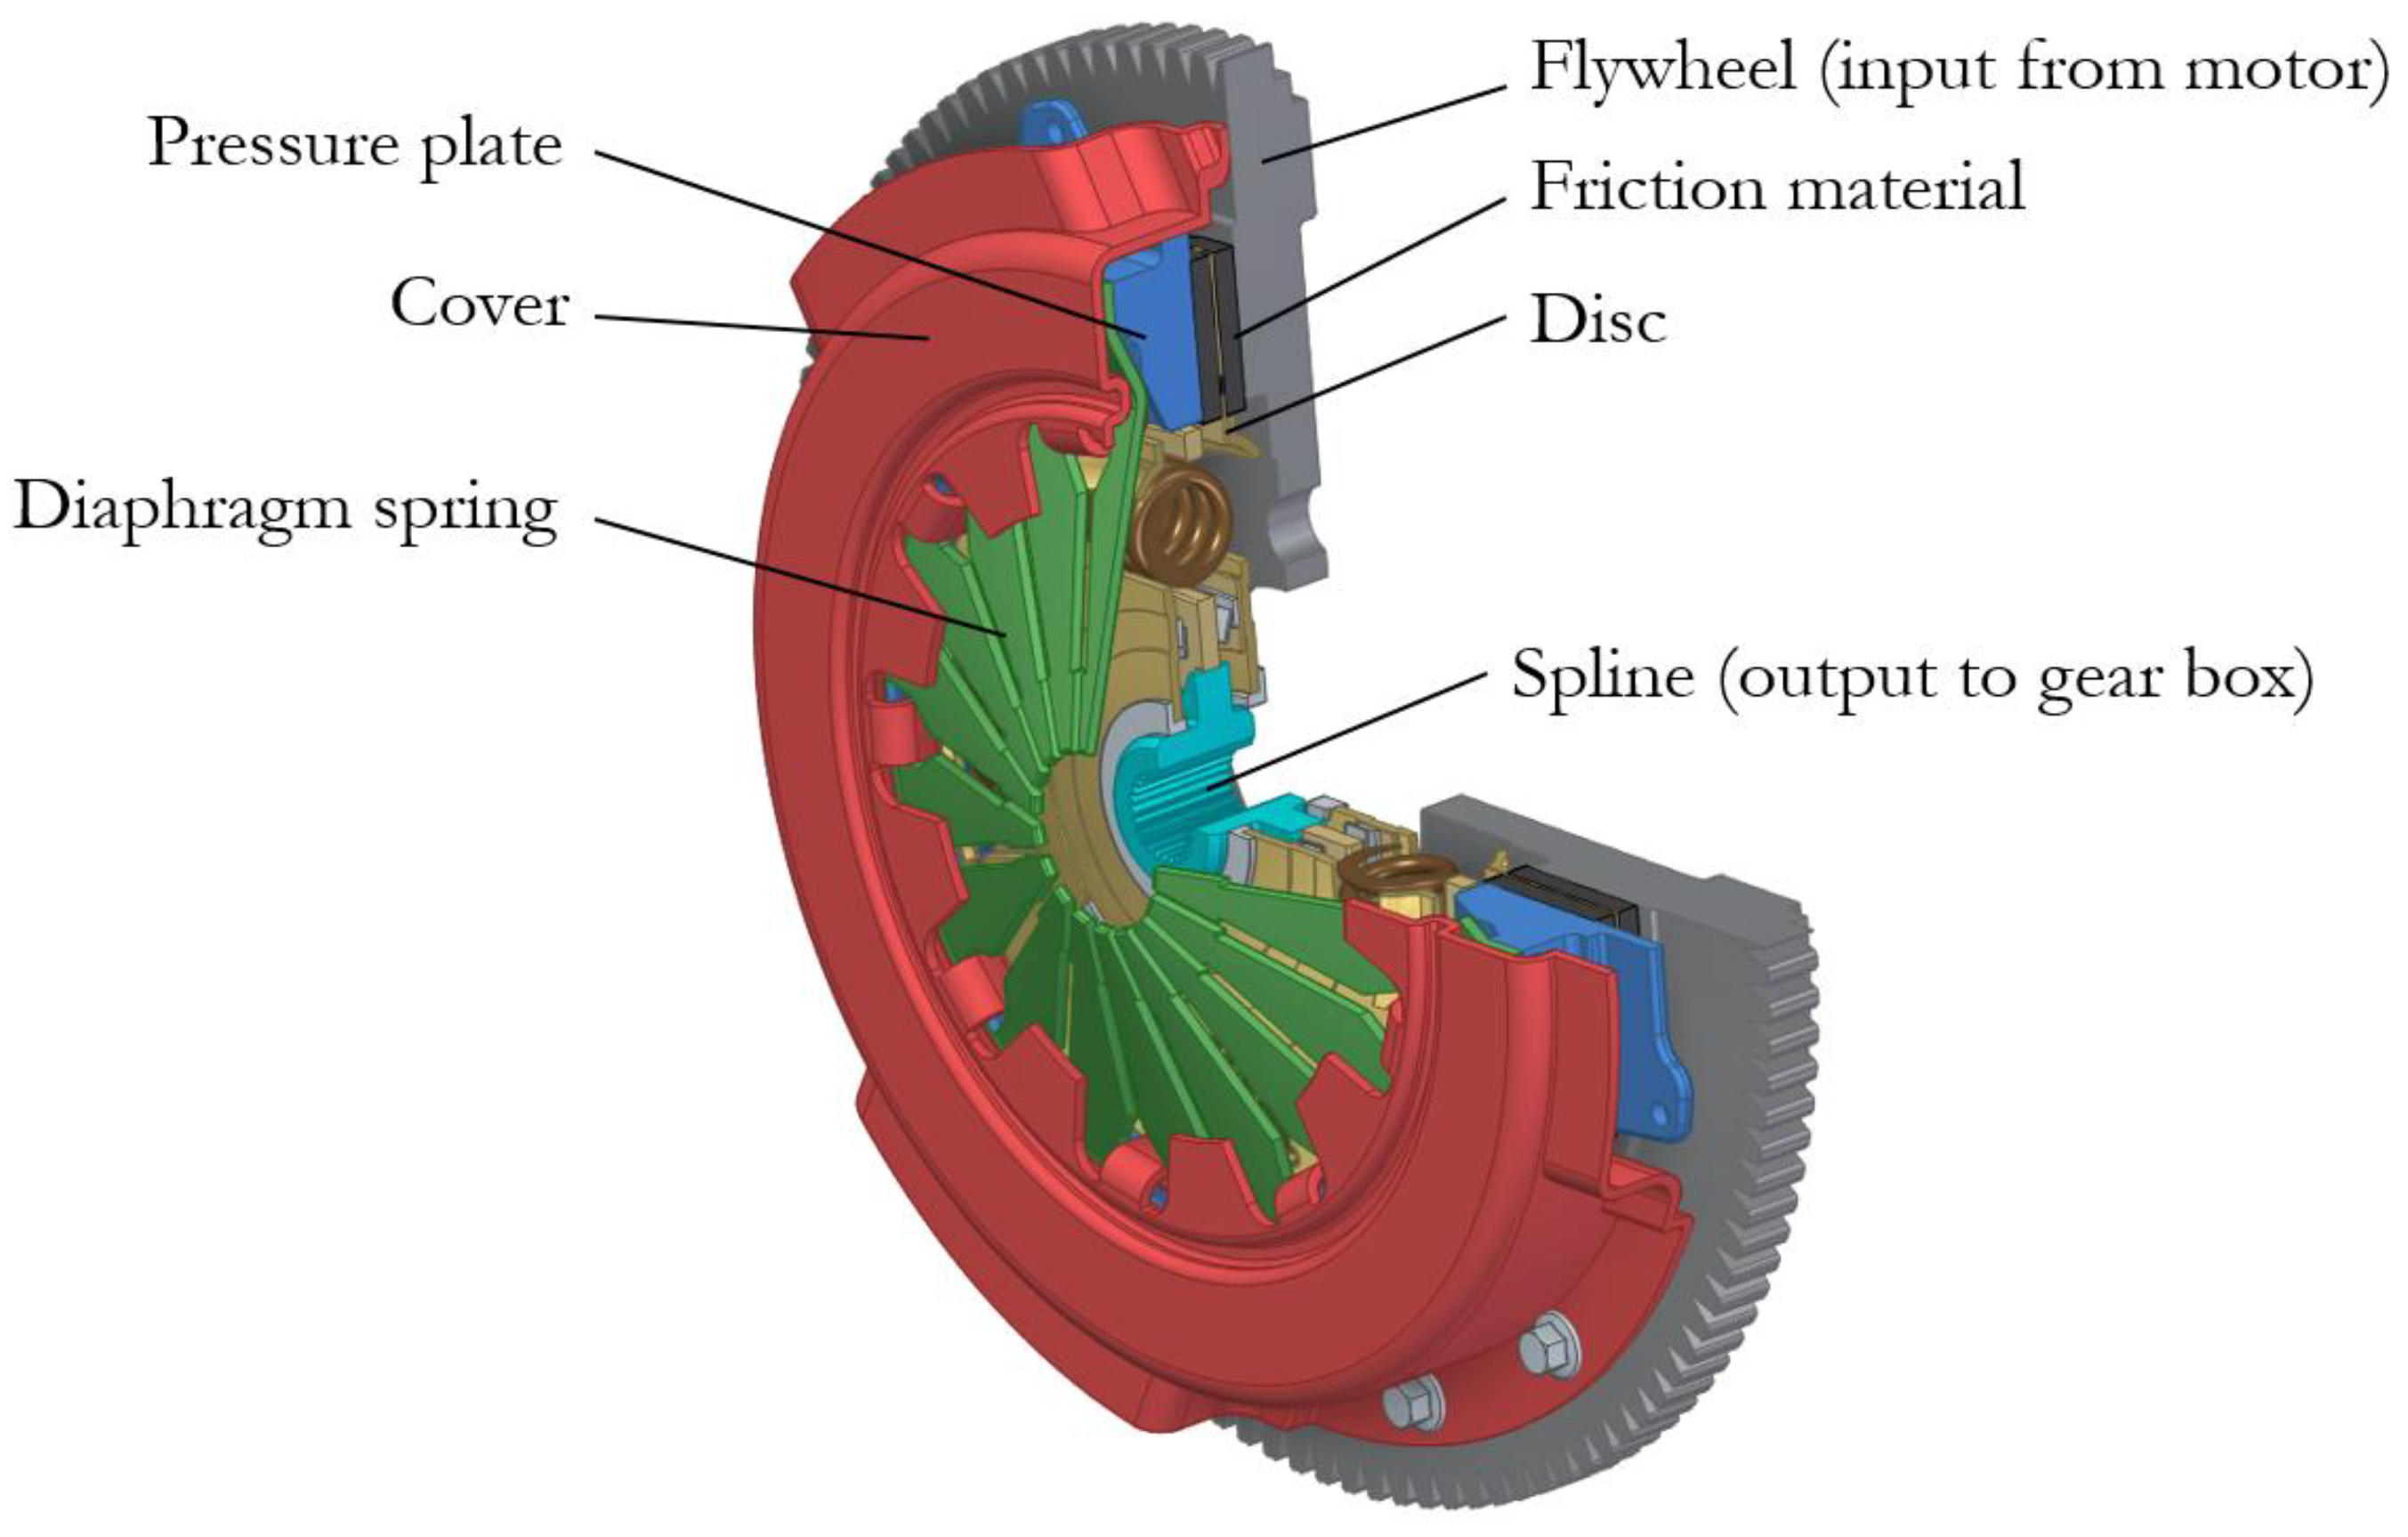
A typical dry clutch configuration can be seen in
Figure 1. The clutch cover containing the pressure plate and the diaphragm spring is bolted against the flywheel, clamping the friction plate in between. Note that not all friction plates are symmetrical, but rather have the spring centre containing the cushion springs extruded in one direction. In an unloaded state, the clamping force is at its highest. When the clutch pedal in a manual transmission vehicle is depressed, the release fork applies force on the diaphragm spring via the throw-out bearing, which makes the pressure plate retract; this effectively disconnects the engine from the gearbox, since the friction plate is no longer clamped between the flywheel and the pressure plate.
A running combustion engine in a vehicle that is not in motion is labelled as idling. In this state, no torque is transferred through the clutch and there is no connection between the engine and the wheels. To propel the vehicle, a gear is selected, and the clutch is engaged by releasing the clutch pedal. This axially loads the clutch, creating a clamping force.
During an engagement, there is a dynamic relationship in the rotational speed between the engine (flywheel) and wheels (friction plate). This phenomenon is called slip, which is the primary reason for the abrasive wear in a clutch. Pisaturo et al. [
15] suggest an average slip speed of approximately 100 rad/s during a fast acceleration from a standstill.
According to Pisaturo et al. [
15], slipping the clutch during a three-second engagement process can induce thermal power peaks of over 25 kW. This heat is generated in the contact surfaces between the flywheel, the friction plate, and the pressure plate. This results in a total temperature rise of 30 °C, generating approximately 35 kJ of heat energy during an engagement.
A typical passenger car friction plate is laminated with a friction material. There are several types of friction materials that are used in a passenger vehicle application; the most common one is an organic material [
16]. They are typically made of fibre reinforcements, binders, friction modifiers, and fillers, similar to brake friction materials. According to datasheets describing a typical engineering application of organic friction material, the dynamic coefficient of friction (CoF) only varies slightly in the temperature range of 50 to 250 °C [
17]. According to the authors of [
15], the CoF of the material varies largely with the contact pressure and the slip speed [
18].
3. Clutch Tribometer Design
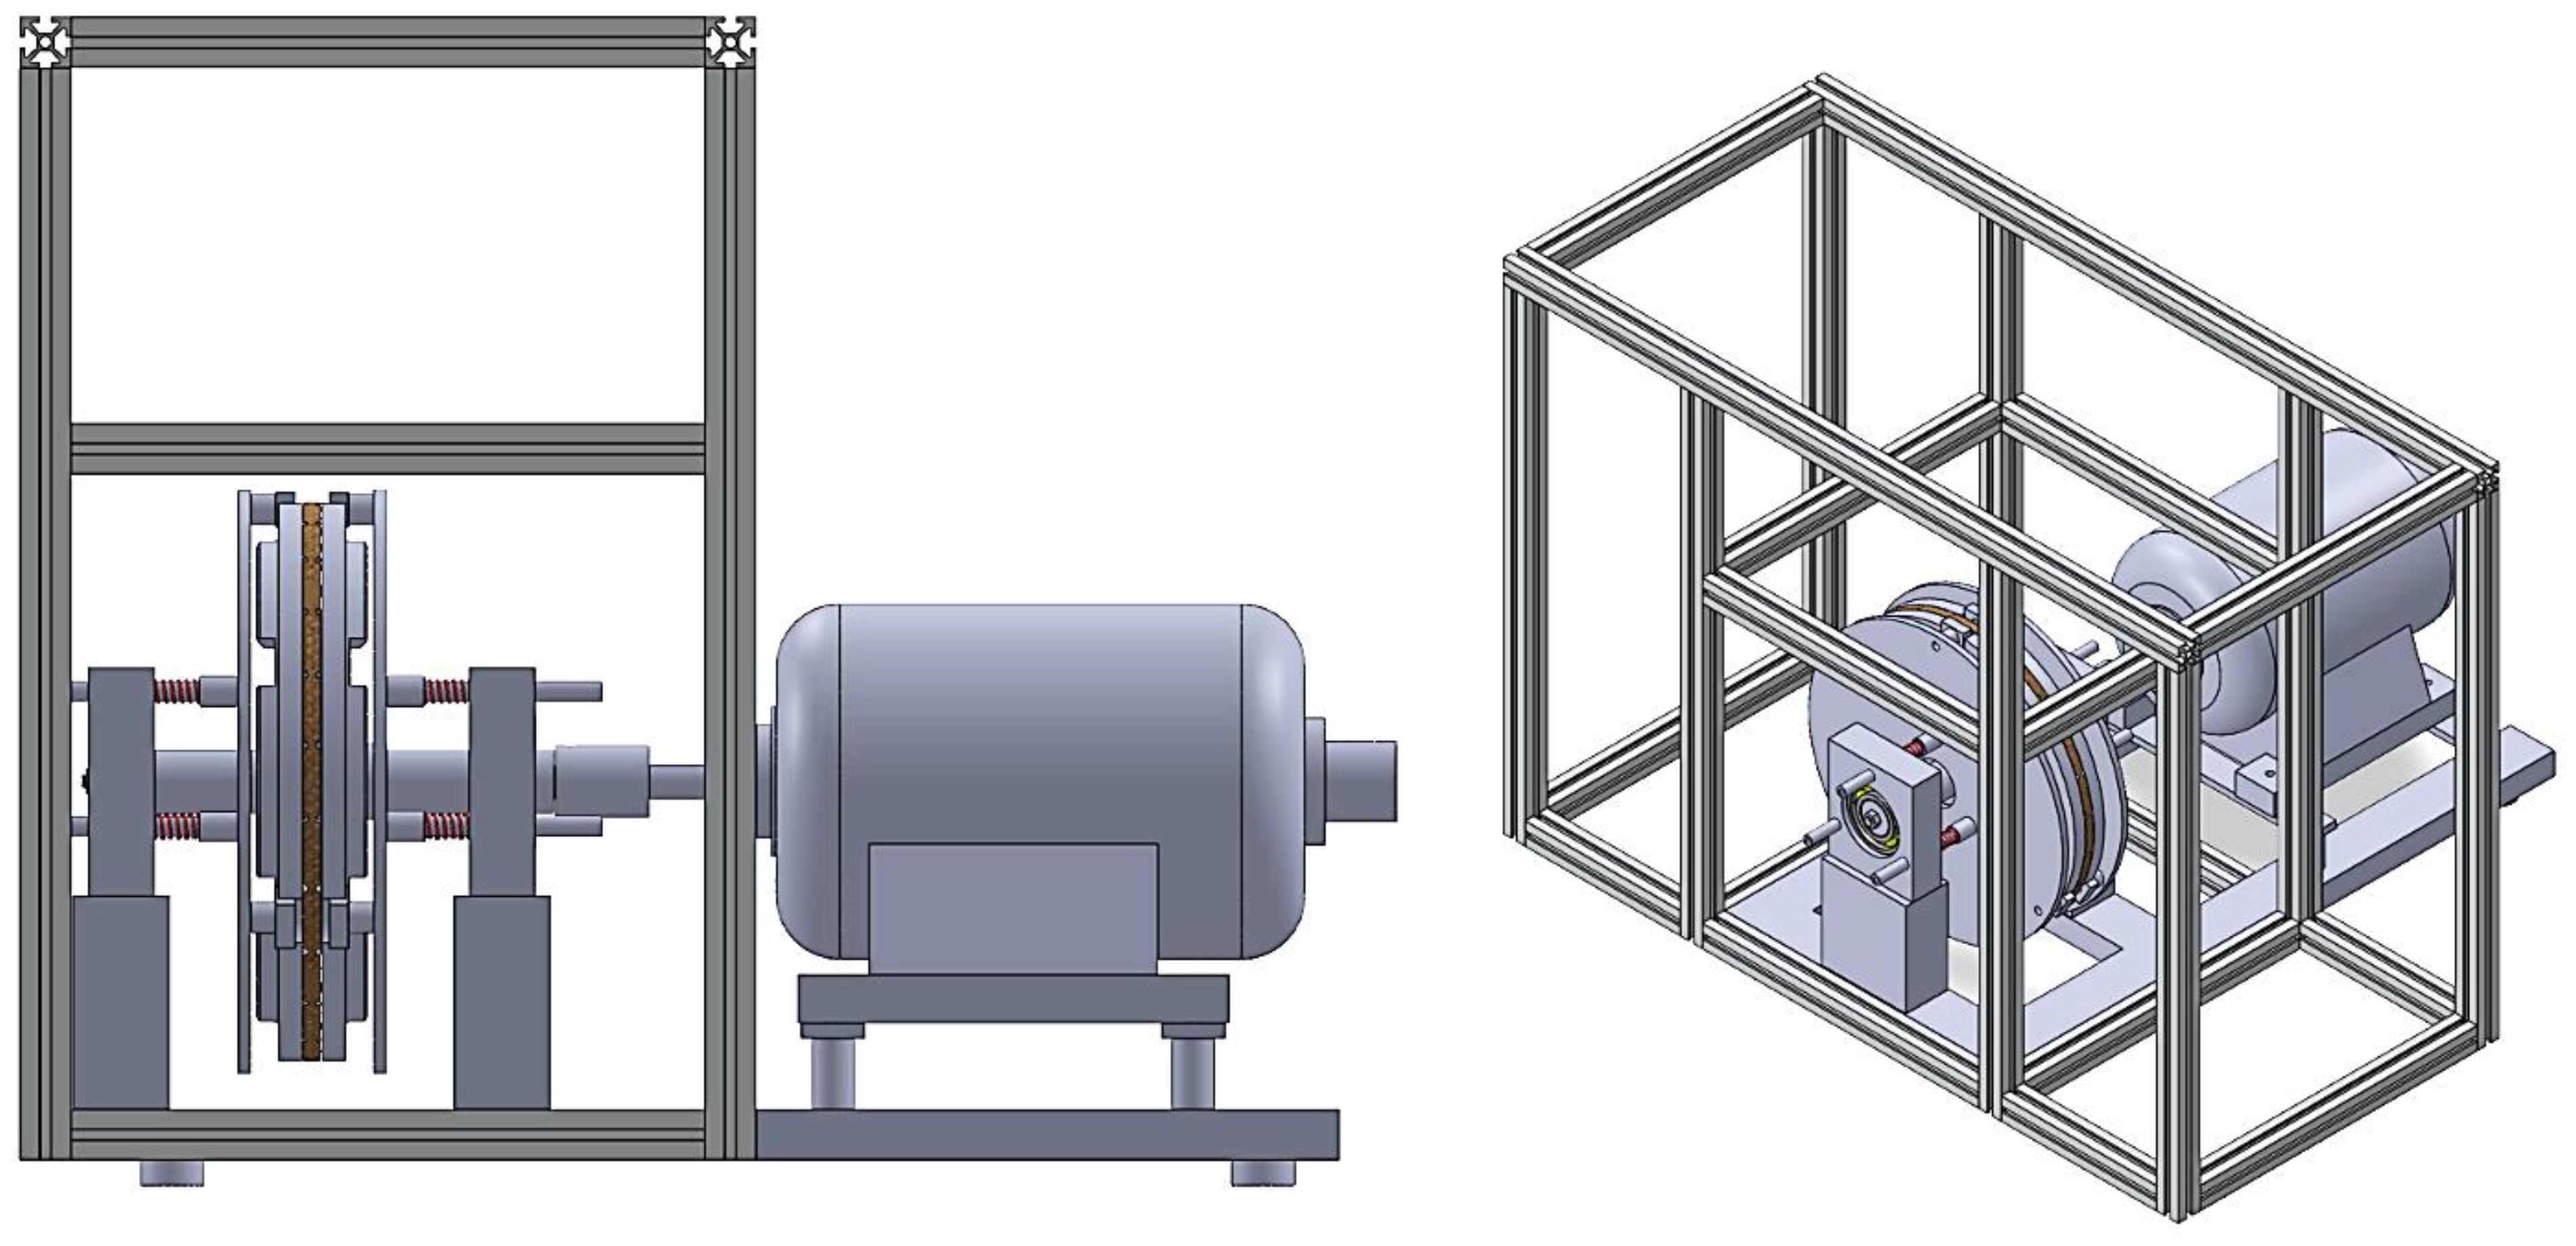
In the clutch tribometer setup, a friction plate is mounted on a shaft driven by an electric motor and secured to a frame. Two pressure plates, one on either side of the friction plate, can slide axially on pins but are prevented from rotation. They are pressed against the friction plate by springs. This represents the clutch used in a passenger car, using whole, unmodified parts, i.e., no cut-outs. The clutch is found in a large number of vehicles currently on European roads, including the Audi A3, the Seat Ibiza, the Škoda Octavia, and the Volkswagen Golf. The clutch tribometer design is shown in
Figure 2.
One box, referred to as the inner box, encapsulates the clutch. This box is then encapsulated by another outer box. The inner box represents the clutch housing, which, in an automobile application, may be fully closed or open to some extent, depending on the presence of seals or an inspection hole. The outer box represents the surrounding of the car, and is used as a controlled environment during the testing. Both boxes consist of acrylic glass supported by aluminium frames.
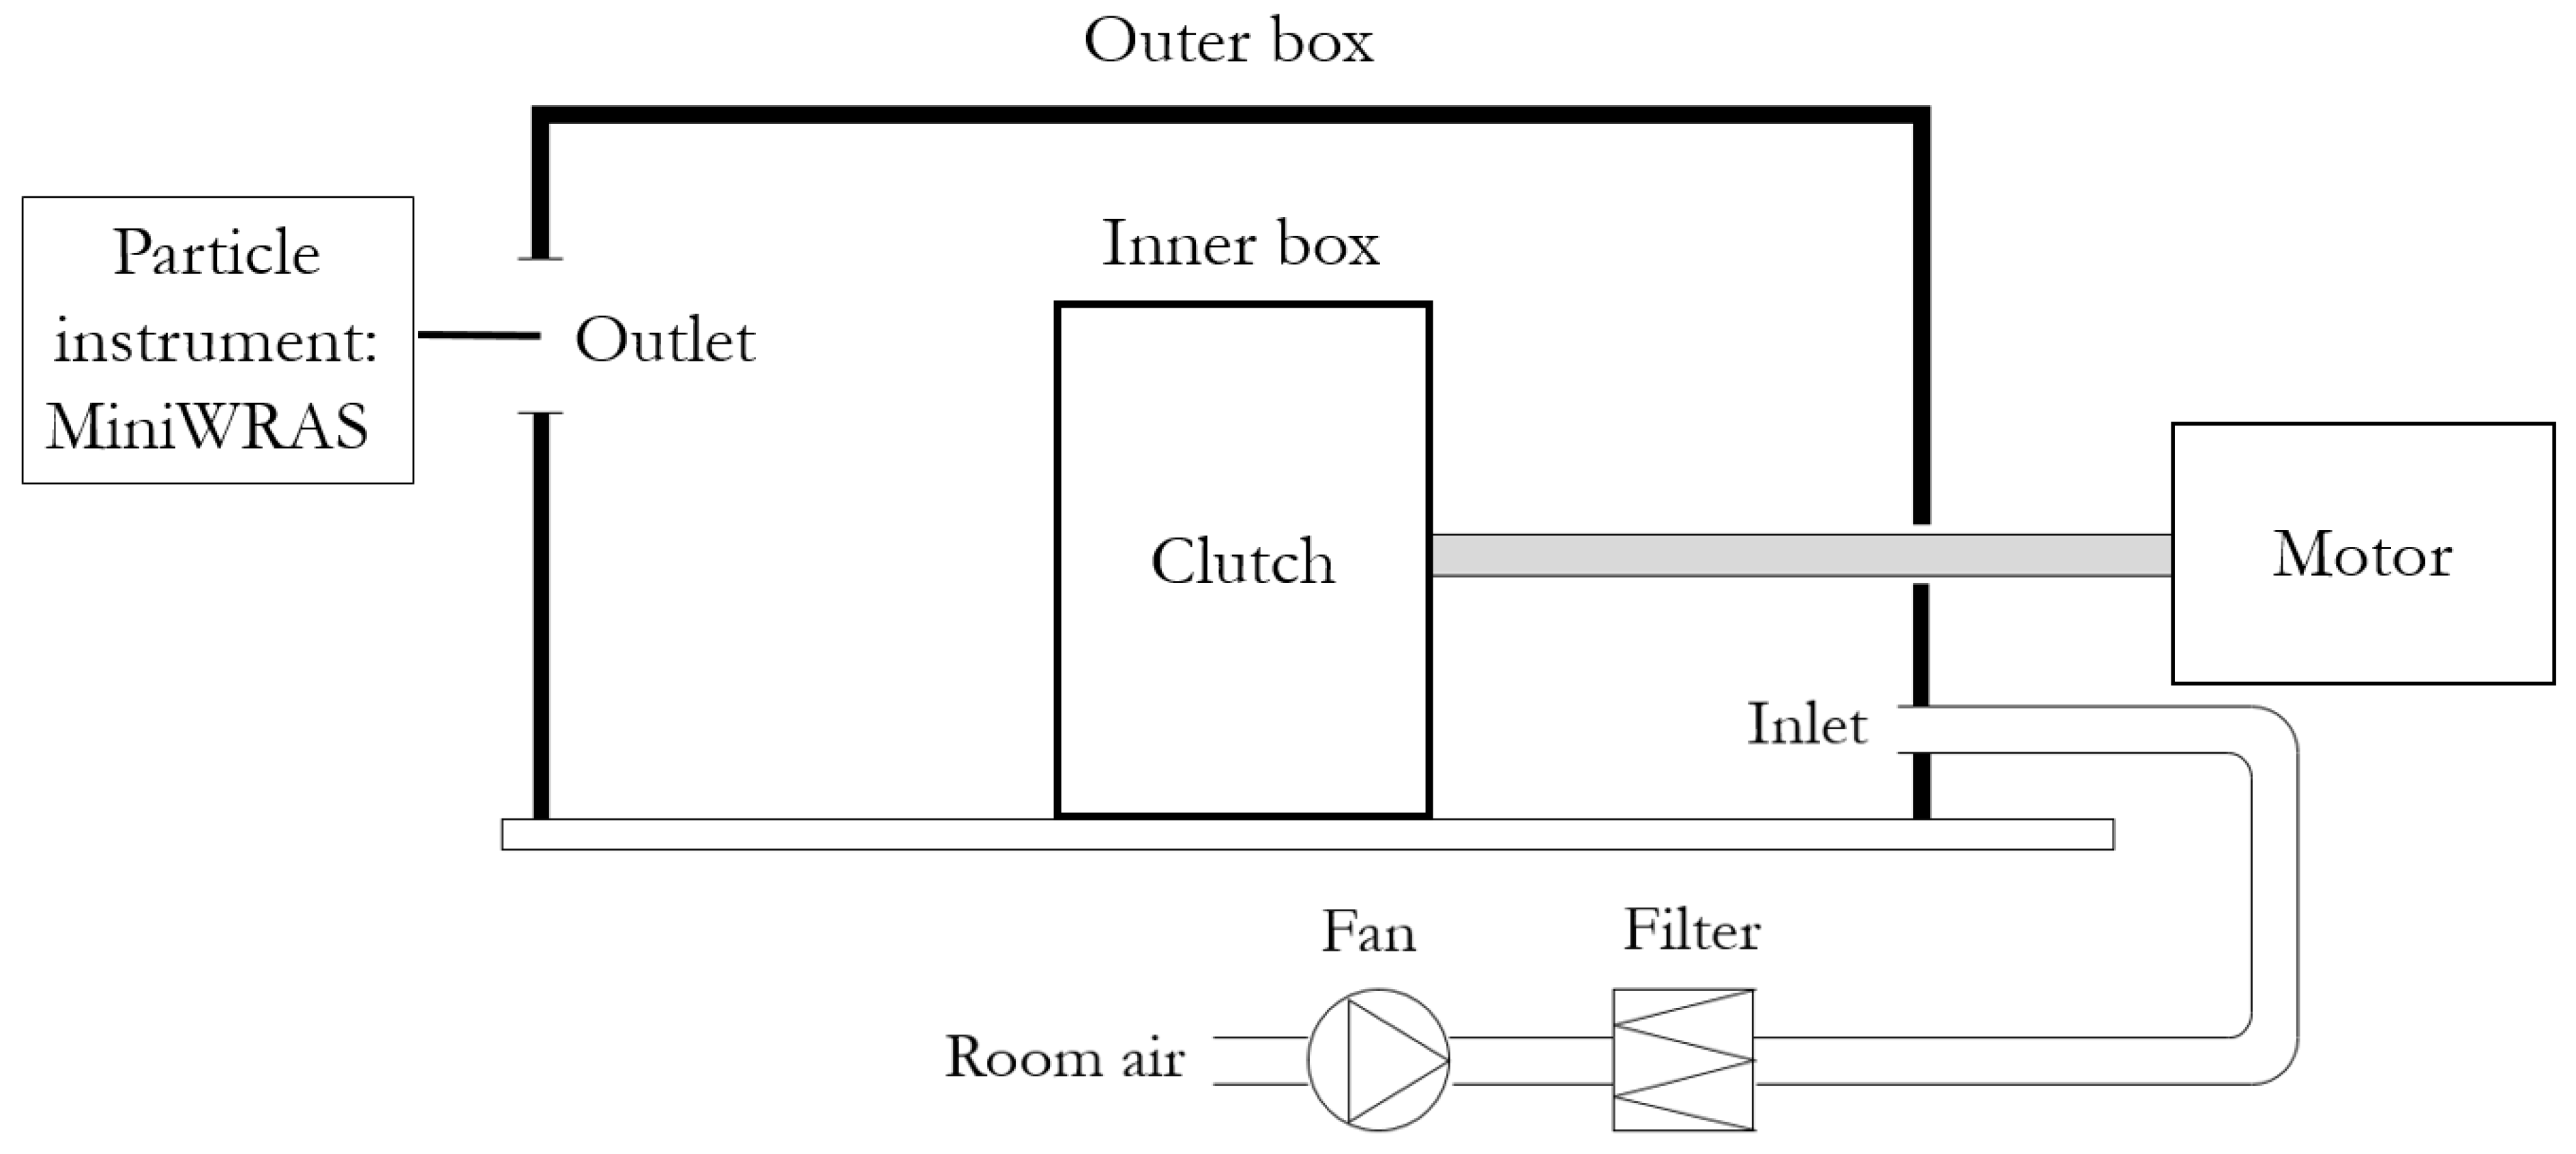
A schematic overview of the whole test setup can be seen in
Figure 3. A similar approach to that used by Alemani et al. [
19] for sampling airborne wear particles from brakes, is used in this study to measure the particles generated from the dry clutches. The outer box is given a unique inlet and outlet. An Allentown Ecoflo™ HEPA filter supplies clean air through the inlet. The inlet airflow creates an overpressure inside the box, making it hard for particles from the outside to enter through the outlet. In addition, the clean air supply ensures that the particles measured at the outlet will only originate from the wear of the clutch.
To investigate whether airborne wear particles are created in the clutch, it is not enough to create a situation where wear occurs. It is also crucial that the airflow is such that it effectively carries emitted particles to the outlet where they are measured. With a poorly placed inlet and outlet, it would be possible to blow too much clean air directly from the inlet to the outlet, thus reporting a false negative result, making the emitted particles unmeasurable. With the current placement of the inlet and the outlet, the inlet air is forced to flow through the clutch before reaching the outlet.
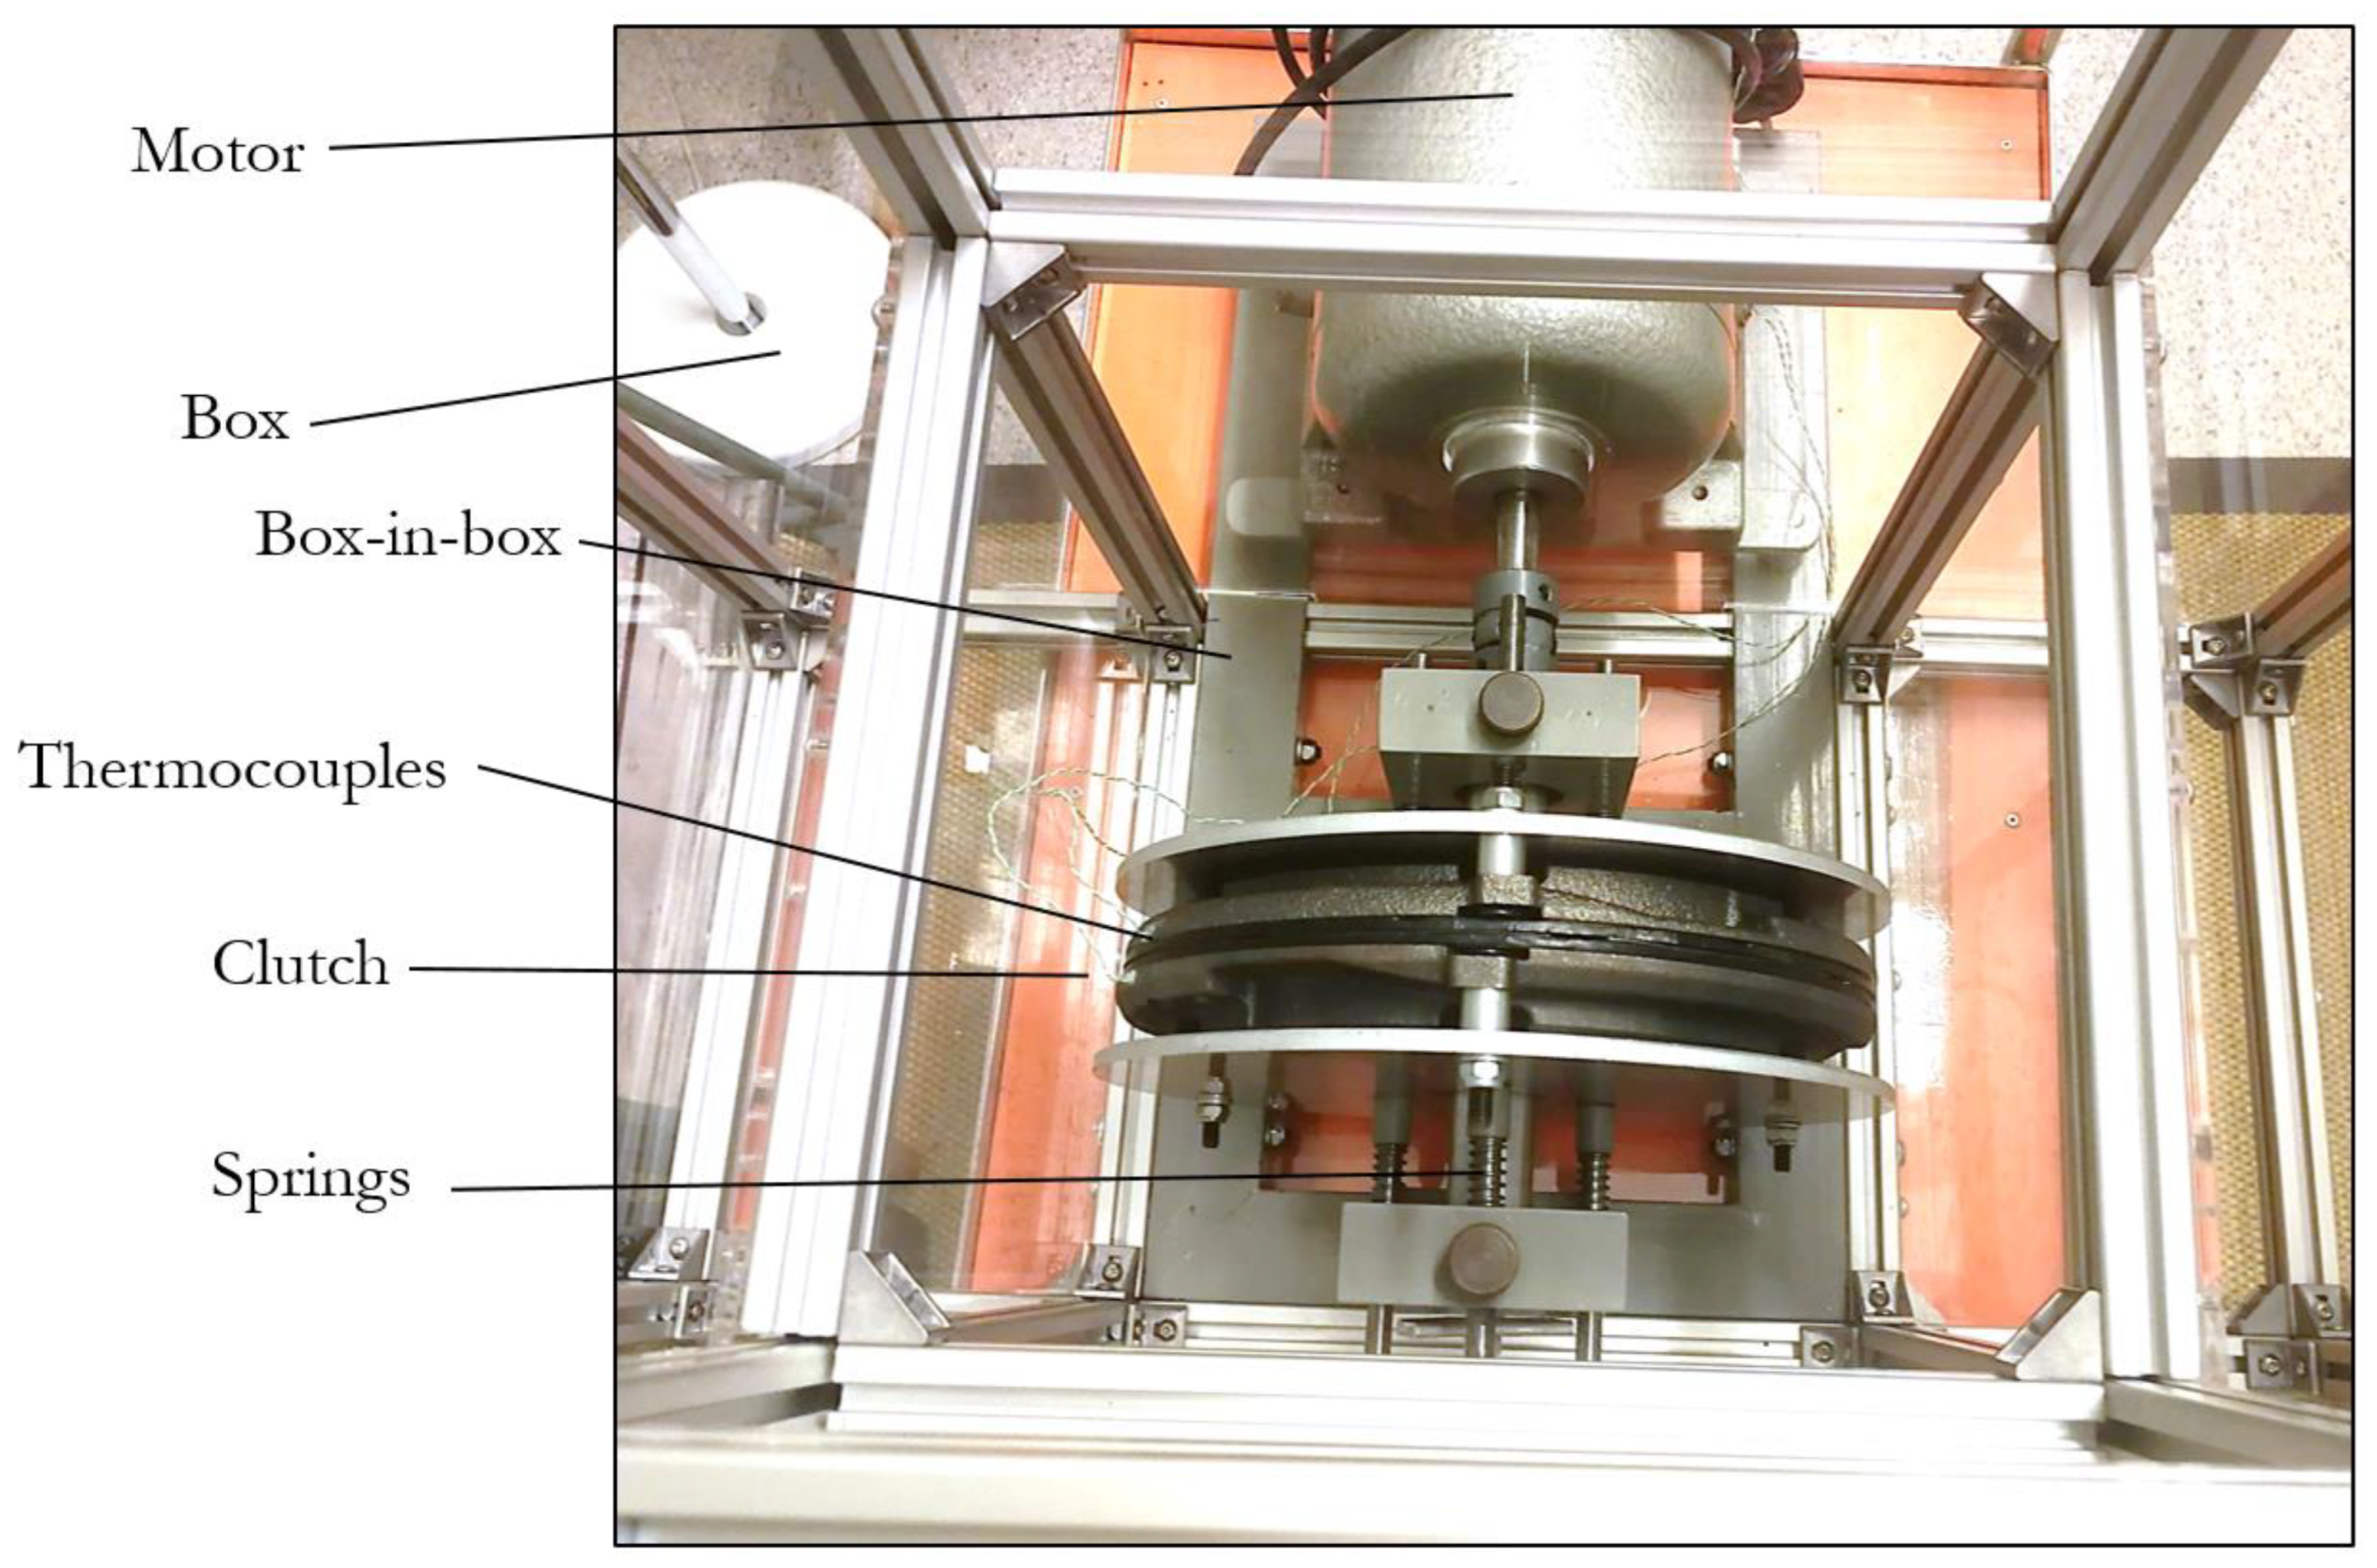
To measure the temperature, two thermocouples of type K were mounted, one in each pressure plate, approximately 1 mm beneath the contact surfaces. These positions were chosen because the pressure plates are stationary, and also because they experience the majority of the heat increase due to the much greater thermal conductivity, compared to the friction material. The temperatures were logged using a PICO® TC-08 thermocouple Data Logger.
A top view photo of the rig is shown in
Figure 4 to facilitate the comprehension of the design.
4. Conditions of Preliminary Tests
In the current tests, the top lid of the inner box was removed, representing a situation of large leakage around the friction plates. The tests were run at a constant rotational speed of 2200 rpm. The load was applied by springs that correspond to a force of 16 N.
Four repetitions were conducted under this same test condition. The temperatures were logged with 1 Hz frequency. Each test was started when the temperature was below 35 °C, and stopped when the temperature was above 70 °C. Within this temperature range, it could be assumed that the CoF between the friction materials and the pressure plate is stable [
17].
The inlet airflow was set to 4 m3/h. With an outer box volume of 0.08 m3, this results in an air exchange rate of 50 1/h. The particle instrument for sampling the emitted particles was a GRIMM Mini Wide-Range Aerosol Spectrometer (MiniWRAS®) Model 1371. It measured airborne particles with a size range from 10 nm to 35 µm electrically (10–193 nm), and optically (0.253–35 µm) at 41 size channels. The particle number range was 3–500 p/dm3 electrically and 0–3,000,000 p/dm3 optically. The airflow rate of MiniWRAS was 1.2 L/min and the measurement interval was 1 min.
After each test, the fan was used to flush the boxes to ensure that no residual particles from previous tests were left in the boxes.
5. Results
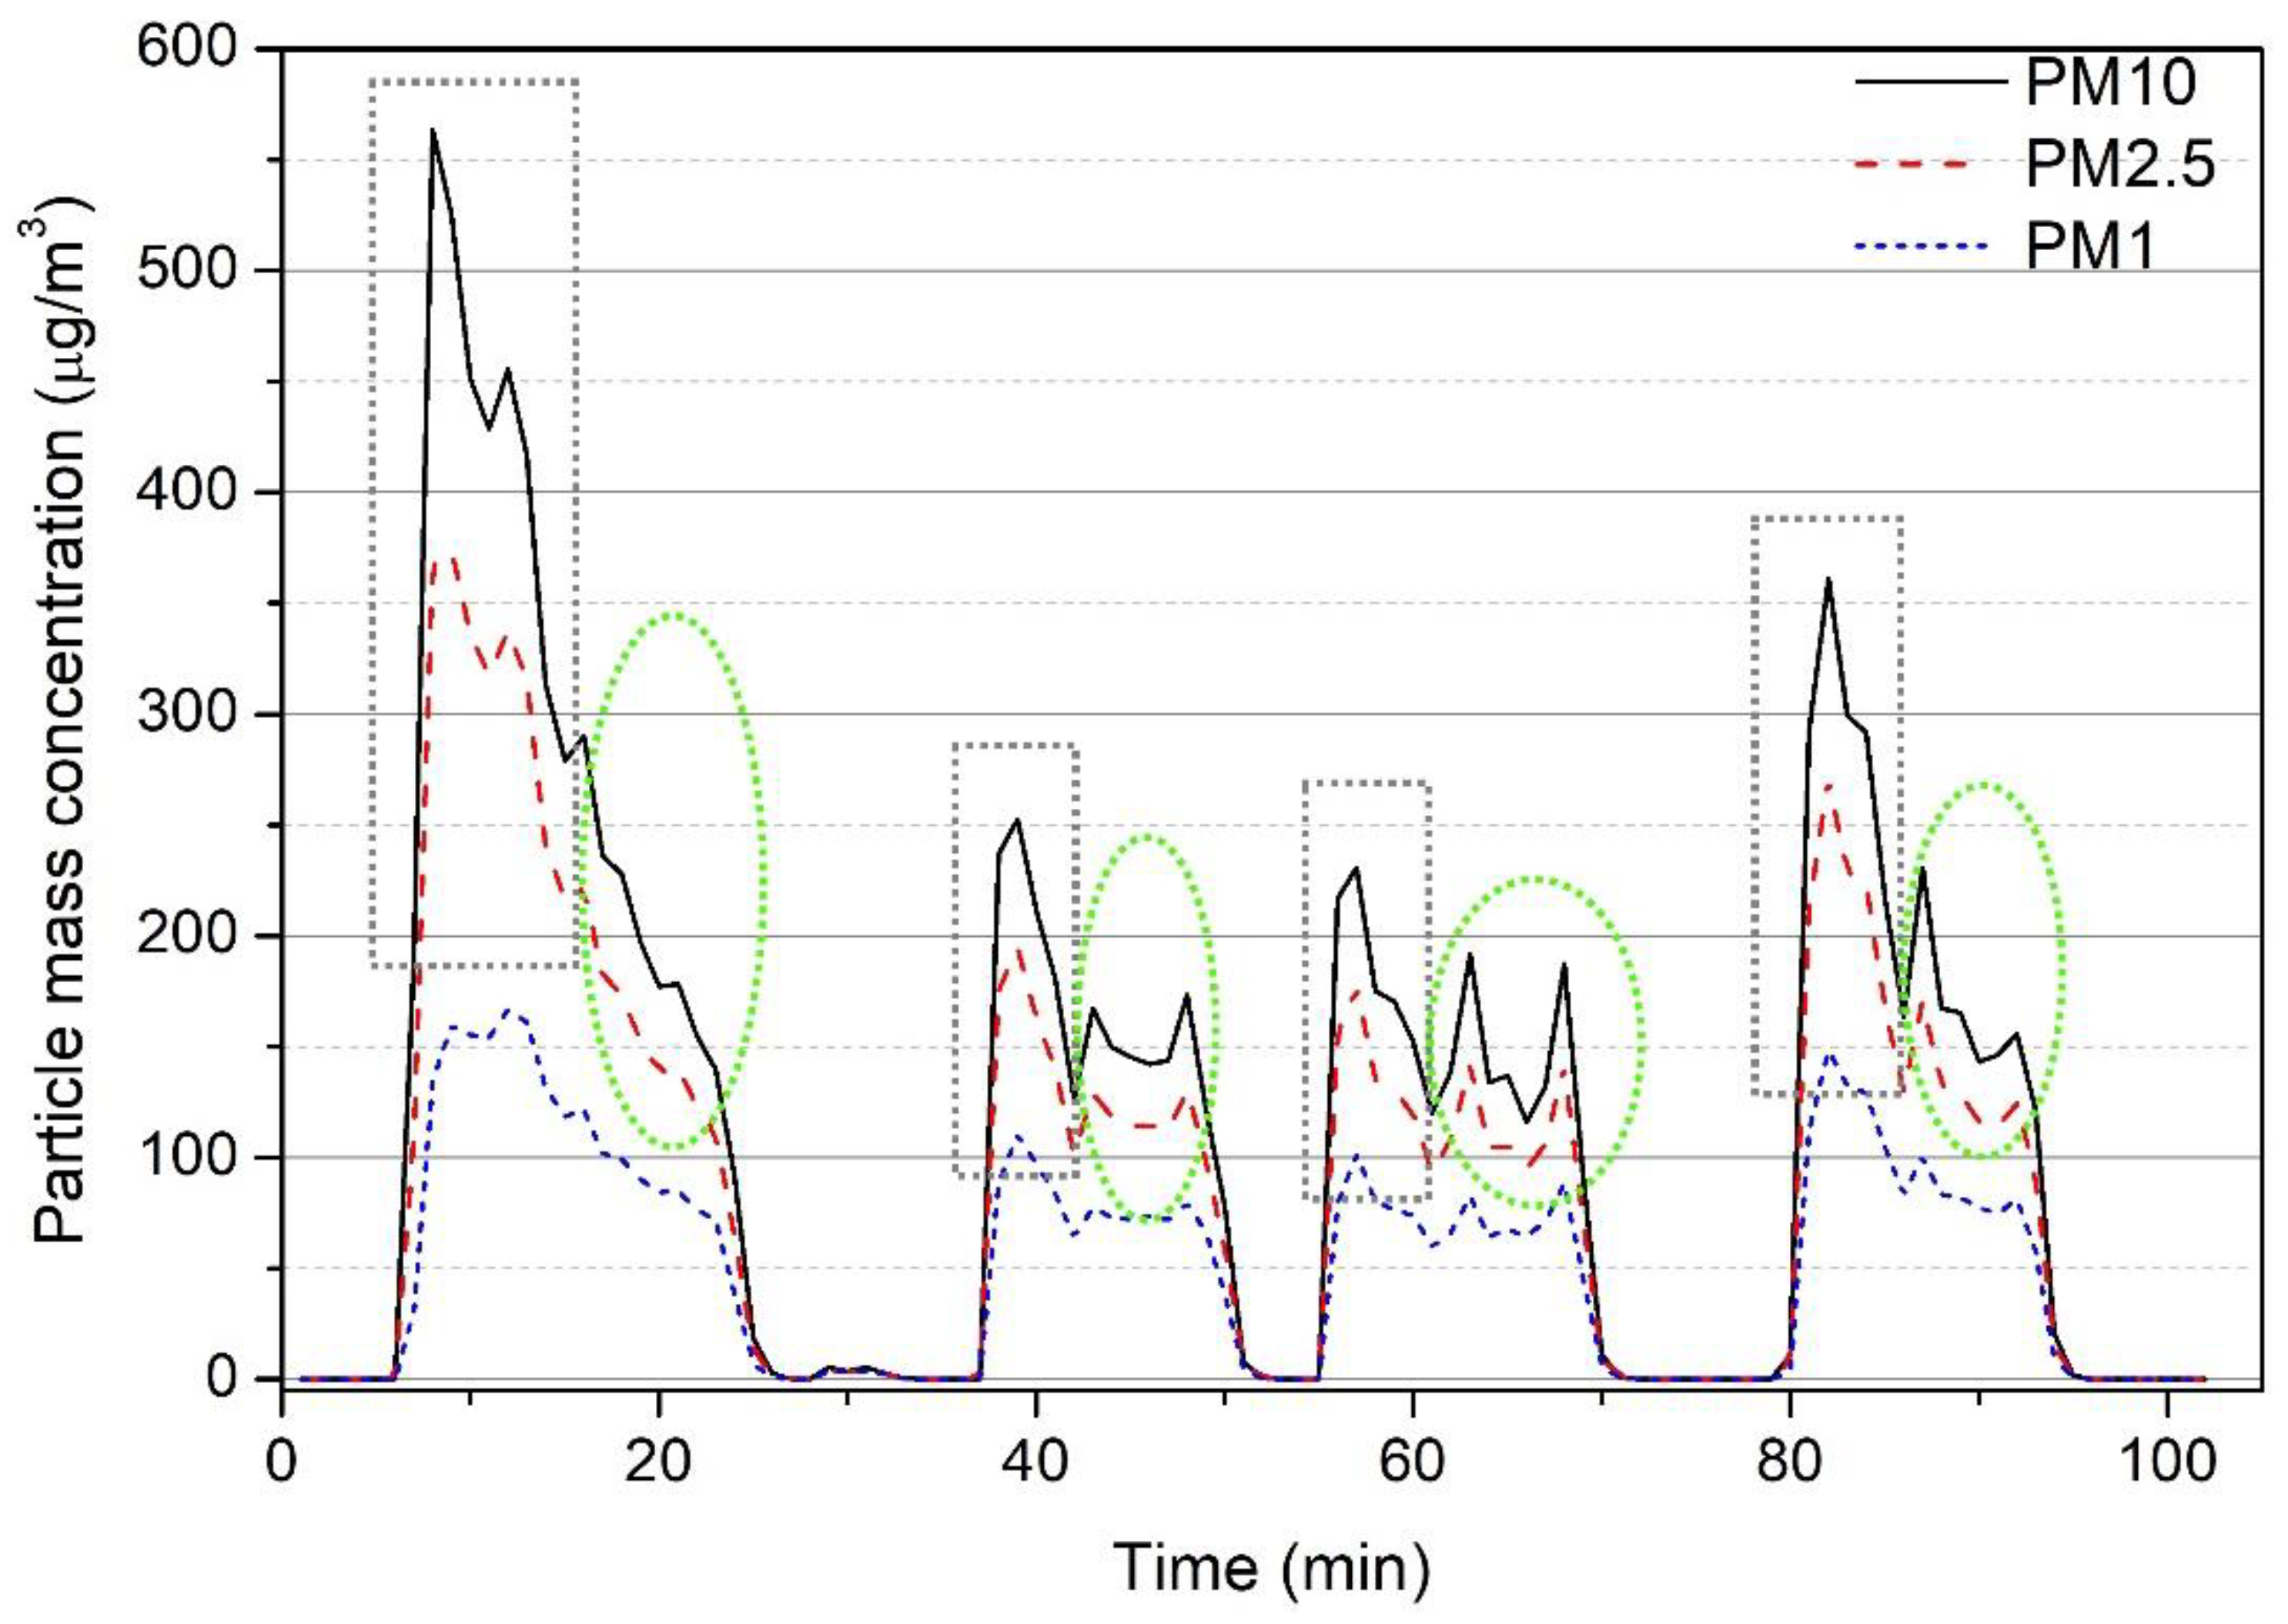
The measured PM10, PM2.5, and PM1 concentrations are presented in
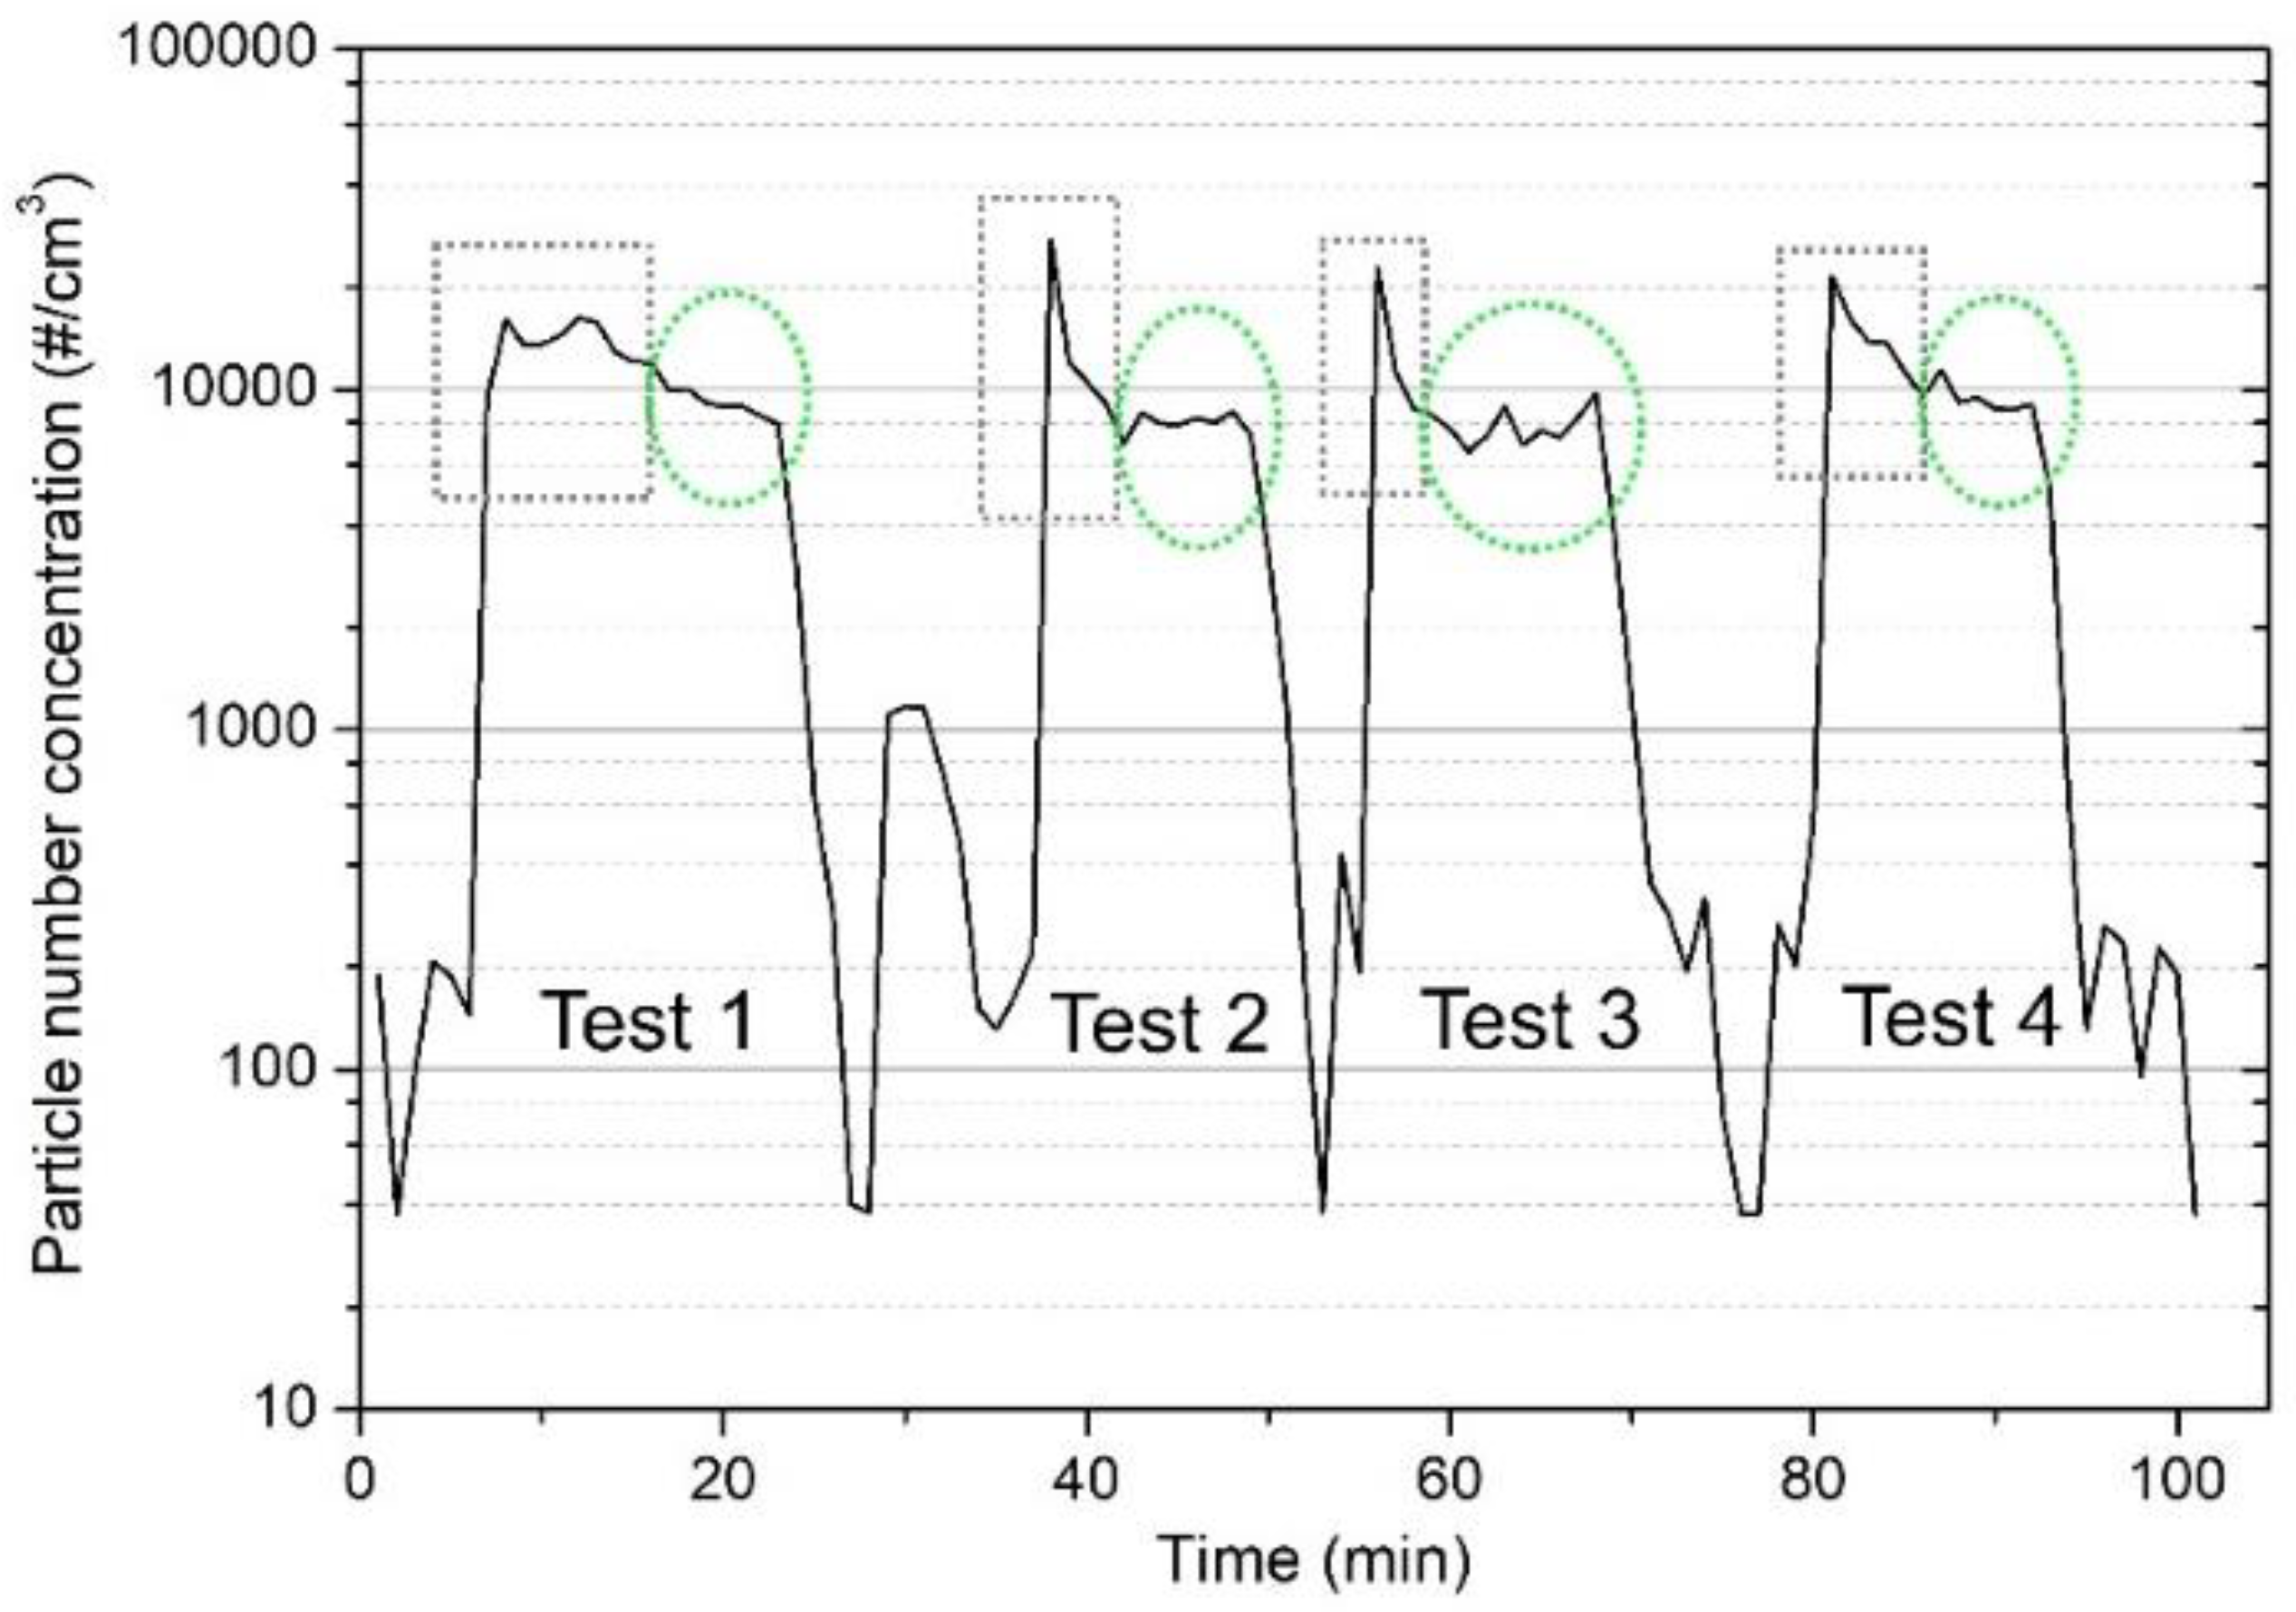
Figure 5 and the total particle number concentration (PNC) is presented in
Figure 6. It can be seen from
Figure 5 and
Figure 6 that each test run shows a high-peaked running-in period (the grey rectangle areas in
Figure 5 and
Figure 6) at the beginning of the test, followed by a relatively smooth, steady state (the green ellipse areas) in the later part of each test run. This “running-in + steady state” particle emissions phenomenon has been observed in several studies on disc brake emissions [
20,
21,
22,
23,
24].
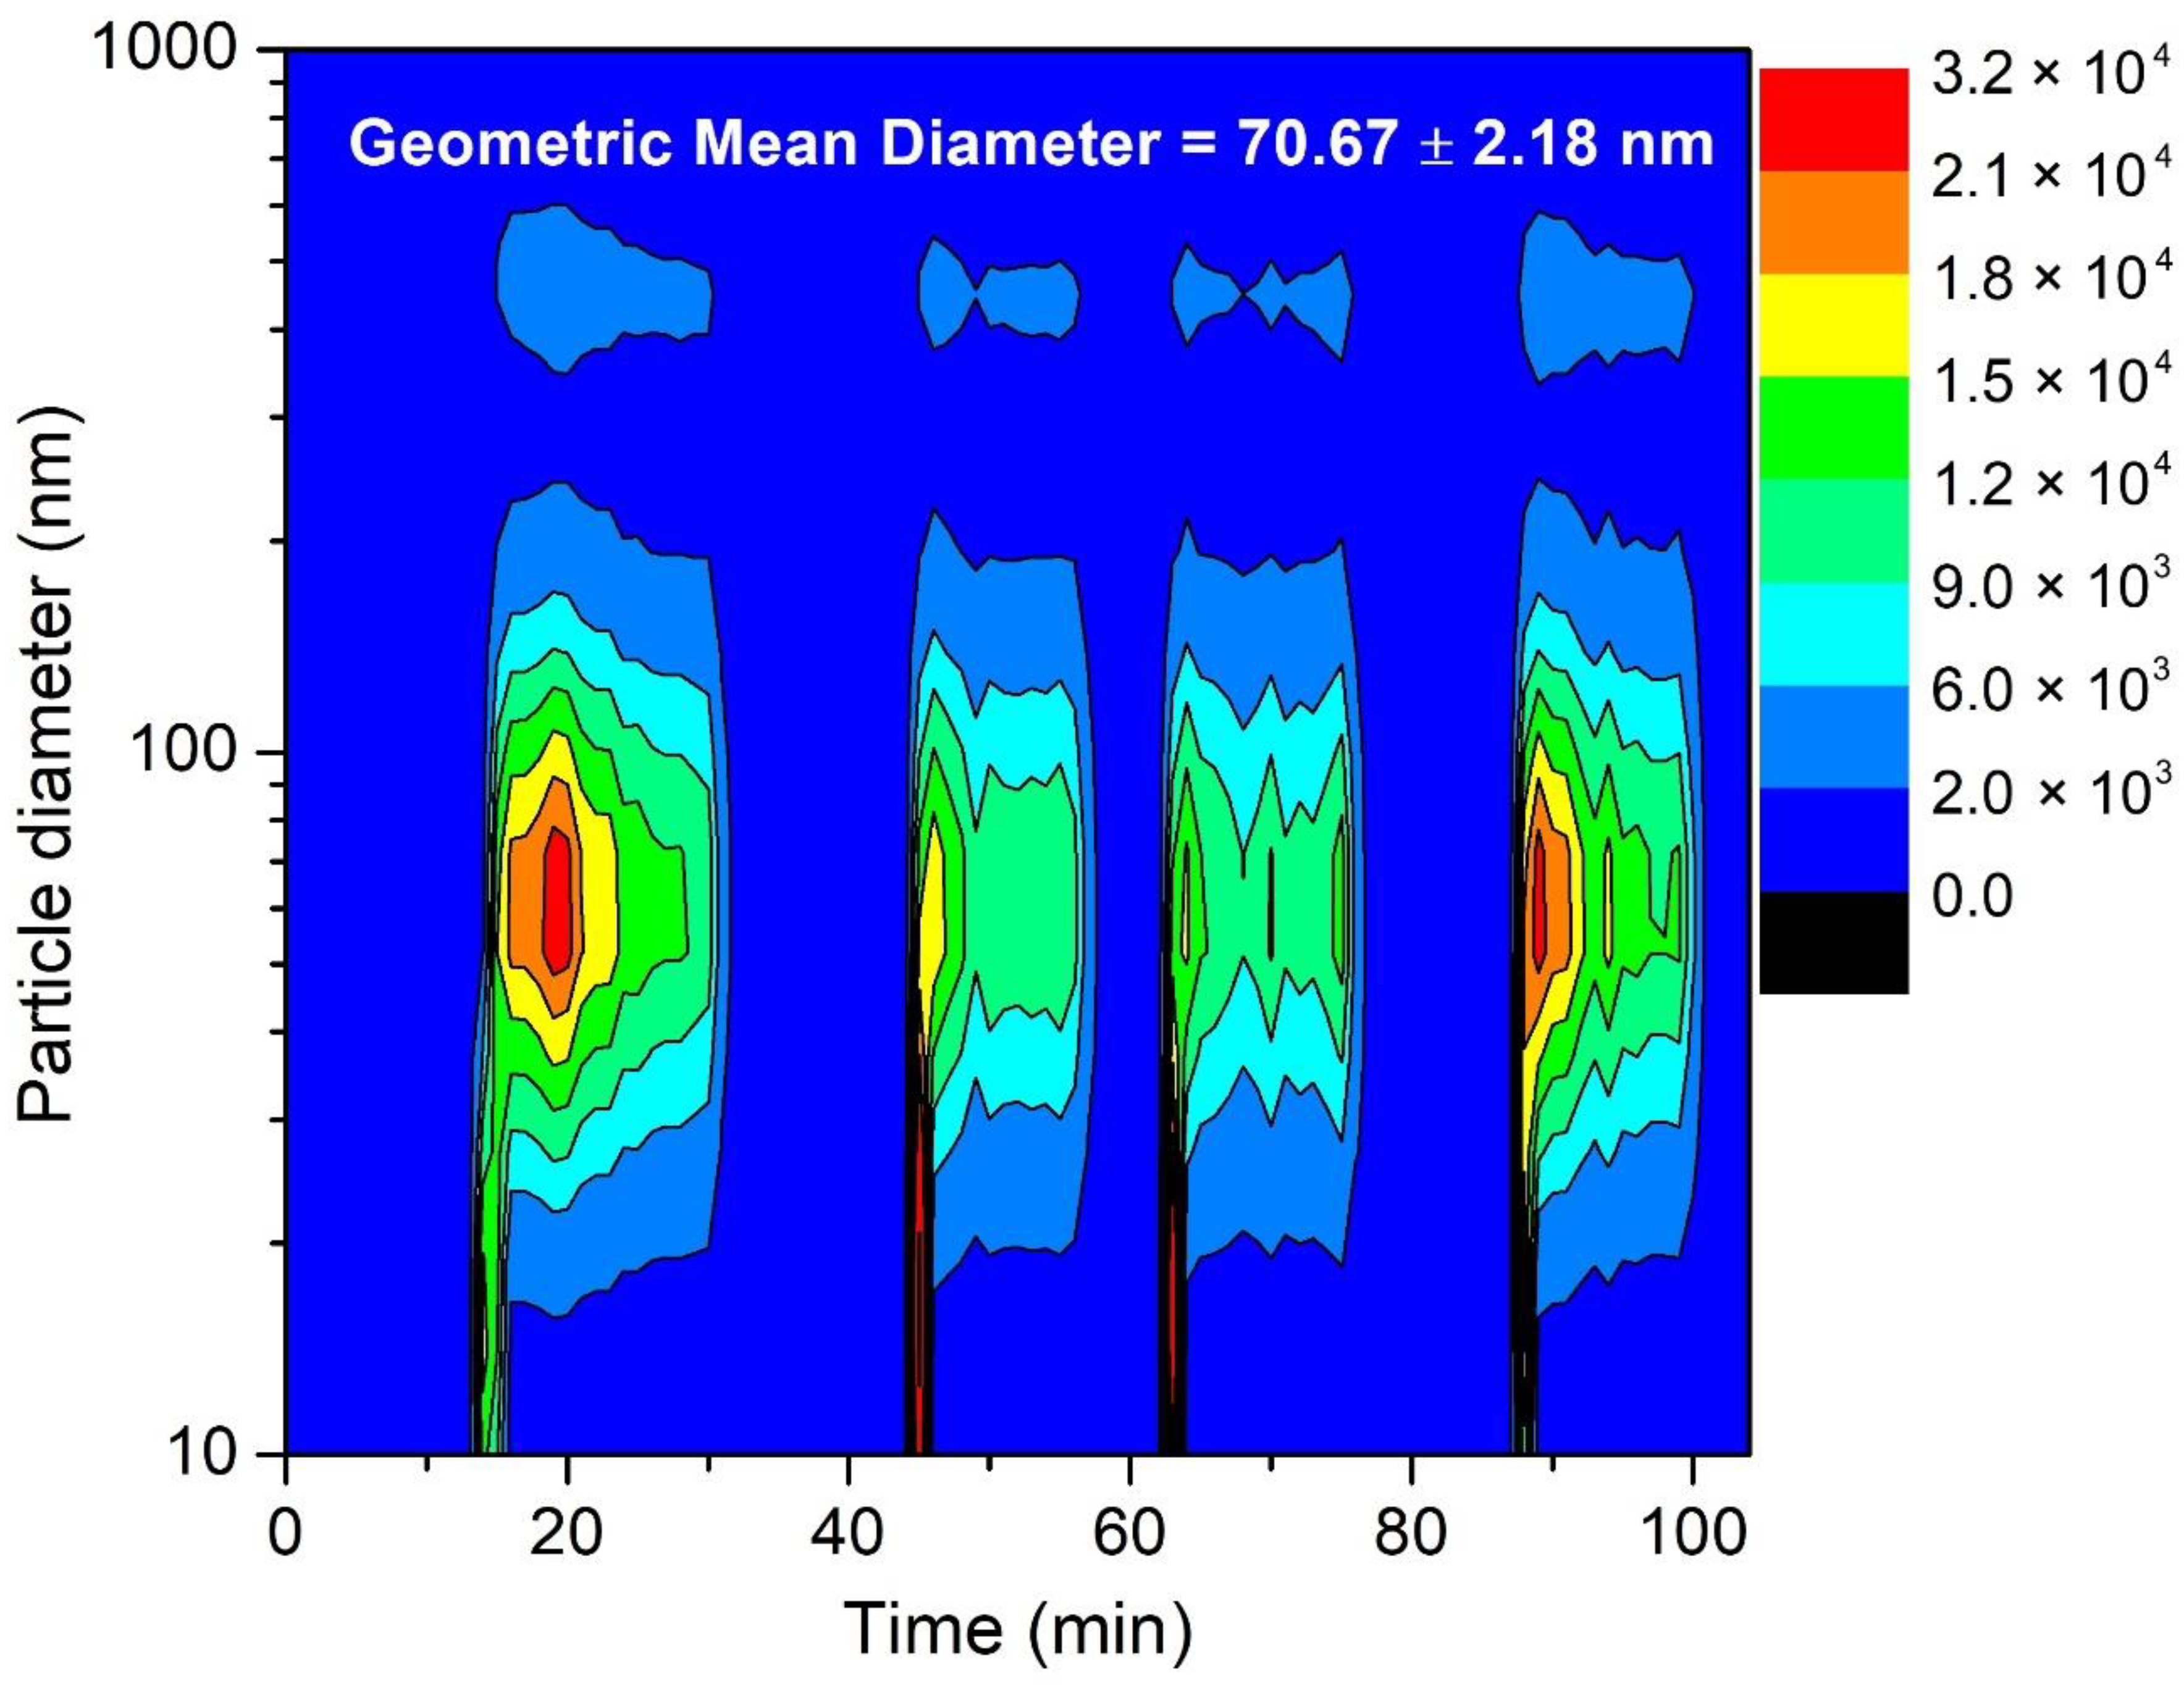
Test 1 shows the highest running-in particle mass concentration of the four repetitions, but the lowest PNC in the same period, indicating that the mass concentration is not necessarily corresponding to the PNC. One possible reason could be that a significant number of nanoparticles are generated in the running-in period (
Figure 7). Due to the very low mass of nanoparticles, there is very little relationship between the nanoparticle number concentration and PM2.5 and PM10 [
25].
Tests 2, 3, and 4 seem to present similar levels of PM10, PM2.5, PM1, and PNC in the steady state. One reason for the deviant performance of Test 1 could be an aging effect of the friction materials due to long exposure to the atmosphere prior to the test. After Test 1, the surfaces are fully engaged and initial surface textures are removed, thereby resulting in similar behaviour in the following test repetitions. From
Figure 7, it can also be noted that the particles generated from dry clutch contact show a bimodal size distribution, with one peak below 100 nm and the other at approximately 500 nm. The peak concentration at the 500 nm peak is much lower than the one below 100 nm, resulting in a geometric mean diameter of the generated particles at approximately 70 nm.
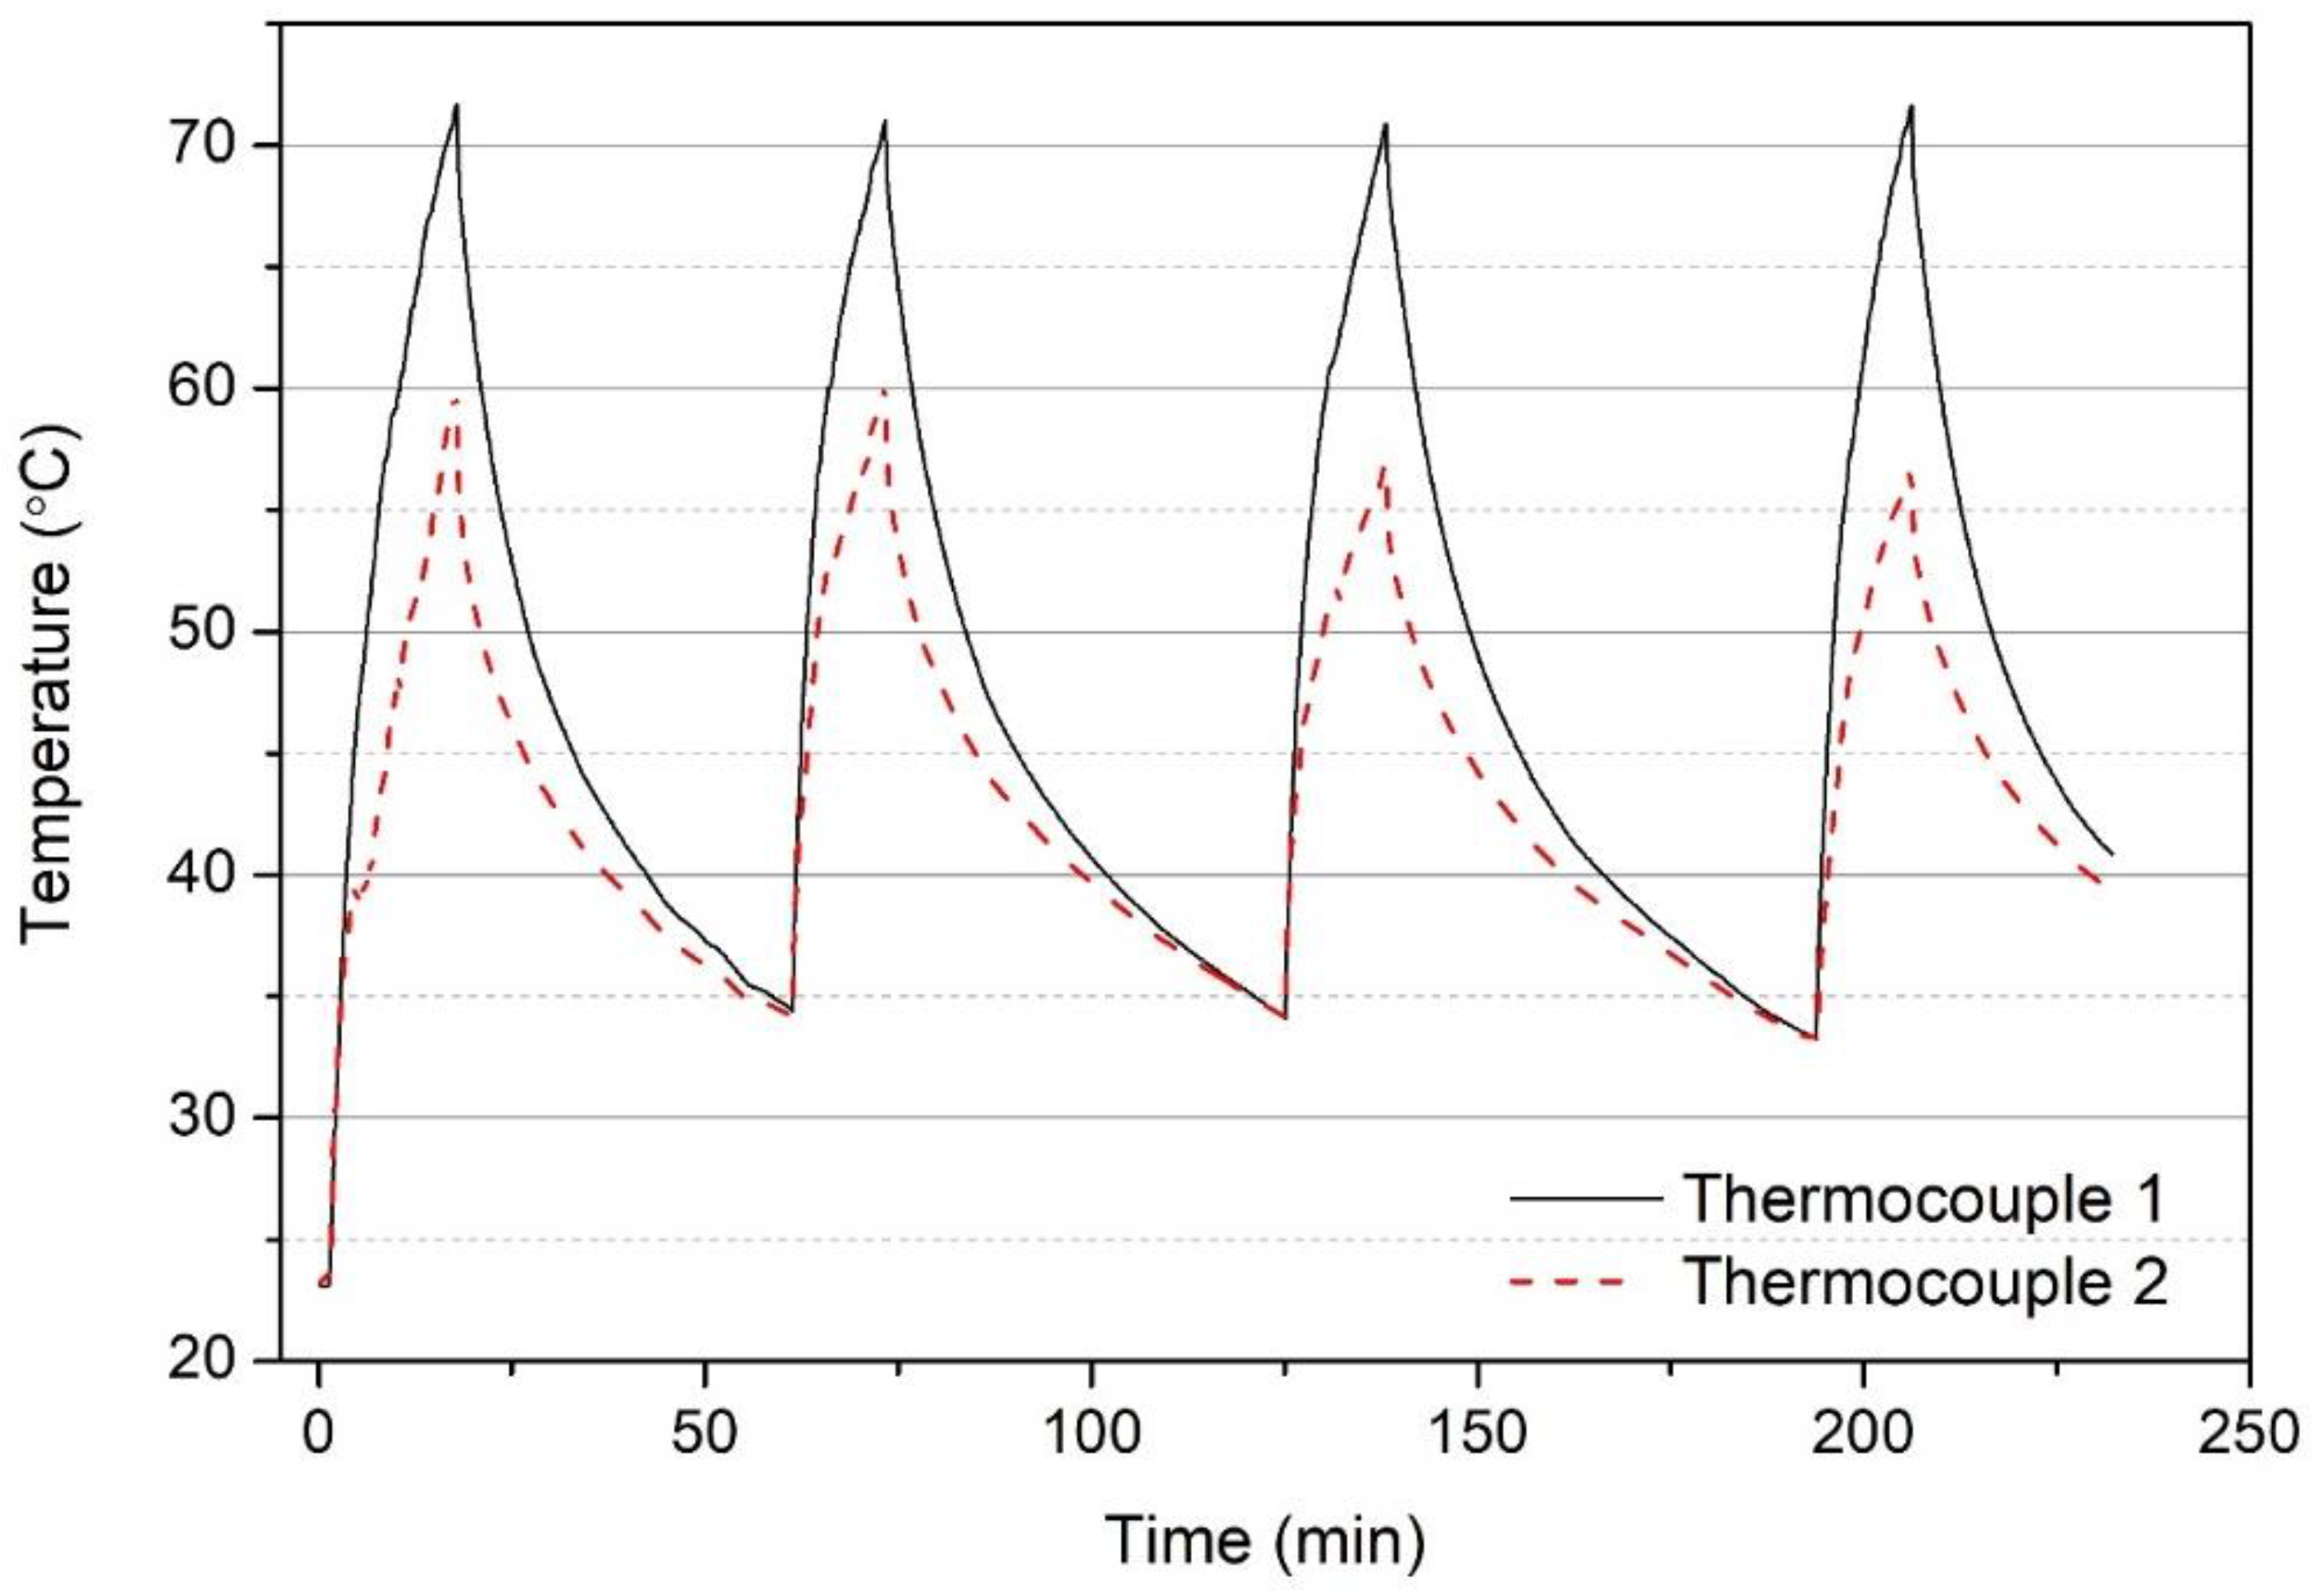
The measured pressure plate temperatures are presented in
Figure 8, showing the well-controlled process of the test procedure, i.e., each test run was started below 35 °C and ended just above 70 °C. Since the rotational speed and the normal load were also set to be constant for all four repetitions, which led to similar particle emission behaviours as shown in
Figure 5,
Figure 6 and
Figure 7, this newly developed dry clutch tribometer is thought to be reliable for future research on clutch particle emissions.
6. Discussion
There are two main methods of operating slip in a test rig. The first is similar to the application in a road vehicle, where the slip occurs occasionally but with considerable power and large temperature derivatives. The temperature is then controlled by periodically slipping by engaging and disengaging the clutch. Accurate control is needed, since the clutch temperature can increase by tens of degrees from a few seconds of slip. While this method has the advantage of more realistically representing typical usage in an automobile application, it is also much more complex and would require a far more powerful motor and larger inertia, much like in a real passenger car.
The second method, as used in this study, is a continuous slip engagement where the power is relatively limited, and where the temperature derivative eventually reaches zero at a desired temperature. This method is less complex and requires less control if designed properly. The design of the testing rig is greatly dependent on which type of slip operation is chosen. This is because every major component has to be dimensioned with respect to the contrasting acting forces. By choosing this method, the setup uses a lower torque, a lighter construction, and a simple temperature control, and should give an airborne wear particle generation at a constant rate, which makes the particle sampling easier.
By designing a clutch rig from scratch, it was possible to incorporate an inner box in a natural way. This box enables future studies, whereby the inner box top lid may be mounted with its hatch open to some degree. Thus, it is possible to investigate when airborne wear particles escape from the housing. When airborne wear particles escape continuously during usage, they are more difficult to handle than when they stay inside the housing. The situation is similar to that of disc brakes, which are open to the surrounding, contra drum brakes, which are encapsulated.
The test procedure shows good repeatability. The temperature increase follows the same path for each test. However, thermocouple 2 shows a lower temperature than thermocouple 1 throughout the tests. This is likely due to the reduced contact caused by an insufficient amount of cooling paste and/or vibrations, or uneven contact between the friction plate and the pressure plate. This does not, however, influence the qualitative findings in this study. However, quantitative results may be affected, and this is a subject for potential future studies.
Even though the particles measured in this study were generated from relatively low temperatures, it is possible that the size, the amount, and the type of particles would be different for a higher temperature. Abdullah et al. [
26] and Wu [
27] reported a temperature of up to approximately 250 °C in dry clutch contacts, but for a much shorter time period. The temperature, while measured only at one point per pressure plate, is assumed to be representative due to symmetry. The possibility of local hotspots, as discussed by Qiao et al. [
28], is thus neglected. Possible future studies include investigating the effect of high temperatures and other severe conditions on clutch particle emissions.
Apart from the previously mentioned aging effect, where, for instance, oxide layers may appear on the contact surfaces, there is also a gradual change of the surfaces due to wear. It is possible that the effective contact area increases with time due to wear, but this also decreases the mean contact pressure. An extensive treatment of wear in clutches is covered by Biczó et al. [
29].
The preliminary results from the tests showed that airborne wear particles were generated. This result shows that the consideration of clutch emissions would be advantageous, especially in urban environments, where many frequent gear changes, including those while parking and in traffic jams, are common.
The focus of this preliminary study was more qualitative than quantitative. The goal was to show that a measurable number of particles can be generated in dry clutches, rather than the exact concentrations. To obtain more quantitative results, it remains to estimate particle loss due to, e.g., wall depositions and isokinetic sampling. In addition, the values presented are as measured by the MiniWRAS instrument and should be seen as qualitative. It would be of interest to use a different measurement technique such as the gravimetric analysis of a filter to obtain a better estimation of the PM concentrations.
7. Conclusions
The current paper presents a clutch tribometer setup designed for airborne wear particle measurements. A preliminary test was run to investigate whether it was possible to generate and sample airborne wear particles with the novel tribometer in a controlled way. The results show that the particle number and mass concentration present “running-in + steady state” behaviours that are similar to automotive disc brake contacts. In addition, the generated particles show bimodal size distribution with a geometric mean diameter of approximately 70 nm. The particle number and the mass concentration in the steady state have very similar levels for all four repetitions, verifying the reproducibility of this new setup design. This setup enables us to answer future research questions regarding the differences between different friction materials on particle concentration, size distribution, and the chemical characterizations of the emitted particles.


