Article

Effects of PM10 and Weather on Respiratory and Cardiovascular Diseases in the Ciuc Basin (Romanian Carpathians)

1
Doctoral School of Chemistry, Faculty of Natural Sciences, University of Pécs, Ifjúság 6, 7624 Pécs, Hungary
2
Department of Bioengineering, Faculty of Economics, Socio-Human Sciences and Engineering, Sapientia Hungarian University of Transylvania, Piaţa Libertăţii 1, 530104 Miercurea Ciuc, Romania
3
Institute for Research and Development of Hunting and Mountain Resources, Str. Progresului 35B, 530240 Miercurea Ciuc, Romania
4
Clinical Emergency Hospital of Bucharest, Calea Floreasca 8, 014461 Bucharest, Romania
5
Meteo Romania (National Meteorological Administration), Sos. București-Ploiești 97, 013686 Bucharest, Romania
6
Faculty of Geography, Doctoral School, Alexandru Ioan Cuza University of Iași, Bulevardul Carol I 11, 700506 Iași, Romania
7
Department of Analytical Chemistry and Environmental Engineering, Politehnica University of Bucharest, 1-7 Gheorghe Polizu, 011061 Bucharest, Romania
8
Bucharest University of Economic Studies, 6 Piața Romana, 010374 Bucharest, Romania
*
Author to whom correspondence should be addressed.
Atmosphere 2021, 12(2), 289; https://doi.org/10.3390/atmos12020289
Submission received: 28 January 2021 / Revised: 17 February 2021 / Accepted: 18 February 2021 / Published: 23 February 2021
(This article belongs to the Section Air Quality and Human Health)

Abstract

:
This study presents the PM10 concentration, respiratory and cardiovascular disease hospital admissions evolution in the Ciuc basin for a period of 9 years (2008–2016), taking into consideration different meteorological conditions: boundary layer, lifting condensation level, temperature-humidity index, and wind chill equivalent chart index. The PM10 and hospital admissions evolution showed a very fluctuated hourly, weekly, monthly, yearly tendency. The PM10 concentration in winter (34.72 μg/m3) was 82% higher than the multiannual average (19.00 μg/m3), and almost three times higher than in summer (11.71 μg/m3). During the winter, PM10 concentration increased by an average of 9.36 μg/m3 due to the increased household heating. Climatological parameters have a demonstrable effect on the PM10 concentration variation. Children, the elderly and men are more sensitive to air pollution, the calculated relative risk for men was (RR = 1.45), and for women (RR = 1.37), respectively. A moderate correlation (0.51) was found between PM10 and pneumonia (P), while a relatively weak correlation (0.39) was demonstrated in the case of PM10 and upper respiratory tract infections (URTI). Furthermore, except thermal humidity index (THI), strong negative correlations were observed between the multiannual monthly mean PM10 and the meteorological data. The PM10 followed a moderate negative correlation with the boundary layer (−0.61). In the case of URTI and P, the highest number of hospital admissions occurred with a 5 to 7-day lag, while the 10 μg/m3 PM10 increase resulted in a 2.04% and 8.28% morbidity increase. For lung cancer (LC) and cardiovascular diseases (AMI, IHD, CCP), a maximum delay of 5–6 months was found. Three-month delay and an average growth of 1.51% was observed in the case of chronic obstructive pulmonary disease (COPD). Overall, these findings revealed that PM10 was and it is responsible for one-third of the diseases.

1. Introduction

Ambient air pollution plays an important role in a broad spectrum of health disorders, emerging as a leading worldwide environmental health problem. The World Health Organization estimates that 22% of global death and disability can be attributed to environmental factors [1].
Epidemiological studies revealed worsening life quality and health symptoms, such as deterioration of lung function due to elevated particle pollution levels resulting in an increased use of medication [2,3,4,5]. Short-term symptoms from exposure to air pollution include itchy eyes, nose and throat, wheezing, coughing, shortness of breath, chest pain, headaches, nausea, as well as respiratory infections [6]. Long-term exposure to high concentrations of PM10 (particulate matter with a diameter of 10 μm or less) can result in several health impacts and premature death like lung cancer, cardiovascular disease, chronic respiratory illness, and allergies [7,8]. PM10 can reach the trachea bronchial and alveolar regions of the respiratory tract, having a greater impact on human health. Noteworthy, specific groups, people with cardiovascular risk factors or pre-existing cardiovascular disease (CVD) are more vulnerable to the aforesaid harmful effects.
There is an increasing body of evidence showing air pollution as a critical risk factor for cardio-respiratory morbidity and mortality. Numerous studies have shown that there is a strong association between exposure to particulate matter and the increased risk of cardiovascular and respiratory disease [9,10,11,12,13,14,15,16]. In 2004, the American Heart Association (AHA) published a scientific statement regarding air pollution and cardiovascular disease, concluding that particulate matter is a large contributor to cardiovascular morbidity and mortality [12]. In 2010, the abovementioned statement was updated, providing a comprehensive review of new evidence linking exposure to PM with cardiovascular disease [12].
Existing statistics are based on large cohort studies conducted mostly in North America and Western Europe, with less information available from Eastern Europe [17,18,19,20,21,22,23,24]. According to air monitoring databases [25], people living in Eastern Europe are generally subjected to higher levels of PM10 than those in Western Europe. The PM10 exposure on human health shows variability, so the data cannot be extrapolated to other regions and populations, for the reason that various specific factors such as demographic and genetic factors, may affect the impact of PM10 on human health.
It has been shown that air particulates with a diameter of less than 10 µm (PM10) can reach the trachea bronchial and alveolar regions of the respiratory tract, having a substantial impact on human health [26]. Particulate matter is often divided into two main groups based on characteristics, sources, and potential health effects: fine particles, PM2.5 (with a diameter between 0.1 and 2.5 µm) and coarse particles, PM10-2.5 (having a diameter between 2.5–10 µm).
In Romania, only a few studies have been published in terms of respiratory health effects of PM10 [27]. There is an unmet need for studies addressing the burden of pollution-attributable cardio-respiratory diseases in our country.
The purpose of this study is twofold: firstly, to analyze the temporal distribution of ambient particulate matter (PM10) in the Ciuc basin over a period of 9 years (2008–2016), and secondly, to assess the short- and long-term effects on respiratory and cardiovascular morbidity taking into account the meteorological conditions.

2. Materials and Methods
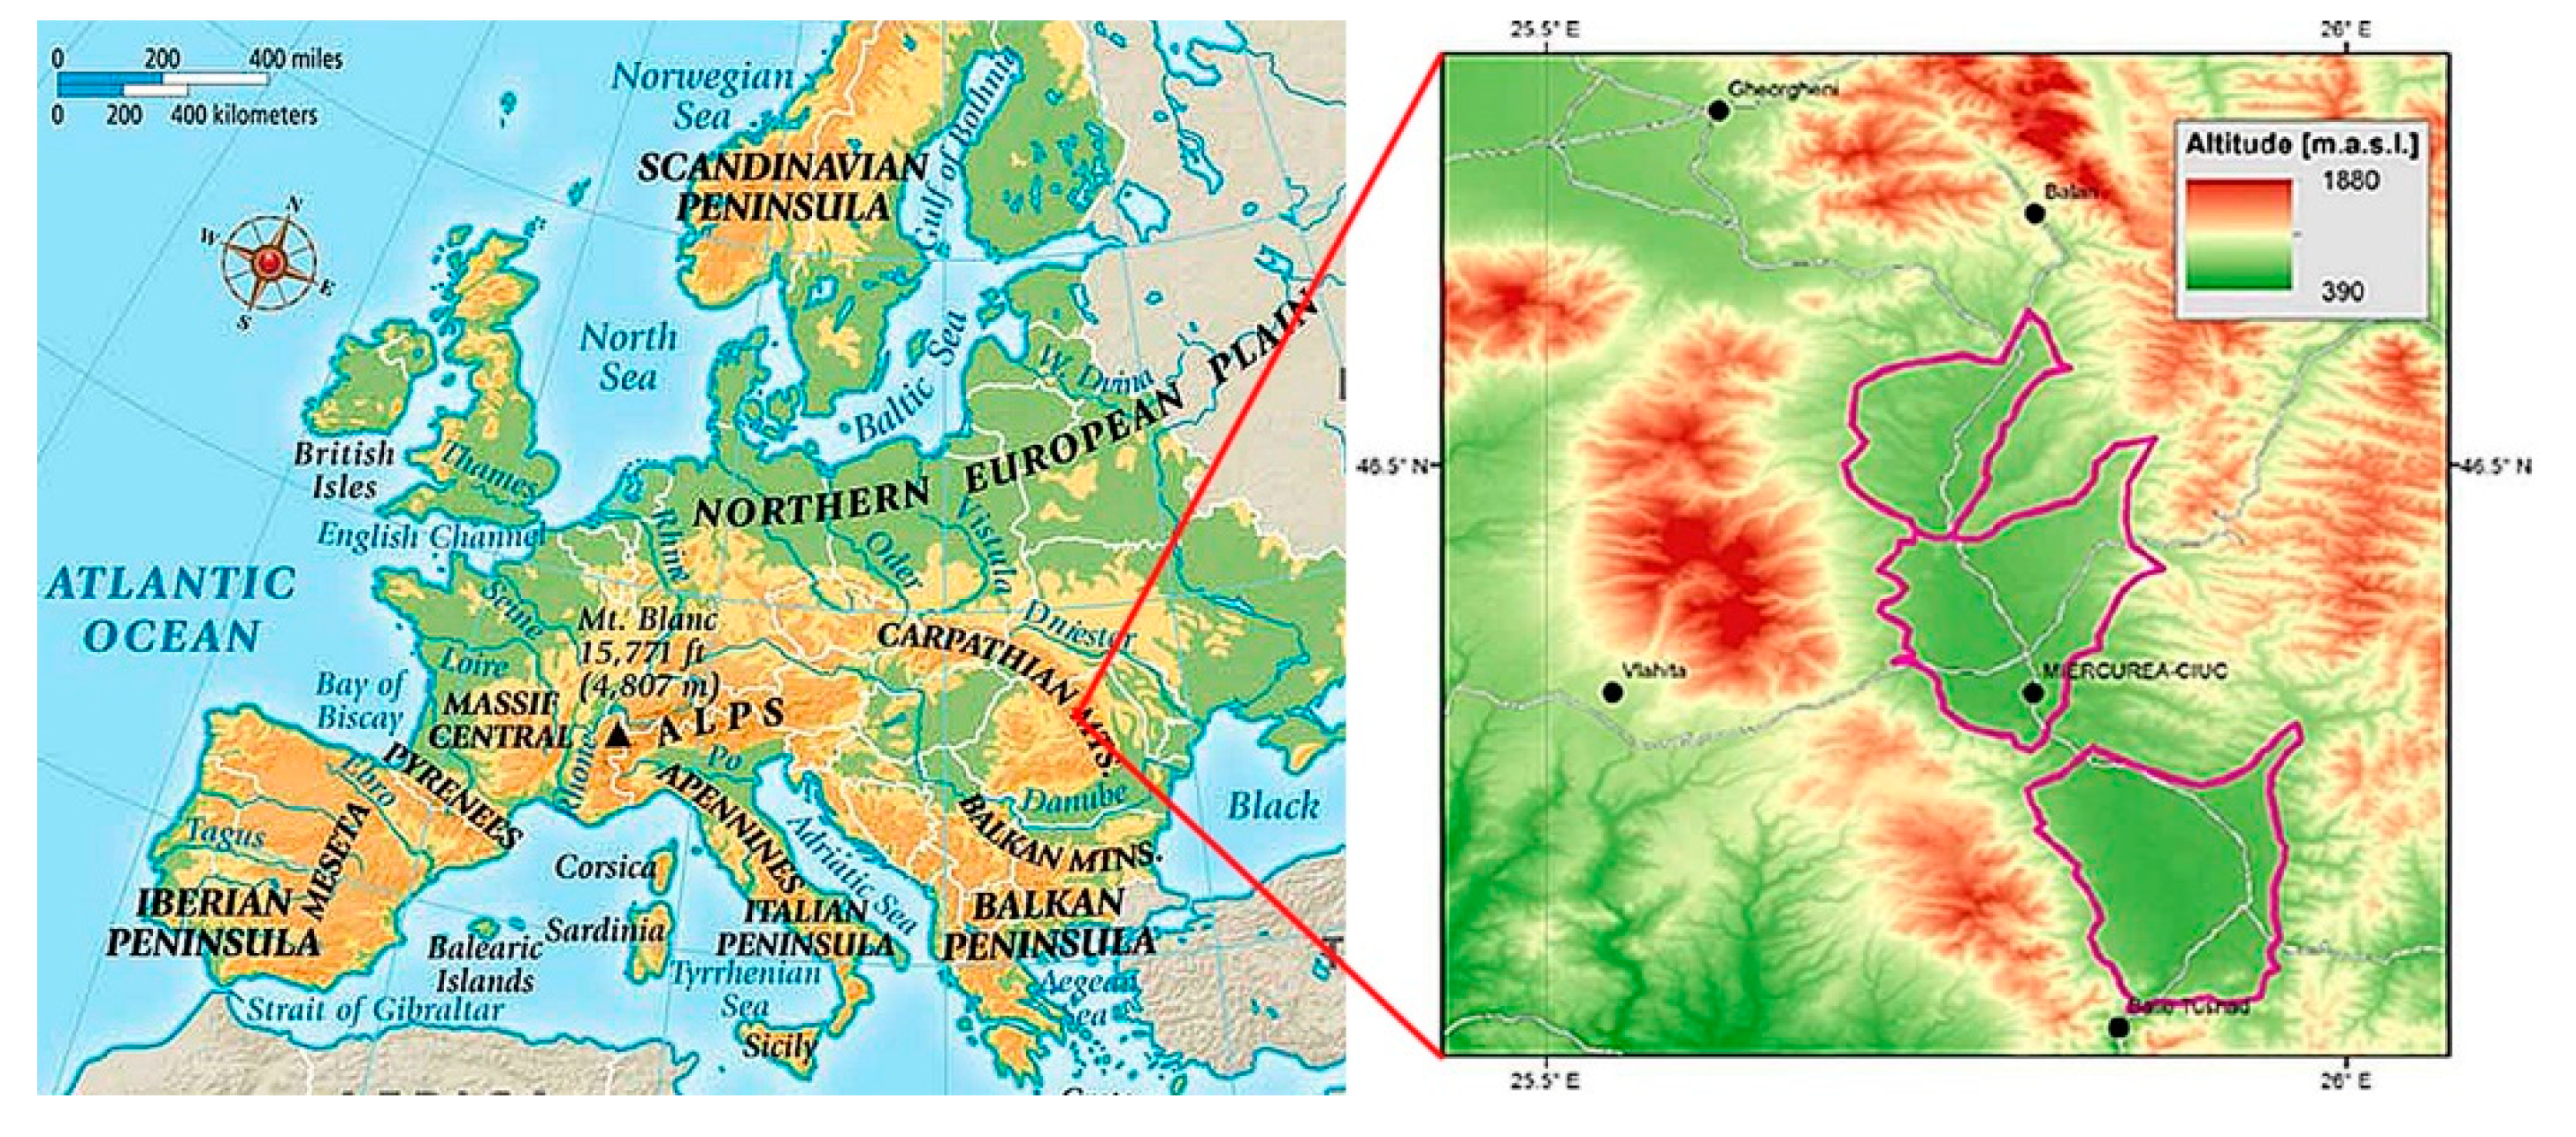
2.1. Studied Region

The Ciuc basin is located in the middle of the Eastern Carpathians, at an altitude of 650 m, with a population of ~150,000 (Figure 1). Due to its enclosed character, the Ciuc basin is known for its specific microclimatic and meteorological conditions, with long episodes of static stability and thermal inversion periods, hence favoring the accumulation of pollutants.

2.2. Air Pollution, Medical and Meteorological Data

The PM10 concentration data were obtained from the HR01 regional monitoring station located near the municipality of Miercurea Ciuc, the “Cold Pole” of Romania [28,29], at 46.33° N, 25.81° E, at an elevation of 697 m a.s.l. PM10 data were sampled with an automated analyzer type LSPM10; for further analysis, the daily gravimetric and hourly values (μg/m3) were used.
The daily respiratory and cardiovascular hospital admission data from 1 January 2008 to 31 December 2016 (3288 days) were obtained from the Regional Emergency Hospital of Miercurea Ciuc, which is the single regional hospital in the studied region. During the studied period, 18,286 hospital admissions were registered [27]. The selection was made according to the International Classification of Disease, 10th Revision (ICD-10) by the World Health Organization. Seven different types of diseases were studied: lung cancer -LC (ICD-10 code C33–C34); acute myocardial infarction -AMI (ICD-10 code I21); ischemic heart diseases-IHD (ICD-10 code I20-I25 except I21); chronic cardiopulmonary disease-CCP (ICD-10 code I27.9); upper respiratory tract infections-URTI (ICD-10 code J00-J06); pneumonia-P (ICD-10 code J12–J18); chronic obstructive pulmonary diseases-COPD (ICD-10 code J44). Hospital admissions were examined based on sex and age groups [0–5], (5–14], (14–40], (40–60] and 60+ years, respectively. The number of patients coming from outside the basin was negligible.
Climatological parameters such as daily temperature, precipitation amount and the relative humidity index were provided by the National Meteorological Administration (Meteo Romania). Regarding the lifting condensation level (LCL) it was calculated according to Equation (1):
L C L   =   20 + T 5 ( 100 R H )
where: LCL—lifting condensation level, T—air temperature (°C), RH—relative humidity (%).
Furthermore, the temperature-humidity index (THI) and the wind chill equivalent chart index (WCT) were also calculated, LCL and THI, being strongly related to the PM10 concentration evolution, while WCT is a dimensionless human comfort index. Lastly, the daily value of the boundary layer was extracted from ERA5 reanalysis using the mean value of all the pixels covering the Ciuc basin region [30,31].

2.3. Statistical Analysis

In order to determine the monthly, seasonal and yearly PM10 concentrations, the daily gravimetric measurements were used, while the diurnal and weekly variations were estimated by using the hourly PM10 concentrations. The relationship between the daily hospital admissions, meteorological conditions, and PM10 concentration, was determined using different statistical indices: mean, standard deviation, coefficient of variation, minimum, median, maximum, 25th and 75th percentile values, and confidence interval. To assess the impact of PM10 contribution to respiratory and cardiovascular morbidity, different methods were used, such as the Pearson correlation, the Fourier transform, the Aunan’s calculation procedures, relative risk, as well as the morbidity increase caused by a 10 µg/m3 rise in PM10. The Pearson correlation coefficient was considered statistically significant (p-level < 0.05), if the r value was greater than 0.203 or below −0.203.
On the other hand, the PM10 values resulted during the household heating with wood (HPM10) were estimated using Equation (2), hence the residential heating contribution to outdoor PM10 was determined by considering the average winter and summer concentrations as well as the average boundary layer (BL) height ratio:
H P M 10   =   C P M 10 w ( B L s B L w × C P M 10 s )
where: H P M 10 —the average PM10 increase during winter caused by heating (μg/m3), C P M 10 w —the average PM10 in winter period (μg/m3), C P M 10 s —the average PM10 in summer period (μg/m3), B L s —the average boundary layer in summer (m), B L w —the average boundary layer in winter (m).
In order to estimate the health effects of cold and heat extremes, according to Dobrinescu et al. [32], five discomfort classes can be established: severe danger from cold (WCT ≤ −35 °C), extremely cold (−35 °C > W ≤ −20 °C), uncomfortably cold (−20 °C > THI ≤ 0 °C), uncomfortably hot (66 ≤ THI < 80), severe danger from heat THI ≥ 80, respectively:
T H I   =   ( 1.8 T A + 32 ) ( 0.55 0.55 R H 100 ) ( 1.8 T A 26 )
where: T A is the air temperature (°C) measured at a standard level (2 m).
The critical threshold above which the human body feels strong discomfort is 80 units. THI is expressed in dimensionless form.
In the winter season, the severe danger from cold, extremely cold and uncomfortably cold was estimated, using WCT:
W C T   =   13.12 + 0.6215 T A 11037 F F 10 0.16 + 0.3965 T A F F 10 0.16  
where: F F 10   is the wind speed (km/h) measured at 10 m a.g.l.
Usually, WCT only expresses a human sensation and it is linked to the way the human skin perceives the temperature on a calm day.
Regarding the PM10 concentration data, four classes were established: low < 25 µg/m3, moderate between 25 µg/m3 and 37.5 µg/m3, high ranging from 37.5 µg/m3 to 50 µg/m3, and very high concentrations > 50 µg/m3, respectively.
Since there is a latency period between exposure and appearance of disease the Fourier transform method was used to decipher the relation. The Fourier transform is a mathematical technique that transforms a signal from the time domain to the frequency domain, showing that any wave form can be rewritten as the sum of sinusoidal functions [33], the method has been applied to the air pollution, medical and meteorological time series as well. The Fourier transform gives us a point of view in order to better understand the association between exposure to PM10 and the influence of climate on hospital admissions.
It is formed by a set W n ( t ) = e i n t , n = 0.1 … orthogonal functions, of period 2π:
F ( ω ) = f ( t ) e i ω t t
ω   =   2 π f
where: | f ( ω ) | is the amplitude of each component ω of the signal [34].
To assess the total damage of PM10 to human health in the Ciuc basin Aunan’s calculations procedures were used, briefly, the annual number of symptom-days was calculated from the daily mean PM10 concentration variation [35].
The odds ratio (OR) was estimated from the regression coefficient β and the increase of concentration level from baseline to Ci:
O R i   =   e β Δ C i
Pab s = (OR − 1) × 100
The hypothetical zero-concentration prevalence is given by:
p 0   =   p a b s   ( C i ) O R i O R i ×   p a b s   ( C i ) + p a b s   ( C i )
The health effects of exposure-response functions generally are derived from the relation between daily mean concentrations, Ci, and the daily prevalence of the effects, p(Ci):
S s u m   =   i   =   1 365 ( p ( C i )   × N   =   i   =   1 365 p 0 ×   e x p ( β ×   C i ) N
According to the literature the annual number of symptom days (Ssum) in a population (N) ideally can be estimated by calculating the daily number of affected persons in the respective population and sum over the year (Equation (10)).
Starting from daily hospital admission and PM10 concentration databases, we analyzed the evolution of respiratory diseases from a 1 to 10 days delay. In the case of CVD, a time delay of 1 to 10 months was used. As boundary condition was set, that only positive values will be followed, in the case of PM10 only the changes larger than 5 μg/m3 were evaluated, and the baseline was set to 10 μg/m3. The two variables had to meet the set conditions at the same time: if ΔPM10 > 5 μg/m3 and Morbidity > 0. In addition, we considered the percentage increase of cases concerning the PM10 change of 10 μg/m3, comparing the average increase to the number of days tested. To determine the time delay, the day/month corresponding to the maximum value obtained with the time difference tested was taken.

3. Results

The results show that the multiannual PM10 concentration is 19.00 μg/m3 and on an average day 6 respiratory and cardiovascular diseases have been recorded (Table 1). The coefficient of variation (CV) for PM10 and WCT was 0.61, and 0.93, respectively. The lowest coefficient variation was found in the case of P and COPD with a value of 0.37.

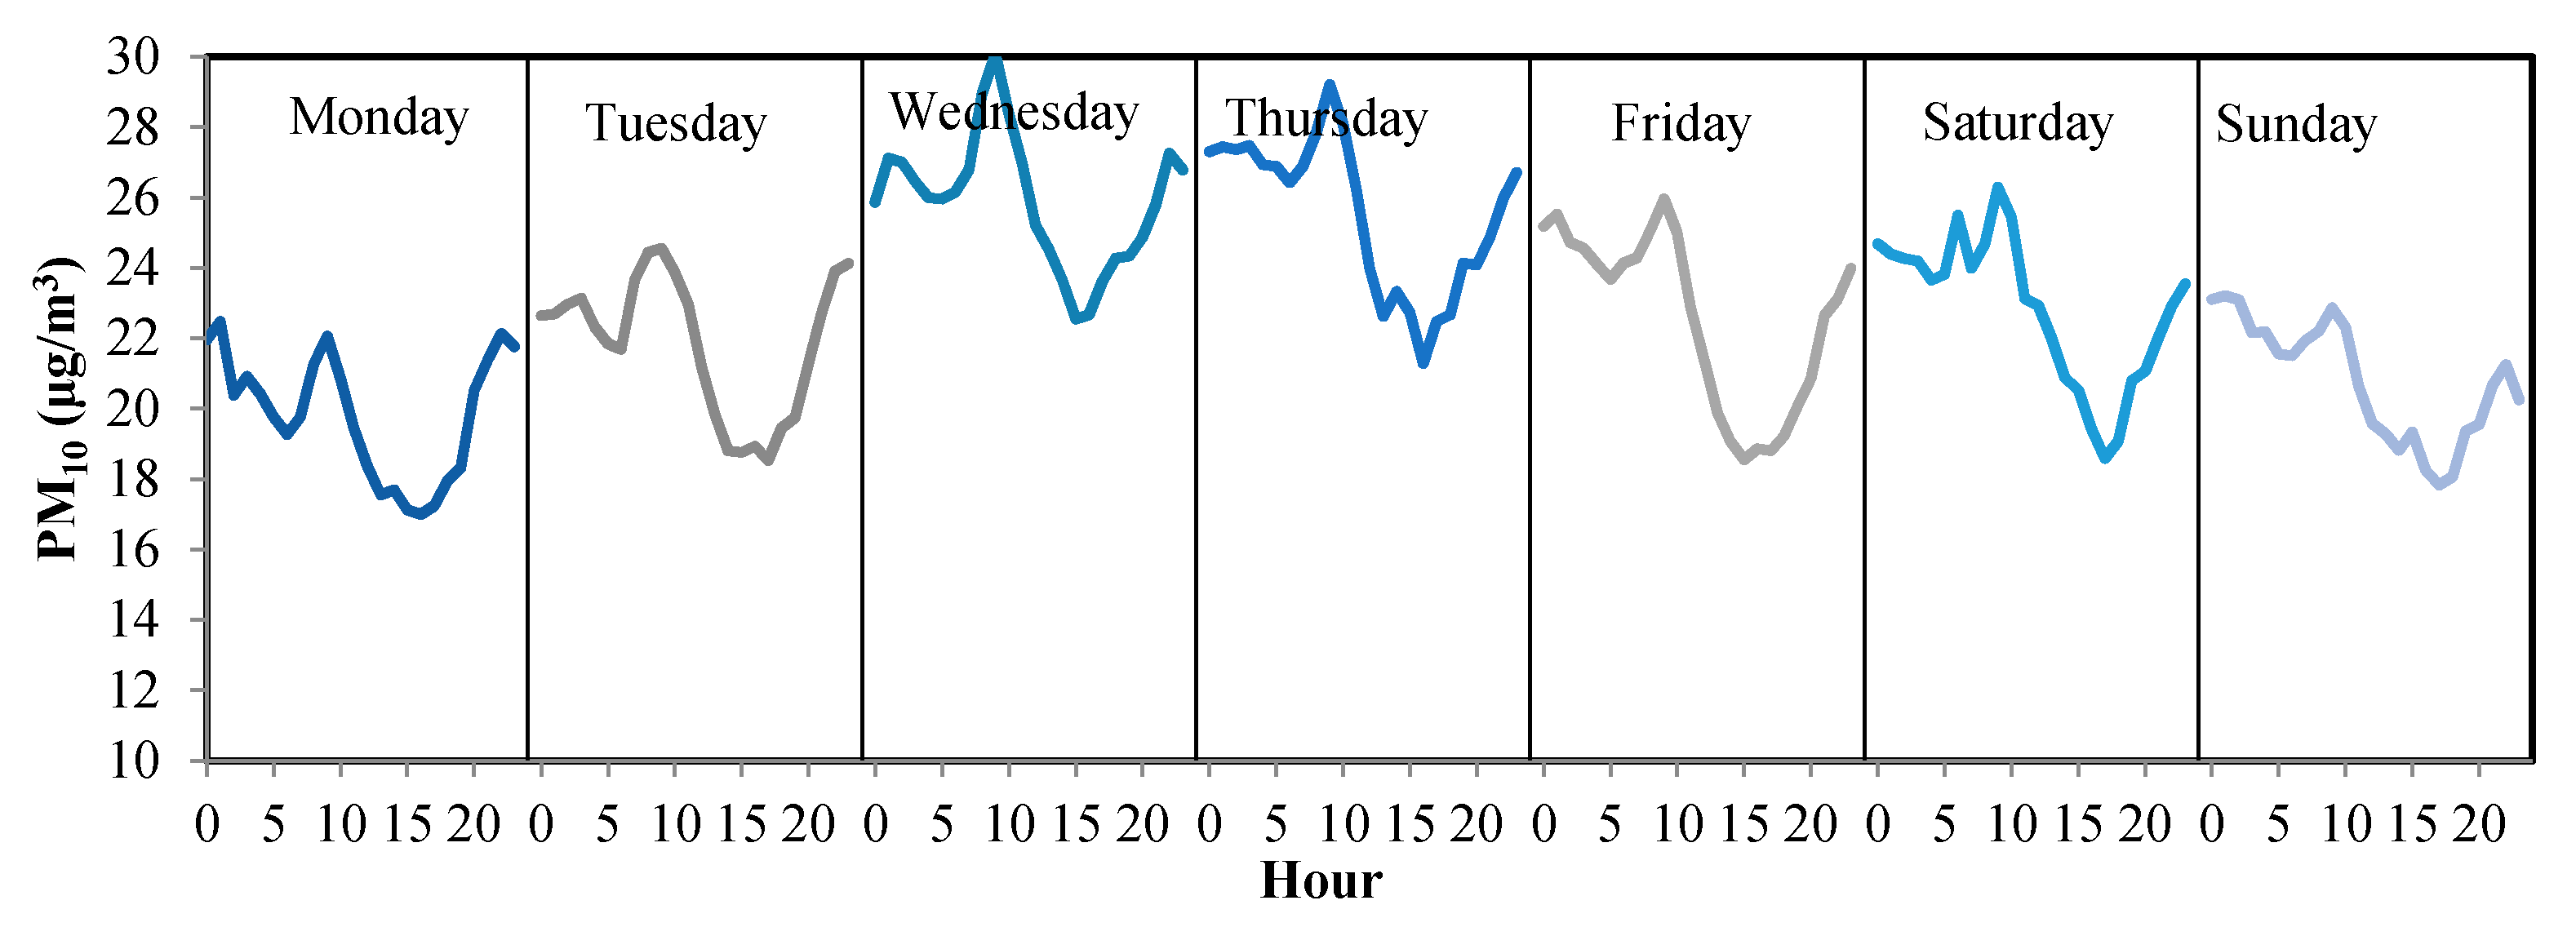
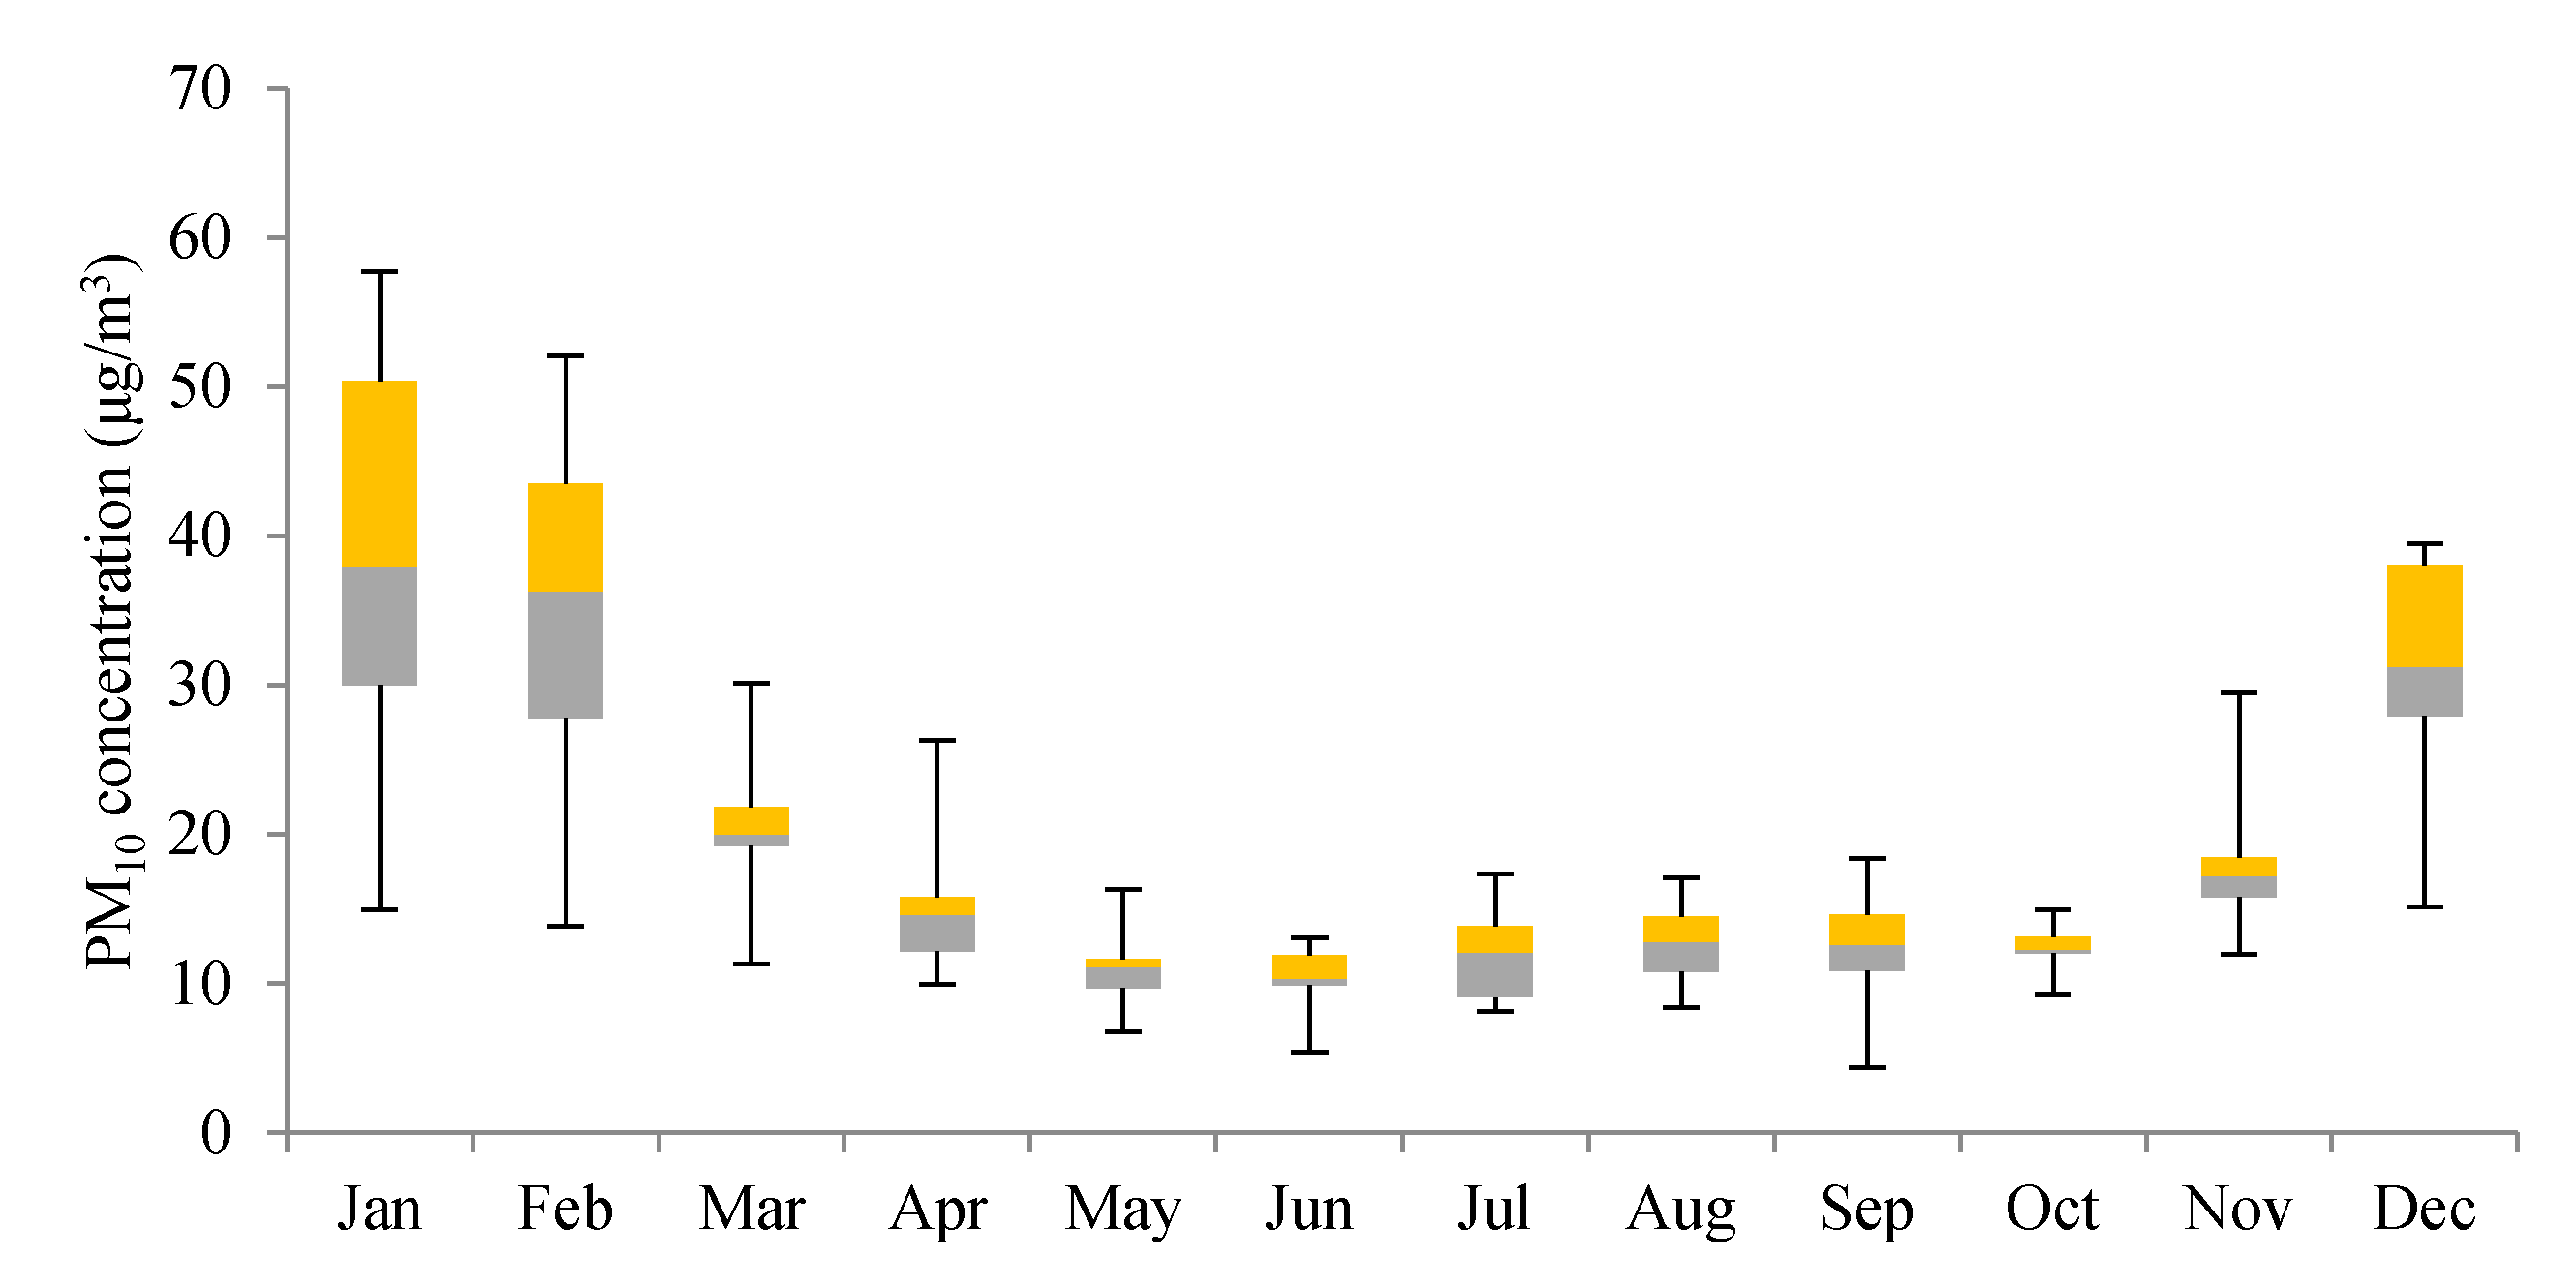
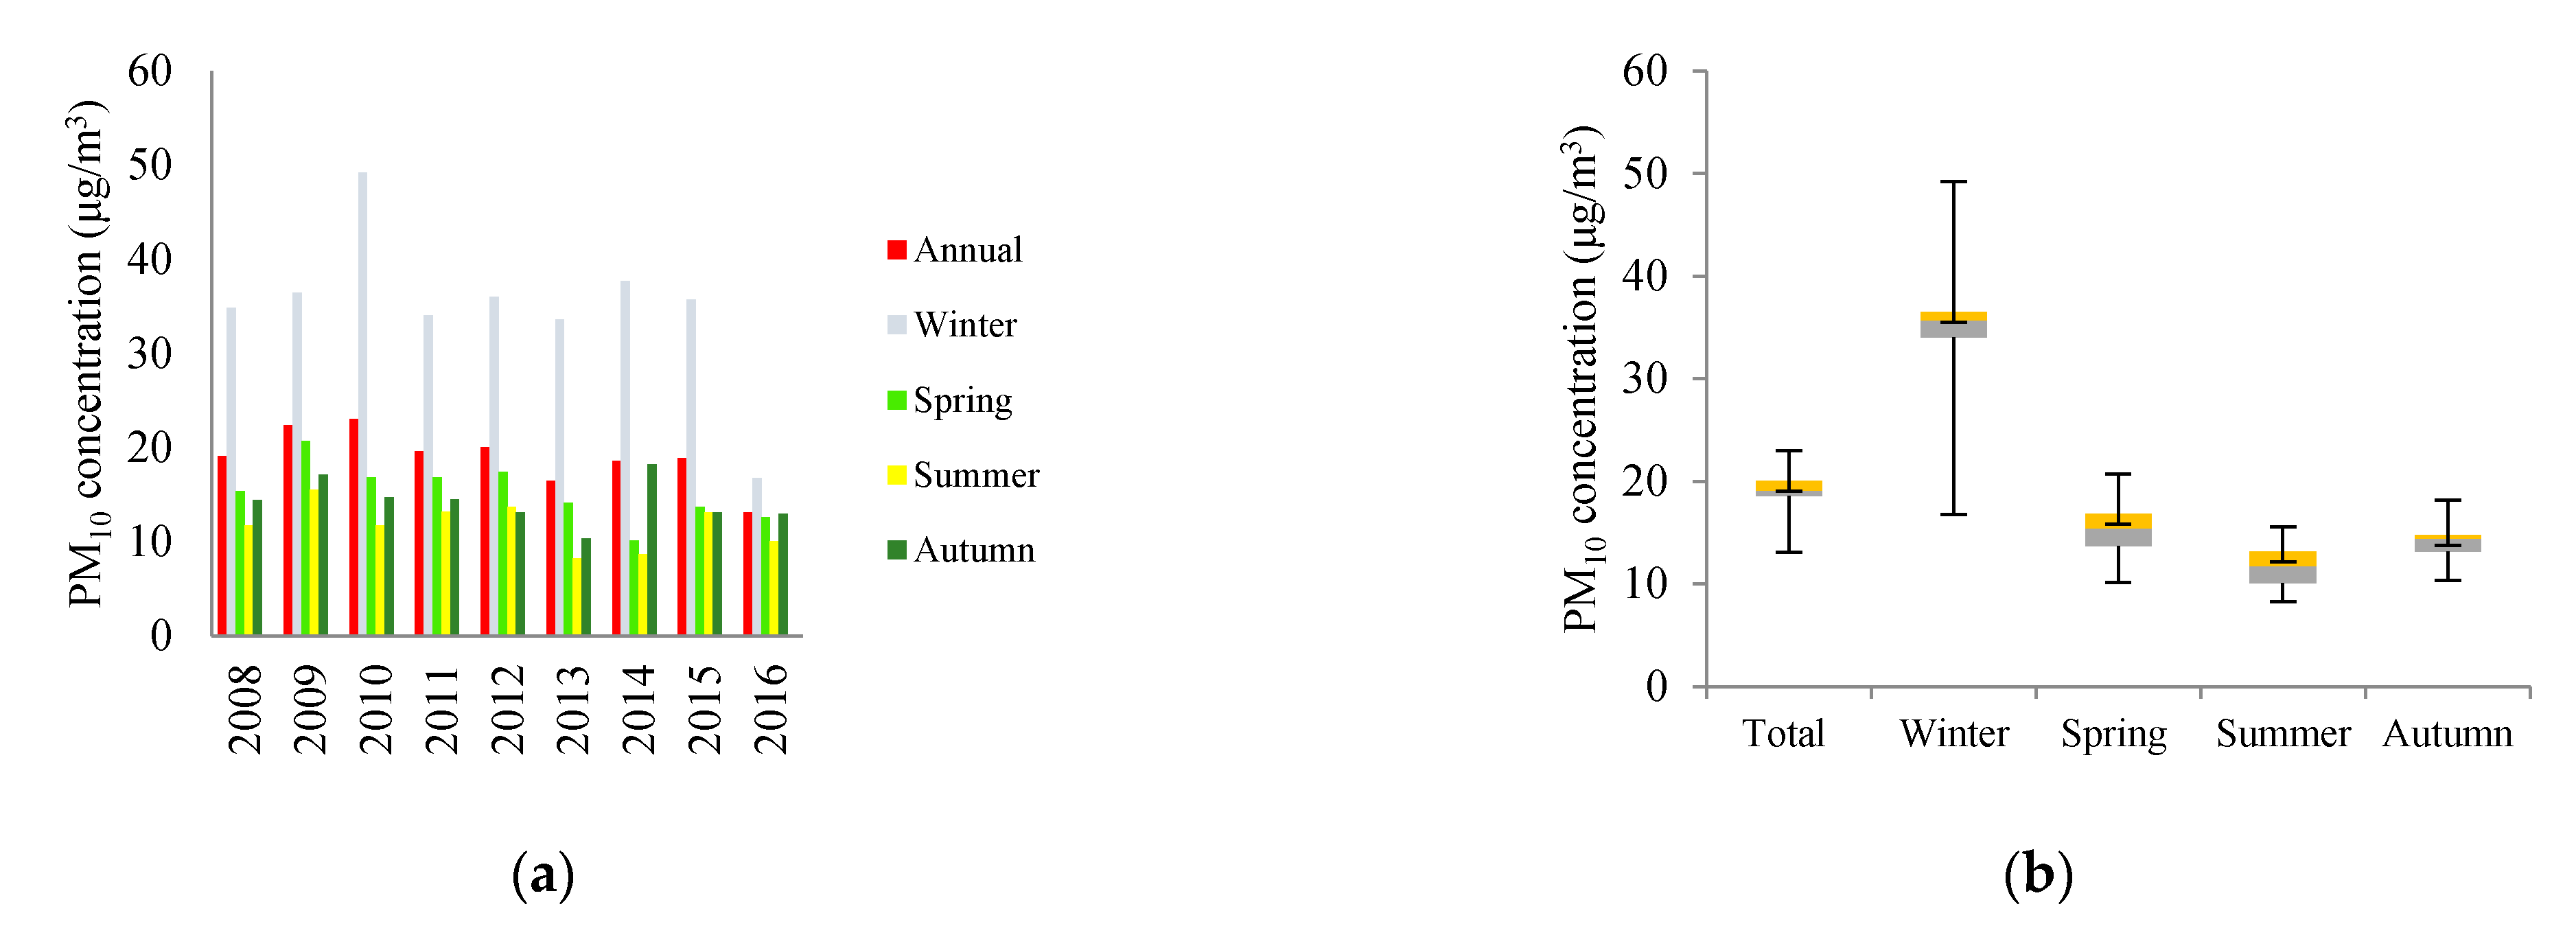
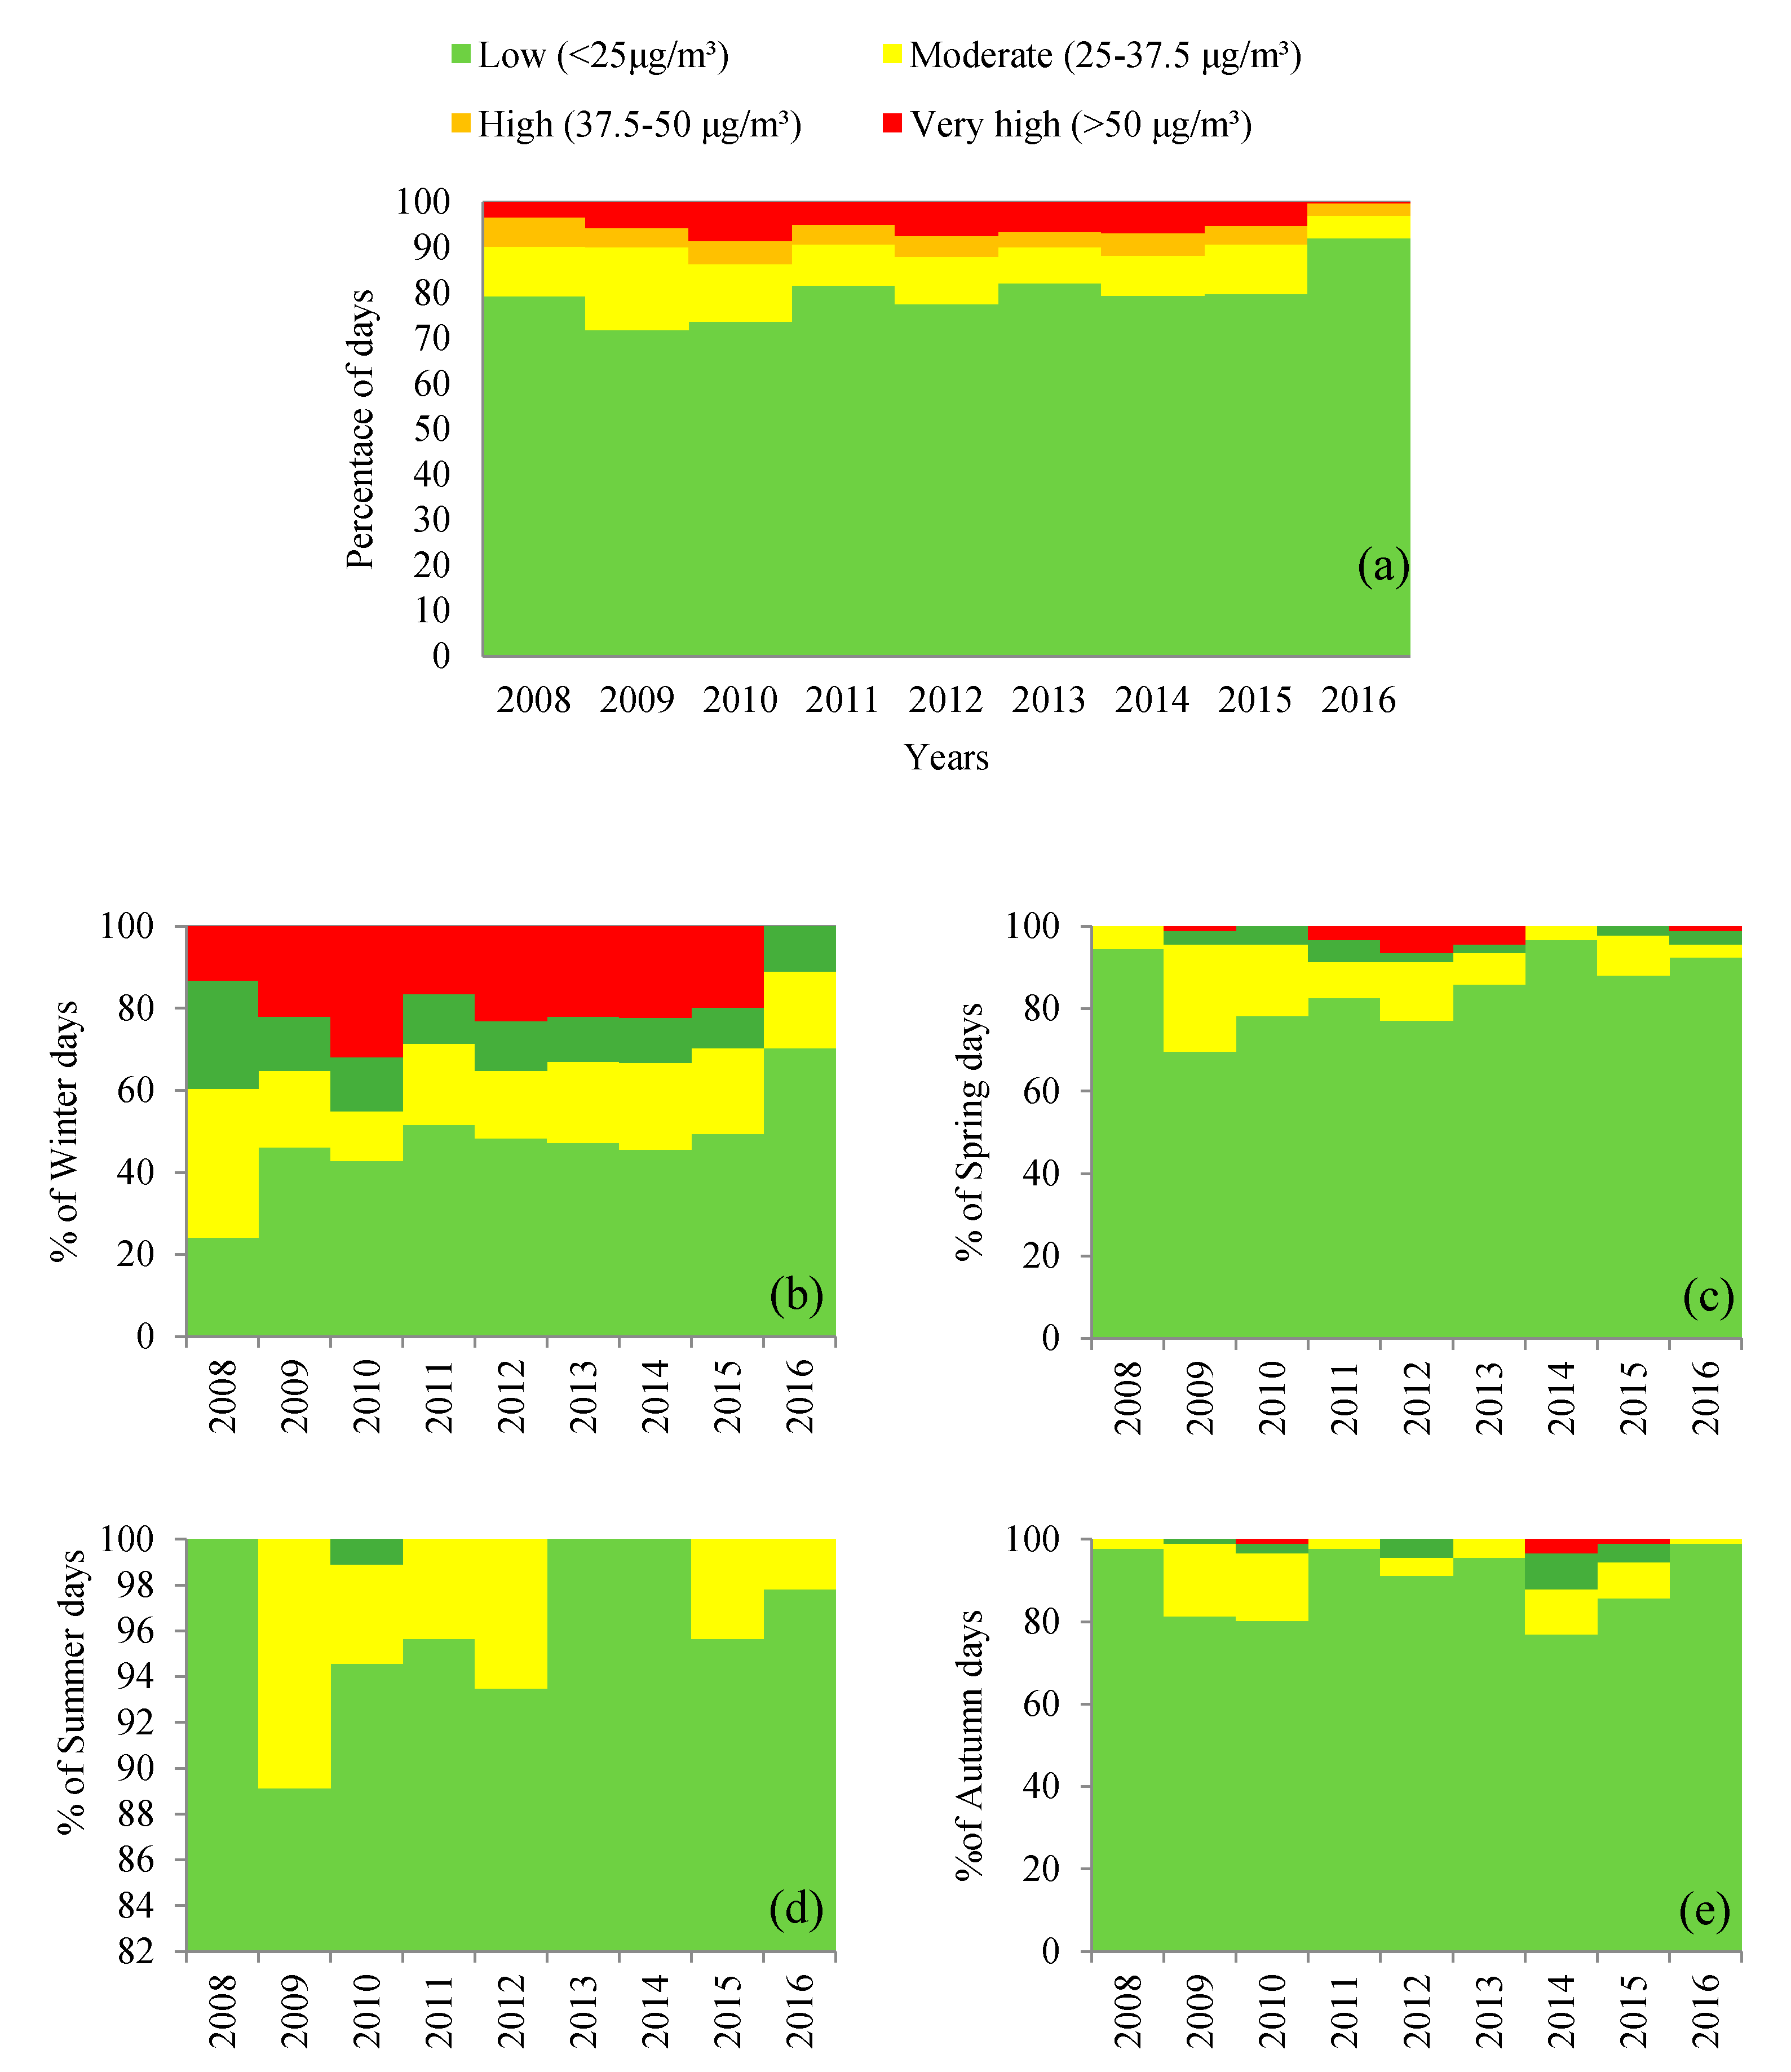
3.1. Ambient PM10 Trend

Multiannual average concentrations of PM10 were used to detect hourly, daily, and weekly changes. The hourly mean concentration of PM10 ranged between 17.0 and 30.1 μg/m3. Daily PM10 values show the bimodal daily pattern, the first peak is in the morning correlated to the rush hours of road traffic (8–11 a.m.) and the second peak occurs at midnight (Figure 2).
The lowest concentration values were found on Sundays (20.8 μg/m3) and Mondays (19.8 μg/m3), known as the “holiday and after holiday effect”, because of lower emissions from vehicle traffic and other sources [36]. At the beginning of the week, the daily PM10 concentrations are starting to increase, and reach the maximum on Wednesdays 25.9 μg/m3 and Thursdays 25.5 μg/m3. The monthly PM10 concentrations show significant fluctuations over the year (Figure 3). The lowest PM10 value was measured in June: 10.36 μg/m3, when the boundary layer level is three-time higher than in winter.
Annual evolution shows that in the first three studied years (2008–2010) a constant increase was detected, with an average of 10.08%. The PM10 concentration was higher than the annual WHO Air Quality admissible level (20 μg/m3) in 2009 (22.39 μg/m3), and in 2010 (23.00 μg/m3), respectively. This rise was followed by a longer fluctuating period (2011–2015) with an average decrease of 3.23%, and a significant 30.56% drop in the year of 2016, when was recorded the minimum concentration level (13.08 μg/m3) (Figure 4a). This decreasing trend could be explained by the implementation of environmental regulations imposed by the EU.
The average seasonal PM10 concentration varies considerably throughout the year (Figure 4b); in winter (34.72 μg/m3), they are 82% higher than the multiannual average (19.00 μg/m3), and almost three times higher than in summer (11.71 μg/m3). The highest seasonal concentration was measured during the winter of 2009–2010 (47.62 μg/m3), close to the WHO’s daily acceptable limit of 50 μg/m3 [37].
According to the calculations, the increased PM10 concentration depends on the high changes in the winter and summer boundary layer and from the increased emission from heating in the winter period. During the winter, PM10 concentration increased by an average of 9.36 μg/m3 due to the heating season.
According to the PM10 classification (low, moderate, high and very high concentration), the PM10 concentration was higher than 50 μg/m3 in 177 cases; 88% of them were in winter, 8.5% occurred in spring, and 2.8% in autumn (Figure 5). The number of days with very high pollution and high pollution were 3.815.42%7.01 and 3.714.43%5.16 of the total, respectively.
Thus, taking into consideration the annual PM10 evolution categories the number of exceedances represents 5.42%, on the other hand, significant changes were observed between seasons. The highest 18.95% was found in winter, due to the main reasons stated out earlier, while in autumn and spring the value was only 1.81% and 0.61%, respectively, meanwhile, there were no exceedances during summer.

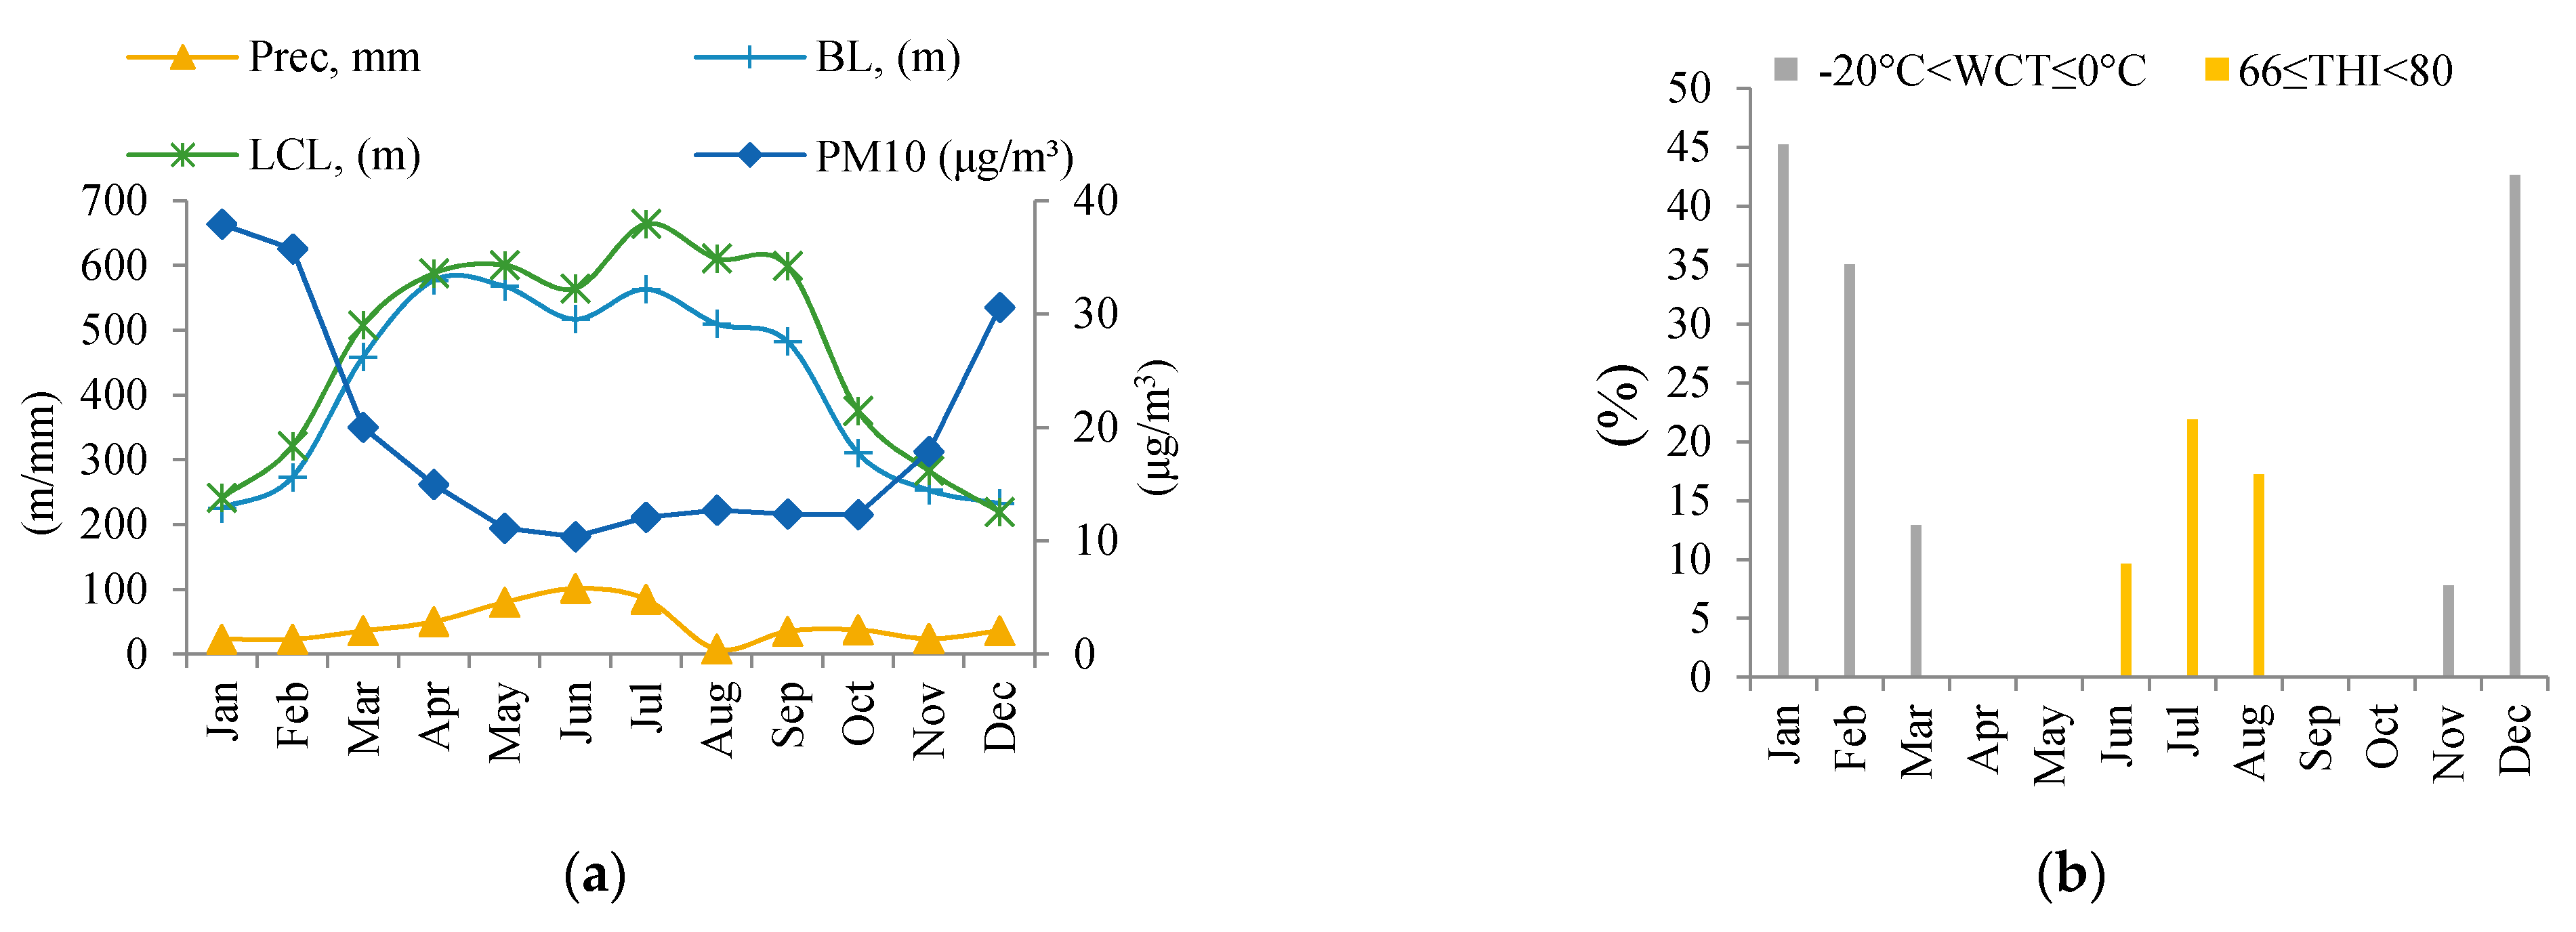
3.2. Relationship between PM10 Concentration and Meteorological Variables

Climatological parameters have a demonstrable effect on the PM10 concentration variation. Except for THI, the multiannual monthly mean of PM10 and the meteorological data show strong negative correlations (Figure 6).
Two classes of human discomfort were detected (Figure 6b): uncomfortably cold and uncomfortably hot. Uncomfortably cold represented 40.96% of the total winter days, 3.22% resulting from the spring days, and 2.59% from the autumn days, while uncomfortably hot occurred during the summer, exhibiting 16.23% of the total summer days, respectively. For the entire studied period, 28.59% of the total days were uncomfortable. Precipitation has a positive effect, by reducing through wet scavenging the PM10 concentration. This effect is more significant during summer, when the quantity of precipitation is the highest (avg. 81.44 mm). The monthly PM10 evaluation shows a reverse trend with the boundary layer and lifting condensation level. There are two categories of accumulation conditions if the values of boundary layer and air pressure are high, strong anticyclonic systems are formed, leading to the Brunt Vaisala effect that often produces thermal inversions, favoring pollutant accumulation. The second accumulation condition occurs when the cloud base is low and the relative humidity is high, leading to fog formation.

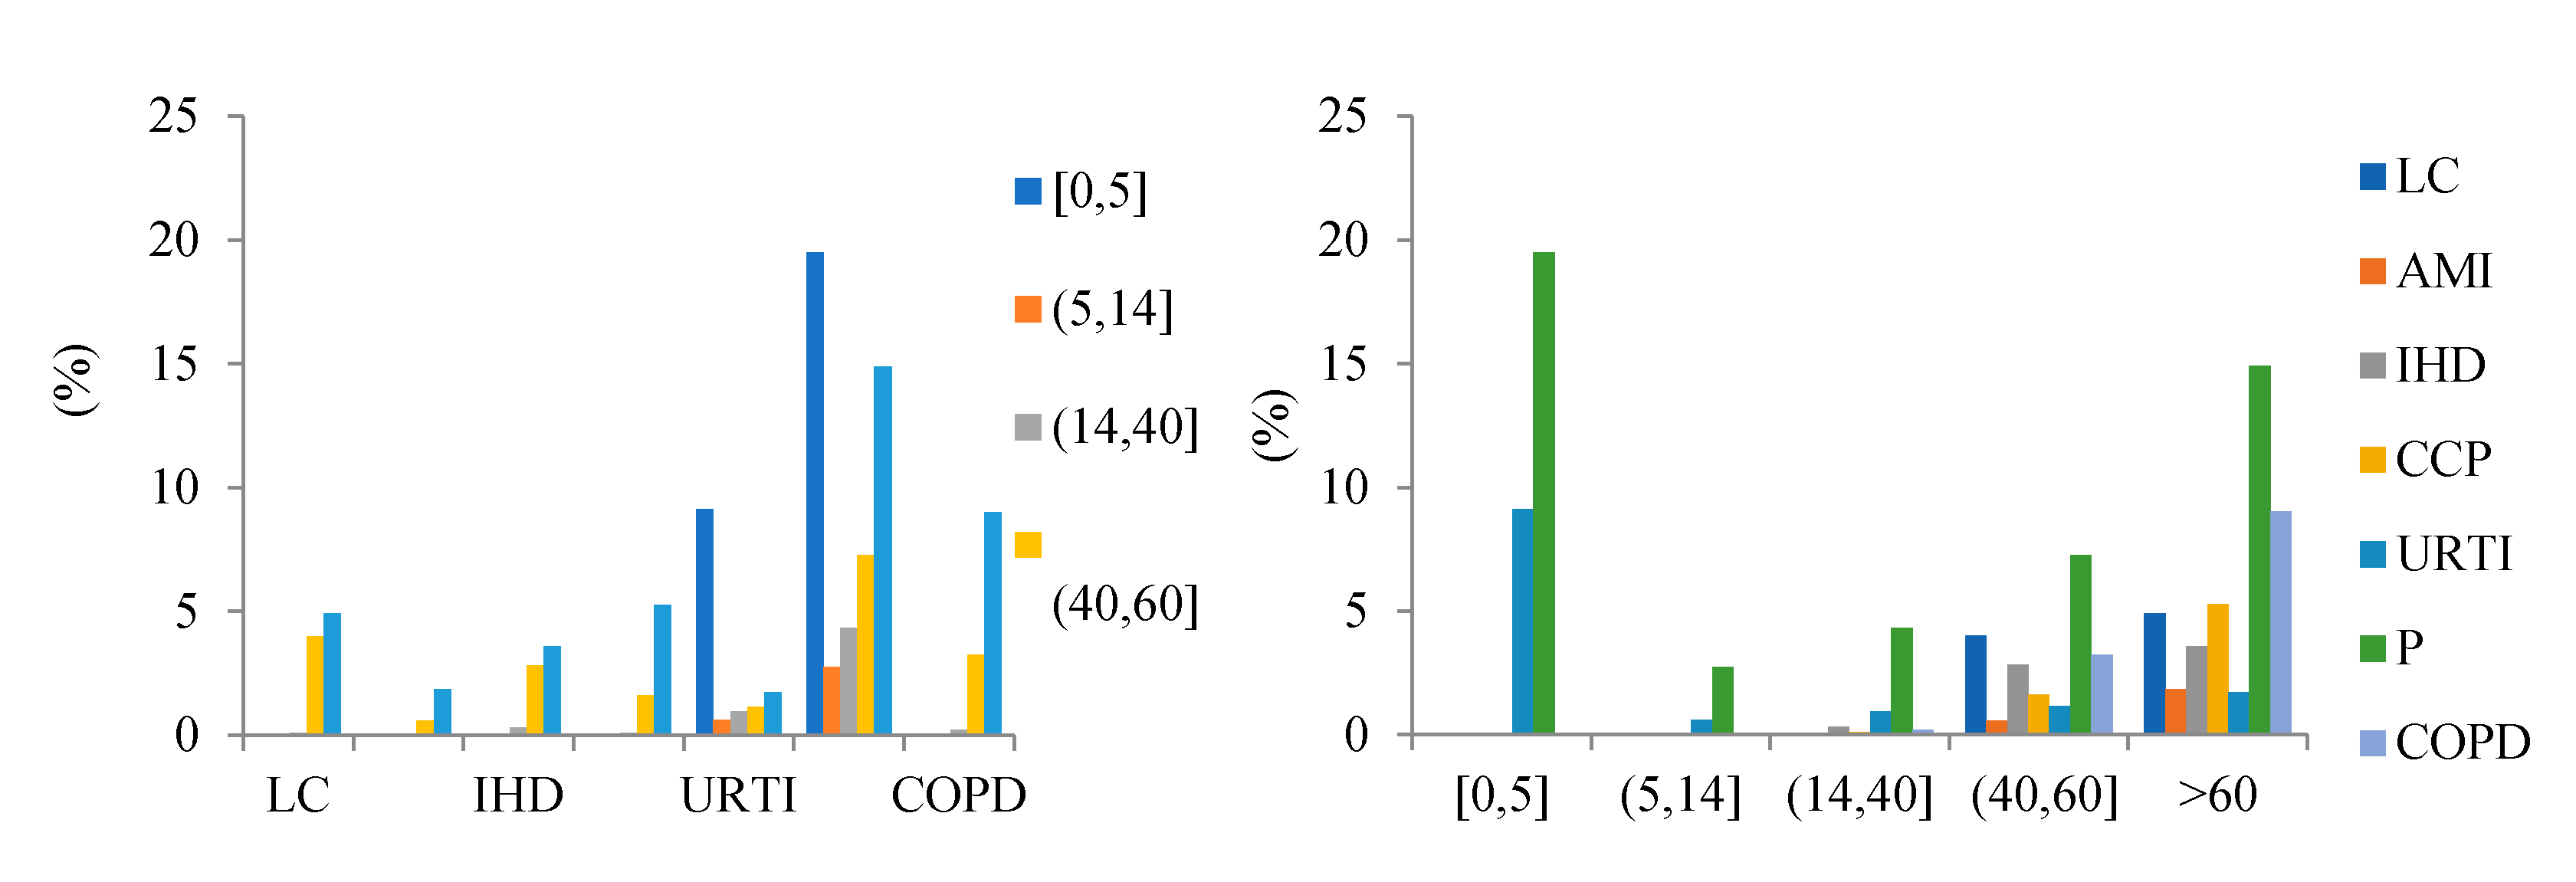
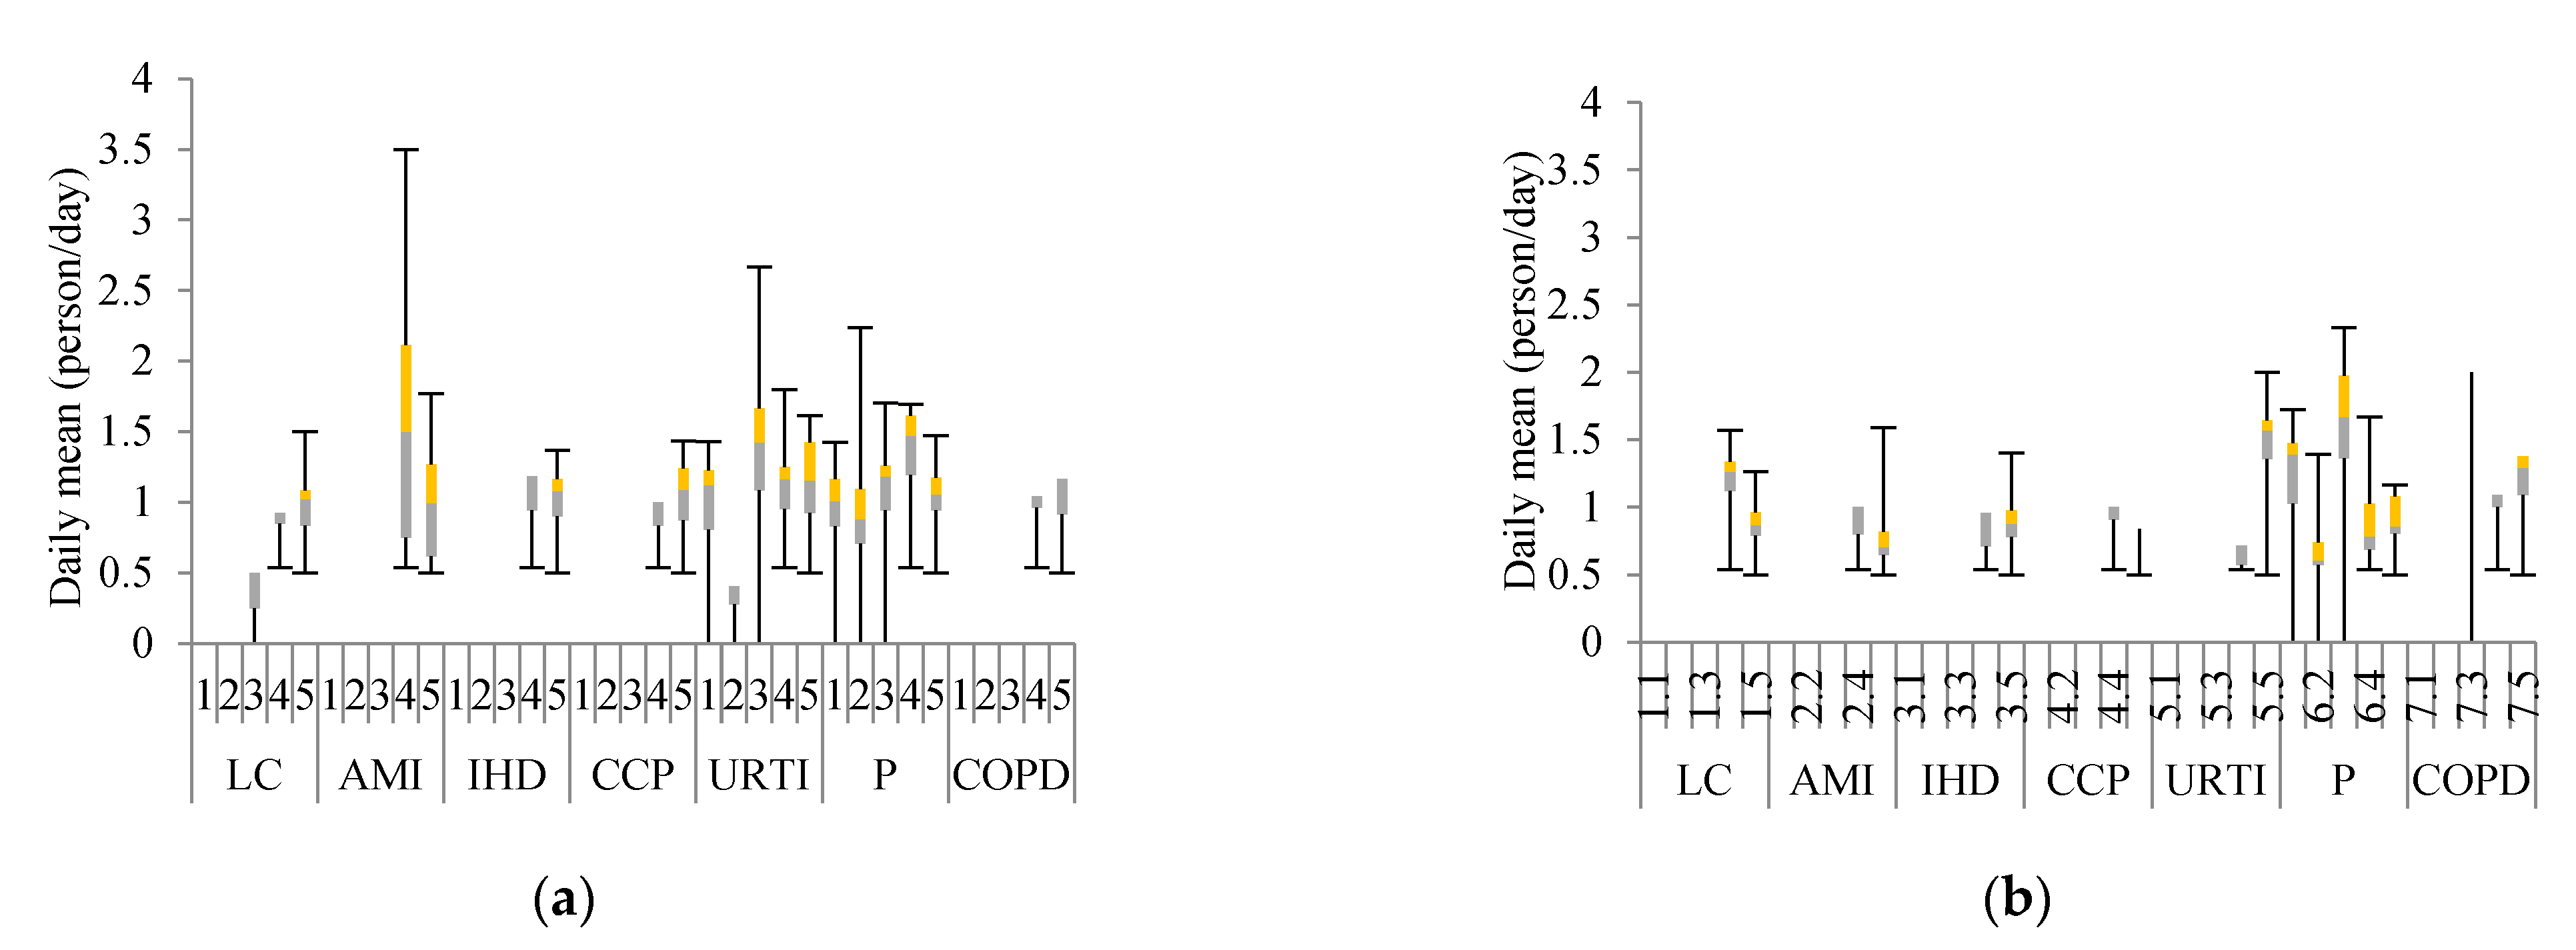
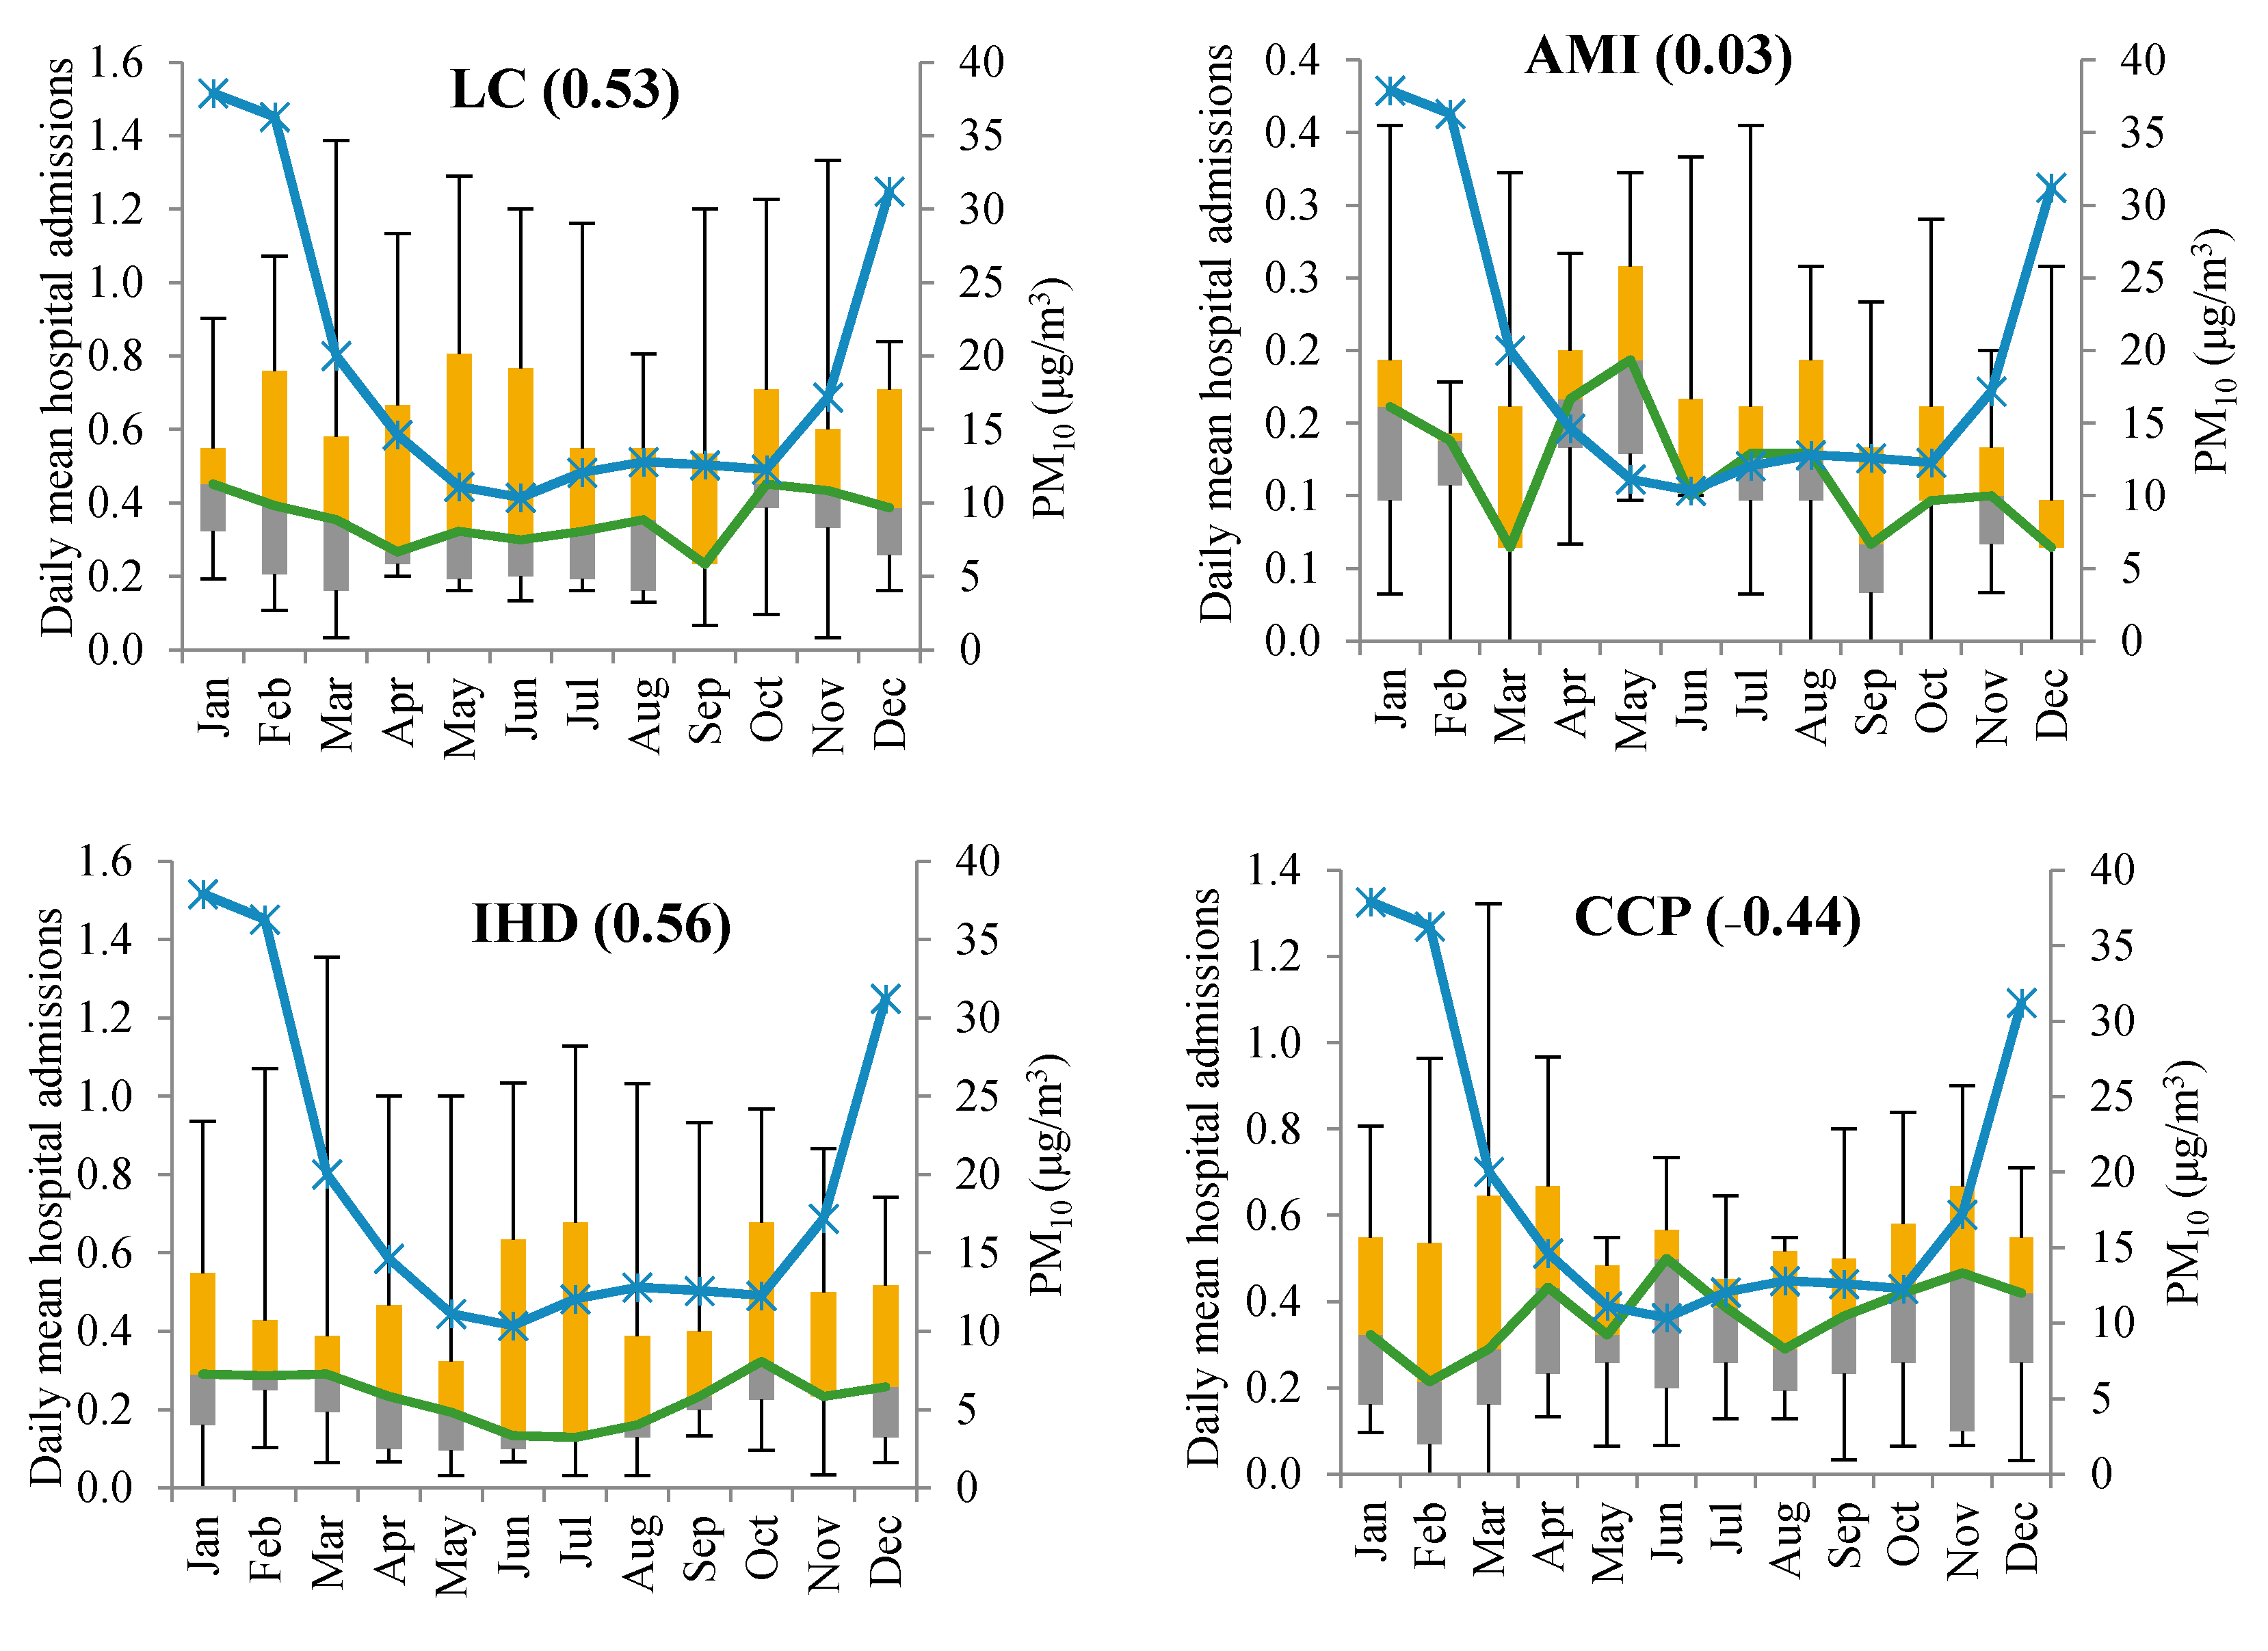
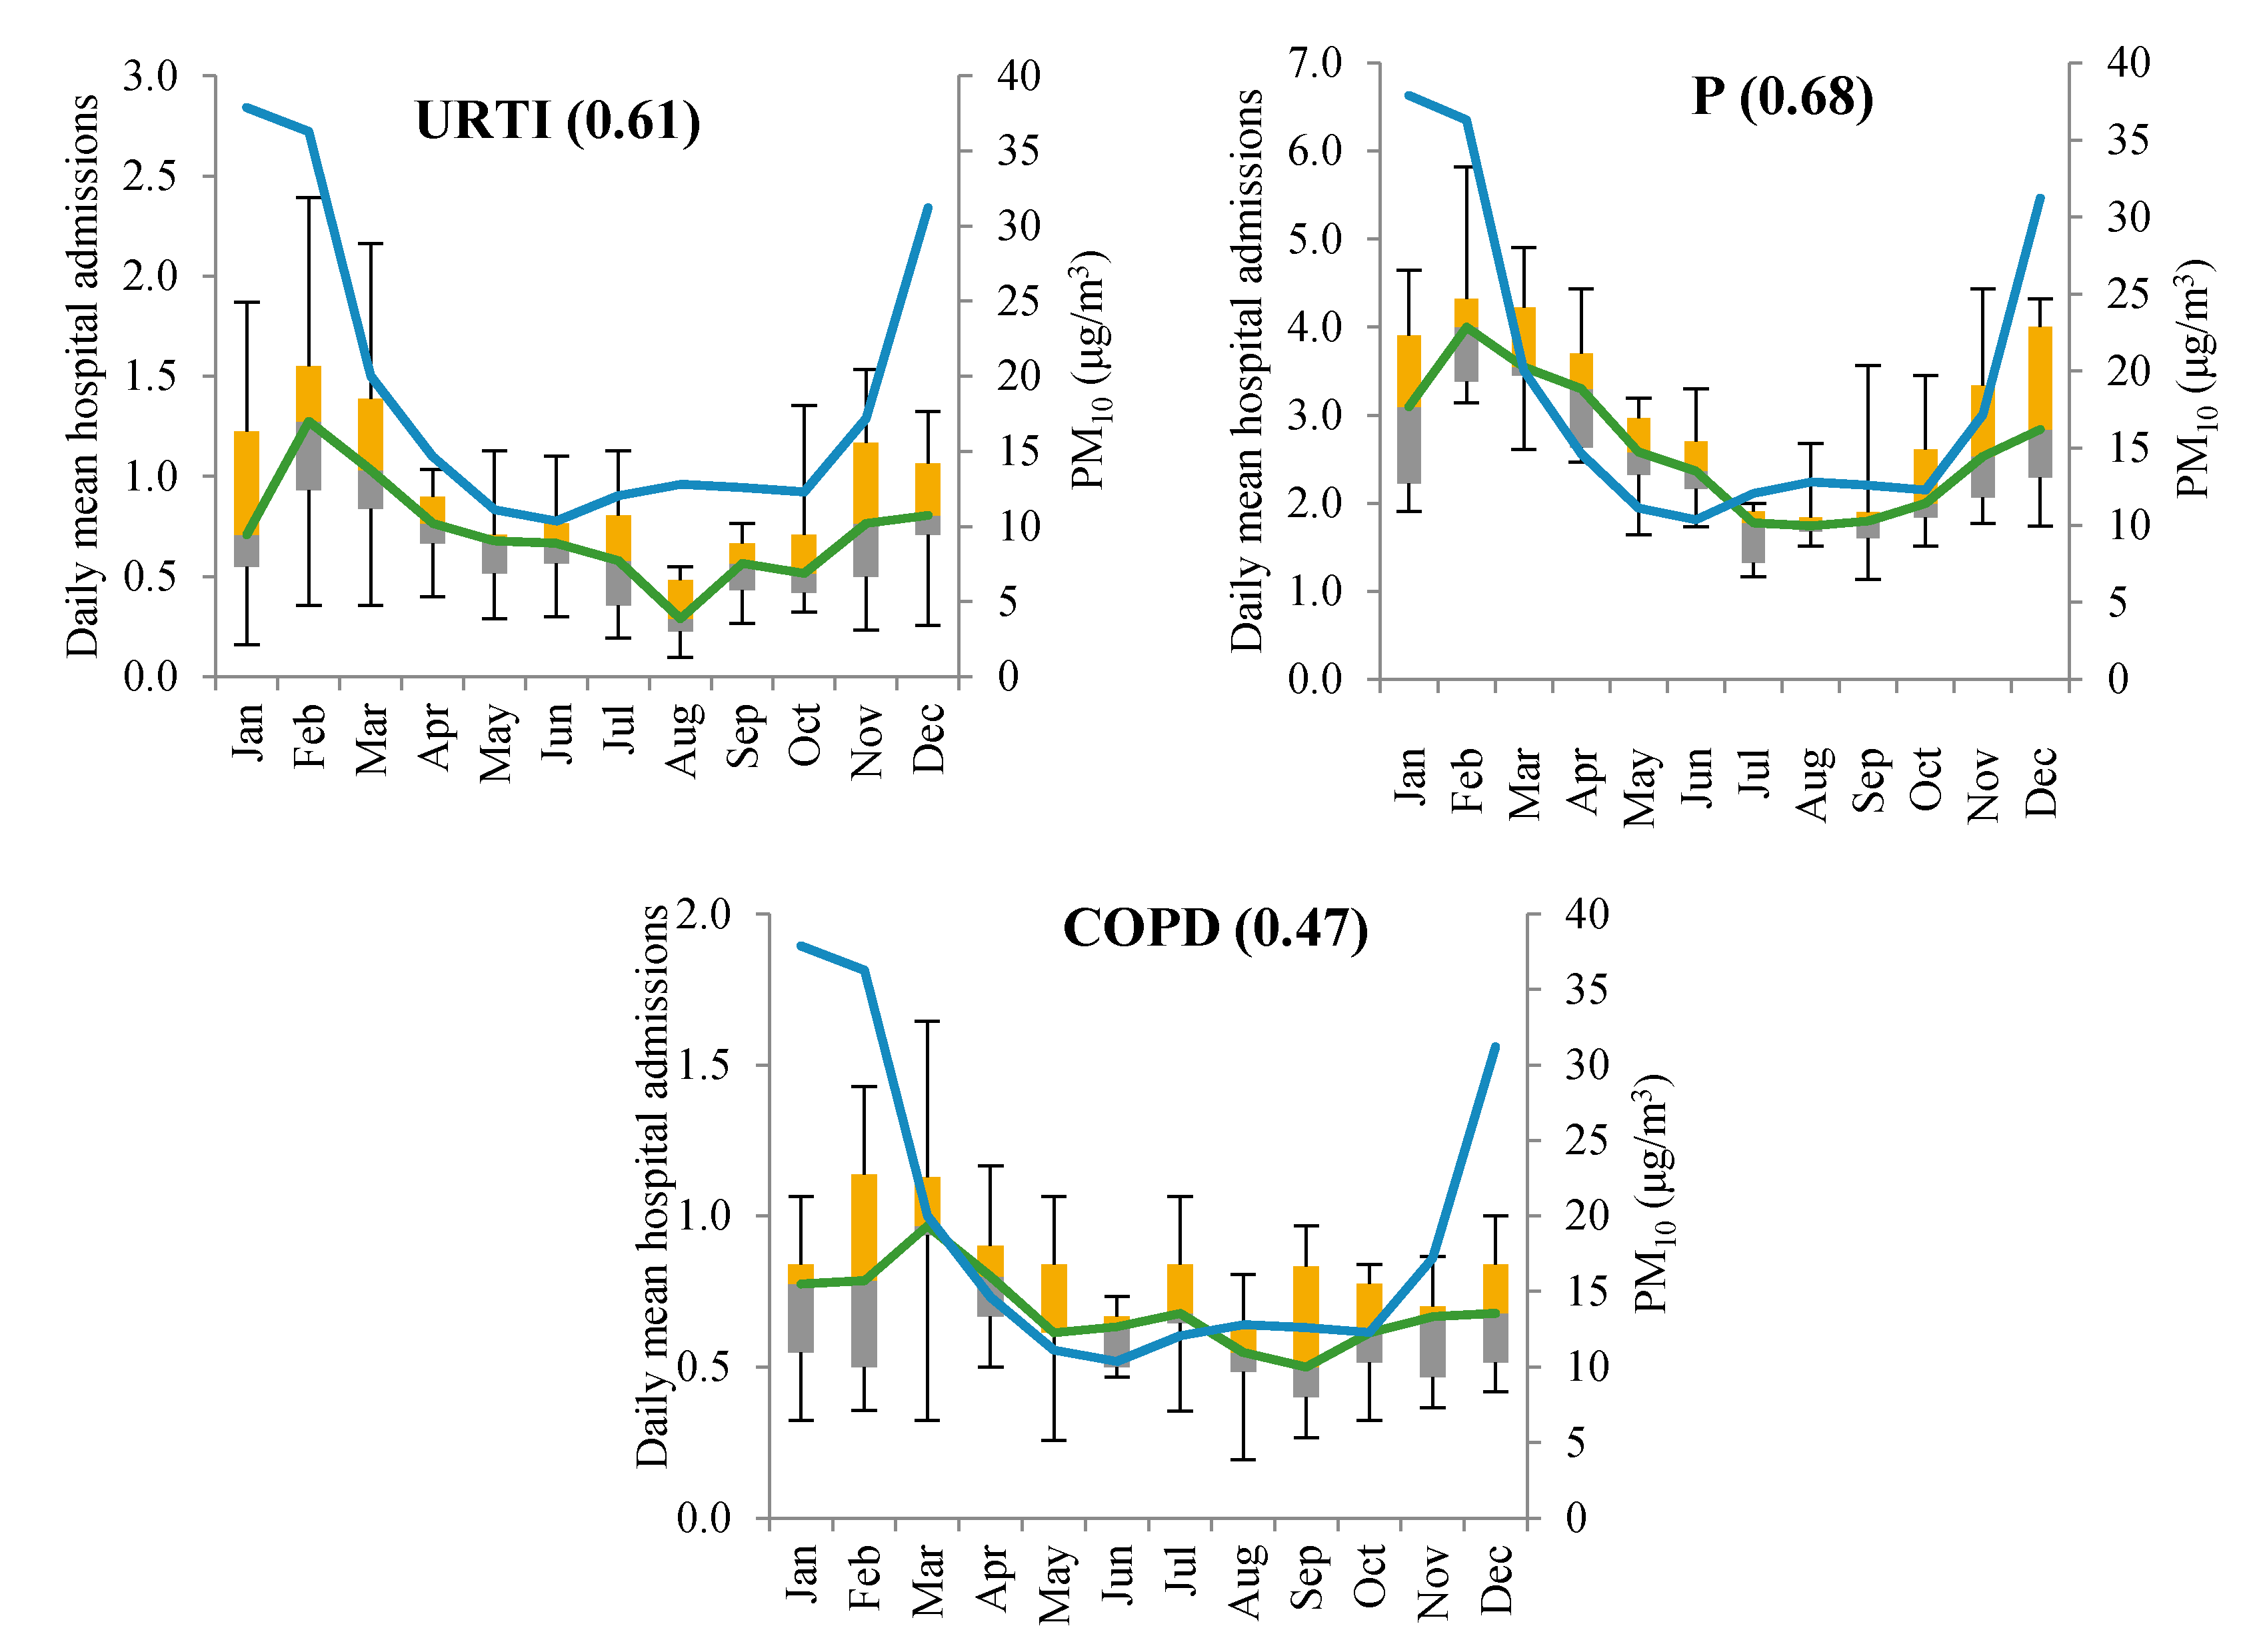
3.3. Hospital Admission Evaluation

Admissions in Ciuc Emergency Hospital due to respiratory and cardiovascular causes were analyzed in detail. The incidence of the disease was examined in five different age groups: [0–5], (5–14], (14–40], (40–60], 60+. In 2010, 2012 and 2014, the number of days with high and very high pollution was higher in comparison with other years, resulting in the surge of hospital admissions. Diseases were found to be most common in the elderly age group 60+ representing 41.3%. The second large number of patients were children; below 5 years old, with 28.9% followed by the patients between (40–60], accounting for up to 20.4%. A lower rate was found in the case of children (5–14] years with 3.4% and young people (14–40] years with 6.0%, respectively. Furthermore, hospital admissions also show a weekly, and monthly cycle. The maximum hospital admission is on Monday and Friday and the minimum on Sunday. The average number of monthly hospital admissions shows a maximum in March (n = 230) and a minimum in August (n = 122). Most hospital admissions were for P in the children’s age group [0–5] years with 19.5% and in the case of elderly people 60+ years with 14.9% proportion (Figure 7).
In addition, the URTI was also common with 13.55%, in this case, the most affected age category was children [0–5] with a weight of 9.12%. The next most frequent disease was COPD with 12.5%, followed by LC 9.01%, CCP 6.99, IHD 6.73%, and AMI 2.5%, respectively.

3.4. Fourier Transformation

The PM10 concentration and climatological data (LCL, BL, THI, WCT) impact on the seven different types of diseases, during all seasons, and based on the five age group category was calculated (Table 2). From the total 459 Fourier transform significant correlation was found, using Pearson’s correlation coefficient approach, in the case of 255, representing 55.56%. After the transformation, the Pearson correlation was applied to ten samples, knowing that in that case if n is between 0.01 and 0.02 the correlation should be 0.745.
Predominantly the PM10 effects were accountable in all age groups in case of URTI and Pneumonia, and all types of diseases occurred at ages higher than 40 years old. The PM10 effects were linked with the WCT and BL, marked with gray backgrounds, based on the numerous assimilations identified during analysis (Table 2). Examining the overlap between the PM10 and studied meteorological parameters, it was observed that on average 68.9% had the same effect. The highest association was between the PM10-BL with 86.9% similarity. A significant effect was found in the case of WCT’s which was reflected in increased IHD in the winter period. The results showed that the climatological parameters (BL, WCT) had additional effects on morbidity, which are marked with red dots (Table 2). On the other hand, BL had additional effects on P and URTI diseases in autumn for all age categories. In winter the WCT shows a strong positive correlation.

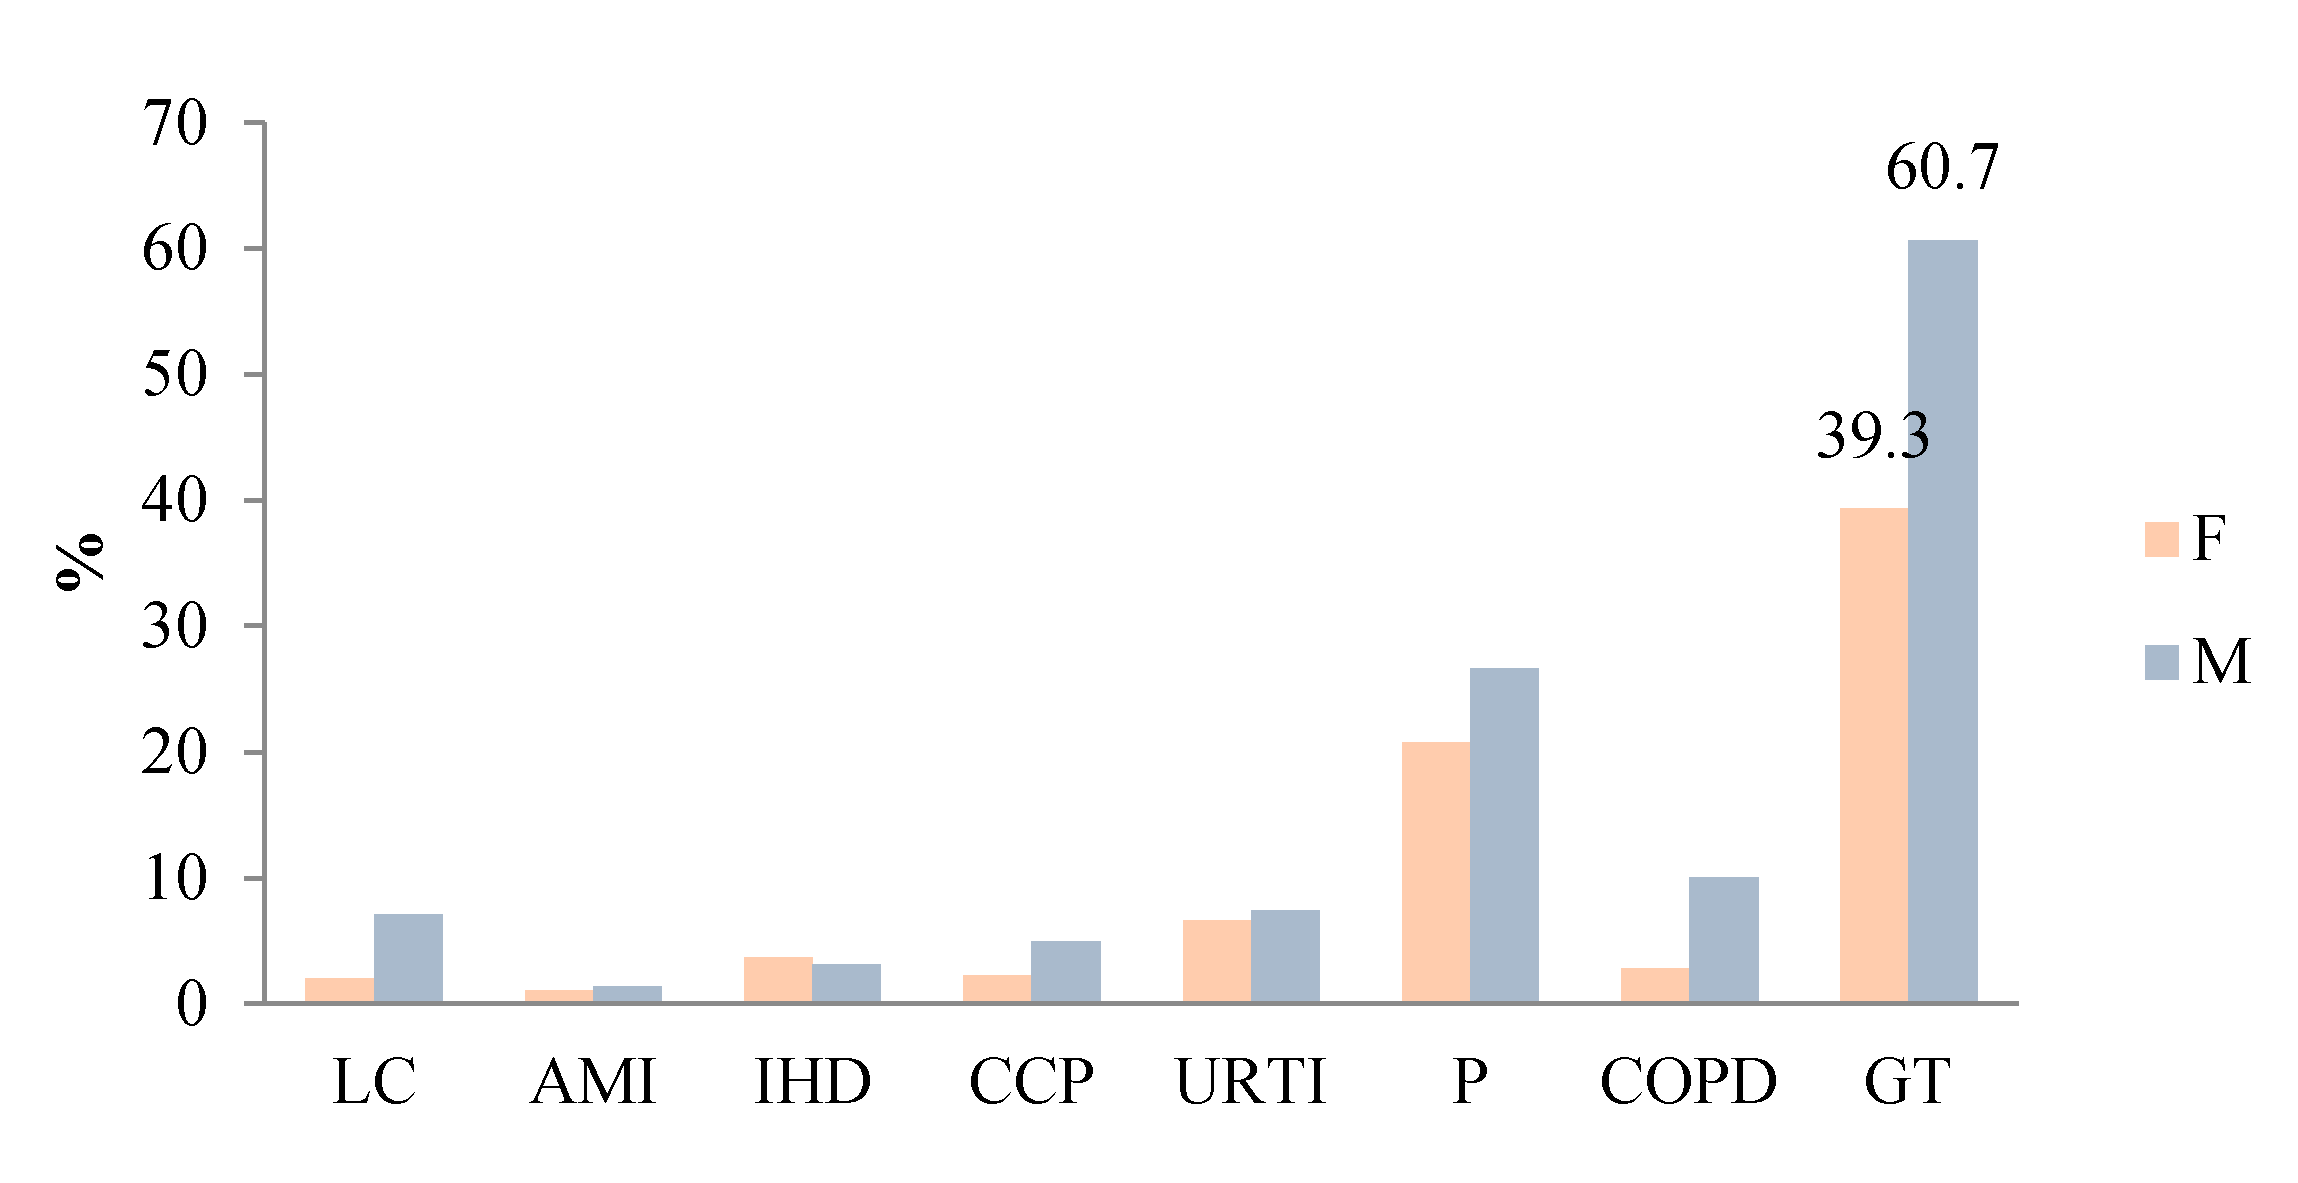
3.5. Gender Distribution of Morbidity and Relative Risk Calculation

A significant gender difference was found between men and women. According to the statistics, 60.7% of the total number of hospitalized patients were men (Figure 8). With the exception of IHD, where men showed significantly higher susceptibility.
The relative risk is the ratio of the probability of an outcome in an exposed group to the probability of an outcome in an unexposed group.
R R   =   E E R C E R   =   A / ( A + B ) C / ( C + D )  
where: EER is the experimental event rate and CER is the control event rate.
The PM10 concentration level in summer was the lowest (10 μg/m3), hence August was selected as a control month. The lowest PM10 concentration and morbidity rate was taken as a reference value.
Relative risk calculation was carried out in different age and gender groups. There was substantial variation in risk between male and female and different age categories. The mean value of RR was 1.37 for women and 1.45 for men. The most significant effect was seen in the case of PM10 and P and URTI (Figure 9).

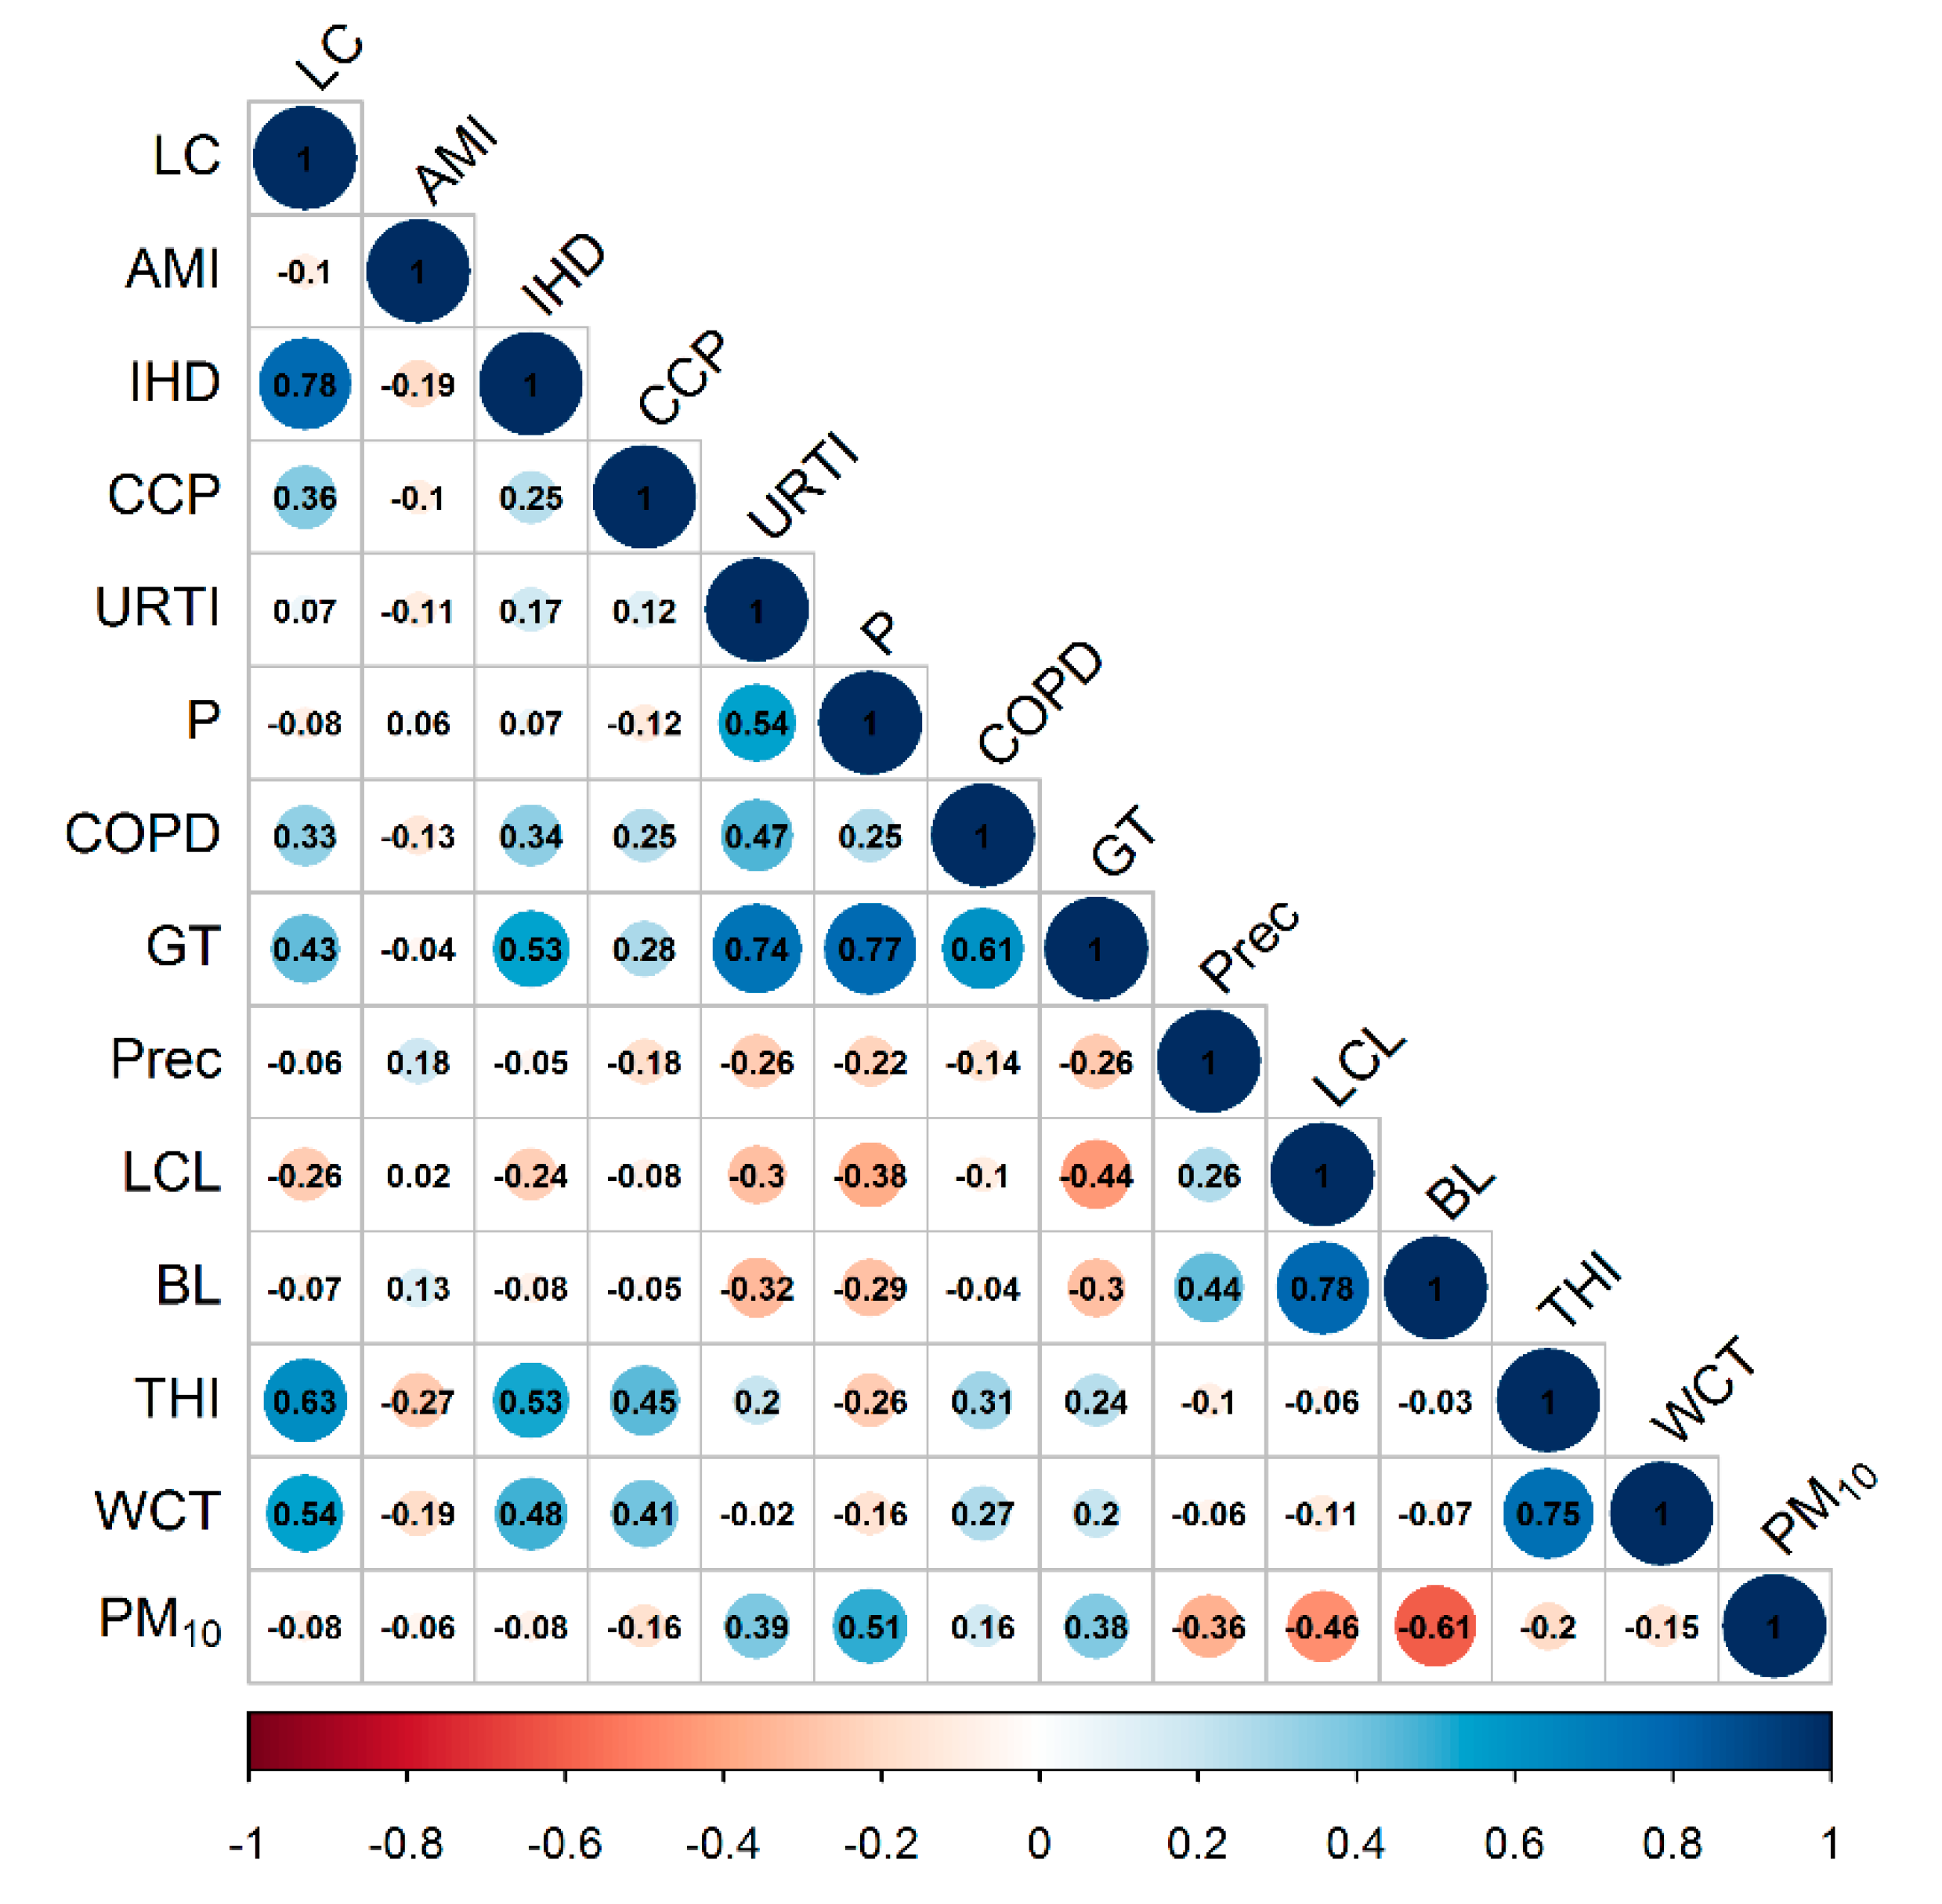
3.6. Correlation Analysis

The Pearson correlation coefficient was used to determine the correlation between the multiannual monthly PM10 concentration and morbidity. Except the AMI for each disease, the Person correlation coefficient was significant: URTI (0.61), P (0.68), IHD (0.56), LC (0.53), CCP (−0.44), and COPD (0.47), respectively. The median multiannual monthly PM10 concentration is marked with the blue line, and the other hand the morbidity monthly evaluation is marked with the green line (Figure 10).
The Pearson correlation between monthly means of PM10, hospital admissions and meteorological parameters over the entire period 2008–2016 has been studied. Pearson’s correlation in many cases shows a significant correlation (r = ±0.23) (Figure 11). A moderate correlation was found between PM10 and P (0.51) and URTI (0.39), respectively. Furthermore, the PM10 followed a moderate negative correlation with the boundary layer (−0.61). As the THI index shows in summer has an additional effect on disease evolution, hence moderate correlation was found between the LC (0.63), IHD (0.52), CCP (0.45), and a weak correlation with the COPS (0.31). In winter the WCT showed moderate correlation with the LC (0.54), IHD (0.48), and CCP (0.41).

3.7. Morbidity Increase Due to a 10 μg/m3 Rise in PM10

The daily morbidity increase associated with a 10 μg/m3 change in PM10 was calculated (Equation (12)).
%   M o r b i d i t y i n c 10 μ g / m 3   =   1 n 1 n ( 10 %   M o r b i d i t y i n c r e a s e 1 n Δ C P M 10 )
where: %   M o r b i d i t y i n c 10 μ g / m 3   —10 μg/m3 PM10 disease caused by average growth; % M o r b i d i t y i n c r e a s e ( 1 n ) —individual current disease growth in percent; Δ C P M 10 —PM10 concentration change compared to the previous one (1–10 days); n—the number of days tested.
The most significant increase caused by 10 μg/m3 increase in PM10 concentration was found for P, with 6.848.28%8.95 after five days (Figure 12).
In the case of URTI and P, the highest number of hospital admissions occurred between the 5th to 7th day, while the 10 μg/m3 PM10 increase resulted in a 2.04% and 8.28% morbidity increase. For lung cancer (LC) and CVD (AMI, IHD, CCD), a maximum delay of 5–6 months was found. Except for AMI (<0.1%), an increase of 0.5% was found. Three months of time offset was observed in the case of COPD, identifying an average of 1.51% growth.

3.8. Theoretical Calculation of Hospital Admissions

The ratio between the theoretical and practical disease evaluation was analyzed (Figure 13). The PM10 contribution to the hospital admissions on average was 0.34 from the total number of hospitalizations. The minimum value of 0.27 was obtained in 2012 for AMI while the highest PM10 contribution was observed in 2011—0.49 in the case of IHD.
The orange line represents the total number of cases per year and the blue one marks the PM10 contribution to the disease morbidity. In the studied region, ambient PM10 concentration had a yearly contribution of 500,552,603 cases to the total morbidity. Taken into consideration the different types of disease frequency the contribution ratio is between 0.88–17.11% (Figure 14).
The annual mean disease evaluation caused by the PM10 is 1.852.71%3.58 for LC, 1.212.11%3.02 for AMI and IHD, 1.622.29%2.96 CCP. URTI represented by 3.684.72%5.76 P and COPD were the most frequent, with 13.4617.13%20.8 and 3.994.21%4.42, respectively.

4. Discussion

The study provides comprehensive information on the combined effect of PM10 and climate parameters on human health. Our results are consistent with previous studies showing an increased number of hospital admissions due to cardio-respiratory diseases after increased PM10-2.5 particulate concentration [38,39,40,41]. A meta-analysis of 23 mortality and 10 hospital admissions studies confirmed increased morbidity and mortality as a result of higher short-term PM10-2.5 concentrations, with more robust correlations for respiratory than cardiovascular endpoints [42].
Symptom exacerbations and disease progression are prompted by particle-triggered molecular and cellular mechanisms. Locally, PM10 deposited in the respiratory tract elicit inflammation by causing oxidative stress, with bronchial hyperactivity, increased sputum production, and injury of the alveolar cells, including alveolar macrophages [43]. These processes lead to impaired lung function and weakened the local immune system, resulting in an increased risk of respiratory disorders following pollutant exposure. Moreover, PM10 air pollution exerts deleterious effects on vascular endothelium, sympathetic nervous system, and systemic inflammation, causing increased cardiovascular morbidity and mortality, primarily of ischemic nature [44,45,46]. Noteworthy, specific groups (e.g., people with cardiovascular risk factors or pre-existing cardiovascular disease) are more vulnerable to the aforesaid harmful effects.
On the other hand, significant differences existed frequently in PM10 concentrations between the weekends and weekdays. Daily mean PM10 concentration on weekdays 23.1 μg/m3 was significantly higher than those on weekends 21.8 μg/m3. According to the results, diurnal variations and weekly cycles are a function of emission sources, and meteorological parameters [47,48]. During winter, there are several influencing factors responsible for the higher PM10 concentration, like thermal inversion, increased PM10 emissions due to indoor heating, and stable atmospheric conditions. The uneven distribution of precipitation reduces the efficiency of the washout mechanism by wet scavenging [49] and the unfavorable topography conditions of the closed basin. As for summer, the evapotranspiration plays an important role in the mixing of air mass by wet convection.
The highest correlation between the PM10 and diseases was found in the case of P (0.51), followed by URTI (0.39). The same finding shows that besides PM10 the meteorological parameters also have an important contribution to the disease occurrence [50]. Winter cold stress is associated with an increase in influenza and respiratory infections that may affect cardiovascular disease. In addition, THI plays an important role in disease frequency, except for the URTI disease. Furthermore, WCT has a big contribution to the LC, IHD, CCP, COPD. The time delay between the dose-response is closely related to certain AMI subtypes and individual characteristics [51]. Studies assessing hospital admissions due to COPD indicated that coarse PM has a stronger or as strong short-term effect as fine PM, stating that PM10-2.5 are also capable to activate severe adverse reactions enough to require hospitalization [52].
On the other hand, meteorological parameters might have an important impact on PM10 concentration; a negative significant correlation between the PM10 and boundary layer (−0.605), lifting condensation level (−0.46) and precipitation (−0.36) was observed. The PM10 accumulation and this reverse ratio can be explained in light of clouds low position and the presence of frequent fog phenomena which are very common in the Ciuc basin [53].
Song et al. [54] conducted a systematic review and meta-analysis in China, United States, and Europe, in order to assess the consequence of a 10 µg/m3 increase in PM10 concentration on COPD in the aforementioned countries. Their findings showed a similar intensification of hospital admission number which increased by 1% in China and Europe, and by 2% in the United States, respectively [54]. Despite the significance of the ambient PM10 effect in the Ciuc basin, there is little information available in the literature on temporal trend and long-term health effects of PM10 in this area. The high air pollution level during the cold season in the Ciuc basin is likely the result of wood-burning, specific topographical and meteorological conditions.
Particle pollution has been linked to a higher risk of exacerbations and respiratory symptoms in subjects with pre-existing lung maladies, compared to the healthy ones.
In concordance with our results, the findings from the European Study of Cohorts for Air Pollution Effects (ESCAPE) revealed a significant association for PM10 concentration and the risk for LC (HR 1.22 [95% CI 1.03–1.45] per 10 μg/m3). The meta-analysis included 312,944 subjects from 17 cohort studies and 9 European countries, counting 2095 incident lung cancer cases diagnosed during a mean follow-up of 12.8 years. The results were confirmed by further studies, which also indicated that the relationship appeared to be more manifest among men [7].
Studies assessing hospital admissions due to COPD indicated that coarse PM had a stronger or as strong short-term effect as fine PM, which supports that PM10-2.5 are also capable to activate severe adverse reactions enough to require hospitalization [52]. After the increased particulate contamination, epidemiological studies have shown deterioration in symptoms and quality of life, increased use of medication and deterioration in lung function [2,3,4,5]. Moreover, in a recent meta-analysis of 85 studies from 12 low- and middle-income countries (mostly East Asia and the Pacific), short-term PM10 exposure was proved to have stronger associations with COPD morbidity [14].
In recent years, solid evidences were also gathered in relation to air pollution and the cardiovascular system. In line with prior studies conducted in different geographical locations, our findings revealed positive associations between ambient PM10-2.5 and hospital admissions for several cardiovascular maladies (i.e., AMI, IHD, and CCP). For example, studies conducted in Western Europe and North America, including the ESCAPE pooled study, detected augmented number of ischemic cardiac events due to higher PM10 exposure, indicating increased risk for each 10 μg/m3 increase in PM10 concentration [55,56,57,58]. Similarly, Feng et.al. reported a significant fluctuation in emergency department admissions for selective cardiovascular diseases (including IHD) in Beijing, China, following short-term PM10 exposure [59]. As for CCP, to the best of our knowledge, there are no existing studies that specifically addressed the PM-related disease load. According to our observations, in the Ciuc basin, we found a linear relationship between PM10 level and hospitalization frequency. This could be explained by the detrimental effect of PM on the right ventricular function. Indeed, the analysis of cardiac magnetic resonance images from 1490 participants from the Multi-Ethnic Study of Atherosclerosis evidenced robust correlation between long-term PM10-2.5concentrations and right ventricular mass in specific subpopulations (i.e., individuals with emphysema and current smokers) [42].
In our study, subjects ≥ 60 years old (41.3%) and males (60.7%) were the most susceptible to respiratory illnesses owing to the increased level of PM10-2.5. These findings are consistent with literature data and offer a broader view of the demographic-specific associations between air pollution, respiratory and cardiovascular diseases. Indeed, a recent study conducted on a large sample size of 56,221 cardiovascular and 92,464 respiratory emergency admissions in 10 general hospitals from Beijing, reported that males and people aged ≥ 65 years were more vulnerable to air pollution [59]. The relationship between pollution exposure and increased morbidity and mortality in the elderly is well-recognized [60,61]. Due to co-morbidities, reduced lung function and weaker immune systems, in case of elder people are prone to exacerbations of chronic diseases (such as COPD) or to respiratory tract infections (particularly pneumonia) [62]. Existing evidence acknowledges gender as a modifier of air pollution effects on human health, but the current findings are inconsistent regarding which gender is more vulnerable. As for male gender, available data indicates that men who smoke respond more intensely to ambient pollution [59]. There is a number of possible explanations for why men are more susceptible to develop pollution-related conditions. Several gendered behaviors (such as alcohol consumption and smoking) have been linked to increased susceptibility to adverse immune-related health effects, including respiratory infections [63]. Gender differences in terms of work-related exposure may also be responsible, men generally spending significantly more time outdoors than women (16.1 h/week versus 9.2 h/week) [64]. Last but not least, sex-linked physiological dissimilarities (e.g., hormonal status, lung maturation and size, airway and vascular responsiveness) are also considered as key factors [63,65].
Our data revealed that children under the age of 5 were more affected by air pollution, with increased hospitalizations for P and URTI. Previous studies have established that outdoor pollution amplifies the burden of severe acute respiratory infections, with increased hospital admissions and mortality, particularly in young children (under 5 years old) [66,67,68].
Furthermore, the association between exposure to PM and childhood P has been confirmed by data from 10 European birth cohorts within the ESCAPE Project [69]. The main reasons why children face greater risks from air pollution have been comprehensively discussed in previous papers [70,71]. First, their lungs, as well as their immune system, are still developing, hence the susceptibility to inflammation is higher. Secondly, they usually breathe faster than adults, inhaling more pollutants relative to their body size. Thirdly, they spend more time out and are more active outdoors than adults, which also result in higher doses of inhaled pollutant.
Epidemiological evidence suggests that the affinity to disease occurrence increases with age and it is higher after 40 years [72]. The prevalence of the disease is highly dependent on age since the human organism is more sensitive to increased PM10 concentration in early childhood and elderly age. In the case of the young generation, the weaker developing immune system is responsible for the frequent illness [73].

5. Study Limitations

Our study was subject to some limitations. First, our survey did not comprise information on documented potential confounders such as occupational/educational/marital status, body mass index, smoking, and alcohol consumption. Second, we were not able to discriminate re-admission frequencies. It is possible for a few patients to have been re-hospitalized within the analyzed timeframe, resulting in underestimation of PM10-related risk variance.

6. Conclusions

We analyzed the influence of meteorological data and PM10 concentration, on health in the Ciuc basin, Romania, from 2008 to 2016. Our results indicate that increasing PM10-concentration is associated with increased hospital admissions for cardio-respiratory diseases. In general, the highest PM10 concentration was observed in winter, especially in January, due to the high atmospheric stability in winter period, thermal inversions, the higher atmospheric pressure and the increased emission from the biomass burning. The damaging effects of air pollution can occur from 5–7 days in the case of respiratory diseases and to 3–6 months for pulmonary and cardiovascular diseases. Children under 5 years, men and the elderly up to 60 years are the most likely to suffer from respiratory disease than other age groups, due to air pollution. According to the calculation, one-third of the affected people could be attributed to PM10. The short-term exposure to outdoor air pollutant PM10 was positively associated with respiratory admissions. Regarding the long-term exposure, it can be concluded that PM10 had negative effect on cardiovascular disease, however, there was a significant delay in dose-response. Furthermore, the PM10 and the climate indexes (WCT, THI) have an important role in the increase of disease frequency.
The present study contributed to the limited information about the effects of air pollution in Romania/Eastern Europe and emphasizes the need for additional research on this topic.
Particulate matter (PM) air pollution is an important and modifiable risk factor for adverse health outcomes including cardiovascular disease. Reduction in air pollution exposures is essential to attaining global targets, such as the American Heart Association and World Heart Federation goal of reducing premature CVD mortality by 25% by 2025 [74].

Author Contributions

Conceptualization, R.S.; methodology, K.B., Z.B., M.M.M.; S.P. and A.K. software, Z.B., M.-V.B. and I.-A.N.; validation, R.S. and Z.B., formal analysis K.B. and Z.B., writing—original draft preparation, K.B., M.M.M. and Á.K.; writing—review and editing, K.B., Z.B. and M.-V.B.; and supervision, R.S. All authors have read and agreed to the published version of the manuscript.

Funding

This research received no external funding.

Institutional Review Board Statement

Not applicable.

Informed Consent Statement

Not applicable.

Data Availability Statement

Not applicable.

Acknowledgments

The authors thank the Miercurea Ciuc County Hospital and the Harghita Environmental Protection Agency for providing data on morbidity and pollution, and K.B. thanks the Verestóy Attila Foundation for the research fellowship. We acknowledge the Copernicus Climate Data Store and European Centre for Medium-Range Weather Forecast (ECMWF) for making available the ERA5 dataset.

Conflicts of Interest

The authors declare no conflict of interest.

References

  1. Prüss-Ustün, A.; Wolf, J.; Corvalán, C.; Bos, R.; Neira, M. Global Burden of Diseases from Environmental Riks. World Health Organ. 2016, 1522. [Google Scholar] [CrossRef]
  2. Peacock, J.L.; Ross Anderson, H.; Bremner, S.A.; Marston, L.; Seemungal, T.A.; Strachan, D.P.; Wedzicha, J.A. Outdoor air pollution and respiratory health in patients with COPD. Thorax 2011, 66, 591–596. [Google Scholar] [CrossRef] [Green Version]
  3. Künzli, N.; Ackermann-Liebrich, U.; Brändli, O.; Tschopp, J.M.; Schindler, C.; Leuenberger, P. Clinically “small” effects of air pollution on FVC have a large public health impact. Eur. Respir. J. 2000, 15, 131–136. [Google Scholar] [CrossRef]
  4. Mariani, E.; Bonati, E.; Veronesi, L.; Colucci, M.; Zanelli, R.; Sansebastiano, G.; Olivieri, D.; Marangio, E. Respiratory function in subjects with chronic obstructive pulmonary disease (COPD) and atmospheric pollution in the city of parma. preliminary analysis. Acta Biomed. 2010, 81, 109–114. [Google Scholar] [PubMed]
  5. Lagorio, S.; Forastiere, F.; Pistelli, R.; Iavarone, I.; Michelozzi, P.; Fano, V.; Marconi, A.; Ziemacki, G.; Ostro, B.D. Air pollution and lung function among susceptible adult subjects: A panel study. Environ. Health A Glob. Access Sci. Source 2006, 5. [Google Scholar] [CrossRef] [Green Version]
  6. Brunekreef, B.; Dockery, D.W.; Krzyzanowski, M. Epidemiologic Studies on Short-Term Effects of Low Levels of Major Ambient Air Pollution Components. Environ. Health Perspect. 1986, 103 (Suppl. 2), 3–13. [Google Scholar]
  7. Consonni, D.; Carugno, M.; De Matteis, S.; Nordio, F.; Randi, G.; Bazzano, M.; Caporaso, N.E.; Tucker, M.A.; Bertazzi, P.A.; Pesatori, A.C.; et al. Outdoor particulate matter (PM10) exposure and lung cancer risk in the EAGLE study. PLoS ONE 2018, 13, 1–20. [Google Scholar] [CrossRef] [Green Version]
  8. Micheu, M.M.; Birsan, M.V.; Szép, R.; Keresztesi, Á.; Nita, I.A. From air pollution to cardiovascular diseases: The emerging role of epigenetics. Mol. Biol. Rep. 2020, 47, 5559–5567. [Google Scholar] [CrossRef]
  9. Polichetti, G.; Cocco, S.; Spinali, A.; Trimarco, V.; Nunziata, A. Effects of particulate matter (PM10, PM2.5 and PM1) on the cardiovascular system. Toxicology 2009, 261, 1–8. [Google Scholar] [CrossRef]
  10. Kannel, W.B.; D’Agostino, R.B.; Sullivan, L.; Wilson, P.W.F. Concept and usefulness of cardiovascular risk profiles. Am. Heart J. 2004. [Google Scholar] [CrossRef] [PubMed]
  11. Du, Y.; Xu, X.; Chu, M.; Guo, Y.; Wang, J. Air particulate matter and cardiovascular disease: The epidemiological, biomedical and clinical evidence. J. Thorac. Dis. 2016, 8, E8–E19. [Google Scholar] [CrossRef]
  12. Brook, R.D.; Rajagopalan, S.; Pope, C.A.; Brook, J.R.; Bhatnagar, A.; Diez-Roux, A.V.; Holguin, F.; Hong, Y.; Luepker, R.V.; Mittleman, M.A.; et al. Particulate Matter Air Pollution and Cardiovascular Disease. Circulation 2010, 121, 2331–2378. [Google Scholar] [CrossRef] [Green Version]
  13. Jo, E.J.; Lee, W.S.; Jo, H.Y.; Kim, C.H.; Eom, J.S.; Mok, J.H.; Kim, M.H.; Lee, K.; Kim, K.U.; Lee, M.K.; et al. Effects of particulate matter on respiratory disease and the impact of meteorological factors in Busan, Korea. Respir. Med. 2017, 124, 79–87. [Google Scholar] [CrossRef] [Green Version]
  14. Newell, K.; Kartsonaki, C.; Lam, K.B.H.; Kurmi, O.P. Cardiorespiratory health effects of particulate ambient air pollution exposure in low-income and middle-income countries: A systematic review and meta-analysis. Lancet Planet. Health 2017, 1, e360–e367. [Google Scholar] [CrossRef] [Green Version]
  15. Stanaway, J.D.; Afshin, A.; Gakidou, E.; Lim, S.S.; Abate, D.; Abate, K.H.; Abbafati, C.; Abbasi, N.; Abbastabar, H.; Foad, A.-A. Global, regional, and national comparative risk assessment of 84 behavioural, environmental and occupational, and metabolic risks or clusters of risks for 195 countries and territories, 1990–2017: A systematic analysis for the Global Burden of Disease Study. Lancet 2018, 392, 1923–1994. [Google Scholar] [CrossRef] [Green Version]
  16. Micheu, M.M.; Birsan, M.V.; Nita, I.A.; Andrei, M.D.; Nebunu, D.; Acatrinei, C.; Sfîcă, L.; Szép, R.; Keresztesi, Á.; F-dez de Arróyabe, P.; et al. Influence of meteorological variables on people with cardiovascular diseases in Bucharest (2011–2012). Rom. Rep. Phys. 2020, 73, 107. [Google Scholar]
  17. Krewski, D.; Jerrett, M.; Richard, T.B.; Ma, R.; Hughes, E.; Shi, Y.; Turner, M.C.; Pope, C.A., III; Turson, G.; Calle, E.E.; et al. Extended Follow-Up and Spatial Analysis of the American Cancer Society Study Linking Particulate Air Pollution and Mortality; Health Effects Institute: Boston, MA, USA, 1991. [Google Scholar]
  18. Dominici, F.; McDermott, A.; Daniels, M.; Zeger, S.L.; Samet, J.M. Revised analyses of the national morbidity, mortality, and air pollution study: Mortality among residents of 90 cities. J. Toxicol. Environ. Health Part A 2005, 68, 1071–1092. [Google Scholar] [CrossRef]
  19. Samoli, E.; Peng, R.; Ramsay, T.; Pipikou, M.; Touloumi, G.; Dominici, F.; Burnett, R.; Cohen, A.; Krewski, D.; Samet, J.; et al. Acute effects of ambient particulate matter on mortality in Europe and North America: Results from the APHENA study. Environ. Health Perspect. 2008, 116, 1480–1486. [Google Scholar] [CrossRef] [Green Version]
  20. Pascal, M.; Corso, M.; Chanel, O.; Declercq, C.; Badaloni, C.; Cesaroni, G.; Henschel, S.; Meister, K.; Haluza, D.; Martin-Olmedo, P.; et al. Assessing the public health impacts of urban air pollution in 25 European cities: Results of the Aphekom project. Sci. Total Environ. 2013, 449, 390–400. [Google Scholar] [CrossRef]
  21. Beelen, R.; Raaschou-Nielsen, O.; Stafoggia, M.; Andersen, Z.J.; Weinmayr, G.; Hoffmann, B.; Wolf, K.; Samoli, E.; Fischer, P.; Nieuwenhuijsen, M.; et al. Effects of long-term exposure to air pollution on natural-cause mortality: An analysis of 22 European cohorts within the multicentre ESCAPE project. Lancet 2014, 383, 785–795. [Google Scholar] [CrossRef]
  22. Dehbi, H.M.; Blangiardo, M.; Gulliver, J.; Fecht, D.; de Hoogh, K.; Al-Kanaani, Z.; Tillin, T.; Hardy, R.; Chaturvedi, N.; Hansell, A.L. Air pollution and cardiovascular mortality with over 25 years follow-up: A combined analysis of two British cohorts. Environ. Int. 2017, 99, 275–281. [Google Scholar] [CrossRef] [PubMed] [Green Version]
  23. Gandini, M.; Scarinzi, C.; Bande, S.; Berti, G.; Carnà, P.; Ciancarella, L.; Costa, G.; Demaria, M.; Ghigo, S.; Piersanti, A.; et al. Long term effect of air pollution on incident hospital admissions: Results from the Italian Longitudinal Study within LIFE MED HISS project. Environ. Int. 2018, 1–11. [Google Scholar] [CrossRef] [PubMed]
  24. Qian, D.; Yan, W.; Zanobetti, A.; Wang, Y.; Koutrakis, P.; Choirat, C.; Dominici, F.; Schwartz, J.D. Air pollution and mortality in the medicare population. J. Am. Med. Assoc. 2018, 319, 2135. [Google Scholar] [CrossRef]
  25. Available online: berkeleyearth.org (accessed on 18 February 2021).
  26. Xing, Y.F.; Xu, Y.H.; Shi, M.H.; Lian, Y.X. The impact of PM2.5 on the human respiratory system. J. Thorac. Dis. 2016, 8, E69–E74. [Google Scholar] [CrossRef] [PubMed]
  27. Leitte, A.M.; Petrescu, C.; Franck, U.; Richter, M.; Suciu, O.; Ionovici, R.; Herbarth, O.; Schlink, U. Respiratory health, effects of ambient air pollution and its modification by air humidity in Drobeta-Turnu Severin, Romania. Sci. Total Environ. 2009, 407, 4004–4011. [Google Scholar] [CrossRef]
  28. Szép, R.; Mateescu, E.; Nechifor, C.; Keresztesi, Á. Chemical characteristics and source analysis on ionic composition of rainwater collected in the Carpathians “Cold Pole,” Ciuc basin, Eastern Carpathians, Romania. Environ. Sci. Pollut. Res. 2017, 24, 27288–27302. [Google Scholar] [CrossRef] [PubMed]
  29. Szép, R.; Bodor, Z.; Miklóssy, I.; Niță, I.A.; Oprea, O.A.; Keresztesi, Á. Influence of peat fires on the rainwater chemistry in intra-mountain basins with specific atmospheric circulations (Eastern Carpathians, Romania). Sci. Total Environ. 2019, 647, 275–289. [Google Scholar] [CrossRef]
  30. Hersbach, H.; Bell, B.; Berrisford, P.; Hirahara, S.; Horányi, A.; Muñoz-Sabater, J.; Nicolas, J.; Peubey, C.; Radu, R.; Schepers, D.; et al. The ERA5 global reanalysis. Q. J. R. Meteorol. Soc. 2020, 146, 1999–2049. [Google Scholar] [CrossRef]
  31. Available online: https://rda.ucar.edu/datasets/ds630.0/. (accessed on 18 February 2021).
  32. Dobrinescu, A.; Busuioc, A.; Birsan, M.V.; Dumitrescu, A.; Orzan, A. Changes in thermal discomfort indices in Romania and their connections with large-scale mechanisms. Clim. Res. 2015, 64, 213–226. [Google Scholar] [CrossRef]
  33. Osgood, B. The Fourier Transform and its Applications—Lecture Notes. Electr. Eng. Dep. Stanf. Univ. 2010, 186–188. [Google Scholar]
  34. Ribeiro, K.M.; Júnior, R.A.B.; Sáfadi, T.; Horgan, G. Comparison between Fourier and Wavelets Transforms in Biospeckle Signals. Appl. Math. 2013, 4, 11–22. [Google Scholar] [CrossRef] [Green Version]
  35. Aunan, K. Exposure-response functions for health effects of air pollutants based on epidemiological findings. Risk Anal. 1996, 16, 693–709. [Google Scholar] [CrossRef]
  36. Tan, P.; Chou, C.; Liang, J.; Chou, C.C.; Shiu, C. Air pollution “holiday effect” resulting from the Chinese New Year. Atmos. Environ. 2009, 43, 2114–2124. [Google Scholar] [CrossRef]
  37. Colvez, A.; Castex, A.; Carriere, I. WHO Air quality guidelines for particulate matter, ozone, nitrogen. Rev. Epidemiol. Sante Publique 2003, 51, 565–573. [Google Scholar] [CrossRef]
  38. Anenberg, S.C.; Belova, A.; Brandt, J.; Fann, N.; Greco, S.; Guttikunda, S.; Heroux, M.E.; Hurley, F.; Krzyzanowski, M.; Medina, S.; et al. Survey of Ambient Air Pollution Health Risk Assessment Tools. Risk Anal. 2016, 36, 1718–1736. [Google Scholar] [CrossRef]
  39. Li, Y.; Henze, D.K.; Jack, D.; Henderson, B.H.; Kinney, P.L. Assessing public health burden associated with exposure to ambient black carbon in the United States. Sci. Total Environ. 2016, 539, 515–525. [Google Scholar] [CrossRef] [Green Version]
  40. Hassanvand, M.S.; Naddafi, K.; Kashani, H.; Faridi, S.; Kunzli, N.; Nabizadeh, R.; Momeniha, F.; Gholampour, A.; Arhami, M.; Zare, A.; et al. Short-term effects of particle size fractions on circulating biomarkers of inflammation in a panel of elderly subjects and healthy young adults. Environ. Pollut. 2017, 223, 695–704. [Google Scholar] [CrossRef] [PubMed]
  41. Xia, X.; Zhang, A.; Liang, S.; Qi, Q.; Jiang, L.; Ye, Y. The association between air pollution and population health risk for respiratory infection: A case study of Shenzhen, China. Int. J. Environ. Res. Public Health 2017, 14, 950. [Google Scholar] [CrossRef] [Green Version]
  42. Adar, S.D.; Filigrana, P.A.; Clements, N.; Peel, J.L. Ambient Coarse Particulate Matter and Human Health: A Systematic Review and Meta-Analysis. Curr. Environ. Health Rep. 2014, 1, 258–274. [Google Scholar] [CrossRef] [PubMed] [Green Version]
  43. Fiordelisi, A.; Piscitelli, P.; Trimarco, B.; Coscioni, E.; Iaccarino, G.; Sorriento, D. The mechanisms of air pollution and particulate matter in cardiovascular diseases. Heart Fail. Rev. 2017, 22, 337–347. [Google Scholar] [CrossRef] [PubMed]
  44. Miller, M.R.; Shaw, C.A.; Langrish, J.P. From particles to patients: Oxidative stress and the cardiovascular effects of air pollution. Future Cardiol. 2012, 8, 577–602. [Google Scholar] [CrossRef] [Green Version]
  45. Li, Y.R.; Xiao, C.C.; Li, J.; Tang, J.; Geng, X.Y.; Cui, L.J.; Zhai, J.X. Association between air pollution and upper respiratory tract infection in hospital outpatients aged 0 e 14 years in Hefei, China: A time series study. Public Health 2017, 6. [Google Scholar] [CrossRef]
  46. Hamanaka, R.B.; Mutlu, G.M. Particulate Matter Air Pollution: Effects on the Cardiovascular System. Front. Endocrinol. Lausanne 2018, 9, 1–15. [Google Scholar] [CrossRef] [PubMed] [Green Version]
  47. Cheol Kim, H.; Kim, E.; Bae, C.; Hoon Cho, J.; Kim, B.U.; Kim, S. Regional contributions to particulate matter concentration in the Seoul metropolitan area, South Korea: Seasonal variation and sensitivity to meteorology and emissions inventory. Atmos. Chem. Phys. 2017, 17, 10315–10332. [Google Scholar] [CrossRef] [Green Version]
  48. Mohtar, A.A.A.; Latif, M.T.; Baharudin, N.H.; Ahamad, F.; Chung, J.X.; Othman, M.; Juneng, L. Variation of major air pollutants in different seasonal conditions in an urban environment in Malaysia. Geosci. Lett. 2018, 5, 21. [Google Scholar] [CrossRef]
  49. Aikawa, M.; Kajino, M.; Hiraki, T.; Mukai, H. The contribution of site to washout and rainout: Precipitation chemistry based on sample analysis from 0.5mm precipitation increments and numerical simulation. Atmos. Environ. 2014, 95, 165–174. [Google Scholar] [CrossRef]
  50. Ghanizadeh, G.; Heidari, M.; Seifi, B.; Jafari, H.; Pakjouei, S. The Effect of Climate Change on Cardiopulmonary Disease—A Systematic Review. J. Clin. Diagn. Res. 2017, 1–4. [Google Scholar] [CrossRef]
  51. Zhang, Q.; Qi, W.; Yao, W.; Wang, M.; Chen, Y.; Zhou, Y. Ambient Particulate Matter (PM 2.5/PM 10) Exposure and Emergency Department Visits for Acute Myocardial Infarction in Chaoyang District, Beijing, China During 2014: A Case-Crossover Study. J. Epidemiol. 2016, 26, 538–545. [Google Scholar] [CrossRef] [Green Version]
  52. Brunekreef, B.; Forsberg, B. Epidemiological evidence of effects of coarse airborne particles on health. Eur. Respir. J. 2005, 26, 309–318. [Google Scholar] [CrossRef] [PubMed]
  53. Sun, Y.; Zhuang, G.; Tang, A.; Wang, Y.; An, Z. Chemical Characteristics of PM2.5 and PM10 in Haze—Fog Episodes in Beijing. Env. Sci. Technol. 2006, 40, 3148–3155. [Google Scholar] [CrossRef]
  54. Song, Q.; Christiani, D.C.; Wang, X.; Ren, J. The global contribution of outdoor air pollution to the incidence, prevalence, mortality and hospital admission for chronic obstructive pulmonary disease: A systematic review and meta-analysis. Int. J. Env. Res. Public Health 2014, 11, 11822–11832. [Google Scholar] [CrossRef] [Green Version]
  55. Lipsett, M.J.; Ostro, B.D.; Reynolds, P.; Goldberg, D.; Hertz, A.; Jerrett, M.; Smith, D.F.; Garcia, C.; Chang, E.T.; Bernstein, L. California Long-term exposure to air pollution and cardiorespiratory disease in the California teachers study cohort. Am. J. Respir. Crit. Care Med. 2011, 184, 828–835. [Google Scholar] [CrossRef]
  56. Cesaroni, G.; Forastiere, F.; Stafoggia, M.; Andersen, Z.J.; Badaloni, C.; Beelen, R.; Caracciolo, B.; De Faire, U.; Erbel, R.; Eriksen, K.T.; et al. Long term exposure to ambient air pollution and incidence of acute coronary events: Prospective cohort study and meta-analysis in 11 european cohorts from the escape project. BMJ 2014, 348. [Google Scholar] [CrossRef] [Green Version]
  57. Hart, J.E.; Puett, R.C.; Rexrode, K.M.; Albert, C.M.; Laden, F. Effect modification of long-term air pollution exposures and the risk of incident cardiovascular disease in US women. J. Am. Heart Assoc. 2015, 4, 1–13. [Google Scholar] [CrossRef] [PubMed] [Green Version]
  58. Cai, Y.; Hodgson, S.; Blangiardo, M.; Gulliver, J.; Morley, D.; Fecht, D.; Vienneau, D.; de Hoogh, K.; Key, T.; Hveem, K.; et al. Road traffic noise, air pollution and incident cardiovascular disease: A joint analysis of the HUNT, EPIC-Oxford and UK Biobank cohorts. Environ. Int. 2018, 114, 191–201. [Google Scholar] [CrossRef] [PubMed]
  59. Feng, W.; Li, H.; Wang, S.; Van Halm-Lutterodt, N.; An, J.; Liu, Y.; Liu, M.; Wang, X.; Guo, X. Short-term PM10 and emergency department admissions for selective cardiovascular and respiratory diseases in Beijing, China. Sci. Total Environ. 2019, 657, 213–221. [Google Scholar] [CrossRef] [PubMed]
  60. Viegi, G.; Maio, S.; Simoni, M.; Baldacci, S.; Annesi-Maesano, I. The epidemiological link between ageing and respiratory diseases. Eur. Respir. Soc. Monogr. 2009, 43, 1–17. [Google Scholar]
  61. Eckel, S.P.; Louis, T.A.; Chaves, P.H.M.; Fried, L.P.; Margolis, A.H.G. Modification of the association between ambient air pollution and lung function by frailty status among older adults in the cardiovascular health study. Am. J. Epidemiol. 2012, 176, 214–223. [Google Scholar] [CrossRef] [Green Version]
  62. Simoni, M.; Baldacci, S.; Maio, S.; Cerrai, S.; Sarno, G.; Viegi, G. Adverse effects of outdoor pollution in the elderly. J. Thorac. Dis. 2015, 7, 34–45. [Google Scholar] [CrossRef]
  63. Clougherty, J.E. A growing role for gender analysis in air pollution epidemiology. Environ. Health Perspect. 2010, 118, 167–176. [Google Scholar] [CrossRef] [PubMed] [Green Version]
  64. Abbey, D.E.; Burchette, R.J.; Knutsen, S.F.; Mcdonnell, W.F.; Lebowitz, M.D.; Enright, P.L. Long-term particulate and other air pollutants and lung function in nonsmokers. Am. J. Respir. Crit. Care Med. 1998, 158, 289–298. [Google Scholar] [CrossRef] [PubMed]
  65. Silveyra, P.; Nathalie, F.; Lidys, R. Understanding the Intersection of Environmental Pollution, Pneumonia, and Inflammation: Does Gender Play a Role? Long-Haul Travel Motiv. Int. Tour. Penang 2018, 1, 13. [Google Scholar]
  66. Chauhan, A.J.; Johnston, S.L. Air pollution and infection in respiratory illness. Br. Med. Bull. 2003, 68, 95–112. [Google Scholar] [CrossRef]
  67. Darrow, L.A.; Klein, M.; Dana Flanders, W.; Mulholland, J.A.; Tolbert, P.E.; Strickland, M.J. Air pollution and acute respiratory infections among children 0–4 years of age: An 18-year time-series study. Am. J. Epidemiol. 2014, 180, 968–977. [Google Scholar] [CrossRef] [Green Version]
  68. Gouveia, N.; Junger, W.L.; Romieu, I.; Cifuentes, L.A.; de Leon, A.P.; Vera, J.; Strappa, V.; Hurtado-Díaz, M.; Miranda-Soberanis, V.; Rojas-Bracho, L.; et al. Effects of air pollution on infant and children respiratory mortality in four large Latin-American cities. Env. Pollut. 2018, 232, 385–391. [Google Scholar] [CrossRef] [PubMed]
  69. MacIntyre, E.A.; Gehring, U.; Mölter, A.; Fuertes, E.; Klümper, C.; Krämer, U.; Quass, U.; Hoffmann, B.; Gascon, M.; Brunekreef, B.; et al. Air pollution and respiratory infections during early childhood: An analysis of 10 European birth cohorts within the ESCAPE project. Environ. Health Perspect. 2014, 122, 107–113. [Google Scholar] [CrossRef]
  70. Trasande, L.; Thurston, G.D. The role of air pollution in asthma and other pediatric morbidities. J. Allergy Clin. Immunol. 2005, 115, 689–699. [Google Scholar] [CrossRef]
  71. Saadeh, R.; Klaunig, J. Children’s Inter-Individual Variability and Asthma Development. Int. J. Health Sci. 2015, 9. [Google Scholar] [CrossRef]
  72. Maheswaran, R.; Pearson, T.; Smeeton, N.C.; Beevers, S.D.; Campbell, M.J.; Wolfe, C.D. Outdoor Air Pollution and Incidence of Ischemic and Hemorrhagic Stroke A Small-Area Level. Ecol. Study. 2011, 22–27. [Google Scholar] [CrossRef] [Green Version]
  73. Sunyer, J. Lung function effects of chronic exposure to air pollution Can traffic-related air pollution cause asthma? BMJ 2009. [Google Scholar] [CrossRef] [Green Version]
  74. Sacco, R.L.; Roth, G.A.; Reddy, K.S.; Arnett, D.K.; Bonita, R.; Gaziano, T.A.; Heidenreich, P.A.; Huffman, M.D.; Mayosi, B.M.; Mendis, S.; et al. The Heart of 25 by 25: Achieving the Goal of Reducing Global and Regional Premature Deaths from Cardiovascular Diseases and Stroke: A Modeling Study from the American Heart Association and World Heart Federation. Circulation 2016, 133, e674–e690. [Google Scholar] [CrossRef] [PubMed]
Figure 1. Sampling site location. The main parts of the Ciuc basin are marked with red lines.
Atmosphere 12 00289 g001
Figure 2. Weekly evolution of hourly PM10 concentration (multiannual means).
Atmosphere 12 00289 g002
Figure 3. Box-plot analysis of monthly PM10 concentrations (multiannual means). The lower (grey) and upper (yellow) limits represent the first (25P) and third (75P) quartiles, and the ends of the whiskers represent the minimum and the maximum values.
Atmosphere 12 00289 g003
Figure 4. Annual (a) and seasonal (b) mean PM10 concentration. 4.b Box-plot analysis of seasonal PM10 concentrations The lower (grey) and upper (yellow) limits represent the first (25P) and third (75P) quartiles, and the ends of the whiskers represent the minimum and the maximum values.
Atmosphere 12 00289 g004
Figure 5. Annual and seasonal PM10 categories evolution during the studied period ((a)—total days, (b)—winter days, (c)—spring days, (d)—summer days, (e)—autumn days).
Atmosphere 12 00289 g005
Figure 6. Monthly PM10 concentrations and meteorological parameters: (a): Prec., BL, LCL, (b): WCT, THI.
Atmosphere 12 00289 g006
Figure 7. Diseases occurrence in different age groups.
Atmosphere 12 00289 g007
Figure 8. Disease frequency in different age categories and gender distribution.
Atmosphere 12 00289 g008
Figure 9. Box-plot analysis of relative risk evaluation in different gender groups: (a) men; (b)-women. The lower (grey) and upper (yellow) limits represent the first (25P) and third (75P) quartiles, and the ends of the whiskers represent the minimum and the maximum values.
Atmosphere 12 00289 g009
Figure 10. Box-plot analysis of daily mean hospital admissions. The lower (grey) and upper (yellow) limits represent the first (25P) and third (75P) quartiles, and the ends of the whiskers represent the minimum and the maximum values.
Atmosphere 12 00289 g010aAtmosphere 12 00289 g010b
Figure 11. Pearson’s rank correlation coefficients between PM10, health effect and meteorological data.
Atmosphere 12 00289 g011
Figure 12. Box-plot analysis of percent increase of hospitalizations for each 10 μg/m3 increment of PM10.The lower (grey) and upper (yellow) limits represent the first (25P) and third (75P) quartiles, and the ends of the whiskers represent the minimum and the maximum values.
Atmosphere 12 00289 g012
Figure 13. Health endpoint attributable to short- and long-term exposure to PM10.
Atmosphere 12 00289 g013
Figure 14. Box-plot analysis of PM10 contribution to the annual mean disease frequency. The lower (grey) and upper (yellow) limits represent the first (25P) and third (75P) quartiles, and the ends of the whiskers represent the minimum and the maximum values.
Atmosphere 12 00289 g014
Table 1. Summary statistics of daily hospital admission numbers, meteorological conditions and PM10 concentration. –LC: lung cancer; AMI: acute myocardial infarction; IHD: ischemic heart diseases; CCP: chronic cardiopulmonary disease; URTI: upper respiratory tract infections; P: pneumonia; COPD: chronic obstructive pulmonary diseases; GT: global trends; Prec.: precipitation; LCL: lifting condensation level; BL: boundary layer; THI: thermal humidity index; WCT: wind chill equivalent chart index.
Types of DiseasesMean + SDCVMinP(25)P(50)P(75)MaxCI95−CI95+
LC0.48 ± 0.340.700.030.210.390.681.390.420.54
AMI0.13 ± 0.080.620.000.070.130.190.350.120.15
IHD0.38 ± 0.330.880.000.130.230.551.350.310.44
CCP0.39 ± 0.260.660.000.170.390.551.320.340.44
URTI0.77 ± 0.450.580.100.450.691.032.390.690.86
P2.71 ± 1.130.371.131.902.573.455.822.522.90
COPD0.70 ± 0.260.370.190.510.680.841.650.660.75
GT5.57 ± 1.650.302.744.305.416.3211.825.265.88
Meteo. conditions
Prec **49.31 ± 34.410.700.2024.0538.5070.63177.3042.8255.80
LCL *462.23 ± 208.500.451.43289.59497.90600.381000.63422.91501.56
BL *428.87 ±156.490.36135.78278.89467.57549.40748.20399.35458.38
THI *32.33 ± 11.530.36−2.8025.8335.1340.2554.1730.1634.51
WCT *4.95 ± 4.630.93−7.412.045.347.9015.324.085.82
PM1019.00 ± 11.590.614.3911.6114.5121.5057.7116.8221.19
* monthly average values ** monthly summaries values.
Table 2. Significant Pearson correlation coefficients between PM10, climatological data, and disease occurrence after the Fourier transforms.
PM10
Age Categories[0–5](5–14](14–40](40–60]>60
WSpSuAWSpSuAWSpSuAWSpSuAWSpSuA
1. LC ********
2. AMI * * ****
3. IHD **** ***
4.CCP **** ***
5. URTI** * * * * *** *
6. P*** *** *** *** ***
7. COPD ********
BL
Age categories[0–5](5–14](14–40](40–60]>60
WSpSuAWSpSuAWSpSuAWSpSuAWSpSuA
1. LC ** ****
2. AMI *** ****
3. IHD ** ***
4.CCP **** **
5. URTI**** * * * * *
6. P********************
7. COPD ********
WCT
Age categories[0–5](5–14](14–40](40–60]>60
WSpSuAWSpSuAWSpSuAWSpSuAWSpSuA
1. LC * * **
2. AMI * **
3. IHD * *
4.CCP *
5. URTI* * *
6. P * * * *** *
7. COPD ** *
(Where: W = winter, Sp = spring, Su = summer, A = autumn,). *- climatological effects; gray background: PM10 effects.
Publisher’s Note: MDPI stays neutral with regard to jurisdictional claims in published maps and institutional affiliations.

