Article

COVID-19 and Air Pollution: Measuring Pandemic Impact to Air Quality in Five European Countries

by
Akvilė Feiferytė Skirienė
* and
Žaneta Stasiškienė
Institute of Environmental Engineering, Kaunas University of Technology, Gedimino str. 50, 44239 Kaunas, Lithuania
*
Author to whom correspondence should be addressed.
Atmosphere 2021, 12(3), 290; https://doi.org/10.3390/atmos12030290
Submission received: 7 January 2021 / Revised: 7 February 2021 / Accepted: 19 February 2021 / Published: 24 February 2021
(This article belongs to the Section Air Quality)

Abstract

:
The rapid spread of the coronavirus (COVID-19) pandemic affected the economy, trade, transport, health care, social services, and other sectors. To control the rapid dispersion of the virus, most countries imposed national lockdowns and social distancing policies. This led to reduced industrial, commercial, and human activities, followed by lower air pollution emissions, which caused air quality improvement. Air pollution monitoring data from the European Environment Agency (EEA) datasets were used to investigate how lockdown policies affected air quality changes in the period before and during the COVID-19 lockdown, comparing to the same periods in 2018 and 2019, along with an assessment of the Index of Production variation impact to air pollution changes during the pandemic in 2020. Analysis results show that industrial and mobility activities were lower in the period of the lockdown along with the reduced selected pollutant NO2, PM2.5, PM10 emissions by approximately 20–40% in 2020.

1. Introduction

The first reported cases in the Wuhan Municipality (China) at the end of 2019 marked the beginning of the highly contagious Sars-COV-2 virus that caused the coronavirus (COVID-19) and was acknowledged as a global pandemic in just a few months [1,2,3,4,5]. Concerning the outbreak of COVID-19, on 23 January 2020, the central government of China imposed a lockdown in Wuhan and other cities to maintain the spread of the virus [6]. The WHO officially declared the virus as a global pandemic on 11 March 2020, when the virus spread at an unprecedented rate, with more than 1 million COVID-19 cases confirmed in just 4 months. By the end of April, there were more than 3 million COVID-19 cases. By the end of May, there were more than 5 million confirmed cases and more than 337 thousand confirmed deaths (death rate is 6.4%). By the end of the year, there were 74 million confirmed cases with 1.6 million deaths [7].
Considering the highly contagious characteristics of the virus, WHO recommendations released on 27 January suggested implementing measures to contrast the diffusion of the disease [8], and just a month after, on 29 February, WHO released new recommendations that included travel measures and travel bans. The new recommendations also suggested 14-day self-monitoring for symptoms for people who came back from affected areas [9]. Responding to the rapid spread of COVID-19 most governments have imposed a complete nation-wide lockdown by completely restricting the movement of people, self-quarantine obligations for residents who came back from countries with high infection rates, and social distancing [10]. The European Commission released guidelines for border management measures, which ensure the delivery of goods and essential services across Europe via “green lines” [11]. Countries in South America, most parts of Africa, the Middle East, and South Asia have the most restrictive regulations, while partly restrictive travel regulations were implemented in most European countries, North America, and East Asia [12].
As countries went on lockdown, the industrial activities were shut down globally, which had a global effect on the economy [10,13], with the global GDP contracting by 4.4% [14], a drop that is much worse than during the 2008–2009 global financial crisis. While countries are confronting the economic and health crisis, there are some positive aspects—significantly improved air quality, reduction of noise, and reduction of greenhouse gasses emissions (GHG) [15]. Countries implemented lockdown restrictions on their external borders and, in some cases, restricted internal traveling, social distance measures resulted in the significant reduction of transport flows, non-essential business (restaurants, fitness centers, shopping malls) were closed, industrial activities and constructions were minimized to a minimum level. All these activities are the main source of air pollution [16]. Mobility reports and scientific research has shown a decreasing trend of human movement in the affected countries. The mobility in the regions of Northern Italy was reduced by 77% [17], while in France, mobility shrunk by 79% during the lockdown [18]. National lockdown presented itself as a solution to the question of finding a way to improve air quality when air pollution is a global threat leading to a large impact on human health and ecosystems [19,20]. The transport sector represents almost a quarter of greenhouse gas emissions and it’s considered to be the main cause of air pollution in cities. While the origin of PMs emissions is road traffic, which relies on oil products such as gasoline and diesel [20], obvious air quality changes during the pandemic when all economic activities were reduced to the minimum level implies a strong relationship between countries’ economic development, foreign trade, industrial structure, and air quality deterioration [21,22].
Air pollution is the most important environmental risk to human health and the second biggest environmental concern for Europeans after climate change [23]. There are some concerns that reduced GHG emissions are a short-term case. Take the example of the 2008–2009 financial crisis, when carbon emissions soared by 6% in one year, after financial stimulus measures for rapid recovery of the economy went entirely to carbon-intensive industries [24]. The effects of air pollution changes have been investigated in several studies that observe the meaningful impact of nationwide lockdowns on atmospheric pollution [25,26,27,28]. Recent satellite data analysis-based reports by the Copernicus Atmosphere Monitoring Service confirm a reduction of air pollutants in the main European cities during the lockdown. Most studies that analyzed air pollution by including meteorological variables, such as temperature, wind speed, wind direction, and humidity concluded that meteorological variables had no significant effect on air pollutant concentration during the pandemic [28,29,30].
Changes in air pollutant concentration have been scientifically observed since the beginning of the lockdown. Various studies carried out in various regions of the world confirmed that national lockdowns led to air pollutants’ reduction in the atmosphere. Shi and Brasseur [25] analysis confirm the reduction of PM2.5, CO, and NO2 by 33%, 23%, and 55%, respectively, during the lockdown period from 23 January to 29 February 2020 to the same period of 2019. Various studies confirm air pollution reduction during the lockdown period. Focusing on Western Europe, Menut et al. [31], using WFR and CHIMERE models, simulated NO2 and PMs changes for March 2020. The results confirmed a 30–50% decrease of NO2 and a 5–15% decrease of PMs concentrations ranging from 30% to 50% in all Western European countries. In five Polish cities during the lockdown period, the concentration of PM2.5, PM10, SO2, and NO2 were reduced by 11.1–26.4%, 8.6–33.9%, 18–23%, 10–19%, respectively, compared to the corresponding periods in 2018 and 2019 [32]. Different studies confirm that reduced economic activity and traffic restrictions have led to air pollution reduction across China, where NO2, PM10, PM2.5, and CO decreased by 33.1–37.8%, 33.6%, 7.4–21.5%, and 12.7–20.4%, respectively [33,34], preventing environmental pollution.
Some recent studies were focusing on the impact COVID-19 had on urban transportation and emissions, when traffic volume was significantly reduced. Tian et al. [35] study presents a significant CO2 emission drop in Canada, from 7303.73 million kg in March to 4593.01 million kg in April of 2020, during the lockdown period. NO2 and CO concentration levels show a decrease during the lockdown period. The results also confirm that the reduction of air pollution was significant, but contemporary and rebounded after the end of the short-term quarantine in Canadian regions. Gama et al. [36] used national air quality monitoring network data to analyze data of PM10 and NO2 in Portugal and approximately observed a 40% NO2 and 18% PM10 reduction in March-May of 2020, compared to the pre-lockdown period. Using air quality stations and hourly observations, Baldasano [37] evaluated NO2 concentration changes in Barcelona and Madrid (Spain) during the lockdown period. The analysis results of the NO2 hourly observations in Madrid and Barcelona showed an average reduction of 62% and 50%. Chen et al. [38] analysis focused on private vehicle restriction and PM2.5, PM10 concentration changes by 39.3% and 31.4% in 49 cities in China.
Several recent studies confirm a stronger positive correlation between population density and infected individuals of the COVID-19 over March and April in a stable atmosphere with low wind speed and frequently high levels of ozone and particular matters in Northern Italian cities. Research results indicate that in polluted cities, where an unstable atmosphere with high wind speeds can decrease air pollution and alleviate the spread of COVID-19 in society [39]. About 74.5% of infected individuals and 81% of total deaths in Italy caused by COVID-19 are in regions with high pollution concentration [40]. The same results were confirmed in the autumn-winter season of 2020–2021 [41]. The governments should pay attention to cities and regions with high pollution levels because it might have a negative effect on public health and environmental policies, new technologies to reduce the levels of air pollution should be explored [3,42].
Our study aims to assess the effects of COVID-19-induced lockdown measures on air pollution in 5 countries affected by COVID-19 the most in Europe, analyzing NO2, PM2.5, and PM10 concentration changes during the Pre-lockdown, I period, and II periods. The comparison of air pollution data results within the same periods in 2018–2019 will allow us to measure the impact of nationwide lockdowns to air quality changes. Additionally, we aim to measure the relationship between industrial production index as the economic activity indicator and air pollution changes during the Pre-lockdown, I period, and II period in 2020.

2. Materials and Methods

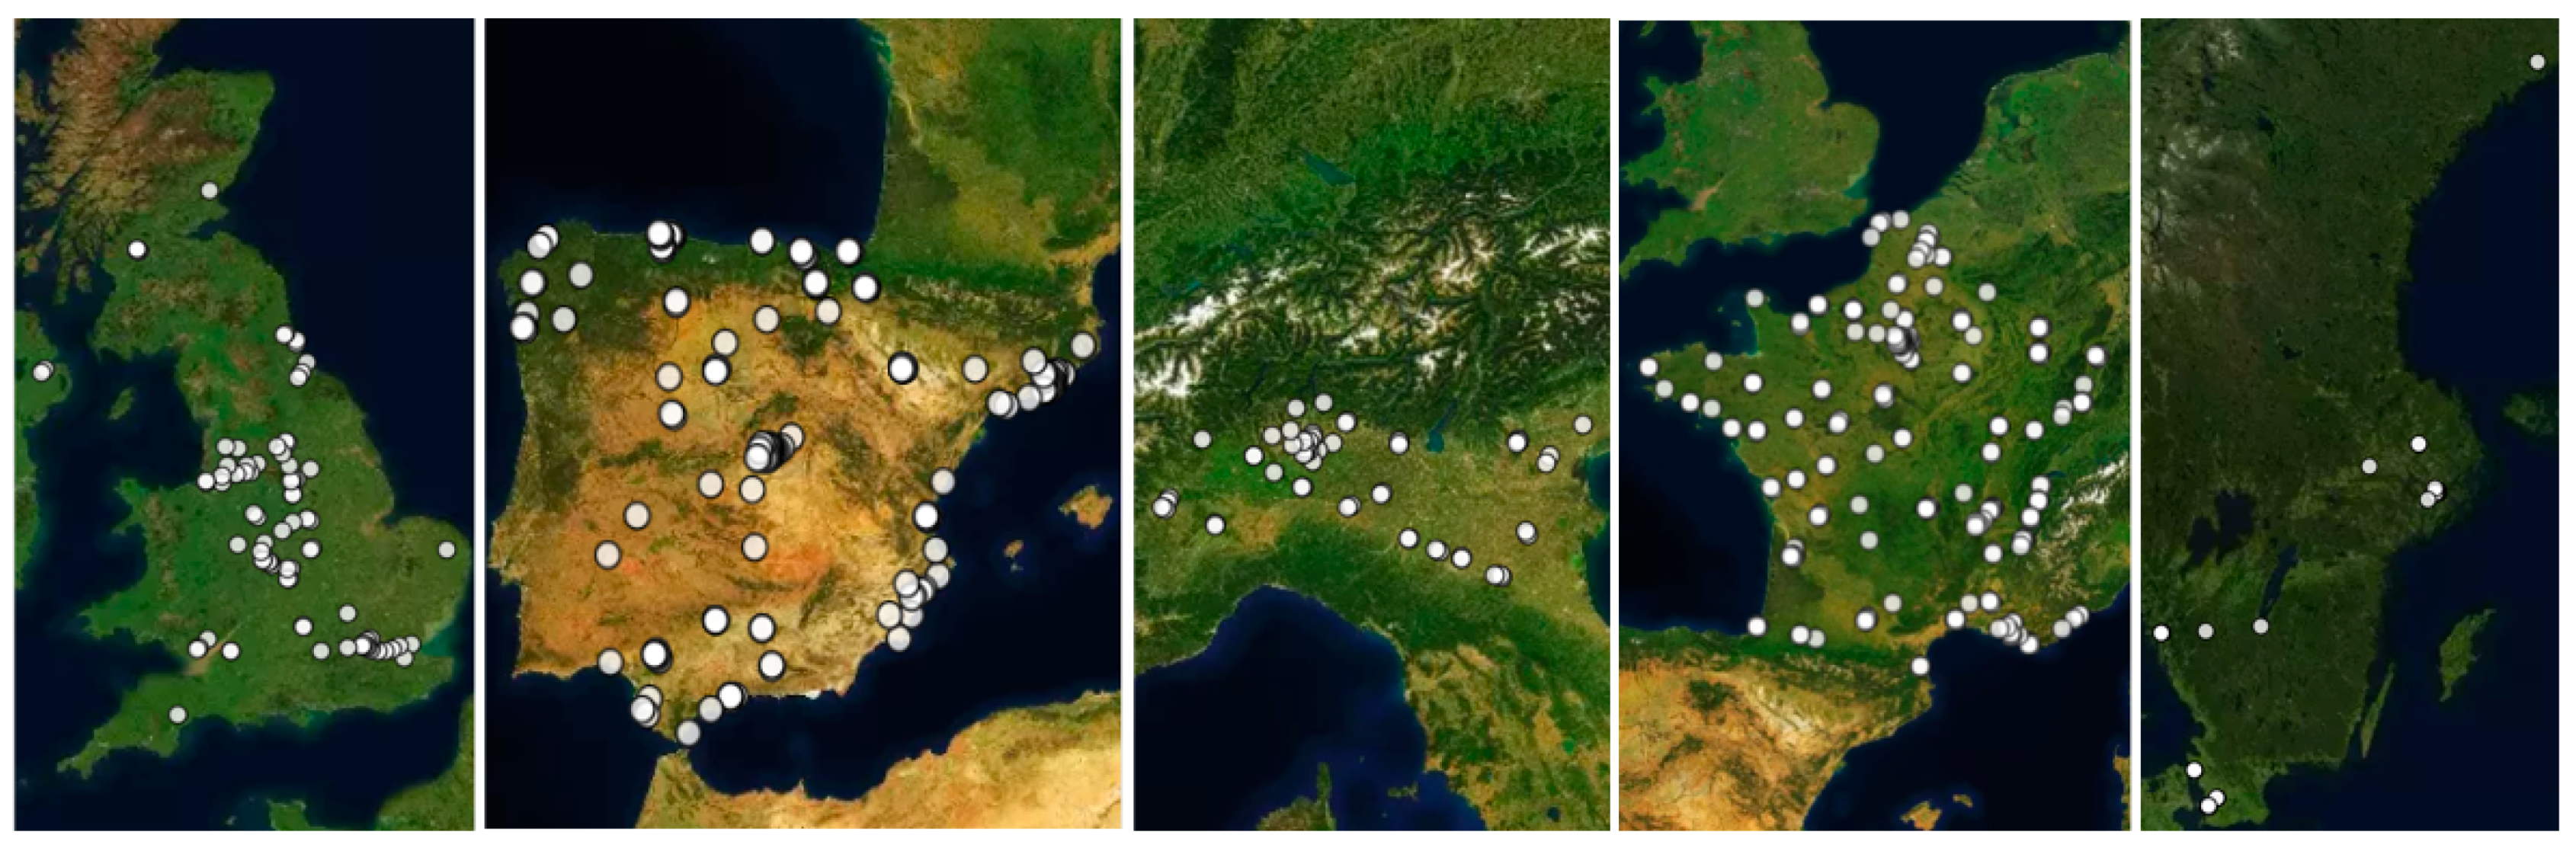
2.1. Analysis Sample, Data, and Limitations

To understand the details of air quality changes during the COVID-19 period, the analyzed period was divided into 3 stages: Pre-lockdown (1st January to 29th February 2020), I period (March–April 2020), when national lockdowns were announced, and II period (May 2020) when countries decided to apply less restrictive regulations, compared to the same periods from 2018–2019 years.
Air pollutant concentration analysis in selected European countries was made using the Copernicus Atmosphere Monitoring Service, comparing tropospheric NO2, PM2.5, PM10 concentrations between 6 January and 31 March. The monthly ambient mass concentrations of criteria air pollutants including NO2, PM2.5, PM10 was obtained from the European Environment Agency (EEA) database (https://www.eea.europa.eu/themes/air/air-quality-and-covid19, accessed on 19 February 2021), which gives average weekly concentration measures given by operating environmental monitoring stations in each country. Weekly values are averaged to obtain monthly air pollution concentration.
While most studies support a correlation between transport flows and air pollutant concentration changes [3,18,28,29,30,35,37,38,43], our analysis focuses on production impact on air pollution during the COVID-19 period. Index of Production or Industrial Production Index is a monthly economic indicator measuring the real output of industries such as manufacturing, mining, electric, and gas. These industries are the main source of GHG emissions [44]. We collected data of the Index of Production (IoP) from official economic reports [45,46,47] and national databases (UK Office for National Statistics [48], Spain Instituto National de Estadística [49] to analyze how national lockdowns affected countries’ production and economies in the context of air pollution changes. As an empirical methodology, we used a Pearson correlation test with a significance level of α = 0.05.
For air quality analysis, we selected four European countries and focused on industrial regions: the United Kingdom (during the preparation of the study, the United Kingdom had not officially finished the Brexit procedures to leave the European Union), Spain, France, and Sweden, as well as the Northern Italy region, which were the most affected by COVID-19 and implemented different policies regarding the spread of the virus [39,40,41,42,50,51]. Northern Italian cities of Turin, Milan, and Genoa create an “industrial triangle” of Italy in Piemonte, Liguria, Lombardy, Emilia-Romagna, and Veneto regions, characterized by a high density of industrial plants, traffic, and intensive agriculture. The region plays a major economic role in the country, creating approximately 50% of the Italian GDP [51].
Selected air pollutant data analysis limitations related to data availability. Cities’ air pollution data presented in the EEA database revealed that, in some cases, cities did not provide data during particular periods. Monitor site locations in the selected countries are presented in Figure 1.
The average monthly concentration analysis of PM2.5 in French cities was not included because of the small amount of data. It was chosen to not make any summarizing conclusions on how COVID-19 might affect changes in PM2.5 concentrations. For the equity of the air pollution data analysis, Canary Islands’ air monitoring station data was excluded from the Spanish air pollution data analysis because of a sand storm in February 2020 and the higher-than-average concentration of PMs.

2.2. Mann–Kendall Test

Trend analysis of air pollution was conducted using Mann–Kendall and Sen’s slope tests. The Mann–Kendall and Sen’s slope tests were conducted on monthly average NO2, PM2.5, and PM10 pollutants data.
Air pollution trend analysis has been done using Mann–Kendall rank-based nonparametric test. The Mann–Kendall test is preferred when various air pollution stations are tested in a single study. In the case of determining the presence of a monochromic trend in a time series, the H0 is that the data comes from a population, where random variables are independent and identically distributed. The alternative hypothesis H1 is that the data follows the monochromic trend over time. Mann–Kendall test statistic S is calculated as
S = i = 1 n 1 j = I + 1 n s g n ( x j x i )
where n is the number of data points, xi and xj are the data values in time series i and j (j > i), respectively, and sgn (xjxi) is the sign function and it is calculated as follows:
s g n ( x j x i ) = { + 1 ,   i f   x j x i > 0 0 ,   i f   x j x i = 0 1 ,   i f   x j x i < 0
The variance of S can be acquired as follows:
V a r ( S ) = n ( n 1 ) ( 2 n + 5 ) i = 1 m t i ( t i 1 ) ( 2 t i + 5 ) 18
where m is the number of tied groups in a data set, ti is the data value count in i group, n is the number of data series. Standard normal test statistics (W(S)) is calculated as follows:
W ( S ) = { S 1 V a r ( s ) ,   i f   S > 0 0 ,   i f   S = 0 S + 1 V a r ( s ) ,   i f   S < 0
Positive or negative S values indicate the increasing or decreasing trends, respectively. In this study, the significance level α = 0.05 is used. At the 5% significance level, the H0 hypothesis is rejected, confirming the existence of a trend when W(S) < 0.05 accepting the alternative hypothesis H1.

2.3. Sen’s Slope Estimator

Sen’s slope test is widely used to estimate the power of a trend for the pair of data N as follows:
Q i = x j x k j k ,   f o r   i = 1 , , N ,
where xj and xk are the data values at times (j > k), respectively. If there is one datum in each time period, then N = n(n − 1)/2, where n is the number of time periods. If there are multiple observations during one or more time periods, then N < n(n − 1)/2, where n is the total number of observations.
The N values of Qi are ranked from smallest to largest and a median of slope (Sen’s slope) is calculated as follows:
Q m e d = { Q [ N + 1 2 ] ,   i f   N   i s   o d d ( Q N / 2 + Q [ ( N + 2 ) / 2 ] ) / 2 ,   i f   N   i s   e v e n
The Qmed reflects a data trend, while its value indicates the steepness of the trend. When the median slope is statistically different than zero, the Qmed is estimated as follows:
C α = Z 1 α / 2 V a r ( s )
where Var(S) is defined in Equation (3) and Z1-α/2 is obtained from the standard normal distribution table. In this study a α = 0.05 confidence interval was used [53].

3. Results

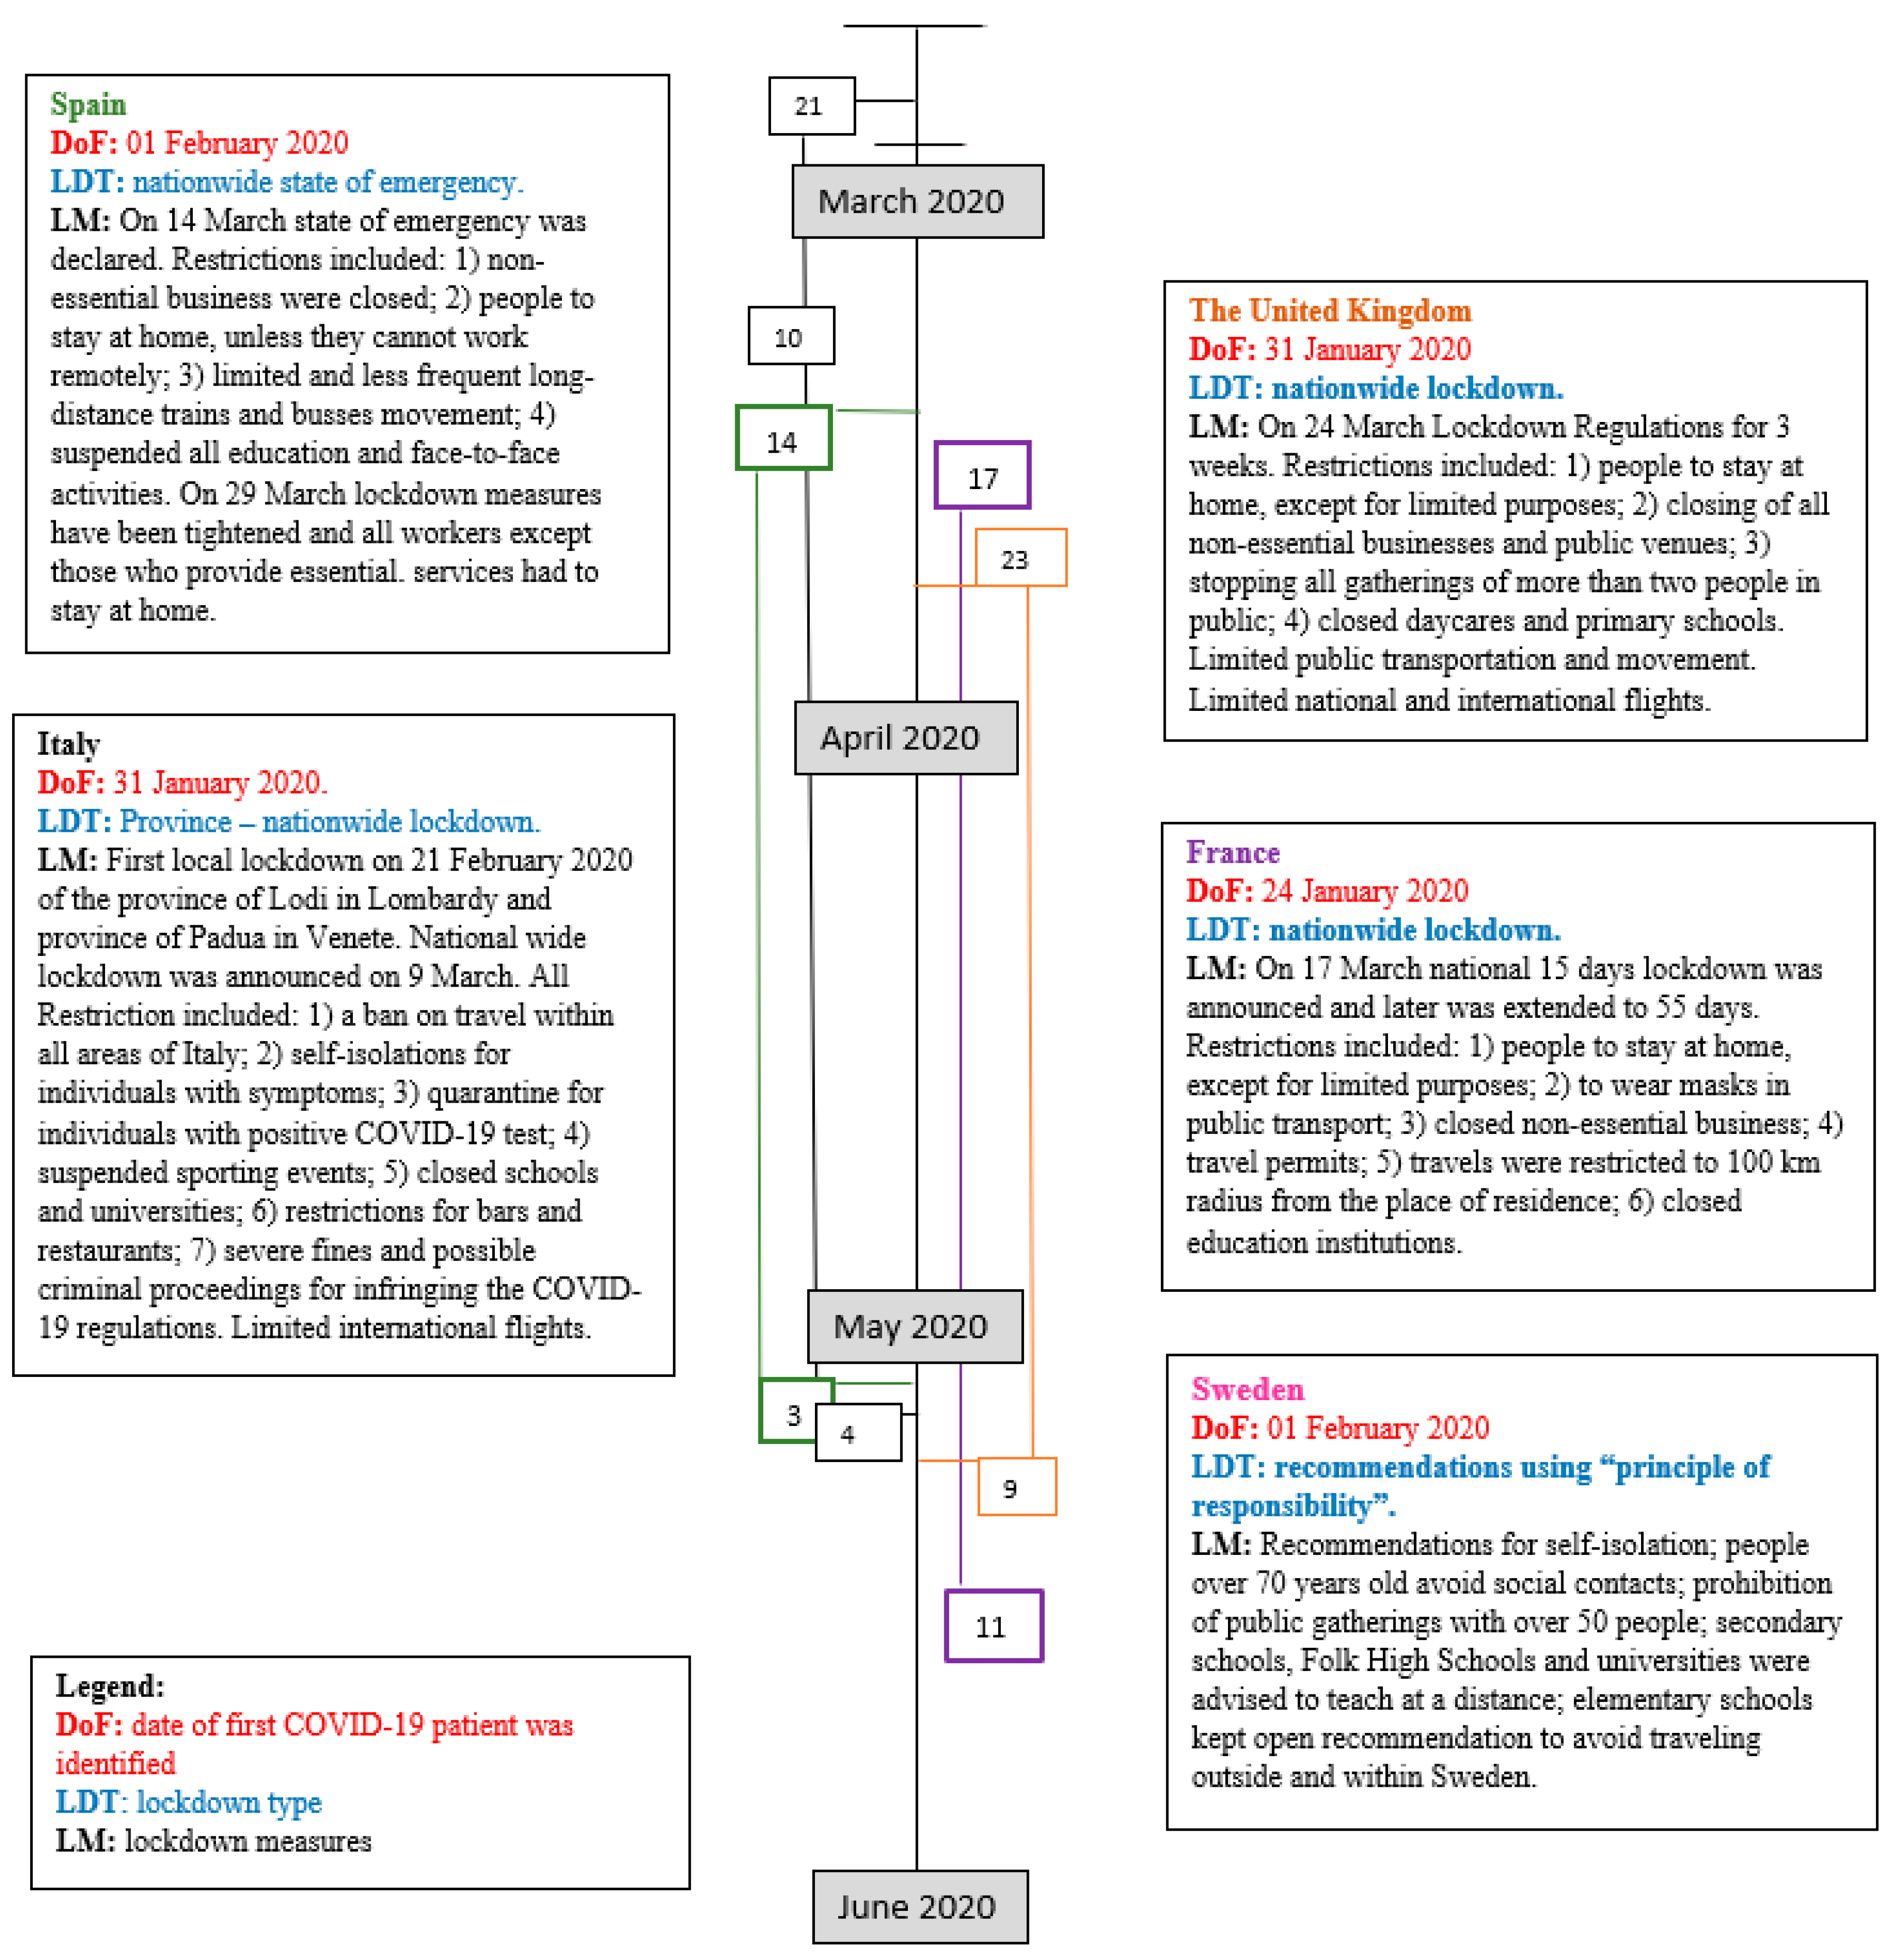
3.1. Review of Country-Based COVID-19 Lockdown Measures

A systematic review of national lockdown measures in each country was performed based on their national health institutions’ resolutions and declarations, published reports, global datasets, and published scientific articles. Since some countries publish more detailed information in their official language other than English, this study relies on English sources for collecting and collating information. All country-based lockdown measures are presented in Figure 2 which could affect the levels of pollutants in the atmosphere.
UK. During the rapid spread of COVID-19, on the 3rd of March, the United Kingdom government published a three-stage action plan to manage COVID-19 in the country: containment, delay, and mitigation. Additionally, people were advised against all but essential international travel, to avoid traveling on cruise ships, keep physical distance, avoid pubs and restaurants, recommendations to work from home, postponement of port events. Due to the rapid spread of the virus at the end of March, the United Kingdom decided to tighten the restrictions and close all pubs, restaurants, gyms, schools, and universities. By that time, the number of confirmed COVID-19 cases reached 22 thousand and 287.57 deaths per million populations. 14 days’ self-isolation was advised for people returning from places with high infection rates, people with similar symptoms, or household contacts [54]. The national lockdown started on the 23rd of March, with included restrictions: (1) people had to stay at home, except for limited purposes; (2) closing of all non-essential businesses, including retail and hospitality sectors; (3) closing public venues; (4) stopping all gatherings with more than two people in public; (5) closing daycares and primary education institutions [55]. The Coronavirus Act 2020 was published on 25 March 2020, which contained emergency powers to respond to the pandemic. On 10 May, the Government set out the plan to ease the lockdown restrictions. Although the country’s lockdown measures were much less drastic than in Italy or Spain, the country’s economic activities and population mobility were still impacted.
Spain. The Ministry of Health in Spain activated COVID-19 protocols for early detection, surveillance, preventing transmission, and monitoring contacts. The information and consultation channel for citizens Hispabot-Covid19 was launched on 8 April through WhatsApp. First measures to control the spread of the virus were initiated in the period from 3 to 12 March. On 14 March the “State of Alarm” was declared with high restrictions to movement throughout the whole country. Citizens were required to stay at home and use public roads for very specific activities, such as going for food supplies or pharmaceuticals, traveling to work or their regular residence, attending health care centers, etc. All education with face-to-face activities was suspended. On 29 March, lockdown measures were tightened and all workers, except those who provide essential services, had to stay at home [56]. During the “State of Alarm’’ period, the highest Spain Stringency Index was 85.19 [57].
Italy. The first cases of COVID-19 in Italy were recorded on the 31 January 2020 [58]. Since then, the number of confirmed cases has increased exponentially, reaching more than 236 thousand in June. The region hit by the virus the hardest was Lombardy. In March, Italy’s government banned all events, closed educational institutions (daycares, secondary schools, higher education, universities), entertainment venues, sports centers, mass gatherings, banned all traveling within the areas of Italy with some exceptions for work or health-related reasons. A stay home order was released on the 10th of March and lasted until the 4 May [58]. Almost all production and industrial activities, as well as road transport, except for the agricultural ones, were banned [59].
France. The first response from the French government to COVID-19 was in mid-February, concerning hand hygiene and respiratory etiquette with the exponential growth of confirmed cases. During the first days of March, all large public meetings of more than 5000 (later more than 1000, and later more than 100) people were forbidden. All schools and universities were closed starting from 13 March. Even though just a few days later, all public places (except essential shops as supermarkets) were closed, the first round of municipal elections was still held. During that period, the number of COVID-19 cases doubled and reached 6400. As a consequence, a total lockdown policy was announced on 17 March and the second round of municipal elections was postponed. All traveling was restricted to a 100 km radius from the place of residence unless deemed to be a work-related necessity, family justification, or related to medical care. On 23 March, the French government accepted “Emergency Law no. 2020–290”, which empowered the French government to take emergency measures to deal with COVID-19 and its related negative social and economic consequences [60]. At the end of May, France’s Senate approved the release of a coronavirus tracking app, called “StopCovid”. The app allows tracking and keeping records of the duration of individuals’ contact. If someone records a positive test for COVID-19, the application automatically alerts those who have been in contact with that person for more than 15 min to self-isolate themselves [61].
Sweden chose to forgo imposing extraordinary lockdown measures, unlike the other European countries and used an approach based on the “principle of responsibility” by following recommendations instead. The Public Health Agency released recommendations for those who had COVID-19 symptoms to isolate themselves at home, to avoid social contact for everyone over 70 years old, prohibited public gatherings with over 50 people, upper secondary schools, Folk High Schools, and universities were advised to teach remotely, but elementary schools were kept open, it was recommended to avoid traveling outside and within Sweden, etc., [62].

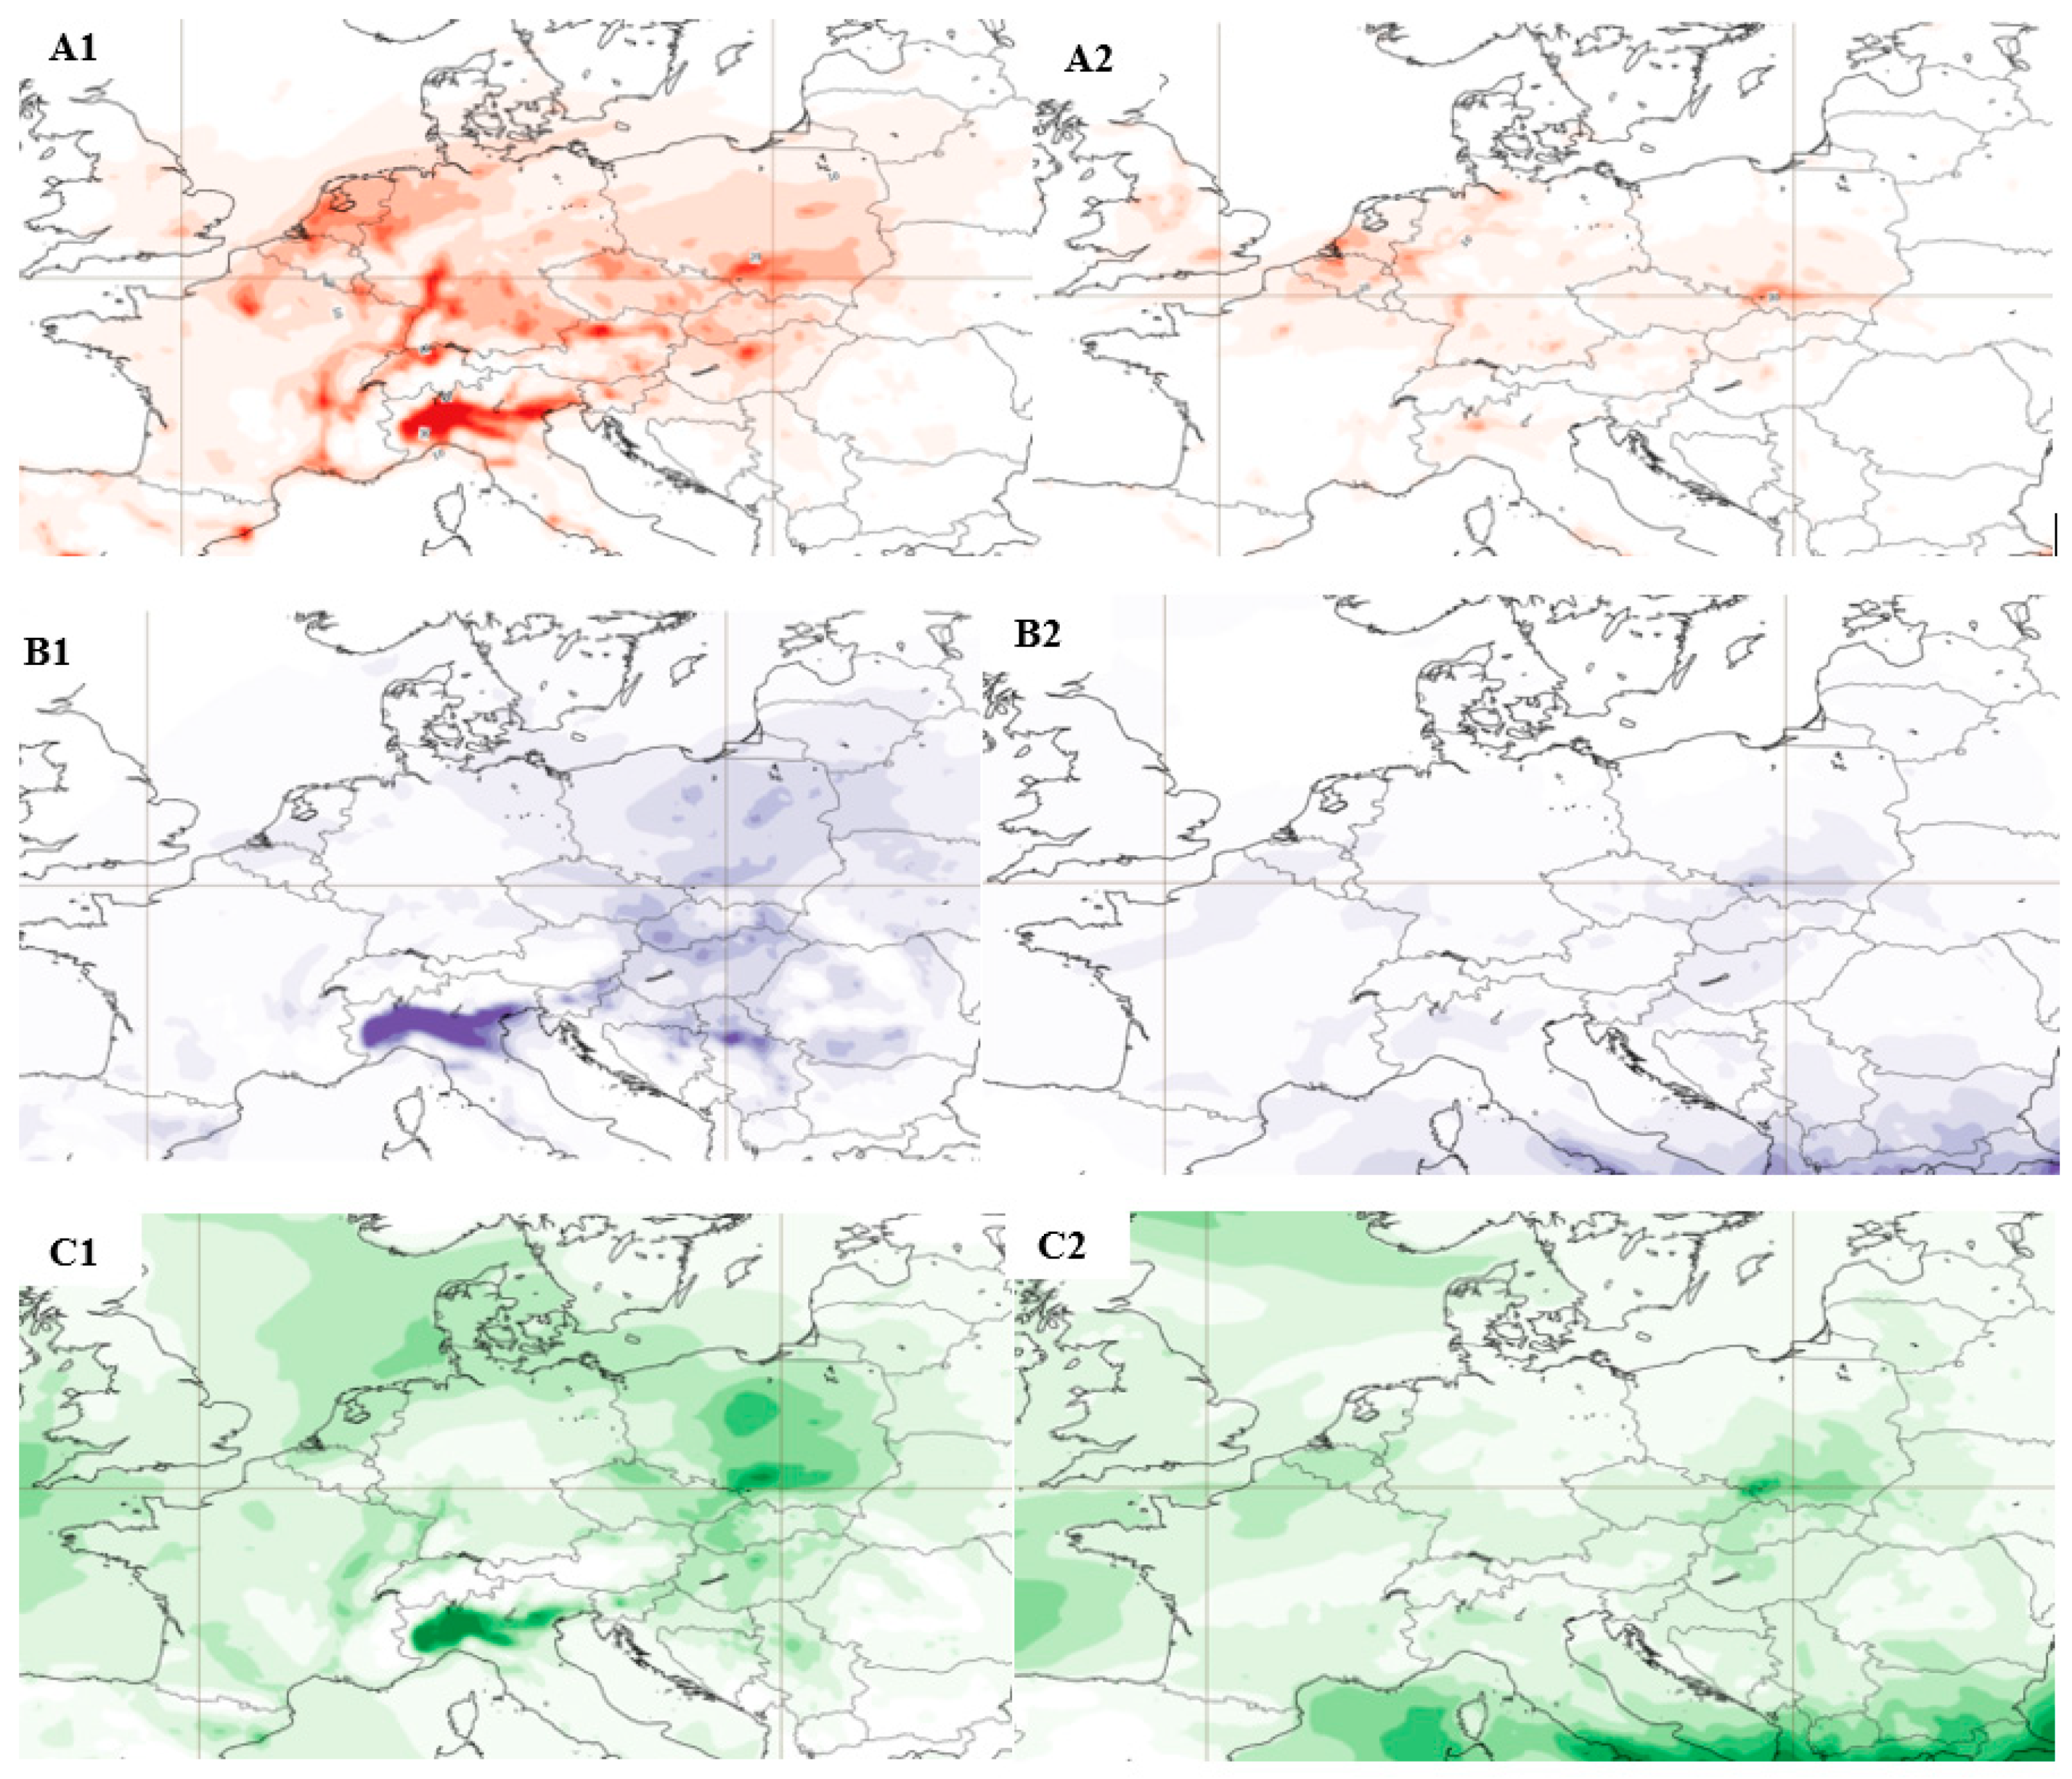
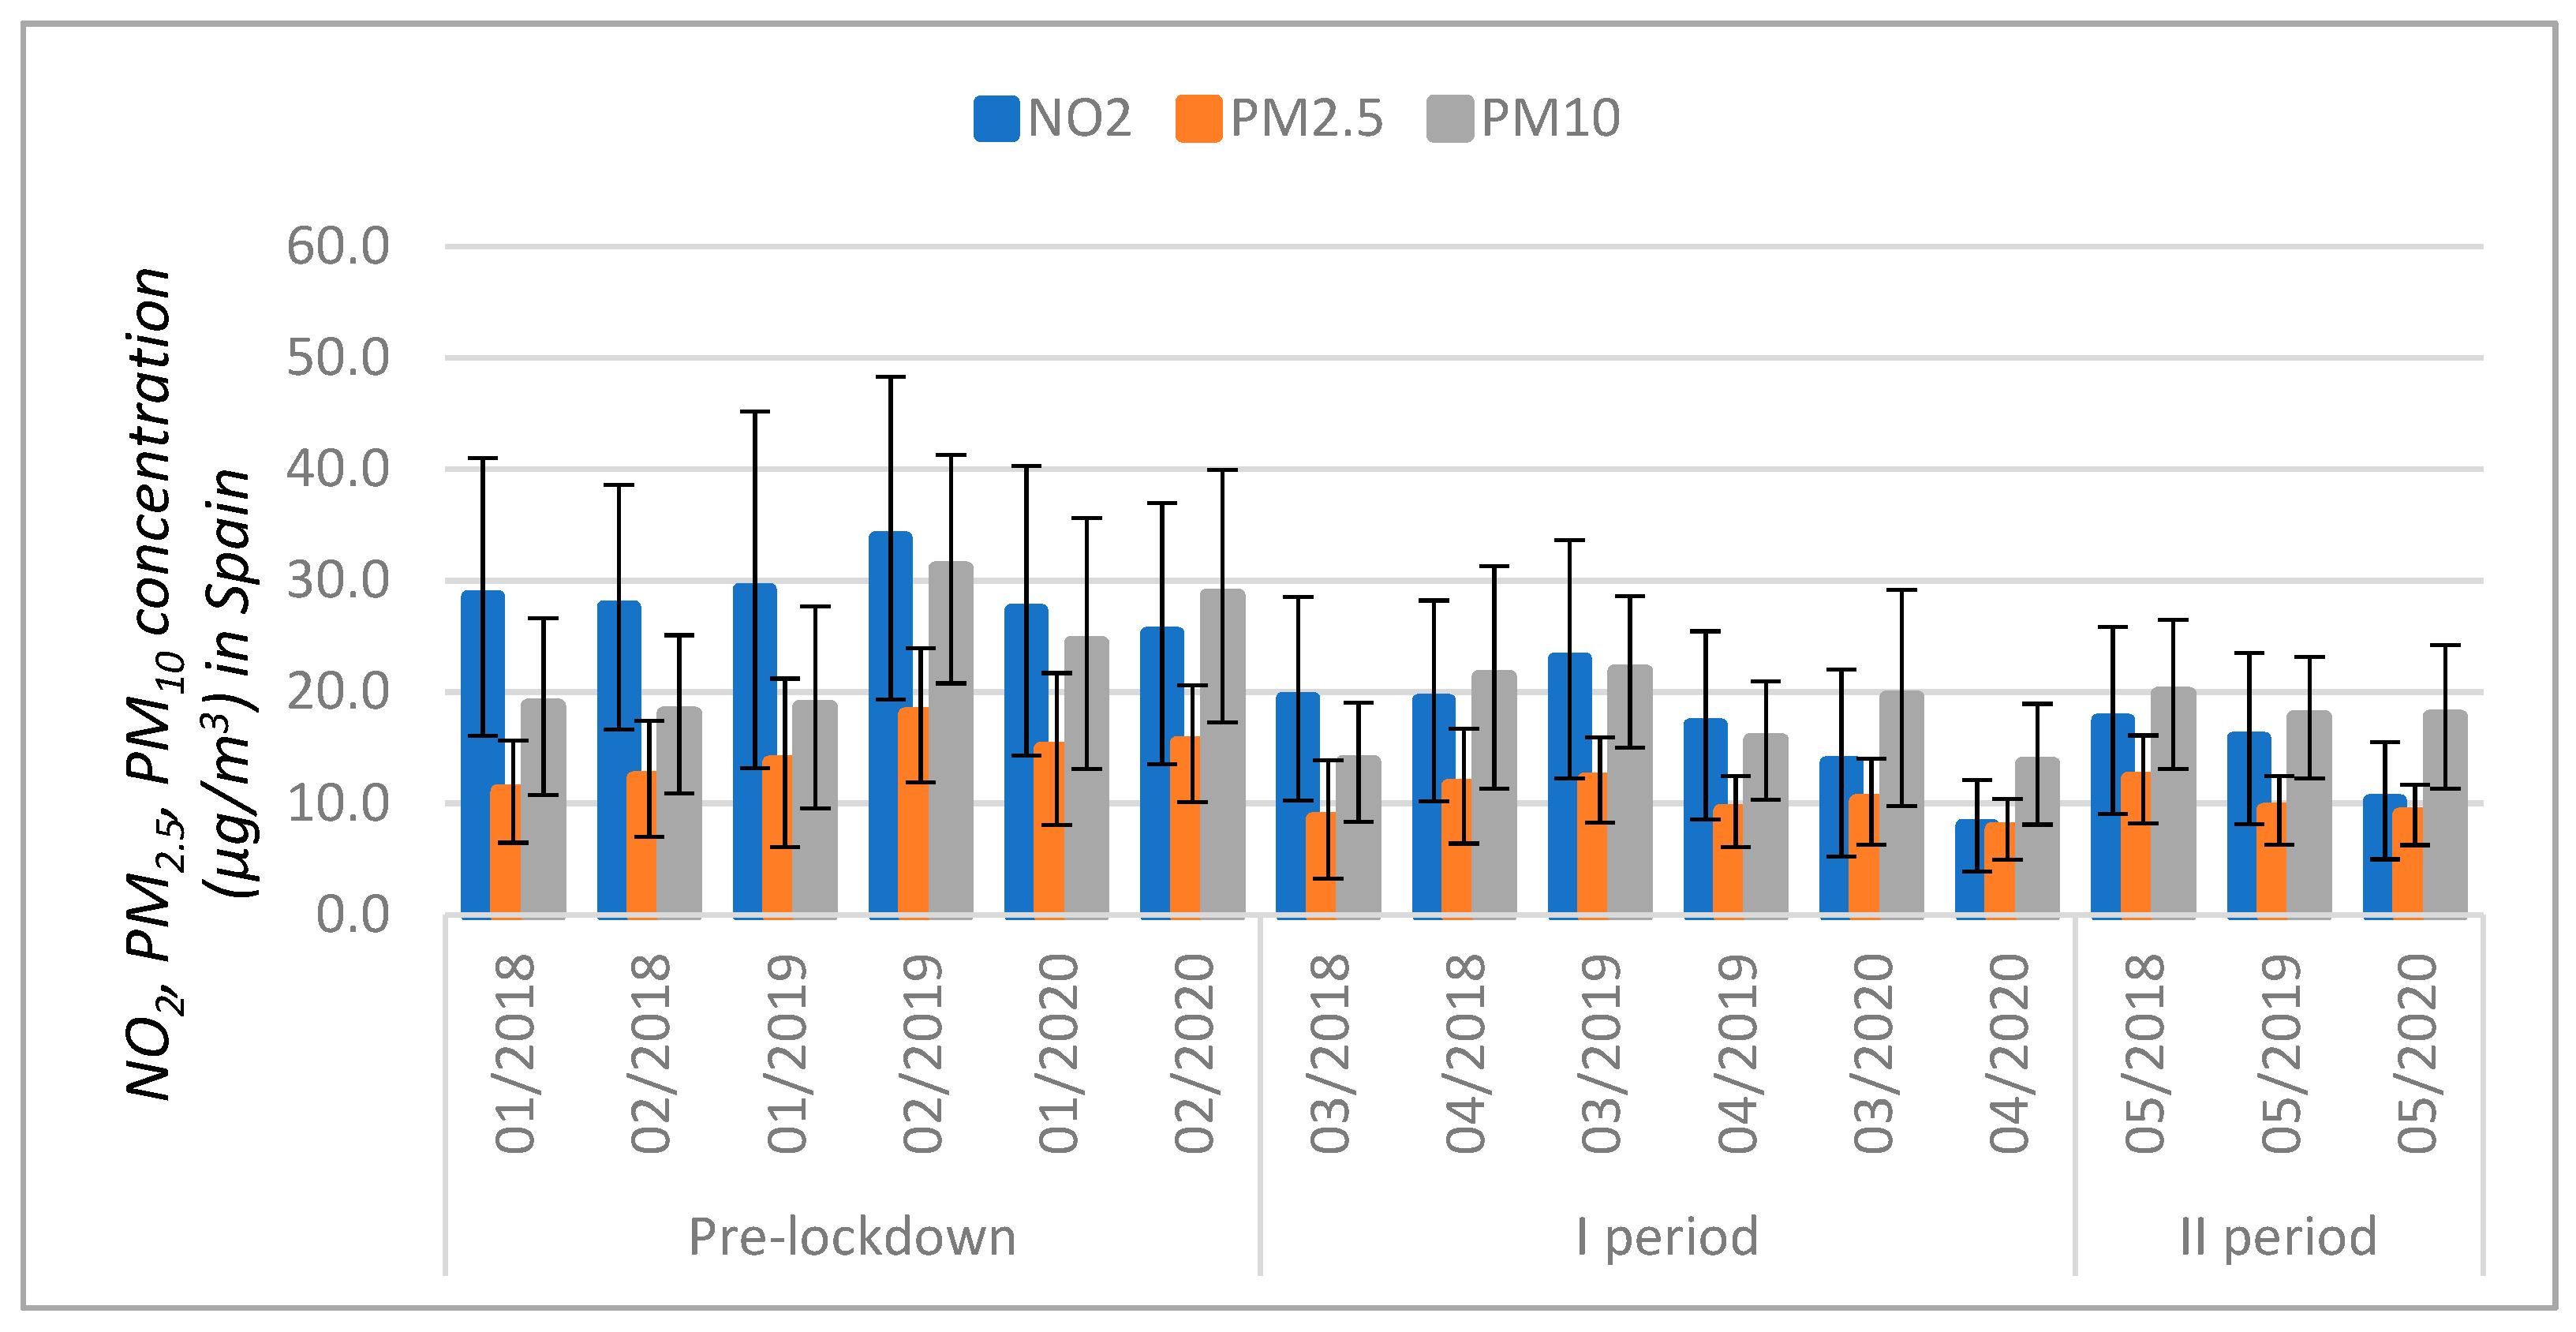
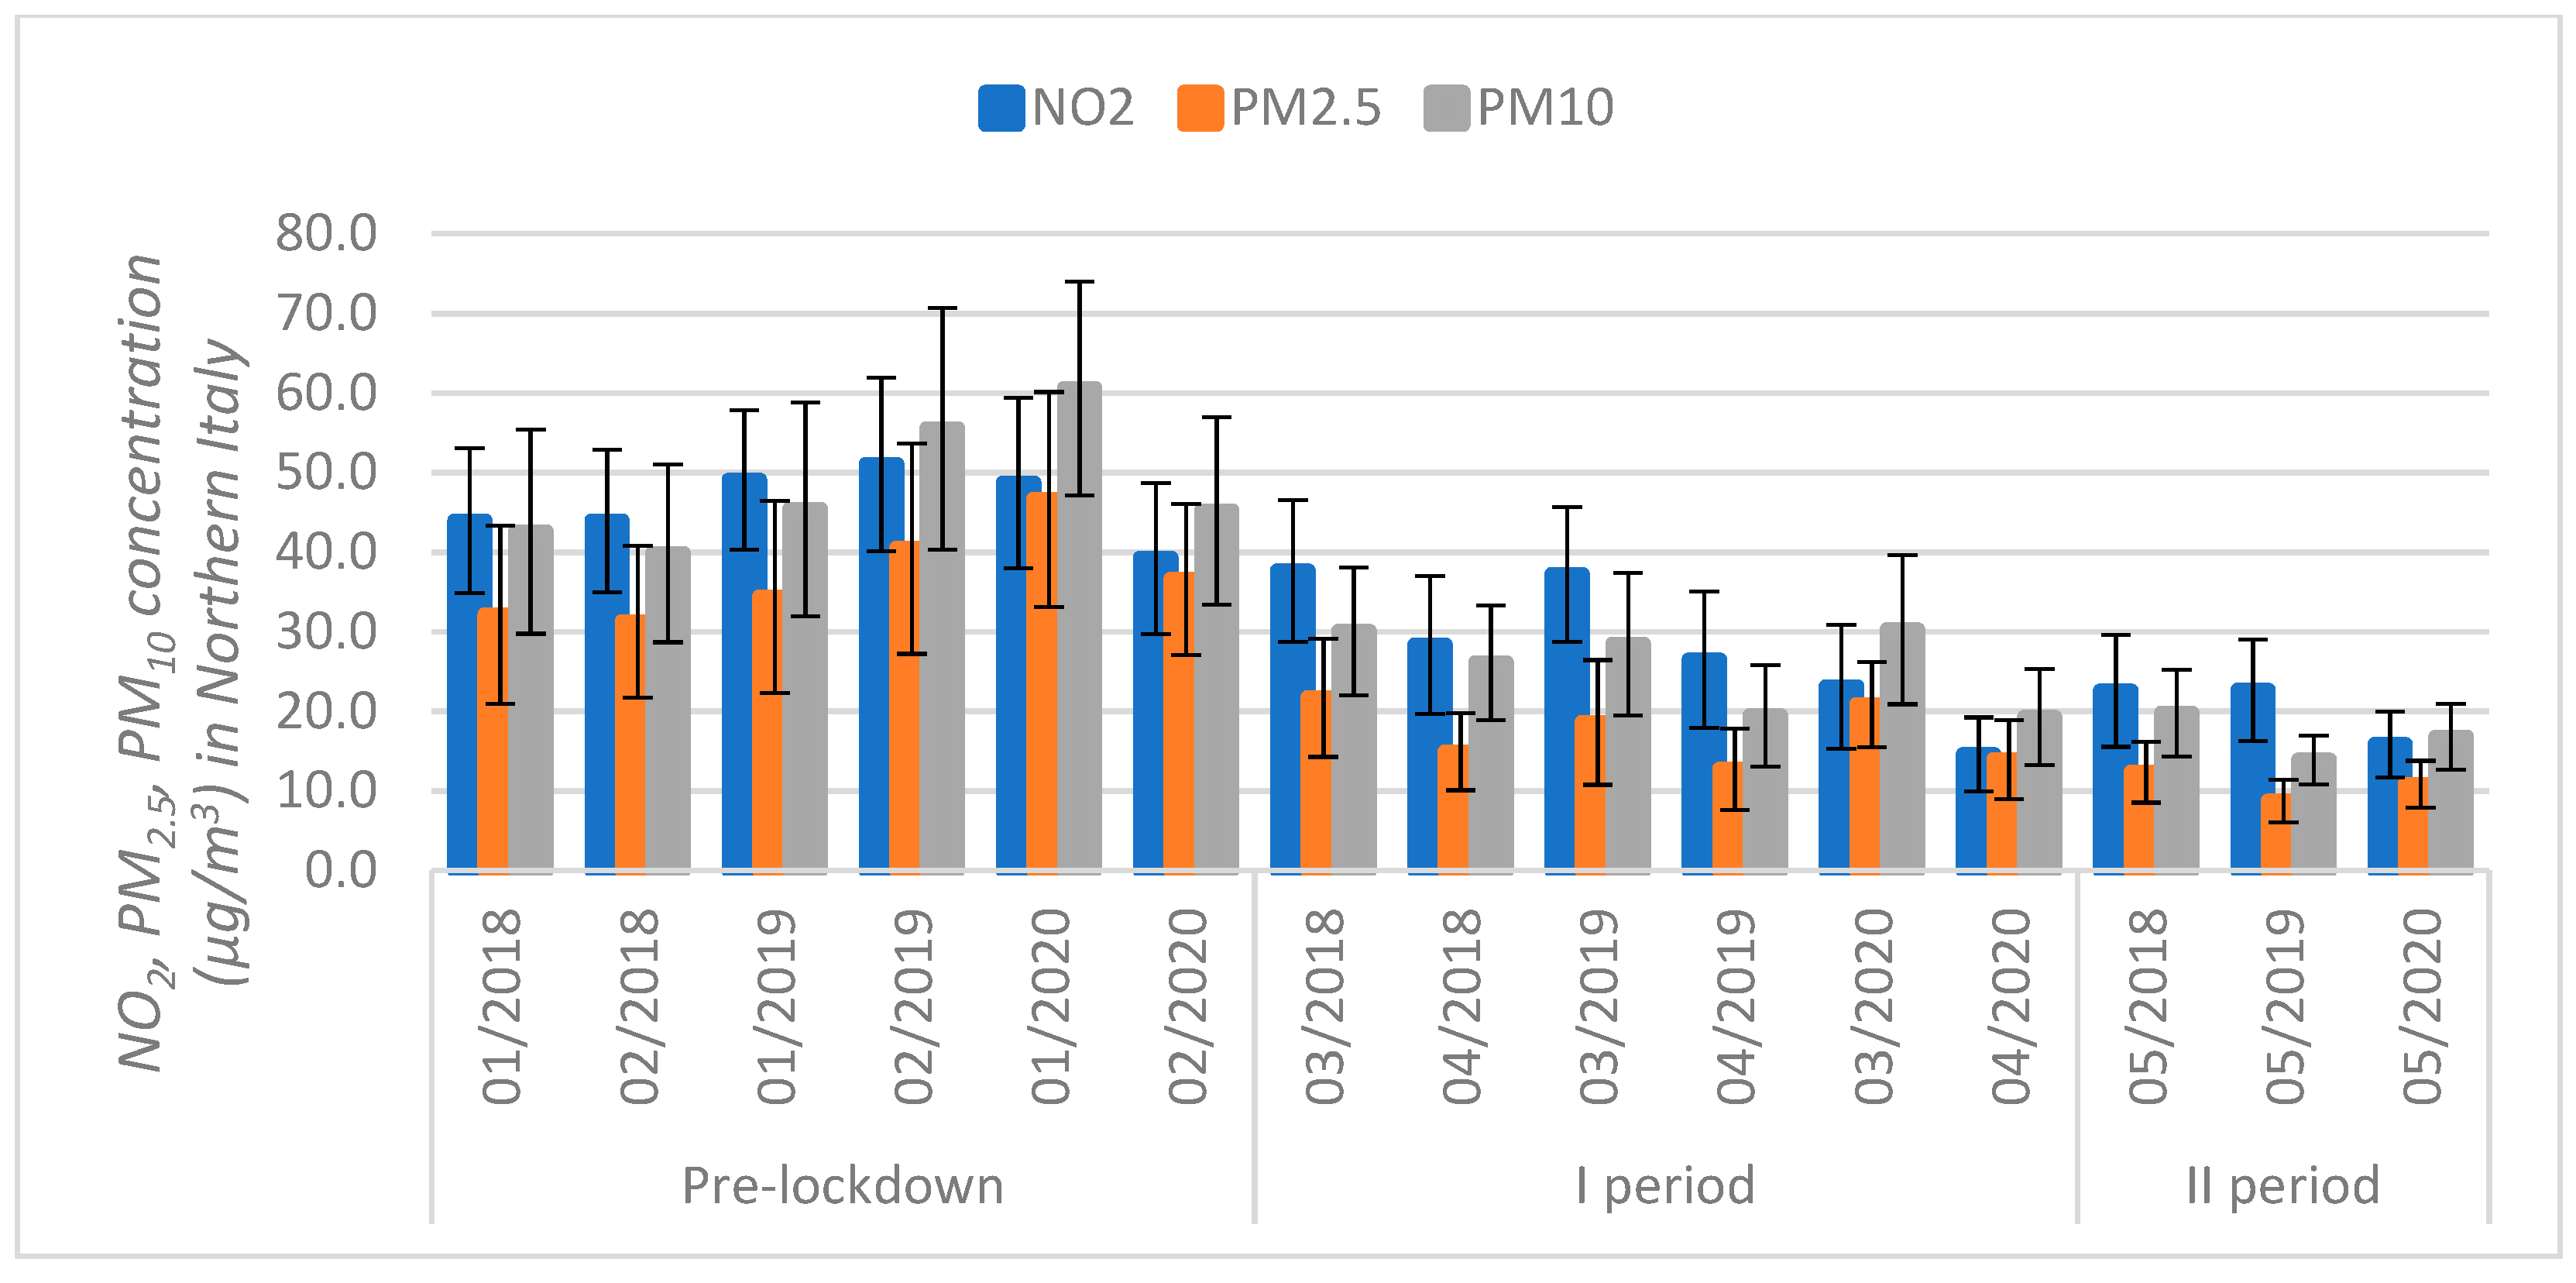
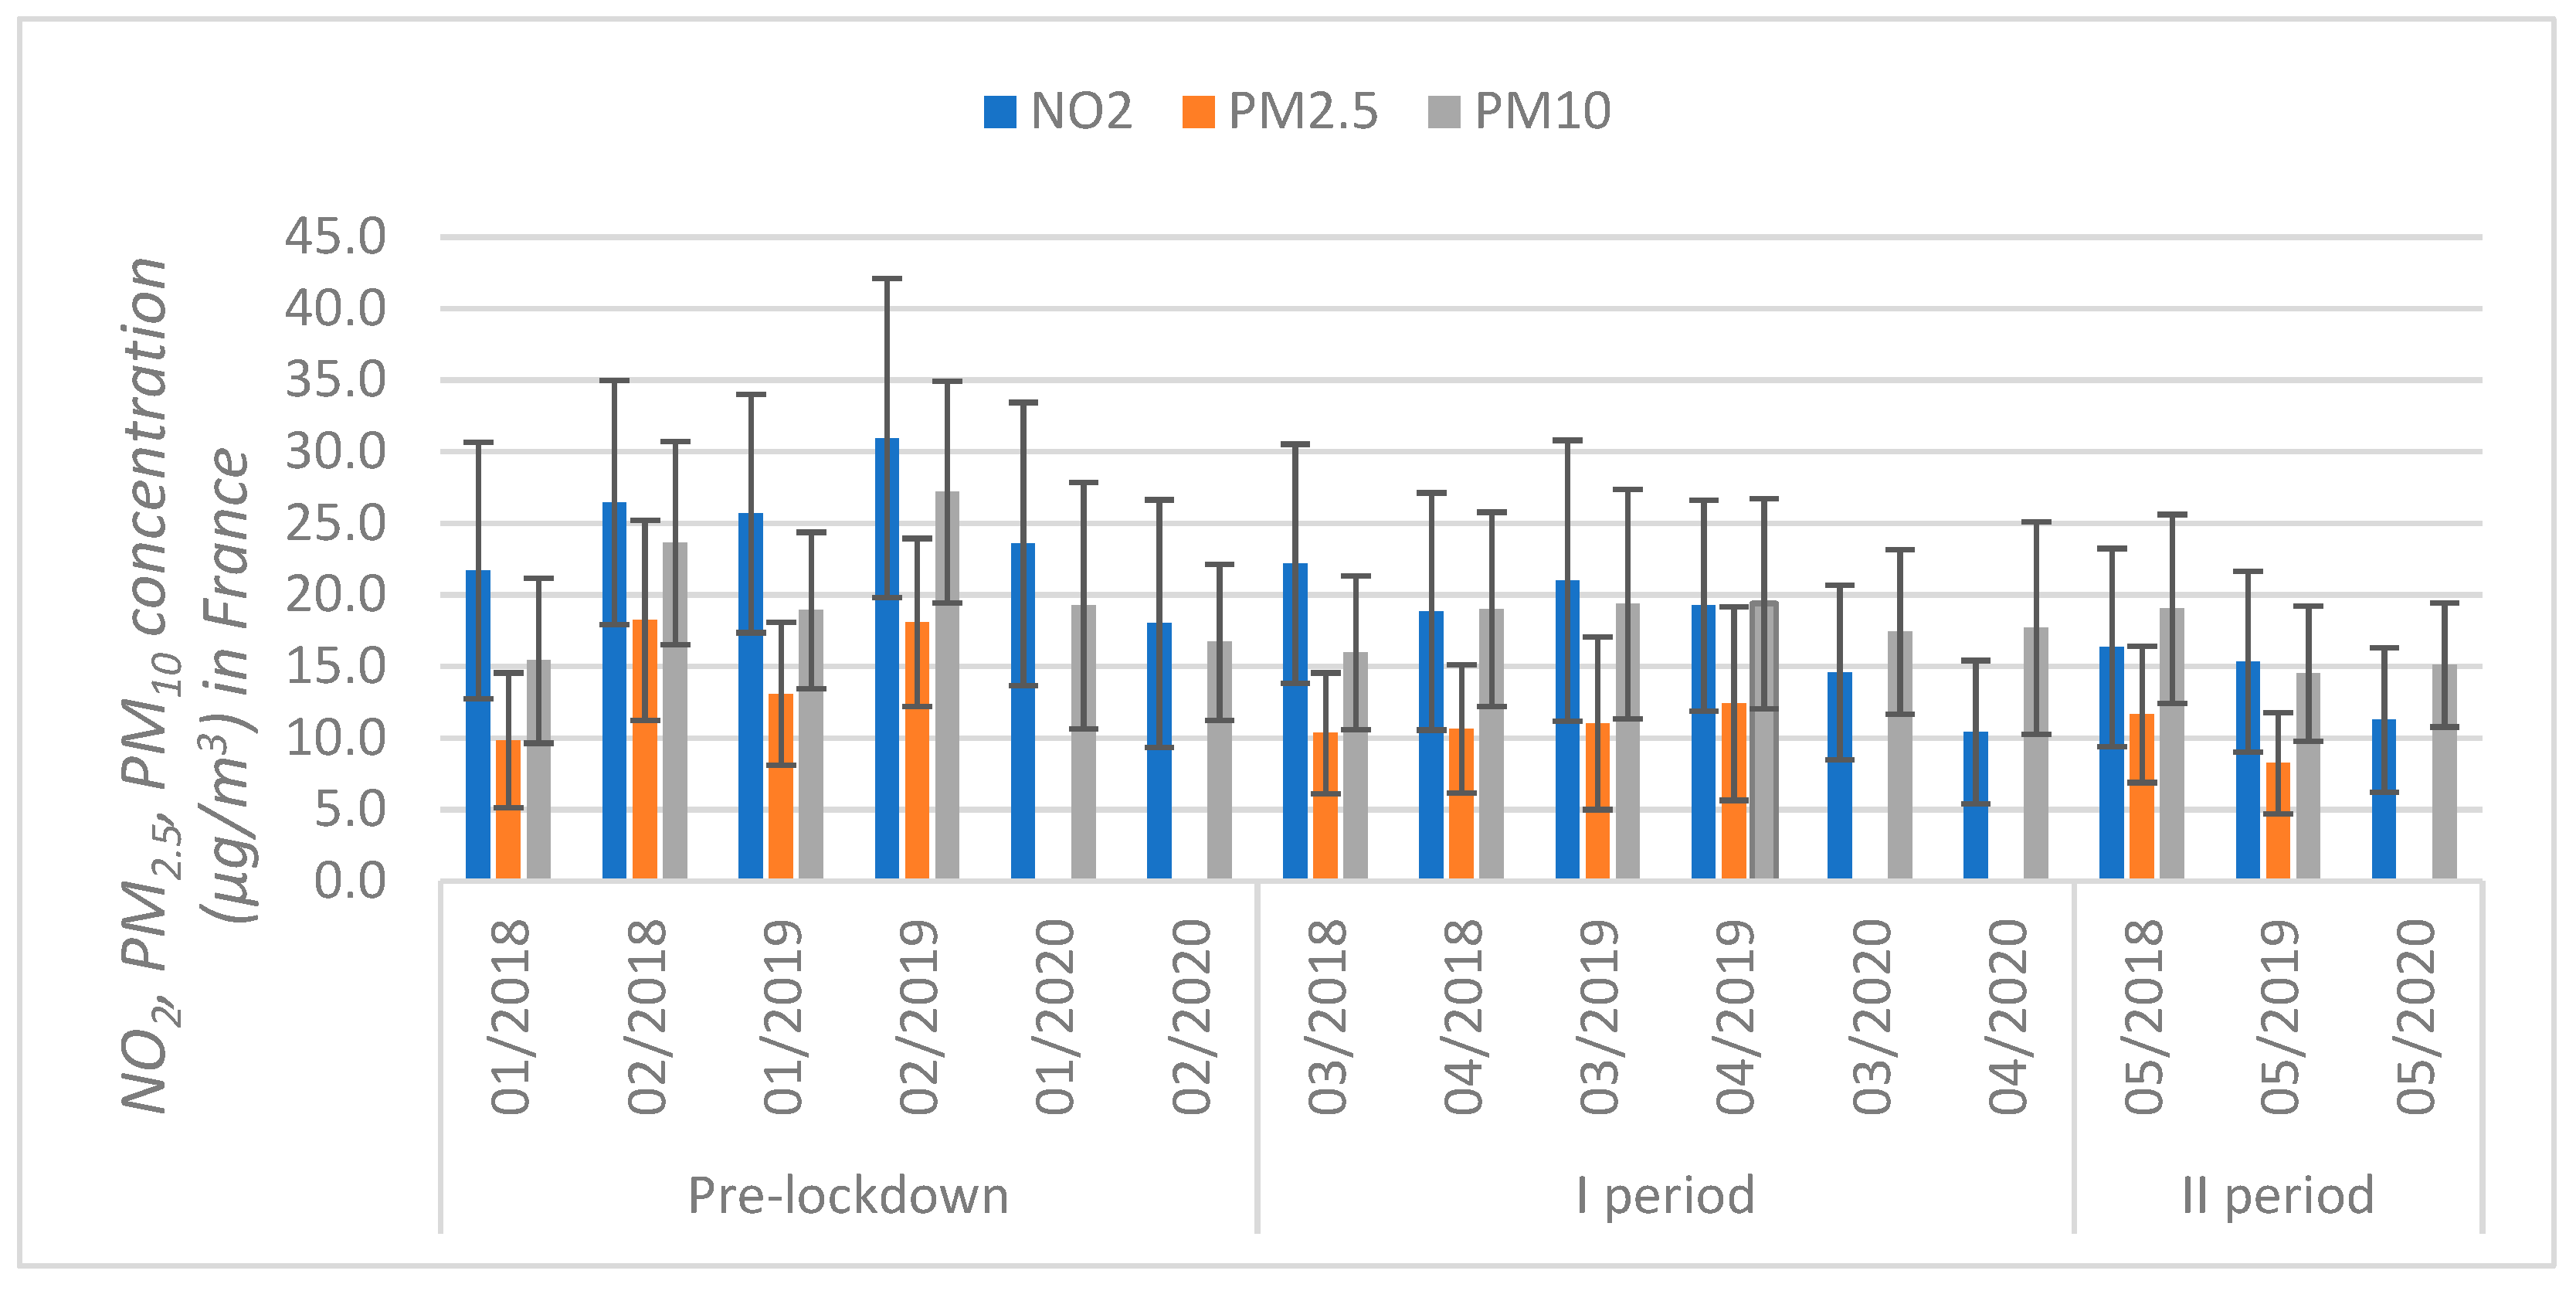
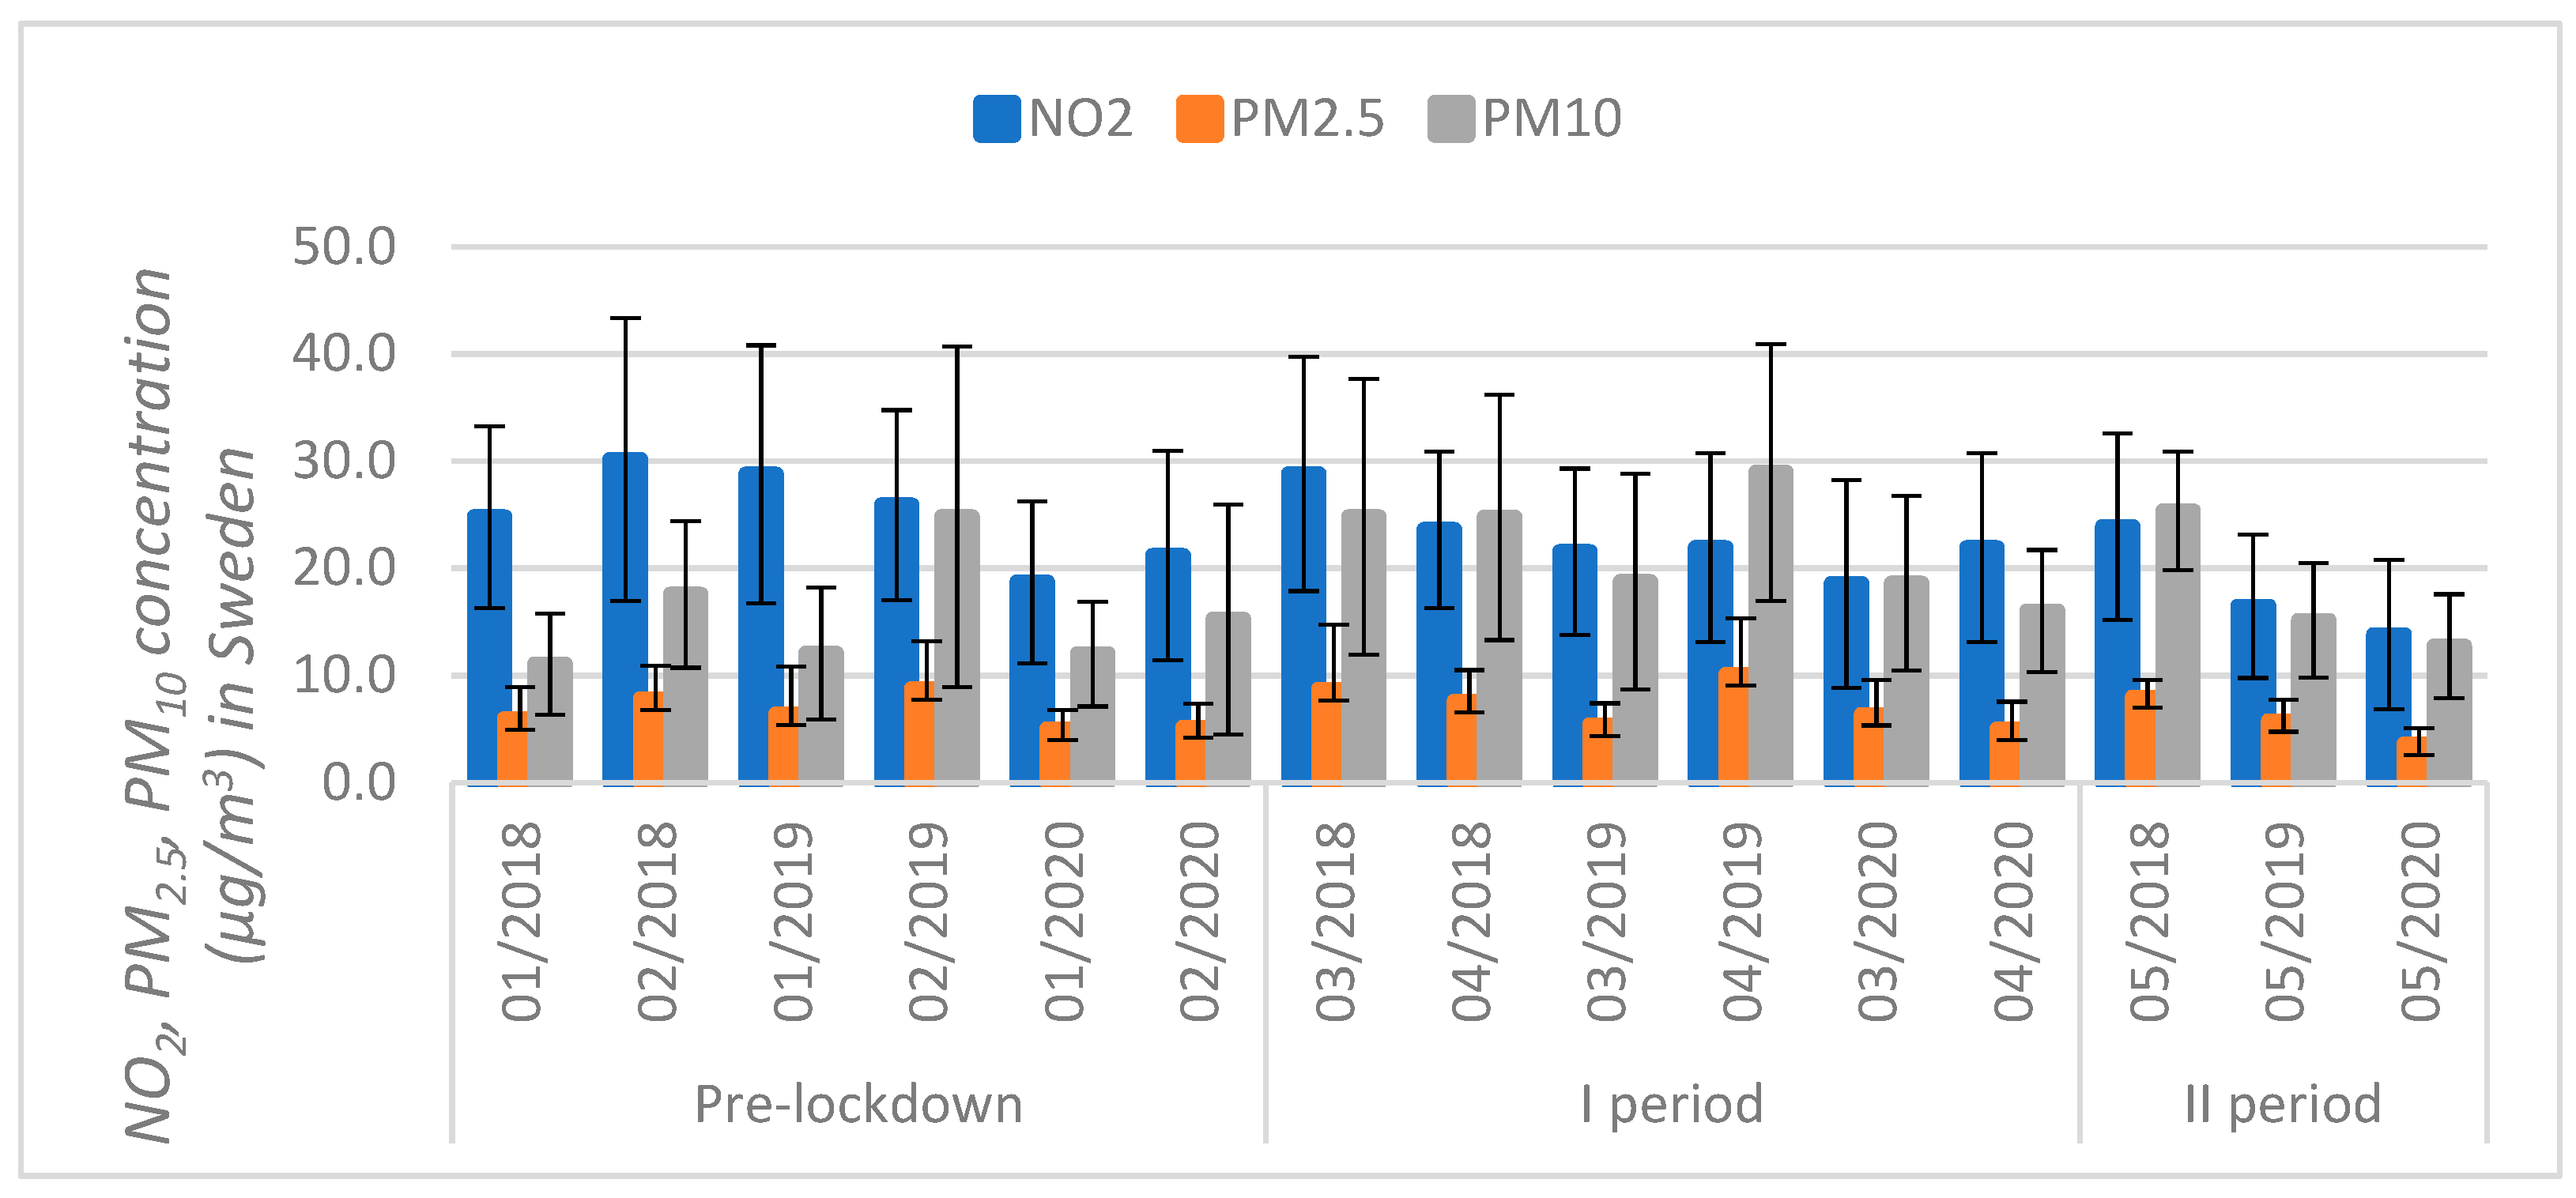
3.2. Air Pollution Analysis in the Context of Production Reduction

The lockdown measures varied across European countries, from milder measures based on recommendations (e.g., Sweden) to strictly enforced measures for residents to not leave their homes and refrain from non-essential traveling (e.g., Spain, Italy, France) [19]. This variability is also reflected in emissions and concentration changes on the maps in Figure 3. To contain the spread of the virus, the European Commission presented recommendations to apply restrictions on non-essential travels from third countries to the EU for an initial period of 30 days. The Commission invited member countries to prolong the temporary restriction until 30 June 2020 [63]. Other essential measures implemented by numerous European countries are social distancing regulations, quarantine measures for COVID-19 positive citizens, suspension of social activities and events, fines for violating quarantine regulations, etc., [62]. NO2 concentration depends on the intensity of industrial facilities, vehicles, and power plants. It can have a significant impact on human health, increasing respiratory problems [64].
There is a common link between these countries and high air pollutants. For instance, the highest concentration of confirmed COVID-19 cases was in Northern Italy, the Po valley to be exact, where the five Italian cities with the highest pollution levels are found [65,66,67]. Although some studies have found spatial coincidence among air pollution and high incidence and mortality [38,39,40,41,50,65,66,67,68], there is a larger uncertainty and further epidemiological research is needed. Figure 3 shows the concentration of NO2, PM2.5, and PM10 changes in Europe in the two different periods: 6 January 2020 data before the outbreak of COVID-19 and 31 March 2020, when most of Europe introduced national lockdowns.
Maps show low levels of selected pollutant concentration across Europe when lockdown measures were implemented to stop the spread of COVID-19. NO2, PM2.5, and PM10 concentrations were significantly reduced, independent of meteorological conditions. However, observations made by satellite instruments provide vertically integrated measurements of the whole atmosphere and cannot be directly compared to surface concentration observations by monitoring stations [19].
The results of selected air pollutant average monthly concentration data analysis from the EEA database show that the suspension of public transportation and habitant mobility restrictions, limited international flights, industry, construction, and other emission source shutdowns during the COVID-19 lockdown are a significant cause of NO2, PM2.5, and PM10 reduction in the atmosphere in the study area (see Figure 4, Figure 5, Figure 6, Figure 7 and Figure 8), compared to the same periods in 2018–2019.
UK. Considering that the local traffic intensity dropped by 77–79% in some countries [18,43] and flights dropped by 82–91% [25], analysis results showed that the average concentration of NO2 during the I period, when the national wide lockdown was announced, decreased by 31.9% in the United Kingdom, compared to the Pre-lockdown period in 2019. During the II period, the average concentration of NO2 significantly decreased by 41.6%, compared to the same period in 2019 (see Figure 4). The average concentration of PM2.5 in 2020 decreased by 48.0%, compared to the Pre-lockdown period in 2019. The average concentration of PM10 was the lowest during the Pre-lockdown period-14.1 μg/m3 and continued to grow during the I period up to 21.1 μg/m3 in 2020. The values were very similar to the concentration registered in 2018–2019.
Spain. From the Pre-lockdown period until the end of II period, Spain had a lower average NO2 and PM2.5 concentration compared to the same periods in 2019 (see Figure 5). While the average concentration of PM10 was higher in January by 31% compared to the same month in 2019, during the I and II periods the average concentration of the NO2 pollutant decreased by 46.8% and by 35.4% compared to the same period in 2019. From February to the end of the I period in April, the average concentration of PM10 was lower by 12% during the I period compared to the same period in 2019. However, in May the average concentration of PM10 remained the same—17.7 μg/m3—as it was in May 2019. Comparing 2019-year air pollution data with 2018 pollution concentration, the decrease of NO2, PM2.5, and PM10 concentration in April (by 11.5%, 19.1%, 26.8%, respectively) and in May (by 9.2%, 23.0%, 10.6%) of 2019 can be noticed.
Northern Italy. Due to the specific topography of the region, where it is surrounded by the Alps, climate features (weak wind), and high economic activity, the significant amount of emissions produced is trapped in the area. The average concentration of NO2 during the first month of the Pre-lockdown period remained the same as it was in January 2019 (see Figure 6). During the I period, the average concentration of NO2 was lower by 41.4% and 30.1% in the II period, compared to the same periods in 2019. Although, the average concentration of PM2.5 was lower by 76.8% and PM10 was lower by 72.3% by the end of the II period in 2020 due to 77% reduced traffic intensity, halted economic activities, and seasonal variations, comparative analysis results from the periods in 2018–2019 revealed that the average concentration of PM2.5 and PM10 rose by 12.7% and 7.2% in the Pre-lockdown period. The average concentrations of PM2.5 and PM10 also were higher by 24.1% and 20.9% in the II period of 2020, compared to 2019. However, standard deviation results show that the values of criteria pollutants in I and II period are close to the mean. Data analysis results mean that the lockdown in Northern Italian cities reduced air pollution, but comparative analysis shows that the average concentration of PM2.5 and PM10, was even higher compared to the same periods in 2018–2019.
France. The average concentration of criteria pollutants in French cities from January to May 2020 is much lower compared to 2018–2019 in the same periods of the Pre-lockdown, the I period response, and the II period response (see Figure 7). The average concentration of NO2 was lower by 25.4% and PM10 decreased by 18.3%, compared to 2019 in the Pre-lockdown period, and 38.2%, as well as 9.5% respective reduction of NO2 and PM10 during the I period of the pandemic compared to the same period in 2019. According to the EEA report on air quality in Europe, the air quality improvement in French cities cannot be explained by meteorology [19]. Furthermore, the national lockdown impact on air quality became clearer in May, when the official lockdown ended and all activities, including more intensive traffic, were gradually resumed. The average concentration of NO2, PM2.5, and PM10 in Paris city rose to 80% of the emissions observed before the lockdown [70].
Sweden chose to implement a soft policy based on “principles of responsibility” instead of a model of strict mobility regulation and national lockdown, implemented by many other European countries. The average concentration of criteria pollutants in Swedish cities from January to May 2020 is much lower compared to 2018–2019 in the same periods of Pre-lockdown, I period response, and II period response. The concentration of PM2.5, PM10 decreased most significantly during the II period (see Figure 8). The results indicate that during the II period, responsible activities and consideration to the government’s recommendations by Swedish residents and businesses produced positive results in air pollution reduction. The average concentration of PM2.5, PM10 decreased by 32.5% and 26.1% compared to 2019 in the Pre-lockdown period, and 25.2% and 44.2% reduction, respectively, during the I period of the pandemic, compared to the same period in 2019. Standard deviation analysis shows that the value of PM2.5 is close to the mean and did not change drastically in all periods from 2018 to 2020, while standard deviation results of NO2 and PM10 show higher deviation during the I and II periods, with values in the data set being farther away from the mean on average.
Table 1 provides the estimations of IoP association with environmental pollutants NO2, PM2.5, and PM10 in countries during the COVID-19 pandemic in 2020. We find that IoP with all pollutants has a positive correlation, but the degree of correlation is different from country to country. Results showed the average correlation between IoP and NO2 in Sweden (p = 0.646, p > α 0.05) with the lowest drop of IoP (15.5% in April and May), while in other countries, the IoP decreased by more than 20% in March and April. On the other hand, correlation results show weak and very weak correlation. A very weak correlation between IoP and NO2 concentration changes can be observed in Spain (p = 0.025) and United Kingdom (p = 0.038), the correlation degree in Northern Italy and France is higher but very similar—0.046 and 0.045, respectively. During the lockdown, Italy’s IoP declined by 29.3% in March, 42.5% in April, and 20.3% in May [71]. However, there is no strong correlation between IoP and selected pollutant concentration changes. IoP correlation with the PM2.5 pollutant was very weak or weak in all countries with the highest value in the United Kingdom (p = 0.303). The strong correlation between PM10 and IoP was found in Sweden (p = 0.726) and average correlation in France (p = 0.643). In other countries, the p value was lower than 0.2, which is considered to be a weak correlation.

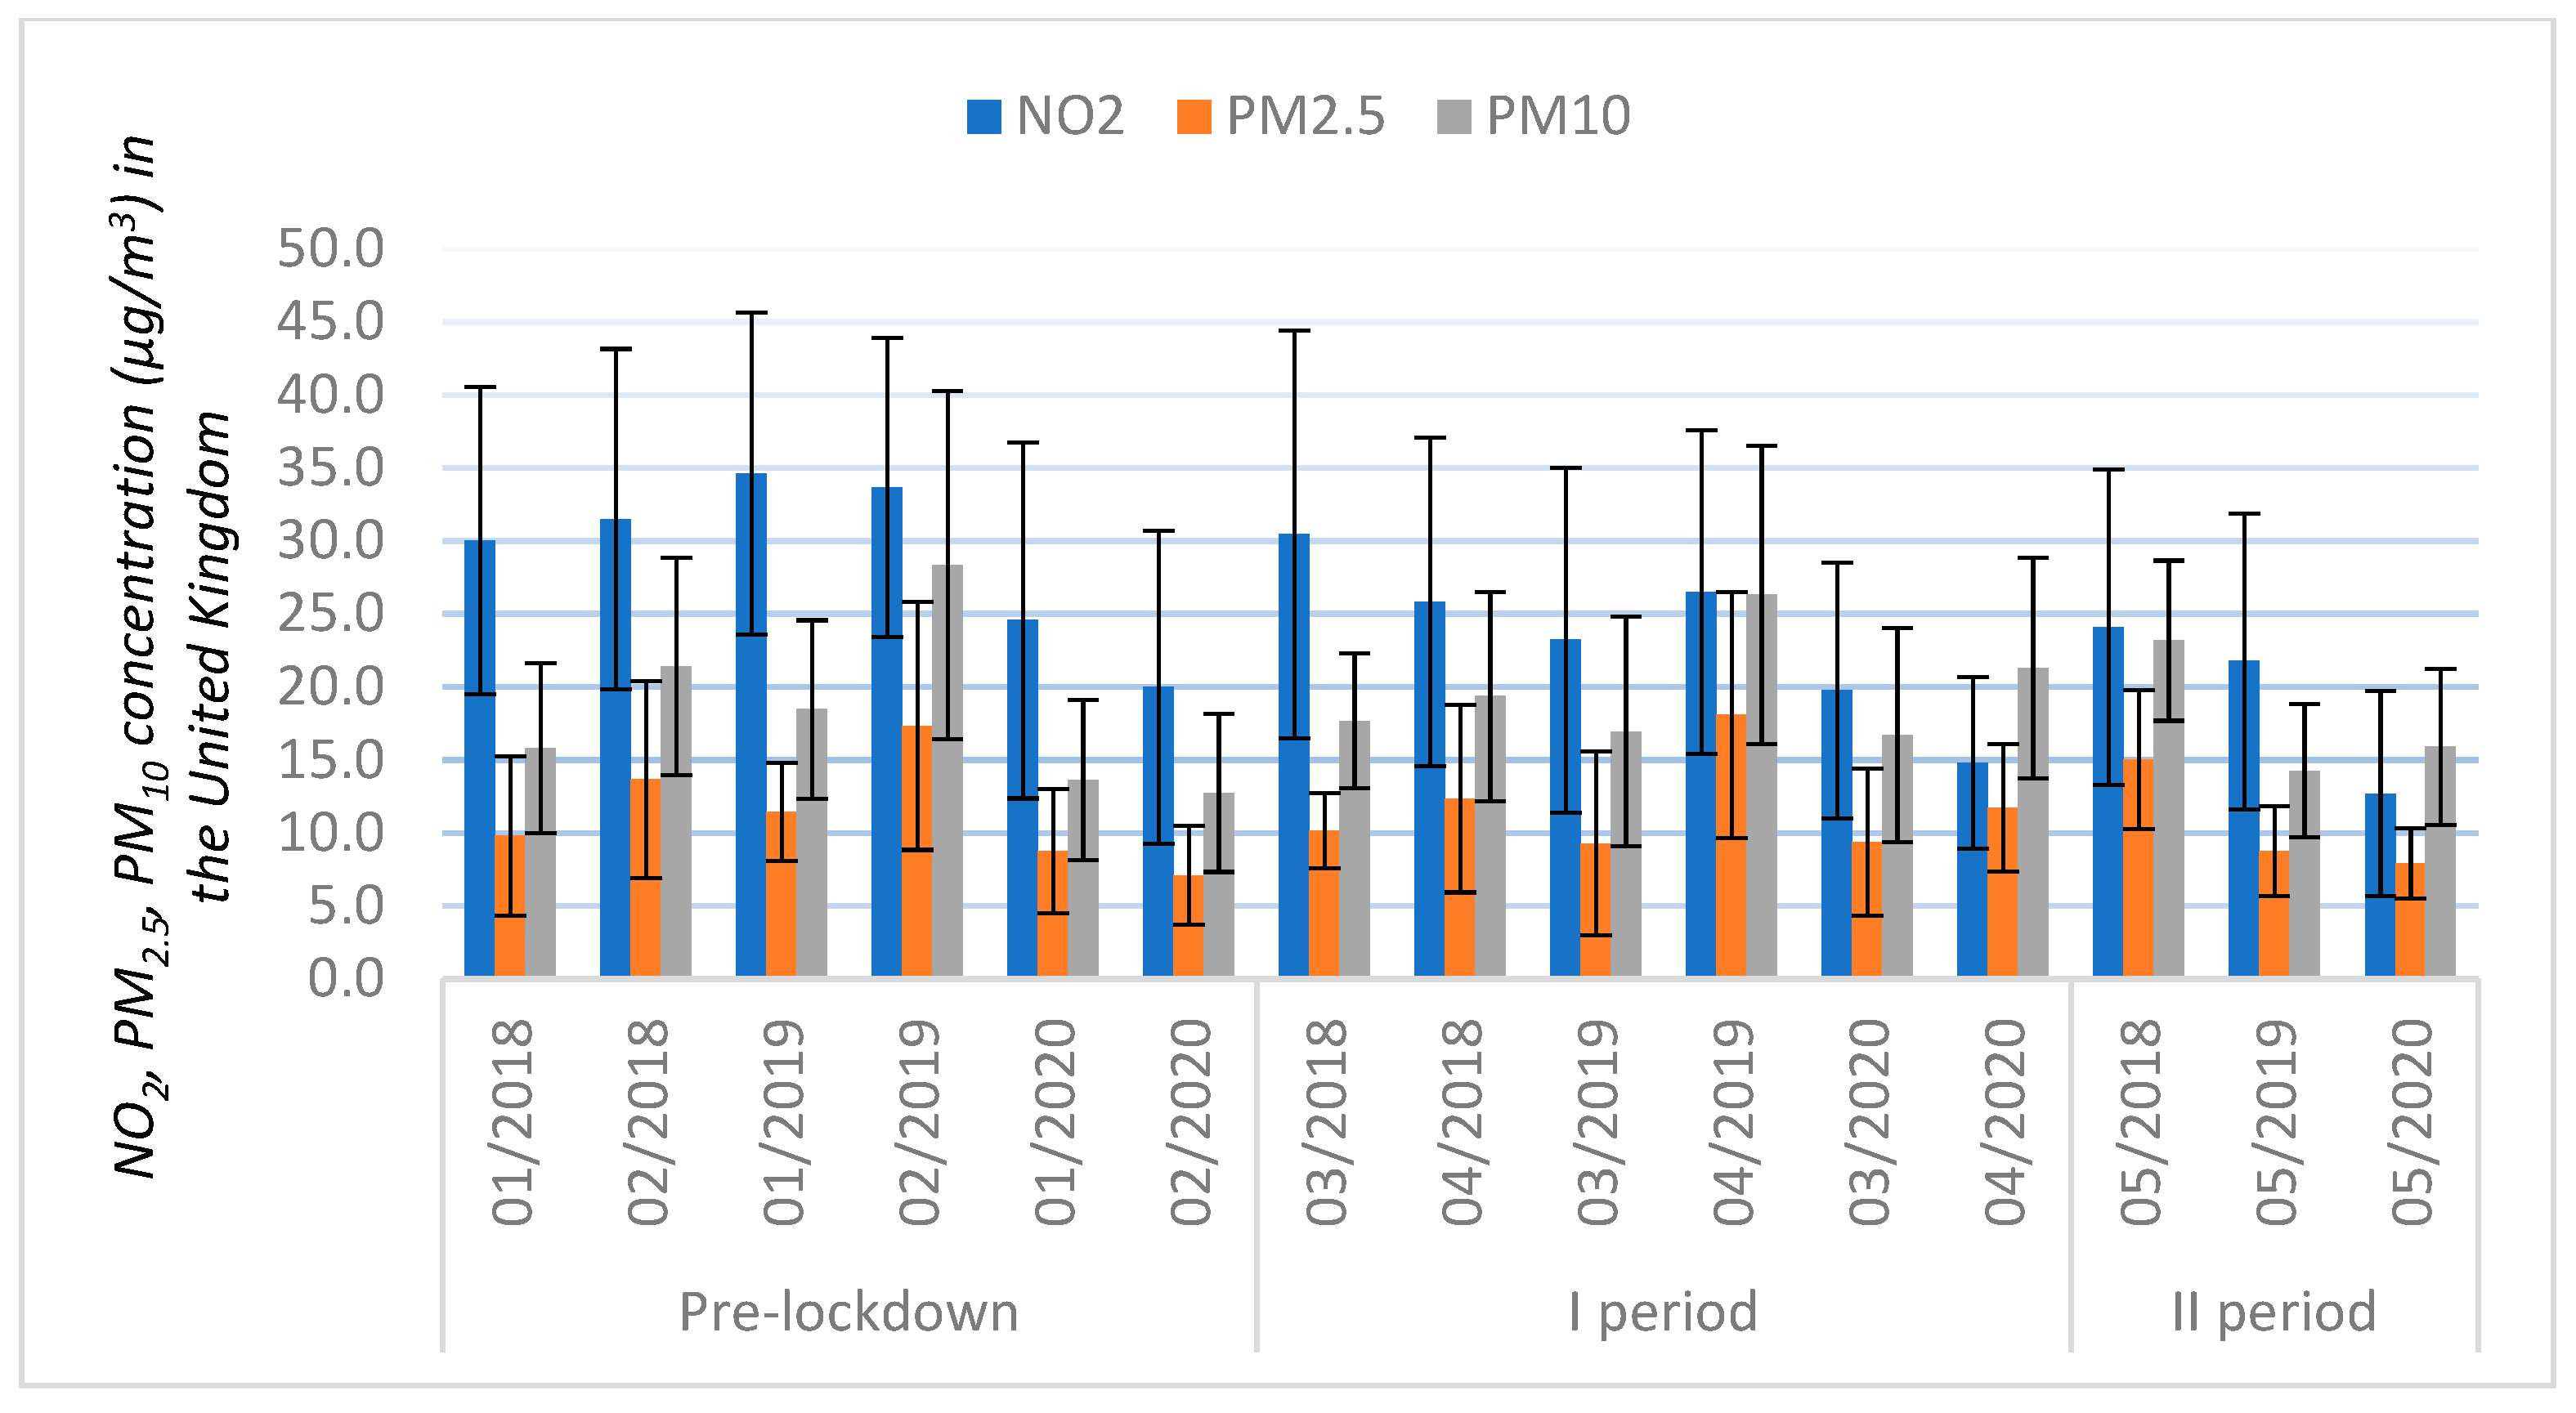
3.3. Trends in the Pollution Variables

Table 2 displays the results of Mann–Kendall and Sen’s slope for different pollutants’ data. The negative value of Kendall’s tau indicates a decreasing trend in data. The Mann–Kendall test showed that p values were below significant level α (0.05) with the NO2 pollutant in the United Kingdom (p = 0.001) and Sweden (p = 0.003), with a negative value of Kendall’s tau, which means almost no correlation and H0 is rejected, confirming alternative hypothesis H1 of acceptance of a trend in time-series data. H1 was accepted for NO2 concentration in Spain with p value of 0.012, Northern Italy with p value of 0.042, France with p value of 0.009, and PM2.5 concentration in Sweden with p value of 0.020. In the case of PMs, Spain’s PM10 value indicates a significant trend (p = 0.921), which is above α value 0.05, accepting H0 and no trend exists for PM10. Other countries’ PMs p values were higher than the significant level of α (0.05) and indicate that no trends exist for PMs.
The Sen’s slope value validates the Man-Kendall test results and shows similar slope orientations. As it is shown in Table 2, Sen slope values are negative and indicate a decreasing trend in the data series. The highest value of the negative Sen’s slope of NO2 (−1.783) and PM10 (−1.180) in Northern Italy and negative value of NO2 in the United Kingdom (−1.167) and Spain (−1.036) indicate the decreasing trends observed in the data series.

4. Discussion

A decline of pollutants NO2, PM2.5, and PM10 in many cases illustrate the clear benefit of forced lockdowns allowing the evaluation of the impact of pollutant concentration, and providing a better understanding of the impact industrial site activities have on air quality changes. All the study results shown above suggest that a direct improvement of air quality during the lockdown periods was visible in all countries [20,29,72]. A significant impact of COVID-19 lockdown on air quality improvement was found in all 4 countries and the Northern region of Italy, including a significant decrease in NO2 concentration (see Figure 4, Figure 5, Figure 6, Figure 7 and Figure 8). Previous studies conclude the significance of the effect of emissions resulting from road and air transportation when it comes to the atmospheric concentration of the NO2 pollutant [20,59,73]. Recent studies of Tian et al. [35] analysis results concerning city air pollution changes in Canada during the pandemic imply that air quality improvement correlates with national lockdown policy. However, analysis results show that the air pollution rebounded in May, along with the return of more intensive economic activities.
The assessment of the effect the lockdown had on PM10 changes is more complex than the identical NO2 analysis. PMs in the air have many sources and the concentration of PM10 might vary not only with meteorology and emissions of primary PMs from a variety of sources, including traffic, industry, commerce, and domestic heating [74]. In some regions where people had to stay at home, there might be an increase in primary PMs emissions from domestic combustion of coal or wood, while emissions of NO2 and primary PMs from traffic were reduced [19,38,39,40,41,50]. The air pollution analysis results for Northern Italy (see Figure 6 and Table 2) imply a less significant impact on pollution reduction, compared to other countries during the lockdown period. The intensive industrial activities, high population density, unfavorable geographical conditions for pollution dispersion—low wind speed, particular orography—in Northern Italy are the probable reason for this variation in results. Furthermore, recently published scientific research concludes that the decrease of traffic-related PM10 was compensated by an increase in PM10 associated with wood burning for domestic heating [31,38,39,40,41,43,50,75,76], which is a very substantial contributor to PMs concentration. However, Table 2 test results show a decreasing trend in countries’ PMs concentration data.

5. Conclusions

This study proposed a new perspective regarding the dynamic impacts of the global pandemic on air pollution and industrial activities. The national lockdowns imposed in many countries drastically lowered human activity, both personal and in the industrial, commercial, and transport sectors. As a result of nationwide lockdown policies, IoP drastically decreased in all countries by 8.1–29.3% in March and additionally by 15.5–42.5% in April. To conduct the analysis, the ground-based air pollution data from 4 European countries and Northern Italy, which were highly affected by COVID-19, has been analyzed. During the I period, when the national lockdown was announced in the majority of European countries, the average concentration of primary pollutants NO2, PM2.5, PM10 decreased in all countries according to Mann–Kendall and Sen slope test results. The average concentration of NO2 during I and II period in the United Kingdom fell by 31.9% and 41.6%, respectively. In Spain it decreased by 46.8% and 35.4%, respectively, in Northern Italy it decreased by 41.1% and 31.4%, respectively, in France it fell by 38.2% during the I period and 30.7% during II period, compared to the same periods in 2019. Although Sweden opted to forgo lockdown measures and used a softer responsibility-based approach, the comparative analysis of NO2 average concentration between I and II periods in 2019–2020 showed the reduction of NO2 concentration by 13.9% during I period and by 15.9% during II period. While the average concentration of NO2 pollutants is noticeable in all countries when compared to the same periods in 2018 and 2019, the average concentration of PM2.5 and PM10 changes indicate the impact of factors other than lower transport flows, industrial, and economic activities. The analysis of Northern Italian cities revealed that the national lockdown did not affect the average concentration reduction of PM2.5 and PM10 in Pre-lockdown, I and II periods and they were higher by 24.1% and 20.9% during the II period of 2020, compared to the same period in 2019. As it was confirmed in previous studies, this can be explained by the region’s unfavorable geographical conditions for pollution dispersion and the decrease of traffic-related PM10 was compensated by an increase in PM10 associated with wood burning for domestic heating. The United Kingdom had lower PM2.5 and PM10 concentrations in the I period but the average concentration of PM10 rose by 11.0% in II period, compared to Pre-lockdown in 2019.
IoP and selected pollutants’ Pearson correlation analysis results show a weak relationship between NO2, PM2.5, and PM10 changes and countries’ IoP, except the identified strong correlation between PM10 and IoP and average correlation between NO2 and IoP in Sweden (p = 0.726 and p = 0.646), and average correlation in France (p = 0.643). In summary, Pearson air pollutants and IoP correlation varied significantly in the range |0.014–0.303|, which suggests the independence of IoP on air pollutant changes.
This study helps to rethink how economic activities in the context of the global pandemic could solve environmental issues and improve air quality. Regions and cities with a high concentration of industrial sectors and intensive traffic are suffering from extreme air pollution regularly. A forced lockdown, together with minimized economic activity and transport flows, enabled a global air quality improvement. This means that air quality in the future depends on economic and industrial activities, as well as the intensity of the transport sector after the global pandemic ends, the economy enters a recovery period, and any progress that is made gets reverted. While most studies focus on transport emissions and air pollution analysis, the economic activities’ impact on air quality during and post-COVID-19 period requires deeper analysis in future studies.

Author Contributions

Conceptualization, A.F.S. and Ž.S.; methodology, A.F.S.; formal analysis, A.F.S.; investigation, A.F.S.; resources, A.F.S.; data curation, A.F.S. and Ž.S.; writing—original draft preparation, A.F.S.; writing—review and editing, Ž.S.; supervision, Ž.S. All authors have read and agreed to the published version of the manuscript.

Funding

This research received no external funding.

Institutional Review Board Statement

Not applicable.

Informed Consent Statement

Not applicable.

Data Availability Statement

Data supporting reported results can be found in European Environment Agency online database (https://www.eea.europa.eu/themes/air/air-quality-and-covid19). COVID-19 data was used from Our World in Data database (https://github.com/owid/covid-19-data/tree/master/public/data); information about countries response to COVID-19 was obtained from ECDC database (https://www.ecdc.europa.eu/en/publications-data/download-data-response-measures-covid-19).

Conflicts of Interest

The authors declare no conflict of interest.

References

  1. Chan, J.F.W.; Yuan, S.; Kok, K.H.; To, K.K.W.; Chu, H.; Yang, J.; Xing, F.; Liu, J.; Yip, C.C.Y.; Poon, R.W.S.; et al. A Familial Cluster of Pneumonia Associated with the 2019 Novel Coronavirus Indicating Person-to-Person Transmission: A Study of a Family Cluster. Lancet 2020, 395, 514–523. [Google Scholar] [CrossRef] [Green Version]
  2. World Health Organization. Nowel Coronavirus (19-nCoV) Situation Report—1. 21 January 2020. Available online: https://www.who.int/docs/default-source/coronaviruse/situation-reports/20200121-sitrep-1-2019-ncov.pdf?sfvrsn=20a99c10_4 (accessed on 8 May 2020).
  3. Zhu, Y.; Xie, J.; Huang, F.; Cao, L. Association between Short-Term Exposure to Air Pollution and COVID-19 Infection: Evidence from China. Sci. Total Environ. 2020, 727, 138704. [Google Scholar] [CrossRef] [PubMed]
  4. Cucinotta, D.; Vanelli, M. WHO Declares COVID-19 a Pandemic. Acta Biomed. 2020, 91, 157–160. [Google Scholar] [CrossRef]
  5. Huang, C.; Wang, Y.; Li, X.; Ren, L.; Zhao, J.; Hu, Y.; Zhang, L.; Fan, G.; Xu, J.; Gu, X.; et al. Clinical Features of Patients Infected with 2019 Novel Coronavirus in Wuhan, China. Lancet 2020, 395, 497–506. [Google Scholar] [CrossRef] [Green Version]
  6. Tian, H.; Liu, Y.; Li, Y.; Wu, C.-H.; Chen, B.; Kraemer, M.U.G.; Li, B.; Cai, J.; Xu, B.; Yang, Q.; et al. An Investigation of Transmission Control Measures during the First 50 Days of the COVID-19 Epidemic in China. Science 2020, 368, 638–642. [Google Scholar] [CrossRef] [PubMed] [Green Version]
  7. WHO. Weekly Epidemiological Update—15 December 2020. Available online: https://www.who.int/publications/m/item/weekly-epidemiological-update---15-december-2020 (accessed on 19 December 2020).
  8. World Health Organization. Updated WHO Advice for International Traffic in Relation to the Outbreak of the Novel Coronavirus 2019-NCoV; WHO: Geneva, Switzerland, 2020. [Google Scholar]
  9. WHO. Updated WHO Recommendations for International Traffic in Relation to COVID-19 Outbreak. Available online: https://www.who.int/news-room/articles-detail/updated-who-recommendations-for-international-traffic-in-relation-to-covid-19-outbreak (accessed on 24 May 2020).
  10. Muhammad, S.; Long, X.; Salman, M. COVID-19 Pandemic and Environmental Pollution: A Blessing in Disguise? Sci. Total Environ. 2020, 728, 138820. [Google Scholar] [CrossRef] [PubMed]
  11. European Commission. Covid-19 Guidelines for Border Management Measures to Protect Health and Ensure the Availability of Goods and Essential Services 2020/C 86 I/01. Available online: https://eur-lex.europa.eu/legal-content/EN/TXT/?uri=CELEX:52020XC0316(03) (accessed on 24 May 2020).
  12. IATA. Interactive Coronavirus (Covid-19) Travel Regulations Map (Powered by Timatic). Available online: https://www.iatatravelcentre.com/international-travel-document-news/1580226297.htm (accessed on 24 May 2020).
  13. Kumari, P.; Toshniwal, D. Impact of Lockdown on Air Quality over Major Cities across the Globe during COVID-19 Pandemic. Urban Clim. 2020, 34, 100719. [Google Scholar] [CrossRef]
  14. International Monetary Fund. Global Financial Stability Report: Bridge to Recovery. Available online: https://www.imf.org/en/Publications/GFSR/Issues/2020/10/13/global-financial-stability-report-october-2020#Chapter1 (accessed on 27 January 2021).
  15. Zambrano-Monserrate, M.A.; Ruano, M.A.; Sanchez-Alcalde, L. Indirect Effects of COVID-19 on the Environment. Sci. Total Environ. 2020, 728, 138813. [Google Scholar] [CrossRef] [PubMed]
  16. Meng, F.; Wang, J.; Li, T.; Fang, C. Pollution Characteristics, Transport Pathways, and Potential Source Regions of PM2.5 and PM10 in Changchun City in 2018. Int. J. Environ. Res. Public Health 2020, 17, 6585. [Google Scholar] [CrossRef] [PubMed]
  17. Pepe, E.; Bajardi, P.; Gauvin, L.; Privitera, F.; Lake, B.; Cattuto, C.; Tizzoni, M. COVID-19 outbreak response, a dataset to assess mobility changes in Italy following national lockdown. Sci. Data 2020, 7, 230. [Google Scholar] [CrossRef]
  18. Galeazzi, A.; Cinelli, M.; Bonaccorsi, G.; Pierri, F.; Schmidt, A.L.; Scala, A.; Pammolli, F.; Quattrociocchi, W. Human Mobility in Response to COVID-19 in France, Italy and UK. arXiv 2020, arXiv:2005.06341. [Google Scholar]
  19. European Environment Agency. Air Quality in Europe—2020 Report; European Environment Agency: Luxembourg, 2020. [Google Scholar]
  20. Lozhkina, O.; Lozhkin, V.; Nevmerzhitsky, N.; Tarkhov, D.; Vasilyev, A. Motor Transport Related Harmful PM2.5 and PM10: From Onroad Measurements to the Modelling of Air Pollution by Neural Network Approach on Street and Urban Level. In Journal of Physics: Conference Series; Institute of Physics Publishing: Bristol, UK, 2016; Volume 772. [Google Scholar] [CrossRef] [Green Version]
  21. Omri, A. CO2 Emissions, Energy Consumption and Economic Growth Nexus in MENA Countries: Evidence from Simultaneous Equations Models. Energy Econ. 2013, 40, 657–664. [Google Scholar] [CrossRef] [Green Version]
  22. Zhu, L.; Hao, Y.; Lu, Z.-N.; Wu, H.; Ran, Q. Do Economic Activities Cause Air Pollution? Evidence from China’s Major Cities. Sustain. Cities Soc. 2019, 49, 101593. [Google Scholar] [CrossRef]
  23. European Commission. Special Eurobarometer 468: Attitudes of European Citizens towards the Environment. Available online: http://data.europa.eu/euodp/en/data/dataset/S2156_88_1_468_ENG (accessed on 26 January 2021).
  24. The World Bank. Earth Day 2020: Could COVID-19 Be the Tipping Point for Transport Emissions? Available online: https://www.worldbank.org/en/news/feature/2020/04/22/earth-day-2020-could-covid-19-be-the-tipping-point-for-transport-emissions (accessed on 29 May 2020).
  25. Shi, X.; Brasseur, G.P. The Response in Air Quality to the Reduction of Chinese Economic Activities during the COVID-19 Outbreak. Geophys. Res. Lett. 2020, 47, e2020GL088070. [Google Scholar] [CrossRef] [PubMed]
  26. Rugani, B.; Caro, D. Impact of COVID-19 Outbreak Measures of Lockdown on the Italian Carbon Footprint. Sci. Total Environ. 2020, 737, 139806. [Google Scholar] [CrossRef]
  27. Fattorini, D.; Regoli, F. Role of the Chronic Air Pollution Levels in the Covid-19 Outbreak Risk in Italy. Environ. Pollut. 2020, 264, 114732. [Google Scholar] [CrossRef] [PubMed]
  28. Cameletti, M. The Effect of Corona Virus Lockdown on Air Pollution: Evidence from the City of Brescia in Lombardia Region (Italy). Atmos. Environ. 2020, 239, 117794. [Google Scholar] [CrossRef]
  29. Wyche, K.P.; Nichols, M.; Parfitt, H.; Beckett, P.; Gregg, D.J.; Smallbone, K.L.; Monks, P.S. Changes in Ambient Air Quality and Atmospheric Composition and Reactivity in the South East of the UK as a Result of the COVID-19 Lockdown. Sci. Total Environ. 2021, 755, 142526. [Google Scholar] [CrossRef]
  30. Sulaymon, I.D.; Zhang, Y.; Hopke, P.K.; Zhang, Y.; Hua, J.; Mei, X. COVID-19 Pandemic in Wuhan: Ambient Air Quality and the Relationships between Criteria Air Pollutants and Meteorological Variables before, during, and after Lockdown. Atmos. Res. 2021, 250, 105362. [Google Scholar] [CrossRef] [PubMed]
  31. Menut, L.; Bessagnet, B.; Siour, G.; Mailler, S.; Pennel, R.; Cholakian, A. Impact of Lockdown Measures to Combat Covid-19 on Air Quality over Western Europe. Sci. Total Environ. 2020, 741, 140426. [Google Scholar] [CrossRef] [PubMed]
  32. Filonchyk, M.; Hurynovich, V.; Yan, H. Impact of Covid-19 Lockdown on Air Quality in the Poland, Eastern Europe. Environ. Res. 2020, 110454. [Google Scholar] [CrossRef]
  33. Li, M.; Wang, T.; Xie, M.; Li, S.; Zhuang, B.; Fu, Q.; Zhao, M.; Wu, H.; Liu, J.; Saikawa, E.; et al. Drivers for the Poor Air Quality Conditions in North China Plain during the COVID-19 Outbreak. Atmos. Environ. 2021, 246, 118103. [Google Scholar] [CrossRef] [PubMed]
  34. Wang, J.; Xu, X.; Wang, S.; He, S.; He, P. Heterogeneous Effects of COVID-19 Lockdown Measures on Air Quality in Northern China. Appl. Energy 2021, 282, 116179. [Google Scholar] [CrossRef] [PubMed]
  35. Tian, X.; An, C.; Chen, Z.; Tian, Z. Assessing the Impact of COVID-19 Pandemic on Urban Transportation and Air Quality in Canada. Sci. Total Environ. 2021, 765, 144270. [Google Scholar] [CrossRef] [PubMed]
  36. Gama, C.; Relvas, H.; Lopes, M.; Monteiro, A. The Impact of COVID-19 on Air Quality Levels in Portugal: A Way to Assess Traffic Contribution. Environ. Res. 2021, 193, 110515. [Google Scholar] [CrossRef] [PubMed]
  37. Baldasano, J.M. COVID-19 Lockdown Effects on Air Quality by NO2 in the Cities of Barcelona and Madrid (Spain). Sci. Total Environ. 2020, 741, 140353. [Google Scholar] [CrossRef]
  38. Chen, Z.; Hao, X.; Zhang, X.; Chen, F. Have Traffic Restrictions Improved Air Quality? A Shock from COVID-19. J. Clean. Prod. 2021, 279, 123622. [Google Scholar] [CrossRef] [PubMed]
  39. Coccia, M. How Do Low Wind Speeds and High Levels of Air Pollution Support the Spread of COVID-19? Atmos. Pollut. Res. 2020, 12, 437–445. [Google Scholar] [CrossRef] [PubMed]
  40. Coccia, M. Effects of the Spread of COVID-19 on Public Health of Polluted Cities: Results of the First Wave for Explaining the Dejà vu in the Second Wave of COVID-19 Pandemic and Epidemics of Future Vital Agents. Environ. Sci. Pollut. Res. 2021, 1–8. [Google Scholar] [CrossRef]
  41. Coccia, M. How (Un)Sustainable Environments Are Related to the Diffusion of COVID-19: The Relation between Coronavirus Disease 2019, Air Pollution, Wind Resource and Energy. Sustainability 2020, 12, 9709. [Google Scholar] [CrossRef]
  42. Coccia, M. An Index to Quantify Environmental Risk of Exposure to Future Epidemics of the COVID-19 and Similar Viral Agents: Theory and Practice. Environ. Res. 2020, 191, 110155. [Google Scholar] [CrossRef]
  43. Putaud, J.-P.; Pozzoli, L.; Pisoni, E.; Dos Santos, S.M.; Lagler, F.; Lanzani, G.; Dal Santo, U.; Colette, A. Impacts of the COVID-19 Lockdown on Air Pollution at Regional and Urban Background Sites in Northern Italy. Atmos. Chem. Phys. Discuss. 2020, 1–18. [Google Scholar] [CrossRef]
  44. European Environment Agency. The Challenge of Reducing Industrial Pollution. Available online: https://www.eea.europa.eu/signals/signals-2020/articles/the-challenge-of-reducing-industrial-pollution (accessed on 1 February 2021).
  45. Italy Industrial Production Index. Available online: https://www.investing.com/economic-calendar/italian-industrial-production-951 (accessed on 30 December 2020).
  46. France—Industrial Production Index. Available online: https://countryeconomy.com/business/industrial-production/france (accessed on 30 December 2020).
  47. Sweden—Industrial Production Index. Available online: https://countryeconomy.com/business/industrial-production/sweden (accessed on 30 December 2020).
  48. Office for National Statistics. Available online: https://www.ons.gov.uk/economy/economicoutputandproductivity/output/bulletins/indexofproduction/previousReleases?:uri=economy/economicoutputandproductivity/output/bulletins/indexofproduction/previousReleases&:uri=economy/economicoutputandproductivi-ty/output/bulletins/indexofproduction/previousReleases&:uri=economy/economicoutputandproductivity/output/bulletins/indexofproduc-tion/previousReleases&:uri=economy/economicoutputandproductivity/output/bulletins/indexofproduction/previousReleases&:uri=economy/economicoutputandproductivity/output/bulletins/indexofproduction/previousReleases&page=1 (accessed on 30 December 2020).
  49. Instituto National de Estadística. Available online: https://www.ine.es/en/prensa/ipi_prensa_en.htm (accessed on 30 December 2020).
  50. Coccia, M. The Effects of Atmospheric Stability with Low Wind Speed and of Air Pollution on the Accelerated Transmission Dynamics of COVID-19. Int. J. Environ. Stud. 2021, 78, 1802937. [Google Scholar] [CrossRef]
  51. Coker, E.S.; Cavalli, L.; Fabrizi, E.; Guastella, G.; Lippo, E.; Parisi, M.L.; Pontarollo, N.; Rizzati, M.; Varacca, A.; Vergalli, S. The Effects of Air Pollution on COVID-19 Related Mortality in Northern Italy. Environ. Resour. Econ. 2020, 76, 611–634. [Google Scholar] [CrossRef] [PubMed]
  52. European Environment Agency. Air Quality and COVID-19. Available online: https://www.eea.europa.eu/themes/air/air-quality-and-covid19 (accessed on 18 June 2020).
  53. Gilbert, R. Statistical Methods for Environmental Pollution Monitoring; John Wiley & Sons: New York, NY, USA, 1987. [Google Scholar]
  54. COVID-19 Health System Response Monitor. Available online: https://www.covid19healthsystem.org/countries/unitedkingdom/countrypage.aspx (accessed on 23 December 2020).
  55. Jephcote, C.; Hansell, A.L.; Adams, K.; Gulliver, J. Changes in Air Quality during COVID-19 ‘Lockdown’ in the United Kingdom. Environ. Pollut. 2020, 272, 116011. [Google Scholar] [CrossRef] [PubMed]
  56. Statistica. Coronavirus (COVID-19) Outbreak in Spain—Statistics & Facts. Available online: https://www.statista.com/topics/6118/coronavirus-covid-19-outbreak-in-spain/ (accessed on 7 February 2021).
  57. Our World in Data. Data on COVID-19 (Coronavirus) by Our World in Data. 2020. Available online: https://ourworldindata.org/coronavirus-data (accessed on 20 December 2020).
  58. OECD. Data on Country Response Measures to COVID-19. Available online: https://www.ecdc.europa.eu/en/publications-data/download-data-response-measures-covid-19 (accessed on 19 December 2020).
  59. Lovarelli, D.; Conti, C.; Finzi, A.; Bacenetti, J.; Guarino, M. Describing the Trend of Ammonia, Particulate Matter and Nitrogen Oxides: The Role of Livestock Activities in Northern Italy during Covid-19 Quarantine. Environ. Res. 2020, 191, 110048. [Google Scholar] [CrossRef]
  60. Spitzer, D.; Martinier, S.; Shannon, D. France: The French Government Response to the COVID-19: Highlights of Measures Taken. Available online: https://www.mondaq.com/france/operational-impacts-and-strategy/926220/the-french-government-response-to-the-covid-19-highlights-of-measures-taken (accessed on 16 June 2020).
  61. Chadwick, L. France Approves Release of Controversial COVID-19 Tracking App. Available online: https://www.euronews.com/2020/05/27/france-s-controversial-covid-19-tracking-phone-app-approved-by-lower-house-of-parliament (accessed on 16 June 2020).
  62. Deloite. EU Countries Measures on COVID-19 under Magnifying Glass. Available online: https://www2.deloitte.com/ro/en/pages/business-continuity/articles/EU-countries-measures-on-COVID-19-under-magnifying-glass.html (accessed on 13 June 2020).
  63. European Commission. Travel Restrictions. Available online: https://ec.europa.eu/info/live-work-travel-eu/health/coronavirus-response/travel-and-transportation-during-coronavirus-pandemic/travel-and-eu-during-pandemic_en (accessed on 13 June 2020).
  64. European Space Agency. Air Pollution Remains Low as Europeans Stay at Home. Available online: http://www.esa.int/Applications/Observing_the_Earth/Copernicus/Sentinel-5P/Air_pollution_remains_low_as_Europeans_stay_at_home (accessed on 13 June 2020).
  65. Cantini, F.; Niccoli, L.; Matarrese, D.; Nicastri, E.; Stobbione, P.; Goletti, D. Baricitinib Therapy in COVID-19: A Pilot Study on Safety and Clinical Impact. J. Infect. 2020, 81, 318–356. [Google Scholar] [CrossRef]
  66. Gatti, R.C.; Velichevskaya, A.; Tateo, A.; Amoroso, N.; Monaco, A. Machine Learning Reveals that Prolonged Exposure to Air Pollution Is Associated with SARS-CoV-2 Mortality and Infectivity in Italy. Environ. Pollut. 2020, 267, 115471. [Google Scholar] [CrossRef] [PubMed]
  67. Domingo, J.L.; Marquès, M.; Rovira, J. Influence of Airborne Transmission of SARS-CoV-2 on COVID-19 Pandemic. A Review. Environ. Res. 2020, 188, 109861. [Google Scholar] [CrossRef]
  68. Konstantinoudis, G.; Padellini, T.; Bennett, J.; Davies, B.; Ezzati, M.; Blangiardo, M. Long-Term Exposure to Air-Pollution and COVID-19 Mortality in England: A Hierarchical Spatial Analysis. Environ. Int. 2021, 146, 106316. [Google Scholar] [CrossRef] [PubMed]
  69. Copernicus Sentinel-5P Tropospheric Nitrogen Dioxide. Available online: https://maps.s5p-pal.com/no2/ (accessed on 13 June 2020).
  70. Évaluation de L’impact du Deconfinement sur la Qualité de L’air en Île-de-France. Available online: http://www.airparif.asso.fr/actualite/detail/id/286 (accessed on 23 December 2020).
  71. Wijfferlaars. COVID-19 Has a Devastating Impact on Italy’s Economy. Available online: https://economics.rabobank.com/publications/2020/july/covid-19-devastating-impact-on-italy-economy/ (accessed on 20 December 2020).
  72. Hu, M.; Chen, Z.; Cui, H.; Wang, T.; Zhang, C.; Yun, K. Air Pollution and Critical Air Pollutant Assessment during and after COVID-19 Lockdowns: Evidence from Pandemic Hotspots in China, the Republic of Korea, Japan, and India. Atmos. Pollut. Res. 2020, 12, 316–329. [Google Scholar] [CrossRef] [PubMed]
  73. Li, M.; Wang, L.; Liu, J.; Gao, W.; Song, T.; Sun, Y.; Li, L.; Li, X.; Wang, Y.; Liu, L.; et al. Exploring the Regional Pollution Characteristics and Meteorological Formation Mechanism of PM2.5 in North China during 2013–2017. Environ. Int. 2020, 134, 105283. [Google Scholar] [CrossRef]
  74. Han, X.; Naeher, L.P. A Review of Traffic-Related Air Pollution Exposure Assessment Studies in the Developing World. Environ. Int. 2006, 32, 106–120. [Google Scholar] [CrossRef]
  75. Vultaggio, M.; Varrica, D.; Alaimo, M.G. Impact on Air Quality of the Covid-19 Lockdown in the Urban Area of Palermo (Italy). Int. J. Environ. Res. Public Health 2020, 17, 7375. [Google Scholar] [CrossRef] [PubMed]
  76. Collivignarelli, M.C.; Abbà, A.; Bertanza, G.; Pedrazzani, R.; Ricciardi, P.; Carnevale Miino, M. Lockdown for CoViD-2019 in Milan: What Are the Effects on Air Quality? Sci. Total Environ. 2020, 732, 139280. [Google Scholar] [CrossRef] [PubMed]
Figure 1. Visualization of air pollution stations in the selected Europe countries cities (UK, Spain, Northern Italy, Sweden and France) [52]. NOTE: Only four cities of France presented an average concentration of PM2.5 data in the period of May 2019. During the lockdown period and I period, 56 cities of France presented an average concentration of PM2.5 data in 2019. 29 cities of Spain presented average concentration of PM2.5 data in the periods of May 2019 and May 2020.
Atmosphere 12 00290 g001
Figure 2. Country based COVID-19 reported dates and lockdown measures with an effect on air pollution in the study area. The beginning and the end of the lockdown for respective countries were presented on the time axes with solid lines of different colors, corresponding to the colors of country names. The numeric values on the time axis represent the beginning and end dates of lockdowns in the individual countries (prepared by authors [54,55,56,57,58,59,60,61,62]).
Atmosphere 12 00290 g002
Figure 3. Air pollutants concentration changes in Central Europe: Panels on the left represent air pollutant concentration on the 6th of January; Panels on the right are air pollutant concentration during the lockdown on the 31 March. Top panels (A1,A2) are a comparison of NO2 concentration [μg/m3]; Panels (B1,B2) are a comparison of PM2.5 concentration [μg/m3]; Panels (C1,C2) are a comparison of PM10 concentration [μg/m3] [64,69].
Atmosphere 12 00290 g003
Figure 4. Trends of NO2 (blue line), PM2.5 (red line), PM10 (grey line) in the United Kingdom during Pre-lockdown, I period, and II period in 2018–2020 (prepared by authors).
Atmosphere 12 00290 g004
Figure 5. Trends of NO2 (blue line), PM2.5 (red line), PM10 (grey line) in Spain during Pre-lockdown, I period, and II period in 2018–2020 (prepared by authors).
Atmosphere 12 00290 g005
Figure 6. Trends of NO2 (blue line), PM2.5 (red line), PM10 (grey line) in Northern Italy in Pre-lockdown, I period, and II period in 2018–2020 (prepared by authors).
Atmosphere 12 00290 g006
Figure 7. Trends of NO2 (blue line), PM2.5 (red line), PM10 (grey line) in France in Pre-lockdown, I period and II periods in 2018–2020 (prepared by authors).
Atmosphere 12 00290 g007
Figure 8. Trends of NO2 (blue line), PM2.5 (red line), PM10 (grey line) in Sweden in Pre-lockdown, I period, and II periods in 2018–2020 (prepared by authors).
Atmosphere 12 00290 g008
Table 1. Pearson correlation analysis of IoP with NO2, PM2.5, and PM10 pollutants from Pre-lockdown, I and II periods of 2020 (prepared by authors).
CountriesNO2PM2.5PM10
Pearson Correlation Coefficient (p)The United Kingdom0.0380.3030.075
Spain0.0250.0170.014
Northern Italy0.0460.0770.085
France0.045-0.643
Sweden0.6460.1910.726
Table 2. Results of Mann–Kendall and Sen’s slope tests results on NO2, PM2.5, PM10 data from the Pre-lockdown, I, and II periods of 2018–2020 (prepared by authors).
CountriesPollutantsKendall’s Taup-ValueS-ValueInterpretation Sen’s Slope
The United KingdomNO2−0.6570.001−69.000Accept H1−1.167
PM2.5−0.2870.137−30.000Accept H0−0.200
PM10−0.2190.255−23.000Accept H0−0.282
SpainNO2−0.4860.012−51.000Accept H1−1.036
PM2.5−0.0960.620−10.000Accept H0−0.073
PM10−0.0190.921−2.000Accept H0−0.018
Northern ItalyNO2−0.3940.042−41.000Accept H1−1.783
PM2.5−0.2000.299−21.000Accept H0−0.783
PM10−0.2570.181−27.000Accept H0−1.180
FranceNO2−0.5050.009−53.000Accept H1−0.840
PM2.5-----
PM10−0.1630.399−17.000Accept H0−0.130
SwedenNO2−0.5800.003−60.000Accept H1−0.733
PM2.5−0.4520.020−47.000Accept H1−0.257
PM10−0.1070.584−11.000Accept H0−0.250
Publisher’s Note: MDPI stays neutral with regard to jurisdictional claims in published maps and institutional affiliations.

