Article

Numerical Study of the Impact of Complex Terrain and Soil Moisture on Convective Initiation

1
Key Laboratory of Land Surface Process and Climate Change in Cold and Arid Regions, Northwest Institute of Eco-Environment and Resources, Chinese Academy of Sciences, Lanzhou 730000, Gansu, China
2
University of Chinese Academy of Sciences, Beijing 100049, China
3
Pingliang Land Surface Process & Severe Weather Research Station, Pingliang 744015, China
4
Gansu Land Surface Process & Severe Weather Observation and Research Station, Pingliang 744015, China
*
Author to whom correspondence should be addressed.
Atmosphere 2020, 11(8), 871; https://doi.org/10.3390/atmos11080871
Submission received: 30 July 2020 / Revised: 8 August 2020 / Accepted: 11 August 2020 / Published: 17 August 2020

Abstract

:
The relative importance of topography and soil moisture on the initiation of an afternoon deep convection under weak synoptic-scale forcing was investigated using the weather research and forecasting (WRF) model with high resolution (1.33 km). The convection occurred on 29 June 2017, over the Liupan Mountains, west of the Loess Plateau. The timing and location of the convective initiation (CI) simulated by the WRF model compared well with the radar observations. It showed that the warm and humid southerly airflow under 700 hPa was divided into east and west flows due to the blockage of the Liupan Mountains. The warm and humid air on the west side was forced to climb along the slope and enhanced the humidity near the ridge. The accumulation of unstable energy in the middle and north of the ridge led to a strong vertical convergence and triggered the convection. Sensitivity experiments showed that terrain played a dominant role in triggering the convection, while the spatial heterogeneity of soil moisture played an indirect role by affecting the local circulation and the partition of surface energy.

1. Introduction

Meteorological disasters induced by severe weather such as hail, heavy rainfall, and thunderstorms pose a great threat to our life and property and cause huge economic losses. Efforts have been devoted to the research of deep convections due to the related severe weather events. However, there remain uncertainties in the physical mechanism of the evolution of deep convection, leading to major challenges in predicting strong convective weather accurately [1,2]. Convection initiation (CI) is currently the most uncertain part of deep convection [3]. Improving the prediction of CI will increase the accuracy of the precipitation forecast [4,5]. A series of international observation-based experiments have been carried out to better understand the process of CI, such as the International H2O Project (IHOP) [6], Convective Storm Initiation Project (CSIP) [7], and Convective and Orographically-induced Precipitation Study (COPS) [8].
Complex terrains can affect CI through both mechanical and thermodynamical processes [9,10]. Weckwerth et al. [11] analyzed a convective event in the eastern slope of the Vosges Mountains using the weather research and forecasting (WRF) model and high-resolution observations. Both simulations and observations showed that convection was triggered by the updraft associated with the low-level convergence and water vapor due to the colliding of upslope easterly and downslope westerly. Moreover, convection is triggered by different mechanisms through the interaction of topography and synoptic backgrounds. Under conditions of strong synoptic backgrounds such as the passage of cold fronts and mid-level troughs, terrain alters the convective available potential energy (CAPE) and the convective inhibition (CIN) through the modification of local wind, temperature, and humidity, and further indirectly or directly trigger CI [12,13]. Under weak synoptic backgrounds, terrain and land surface characteristics, such as soil moisture and vegetation, play a more important role in determining the development of convection [14]. The spatial heterogeneous soil moisture affects CI by changing the surface energy partitioning and triggering mesoscale circulation [15,16,17,18,19]. Taylor et al. [20] analyzed the relationship between afternoon convective precipitation and soil moisture on continents based on observations and pointed out that afternoon convective precipitation tends to occur in areas with relatively dry soil, especially in semi-arid areas. The mechanism of how soil moisture affecting CI is more complicated in regions with complex terrain [21,22,23]. Ideal simulations performed by Imamovic et al. [24] showed that the sensitivity of convection to soil moisture in mountainous regions depended on both the heterogeneity of soil moisture and the mountain height.
The Loess Plateau is located in the north central part of China with complex topography and diverse landforms due to the long history of soil erosion [25]. The Loess Plateau is in the transition zone of semi-arid and semi-humid regions, where it has been broadly regarded as the “hot-spot” of land–atmosphere coupling. The weather and climate in the Loess Plateau are highly sensitive to land surface processes [26,27]. Although the interaction of soil moisture and precipitation (SMP) has been investigated in this region [28], rare attention has been paid to the role of soil moisture in CI. Moreover, most studies focused on the sole impact of soil moisture, and the combined effects of soil moisture and topography on convection remained unknown, which is particularly relevant for the Loess Plateau.
This work aims to investigate the collective impacts of terrain and soil moisture on CI under weak synoptic forcing. To this end, a linear multi-cell storm occurred on 29 June 2017, near the Liupan Mountains (LPMs) in the west of the Loess Plateau was selected as a case study. Sensitivity experiments were performed using high-resolution WRF simulations. This study not only provides a profound theoretical basis for local deep convection, and fulfills the progressive demand of fine scale precipitation prediction, but also deepens our understanding of the interaction between soil moisture and CI in complex terrain.

2. Data and Model Description

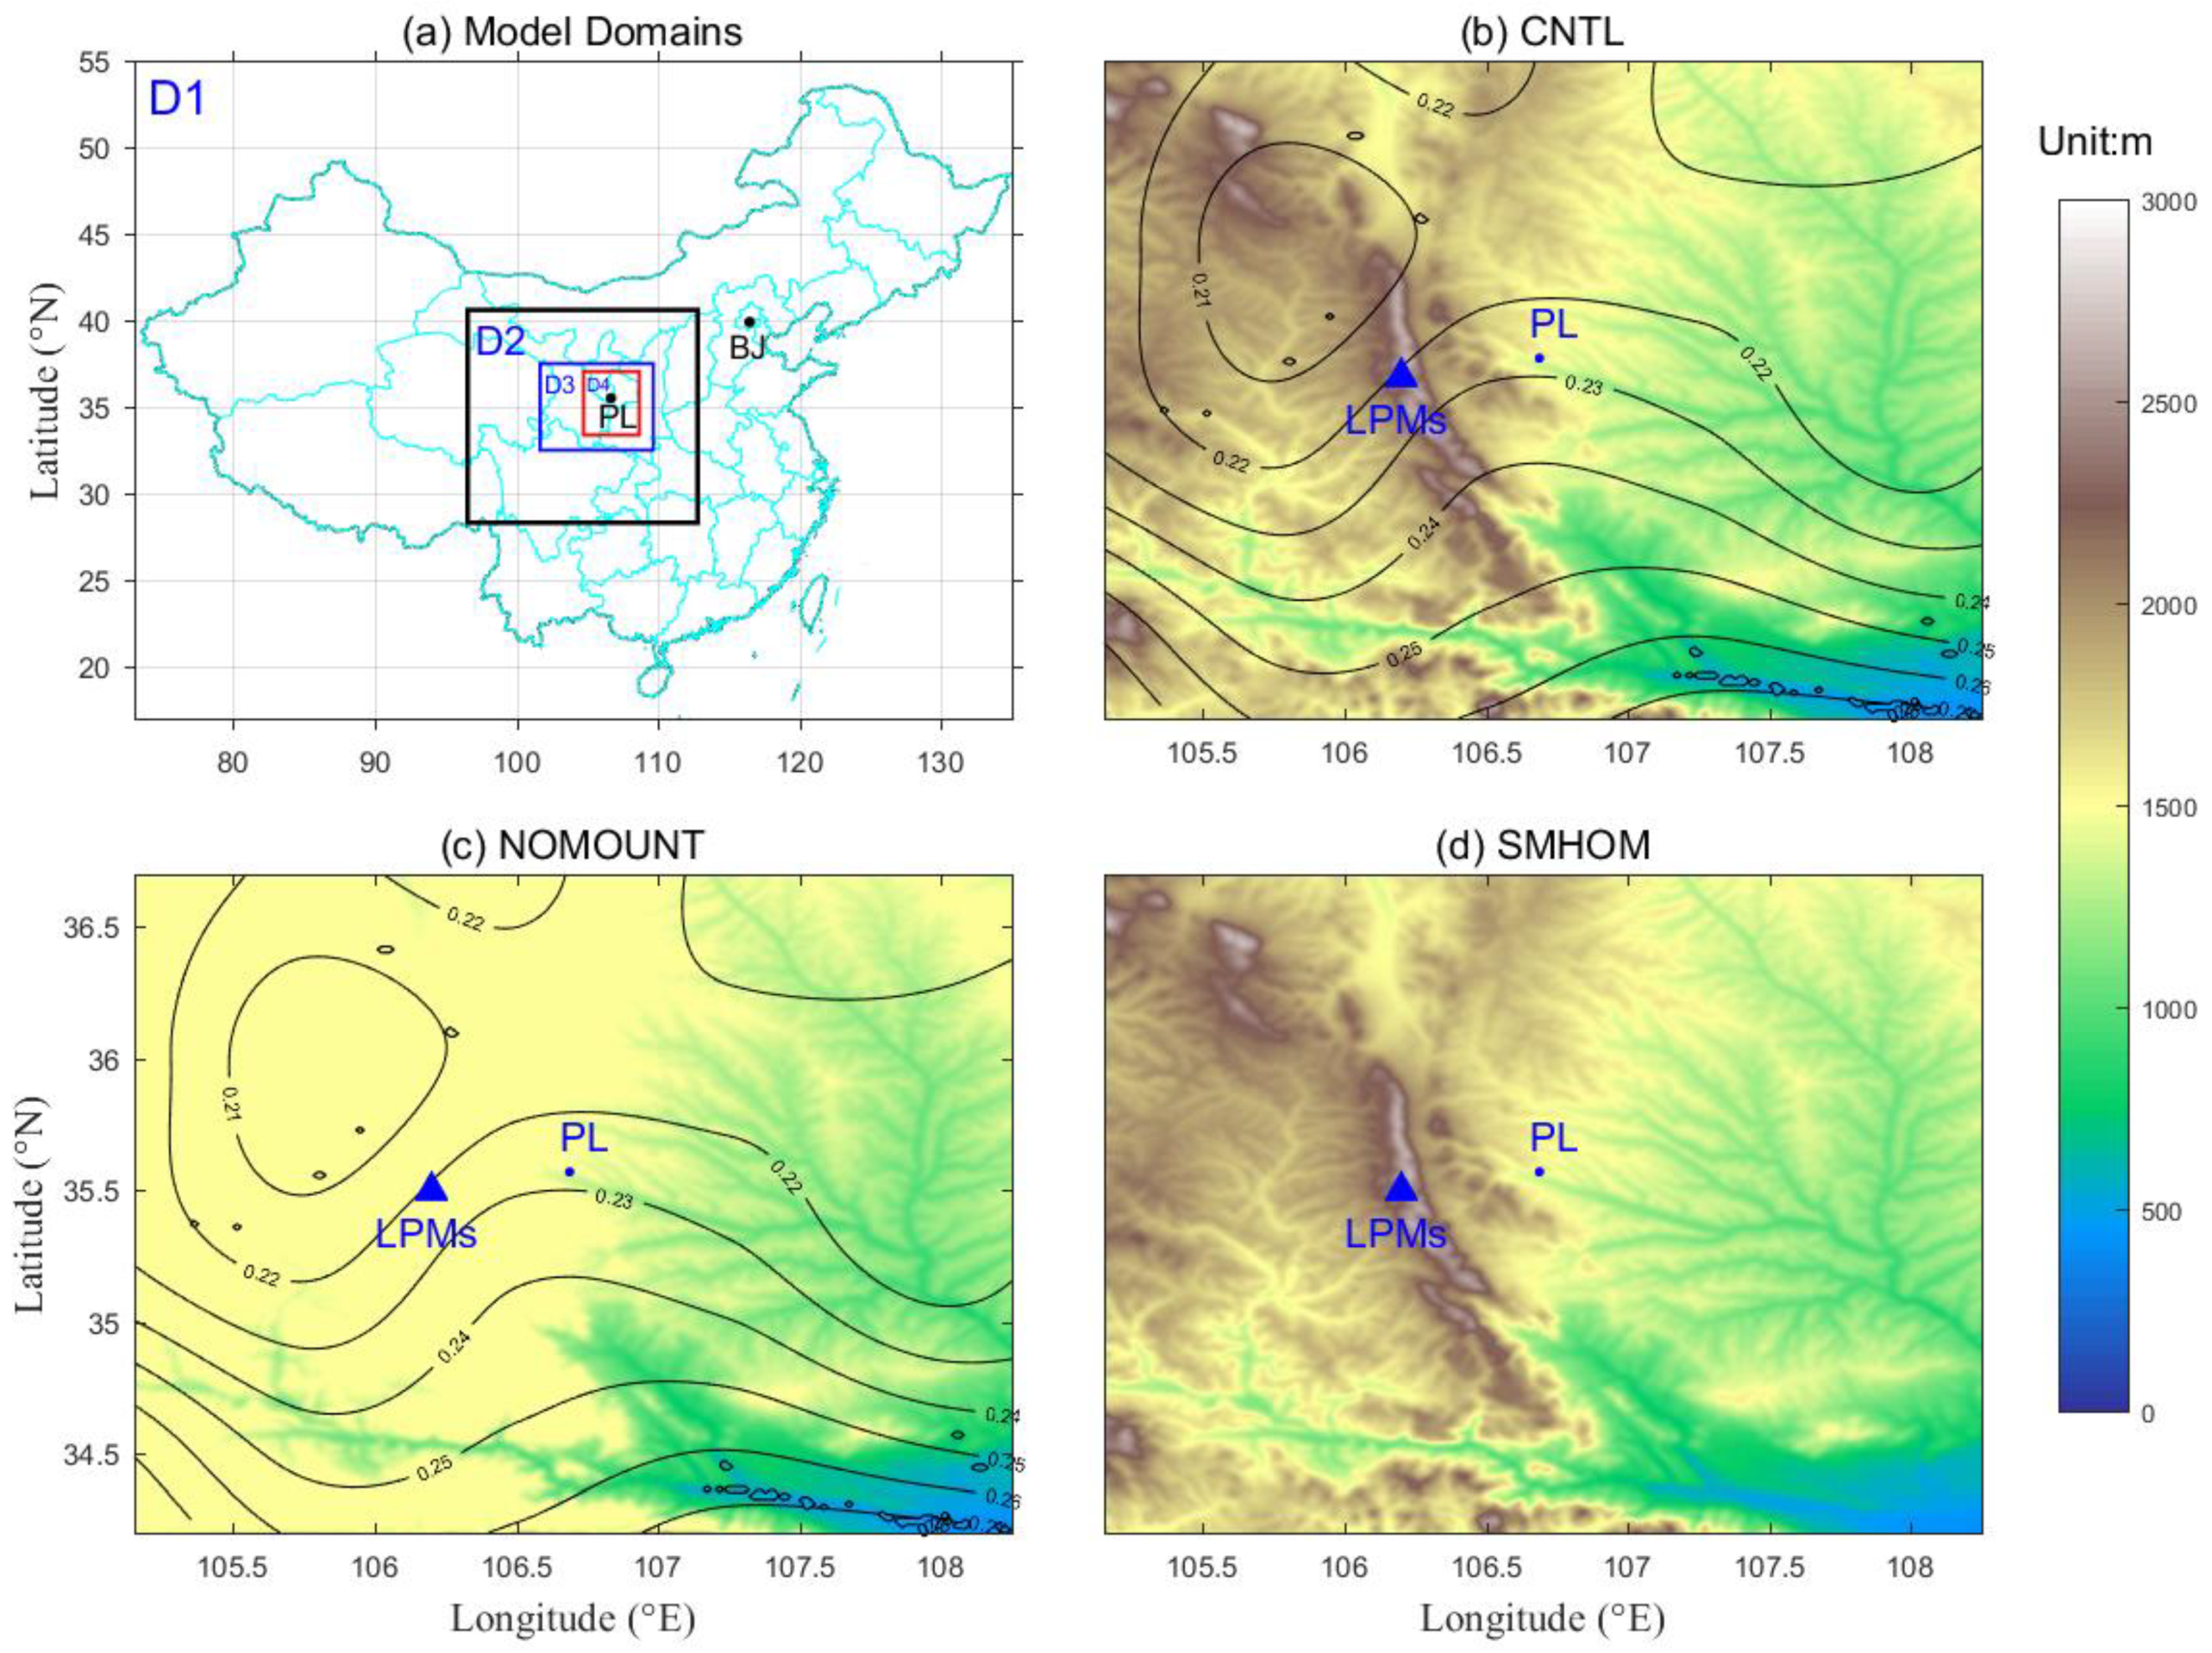
2.1. Model Description

The weather research and forecasting (WRF, Version 4.0, released on 8 June 2018), developed by the National Center for Atmospheric Research (NCAR) and the National Centers for Environmental Prediction (NCEP) was used in this study. The WRF model is a fully compressible and non-hydrostatic model with multiple parameterization schemes for major physical processes. It has been widely applied to weather and climate studies at various scales [29,30].
The simulation covered the period from 2000 LST (local standard time = UTC + 7 h) 28–30 June 2017. The first 10-hour simulation was discarded as the model spin-up and the remaining simulation (0600–1400 LST 29 June 2017) was further analyzed. The model output was saved every 10 min. The ERA (European Centre for Medium-Range Weather Forecasts (ECWMF) reanalysis) -interim reanalysis data (0.75° × 0.75°) were used to provide the lateral boundary and initial conditions [31]. Four nested domains in the Lambert projection were applied, with grid spacings of 36, 12, 4, and 1.33 km for the outmost domain (D1), the second domain (D2), the third domain (D3), and the innermost domain (D4) respectively (Figure 1a). The simulation was integrated with time steps of 90 s. There were 50 vertical sigma-pressure levels with the lowest level following the terrain and the top level set at 50 hPa. The outmost domain covers East Asia including China, the second domain covers central China and includes the entire Loess Plateau and the third domain covers the west of Loess Plateau. The innermost domain is centered at Pingliang, covering the Liupan Mountains (LPMs, Pingliang, China; Figure 1b). The United States Geological Survey (USGS, Reston, VA, USA) static data with 30” in WRF was used for topography data.
Several combinations of physical parameterizations were compared and evaluated to determine the optimal physical parameterization schemes for this study and the following physical parameterization schemes were used in all domains: Dudhia scheme for short-wave radiation [32], RRTM (Rapid Radiative Transfer Model) scheme for long-wave radiation [33], WSM6 scheme for cloud microphysical processes [34], Kain–Fritsch scheme for cumulus convection parameterization [35], and YSU (Yonsei University) scheme for boundary layer processes [36], the revised MM5 (Mesoscale Model 5) Monin–Obukhov scheme was used for the surface layer process [37], and the Noah scheme was used for the land surface process [38]. Note the cumulus convection parameterization was only used for the outmost and the second domains.
Three experiments were designed to study the effects of topography and soil moisture on CI (convective initiation):
(1)
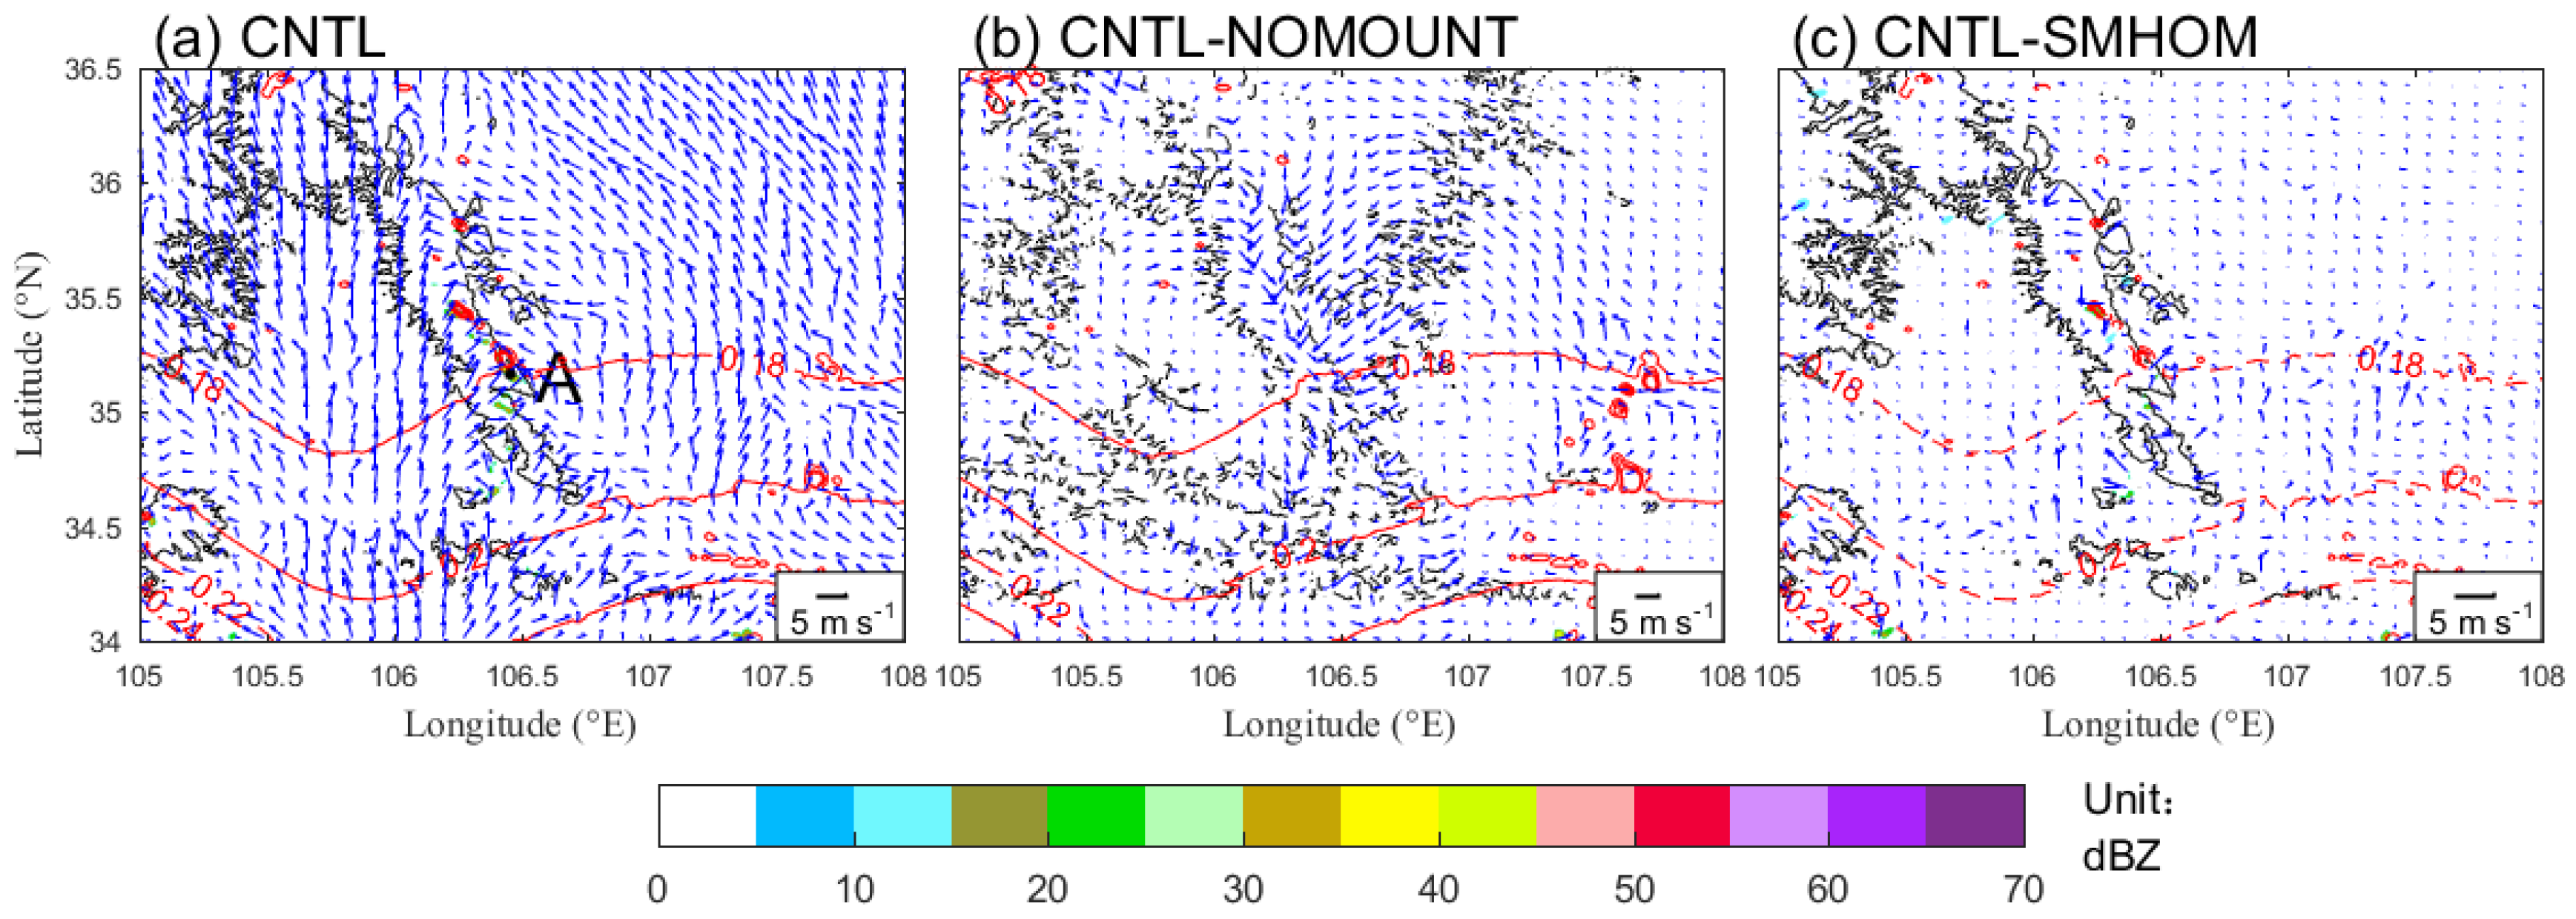
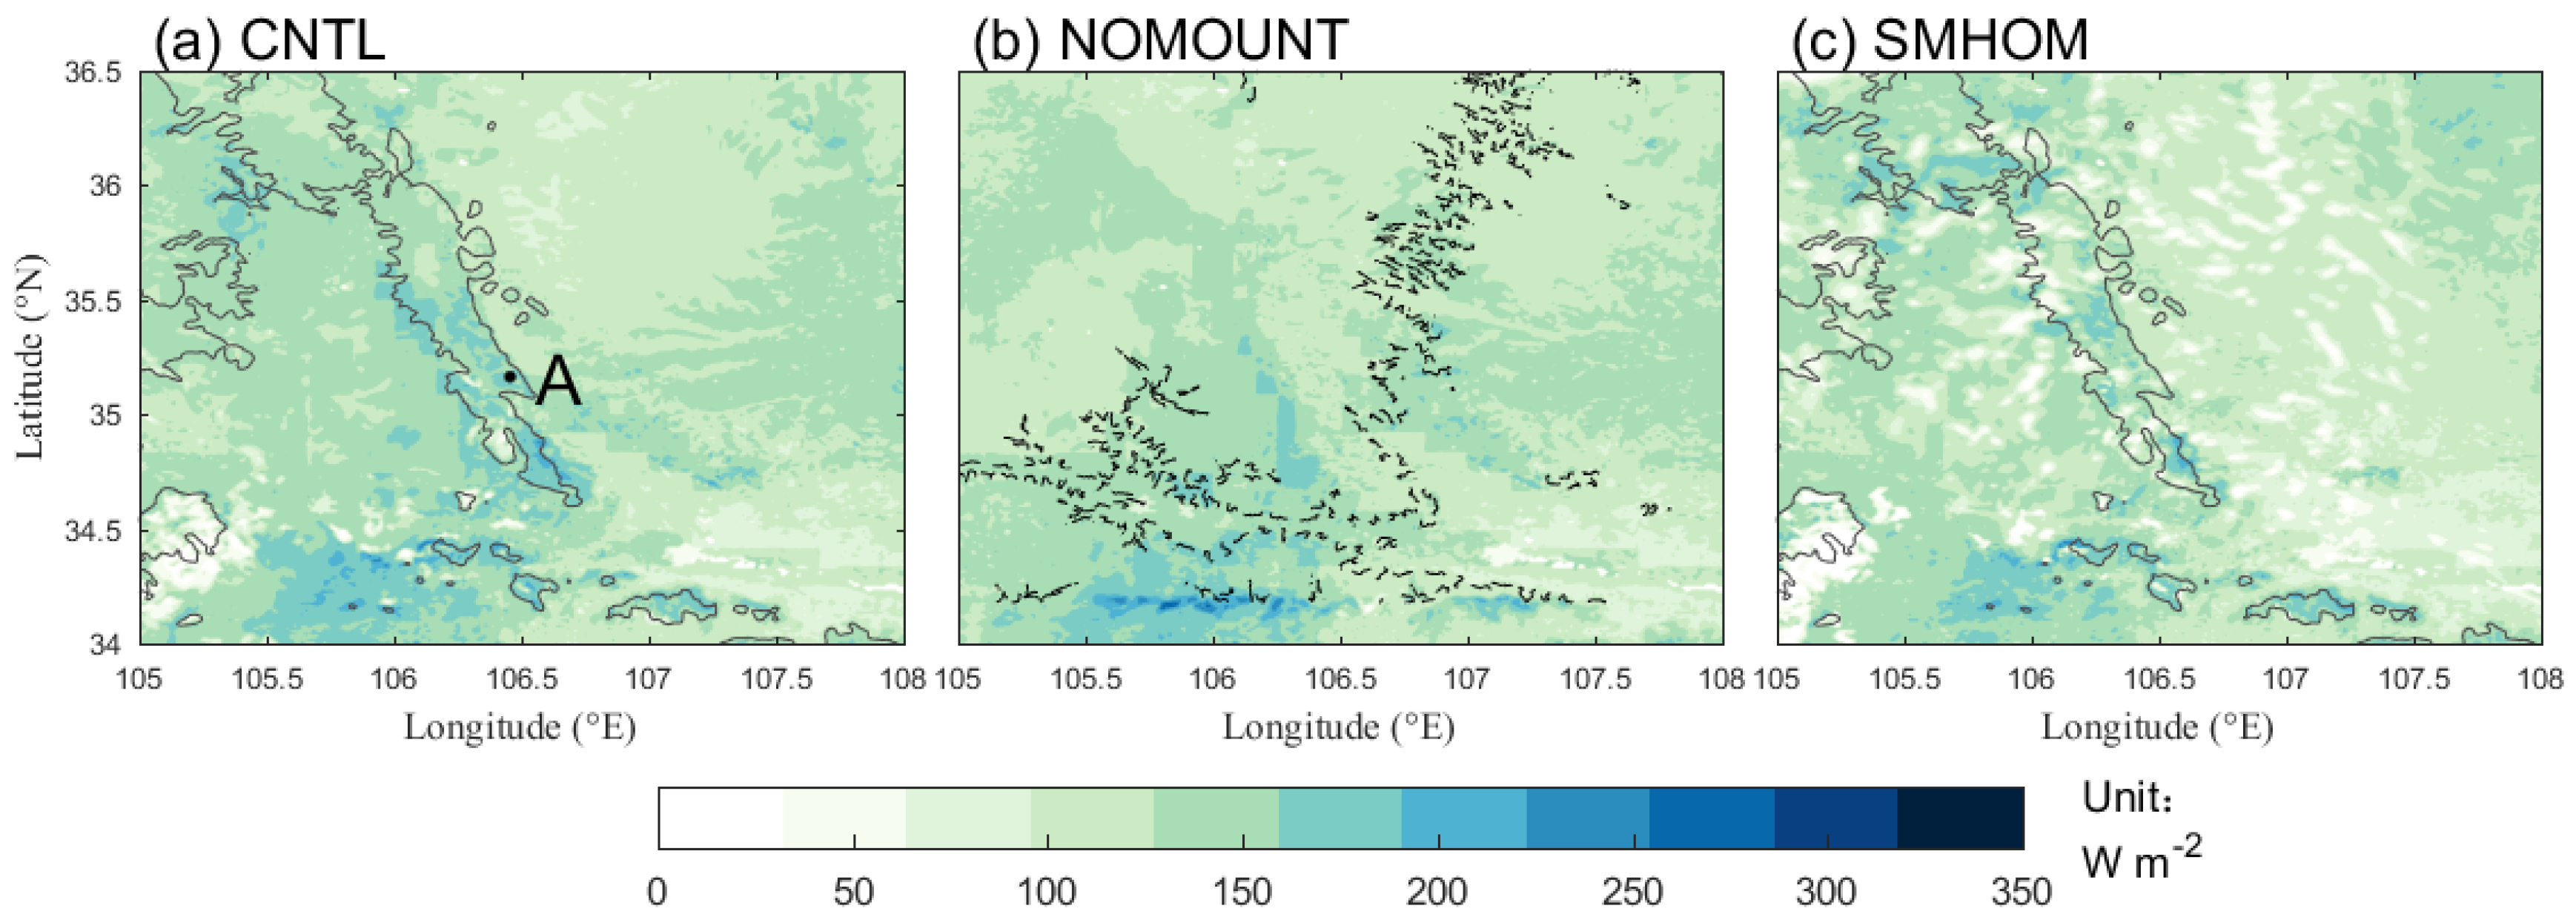
Control experiment (CNTL, Figure 1b): default USGS terrain and ERA-Interim soil moisture were used;
(2)
Terrain removal experiment (NOMOUNT, Figure 1c): same as CNTL but the LPMs were removed from the innermost domain by setting the area above 1500 m as 1500 m. The difference between CNTL and NOMOUNT indicates the effect of topography;
(3)
Homogeneous soil moisture experiment (SMHOM, Figure 1d): same as CNTL but the initial soil moisture in the innermost domain was spatially homogeneous and set to the mean value (0.2 m3m−3) of the innermost domain. A comparison between CNTL and SMHOM gives information on the effect of the spatial distribution of soil moisture.

2.2. Data

The ERA-Interim reanalysis data was used to validate the performance of WRF in simulating the background synoptic-scale circulation. The radiosonde data at Pingliang Station (35.53° N, 106.67° E, 1468 m ASL) at 0615 LST June 29, provided by the Pingliang municipal meteorological bureau, was used to verify WR’s performance in simulating vertical atmospheric structure. The reanalysis data and the radiosonde data were both obtained at 0700 LST 29 June 2017. Data from an X-band Doppler weather radar (LLX06B, manufactured by Xi’an Institute of Electronic Engineering, Xi’an, China) located at the Pingliang Land Surface Processes and Severe Weather Research Station (35.57° N, 106.69° E, 1650 m ASL, hereinafter referred to as the PL Station), Chinese Academy of Sciences, were used to explore the evolution of deep convection. X-band radars with a 3-cm wavelength have a high spatial-temporal resolution and are suitable for monitoring local deep convections [39]. The beamwidth is 1°, with a range resolution of 1 km. The radar uses the volume coverage pattern (VCP) 21 mode, and the volume scan interval is 6 min, which can effectively track convection activities within 150 km centered at the PL (Pingliang) Station. The radar is located at an altitude of 1650 m ASL and has good sight in the detection region except slight blocking by the mountain ridge in the west. After ground clutter filtering, distance correction, and other quality controls, the raw radar data was transferred from the original polar coordinate to Cartesian coordinates to obtain the combined reflectivity data with a spatial resolution of 1 km.
In addition, the CSIT (combined storm identification, tracking algorithm) algorithm [40] was used to automatically identify convective cells using the 4-neighborhood labeling method and a preset condition of combined reflectivity >30 dBZ and the area >15 km2. The low reflectivity threshold was chosen to detect CI and distinguish from weak echoes generated by stratiform precipitation [41,42], which has been checked visually.

3. Model Result

Deep convection is affected by both synoptic-scale circulations and local environment. The development of convection is more sensitive to changes in the local environment when the synoptic-scale background is relatively weak. In this section, we compared the simulation results with ERA-reanalysis data, radiosonde data, and radar reflectivity data to validate the performance of the WRF model. Moreover, the study area had been cloudless for several days (cloudy on 24, 25 June and sunny during 26–29 June 2017) before the occurrence of the convection. The top soil was dry due to the lack of rainfall and strong evapotranspiration. In the afternoon of June 29, a severe short-duration rainfall, accompanied by hail with diameters up to 7 mm, occurred over the study area.

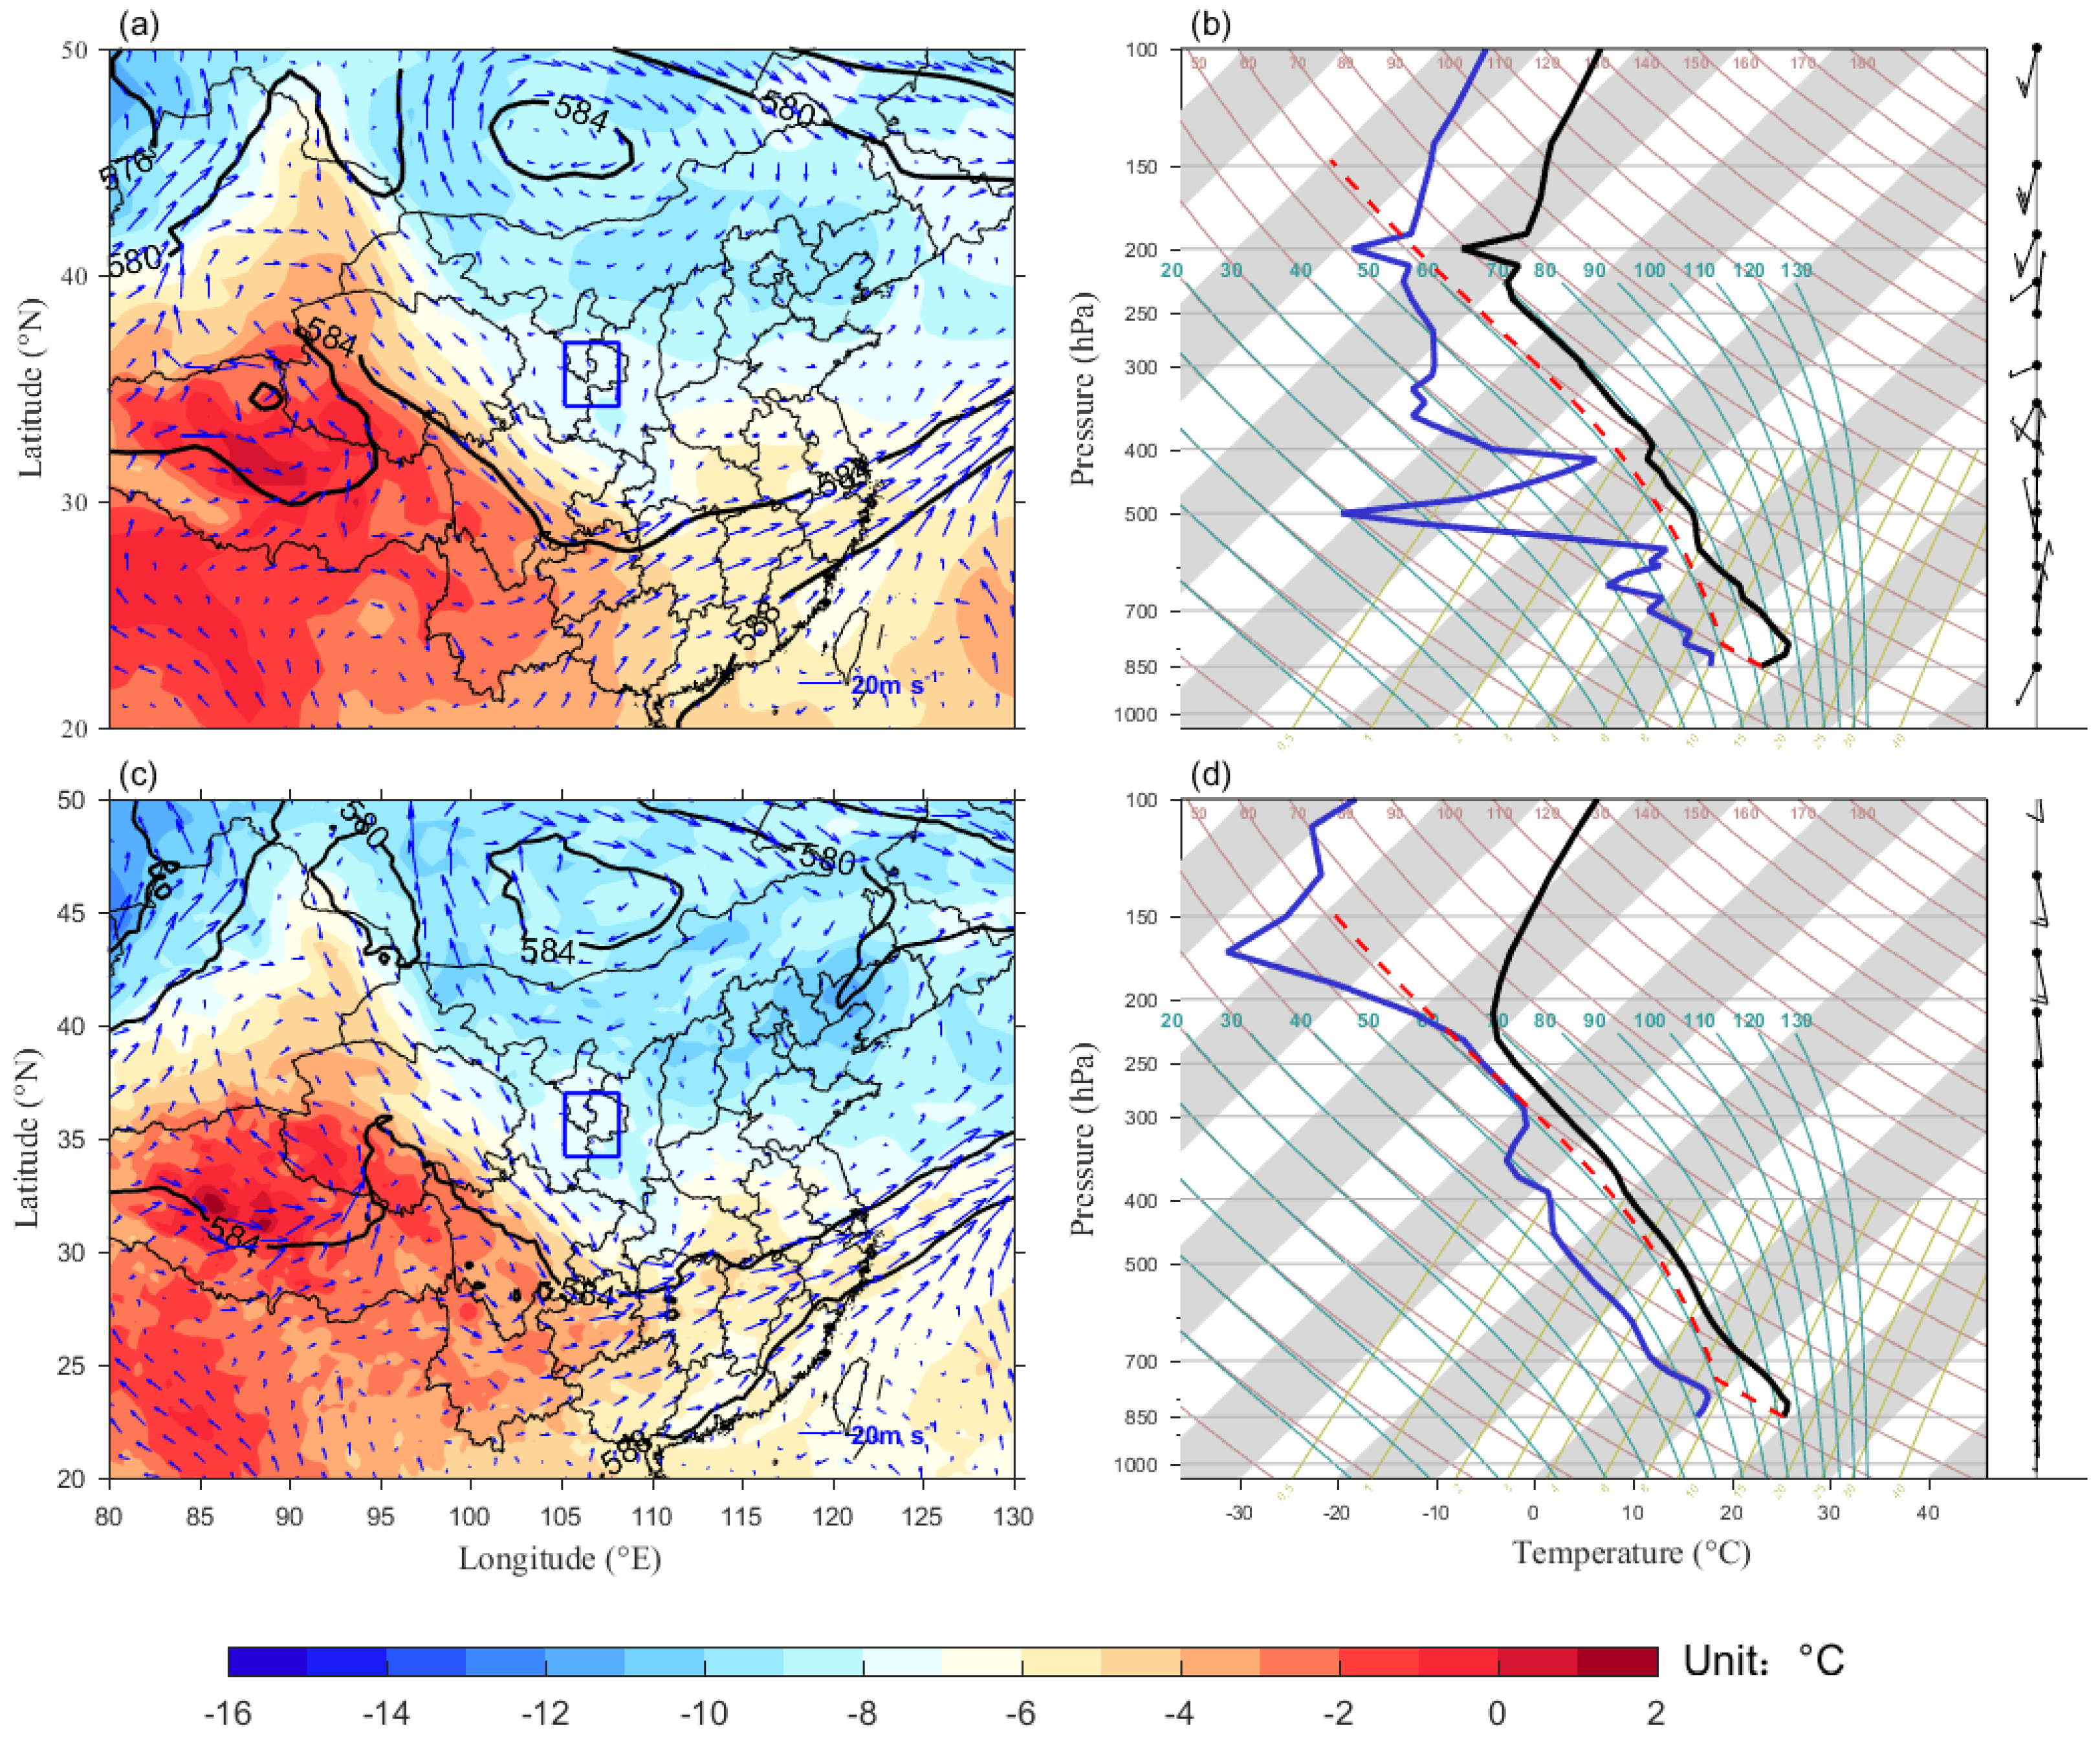
3.1. A Comparison of Large-Scale Circulation and Vertical Atmospheric Structure

As shown on the 500 hPa isobaric level, the west pacific subtropical high (WPSH) dominates the Southeast China, with the 588 gpm contour line located at the southeastern coastal area of China at 0700 LST 29 June 2017 (Figure 2a). At the same time, there was an anticyclone with central geopotential height exceeding 584 gpm to the north of China. Between these two systems, there was a trough of low pressure to the east of the Tibetan plateau, leading to the northwesterly and southwesterly wind before and after the trough respectively. The study area is located between the northern high-pressure and the southern trough, controlled by weak south and southwesterly. On the 850 hPa isobaric level, there was no obvious low-pressure system. Relatively strong warm and humid southerly airflow prevailed in the southeast coastal area, and the study area was still controlled by the weak south wind (Figure not shown). WRF can well simulate the large-scale circulation with the northern high pressure slightly at lower latitudes and larger in area compared with the ERA-Interim data (Figure 2c).
To facilitate the comparison of WRF results with radiosonde observations, we compared the simulated values at the grid that was closest to the radiosonde site. The difference of terrain height between the PL station and the nearest grid point was small (86 m), thus the impact of the elevation difference was minimal. The radiosonde data showed that the air temperature gradually decreased from 800 hPa, and increased from 200 hPa at 0615 LST June 29 (Figure 2b). The humidity decreased rapidly with altitude below 500 hPa, but increased rapidly with altitude between 400 and 500 hPa, indicating an obvious dry air intrusion in the middle troposphere. The observed wind veered anticlockwise from northeast to northwest and then southwest at the lower to middle troposphere. The CAPE and CIN was both zero, showing an unfavored environment for convection.
WRF simulated air temperature compared well with the observation (Figure 2d). However, WRF did not capture the vertical variation of humidity, and missed the dry air intrusion in the middle troposphere. In addition, a consistent southerly wind was simulated throughout the whole troposphere, with calm wind at low to middle levels. The CAPE (33 J) and CIN (76.3 J) were a little higher than the observation.
Overall, the WRF model performs well in simulating the background large-scale circulation although there remains inconsistency in the vertical structure of the planetary boundary layer (PBL) before CI between simulation and observation.

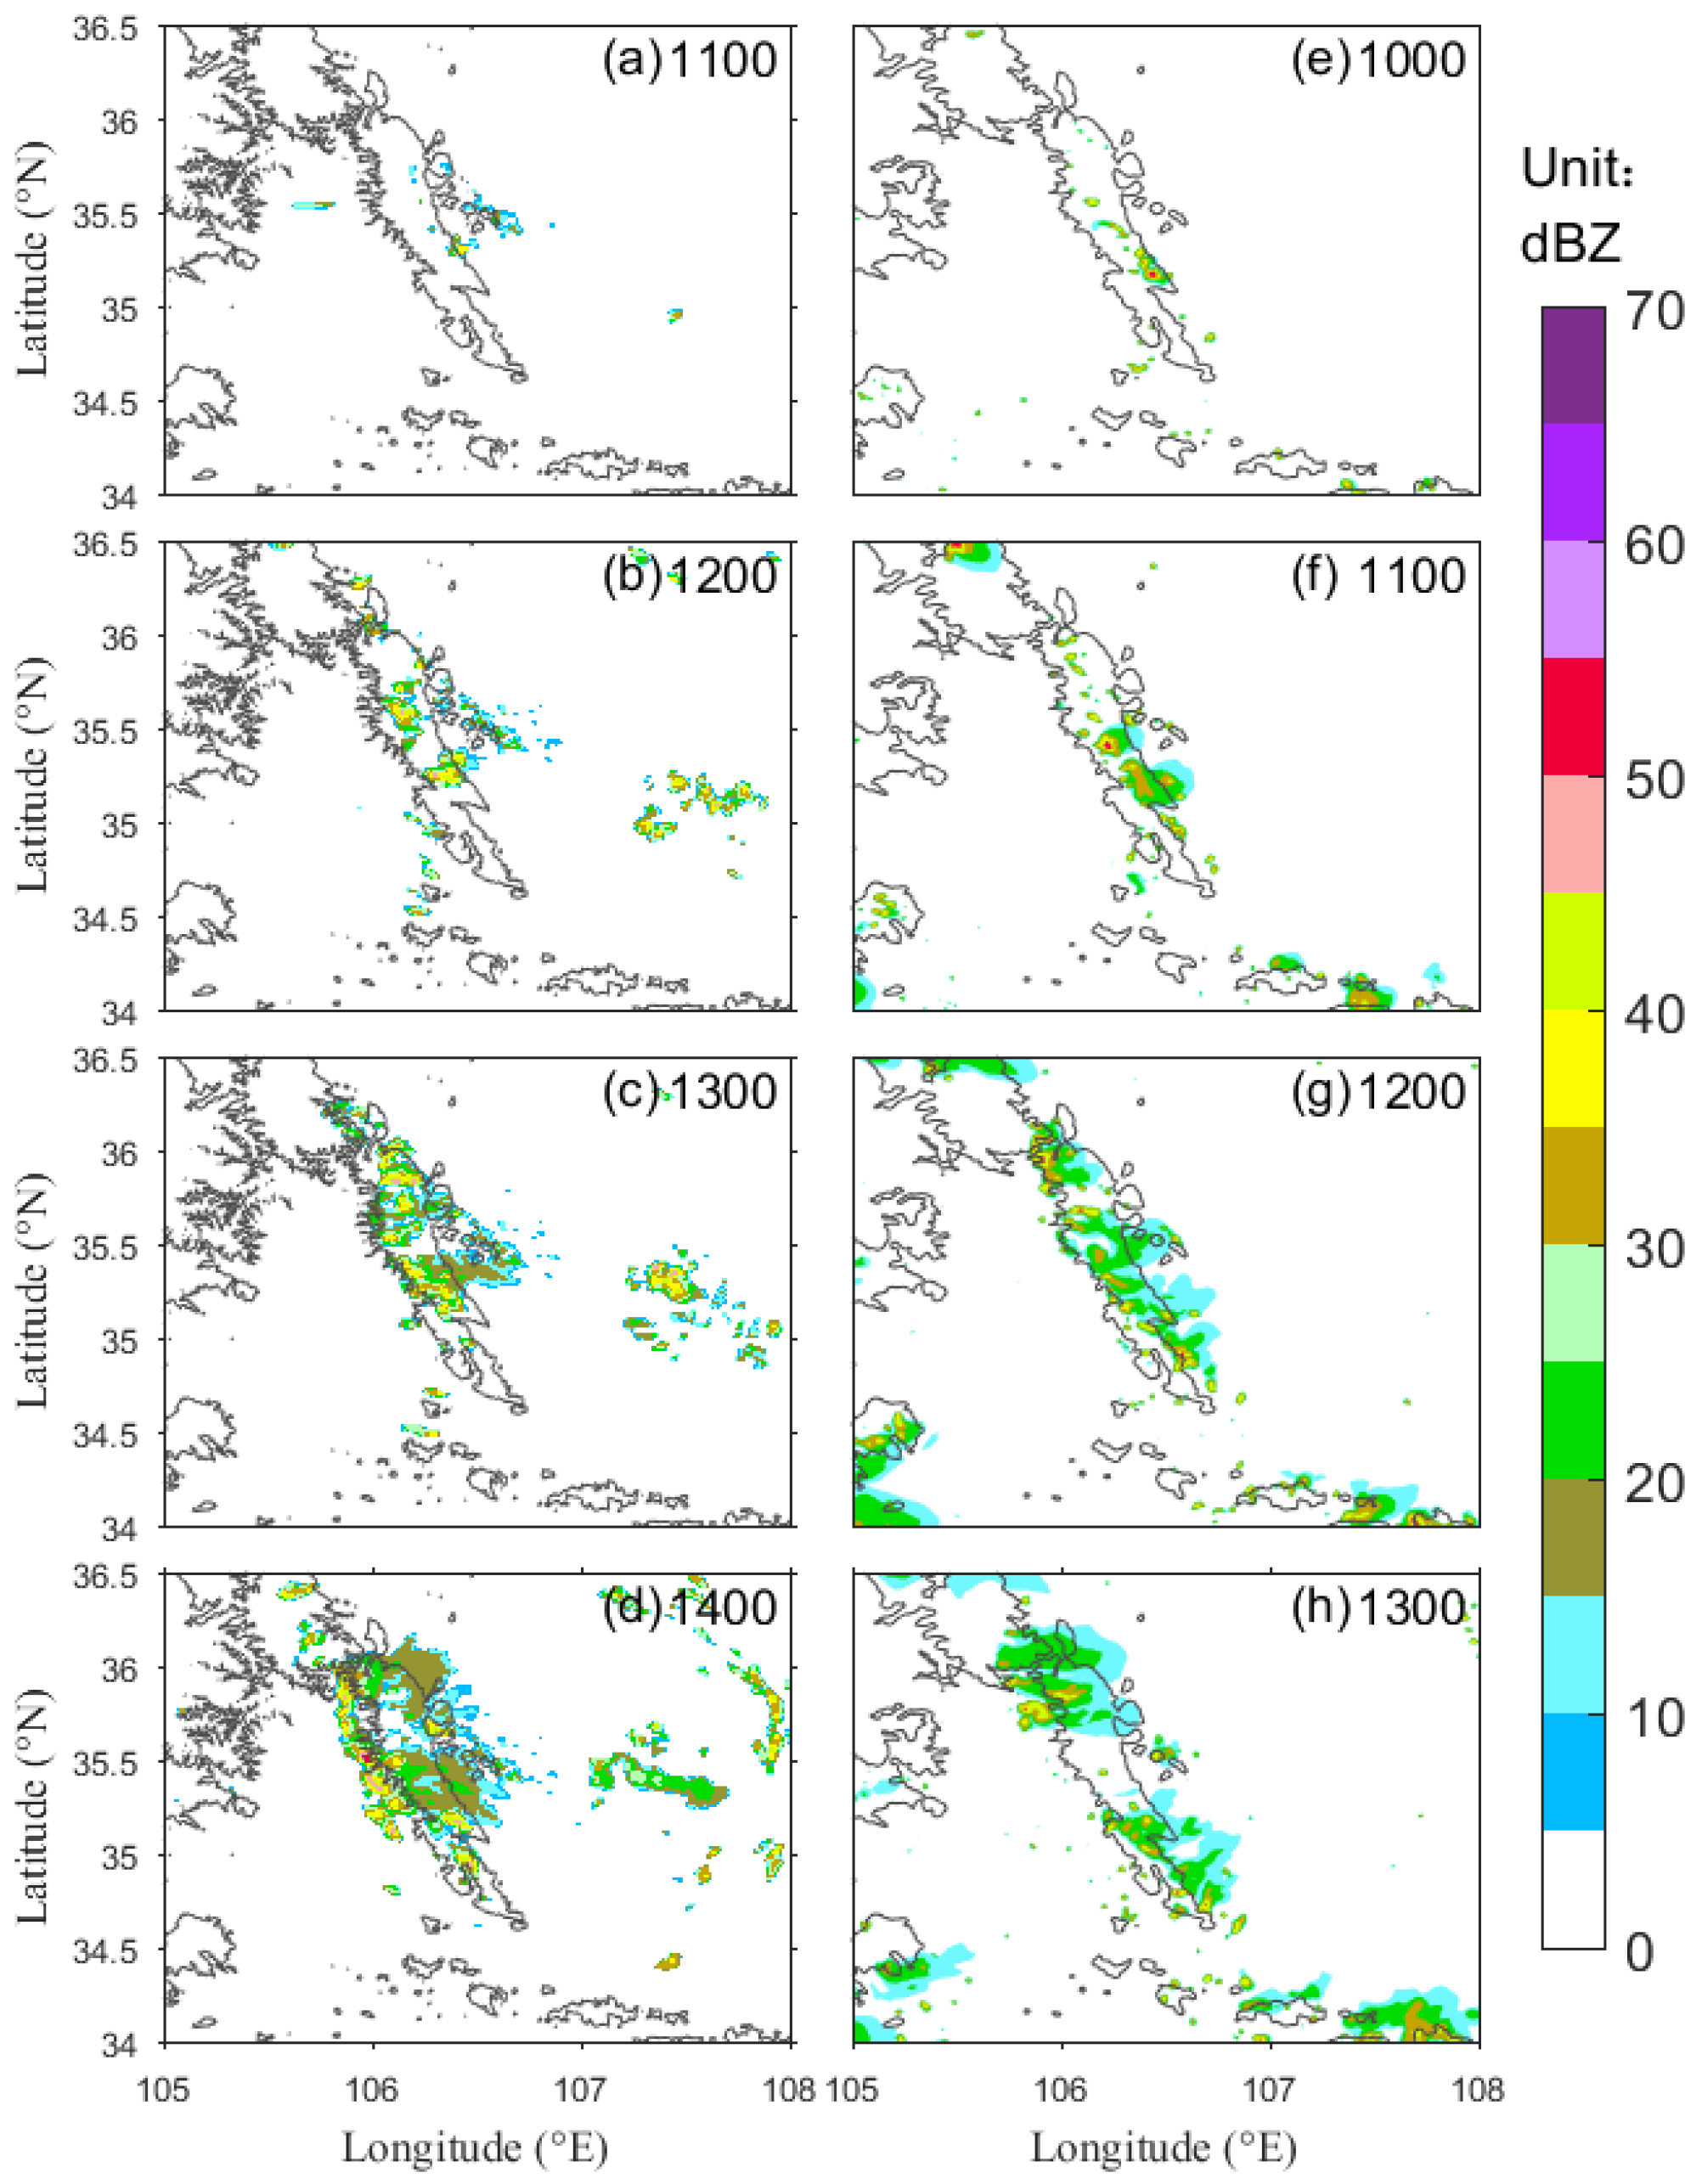
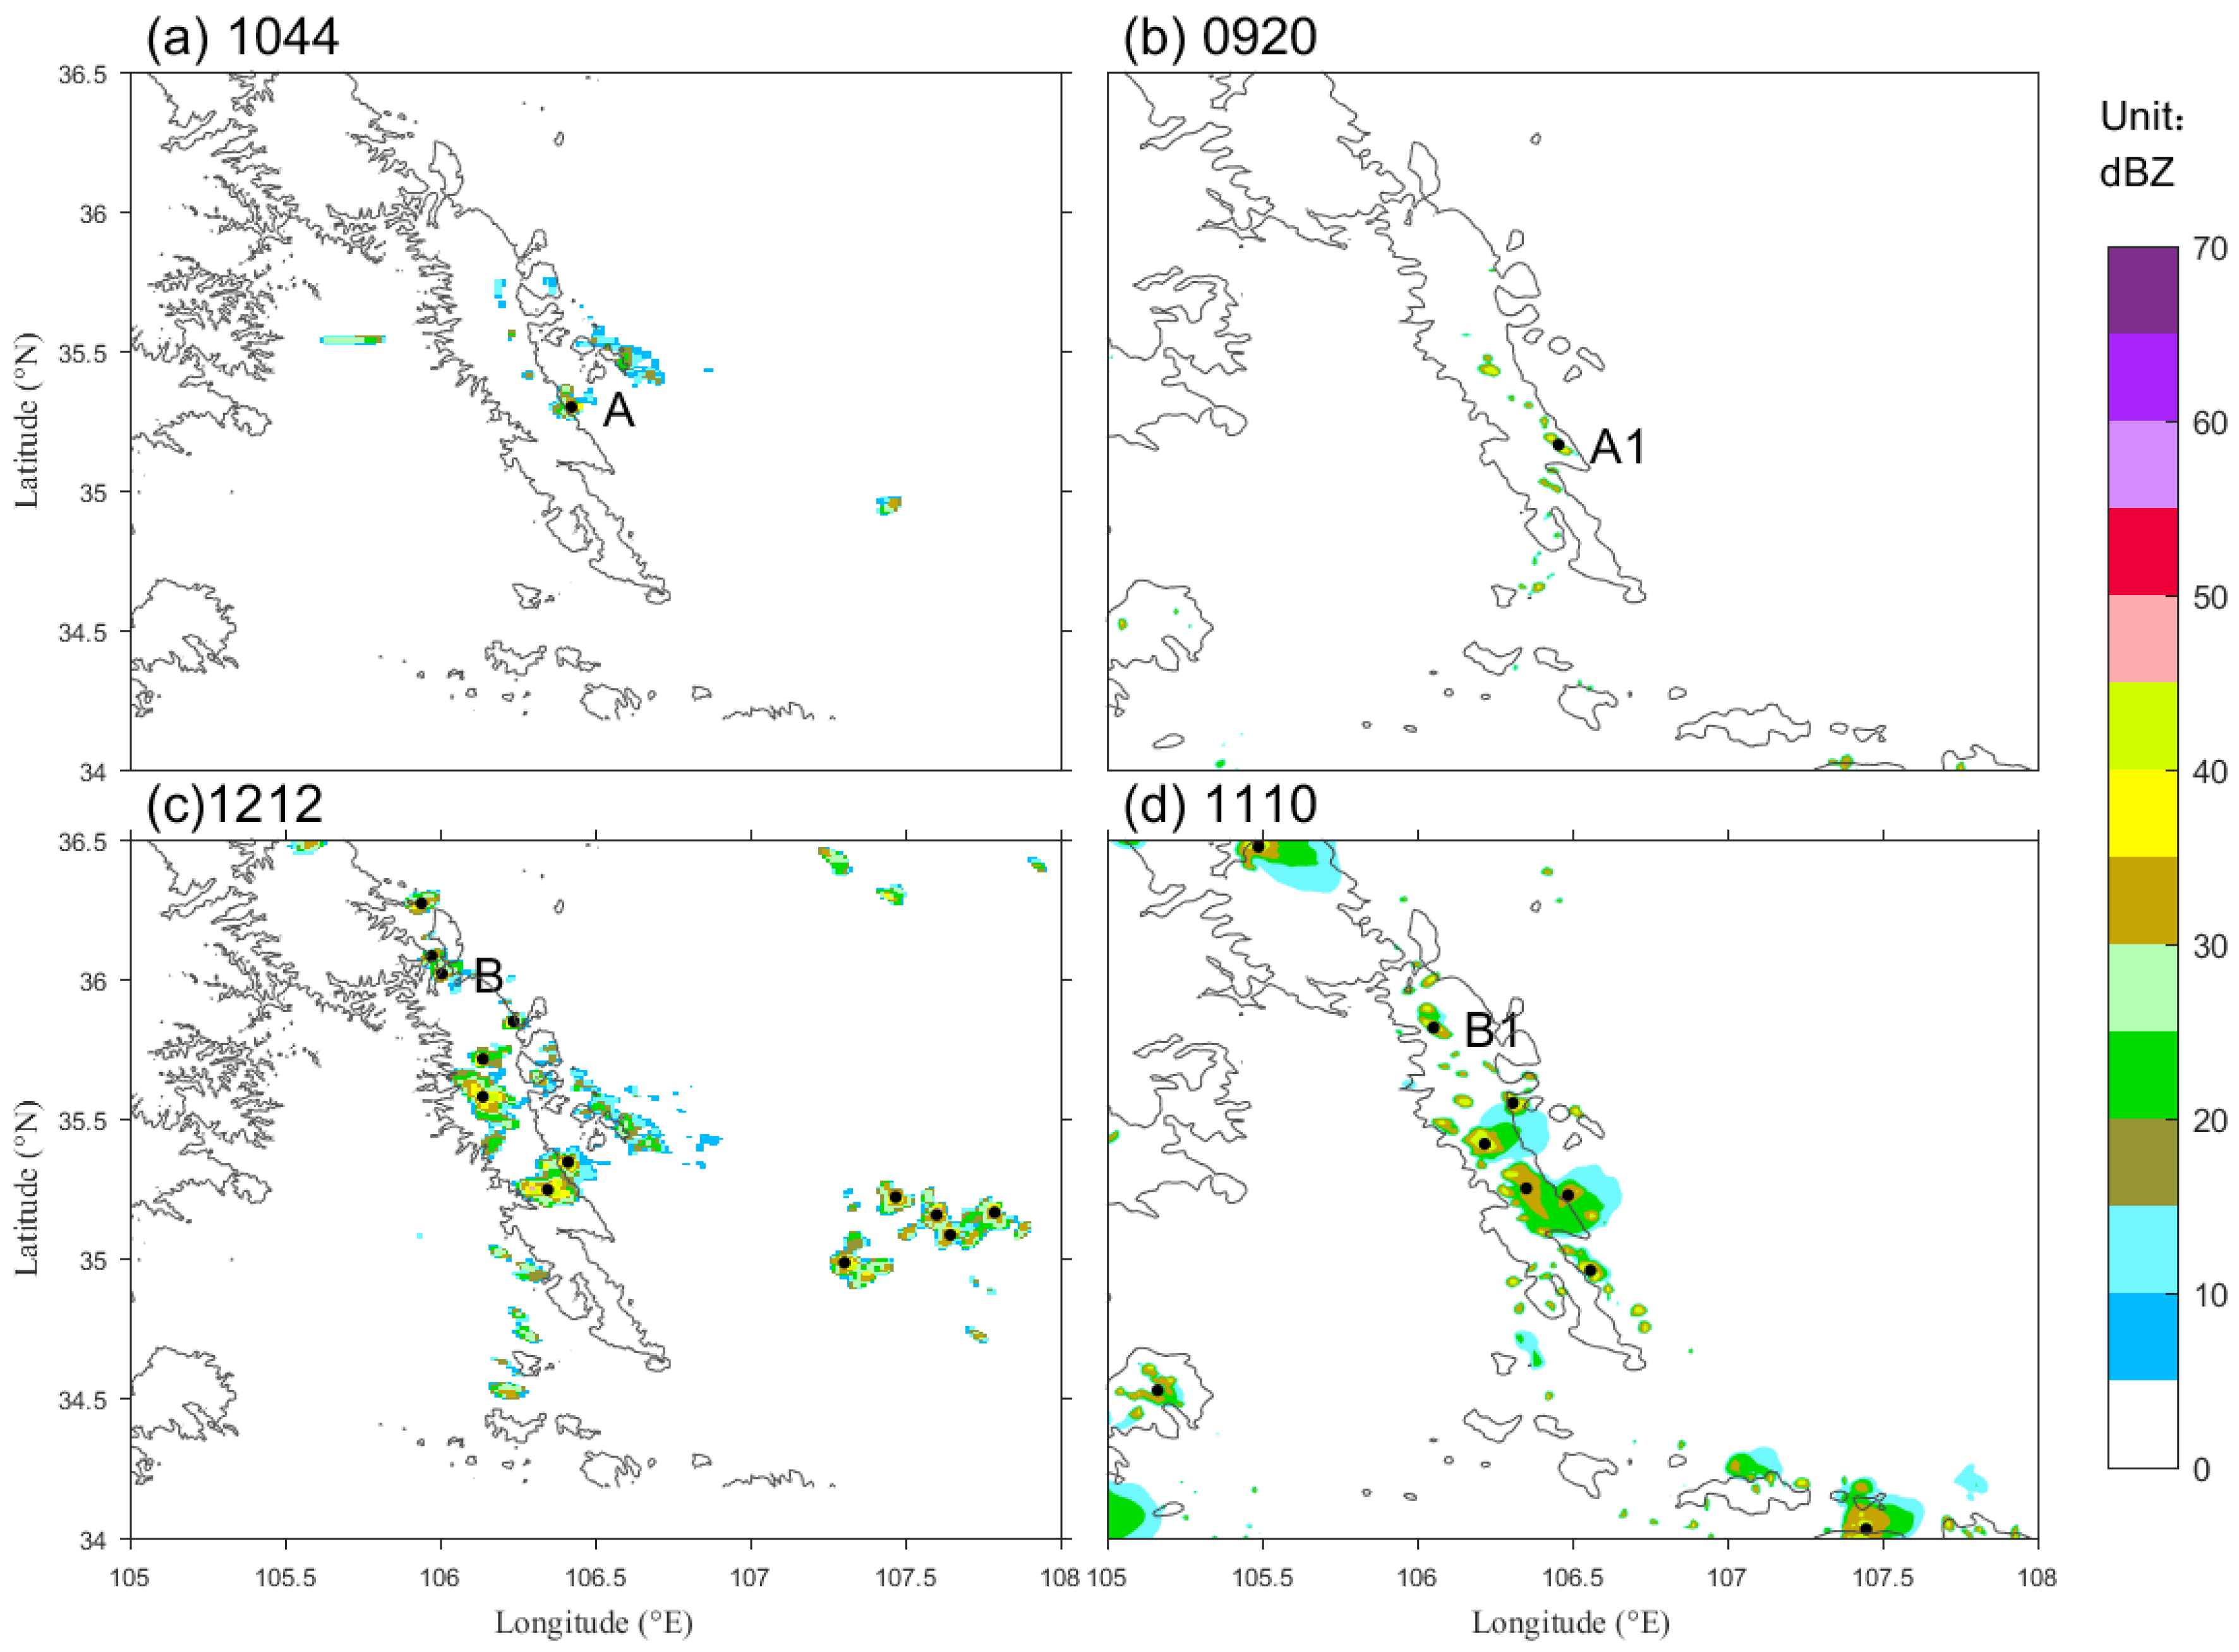
3.2. Comparison of Radar Reflectivity

We further validate the performance of WRF in simulating the initiation of convection (Figure 3). The radar observation showed the convection was initiated in the middle of LPMs at 1100 LST (Figure 3a), and then multiple convective cells occurred along the ridge at 1200 LST (Figure 3b). These convective cells moved slowly to the northwest and more convective cells were enhanced locally with composite reflectivity exceeding 45 dBZ at 1300 LST (Figure 3c). By 1400 LST, these convective cells moved to the west of the LPMs, merged to a linear multicell storm along the 2000 m terrain contour (Figure 3d). The multicell storm gradually weakened as it moved slowly westward, causing a large area of the stratiform in the mountain region. The combined radar reflectivity simulated by WRF was generally consistent with the observation except that the simulated convection was triggered about one hour earlier. Moreover, the convective cells in the middle of the mountain rapidly dissipated at 1300 LST, thus not producing the multicell with the same area and magnitude as the observations (Figure 3h). Convections triggered in the southeast and moved from the outside of the study area were not concerned in this study.
The triggered convection did not necessarily develop into deep convection, we therefore focused on the initiations of deep convection. Two initiations were identified in observations marked as A (Figure 4a) and B (Figure 4c). A is the first initiation point that occurred at 1044 LST in the middle of the mountain; while B was initiated at 1212 LST in the north of the mountain. As for WRF, the first convection was triggered at point A1 at 0920 LST in the middle of the mountain and at point B1 at 1110 LST in the north of the mountain (Figure 4b,d). Generally, the locations of the observed and the simulated convection initiation were quite similar, but the timing of convection initiations are different. The simulated convections tend to be triggered earlier than observations.
The above comparative analysis indicates a good performance of WRF in simulating the position and the intensity of convection. The location of CI simulated by WRF almost overlaps with that observed. The simulated CI occurred slightly earlier than the observation by 1 h. Although the WRF model failed to reproduce the convective enhancement (CE) at 1400 LST, the simulated CI is consistent with the observation in terms of time and location. In general, the WRF model well simulates the CI process of this deep convection, and the high-resolution data from the model can be used to perform a further mechanism analysis.

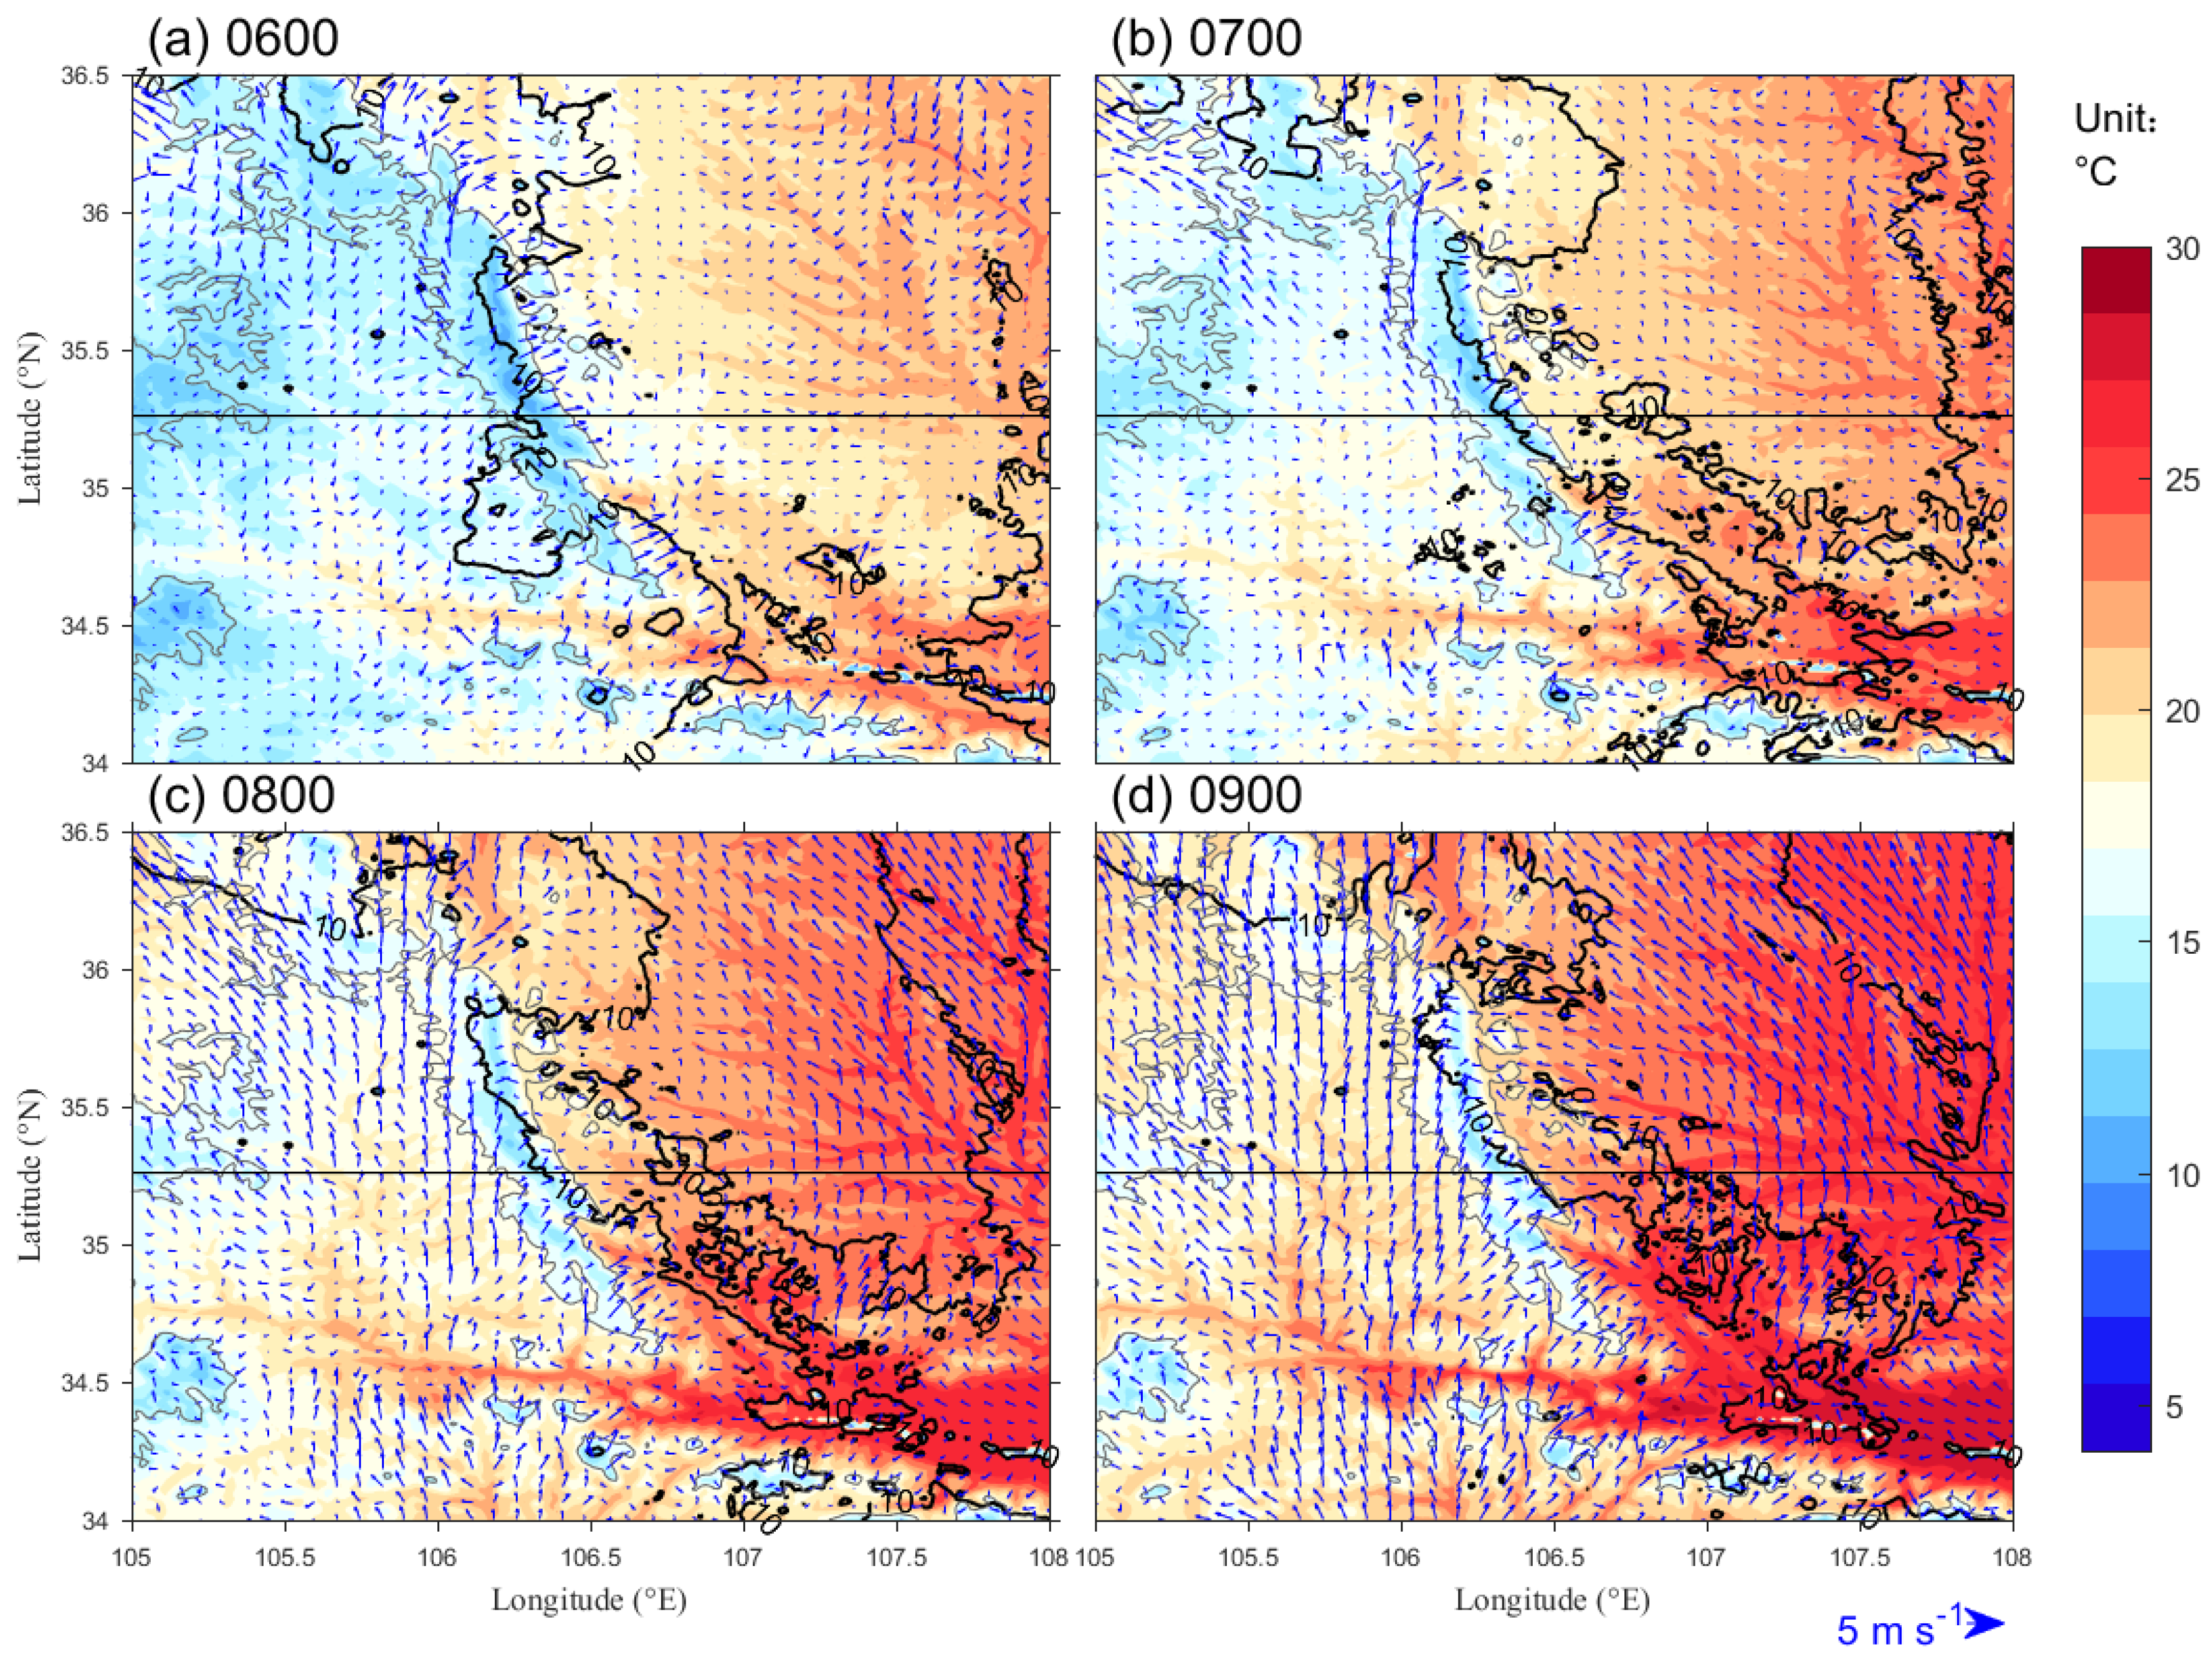
3.3. Horizontal Structure

To explore the triggering factors of CI and reveal the related physical mechanisms, multiple simulated variables, such as wind, temperature, specific humidity, relative vorticity, and the water vapor flux, were diagnosed.
The 10-m wind, 2-m temperature, and humidity from the CNTL experiment were analyzed as shown in Figure 5. Downwind from the mountain ridge controlled the north mountain ridge and the east side of LPMs at 0600 LST. With the increase of solar radiation, the downwind gradually weakened, and the near-surface temperature and humidity began to rise (Figure 5b). The near-surface wind speed began to increase at 0800 LST, and the wind direction was mainly southerly as the stronger southerly winds began to control the study area. Later, the wind speed on the west side of the mountain increased due to the transition of mountain wind to valley wind, while the speed on the east side of the mountain was weak due to the mountain blockage (Figure 5c). The wind direction changed to southeast in the east side of the mountain after passing LPMs at 0900 LST. Low-level convergence appeared near the ridge of the mountain due to the mechanical forced flow (Figure 5d).
Low-level water vapor mainly comes from external transport and local evapotranspiration [43]. The southerly was divided into two branches, i.e., the east and the west parts, below 700 hPa due to the blocking of LPMs, moistening the low-level atmosphere at the east side of the mountain. A weak moisture flux convergence (MFC) was also observed at 0800 LST in the middle of the mountain ridge. Besides, a weak divergence and positive relative vorticity were located at the position of the two CIs (A1 and B1) at 0600 LST at 850 hPa, and the intensity then became weak. At 700 hPa, the corresponding area had negative relative vorticity and weaker updraft in divergence center. The upper wind at 500 hPa distributed in counterclockwise centered on the southern LPMs (figure not shown), leading to easterly in the middle of LPMs. These results indicate that the configuration of the high-level to low-level wind field was conducive to the occurrence of convection.

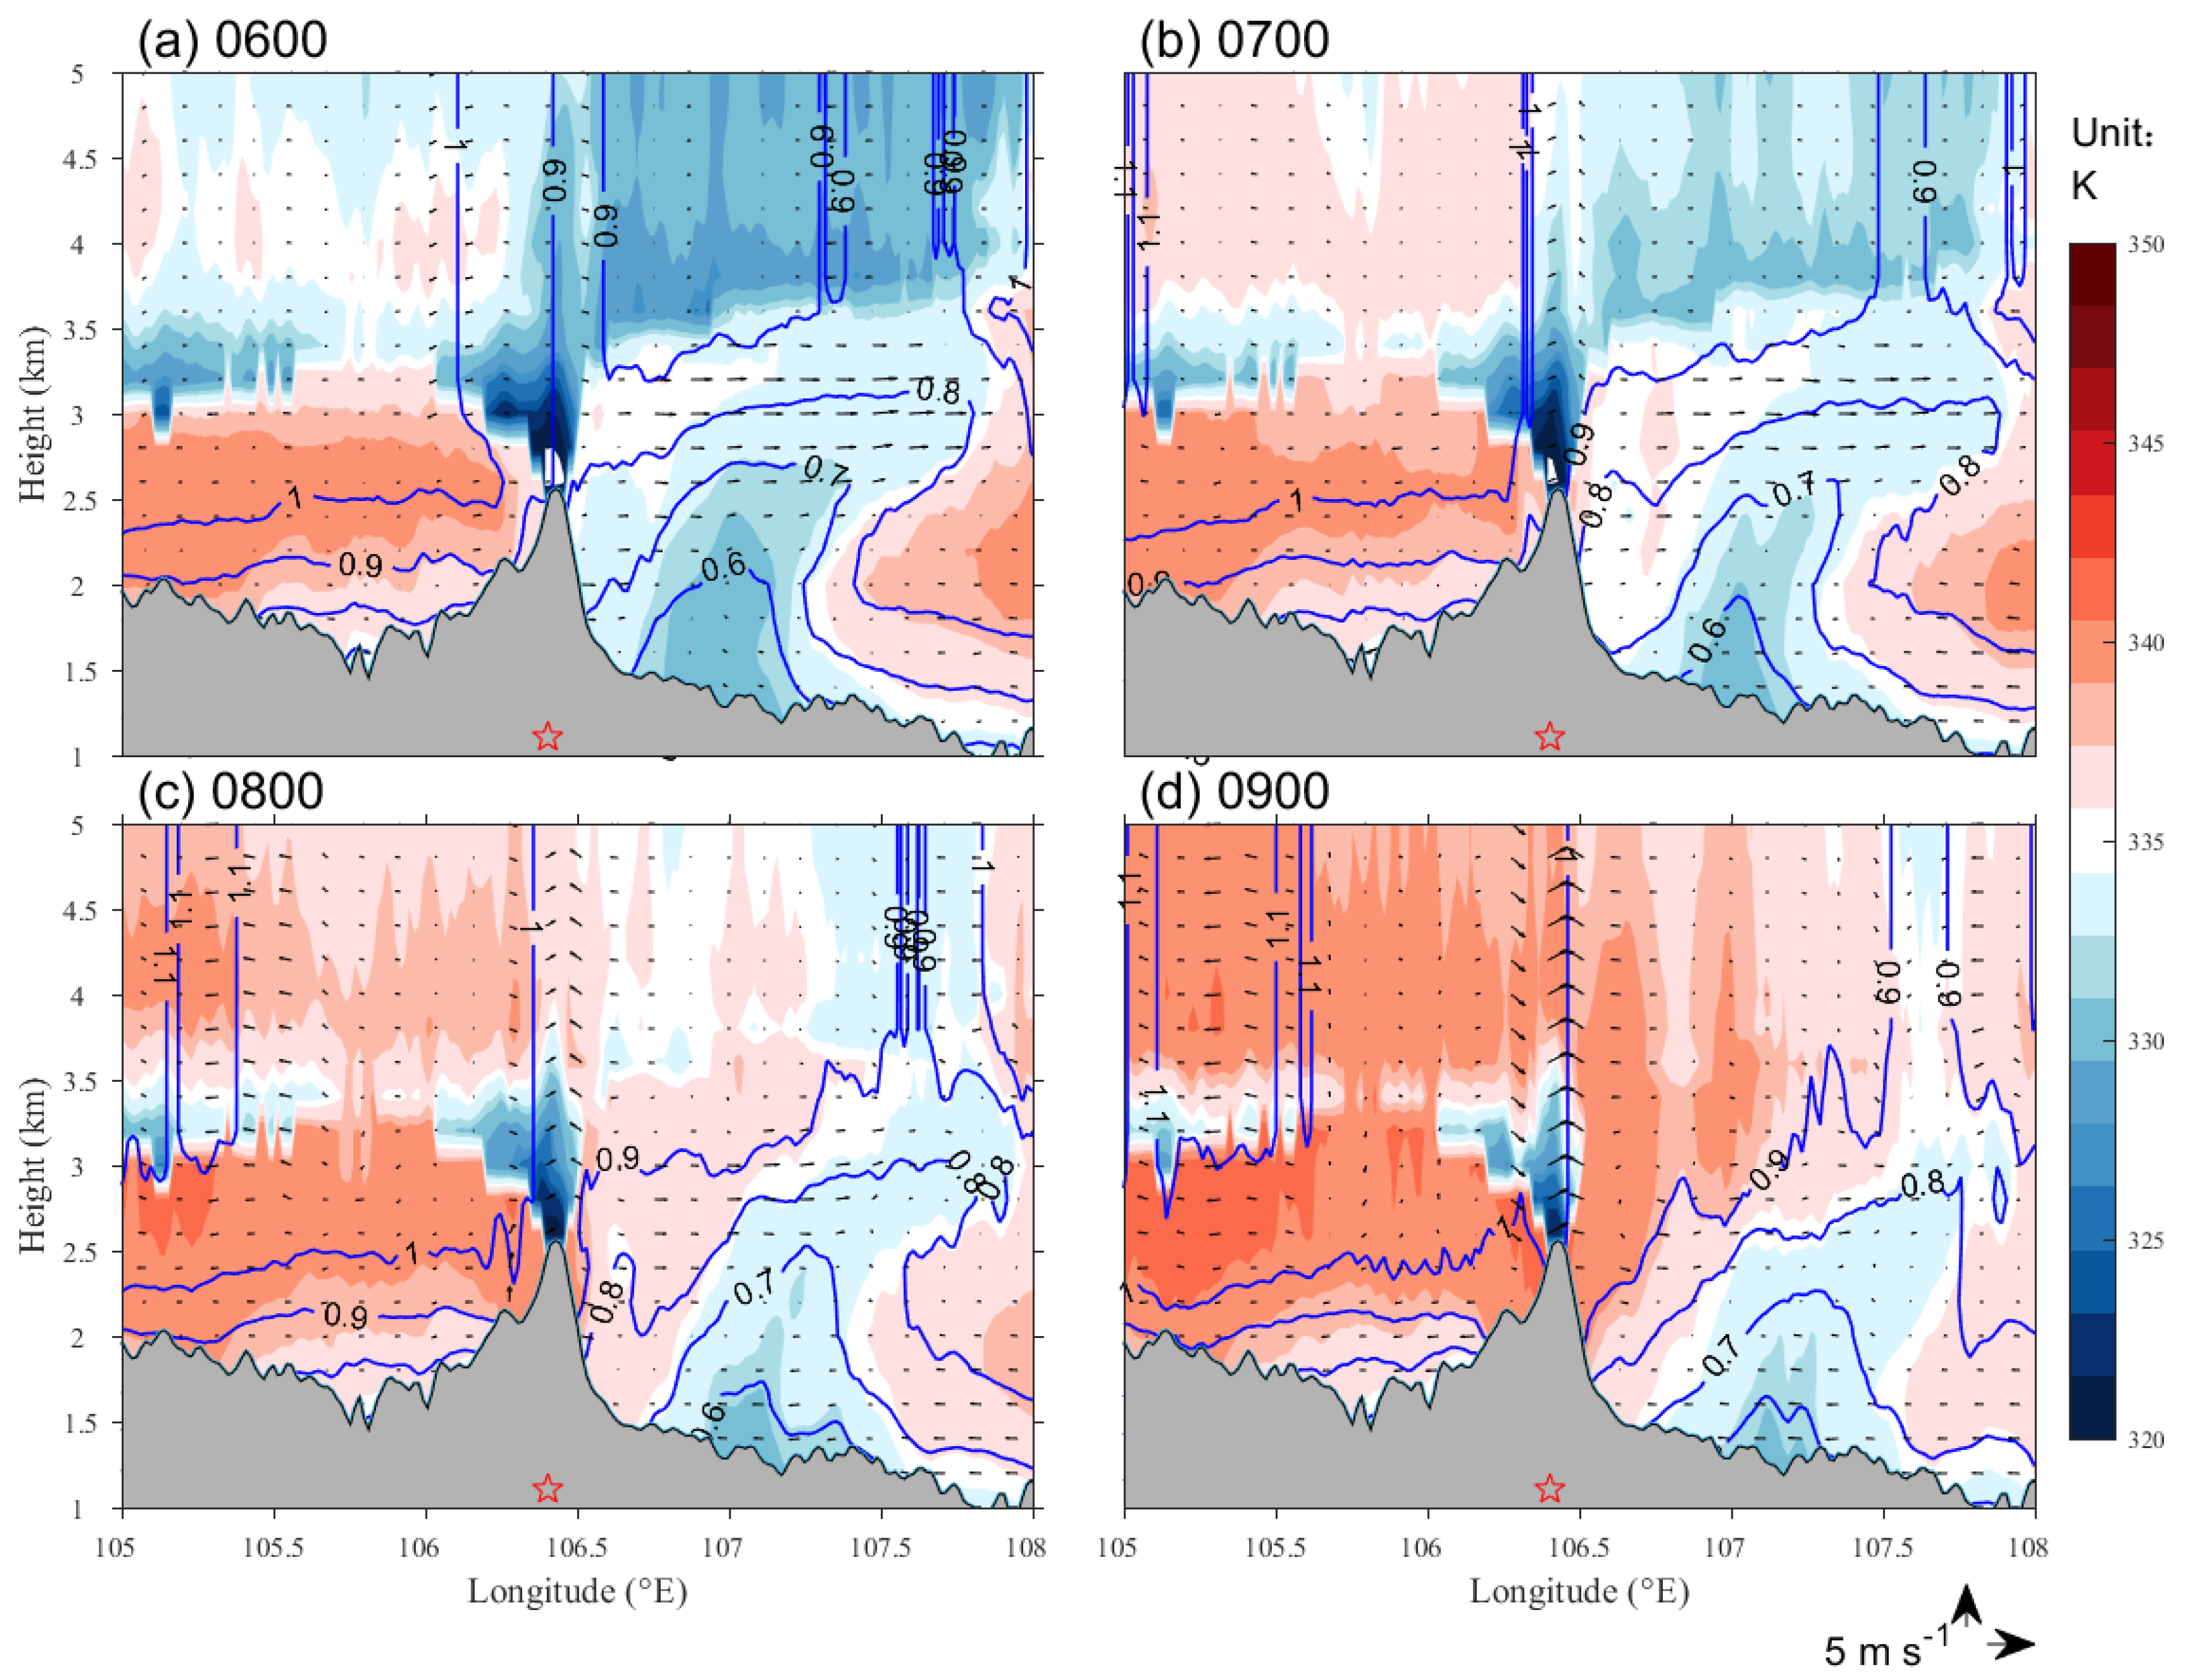
3.4. Vertical Structure

To analyze the vertical structure of the atmospheric boundary layer before CI, a latitudinal cross-section along the CI point A1 (35.26° N, 106.4° E) was drawn, as shown in Figure 6. The pseudo-equivalent temperature was characterized by a high value on the western side of the mountain, a low value near the eastern side of the mountain, and another high value away from the mountain. The dense contours of pseudo-equivalent temperature near the mountain ridge indicate unstable air and large unstable energy near the mountain ridge. The distribution of specific humidity was consistent with the pseudo-equivalent temperature. There was a 1-km-thick layer of warm and humid air extending to the top of the mountain on the western side of the mountain (Figure 6a), while cold and dry air prevailed on the eastern side. After sunrise, the air near the mountain ridge began to heat up due to surface heating, accompanied by the decrease of a cold center area (Figure 6b). The difference in elevation between the ridge and the foothills on both sides resulted in a stronger upslope on the western side and a weaker one on the eastern side at 0800 LST (Figure 6c). A strong updraft appeared at 0900 LST at the mountain ridge, which generated a convective cell with intensity greater than 30 dBZ at 0920 LST (CI point A1). A similar temperature and humidity distribution were observed at the CI point B1 at 1110 LST on the northern ridge of LPMs. A comparison of the temperature and humidity profiles at the two CI points indicates that the CAPE (CIN) of the CI point B1 (CAPE: 350.89 J; CIN: 3.25 J) on the northern ridge was lower (bigger) than that of A1 (CAPE: 594.4 J; CIN: 0 J) in the central ridge in the early morning (0900 LST), which is the main reason why B1 appeared later than A1.

3.5. The Trigger Mechanism of CI

According to the analysis in the previous subsections, it can be seen that the atmosphere was unstable before CI. The configuration of high-level and low-level wind, water vapor, and thermal conditions were all conducive to the development of convection. The mechanically forced flows by the terrain generated an updraft on the windward slope and convergence around the mountain ridge under the background of the southerly wind. The moist updraft heated by the land surface triggered the convection due to the unstable energy and accumulation of water vapor. The timing of CI at point B1 over dry soil was later than point A1, and was closer to the observation, though the low-level wind, temperature and humidity conditions were more conducive to convection. Soil moisture may influence the timing of CI as the wind speed, CAPE, and CIN over the dry surface are all greater than that over the wet surface. In general, the combined effect of soil moisture and topography during the convection process resulted in a boundary layer environment conducive to CI. A series of sensitivity experiments were designed to further analyze the impact of topography and soil moisture on CI in the following section.

4. Results of Sensitivity Experiments

The CI points in the control and sensitivity experiments were identified using the CSIT algorithm proposed by Zan et al. [40]. It was found that the initiation time of A1 was 0920 LST in CNTL, and 1000 LST in SMHOM, respectively; while B1 appeared in CNTL at 1110 LST, and at 1050 LST respectively in SMHOM. In NOMOUNT, few convective cells were identified. The above analysis indicates that the topography was the most important factor affecting the occurrence of CI, while the spatial distribution of soil moisture would affect the triggering time of convection.
It can be seen from Figure 7a that there were some weak echoes along the ridge of LPMs at 0920 LST in CNTL. The study area was dominated by southerly winds. From the difference of the wind field between the CNTL and the NOMOUNT experiments in Figure 7b, it can be found that the presence of the mountain in CNTL enhanced the convergence at the ridge, which further suggested that terrain is an important factor for the occurrence of CI for the studied case. In Figure 7c, there were weak convergences in the transition area of wet and dry soil (between 0.18 and 0.2 m3 m−3) in the south of the innermost domain. These results indicate that the spatial heterogeneity of soil moisture would enhance local low-level wind speed and convergence.
Spatial distribution of the near-surface temperature, specific humidity, pseudo-equivalent temperature, and other variables in the sensitivity experiments also changed compared with the CNTL experiment. Warm and humid (cold and dry) air exhibited on the western (eastern) side of the mountain, with a deep cold center on the mountain ridge in different numerical experiments (except the NOMOUNT experiment).
Surface energy, as an important factor driving the development of local circulation, restricts the changes of heat, momentum, and humidity in the PBL [17]. The surface flux is unevenly distributed in space due to the influence of terrain and land use, etc. The difference in the sensible heat flux (SH) and latent heat flux (LH) between 0500 and 0800 in each experiment was calculated to study the variation in surface energy changes before convection (Figure 8). SH increased in the middle and south of the ridge through the surface heating in the CNTL and SMHOM experiments. As for LH, it increased in the middle of the ridge and the southern foothills in the CNTL and SMHOM experiments (figure not shown). The above results showed that removing terrain reduced the SH near the ridge, meanwhile, the non-uniform distribution of soil moisture effected the partitioning of surface energy and its spatial distribution.
The above analysis shows that CI was affected by the topography and soil moisture collectively. In the NOMOUNT experiment, none of the convective cells were initiated in the area where the original mountain was located, suggesting the importance of terrain in triggering convection. However, the near-surface wind speeds and the changes of CI in the north of the ridge in the SMHOM experiments indicate that the effect of soil moisture cannot be ignored. The terrain induced convergence on the ridge by blocking the southerly airflow, and the spatial distribution of soil moisture changed the local low-level wind. The continuous accumulation of energy in the ridge and the dry surface due to the heterogeneous distribution of terrain and soil moisture affected the timing and location of CI by altering the strength of the local circulation.

5. Conclusions and Discussion

The initiation of a linear multicell storm in Liupan Mountain, west of the Loess Plateau, on 29 June 2017, was examined based on radar observation data, reanalysis data, and high resolution (1.33 km) simulation using the WRF model. Impacts of both topography and soil moisture on the initiation of deep convection under weak synoptic forcing were analyzed. The vertical atmospheric structure was adjusted by the land surface heating and evapotranspiration after the sunrise, making the local environment conducive to the occurrence of convection. The water vapor and wind field were also changed due to the collective influences of the southerly wind, the blockage of LPMs, and the heterogeneous distribution of soil moisture. Specifically, the LPMs divided the southerly airflow into two branches: the west flow, which was warm and humid as a result of the altitude difference and dry surface, was forced to lift along the mountain, while the east flow, which was dry and cold, was blocked by the steep ridge. With the accumulation of CAPE and water vapor, a strong updraft emerged by the convergence in the middle of the ridge, and triggered the convection. Meanwhile, the initiation time of convection in the north of the ridge was later than that in the middle of the ridge due to a larger CIN.
By removing the LPMs and modifying the spatial distribution of soil moisture, the impacts of topography and soil moisture on CI was discussed. Sensitivity experiments show that topography and soil moisture can affect the time, location, and intensity of CI through the modification of near-surface energy partition and its spatial distribution, the spatial distribution of the wind field and water vapor, etc.
In this paper, through the diagnosis of near-surface thermodynamic conditions and wind field based on observations and sensitivity experiments, the physical mechanism of CI is analyzed to provide insight into the collective influences of complex terrain and the spatial distribution of soil moisture. Results show that not only the terrain but also the heterogeneous distribution of soil moisture led to the low-level convergence through the alteration of land surface energy partitioning. It is consistent with the previous studies, which suggested that the initiation of convection is sensitive to dry soil owing to the impact of soil moisture in terms of modulating surface fluxes and local convergence [44,45,46]. However, these studies were mostly based on ideal simulations and a lack of validation with actual events. This work verifies that soil moisture does influence the timing, location, and intensity under weak synoptic forcing by performing sensitivity experiments on a real case.
Our study helps to deepen the understanding of the CI process and improve the prediction of deep convection in complex terrain. Numerical models, such as WRF, are widely used in analyzing the physical processes of deep convection, but uncertainties still exist in these models. A great majority of uncertainties result from the choice of physical parameterization schemes, such as microphysics, convection, radiation, and PBL schemes, which largely affect the accuracy of the simulated temperature, humidity, and wind field [47,48]. The deviation between observations and model simulations in the vertical structure of PBL in the early morning also leads to uncertainty in convection initiation. Model ensembles have been used to improve the robustness of model results, which will be investigated in our future work.
More cases under a weak synoptic background and high-resolution simulations are needed in the future to obtain a robust physical mechanism to enhance the capacity of the model ulteriorly. Previous studies have pointed out that the relationship of SMP is largely depended on the data source of the soil moisture [49,50], so more precise data with high spatial-temporal resolution, such as SMOS (Soil Moisture and Ocean Salinity), GLDAS (Global Land Data Assimilation Systems), and ERA5 (European Centre for Medium-Range Weather Forecasts Reanalysis 5) [51,52], is necessary to improve the model initial conditions. Besides, the climatic effects owing to the vegetation changes resulting from the Grain for Green Program (GFGP) over the Loess Plateau have received huge attention in recent years [30], while few studies have explored its impact on precipitation on convective scales [53]. Considering the background of global warming, rainfall is prone to occur as heavy, short-duration storms [54,55], so land surface processes may play an increasingly indispensable role and the connection between precipitation and vegetation and soil moisture deserves more attention.

Author Contributions

Conceptualization, Y.Y.; Data curation, T.Z.; Formal analysis, B.Z.; Funding acquisition, Y.Y.; Investigation, B.Z.; Methodology, B.Z.; Project administration, J.L.; Resources, G.Z.; Software, L.D.; Validation, B.Z.; Visualization, B.Z.; Writing—original draft, B.Z.; Writing—review & editing, Y.Y. All authors have read and agreed to the published version of the manuscript.

Funding

This research was funded by the National Key Basic Research and Development Program of China (grant number 2018YFC1505701), National Natural Science Foundation of China (grant number 41575014), The Second Tibetan Plateau Scientific Expedition and Research (STEP) program (grant number 2019QZKK0102) and the Youth Fund of Northwest Institute of Eco-Environmental Resources, Chinese Academy of Sciences (grant number Y851D21001).

Acknowledgments

Technical support was provided by Technology Service Center, Northwest Eco-Environmental Resources Research Institute of Chinese Academy of Sciences. Thanks to the anonymous reviewers for their constructive comments and suggestions for the manuscript.

Conflicts of Interest

The authors declare no conflict of interest.

References

  1. Miyamoto, Y.; Yamaura, T.; Yoshida, R.; Yashiro, H.; Tomita, H.; Kajikawa, Y.; Xu, L.; Middlebrook, A.M.; Liao, J.; Gouw, J.A.; et al. Precursors of deep moist convection in a subkilometer global simulation. JGR Atmos. 2016, 121, 12080–12088. [Google Scholar] [CrossRef]
  2. Yano, J.-I.; Ziemiański, M.Z.; Cullen, M.; Termonia, P.; Onvlee, J.; Bengtsson, L.; Carrassi, A.; Davy, R.; Deluca, A.; Gray, S.L.; et al. Scientific Challenges of Convective-Scale Numerical Weather Prediction. Bull. Am. Meteorol. Soc. 2018, 99, 699–710. [Google Scholar] [CrossRef]
  3. Keat, W.J.; Stein, T.H.M.; Phaduli, E.; Landman, S.; Becker, E.; Bopape, M.J.M.; Hanley, K.E.; Lean, H.W.; Webster, S. Convective initiation and storm life cycles in convection-permitting simulations of the Met Office Unified Model over South Africa. Q. J. R. Meteorol. Soc. 2019, 145, 1323–1336. [Google Scholar] [CrossRef] [Green Version]
  4. Kain, J.S.; Coniglio, M.C.; Correia, J.; Clark, A.J.; Marsh, P.T.; Ziegler, C.L.; Lakshmanan, V.; Miller, S.D.; Dembek, S.R.; Weiss, S.J.; et al. A Feasibility Study for Probabilistic Convection Initiation Forecasts Based on Explicit Numerical Guidance. Bull. Am. Meteorol. Soc. 2013, 94, 1213–1225. [Google Scholar] [CrossRef] [Green Version]
  5. Madaus, L.E.; Hakim, G.J. Constraining ensemble forecasts of discrete convective initiation with surface observations. Mon. Weather Rev. 2017, 145, 2597–2610. [Google Scholar] [CrossRef]
  6. Weckwerth, T.M.; Parsons, D.B. A Review of Convection Initiation and Motivation for IHOP_2002. Mon. Weather Rev. 2006, 134, 5–22. [Google Scholar] [CrossRef]
  7. Browning, K.A.; Blyth, A.M.; Clark, P.A.; Corsmeier, U.; Morcrette, C.J.; Agnew, J.L.; Ballard, S.P.; Bamber, D.; Barthlott, C.; Bennett, L.J.; et al. The convective storm initiation project. Bull. Am. Meteorol. Soc. 2007, 88, 1939–1956. [Google Scholar] [CrossRef]
  8. Wulfmeyer, V.; Behrendt, A.; Kottmeier, C.; Corsmeier, U.; Barthlott, C.; Craig, G.C.; Hagen, M.; Althausen, D.; Aoshima, F.; Arpagaus, M.; et al. The Convective and Orographically-induced Precipitation Study (COPS): The scientific strategy, the field phase, and research highlights. Q. J. R. Meteorol. Soc. 2011, 137, 3–30. [Google Scholar] [CrossRef]
  9. Kirshbaum, D.J.; Adler, B.; Kalthoff, N.; Barthlott, C.; Serafin, S. Moist orographic convection: Physical mechanisms and links to surface-exchange processes. Atmosphere 2018, 9, 80. [Google Scholar] [CrossRef] [Green Version]
  10. Bennett, L.J.; Blyth, A.M.; Burton, R.R.; Gadian, A.M.; Weckwerth, T.M.; Behrendt, A.; Di Girolamo, P.; Dorninger, M.; Lock, S.J.; Smith, V.H.; et al. Initiation of convection over the Black Forest mountains during COPS IOP15a. Q. J. R. Meteorol. Soc. 2011, 137, 176–189. [Google Scholar] [CrossRef] [Green Version]
  11. Weckwerth, T.M.; Bennett, L.J.; Jay Miller, L.; Van Baelen, J.; Di Girolamo, P.; Blyth, A.M.; Hertneky, T.J. An Observational and Modeling Study of the Processes Leading to Deep, Moist Convection in Complex Terrain. Mon. Weather Rev. 2014, 142, 2687–2708. [Google Scholar] [CrossRef]
  12. Scheffknecht, P.; Serafin, S.; Grubišić, V. A long-lived supercell over mountainous terrain. Q. J. R. Meteorol. Soc. 2017, 143, 2973–2986. [Google Scholar] [CrossRef]
  13. Rasmussen, K.L.; Houze, R.A. Convective Initiation near the Andes in Subtropical South America. Mon. Weather Rev. 2016, 144, 2351–2374. [Google Scholar] [CrossRef]
  14. Yu, Y.; He, J.; Zhao, S.; Liu, N.; Chen, J.; Mao, H.; Wu, L. Numerical simulation of the impact of reforestation on winter meteorology and environment in a semi-arid urban valley, Northwestern China. Sci. Total Environ. 2016, 569–570, 404–415. [Google Scholar] [CrossRef] [PubMed]
  15. Taylor, C.M. Detecting soil moisture impacts on convective initiation in Europe. Geophys. Res. Lett. Res. 2015, 42, 4631–4638. [Google Scholar] [CrossRef] [Green Version]
  16. Maurer, V.; Kalthoff, N.; Gantner, L. Predictability of convective precipitation for West Africa: Does the land surface influence ensemble variability as much as the atmosphere? Atmos. Res. 2015, 157, 91–107. [Google Scholar] [CrossRef]
  17. Hohenegger, C.; Stevens, B. The role of the permanent wilting point in controlling the spatial distribution of precipitation. Proc. Natl. Acad. Sci. USA 2018, 115, 5692–5697. [Google Scholar] [CrossRef] [Green Version]
  18. Cioni, G.; Hohenegger, C. A simplified model of precipitation enhancement over a heterogeneous surface. Hydrol. Earth Syst. Sci. 2018, 22, 3197–3212. [Google Scholar] [CrossRef] [Green Version]
  19. Trier, S.B.; Chen, F.; Manning, K.W. A Study of Convection Initiation in a Mesoscale Model Using High-Resolution Land Surface Initial Conditions. Mon. Weather Rev. 2004, 132, 2954–2976. [Google Scholar] [CrossRef] [Green Version]
  20. Taylor, C.M.; De Jeu, R.A.M.; Guichard, F.; Harris, P.P.; Dorigo, W.A. Afternoon rain more likely over drier soils. Nature 2012, 489, 423–426. [Google Scholar] [CrossRef] [Green Version]
  21. Rihani, J.F.; Chow, F.K.; Maxwell, R.M. Isolating effects of terrain and soil moisture heterogeneity on the atmospheric boundary layer: Idealized simulations to diagnose land-atmosphere feedbacks. J. Adv. Model. Earth Syst. 2015, 6, 915–937. [Google Scholar] [CrossRef]
  22. Yang, Y.; Uddstrom, M.; Revell, M.; Andrews, P.; Oliver, H.; Turner, R.; Carey-Smith, T. Numerical Simulations of Effects of Soil Moisture and Modification by Mountains over New Zealand in Summer. Mon. Weather Rev. 2011, 139, 494–510. [Google Scholar] [CrossRef]
  23. Hanley, K.E.; Kirshbaum, D.J.; Belcher, S.E.; Roberts, N.M.; Leoncini, G. Ensemble predictability of an isolated mountain thunderstorm in a high-resolution model. Q. J. R. Meteorol. Soc. 2011, 137, 2124–2137. [Google Scholar] [CrossRef]
  24. Imamovic, A.; Schlemmer, L.; Schär, C. Collective Impacts of Orography and Soil Moisture on the Soil Moisture-Precipitation Feedback. Geophys. Res. Lett. 2017, 44, 11682–11691. [Google Scholar] [CrossRef]
  25. Fu, B.; Wang, S.; Liu, Y.; Liu, J.; Liang, W.; Miao, C. Hydrogeomorphic Ecosystem Responses to Natural and Anthropogenic Changes in the Loess Plateau of China. Annu. Rev. Earth Planet. Sci. 2017, 45, 223–243. [Google Scholar] [CrossRef]
  26. Koster, R.D.; Guo, Z.; Bonan, G.; Chan, E.; Cox, P. Regions of Strong Coupling Between Soil Moisture and Precipitation. Science 2014, 1138, 10–13. [Google Scholar] [CrossRef] [Green Version]
  27. Guan, X.; Huang, J.; Guo, N.; Bi, J.; Wang, G. Variability of soil moisture and its relationship with surface albedo and soil thermal parameters over the Loess Plateau. Adv. Atmos. Sci. 2009, 26, 692–700. [Google Scholar] [CrossRef]
  28. Jia, D.; Wen, J.; Zhang, T.; Xi, J. Responses of soil moisture and thermal conductivity to precipitation in the mesa of the Loess Plateau. Environ. Earth Sci. 2016, 75, 1–13. [Google Scholar] [CrossRef]
  29. Skamarock, W.C.; Klemp, J.B.; Dudhia, J.; Gill, D.O.; Barker, D.M.; Duda, M.G.; Huang, X.Y.; Wang, W.; Powers, J.G. A description of the advanced research WRF version 3 . In NCAR Tech. Note NCAR/TN-475+STR; p. 113. Available online: http://www.mmm.ucar.edu/wrf/users/docs/arwv3.pdf (accessed on 1 June 2020).
  30. Ge, J.; Pitman, A.J.; Guo, W.; Zan, B.; Fu, C. Impact of revegetation of the Loess Plateau of China on the regional growing season water balance. Hydrol. Earth Syst. Sci. 2020, 24, 515–533. [Google Scholar] [CrossRef] [Green Version]
  31. Dee, D.P.; Uppala, S.M.; Simmons, A.J.; Berrisford, P.; Poli, P.; Kobayashi, S.; Andrae, U.; Balmaseda, M.A.; Balsamo, G.; Bauer, P.; et al. The ERA-Interim reanalysis: Configuration and performance of the data assimilation system. Q. J. R. Meteorol. Soc. 2011, 137, 553–597. [Google Scholar] [CrossRef]
  32. Dudhia, J. Numerical study of convection observed during the Winter Monsoon Experiment using a mesoscale two-dimensional model. J. Atmos. Sci. 1989, 46, 3077–3107. [Google Scholar] [CrossRef]
  33. Mlawer, E.J.; Taubman, S.J.; Brown, P.D.; Iacono, M.J.; Clough, S.A. Radiative transfer for inhomogeneous atmospheres: RRTM, a validated correlated-k model for the longwave. J. Geophys. Res. Atmos. 1997, 102, 16663–16682. [Google Scholar] [CrossRef] [Green Version]
  34. Hong, S.; Lim, J. HongandLim_JKMS_WSM6_2006. J. Korean Meteorol. Soc. 2006, 42, 129–151. [Google Scholar]
  35. Kain, J.S.; Kain, J. The Kain-Fritsch convective parameterization: An update. J. Appl. Meteorol. 2004, 43, 170–181. [Google Scholar] [CrossRef] [Green Version]
  36. Hong, S.Y.; Noh, Y.; Dudhia, J. A new vertical diffusion package with an explicit treatment of entrainment processes. Mon. Weather Rev. 2006, 134, 2318–2341. [Google Scholar] [CrossRef] [Green Version]
  37. Jiménez, P.A.; Dudhia, J.; González-Rouco, J.F.; Navarro, J.; Montávez, J.P.; García-Bustamante, E. A revised scheme for the WRF surface layer formulation. Mon. Weather Rev. 2012, 140, 898–918. [Google Scholar] [CrossRef] [Green Version]
  38. Mukul Tewari, N.C.; Tewari, M.; Chen, F.; Wang, W.; Dudhia, J.; LeMone, M.; Mitchell, K.; Ek, M.; Gayno, G.; Wegiel, J.; et al. Implementation and verification of the unified NOAH land surface model in the WRF model. In Proceedings of the 20th Conference on Weather Analysis and Forecasting/16th Conference on Numerical Weather Prediction, Seattle, WA, USA, 14 January 2004; pp. 11–15. [Google Scholar] [CrossRef]
  39. Shah, S.; Notarpietro, R.; Branca, M. Storm Identification, Tracking and Forecasting Using High-Resolution Images of Short-Range X-Band Radar. Atmosphere 2015, 6, 579–606. [Google Scholar] [CrossRef] [Green Version]
  40. Zan, B.; Yu, Y.Y.Y.; Li, J.; Zhao, G.; Zhang, T.; Ge, J. Solving the storm split-merge problem—A combined storm identification, tracking algorithm. Atmos. Res. 2019, 218, 335–346. [Google Scholar] [CrossRef]
  41. Lock, N.A.; Houston, A.L. Spatiotemporal distribution of thunderstorm initiation in the US Great Plains from 2005 to 2007. Int. J. Climatol. 2015, 35, 4047–4056. [Google Scholar] [CrossRef]
  42. Miller, P.W.; Mote, T.L. A climatology of weakly forced and pulse thunderstorms in the southeast United States. J. Appl. Meteorol. Climatol. 2017, 56, 3017–3033. [Google Scholar] [CrossRef]
  43. Wei, J.; Su, H.; Yang, Z.L. Impact of moisture flux convergence and soil moisture on precipitation: A case study for the southern United States with implications for the globe. Clim. Dyn. 2016, 46, 467–481. [Google Scholar] [CrossRef]
  44. Klüpfel, V.; Kalthoff, N.; Gantner, L.; Taylor, C.M. Convergence zones and their impact on the initiation of a mesoscale convective system in West Africa. Q. J. R. Meteorol. Soc. 2012, 138, 950–963. [Google Scholar] [CrossRef] [Green Version]
  45. Min, J.; Guo, Y.; Wang, G. Impacts of Soil Moisture on Typical Frontal Rainstorm in Yangtze River Basin. Atmosphere 2016, 7, 42. [Google Scholar] [CrossRef] [Green Version]
  46. Taylor, C.M.; Parker, D.J.; Harris, P.P. An observational case study of mesoscale atmospheric circulations induced by soil moisture. Geophys. Res. Lett. 2007, 34, 2–7. [Google Scholar] [CrossRef] [Green Version]
  47. Gómez-Navarro, J.J.; Raible, C.C.; Dierer, S. Sensitivity of the WRF model to PBL parametrisations and nesting techniques: Evaluation of wind storms over complex terrain. Geosci. Model Dev. 2015, 8, 3349–3363. [Google Scholar] [CrossRef] [Green Version]
  48. Patel, P.; Ghosh, S.; Kaginalkar, A.; Islam, S.; Karmakar, S. Performance evaluation of WRF for extreme flood forecasts in a coastal urban environment. Atmos. Res. 2019, 223, 39–48. [Google Scholar] [CrossRef]
  49. Yuan, S.; Wang, Y.; Quiring, S.M.; Ford, T.W.; Houston, A.L. A sensitivity study on the response of convection initiation to in situ soil moisture in the central United States. Clim. Dyn. 2020, 54, 2013–2028. [Google Scholar] [CrossRef]
  50. Santanello, J.A.; Lawston, P.; Kumar, S.; Dennis, E. Understanding the impacts of soil moisture initial conditions on NWP in the context of land-atmosphere coupling. J. Hydrometeorol. 2019, 20, 793–819. [Google Scholar] [CrossRef]
  51. Liu, Y.; Yang, Y.; Yue, X. Evaluation of satellite-based soil moisture products over four different continental in-situmeasurements. Remote Sens. 2018, 10, 1161. [Google Scholar] [CrossRef] [Green Version]
  52. Cheng, M.; Zhong, L.; Ma, Y.; Zou, M.; Ge, N.; Wang, X.; Hu, Y. A study on the assessment of multi-source satellite soil moisture products and reanalysis data for the Tibetan Plateau. Remote Sens. 2019, 11, 1196. [Google Scholar] [CrossRef] [Green Version]
  53. Hohenegger, C.; Brockhaus, P.; Bretherton, C.S.; Schär, C. The soil moisture-precipitation feedback in simulations with explicit and parameterized convection. J. Clim. 2009, 22, 5003–5020. [Google Scholar] [CrossRef]
  54. Taylor, C.M.; Belusic, D.; Guichard, F.; Parker, D.J.; Vischel, T.; Bock, O.; Harris, P.P.; Janicot, S.; Klein, C.; Panthou, G. Frequency of extreme Sahelian storms tripled since 1982 in satellite observations. Nature 2017, 544, 475–478. [Google Scholar] [CrossRef] [PubMed] [Green Version]
  55. Westra, S.; Fowler, H.J.; Evans, J.P.; Alexander, L.V.; Berg, P.; Johnson, F.; Kendon, E.J.; Lenderink, G.; Roberts, N.M. Future changes to the intensity and frequency of short-duration extreme rainfall. Rev. Geophys. 2014, 52, 522–555. [Google Scholar] [CrossRef]
Figure 1. (a) Map of model domains and (bd) terrain (shaded, units: m) and soil moisture (black contours, units: m3 m−3) in the (b) control (CNTL), (c) terrain removal (NOMOUNT), and (d) homogeneous soil moisture (SMHOM) experiment. PL refers to Pingliang Station and Liupan Mountains is indicated as LPMs.
Atmosphere 11 00871 g001
Figure 2. (a) Composite map of geopotential height (black contours, units: gpm), temperature (shaded, units: °C), and wind vectors (blue vectors, units: m s−1) at 0700 LST at 500 hPa from ERA-interim and (b) observed radiosonde soundings at 0700 LST at Pingliang on 29 June 2017, black and blue solid lines denote temperature (units: °C) and dew-point temperature (units: °C), respectively, and red dotted line represents the air mass curve. The long and short bars on the right-hand denote 10 m s−1 and 5 m s−1, respectively, (c) same as (a) but from the WRF simulation, (d) same as (b) but from the WRF simulation.
Atmosphere 11 00871 g002
Figure 3. Observed (ad) and simulated (eh) radar composite reflectivity (shaded, units: dBZ), (a) 1100, (b) 1200, (c) 1300, (d) 1400; (e) 1000, (f) 1100, (g) 1200, and (h) 1300 LST. The solid black lines are the 2000 m terrain contours.
Atmosphere 11 00871 g003
Figure 4. Observed (a,c) and simulated (b,d) radar composite reflectivity (shaded, units: dBZ) and CI point (black dots), (a) 1044, (b) 0920, (c) 1212, and (d) 1110 LST. The solid black lines are the 2000 m terrain contours.
Atmosphere 11 00871 g004
Figure 5. Simulated temperature (shaded, units: °C) and specific humidity (black thick line, units: g kg−1) at 2 m overlapped with 10 m wind field (blue vector, units: m s−1), (a) 0600, (b) 0700, (c) 0800, and (d) 0900 LST. The gray thin lines are the 2000 m terrain contours, the black solid line is the location of the cross-section shown in Figure 6.
Atmosphere 11 00871 g005
Figure 6. Cross-section of simulated pseudo-equivalent temperature (shaded, units: K) and specific humidity (blue solid lines, units: g kg−1) and wind field (black vectors, units: m s−1) along 35.26° N. (a) 0600, (b) 0700, (c) 0800, and (d) 0900 LST. The gray-shaded area is the terrain, and the red pentagram indicates the location of A1.
Atmosphere 11 00871 g006
Figure 7. Simulated radar composite reflectivity (shaded, units: dBZ), wind field (blue vector, units: m s−1), and 7 cm-soil moisture (red solid lines in (a) and (b), and red dashed lines in (c), units: m3 m−3) at 0920 LST. (a) CNTL, (b) NOMOUNT, and (c) SMHOM. The wind shown in (a) is the 10 m wind from CNTL, in (b,c) are the differences of 10 m wind field between CNTL and the corresponding sensitivity tests. The solid black lines are 2000 m topographic contours, the dash black lines in (b) are 1500 and 2000 m topographic contours of CNTL.
Atmosphere 11 00871 g007
Figure 8. Sensible heat flux (SH, shaded, units: W m−2) difference between 0500 and 0800, (a) CNTL, (b) NOMOUNT, and (c) SMHOM. The solid black lines in (a), and (c) are 2000 m topographic contours, the black dash line in (b) outline the region with removed terrain (1500 m topographic contour).
Atmosphere 11 00871 g008

