Next Issue
Volume 11, September
Previous Issue
Volume 11, July


Atmosphere, Volume 11, Issue 8 (August 2020) – 111 articles

Cover Story (view full-size image): 
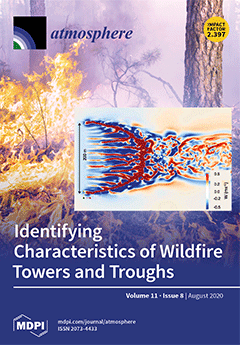
Wildfire behavior is governed by complex interactions among several physical phenomena, such as wind flow and turbulence, heat transfer, aerodynamic fuel drag, and combustion. In this study, the role of buoyant flame dynamics, vorticity-driven motions, and instabilities in dictating wildfire propagation is investigated, using simulations conducted by a physics-based wildfire model called FIRETEC. It is found that the flame-front is organized in a series of fingerlike coherent structures called ‘Towers’ and ‘Troughs’. The characteristics of wildfire–atmosphere interaction associated with these structures are then identified to establish quantitative baselines, against which future experiments can be benchmarked. View this paper
  • Issues are regarded as officially published after their release is announced to the table of contents alert mailing list.
  • You may sign up for e-mail alerts to receive table of contents of newly released issues.
  • PDF is the official format for papers published in both, html and pdf forms. To view the papers in pdf format, click on the "PDF Full-text" link, and use the free Adobe Reader to open them.
Order results
Result details
Section
Select all
Export citation of selected articles as:
23 pages, 1834 KiB  
Article
Ambient Air Quality as a Condition of Effective Healthcare Therapy on the Example of Selected Polish Health Resorts
by Dominik Kobus, Beata Merenda, Izabela Sówka, Anna Chlebowska-Styś and Alicja Wroniszewska
Atmosphere 2020, 11(8), 882; https://doi.org/10.3390/atmos11080882 - 18 Aug 2020
Cited by 7 | Viewed by 2781
Abstract
This article discusses the importance of air quality for the organization and functioning of health resorts. Ten different types of resorts located in various regions of Poland were compared in terms PM10 concentration. Additionally, comparative analysis of the high-PM10 episodes was [...] Read more.
This article discusses the importance of air quality for the organization and functioning of health resorts. Ten different types of resorts located in various regions of Poland were compared in terms PM10 concentration. Additionally, comparative analysis of the high-PM10 episodes was performed in three urban agglomerations located near the analyzed health resorts. The article also discusses formal, legal, and economic instruments that are the basis for legislative actions as tools for managing the air quality in the selected resorts. The analysis of the average annual concentrations in 2015–2019 did not show any exceedances of the PM10 limit value for any of the health resorts studied. High PM10 concentration values in 2018 were recorded for the number of days in exceedance of the limit value, especially in the health resorts of Uniejów, Ciechocinek, and Szczawno-Zdrój. Health resorts located in the south of Poland were identified as the most at risk in terms of the occurrence of limit value exceedances, information, and alert thresholds. It was concluded that the implementation of the so called “anti-smog” resolutions, including the development of financial support for changing the heating system to eliminate coal boilers and furnaces, is absolutely necessary for air quality improvement. Full article
(This article belongs to the Special Issue Particulate Matters Emission in Poland)
Show Figures

Figure 1

14 pages, 4872 KiB  
Article
Space-Borne Monitoring of NOx Emissions from Cement Kilns in South Korea
by Hyun Cheol Kim, Changhan Bae, Minah Bae, Okgil Kim, Byeong-Uk Kim, Chul Yoo, Jinsoo Park, Jinsoo Choi, Jae-bum Lee, Barry Lefer, Ariel Stein and Soontae Kim
Atmosphere 2020, 11(8), 881; https://doi.org/10.3390/atmos11080881 - 18 Aug 2020
Cited by 13 | Viewed by 4137
Abstract
Nitrogen oxide (NOx) emissions from the South Korean cement industry are investigated with remote-sensing measurements, surface observations, and in situ aircraft measurements. In the Yeongwol, Danyang, and Jecheon regions of central South Korea, six closely located cement factories produce 31 million [...] Read more.
Nitrogen oxide (NOx) emissions from the South Korean cement industry are investigated with remote-sensing measurements, surface observations, and in situ aircraft measurements. In the Yeongwol, Danyang, and Jecheon regions of central South Korea, six closely located cement factories produce 31 million tons of cement annually. Their impact on the regional environment has been a public-policy issue, but their pollutants have not been continuously monitored nor have emissions inventories been fully verified. Using a newly developed downscaling technique, remote-sensing analyses show that Ozone Monitoring Instrument (OMI) NO2 column densities over the cement kilns have more than twice the modeled concentrations, indicating that the kilns are one of the most dominant NOx emission point sources in South Korea. Observed NOx emissions are stronger in the spring, suggesting that these sources play an important role in the formation of surface ozone and secondary particulate matter. These emissions also slightly increased in recent years, even while most major South Korean cities posted a declining trend in NOx emissions. Photochemical models (during May to July 2015) demonstrate that emissions from the South Korean cement industry have significant environmental impacts, both on surface ozone (up to approximately 4 ppb) and PM2.5 (up to approximately 2 µg/m3). Full article
(This article belongs to the Special Issue Regional Air Quality Modeling)
Show Figures

Graphical abstract

22 pages, 7462 KiB  
Article
Gravity Wave Investigations over Comandante Ferraz Antarctic Station in 2017: General Characteristics, Wind Filtering and Case Study
by Gabriel Augusto Giongo, José Valentin Bageston, Cosme Alexandre Oliveira Barros Figueiredo, Cristiano Max Wrasse, Hosik Kam, Yong Ha Kim and Nelson Jorge Schuch
Atmosphere 2020, 11(8), 880; https://doi.org/10.3390/atmos11080880 - 18 Aug 2020
Cited by 6 | Viewed by 2513
Abstract
This work presents the characteristics of gravity waves observed over Comandante Ferraz Antarctic Station (EACF: 62.1° S, 58.4° W). A total of 122 gravity waves were observed in 34 nights from March to October 2017, and their parameters were obtained by using the [...] Read more.
This work presents the characteristics of gravity waves observed over Comandante Ferraz Antarctic Station (EACF: 62.1° S, 58.4° W). A total of 122 gravity waves were observed in 34 nights from March to October 2017, and their parameters were obtained by using the Fourier Transform spectral analysis. The majority of the observed waves presented horizontal wavelength ranging from 15 to 35 km, period from 5 to 20 min, and horizontal phase speed from 10 to 70 ± 2 m·s−1. The propagation direction showed an anisotropic condition, with the slower wave propagating mainly to the west, northwest and southeast directions, while the faster waves propagate to the east, southeast and south. Blocking diagrams for the period of April–July showed a good agreement between the wave propagation direction and the blocking positions, which are eastward oriented while the waves propagate mainly westward. A case study to investigate wave sources was conducted for the night of 20–21 July, wherein eight small-scale and one medium-scale gravity waves were identified. Reverse ray tracing model was used to investigate the gravity wave source, and the results showed that six among eight small-scale gravity waves were generated in the mesosphere. On the other hand, only two small-scale waves and the medium-scale gravity wave had likely tropospheric or stratospheric origin, however, they could not be associated with any reliable source. Full article
Show Figures

Figure 1

20 pages, 3850 KiB  
Article
Hurricane Dorian Outer Rain Band Observations and 1D Particle Model Simulations: A Case Study
by Viswanathan Bringi, Axel Seifert, Wei Wu, Merhala Thurai, Gwo-Jong Huang and Christoph Siewert
Atmosphere 2020, 11(8), 879; https://doi.org/10.3390/atmos11080879 - 18 Aug 2020
Cited by 11 | Viewed by 3391
Abstract
The availability of high quality surface observations of precipitation and volume observations by polarimetric operational radars make it possible to constrain, evaluate, and validate numerical models with a wide variety of microphysical schemes. In this article, a novel particle-based Monte-Carlo microphysical model (called [...] Read more.
The availability of high quality surface observations of precipitation and volume observations by polarimetric operational radars make it possible to constrain, evaluate, and validate numerical models with a wide variety of microphysical schemes. In this article, a novel particle-based Monte-Carlo microphysical model (called McSnow) is used to simulate the outer rain bands of Hurricane Dorian which traversed the densely instrumented precipitation research facility operated by NASA at Wallops Island, Virginia. The rain bands showed steady stratiform vertical profiles with radar signature of dendritic growth layers near −15 °C and peak reflectivity in the bright band of 55 dBZ along with polarimetric signatures of wet snow with sizes inferred to exceed 15 mm. A 2D-video disdrometer measured frequent occurrences of large drops >5 mm and combined with an optical array probe the drop size distribution was well-documented in spite of uncertainty for drops <0.5 mm due to high wind gusts and turbulence. The 1D McSnow control run and four numerical experiments were conducted and compared with observations. One of the main findings is that even at the moderate rain rate of 10 mm/h collisional breakup is essential for the shape of the drop size distribution. Full article
(This article belongs to the Special Issue Microphysics of Precipitation Particles: Raindrops, Hail, and Snow)
Show Figures

Figure 1

15 pages, 2205 KiB  
Article
A Chemical Transport Model Emulator for the Interactive Evaluation of Mercury Emission Reduction Scenarios
by Francesco De Simone, Francesco D’Amore, Francesco Marasco, Francesco Carbone, Mariantonia Bencardino, Ian M. Hedgecock, Sergio Cinnirella, Francesca Sprovieri and Nicola Pirrone
Atmosphere 2020, 11(8), 878; https://doi.org/10.3390/atmos11080878 - 18 Aug 2020
Cited by 5 | Viewed by 3096
Abstract
Implementation of the Minamata Convention on Mercury requires all parties to “control, and where feasible, reduce” mercury (Hg) emissions from a convention-specified set of sources. However, the convention does not specify the extent of the measures to be adopted, which may only be [...] Read more.
Implementation of the Minamata Convention on Mercury requires all parties to “control, and where feasible, reduce” mercury (Hg) emissions from a convention-specified set of sources. However, the convention does not specify the extent of the measures to be adopted, which may only be analysed by decision-makers using modelled scenarios. Currently, the numerical models available to study the Hg atmospheric cycle require significant expertise and high-end hardware, with results which are generally available on a time frame of days to weeks. In this work we present HERMES, a statistical emulator built on the output of a global Chemical Transport Model (CTM) for Hg (ECHMERIT), to simulate changes in anthropogenic Hg (Hganthr) deposition fluxes in a source-receptor framework, due to perturbations to Hganthr emissions and the associated statistical significance of the changes. The HERMES emulator enables stakeholders to evaluate the implementation of different Hganthr emission scenarios in an interactive and real-time manner, simulating the application of the different Best Available Technologies. HERMES provides the scientific soundness of a full CTM numerical framework in an interactive and user-friendly spreadsheet, without the necessity for specific training or formation and is a first step towards a more comprehensive, and integrated, decision support system to aid decision-makers in the implementation of the Minamata Convention. Full article
(This article belongs to the Special Issue Air Quality Assessment and Management)
Show Figures

Graphical abstract

18 pages, 2300 KiB  
Article
The Summer Surface Energy Budget of the Ice-Free Area of Northern James Ross Island and Its Impact on the Ground Thermal Regime
by Klára Ambrožová, Filip Hrbáček and Kamil Láska
Atmosphere 2020, 11(8), 877; https://doi.org/10.3390/atmos11080877 - 18 Aug 2020
Cited by 7 | Viewed by 2463
Abstract
Despite the key role of the surface energy budget in the global climate system, such investigations are rare in Antarctica. In this study, the surface energy budget measurements from the largest ice-free area on northern James Ross Island, in Antarctica, were obtained. The [...] Read more.
Despite the key role of the surface energy budget in the global climate system, such investigations are rare in Antarctica. In this study, the surface energy budget measurements from the largest ice-free area on northern James Ross Island, in Antarctica, were obtained. The components of net radiation were measured by a net radiometer, while sensible heat flux was measured by a sonic anemometer and ground heat flux by heat flux plates. The surface energy budget was compared with the rest of the Antarctic Peninsula Region and selected places in the Arctic and the impact of surface energy budget components on the ground thermal regime was examined. Mean net radiation on James Ross Island during January–March 2018 reached 102.5 W m−2. The main surface energy budget component was the latent heat flux, while the sensible heat flux values were only 0.4 W m−2 lower. Mean ground heat flux was only 0.4 Wm-2, however, it was negative in 47% of January–March 2018, while it was positive in the rest of the time. The ground thermal regime was affected by surface energy budget components to a depth of 50 cm. The strongest relationship was found between ground heat flux and ground surface temperature. Further analysis confirmed that active layer refroze after a sequence of three days with negative ground heat flux even in summer months. Daily mean net radiation and ground heat flux were significantly reduced when cloud amount increased, while the influence of snow cover on ground surface temperature was negligible. Full article
(This article belongs to the Section Biosphere/Hydrosphere/Land–Atmosphere Interactions)
Show Figures

Graphical abstract

17 pages, 10401 KiB  
Article
The Distribution of Aircraft Icing Accretion in China—Preliminary Study
by Jinhu Wang, Binze Xie and Jiahan Cai
Atmosphere 2020, 11(8), 876; https://doi.org/10.3390/atmos11080876 - 18 Aug 2020
Cited by 2 | Viewed by 3136
Abstract
The icing environment is an important threat to aircraft flight safety. In this work, the icing index is calculated using linear interpolation and based on temperature and relative humidity (RH) curves obtained from radiosonde observations in China. The results show that: (1) there [...] Read more.
The icing environment is an important threat to aircraft flight safety. In this work, the icing index is calculated using linear interpolation and based on temperature and relative humidity (RH) curves obtained from radiosonde observations in China. The results show that: (1) there are obvious differences in icing index distribution in parameter over various climatic regions of China. The differences are reflected in duration, main altitude, and ice intensity. The reason for the differences is related to the temperature and humidity environment. (2) Before and after the summer rainfall process, there are obvious changes in the ice accretion index in the 4–6 km altitude area of Northeast China, and the areas with serious ice accretion are coincident with areas with large rainfall estimates. (3) In the process of snowfall in winter, the ground snow has an impact on the ice accumulation index in the east of China. When it is snowing, ice accumulation in low altitudes is serious. The results of this study offer a theoretical basis for prediction and early warning of aircraft icing. Full article
(This article belongs to the Special Issue Weather and Aviation Safety)
Show Figures

Figure 1

16 pages, 8323 KiB  
Article
A Study of False Alarms of a Major Sudden Stratospheric Warming by Real-Time Subseasonal-to-Seasonal Forecasts for the 2017/2018 Northern Winter
by Masakazu Taguchi
Atmosphere 2020, 11(8), 875; https://doi.org/10.3390/atmos11080875 - 17 Aug 2020
Cited by 4 | Viewed by 2257
Abstract
This study investigates false alarms of a major sudden stratospheric warming (MSSW) by real-time subseasonal-to-seasonal forecast data of the European Centre for Medium-Range Weather Forecasts system for the 2017/2018 Northern Hemisphere winter season. The analysis reveals two false alarm cases in the season, [...] Read more.
This study investigates false alarms of a major sudden stratospheric warming (MSSW) by real-time subseasonal-to-seasonal forecast data of the European Centre for Medium-Range Weather Forecasts system for the 2017/2018 Northern Hemisphere winter season. The analysis reveals two false alarm cases in the season, one in early December and the other in early February. Each case is characterized by ensembles of which a considerable part of the members (MSSW members) show an MSSW, that is, reversal of the zonal mean zonal wind in the extratropical stratosphere on similar calendar dates. Ensemble forecasts that are initialized earlier or later basically lack an MSSW, demonstrating clear intraseasonal variability in the frequency of forecasted MSSWs. For each false alarm case, the MSSW member mean field shows equatorward displacement of the polar vortex around the onset date. For both cases, the MSSW members accompany stronger wave activity in the lower stratosphere than other non-MSSW members and reanalysis data. They are further associated with higher geopotential height than the non-MSSW members, in the upper troposphere over northeastern Canada and Greenland before the first case, and lower height over northeastern Eurasia before the second case. These are located over the ridge and trough, respectively, of the climatological planetary wave of zonal wave number one, and are consistent with the increased wave activity. Full article
(This article belongs to the Section Meteorology)
Show Figures

Figure 1

16 pages, 7602 KiB  
Article
Investigation of Aerosol Climatology and Long-Range Transport of Aerosols over Pokhara, Nepal
by Jeevan Regmi, Khem N Poudyal, Amod Pokhrel, Madhu Gyawali, Lekhendra Tripathee, Arnico Panday, Anthony Barinelli and Rudra Aryal
Atmosphere 2020, 11(8), 874; https://doi.org/10.3390/atmos11080874 - 17 Aug 2020
Cited by 8 | Viewed by 4962
Abstract
This study presents the spectral monthly and seasonal variation of aerosol optical depth (τAOD), single scattering albedo (SSA), and aerosol absorption optical depth (AAOD) between 2010 and 2018 obtained from the Aerosol Robotic Network (AERONET) over Pokhara, Nepal. The analysis of [...] Read more.
This study presents the spectral monthly and seasonal variation of aerosol optical depth (τAOD), single scattering albedo (SSA), and aerosol absorption optical depth (AAOD) between 2010 and 2018 obtained from the Aerosol Robotic Network (AERONET) over Pokhara, Nepal. The analysis of these column-integrated aerosol optical data suggests significant monthly and seasonal variability of aerosol physical and optical properties. The pre-monsoon season (March to May) has the highest observed τAOD(0.75 ± 0.15), followed by winter (December to February, 0.47 ± 0.12), post-monsoon (October and November, 0.39 ± 0.08), and monsoon seasons (June to September, 0.27 ± 0.13), indicating seasonal aerosol loading over Pokhara. The variability of Ångström parameters, α, and β, were computed from the linear fit line in the logarithmic scale of spectral τAOD, and used to analyze the aerosol physical characteristics such as particle size and aerosol loading. The curvature of spectral τAOD, α’, computed from the second-order polynomial fit, reveals the domination by fine mode aerosol particles in the post-monsoon and winter seasons, with coarse mode dominating in monsoon, and both modes contributing in the pre-monsoon. Analysis of air mass back trajectories and observation of fire spots along with aerosol optical data and aerosol size spectra suggest the presence of mixed types of transboundary aerosols, such as biomass, urban-industrial, and dust aerosols in the atmospheric column over Pokhara. Full article
(This article belongs to the Special Issue Emissions, Transport and Fate of Pollutants in the Atmosphere)
Show Figures

Figure 1

19 pages, 5869 KiB  
Article
Investigation of the Vertical Influence of the 11-Year Solar Cycle on Ozone Using SBUV and Antarctic Ground-Based Measurements and CMIP6 Forcing Data
by Asen Grytsai, Oleksandr Evtushevsky, Andrew Klekociuk, Gennadi Milinevsky, Yuri Yampolsky, Oksana Ivaniha and Yuke Wang
Atmosphere 2020, 11(8), 873; https://doi.org/10.3390/atmos11080873 - 17 Aug 2020
Cited by 4 | Viewed by 3676
Abstract
The 11-year solar activity cycle in the vertical ozone distribution over the Antarctic station Faraday/Vernadsky in the Antarctic Peninsula region (65.25° S, 64.27° W) was analyzed using the Solar Backscatter Ultra Violet (SBUV) radiometer data Version 8.6 Merged Ozone Data Sets (MOD) over [...] Read more.
The 11-year solar activity cycle in the vertical ozone distribution over the Antarctic station Faraday/Vernadsky in the Antarctic Peninsula region (65.25° S, 64.27° W) was analyzed using the Solar Backscatter Ultra Violet (SBUV) radiometer data Version 8.6 Merged Ozone Data Sets (MOD) over the 40-year period 1979–2018. The SBUV MOD ozone profiles are presented as partial column ozone in layers with approximately 3-km altitude increments from the surface to the lower mesosphere (1000–0.1 hPa, or 0–64 km). Periodicities in the ozone time series of the layer data were studied using wavelet transforms. A statistically significant signal with a quasi-11-year period consistent with solar activity forcing was found in the lower–middle stratosphere at 22–31 km in ozone over Faraday/Vernadsky, although signals with similar periods were not significant in the total column measurements made by the Dobson spectrophotometer at the site. For comparison with other latitudinal zones, the relative contribution of the wavelet spectral power of the quasi-11-year periods to the 2–33-year period range on the global scale was estimated. While a significant solar activity signal exists in the tropical lower and upper stratosphere and in the lower mesosphere in SBUV MOD, we did not find evidence of similar signals in the ozone forcing data for the Coupled Model Intercomparison Project Phase 6 (CMIP6). In the extratropical lower–middle stratosphere and lower mesosphere, there is a strong hemispheric asymmetry in solar activity–ozone response, which is dominant in the Southern Hemisphere. In general, the results are consistent with other studies and highlight the sensitivity of ozone in the lower–middle stratosphere over the Antarctic Peninsula region to the 11-year solar cycle. Full article
(This article belongs to the Section Meteorology)
Show Figures

Figure 1

21 pages, 6702 KiB  
Article
An Updated Synoptic Climatology of Lake Erie and Lake Ontario Heavy Lake-Effect Snow Events
by Jake Wiley and Andrew Mercer
Atmosphere 2020, 11(8), 872; https://doi.org/10.3390/atmos11080872 - 17 Aug 2020
Cited by 8 | Viewed by 3233
Abstract
Lake-effect snow (LES) storms pose numerous hazards, including extreme snowfall and blizzard conditions, and insight into the large-scale precursor conditions associated with LES can aid local forecasters and potentially allow risks to be mitigated. In this study, a synoptic climatology of severe LES [...] Read more.
Lake-effect snow (LES) storms pose numerous hazards, including extreme snowfall and blizzard conditions, and insight into the large-scale precursor conditions associated with LES can aid local forecasters and potentially allow risks to be mitigated. In this study, a synoptic climatology of severe LES events over Lakes Erie and Ontario was created using an updated methodology based on previous studies with similar research objectives. Principal component analysis (PCA) coupled with cluster analysis (CA) was performed on a case set of LES events from a study domain encompassing both lakes, grouping LES events with similar spatial characteristics into the primary composite structures for LES. Synoptic scale composites were constructed for each cluster using the North American Regional Reanalysis (NARR). Additionally, one case from each cluster was simulated using the Weather Research and Forecast (WRF) model to analyze mesoscale conditions associated with each of the clusters. Three synoptic setups were identified that consisted of discrepancies, mostly in the surface fields, from a common pattern previously identified as being conducive to LES, which features a dipole and upper-level low pressure anomaly located near the Hudson Bay. Mesoscale conditions associated with each composite support differing LES impacts constrained to individual lakes or a combination of both. Full article
(This article belongs to the Section Meteorology)
Show Figures

Graphical abstract

15 pages, 3811 KiB  
Article
Numerical Study of the Impact of Complex Terrain and Soil Moisture on Convective Initiation
by Beilei Zan, Ye Yu, Longxiang Dong, Jianglin Li, Guo Zhao and Tong Zhang
Atmosphere 2020, 11(8), 871; https://doi.org/10.3390/atmos11080871 - 17 Aug 2020
Cited by 6 | Viewed by 2758
Abstract
The relative importance of topography and soil moisture on the initiation of an afternoon deep convection under weak synoptic-scale forcing was investigated using the weather research and forecasting (WRF) model with high resolution (1.33 km). The convection occurred on 29 June 2017, over [...] Read more.
The relative importance of topography and soil moisture on the initiation of an afternoon deep convection under weak synoptic-scale forcing was investigated using the weather research and forecasting (WRF) model with high resolution (1.33 km). The convection occurred on 29 June 2017, over the Liupan Mountains, west of the Loess Plateau. The timing and location of the convective initiation (CI) simulated by the WRF model compared well with the radar observations. It showed that the warm and humid southerly airflow under 700 hPa was divided into east and west flows due to the blockage of the Liupan Mountains. The warm and humid air on the west side was forced to climb along the slope and enhanced the humidity near the ridge. The accumulation of unstable energy in the middle and north of the ridge led to a strong vertical convergence and triggered the convection. Sensitivity experiments showed that terrain played a dominant role in triggering the convection, while the spatial heterogeneity of soil moisture played an indirect role by affecting the local circulation and the partition of surface energy. Full article
Show Figures

Figure 1

23 pages, 7465 KiB  
Article
Typhoon Quantitative Rainfall Prediction from Big Data Analytics by Using the Apache Hadoop Spark Parallel Computing Framework
by Chih-Chiang Wei and Tzu-Hao Chou
Atmosphere 2020, 11(8), 870; https://doi.org/10.3390/atmos11080870 - 17 Aug 2020
Cited by 11 | Viewed by 4288
Abstract
Situated in the main tracks of typhoons in the Northwestern Pacific Ocean, Taiwan frequently encounters disasters from heavy rainfall during typhoons. Accurate and timely typhoon rainfall prediction is an imperative topic that must be addressed. The purpose of this study was to develop [...] Read more.
Situated in the main tracks of typhoons in the Northwestern Pacific Ocean, Taiwan frequently encounters disasters from heavy rainfall during typhoons. Accurate and timely typhoon rainfall prediction is an imperative topic that must be addressed. The purpose of this study was to develop a Hadoop Spark distribute framework based on big-data technology, to accelerate the computation of typhoon rainfall prediction models. This study used deep neural networks (DNNs) and multiple linear regressions (MLRs) in machine learning, to establish rainfall prediction models and evaluate rainfall prediction accuracy. The Hadoop Spark distributed cluster-computing framework was the big-data technology used. The Hadoop Spark framework consisted of the Hadoop Distributed File System, MapReduce framework, and Spark, which was used as a new-generation technology to improve the efficiency of the distributed computing. The research area was Northern Taiwan, which contains four surface observation stations as the experimental sites. This study collected 271 typhoon events (from 1961 to 2017). The following results were obtained: (1) in machine-learning computation, prediction errors increased with prediction duration in the DNN and MLR models; and (2) the system of Hadoop Spark framework was faster than the standalone systems (single I7 central processing unit (CPU) and single E3 CPU). When complex computation is required in a model (e.g., DNN model parameter calibration), the big-data-based Hadoop Spark framework can be used to establish highly efficient computation environments. In summary, this study successfully used the big-data Hadoop Spark framework with machine learning, to develop rainfall prediction models with effectively improved computing efficiency. Therefore, the proposed system can solve problems regarding real-time typhoon rainfall prediction with high timeliness and accuracy. Full article
Show Figures

Graphical abstract

22 pages, 9223 KiB  
Article
A Hydrodynamical Atmosphere/Ocean Coupled Modeling System for Multiple Tropical Cyclones
by Ghassan J. Alaka, Jr., Dmitry Sheinin, Biju Thomas, Lew Gramer, Zhan Zhang, Bin Liu, Hyun-Sook Kim and Avichal Mehra
Atmosphere 2020, 11(8), 869; https://doi.org/10.3390/atmos11080869 - 16 Aug 2020
Cited by 12 | Viewed by 2841
Abstract
The goal of this paper is to introduce a new multi-storm atmosphere/ocean coupling scheme that was implemented and tested in the Basin-Scale Hurricane Weather Research and Forecasting (HWRF-B) model. HWRF-B, an experimental model developed at the National Oceanic and Atmospheric Administration (NOAA) and [...] Read more.
The goal of this paper is to introduce a new multi-storm atmosphere/ocean coupling scheme that was implemented and tested in the Basin-Scale Hurricane Weather Research and Forecasting (HWRF-B) model. HWRF-B, an experimental model developed at the National Oceanic and Atmospheric Administration (NOAA) and supported by the Hurricane Forecast Improvement Program, is configured with multiple storm-following nested domains to produce high-resolution predictions for several tropical cyclones (TCs) within the same forecast integration. The new coupling scheme parallelizes atmosphere/ocean interactions for each nested domain in HWRF-B, and it may be applied to any atmosphere/ocean coupled system. TC forecasts from this new hydrodynamical modeling system were produced in the North Atlantic and eastern North Pacific from 2017–2019. The performance of HWRF-B was evaluated, including forecasts of TC track, intensity, structure (e.g., surface wind radii), and intensity change, and simulated sea-surface temperatures were compared with satellite observations. Median forecast skill scores showed significant improvement over the operational HWRF at most forecast lead times for track, intensity, and structure. Sea-surface temperatures cooled by 1–8 °C for the five HWRF-B case studies, demonstrating the utility of the model to study the impact of the ocean on TC intensity forecasting. These results show the value of a multi-storm modeling system and provide confidence that the multi-storm coupling scheme was implemented correctly. Future TC models within NOAA, especially the Unified Forecast System’s Hurricane Analysis and Forecast System, would benefit from the multi-storm coupling scheme whose utility and performance are demonstrated in HWRF-B here. Full article
(This article belongs to the Special Issue Modeling and Data Assimilation for Tropical Cyclone Forecasts)
Show Figures

Figure 1

14 pages, 994 KiB  
Article
Health Effects of Air-Quality Regulations in Seoul Metropolitan Area: Applying Synthetic Control Method to Controlled-Interrupted Time-Series Analysis
by Soo-Yeon Kim, Hyomi Kim and Jong-Tae Lee
Atmosphere 2020, 11(8), 868; https://doi.org/10.3390/atmos11080868 - 16 Aug 2020
Cited by 6 | Viewed by 3743
Abstract
Despite enormous investment in air-quality regulations, there are only a few studies about the health effects of the air-quality regulations. By applying synthetic control methods to controlled-interrupted time-series analysis, this study aimed to test whether air-quality regulations implemented in Seoul metropolitan area since [...] Read more.
Despite enormous investment in air-quality regulations, there are only a few studies about the health effects of the air-quality regulations. By applying synthetic control methods to controlled-interrupted time-series analysis, this study aimed to test whether air-quality regulations implemented in Seoul metropolitan area since 2005 had reduced cardiovascular mortality rate in Seoul and Incheon. Each synthetic control for Seoul and Incheon was constructed to predict the counterfactual cardiovascular mortality rate through synthetic control methods. By using a synthetic control as a control group in controlled-interrupted time-series analysis, we tested whether the air-quality regulations had changed the trend of cardiovascular mortality rate in Seoul and Incheon after the intervention. The results showed a significant slope change in cardiovascular mortality rate in Seoul (coefficient: −0.001, 95% confidence interval (CI): −0.0015, −0.0004) and Incheon (coefficient: −0.0006, 95% CI: −0.0012, 0). This study suggests additional evidence that air-quality regulations implemented in the Seoul metropolitan areas since 2005 had beneficial effects on cardiovascular mortality rate in Seoul and Incheon. Full article
(This article belongs to the Special Issue Regional Air Quality Modeling)
Show Figures

Figure 1

18 pages, 3483 KiB  
Article
Quantifying the Changing Nature of the Winter Season Precipitation Phase from 1849 to 2017 in Downtown Toronto (Canada)
by Micah J. Hewer and William A. Gough
Atmosphere 2020, 11(8), 867; https://doi.org/10.3390/atmos11080867 - 16 Aug 2020
Cited by 5 | Viewed by 2807
Abstract
One hundred and sixty–nine years of weather station data were analyzed to quantify the changing nature of the winter season precipitation phase in the downtown area of Toronto (Canada). The precipitation variables examined were rainfall, snowfall water equivalent, total precipitation, rain days, snow [...] Read more.
One hundred and sixty–nine years of weather station data were analyzed to quantify the changing nature of the winter season precipitation phase in the downtown area of Toronto (Canada). The precipitation variables examined were rainfall, snowfall water equivalent, total precipitation, rain days, snow days, and precipitation days. From these precipitation variables, three precipitation phase metrics were constructed for further analysis: the fraction of total precipitation that fell as snow, the fraction of precipitation days that recorded snow, and finally, the precipitation phase index (PPI) derived from comparing the rainfall to the snowfall water equivalent. Snowfall and snow days were decreasing at the most significant rate over this time period, and although rain days were increasing, total precipitation and precipitation days were also decreasing at a statistically significant rate. All three precipitation phase metrics suggest that winters are becoming less snowy in Toronto’s urban center. We also looked at trends and changes in average winter season temperatures to explore correlations between warming temperatures and changes in the winter season precipitation phase. Of the three precipitation phase metrics considered, the ratio of snow days to precipitation days recorded the strongest time series trend and the strongest correlation with warming temperatures. Full article
(This article belongs to the Special Issue Modeling and Measuring Snow Processes across Scales)
Show Figures

Figure 1

13 pages, 2884 KiB  
Article
An Improved Method for Optical Characterization of Mineral Dust and Soot Particles in the El Paso-Juárez Airshed
by Javier Polanco, Manuel Ramos, Rosa M. Fitzgerald and William R. Stockwell
Atmosphere 2020, 11(8), 866; https://doi.org/10.3390/atmos11080866 - 15 Aug 2020
Cited by 1 | Viewed by 2310
Abstract
Highly time-resolved aerosol measurements and analysis are necessary for a proper aerosol characterization in many polluted regions, because aerosol concentrations in polluted environments can change over time scales of minutes. However, many urban measuring sites have measuring devices that provide time resolved average [...] Read more.
Highly time-resolved aerosol measurements and analysis are necessary for a proper aerosol characterization in many polluted regions, because aerosol concentrations in polluted environments can change over time scales of minutes. However, many urban measuring sites have measuring devices that provide time resolved average aerosol concentrations over a day or two at best. Light-scattering properties of mineral dust and soot particles in the El Paso-Juárez Airshed were analyzed with an improved methodology, using the T-matrix, a maximum likelihood estimator (MLE), and data from both an acoustic extinctiometer and a laser particle counter. The hourly inter-comparisons of the scattering coefficients’ results between the model and those obtained using the instruments at a wavelength of 0.87 μm show good agreement. This methodology has been applied in the El Paso-Juárez Airshed successfully, and it could be used in other cities where mineral dust and soot are major components of the aerosol concentrations. Full article
(This article belongs to the Special Issue Atmospheric Aerosols in North America)
Show Figures

Figure 1

24 pages, 1528 KiB  
Article
Why Does Fog Deepen? An Analytical Perspective
by Jonathan G. Izett and Bas J. H. van de Wiel
Atmosphere 2020, 11(8), 865; https://doi.org/10.3390/atmos11080865 - 14 Aug 2020
Cited by 4 | Viewed by 2727
Abstract
The overall depth of a fog layer is one of the important factors in determining the hazard that a fog event presents. With discrete observations and often coarse numerical grids, however, fog depth cannot always be accurately determined. To address this, we derive [...] Read more.
The overall depth of a fog layer is one of the important factors in determining the hazard that a fog event presents. With discrete observations and often coarse numerical grids, however, fog depth cannot always be accurately determined. To address this, we derive a simple analytical relation that describes the change in depth of a fog interface with time, which depends on the tendencies and vertical gradients of moisture. We also present a lengthscale estimate for the maximum depth over which mixing can occur in order for the fog layer to be sustained, assuming a uniform mixing of the vertical profiles of temperature and moisture. Even over several hours, and when coarse observational resolution is used, the analytical description is shown to accurately diagnose the depth of a fog layer when compared against observational data and the results of large-eddy simulations. Such an analytical description not only enables the estimation of sub-grid or inter-observation fog depth, but also provides a simple framework for interpreting the evolution of a fog layer in time. Full article
(This article belongs to the Special Issue Observation, Simulation and Predictability of Fog )
Show Figures

Figure 1

18 pages, 3317 KiB  
Article
Operational Response to Volcanic Ash Risks Using HOTVOLC Satellite-Based System and MOCAGE-Accident Model at the Toulouse VAAC
by Mathieu Gouhier, Mathieu Deslandes, Yannick Guéhenneux, Philippe Hereil, Philippe Cacault and Béatrice Josse
Atmosphere 2020, 11(8), 864; https://doi.org/10.3390/atmos11080864 - 14 Aug 2020
Cited by 13 | Viewed by 3265
Abstract
In 2010, the Eyjafjallajökull volcano erupted, generating an ash cloud causing unprecedented disruption of European airspace. Despite an exceptional situation, both the London and Toulouse Volcanic Ash Advisory Centres (VAAC) provided critical information on the location of the cloud and on the concentration [...] Read more.
In 2010, the Eyjafjallajökull volcano erupted, generating an ash cloud causing unprecedented disruption of European airspace. Despite an exceptional situation, both the London and Toulouse Volcanic Ash Advisory Centres (VAAC) provided critical information on the location of the cloud and on the concentration of ash, thus contributing to the crisis management. Since then, substantial efforts have been carried out by the scientific community in order to improve remote sensing techniques and numerical modeling. Satellite instruments have proven to be particularly relevant for the characterization of ash cloud properties and a great help in the operational management of volcanic risk. In this study, we present the satellite-based system HOTVOLC developed at the Observatoire de Physique du Globe de Clermont-Ferrand (OPGC) using Meteosat geostationary satellite and designed for real-time monitoring of active volcanoes. After a brief presentation of the system we provide details on newly developed satellite products dedicated to the ash cloud characterization. This includes, in particular, ash cloud altitude and vertical column densities (VCD). Then, from the Stromboli 2018 paroxysm, we show how HOTVOLC can be used in a timely manner to assist the Toulouse VAAC in the operational management of the eruptive crisis. In the second part of the study, we provide parametric tests of the MOCAGE-Accident model run by the Toulouse VAAC from the April 17 Eyjafjallajökull eruption. For this purpose, we tested a range of eruption source parameters including the Total Grain Size Distribution (TGSD), the eruptive column profile, the top plume height and mass eruption rate (MER), as well as the fine ash partitioning. Finally, we make a comparison on this case study between HOTVOLC and MOCAGE-Accident VCD. Full article
(This article belongs to the Special Issue Forecasting the Transport of Volcanic Ash in the Atmosphere)
Show Figures

Figure 1

19 pages, 1523 KiB  
Article
Modeling Emissions from Concentrated Sources into Large-Scale Models: Theory and apriori Testing
by Roberto Paoli
Atmosphere 2020, 11(8), 863; https://doi.org/10.3390/atmos11080863 - 14 Aug 2020
Cited by 3 | Viewed by 1746
Abstract
This paper presents a general procedure to incorporate the effects emissions from localized sources, such as aircraft or ship engines, into chemical transport models (CTM). In this procedure, the species concentrations in each grid box of a CTM are split into plume or [...] Read more.
This paper presents a general procedure to incorporate the effects emissions from localized sources, such as aircraft or ship engines, into chemical transport models (CTM). In this procedure, the species concentrations in each grid box of a CTM are split into plume or small-scale concentrations and background concentrations, respectively, and the corresponding conservation equations are derived. The plume concentrations can be interpreted as subgrid contributions for the CTM grid-box averaged concentrations. The chemical reactions occurring inside the plume are parameterized by introducing suitable “effective” reaction rates rather than modifying the emission indices of the species inside the plume. Various methods for implementation into large-scale models are discussed that differ by the accuracy of the description of plume process. The mathematical consistency of the method is verified on simple idealized setting consisting of a reactive plume in homogeneous turbulence. Full article
(This article belongs to the Section Air Quality)
Show Figures

Figure 1

18 pages, 6402 KiB  
Article
Analysis of Cooling and Humidification Effects of Different Coverage Types in Small Green Spaces (SGS) in the Context of Urban Homogenization: A Case of HAU Campus Green Spaces in Summer in Zhengzhou, China
by Huawei Li, Handong Meng, Ruizhen He, Yakai Lei, Yuchen Guo, Amoako-atta Ernest, Sandor Jombach and Guohang Tian
Atmosphere 2020, 11(8), 862; https://doi.org/10.3390/atmos11080862 - 14 Aug 2020
Cited by 17 | Viewed by 3797
Abstract
In the context of global warming, more and more cities are experiencing extreme Urban Heat Island (UHI) effects and extreme weather phenomena, but urban green spaces are proven to mitigate UHI. Most of UHI’s research focuses on the large scale and uses remote [...] Read more.
In the context of global warming, more and more cities are experiencing extreme Urban Heat Island (UHI) effects and extreme weather phenomena, but urban green spaces are proven to mitigate UHI. Most of UHI’s research focuses on the large scale and uses remote sensing methods, which do not reflect the dynamic characteristics in detail and do not detect internal influencing factors of the green space cooling effect. Therefore, this study focused on Small Green Spaces (SGS), carrying out the measurement of the meteorological parameters (temperature, relative humidity, wind direction, wind speed, photosynthetic radiation) of the 16 sites in four types of coverage (Impervious surface; Shrub-grass; Tree-grass; Tree-shrub-grass) in a university campus. At the same time, the coverage characteristic parameters, such as Canopy Density (CD), Leaf Area Index (LAI), Photosynthetically Active Radiation (PAR), Mean Leaf Angle (MLA), of each plot were analyzed and compared. The results showed that there were significant differences in temperature among different coverage types in SGS. The biggest difference was concentrated in the noon period when solar radiation is strongest during the day. The difference between the four types of coverage with vegetation at night was small. The maximum air temperature difference among the four types could reach 8.9 ℃ and the maximum relative humidity difference was 28.5%. The cooling effect of the multi-layer vegetation-covered (Tree-shrub-grass) area was the largest compared to the impervious surface, indicating that tree cover was the core factor affecting the temperature. Temperature and relative humidity had a close correlation with surface coverage types and some plant community characteristics (such as CD and LAI). The cooling and humidifying effects of plants were also related to PAR and leaf angle. The results provide suggestions for green space management and landscape design. Full article
(This article belongs to the Special Issue Interaction between Urban Microclimates and the Buildings)
Show Figures

Figure 1

20 pages, 9747 KiB  
Article
Isomass and Probability Maps of Ash Fallout Due to Vulcanian Eruptions at Tungurahua Volcano (Ecuador) Deduced from Historical Forecasting
by René Parra, Eliana Cadena, Joselyne Paz and Diana Medina
Atmosphere 2020, 11(8), 861; https://doi.org/10.3390/atmos11080861 - 14 Aug 2020
Cited by 2 | Viewed by 2588
Abstract
Since April of 2015, the ash dispersion and ash fallout due to Vulcanian eruptions at Tungurahua, one of the most active volcanoes in Ecuador, have been forecasted daily. For this purpose, our forecasting system uses the meteorological Weather Research and Forecasting (WRF) and [...] Read more.
Since April of 2015, the ash dispersion and ash fallout due to Vulcanian eruptions at Tungurahua, one of the most active volcanoes in Ecuador, have been forecasted daily. For this purpose, our forecasting system uses the meteorological Weather Research and Forecasting (WRF) and the FALL3D models. Previously, and based on field data, laboratory, and numerical studies, corresponding eruption source parameters (ESP) have been defined. We analyzed the historically forecasted results of the ash fallout quantities over four years (April 2015 to March 2019), in order to obtain the average isomass and probability maps for three-month periods: February–March–April (FMA), May–June–July (MJJ), August–September–October (ASO), and November–December–January (NDJ). Our results indicate similar ash fallout shapes during MJJ and ASO, with a clear and defined tendency toward the west of the volcano; this tendency is less defined during NDJ and FMA. The proximal region west of the volcano (about 100 km to the west) has the highest probability (>70%) of being affected by ash fallout. The distant region to the west (more than 100 km west) presented low to medium probabilities (10%–70%) of ash fallout. The cities of Guaranda (W, 60% to 90%), Riobamba (SW, 70%), and Ambato (NW, 50% to 60%) have the highest probabilities of being affected by ash fallout. Among the large Ecuadorian cities, Guayaquil (SW, 10% to 30%) has low probability, and Quito (N, ≤5%) and Cuenca (SSE, <5%) have very low probabilities of being affected by ash fallout. High ash clouds can move in different directions, compared to wind transport near the surface. Therefore, it is possible to detect ash clouds by remote sensing which, in Ecuador, is limited to the layers over the meteorological clouds, which move in a different direction than low wind; the latter produces ash fallout over regions in different directions compared to the detected ash clouds. In addition to the isomass/probability maps and detected ash clouds, forecasting is permanently required in Ecuador. Full article
(This article belongs to the Special Issue Forecasting the Transport of Volcanic Ash in the Atmosphere)
Show Figures

Figure 1

13 pages, 634 KiB  
Article
Affective Normative Data for English Weather Words
by Alan E. Stewart
Atmosphere 2020, 11(8), 860; https://doi.org/10.3390/atmos11080860 - 14 Aug 2020
Cited by 1 | Viewed by 2958
Abstract
The research in this article examines the emotional associations people have to common weather words and to selected terms that appear in weather communications (e.g., severe thunderstorm warning). A sample of 420 university students provided ratings for each term along four dimensions: 1. [...] Read more.
The research in this article examines the emotional associations people have to common weather words and to selected terms that appear in weather communications (e.g., severe thunderstorm warning). A sample of 420 university students provided ratings for each term along four dimensions: 1. Valence (unhappy vs. happy), 2. Arousal (calm vs. excited), 3. Dominance (in control/dominant vs. controlled/passive), and 4. Surprise (unsurprising/predictable vs. surprising/unpredictable). The results of this research provide descriptive statistical data for the 141 weather words along the four dimensions. The author also examined the correlations of the four dimensions across the terms and observed a high degree of association between the rated arousal and surprise characteristics of terms. In addition, the results revealed the clustering of weather words according to shared similarities across the four affective dimensions (illustrating affective-based synonymy). The results of the research are significant because they reveal a deeper understanding of the subjective and emotional experiences of the atmosphere that people may have when describing the weather of a place. Similarly, the normative data from this research may be used in the analysis of weather- or climate-based communications to characterize the emotional significance or impact of a message. Full article
(This article belongs to the Special Issue Challenges in Applied Human Biometeorology)
Show Figures

Figure 1

23 pages, 3466 KiB  
Article
Validation of Satellite and Merged Rainfall Data over Ghana, West Africa
by Winifred Ayinpogbilla Atiah, Leonard Kofitse Amekudzi, Jeffrey Nii Armah Aryee, Kwasi Preko and Sylvester Kojo Danuor
Atmosphere 2020, 11(8), 859; https://doi.org/10.3390/atmos11080859 - 14 Aug 2020
Cited by 33 | Viewed by 4187
Abstract
In regions of sparse gauge networks, satellite rainfall products are mostly used as surrogate measurements for various rainfall impact studies. Their potential to complement rain gauge measurements is influenced by the uncertainties associated with them. This study evaluates the performance of satellites and [...] Read more.
In regions of sparse gauge networks, satellite rainfall products are mostly used as surrogate measurements for various rainfall impact studies. Their potential to complement rain gauge measurements is influenced by the uncertainties associated with them. This study evaluates the performance of satellites and merged rainfall products over Ghana in order to provide information on the consistency and reliability of such products. Satellite products were validated with gridded rain gauge data from the Ghana Meteorological Agency (GMet) on various time scales. It was observed that the performance of the products in the country are mostly scale and location dependent. In addition, most of the products showed relatively good skills on the seasonal scale (r > 0.90) rather than the annual, and, after removal of seasonality from the datasets, except ARC2 that had larger biases in most cases. Again, all products captured the onsets, cessations, and spells countrywide and in the four agro-ecological zones. However, CHIRPS particularly revealed a better skill on both seasonal and annual scales countrywide. The products were not affected by the number of gauge stations within a grid cell in the Forest and Transition zones. This study, therefore, recommends all products except ARC2 for climate impact studies over the region. Full article
(This article belongs to the Special Issue Precipitation Observations)
Show Figures

Graphical abstract

18 pages, 4225 KiB  
Article
Spatial-Temporal Pattern Changes of UTCI in the China-Pakistan Economic Corridor in Recent 40 Years
by Di Zeng, Jinkui Wu, Yaqiong Mu, Mingshan Deng, Yanqiang Wei and Weibing Sun
Atmosphere 2020, 11(8), 858; https://doi.org/10.3390/atmos11080858 - 13 Aug 2020
Cited by 28 | Viewed by 4289
Abstract
This paper investigated the spatial and temporal variations of the Universal Thermal Climate Index (UTCI) of the China-Pakistan Economic Corridor (CPEC) from 1979 to 2018. The European Centre for Medium-Range Weather Forecasts Re-Analysis-Interim (ERA-Interim) reanalysis data from the European Centre for Medium-Range Weather [...] Read more.
This paper investigated the spatial and temporal variations of the Universal Thermal Climate Index (UTCI) of the China-Pakistan Economic Corridor (CPEC) from 1979 to 2018. The European Centre for Medium-Range Weather Forecasts Re-Analysis-Interim (ERA-Interim) reanalysis data from the European Centre for Medium-Range Weather Forecasts (ECMWF) is selected for UTCI calculation in the region and analyzed by a linear trend and correlation analysis. The results showed that (1) the UTCI of CPEC is decreased with the increase of latitude and altitude. There is obvious spatial heterogeneity in the seasonal scale and the spatial distribution of different thermal stress categories. (2) UTCI generally exhibited a positive trend of 0.33 °C/10a over the past 40 years, and the seasonal variation characteristics of UTCI show an upward trend in all four seasons, of which spring is the fastest. On the space scale, the growth trend has significant spatial variations. (3) Temperature has a positive correlation with UTCI. The influence of temperature on UTCI is greater than that of wind speed. The results of this study will be helpful for regional planning and also contribute to comprehending the characteristics of the thermal environment in CPEC. Full article
(This article belongs to the Special Issue Challenges in Applied Human Biometeorology)
Show Figures

Graphical abstract

18 pages, 6086 KiB  
Article
Cloudiness Information Services for Solar Energy Management in West Africa
by Derrick Kwadwo Danso, Sandrine Anquetin, Arona Diedhiou and Rabani Adamou
Atmosphere 2020, 11(8), 857; https://doi.org/10.3390/atmos11080857 - 13 Aug 2020
Cited by 8 | Viewed by 3587
Abstract
In West Africa (WA), interest in solar energy development has risen in recent years with many planned and ongoing projects currently in the region. However, a major drawback to this development in the region is the intense cloud cover that reduces the incoming [...] Read more.
In West Africa (WA), interest in solar energy development has risen in recent years with many planned and ongoing projects currently in the region. However, a major drawback to this development in the region is the intense cloud cover that reduces the incoming solar radiation when present and causes fluctuations in solar power production. Therefore, understanding the occurrence of clouds and their link to the surface solar radiation in the region is important for making plans to manage future solar energy production. In this study, we use the state-of-the-art European Centre for Medium-range Weather Forecasts ReAnalysis (ERA5) dataset to examine the occurrence and persistence of cloudy and clear-sky conditions in the region. Then, we investigate the effects of cloud cover on the quantity and variability of the incoming solar radiation. The cloud shortwave radiation attenuation (CRASW) is used to quantify the amount of incoming solar radiation that is lost due to clouds. The results showed that the attenuation of incoming solar radiation is stronger in all months over the southern part of WA near the Guinea Coast. Across the whole region, the maximum attenuation occurs in August, with a mean CRASW of about 55% over southern WA and between 20% and 35% in the Sahelian region. Southern WA is characterized by a higher occurrence of persistent cloudy conditions, while the Sahel region and northern WA are associated with frequent clear-sky conditions. Nonetheless, continuous periods with extremely low surface solar radiation were found to be few over the whole region. The analysis also showed that the surface solar radiation received from November to April only varies marginally from one year to the other. However, there is a higher uncertainty during the core of the monsoon season (June to October) with regard to the quantity of incoming solar radiation. The results obtained show the need for robust management plans to ensure the long-term success of solar energy projects in the region. Full article
Show Figures

Figure 1

21 pages, 2582 KiB  
Article
Accurate, Low Cost PM2.5 Measurements Demonstrate the Large Spatial Variation in Wood Smoke Pollution in Regional Australia and Improve Modeling and Estimates of Health Costs
by Dorothy L. Robinson
Atmosphere 2020, 11(8), 856; https://doi.org/10.3390/atmos11080856 - 13 Aug 2020
Cited by 18 | Viewed by 17942
Abstract
The accuracy and utility of low-cost PM2.5 sensors was evaluated for measuring spatial variation and modeling population exposure to PM2.5 pollution from domestic wood-heating (DWH) in Armidale, a regional town in New South Wales (NSW), Australia, to obtain estimates of health [...] Read more.
The accuracy and utility of low-cost PM2.5 sensors was evaluated for measuring spatial variation and modeling population exposure to PM2.5 pollution from domestic wood-heating (DWH) in Armidale, a regional town in New South Wales (NSW), Australia, to obtain estimates of health costs and mortality. Eleven ‘PurpleAir’ (PA) monitors were deployed, including five located part of the time at the NSW government station (NSWGov) to derive calibration equations. Calibrated PA PM2.5 were almost identical to the NSWGov tapered element oscillating microbalance (TEOM) and Armidale Regional Council’s 2017 DustTrak measurements. Spatial variation was substantial. National air quality standards were exceeded 32 times from May–August 2018 at NSWGov and 63 times in one residential area. Wood heater use by about 50% of households increased estimated annual PM2.5 exposure by over eight micrograms per cubic meter, suggesting increased mortality of about 10% and health costs of thousands of dollars per wood heater per year. Accurate real-time community-based monitoring can improve estimates of exposure and avoid bias in estimating dose-response relationships. Efforts over the past decade to reduce wood smoke pollution proved ineffective, perhaps partly because some residents do not understand the health impacts or costs of wood-heating. Real-time Internet displays can increase awareness of DWH and bushfire pollution and encourage governments to develop effective policies to protect public health, as recommended by several recent studies in which wood smoke was identified as a major source of health-hazardous air pollution. Full article
(This article belongs to the Special Issue Regional Air Quality Modeling)
Show Figures

Graphical abstract

25 pages, 741 KiB  
Article
Refinements to Data Acquired by 2-Dimensional Video Disdrometers
by Michael L. Larsen and Christopher K. Blouin
Atmosphere 2020, 11(8), 855; https://doi.org/10.3390/atmos11080855 - 13 Aug 2020
Cited by 3 | Viewed by 2171
Abstract
The 2-Dimensional Video Disdrometer (2DVD) is a commonly used tool for exploring rain microphysics and for validating remotely sensed rain retrievals. Recent work has revealed a persistent anomaly in 2DVD data. Early investigations of this anomaly concluded that the resulting errors in rain [...] Read more.
The 2-Dimensional Video Disdrometer (2DVD) is a commonly used tool for exploring rain microphysics and for validating remotely sensed rain retrievals. Recent work has revealed a persistent anomaly in 2DVD data. Early investigations of this anomaly concluded that the resulting errors in rain measurement were modest, but the methods used to flag anomalous data were not optimized, and related considerations associated with the sample sensing area were not fully investigated. Here, we (i) refine the anomaly-detecting algorithm for increased sensitivity and reliability and (ii) develop a related algorithm for refining the estimate of sample sensing area for all detected drops, including those not directly impacted by the anomaly. Using these algorithms, we explore the corrected data to measure any resulting changes to estimates of bulk rainfall statistics from two separate 2DVDs deployed in South Carolina combining for approximately 10 total years of instrumental uptime. Analysis of this data set consisting of over 200 million drops shows that the error induced in estimated total rain accumulations using the manufacturer-reported area is larger than the error due to considerations related to the anomaly. The algorithms presented here imply that approximately 4.2% of detected drops are spurious and the mean reported effective sample area for drops believed to be correctly detected is overestimated by ~8.5%. Simultaneously accounting for all of these effects suggests that the total accumulated rainfall in the data record is approximately 1.1% larger than the raw data record suggests. Full article
Show Figures

Figure 1

26 pages, 14850 KiB  
Article
Multi-Scale Transects of Three North American Drylines
by Loren D. White and Duanjun Lu
Atmosphere 2020, 11(8), 854; https://doi.org/10.3390/atmos11080854 - 13 Aug 2020
Cited by 1 | Viewed by 2412
Abstract
North American drylines are distinct air mass boundaries that have often been examined for their relation to the initiation of severe convective storms. Three cases of drylines occurring in synoptically quiescent environments are analyzed using data obtained from a single mobile platform in [...] Read more.
North American drylines are distinct air mass boundaries that have often been examined for their relation to the initiation of severe convective storms. Three cases of drylines occurring in synoptically quiescent environments are analyzed using data obtained from a single mobile platform in concert with data from operational synoptic and mesoscale observing systems. Very distinct moisture contrasts were noted in a nocturnal April case in mountainous terrain in the Trans-Pecos region of West Texas. The other two cases revealed multi-step moisture transitions within synoptically diffuse moisture gradients. Their evolution over time suggests that such multi-step patterns may be associated with diurnal and geographic forcing transitions, as well as positioning of deep moist convection. Full article
(This article belongs to the Section Meteorology)
Show Figures

Graphical abstract

11 pages, 1997 KiB  
Article
Arable Weed Patterns According to Temperature and Latitude Gradient in Central and Southern Spain
by María Luisa Gandía, Carlos Casanova, Francisco Javier Sánchez, José Luís Tenorio and María Inés Santín-Montanyá
Atmosphere 2020, 11(8), 853; https://doi.org/10.3390/atmos11080853 - 13 Aug 2020
Cited by 2 | Viewed by 2769
Abstract
(1) Background: In agro-ecosystems, the success of the crops has a strong connection to biodiversity in the landscape. In the face of climate change, it is important to understand the response to environmental variation of weed species by means of their distribution. In [...] Read more.
(1) Background: In agro-ecosystems, the success of the crops has a strong connection to biodiversity in the landscape. In the face of climate change, it is important to understand the response to environmental variation of weed species by means of their distribution. In the last century, biodiversity has been impacted due to a variety of stresses related to climate change. Although the composition of vegetation tends to change at a slower rate than climate change, we hypothesize species present in weed communities are distributed in diverse patterns as a response to the climate. Therefore, the general aim of this paper is to investigate the effect of temperature, using latitude as an indicator, on the composition and distribution of weed communities in agro-ecosystems. (2) Methods: Weeds were monitored in georeferenced cereal fields which spanned south and central Spanish regions. The graphic representation according to latitude allowed us to identify groups of weeds and associate them to a temperature range. We classified weeds as generalist, regional, or local according to the range of distribution. (3) Results: The monitoring of species led to the classification of weeds as generalist, regional or local species according to latitude and associated temperature ranges. Three weed species that were present in all latitude/temperature regions, were classified as generalist (Linaria micrantha (Cav) Hoffmanns & Link, Sonchus oleraceous L., and Sysimbrium irium L.). The species were classified as regional or local when their presence was limited to restricted latitude/temperature ranges. One weed, Stellaria media (L.) Vill., was considered a local species and its distribution dynamics can be considered an indicator of temperature. (4) Conclusions: The novel methodology used in this study to assign weed distribution as an indicator of climatic conditions could be applied to evaluate climate gradients around the world. Full article
(This article belongs to the Special Issue Plant Adaptation to Global Climate Change)
Show Figures

Figure 1

Previous Issue
Back to TopTop