Article

Health Effects of Air-Quality Regulations in Seoul Metropolitan Area: Applying Synthetic Control Method to Controlled-Interrupted Time-Series Analysis

1
BK21PLUS Program in ‘Embodiment: Health–Society Interaction’, Department of Public Health Science, Graduate School, Korea University, Seoul 02841, Korea
2
College of Health Science, Korea University, Seoul 02841, Korea
3
School of Health Policy and Management, College of Health Science, Korea University, Seoul 02841, Korea
4
Department of Environmental Health, Korea University, Seoul 02841, Korea
*
Author to whom correspondence should be addressed.
Atmosphere 2020, 11(8), 868; https://doi.org/10.3390/atmos11080868
Submission received: 26 July 2020 / Revised: 12 August 2020 / Accepted: 13 August 2020 / Published: 16 August 2020
(This article belongs to the Special Issue Regional Air Quality Modeling)

Abstract

:
Despite enormous investment in air-quality regulations, there are only a few studies about the health effects of the air-quality regulations. By applying synthetic control methods to controlled-interrupted time-series analysis, this study aimed to test whether air-quality regulations implemented in Seoul metropolitan area since 2005 had reduced cardiovascular mortality rate in Seoul and Incheon. Each synthetic control for Seoul and Incheon was constructed to predict the counterfactual cardiovascular mortality rate through synthetic control methods. By using a synthetic control as a control group in controlled-interrupted time-series analysis, we tested whether the air-quality regulations had changed the trend of cardiovascular mortality rate in Seoul and Incheon after the intervention. The results showed a significant slope change in cardiovascular mortality rate in Seoul (coefficient: −0.001, 95% confidence interval (CI): −0.0015, −0.0004) and Incheon (coefficient: −0.0006, 95% CI: −0.0012, 0). This study suggests additional evidence that air-quality regulations implemented in the Seoul metropolitan areas since 2005 had beneficial effects on cardiovascular mortality rate in Seoul and Incheon.

1. Introduction

As exposure to air pollution became a major public health concern [1,2,3,4], diverse air-quality regulations had been introduced worldwide. However, relatively small numbers of studies have been conducted to investigate whether an air-quality regulation had beneficial effects on public health and if it had, how much the air-quality regulation contributed to the improvement of public health (also called the accountability research). Even though there is a growing interest in the health effect of air-quality regulations in recent years, there remains a need for further studies to help decision-makers design more effective policies [5,6].
In South Korea, exposure to particulate matter (PM) especially became the most serious health problem. The budget allocated to reduce PM air pollution has continued to grow from 800 million US dollars in 2016 to 27 billion US dollars in 2019 [7]. Especially in the Seoul metropolitan area, there were massive air-quality regulations since 2005, which had followed a special law enacted to improve the air quality of the Seoul metropolitan area. Although an enormous amount of funds has been invested in air-quality regulations in South Korea, only a few studies were conducted about the health effects of the air-quality regulations. For example, Han et al. (2018) found that the air-quality regulations implemented in the Seoul metropolitan area after 2005 had beneficial effects on cardiovascular and cerebrovascular deaths [8]. Kim et al. (2019) also found that the same regulations had beneficial effects on reducing hospital visits for asthma [9].
On the other hand, many previous studies—including the studies in South Korea—have used quasi-experimental study designs to evaluate health effects of regulations. These study designs estimate health effects of an intervention by comparing the longitudinal trend of a health outcome between an intervention group and its control group. Therefore, the validity of the results from quasi-experimental study designs is susceptible to the selection of a control group [10,11]. Nevertheless, there is no standard criterion to select a control group in quasi-experimental study designs. Therefore, it is crucial to provide evidence from different control selections and check the robustness of the results.
Previous studies in South Korea have used a single region as a control group with similar characteristics as an intervention group [8,9]. However, results from studies using a single region as a control group can be easily confounded when the single region has any difference in longitudinal trend of potential confounders with the intervention group. To overcome this problem, this study constructed a virtual control group, the ‘synthetic control’, which could prevent these problems. The synthetic control method (SCM) constructs an optimal synthetic control that can predict a counterfactual outcome that would occur if the intervention would not have been implemented in the intervention group [12,13].
Because the air quality in the Seoul metropolitan area has improved after air-quality regulations, this study hypothesizes that the air-quality regulations in the Seoul metropolitan area after 2005 would have led to decreases in cardiovascular mortality rate in Seoul and Incheon. This study tested the hypothesis by applying SCM to controlled-interrupted time-series analysis (C-ITSA), which is one of the most common types of quasi-experimental study designs. Finally, this study aimed to suggest additional evidence about the health effects of air-quality regulations in South Korea.

2. Materials and Methods

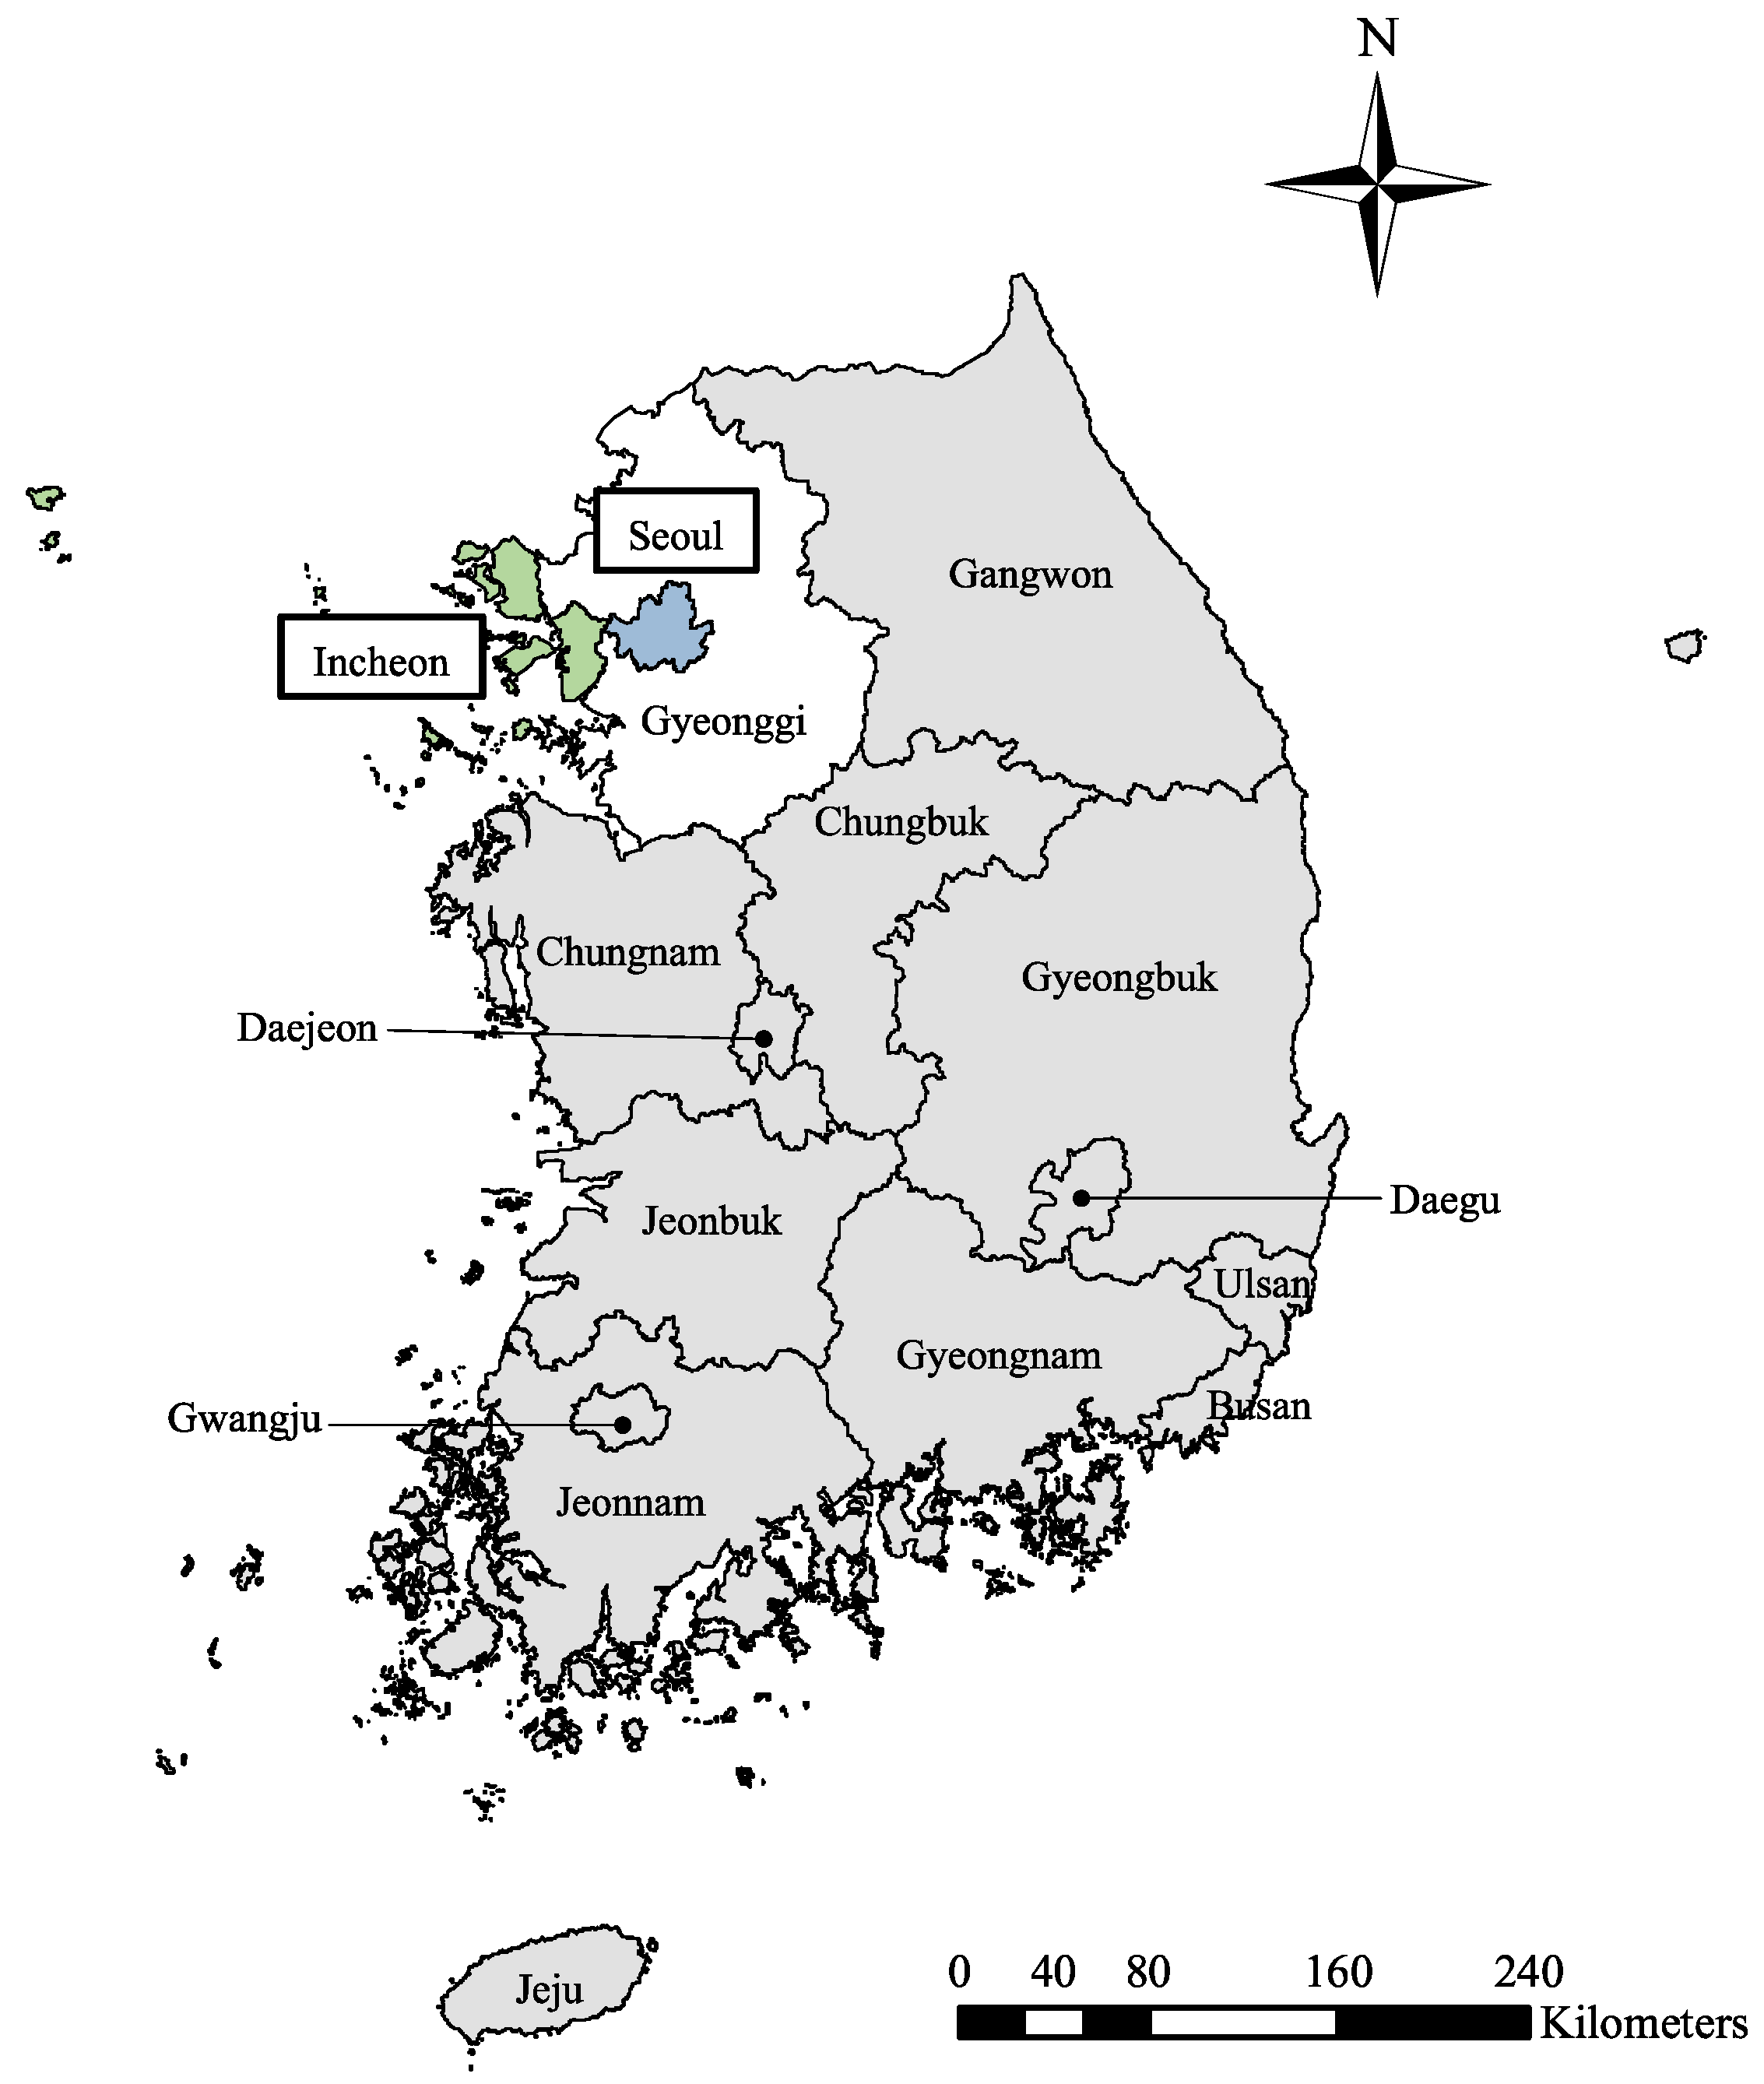
2.1. Intervention and Study Population

This study defined an intervention as a series of air-quality regulations implemented in Seoul metropolitan area after 2005. The regulations had been implemented based on a region-specific law, ‘The Special Act on The Improvement of Air Quality in Seoul Metropolitan Area (2003)’, which was set to improve air quality in the Seoul metropolitan area. Even though diverse air-quality regulations were conducted, much of the effort was focused on reducing the emission of air pollutants from on-road mobile sources (Supplementary Table S1) [14].
The Seoul metropolitan area consists of two metropolitan cities, Seoul and Incheon and one province, Gyeonggi. The intervention groups were defined as Seoul and Incheon (Figure 1). Gyeonggi was not included as an intervention group because the regulations were not implemented in some districts in Gyeonggi. To construct the synthetic control, this study also defined potential control groups as each region in South Korea other than the Seoul metropolitan area. The potential control groups should have similar characteristics with the intervention groups, but should not be affected by the intervention of interest. For this reason, the potential control groups include five metropolitan cities (Busan, Daegu, Gwangju, Daejeon and Ulsan) and eight provinces (Gangwon, Chungbuk, Chungnam, Jeonbuk, Jeonnam, Gyeongbuk, Gyeongnam and Jeju) (Figure 1).
The study period was from January 1998 to December 2017. Pre- and post-intervention periods were defined by a descriptive analysis of air quality, not by the time point of the first regulation. The health effects would not have occurred as soon as the implementation of regulations, but it would have followed the improvement of air quality. Moreover, a significant part of the regulations was conducted simultaneously and through several phases. Although the local governments carried out some regulations from 2005, most of the major regulations were implemented after 2007. Therefore, this study defined the time point from when the health effects would have appeared by a descriptive analysis of air quality.

2.2. Data

For the descriptive analysis of air quality, data for hourly measured concentration of particulate matters less than 10 μm (PM10), nitrogen dioxides (NO2) and sulfur dioxide (SO2) of each monitoring station in South Korea for 1998–2017 were obtained from the National Institute of Environmental Research. There were 25 and 15 monitoring stations in Seoul and Incheon, respectively, which located in residential areas. The representative value for hourly concentration in each city was computed by averaging hourly measured concentration in the stations. Then, the annual mean concentration was calculated from the 24-h mean for each city.
Daily mortality data were obtained from National Statistics Korea for 1998–2017. The monthly age-standardized mortality rate due to cardiovascular deaths [ICD–10, I00–I99] was calculated for January 1998–December 2017. The age-standardized mortality rate was computed using the direct method with a standard population of South Korea in 2005. For constructing synthetic controls, we used some indicators that predict cardiovascular mortality rate. The predictors included smoking rate [15,16], ambient concentration of PM10 [17,18,19], temperature [20,21,22], influenza epidemic measured by age-standardized mortality rate for pneumonia [ICD–10, J12–17] [23,24,25], gross regional domestic product (GRDP) which means the gross domestic product for each region [26], proportion of urban population [27] and the quality of healthcare services measured by age-standardized mortality rate for the avoidable deaths [28,29].
The annual smoking rate in each region during 1998, 2001 and 2005–2017 was calculated using the data from the Korean National Health and Nutrition Examination Survey (K-NHANES). Because K-NHANES was not conducted in 1999–2000 and 2002–2004, missing values during this period were imputed by predicting values with simple linear regression. The annual smoking rate was assumed to remain the same during months in the same year. The data for the monthly temperature in each region from January 1998 to December 2017 were obtained from the Korea Meteorological Administration. The monthly age-standardized mortality rate due to pneumonia and the avoidable deaths in each region from January 1998 to December 2017 were computed using daily mortality data from the National Statistics Korea. Pneumonia mortality rate and the avoidable mortality rate were used as a proxy of the influenza epidemic and the quality of healthcare services, respectively [23,28]. Annual GRDP and proportion of urban population in each region during 1998–2017 were obtained from the National Statistics Korea. The annual GRDP and annual proportion of urban population were also assumed that the annual value would remain the same during months in the same year.

2.3. Statistical Analysis

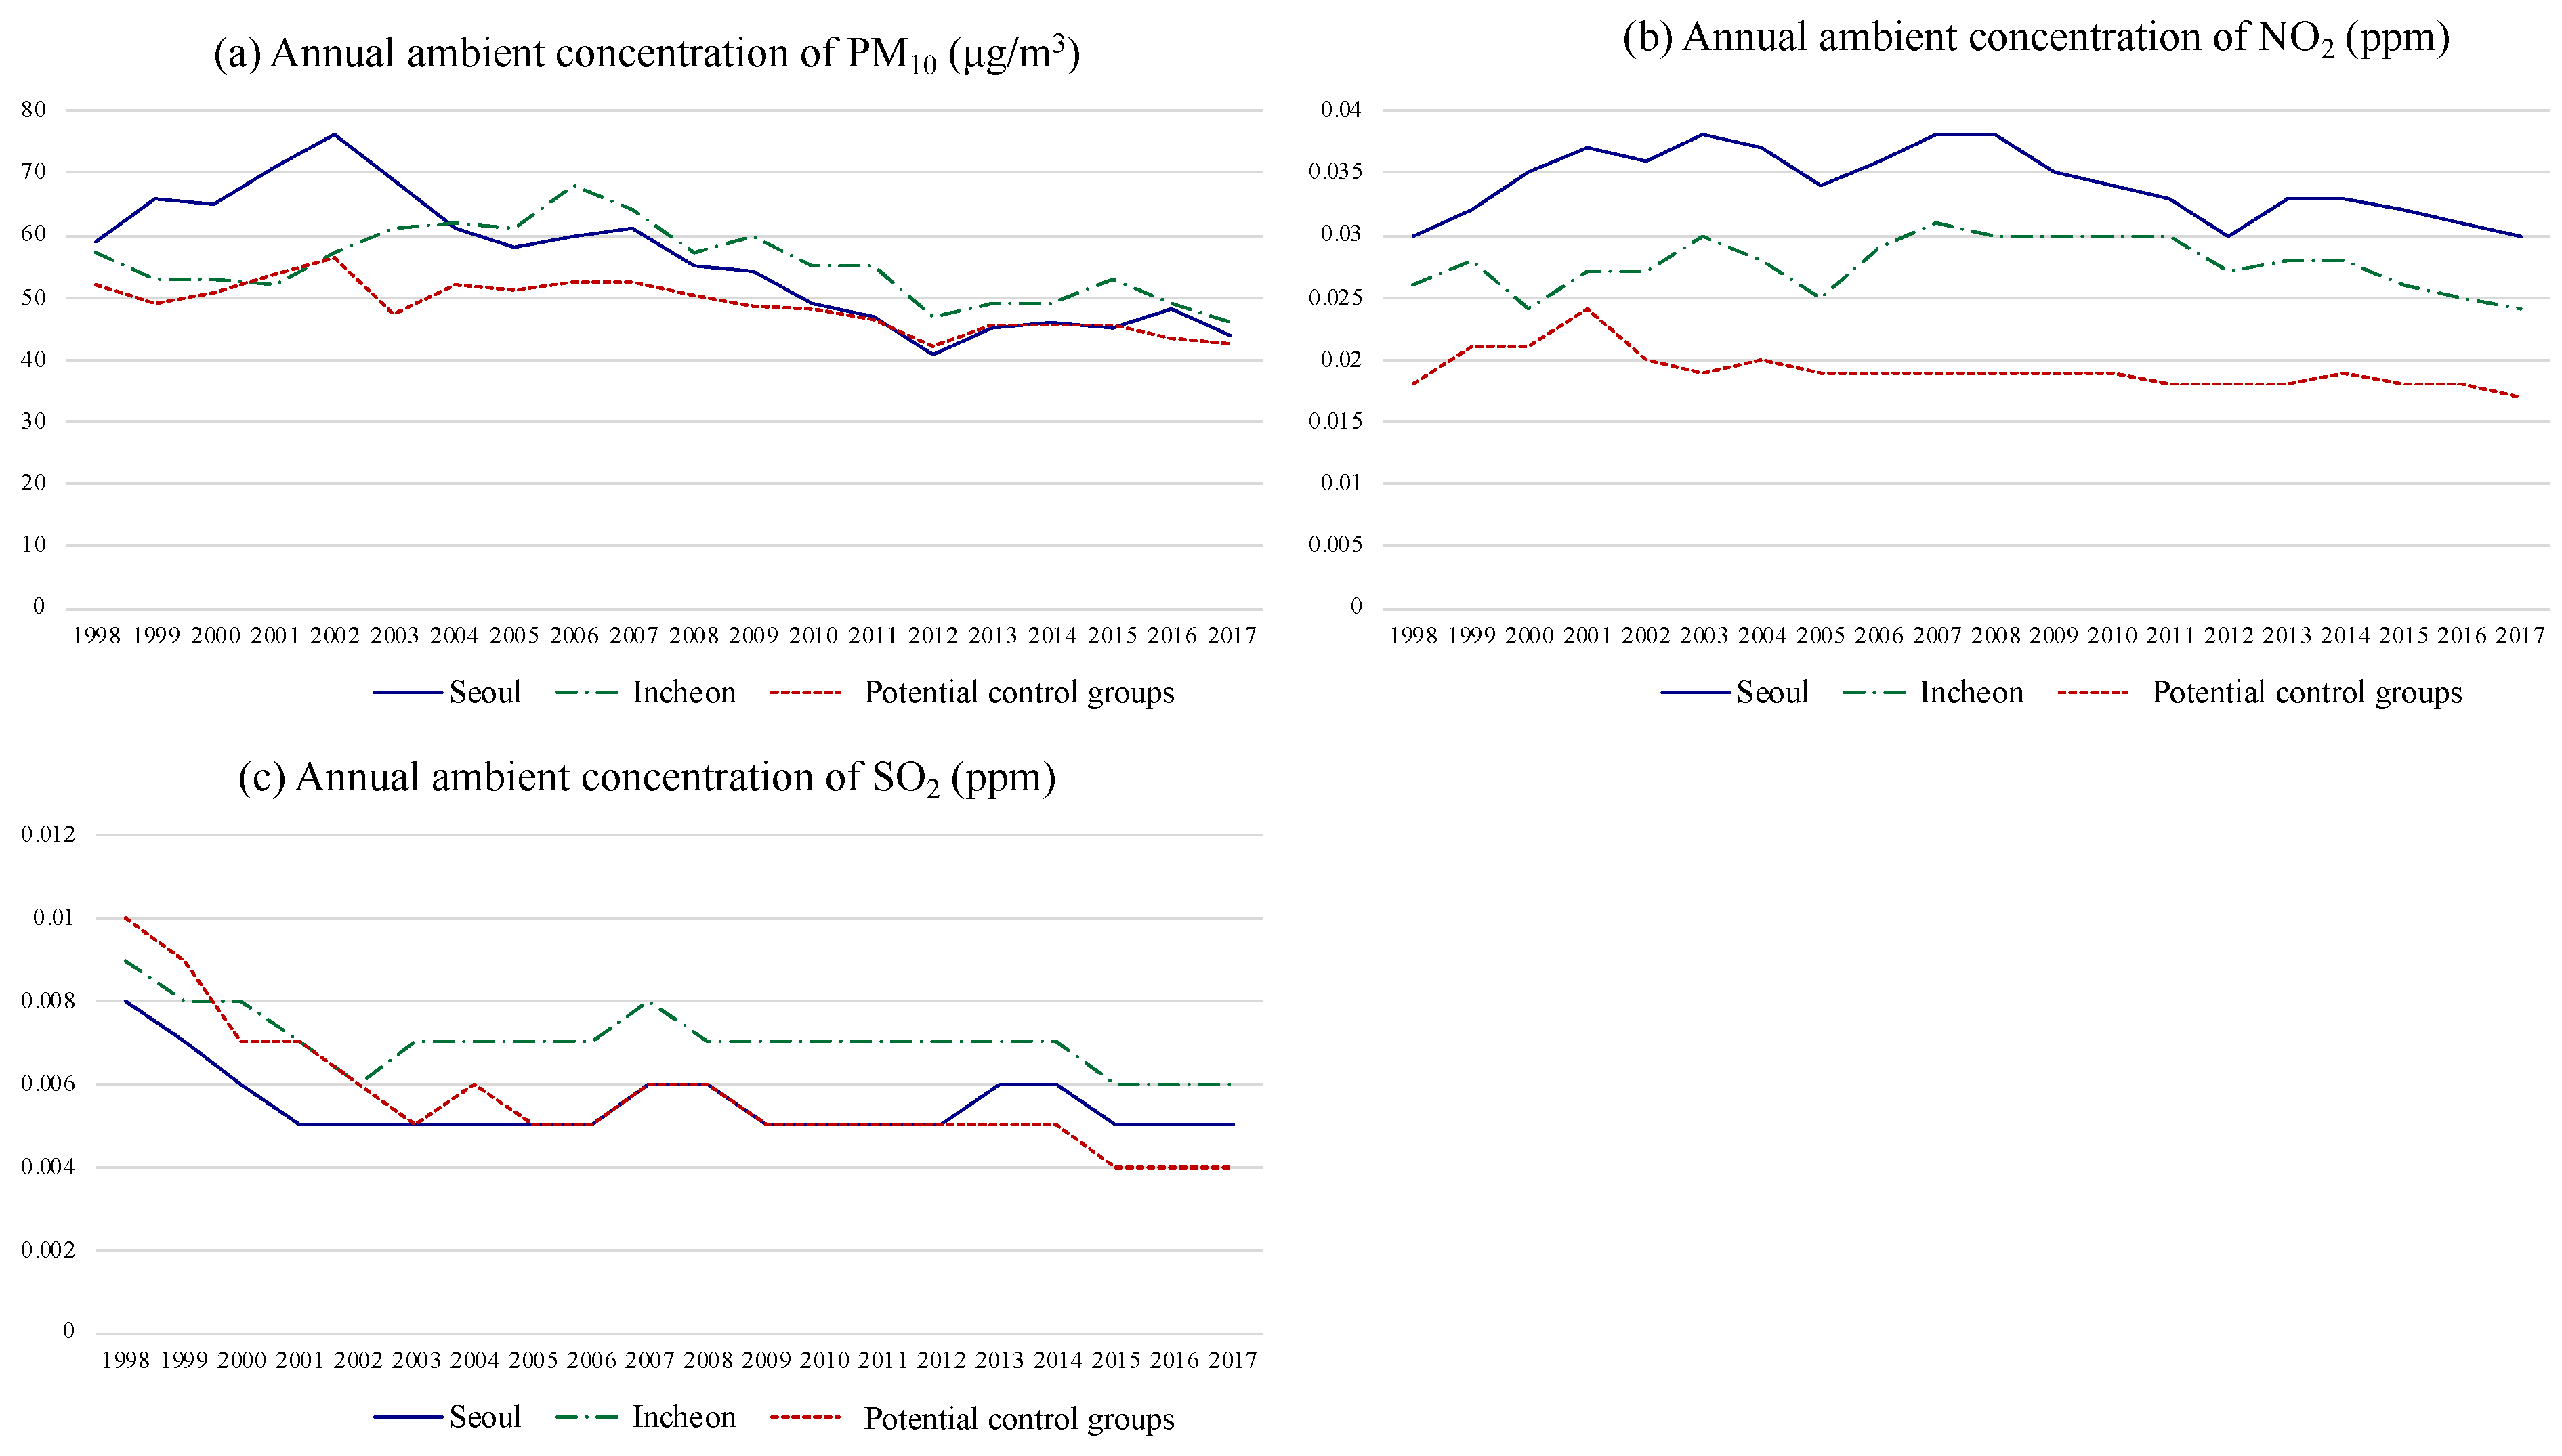
2.3.1. Descriptive Analysis of Air Quality

In the descriptive analysis of air quality, the annual ambient concentrations of PM10, NO2 and SO2 in Seoul and Incheon were compared with that in the potential control groups. The representative value of the potential control groups was calculated by averaging annual ambient concentration of PM10, NO2 and SO2 among the potential control groups. Based on the descriptive results of air quality, we defined the time point from when the health effect would have appeared. In addition—at the stage of C-ITSA—whether the health effect would have appeared abruptly (a step change) or gradually (a slope change) was determined by the descriptive analysis of air quality.

2.3.2. Synthetic Control Method

Using the data of cardiovascular mortality rate and its predictors for the pre-intervention period, optimal synthetic controls were constructed to predict the counterfactual mortality rate for the post-intervention period. Two kinds of weights were determined for each potential control group and each predictor, respectively. Both weights were restricted to have nonnegative values and to sum to one.
At first, the weights for each predictor ( v m in Equation (1)) were selected depending on their relative importance in predicting the mortality rate. Then, the weights for each potential control group (W in Equation (1)) were chosen so that a synthetic control had similar values with the intervention group in cardiovascular mortality rate and the other predictors. The optimal weights for each potential control group are chosen to minimize the Equation (1). Both weights for the potential control groups and the predictors were determined by the Synth package in R (version 3.6.0) (For more details, see Abadie et al. 2011) [30].
m = 1 8 v m ( X i m X 0 m W ) 2
( X i m : the value of m-th predictor for the intervention group (i = 1, 2), X 0 m : a 1*13 vector of m-th variable for the potential control groups (j = 1, …, 13), v m : a weight for m-th predictor, W : a 13*1 vector of weights for the potential control groups).
After determining the optimal weights for each potential control group W*, the counterfactual mortality rate at a specific time point in each synthetic control of Seoul and Incheon was estimated as a weighted average of mortality rate in the potential control groups (Equation (2)).
Y i t =   j = 1 13 w j * Y j t
(t: month, Y i t : estimated mortality rate in i-th intervention group at time t (i = 1, 2), w j * : a weight assigned for j-th potential control group, Y j t : mortality rate in j-th potential control group at time t).
In order to predict the counterfactual mortality rate in Seoul and Incheon accurately, good prediction in the pre-intervention period should be premised. Therefore, the prediction fit of the synthetic controls in the pre-intervention period was checked through prediction errors [12,13,31]. The normalized root mean squared error (NRMSE) was calculated to measure the extent of prediction errors. The NRMSE was calculated by dividing root mean squared error (RMSE) of each variable to the average value of the variable in the intervention group, as shown in Equation (3). The NRMSE of synthetic controls was compared with Daejeon, which was used as a control group in the previous studies in South Korea [8,9]:
N R M S E i j = R M S E i j / X ¯ i j = 1 X ¯ i j t = 1 T 0 ( X i j t X 0 j t ) 2 T 0
(i: i-th intervention group (i = 1, 2), j: j-th predictor, T 0 : the last months before the intervention, X i j k : a value of j-th variable in i-th intervention group at time k, X 0 j k : a value of j-th variable in a synthetic control at time k, X ¯ i j : mean value of j-th variable in i-th intervention group during pre-intervention period).

2.3.3. Controlled-Interrupted Time-Series Analysis

This study conducted C-ITSA using the generalized Poisson regression model to estimate the health effects of the intervention. In order to adjust the effects of time-varying confounders, the counterfactual mortality rate predicted by synthetic controls was controlled through the weighting method suggested by Yorifuji & Kashima (2016) [32]. As shown in Equation (4), the mortality rate observed in Seoul or Incheon was weighted with the ratio of the mortality rate in a synthetic control at time t to the mortality rate in the synthetic control at time t0:
E ( y ) = m o r i , t × ( m o r 0 , t 0 / m o r 0 , t )
(t: month, i: i-th intervention group (i = 1, 2) m o r i , t : mortality rate in i-th intervention group at time t, m o r 0 ,   t : mortality rate in a synthetic control at time t, m o r 0 , t 0 : mortality rate in a synthetic control at the first month t0 which is January 1998 in this study).
Equation (5) shows the final regression model. Since there was a gradual decrease in the ambient concentration of air pollution, this study modeled that there might be a gradual change (a slope change) in the mortality rate, not an abrupt change (a step change). In Equation (5), β1 means the trend of the weighted mortality rate in the pre-intervention period and β2 means the change in the trend after the intervention. If the intervention had effects on reducing cardiovascular mortality rate, an estimated β2 would have a negative value. The seasonality and autoregression were additionally adjusted for in the model as a covariate. The seasonality was adjusted with a seasonal dummy variable. The autoregression was tested by autocorrelation function (ACF) and partial autocorrelation function (PACF) and was adjusted with the first-order autoregressive error term (AR (1)). SAS version 9.4 was used for the analysis:
log E ( y ) =   β 0 + β 1 × t + β 2 × t a f t e r + s e a s o n + A R ( 1 )
(t: month that ranged from January 1998 to December 2017, t a f t e r : time after the intervention that has zero values during pre-intervention periods and increase by one from a time point of the intervention, season: seasonal dummy variable, AR(1): first-order autoregressive error term (only adjusted when there is autoregression)).

2.3.4. Sensitivity Analysis

Several sensitivity analyses were conducted to confirm the robustness of the results. First, because there is no gold standard method to control the counterfactual mortality rate in C-ITSA, the direct adjustment of the counterfactual mortality rate in the synthetic control was used alternatively. We directly adjusted the mortality rate in synthetic controls as a covariate using smoothing spline function.
Secondly, synthetic controls were reconstructed by restricting the inclusion criteria for the potential control group. Although the air-quality regulations in the Seoul metropolitan area were implemented much intensely than any other air-quality regulations in other regions in South Korea, there were similar air-quality regulations in some regions [33]. In particular, Busan, Daegu and Jeonnam (Gwangyang bay) were designated as ‘air quality control region’ in 1999 [34]. These three regions also had planned and implemented comprehensive air-quality regulations during the 2000s. The inclusion of these regions in the potential control group may underestimate the health effects of the intervention. Thus, these regions were excluded from the potential control groups in a sensitivity analysis. For the same reason, synthetic controls were reconstructed excluding neighboring regions (Gangwon, Chungbuk, Chungnam and Daejeon) on the intervention groups to rule out spillover effects of the air-quality regulations in the Seoul metropolitan area.
Third, we tested whether the results were sensitive to the time point of the health effects. Although the reduction of air pollution started in 2007, early regulations were implemented from 2005. In addition, it is possible that the health effects of the improved air quality may have appeared with a lag [35]. Therefore, synthetic controls were reconstructed using 2005 and 2008 as a time point of the health effects.

3. Results

3.1. Descriptive Results of Air Quality

Figure 2 shows the annual ambient concentration of PM10, NO2 and SO2 in South Korea during 1998–2017. PM10 concentration in the intervention groups had a rapid decrease compared to the potential control groups. PM10 concentration in Seoul showed a decline since the early 2000s. The early decline of PM10 concentration in Seoul may be due to other air-quality regulations implemented before 2005, for example, the replacement of a diesel bus by a compressed natural gas (CNG) bus [36,37]. PM10 concentration in Incheon showed a remarkable change in longitudinal trend after 2007. PM10 concentration in Incheon had increased until 2006, however, it turned into a decreasing trend in 2007. For the case of NO2, Seoul and Incheon showed a relatively rapid decrease than the potential control groups since 2007. There was no noticeable difference in the trend of SO2 concentration between the intervention groups and the potential control groups. To summarize, the effects of the air-quality regulations on air quality in Seoul and Incheon appeared from 2007. The time point of 2007 was also consistent with the time point when most major regulations were started to be implemented.
Based on the descriptive results, the pre-intervention period was defined as from January 1998 to December 2006. The health effects of the air-quality regulations were assumed to appear from January 2007 (the post-intervention period: January 2007–December 2017). In addition, because the air quality had changed gradually, this study modeled in C-ITSA that there would have been gradual health effects on cardiovascular mortality rate as well.

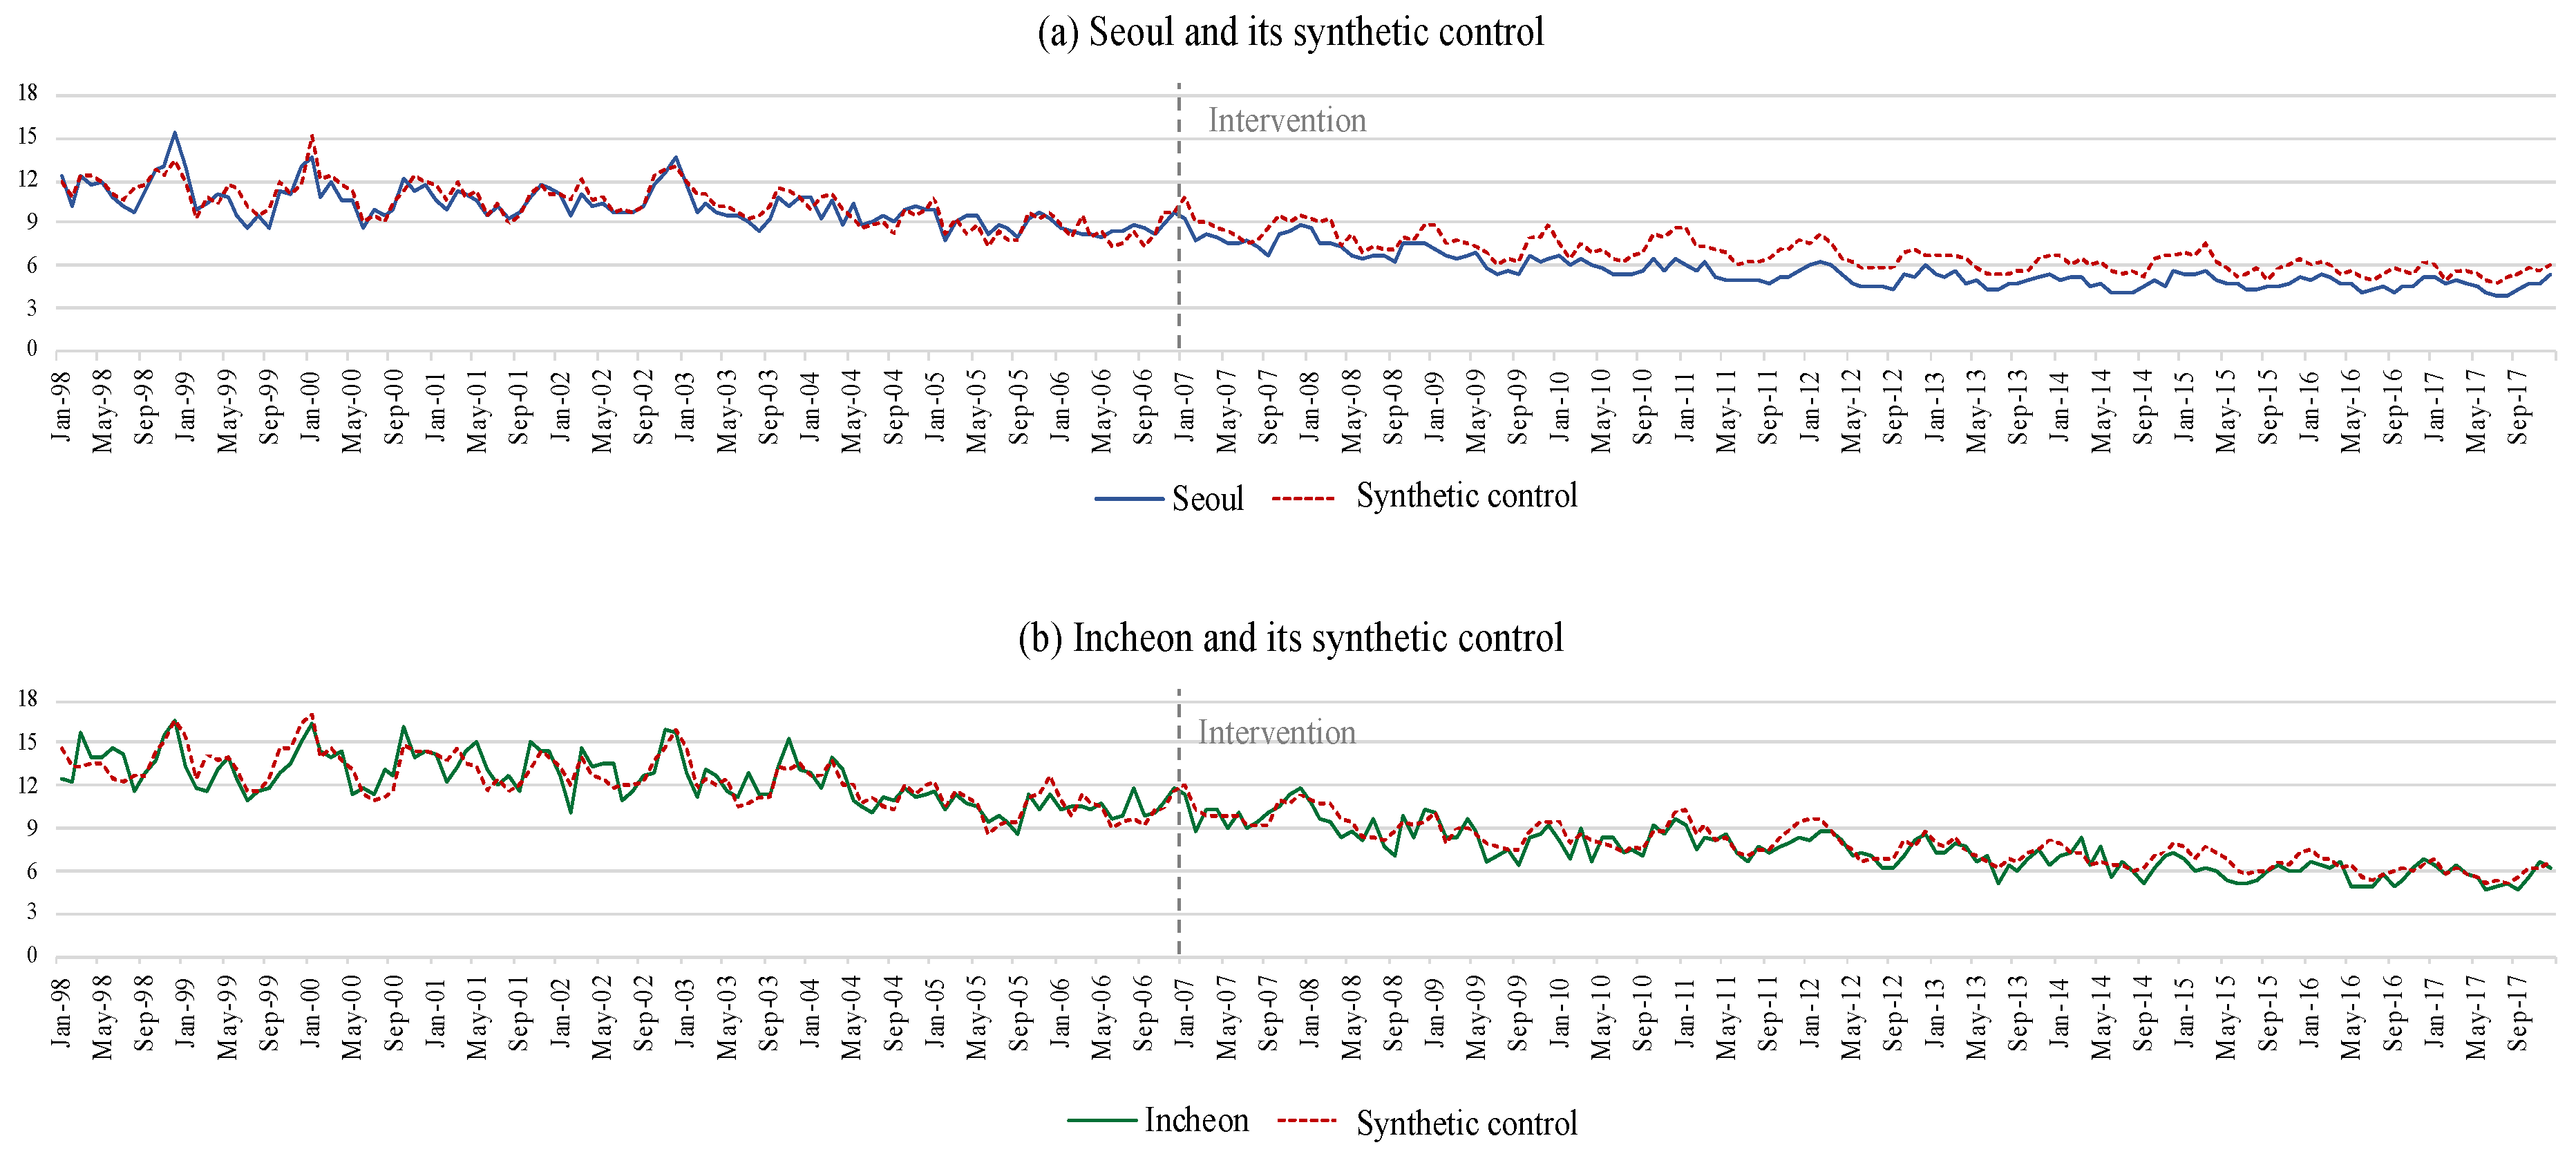
3.2. Synthetic Controls

Synthetic controls for Seoul and Incheon were made as a weighted average of the potential control groups (the weights of the potential control groups are suggested in Supplementary Table S2). Table 1 shows the monthly age-standardized cardiovascular mortality rate in Seoul, Incheon and its synthetic controls for the pre- and post-intervention period. In the pre-intervention period, synthetic controls had a similar level in the mortality rate with its intervention group. In the post-intervention period, synthetic controls showed a higher level in the mortality rate than its intervention group. Figure 3 shows the time-series trend in cardiovascular mortality rate in Seoul, Incheon and its synthetic controls. Similar to the results from Table 1, synthetic controls showed a similar time-series trend in the mortality rate with each intervention group in the pre-intervention period. In the post-intervention period, the intervention groups showed a steeper decreasing trend than in synthetic controls. The discrepancy of the mortality rate in the post-intervention period was more evident in Seoul than in Incheon.
Table 2 shows the NRMSEs of the predictors in the synthetic controls and Daejeon for the pre-intervention period. Even though NRMSEs for some predictors were larger in the synthetic controls than Daejeon, NRMSE for the main outcome variable (cardiovascular mortality rate), was much smaller in synthetic controls than Daejeon (Seoul vs. synthetic control: 0.07; Seoul vs. Daejeon: 0.14; Incheon vs. synthetic control: 0.08; Incheon vs. Daejeon: 0.18). The mean value of NRSMEs was also smaller in the synthetic controls than Daejeon (Seoul vs. synthetic control: 0.25; Seoul vs. Daejeon: 0.28; Incheon vs. synthetic control: 0.12; Incheon vs. Daejeon: 0.22). Thus, the synthetic controls were more comparable with each intervention group than Daejeon.

3.3. Controlled-Interrupted Time-Series Analysis

Results from C-ITSA are described in Table 3. The slope change of cardiovascular mortality rate toward negative directions was statistically significant in both Seoul and Incheon. β2 was estimated as −0.001 (95% confidence interval [CI]: −0.0015, −0.0004) for Seoul and −0.0006 (95% CI: −0.0012, 0) for Incheon. The estimates indicated that the decreasing trend in cardiovascular mortality rate got strengthened after the intervention.
In the sensitivity analyses, this study alternatively used the direct adjustment approach to control the counterfactual mortality rate. The results did not change significantly in both Seoul and Incheon (Supplementary Table S3). When reconstructing synthetic control with restricted potential control groups, we observed consistent results with the main results (Supplementary Table S4). When redefining the time point of the health effects, the results were also consistent with the main results (Supplementary Table S5). With sensitivity analyses, this study identified the robustness of the results.

4. Discussion

This study evaluated the effects of air-quality regulations implemented in Seoul metropolitan area after 2005 on cardiovascular mortality rates by applying SCM to C-ITSA. This study identified synthetic controls would have had a good prediction of the counterfactual mortality rate in Seoul and Incheon. Using the synthetic control as a control group, this study found beneficial effects of the air-quality regulations on cardiovascular mortality rate in both Seoul and Incheon. This study confirmed the robustness of the results through several sensitivity analyses.
Several studies reported the beneficial effects of air-quality regulations on cardiovascular mortality rate [8,32,38,39,40,41,42,43,44]. One of the studies evaluated the association between the same air-quality regulations as this study and cause-specific mortality rate, using Daejeon as a control group [8]. Although estimates from this study and Han et al. (2018) cannot be directly compared due to differences in modeling strategy, our results were partially consistent with the results from the study of Han et al. (2018) [8]. They found that cardiovascular mortality rate in Seoul changed −7.3% (95% CI: −11.1, −3.5) in 2008–2009, −10.2% (95% CI: −13.9, −6.5) in 2010–2011 and −8.3% (95% CI: −12, −4.4) in 2012–2013 compared to the referent period, 2004–2006. In contrast, results for Incheon were statistically significant only in 2008–2009 as −4.5% (95% CI: −8.1, −0.7). Results from quasi-experimental study designs can differ by the selection of the control group. Nonetheless, since there is no standard norm to select a control group, it is important to accumulate evidence with different control selections. Our findings consistent with Han et al. (2018) imply possible beneficial effects of the air-quality regulations on cardiovascular mortality rate.
The beneficial effects on cardiovascular mortality rate may be primarily attributed to the reduction in the ambient concentration of PM10 and NO2. The exposure to ambient PM10 and NO2 is a well-known risk factor for cardiovascular deaths in South Korea [18,19,45]. However, it is possible for other explanations of how the regulations affected the mortality rate, such as changes in PM composition or behavioral changes related to air pollution [46,47,48]. When diverse regulations were implemented simultaneously, it is challenging to demonstrate what specific regulations had affected the mortality rate and how each regulation had affected the mortality rate. Therefore, further studies are needed to clarify what and how air-quality regulations affect the mortality rate and quantify how much each regulation contributes to the total health benefit.
There were some limitations to this study. First, we could not include some critical indicators as a predictor due to the unavailability of data, such as alcohol drinking, physical activity or greenness. Nevertheless, this study used diverse predictors that were closely correlated with these unobserved confounders. Since both the main outcome variable and the other predictors of synthetic control are made to have values similar to an intervention group, unobserved confounders correlated with the predictors can be partially controlled in SCM [12,49,50]. Therefore, possible residual confounding effects by the unobserved confounders could be adequately controlled. However, even if SCM has the advantage in reducing the confounding effects from unobserved confounders, it cannot guarantee the complete elimination of the confounding effects. Therefore, our results should still be interpreted with caution.
Second, other concurrent events may affect cardiovascular mortality rate differentially between each intervention group and the potential control groups. If it had, the beneficial health effects might be due to the concurrent events. However, because most of the health policies in South Korea had been conducted on a national basis, the effects of other health policies may not differ between the intervention groups and the potential control groups. Even though national targets of the Health Plan 2010 and Health Plan 2020 included interregional health equity between the Seoul metropolitan area and the other regions [51], it did not lead to practical policies [52,53]. For this reason, a great part of health policies, for example, expansion of health insurance coverage, awareness campaigns for cardiovascular diseases or anti-smoking policies, was conducted on a national basis [54,55,56].
Finally, there were some challenges that may violate the assumptions of SCM. An essential assumption of SCM is that potential control groups must not have been affected by the intervention of interest or similar interventions [12]. However, in some potential control groups such as Busan, Daegu and Jeonnam, there had been comprehensive air-quality regulations similar to the intervention of interest in this study. Because the intensity of the regulations was much weaker than in the intervention groups, these regions were included in the main analysis [33]. If the regulations in these regions had been effective, including these regions in the potential control groups could lead to underestimating the health effects in Seoul and Incheon. Nevertheless, we found significant beneficial effects on the mortality rate from the main results. In addition, a sensitivity analysis was conducted excluding these regions from the potential control groups and showed consistent results with the main results.
In addition, neighboring regions of the intervention groups, which were Gangwon, Chungnam, Chungbuk and Daejeon, could be affected by the spillover effects of the air-quality regulations. Air pollutants may be transported to neighboring regions depending upon weather conditions [57,58,59]. Because the prevailing wind in South Korea is northwesterly in spring and winter, air quality in the intervention groups could affect Gangwon, Chungnam, Chungbuk and Daejeon [60,61]. The spillover effect could underestimate the health effects in Seoul and Incheon if it effectively reduced the mortality rate in the neighboring regions. Nevertheless, we found significant beneficial effects on the mortality rate from the main results. In addition, in the sensitivity analysis excluding the neighboring regions from potential control groups, the results did not differ significantly.
Our study also has several strengths. Although SCM had been continuously suggested as a complementary method to C-ITSA in recent years, there has been no empirical study applying SCM to C-ITSA [62,63]. To the best of our knowledge, this is the first empirical research to suggest the health effects of air-quality regulations by applying SCM to C-ITSA. By using SCM, this study has the following advantages: (1) This study obtained a more comparable control group with the intervention group than previous studies. It would have improved the internal validity of the results by preventing possible residual confounding effects [64,65]; (2) It would have improved the generalizability of the results because the synthetic control was made as a weighted average of several non-intervention groups [64,66]. In addition, a broad range of sensitivity analyses was conducted, and this study confirmed the robustness of the results. Studies evaluating health effects of intervention have large uncertainties that stem from the complex mechanisms from intervention to health endpoints and the situation where randomized experiments are infeasible. Therefore, to identify whether the results are robust to various assumptions is very important [5]. Consequently, this study suggested additional evidence that the air-quality regulations in the Seoul metropolitan areas after 2005 had beneficial effects on cardiovascular mortality rate.

5. Conclusions

This study evaluated the effects of the air-quality regulations in the Seoul metropolitan area on cardiovascular mortality rate by applying SCM to C-ITSA. This study found beneficial effects of the regulations on cardiovascular mortality rate. The findings from this study can provide evidence that can be used to assess previous policies’ effectiveness and present the direction of future policies. However, because there is no gold-standard method to select a control group in C-ITSA so far, the accumulation of evidence through further studies with various methods is needed to provide more compelling evidence.

Supplementary Materials

The following are available online at https://www.mdpi.com/2073-4433/11/8/868/s1, Table S1: Air-quality regulations in Seoul metropolitan area (SMA) after 2005, Table S2: Weights of the potential control groups, Table S3: Results from sensitivity analyses using direct adjustment of the counterfactual mortality rate, Table S4: Results from sensitivity analyses reconstructing synthetic controls (SC), Table S5: Results from sensitivity analyses with different time point of the health effects.

Author Contributions

Conceptualization, S.-Y.K. and H.K.; methodology, S.-Y.K. and H.K.; data processing and handling, S.-Y.K.; formal analysis, S.-Y.K.; manuscript writing, S.-Y.K.; reviewing and editing the manuscript, H.K. and J.-T.L.; supervision, J.-T.L. All authors have read and agreed to the published version of the manuscript.

Funding

This work was supported by the National Research Foundation of Korea (NRF) grant funded by the Korea government (MSIT) (2020R1A2C1007274). This work was also supported by Basic Science Research Program through the National Research Foundation of Korea (NRF) funded by the Ministry of Education (2019R1A6A3A01096797).

Conflicts of Interest

The authors declare no conflict of interest.

References

  1. Pope, C.A.; Dockery, D.W.; Schwartz, J. Review of epidemiological evidence of health effects of particulate air pollution. Inhal. Toxicol. 1995, 7, 1–18. [Google Scholar] [CrossRef]
  2. Samet, J.M.; Zeger, S.L.; Dominici, F.; Curriero, F.; Coursac, I.; Dockery, D.W.; Schwartz, J.; Zanobetti, A. The national morbidity, mortality, and air pollution study. Res. Rep. Health Eff. Inst. 2000, 94, 5–79. [Google Scholar] [PubMed]
  3. Guxens, M.; Sunyer, J. A review of epidemiological studies on neuropsychological effects of air pollution. Swiss Med. Wkly. 2012, 141. [Google Scholar] [CrossRef]
  4. Gupta, A.; Gautam, S.; Mehta, N.; Patel, M.K.; Talatiya, A. Association between changes in air quality and hospital admissions during the holi festival. SN Appl. Sci. 2019, 1, 163. [Google Scholar] [CrossRef] [Green Version]
  5. Bell, M.L.; Morgenstern, R.D.; Harrington, W. Quantifying the human health benefits of air pollution policies: Review of recent studies and new directions in accountability research. Environ. Sci. Policy 2011, 14, 357–368. [Google Scholar] [CrossRef]
  6. Boogaard, H.; van Erp, A.M.; Walker, K.D.; Shaikh, R. Accountability studies on air pollution and health: The HEI experience. Curr. Environ. Health Rep. 2017, 4, 514–522. [Google Scholar] [CrossRef]
  7. Korea National Assembly Budget Office. Analysis of Projects to Respond Particulate Matter Problems (Engl. Tansl.); Korea National Assembly Budget Office: Seoul, Korea, 2019; ISBN 9788960732063.
  8. Han, C.; Lim, Y.H.; Yorifuji, T.; Hong, Y.C. Air quality management policy and reduced mortality rates in Seoul Metropolitan Area: A quasi–experimental study. Environ. Int. 2018, 121, 600–609. [Google Scholar] [CrossRef]
  9. Kim, H.; Kim, H.; Lee, J.T. Effect of air pollutant emission reduction policies on hospital visits for asthma in Seoul, Korea; Quasi–experimental study. Environ. Int. 2019, 132, 104954. [Google Scholar] [CrossRef]
  10. McNamee, R. Confounding and confounders. Occup. Environ. Med. 2003, 60, 227–234. [Google Scholar] [CrossRef] [Green Version]
  11. Bottomley, C.; Scott, J.A.G.; Isham, V. Analysing interrupted time series with a control. Epidemiol. Methods 2019. [Google Scholar] [CrossRef]
  12. Abadie, A.; Diamond, A.; Hainmueller, J. Synthetic control methods for comparative case studies: Estimating the effect of California’s tobacco control program. J. Am. Stat. Assoc. 2010, 105, 493–505. [Google Scholar] [CrossRef] [Green Version]
  13. Abadie, A.; Diamond, A.; Hainmueller, J. Comparative politics and the synthetic control method. Am. J. Political Sci. 2015, 59, 495–510. [Google Scholar] [CrossRef]
  14. Korea Ministry of Environment. Basic Plans for Second Phase of Air Quality Improvement Plan for Seoul Metropolitan Areas (2015–2024) (Engl. Transl.); Korea Ministry of Environment: Sejong, Korea, 2013. Available online: http://www.me.go.kr/home/web/policy_data/read.do;jsessionid=TRvS5alq5YRi8393qi8cVubySPy87FyI48o94lc11DdqFsIGQRAKdTCpxPaFagcT.meweb1vhost_servlet_engine1?pagerOffset=550&maxPageItems=10&maxIndexPages=10&searchKey=&searchValue=&menuId=10259&orgCd=&seq=6482 (accessed on 20 July 2020).
  15. Jee, S.H.; Yun, J.E.; Park, J.Y.; Sull, J.W.; Kim, I.S. Smoking and cause of death in Korea: 11 years follow–up prospective study. Korean J. Epidemiol. 2005, 27, 182–190. [Google Scholar]
  16. Jung, K.J.; Yun, Y.D.; Baek, S.J.; Jee, S.H.; Kim, I.S. Smoking–attributable mortality among Korean adults, 2012. J. Korea Soc. Health Inform. Stat. 2013, 38, 36–48. [Google Scholar]
  17. Bascom, R.; Bromberg, P.A.; Costa, D.L.; Devlin, R.; Dockery, D.W.; Frampton, M.W.; Lambert, W.; Samet, J.M.; Speizer, F.E.; Utell, M. Health effects of outdoor air pollution. Am. J. Respir. Crit. Care Med. 1996, 153, 477–498. [Google Scholar]
  18. Son, J.Y.; Lee, J.T.; Kim, H.; Yi, O.; Bell, M.L. Susceptibility to air pollution effects on mortality in Seoul, Korea: A case–crossover analysis of individual–level effect modifiers. J. Expo. Sci. Environ. Epidemiol. 2012, 22, 227–234. [Google Scholar] [CrossRef] [Green Version]
  19. Son, J.Y.; Bell, M.L. The relationships between short–term exposure to particulate matter and mortality in Korea: Impact of particulate matter exposure metrics for sub–daily exposures. Environ. Res. Lett. 2013, 8, 014015. [Google Scholar] [CrossRef]
  20. Park, J.K.; Jung, W.S.; Kim, E.B. A study on the influence of extreme heat on daily mortality. J. Korean Soc. Atmos. Environ. 2008, 24, 523–537. [Google Scholar] [CrossRef] [Green Version]
  21. Ha, J.; Yoon, J.; Kim, H. Relationship between winter temperature and mortality in Seoul, South Korea, from 1994 to 2006. Sci. Total Environ. 2009, 407, 2158–2164. [Google Scholar] [CrossRef]
  22. Basu, R. High ambient temperature and mortality: A review of epidemiologic studies from 2001 to 2008. Environ. Health 2009, 8, 40. [Google Scholar] [CrossRef] [Green Version]
  23. Simonsen, L. The global impact of influenza on morbidity and mortality. Vaccine 1999, 17, S3–S10. [Google Scholar] [CrossRef]
  24. Park, M.; Wu, P.; Goldstein, E.; Kim, W.J.; Cowling, B.J. Influenza–associated excess mortality in South Korea. Am. J. Prev. Med. 2016, 50, e111–e119. [Google Scholar] [CrossRef] [PubMed] [Green Version]
  25. Nguyen, J.L.; Yang, W.; Ito, K.; Matte, T.D.; Shaman, J.; Kinney, P.L. Seasonal influenza infections and cardiovascular disease mortality. JAMA Cardiol. 2016, 1, 274–281. [Google Scholar] [CrossRef] [PubMed] [Green Version]
  26. Brenner, M.H. Influence of health care expenditures, GDP, employment and globalization on cardiovascular disease mortality: Potential implications for the current recession. Int. J. Bus. Soc. Sci. 2012, 3, 1–10. [Google Scholar]
  27. Chi, T.K.; Kwag, K.H.; Jekarl, J.; Park, M.S.; Kim, K.K. An ecological study on factors associated with community mortality rates. Korean J. Health Educ. Promot. 2015, 32, 11–22. [Google Scholar] [CrossRef] [Green Version]
  28. Seo, S.H.; Jung, Y.W.; Kim, Y.T. Avoidable Mortality in Korea, 2000–2014. Public Health Wkly. Rep. 2016, 9, 98–107. [Google Scholar]
  29. Chang, I.; Kim, B.H. Regional disparity of medical resources and its effect on age–standardized mortality rates in Korea. Ann. Reg. Sci. 2019, 62, 305–325. [Google Scholar] [CrossRef]
  30. Abadie, A.; Diamond, A.; Hainmueller, J. Synth: An r package for synthetic control methods in comparative case studies. J. Stat. Softw. 2011, 42, 1–17. [Google Scholar] [CrossRef] [Green Version]
  31. Chelwa, G.; van Walbeek, C.; Blecher, E. Evaluating South Africa’s tobacco control policy using a synthetic control method. Tob. Control 2017, 26, 509–517. [Google Scholar] [CrossRef]
  32. Yorifuji, T.; Kashima, S. Fine–particulate air pollution from diesel emission control and mortality rates in Tokyo. Epidemiology 2016, 27, 769–778. [Google Scholar] [CrossRef]
  33. Han, H.; Jung, C.; Kim, H.; Kim, Y. The revisit of the PM10 reduction policy in Korea: Focusing on policy target, tools and effect of first air quality management plan in Seoul Metropolitan Area. J. Korea Environ. Policy Adm. 2017, 25, 49–79. [Google Scholar] [CrossRef]
  34. Korea Ministry of Environment. Research for Evaluating Policies in Air Quality Control Region and Planning Improvement Methods (Engl. Transl.); Korea Ministry of Environment: Sejong, Korea, 2015. Available online: http://www.prism.go.kr/homepage/entire/retrieveEntireDetail.do;jsessionid=4AF3A77BD02306A812F8AEF419D495CA.node02?cond_research_name=&cond_research_start_date=&cond_research_end_date=&research_id=1480000–201500138&pageIndex=727&leftMenuLevel=160 (accessed on 20 July 2020).
  35. Hoek, G.; Krishnan, R.M.; Beelen, R.; Peters, A.; Ostro, B.; Brunekreef, B.; Kaufman, J.D. Long–term air pollution exposure and cardio–respiratory mortality: A review. Environ. Health 2013, 12, 43. [Google Scholar] [CrossRef] [PubMed] [Green Version]
  36. Kim, Y.P. Analysis of the trend of atmospheric PM10 concentration over the Seoul Metropolitan Area between 1999 and 2008. J. Environ. Impact Assess. 2010, 19, 59–74. [Google Scholar]
  37. Kim, K.H.; Shon, Z.H. Long-term changes in PM10 levels in urban air in relation with air quality control efforts. Atmos. Environ. 2011, 45, 3309–3317. [Google Scholar] [CrossRef]
  38. Clancy, L.; Goodman, P.; Sinclair, H.; Dockery, D.W. Effect of air–pollution control on death rates in Dublin, Ireland: An intervention study. Lancet 2002, 360, 1210–1214. [Google Scholar] [CrossRef]
  39. Hedley, A.J.; Wong, C.M.; Thach, T.Q.; Ma, S.; Lam, T.H.; Anderson, H.R. Cardiorespiratory and all–cause mortality after restrictions on sulphur content of fuel in Hong Kong: An intervention study. Lancet 2002, 360, 1646–1652. [Google Scholar] [CrossRef]
  40. Pope III, C.A.; Rodermund, D.L.; Gee, M.M. Mortality effects of a copper smelter strike and reduced ambient sulfate particulate matter air pollution. Environ. Health Perspect. 2007, 115, 679–683. [Google Scholar] [CrossRef] [Green Version]
  41. Henschel, S.; Atkinson, R.; Zeka, A.; Le Tertre, A.; Analitis, A.; Katsouyanni, K.; Chanel, O.; Pascal, M.; Forsberg, B.; Medina, S. Air pollution interventions and their impact on public health. Int. J. Public Health 2012, 57, 757–768. [Google Scholar] [CrossRef]
  42. Lin, H.; Zhang, Y.; Liu, T.; Xiao, J.; Xu, Y.; Xu, X.; Qian, Z.; Tong, S.; Luo, Y.; Zeng, W. Mortality reduction following the air pollution control measures during the 2010 Asian Games. Atmos. Environ. 2014, 91, 24–31. [Google Scholar] [CrossRef]
  43. Lin, H.; Liu, T.; Fang, F.; Xiao, J.; Zeng, W.; Li, X.; Guo, L.; Tian, L.; Schootman, M.; Stamatakis, K.A. Mortality benefits of vigorous air quality improvement interventions during the periods of APEC Blue and Parade Blue in Beijing, China. Environ. Pollut. 2017, 220, 222–227. [Google Scholar] [CrossRef] [Green Version]
  44. Henneman, L.R.; Choirat, C.; Zigler, C.M. Accountability assessment of health improvements in the United States associated with reduced coal emissions between 2005 and 2012. Epidemiology 2019, 30, 477–485. [Google Scholar] [CrossRef] [PubMed]
  45. Hong, Y.C.; Lee, J.T.; Kim, H.; Ha, E.H.; Schwartz, J.; Christiani, D.C. Effects of air pollutants on acute stroke mortality. Environ. Health Perspect. 2002, 110, 187–191. [Google Scholar] [CrossRef] [PubMed]
  46. Son, J.Y.; Lee, J.T.; Kim, K.H.; Jung, K.; Bell, M.L. Characterization of fine particulate matter and associations between particulate chemical constituents and mortality in Seoul, Korea. Environ. Health Perspect. 2012, 120, 872–878. [Google Scholar] [CrossRef] [PubMed] [Green Version]
  47. Han, S.H.; Kim, Y.P. Long–term Trends of the Concentrations of Mass and Chemical Composition in PM 2.5 over Seoul. J. Korean Soc. Atmos. Environ. 2015, 31, 143–156. [Google Scholar] [CrossRef] [Green Version]
  48. Jun, T.; Min, I.S. Air pollution, respiratory illness and behavioral adaptation: Evidence from South Korea. PLoS ONE 2019, 14, e0221098. [Google Scholar] [CrossRef] [PubMed] [Green Version]
  49. Sills, E.O.; Herrera, D.; Kirkpatrick, A.J.; Brandão Jr, A.; Dickson, R.; Hall, S.; Pattanayak, S.; Shoch, D.; Vedoveto, M.; Young, L. Estimating the impacts of local policy innovation: The synthetic control method applied to tropical deforestation. PLoS ONE 2015, 10, e0132590. [Google Scholar] [CrossRef] [PubMed] [Green Version]
  50. Xu, Y. Generalized synthetic control method: Causal inference with interactive fixed effects models. Political Anal. 2017, 25, 57–76. [Google Scholar] [CrossRef] [Green Version]
  51. World Health Organization. WHO Country Cooperation Strategy 2019–2023: Republic of Korea; World Health Organization. Regional Office for the Western Pacific: Manila, Philippines, 2019; Available online: https://iris.wpro.who.int/bitstream/handle/10665.1/14327/WPRO–2019–DPM–001–kor–eng.pdf (accessed on 20 July 2020).
  52. Kim, D.; Lee, S.; Ki, M.; Kim, M.; Kim, S.S.; Kim, Y.; Yun, T.; Jang, S.; Chae, H.; Lee, J.A. Developing Health Inequalities Indicators and Monitoring the Status of Health Inequalities in Korea; Korea Institute for Health and Social Affairs: Sejong, Korea, 2013. [Google Scholar]
  53. Jang, S.; Lee, J.; Kim, C.; Heo, H.; Hwang, J.; Kim, T. Developing key indicators of health equity and strategies for reducing health disparity in National Health Plan. Korean Soc. Health Educ. Promot. 2017, 34, 41–57. [Google Scholar] [CrossRef]
  54. Korea Institute for Health and Social Affairs. Research for Development of First Comprehensive Management Plan for Cardio–and Cerebrovascular Diseases (2018~2022) (Engl. Transl.); Korea Institute for Health and Social Affairs: Sejong, Korea, 2017. Available online: http://www.prism.go.kr/homepage/entire/retrieveEntireDetail.do;jsessionid=4C7A1083DC3143158E2A765E72F2BB2F.node02?cond_research_name=&cond_research_start_date=&cond_research_end_date=&research_id=1351000–201800003&pageIndex=137&leftMenuLevel=160 (accessed on 20 July 2020).
  55. Kim, W.H.L.; Eun, K.; Kim, D.H.; Kim, Y. Impact of Coverage Expansion on Fiscal Sustainability of Healthcare System in Korea: On Four Major Disease; Institute of Public Finance: Sejong, Korea, 2018; Available online: https://www.kipf.re.kr/gafsc/Publication/publication_Report/kiPublish/CA/view.do?serialNo=526299# (accessed on 20 July 2020).
  56. Gunter, R.; Szeto, E.; Jeong, S.H.; Suh, S.A.; Waters, A.J. Cigarette Smoking in South Korea: A Narrative Review. Korean J. Fam. Med. 2020, 41, 3. [Google Scholar] [CrossRef] [Green Version]
  57. Davis, R.E.; Kalkstein, L.S. Using a spatial synoptic climatological classification to assess changes in atmospheric pollution concentrations. Phys. Geogr. 1990, 11, 320–342. [Google Scholar] [CrossRef]
  58. gon Ryou, H.; Heo, J.; Kim, S.Y. Source apportionment of PM10 and PM2. 5 air pollution, and possible impacts of study characteristics in South Korea. Environ. Pollut. 2018, 240, 963–972. [Google Scholar] [CrossRef] [PubMed]
  59. Park, I.S.; Kim, H.K.; Song, C.K.; Jang, Y.W.; Kim, S.H.; Cho, C.R.; Owen, J.S.; Kim, C.H.; Chung, K.W.; Park, M.S. Meteorological characteristics and assessment of the effect of local emissions during high PM10 concentration in the Seoul Metropolitan Area. Asian J. Atmos. Environ. 2019, 13, 117–135. [Google Scholar] [CrossRef]
  60. Kim, E.; Kim, H.; Kim, B.; Kim, S. PM2. 5 Simulations for the Seoul Metropolitan Area:(VI) Estimating Influence of Sectoral Emissions from Chungcheongnamdo. J. Korean Soc. Atmos. Environ. 2019, 35, 226–248. [Google Scholar] [CrossRef]
  61. Yeo, M.J.; Kim, Y.P. Trends of the PM10 Concentrations and High PM10 Concentration Cases in Korea. J. Korean Soc. Atmos. Environ. 2019, 35, 249–264. [Google Scholar] [CrossRef]
  62. Linden, A. Combining synthetic controls and interrupted time series analysis to improve causal inference in program evaluation. J. Eval. Clin. Pract. 2018, 24, 447–453. [Google Scholar] [CrossRef]
  63. Lopez Bernal, J.; Cummins, S.; Gasparrini, A. The use of controls in interrupted time series studies of public health interventions. Int. J. Epidemiol. 2018, 47, 2082–2093. [Google Scholar] [CrossRef] [Green Version]
  64. Pieters, H.; Curzi, D.; Olper, A.; Swinnen, J. Effect of democratic reforms on child mortality: A synthetic control analysis. Lancet Glob. Health 2016, 4, e627–e632. [Google Scholar] [CrossRef] [Green Version]
  65. Bruhn, C.A.; Hetterich, S.; Schuck–Paim, C.; Kürüm, E.; Taylor, R.J.; Lustig, R.; Shapiro, E.D.; Warren, J.L.; Simonsen, L.; Weinberger, D.M. Estimating the population–level impact of vaccines using synthetic controls. Proc. Natl. Acad. Sci. USA 2017, 114, 1524–1529. [Google Scholar] [CrossRef] [Green Version]
  66. Olper, A.; Curzi, D.; Swinnen, J. Trade liberalization and child mortality: A synthetic control method. World Dev. 2018, 110, 394–410. [Google Scholar] [CrossRef]
Figure 1. Map of cities and provinces in South Korea (colored regions—the intervention groups; gray regions—the potential control groups; Seoul metropolitan area—Seoul, Incheon and Gyeonggi).
Atmosphere 11 00868 g001
Figure 2. Annual ambient concentration of particulate matters less than 10 μm (PM10), NO2 and SO2 in Seoul, Incheon and the potential control groups.
Atmosphere 11 00868 g002
Figure 3. Monthly age-standardized cardiovascular mortality rate (per 100,000) in Seoul, Incheon and synthetic controls.
Atmosphere 11 00868 g003
Table 1. Monthly age-standardized cardiovascular mortality rate (per 100,000) in Seoul, Incheon and synthetic controls.
AreaPre-Intervention PeriodPost-Intervention Period
MeanTotalMeanTotal
Seoul10.191101.015.63743.65
Synthetic control of Seoul10.361118.386.79896.64
Incheon12.48134
7.58
7.46985.31
Synthetic control of Incheon12.481347.557.841034.35
Table 2. Normalized root mean squared errors (NRMSEs) in synthetic controls and Daejeon.
SeoulIncheon
Synthetic ControlDaejeonSynthetic ControlDaejeon
Cardiovascular Mortality Rate0.070.140.080.18
Smoking rate0.070.060.050.10
PM10 concentration0.250.290.170.23
Temperature0.080.050.130.08
Pneumonia mortality rate0.380.600.340.49
Gross regional domestic product (GRDP)0.880.910.060.51
% of urban population0.110.000.040.03
Avoidable mortality rate0.160.150.060.14
Mean0.250.280.120.22
Table 3. Main results from controlled-interrupted time-series analysis.
SeoulIncheon
Coefficient (95% CI)Coefficient (95% CI)
β0 (Intercept)−9.0387 (−9.0691, −9.0083) b−8.8282 (−8.8618, −8.7946) a
β1 (Time trend)−0.0006 (−0.001, −0.0003) b0 (−0.0004, 0.0003) a
β2 (Slope change)−0.001 (−0.0015, −0.0004) b−0.0006 (−0.0012, 0) a
a adjusted for seasonal dummy variable. b adjusted for seasonal dummy variable and autoregressive term.

