1. Introduction
The City of Toronto is Canada’s largest urban area, which is situated on the northwest shore of Lake Ontario (43.7°N, 79.4°W). Southern Ontario is a transition zone between polar and tropical air masses, resulting in midlatitude cyclones and considerable weather variation [
1,
2,
3]. These cyclones are common in the midlatitudes and have a significant impact on day–to–day climate variability [
3,
4]. Toronto’s climate is classified as a humid continental climate characterized by warm to hot summers, cold snowy winters, no dry seasons, and a wide range in annual temperatures, mitigated by the presence of Lake Ontario [
4,
5,
6,
7,
8]. Of the top ten highest snow accumulation years, only one has occurred since 1950, that is, 1999 [
9,
10].
This opportunity to analyze over 150 years of observational climate data from the Toronto (Canada) weather station has enabled the identification of statistically significant trends in precipitation and changes in precipitation phase during the winter season. Although Toronto’s climate has been extensively studied over the years [
7,
11,
12,
13,
14,
15,
16,
17,
18,
19], the focus has mainly been on temperature variability and change, as well as the urban heat island effect, with very little attention given to precipitation. Temperatures have been warming across Canada, and precipitation patterns have also been changing [
20,
21], including a reduction in snowfall and snow cover [
22]. However, a localized case study, such as this one, provides more detail on the nature of these changes within an urban climate, especially one with a documented heat island effect [
13,
19], such as the City of Toronto.
Precipitation and precipitation phase are difficult climate variables to model for future climate change projections [
23]. Therefore, studies that quantify changes in precipitation and precipitation phase are important areas of research to enable a better understanding of how regional climates have been changing and may continue to change under projected climate change. Changes in the winter season precipitation phase have important implications for the volume and persistence of snowpacks [
24,
25]. Less snowfall and more rainfall also have important implications for snowmelt, runoff, and streamflow [
26,
27]. Ongoing changes in precipitation phase also have important implications for the timing of spring runoff, river ice–out times, and late–winter snow density (Huntington et al. 2004). Furthermore, Huntington et al. [
28] argued that analysis of changes in precipitation phase (such as the fraction of total precipitation that falls as snow—SF:TP) could be useful for hydrological model development (such as precipitation phase modeling), by constraining model sensitivity and providing an empirical basis for model validation.
Snow is an important surface–water resource and a climate variable that is a useful index of climatic variability and change [
29,
30]. Because snow is climatically sensitive and global temperatures have been increasing, numerous studies have examined changes and trends in snow cover [
29,
31], snowpack accumulations [
32,
33], as well as snowmelt runoff [
34,
35]. Several studies, based in North America, focused on the United States, have reported declining amounts of snow being mainly attributed to increasing temperatures [
32,
33,
35,
36]. Other studies have now begun to explore changes and trends in the fraction of precipitation that has been falling as snow [
28,
30,
37,
38,
39], with consistent findings reporting that the SF:TP ratio has been decreasing across the conterminous United States. These findings have once again been correlated with rising temperatures but are also geographically distributed among regions with average temperatures warm enough to be associated with changes in precipitation phase (where reported temperature ranges vary). Looking at data from 1950 to 1990, Karl et al. [
37] found that the annual ratio of snow to total precipitation was decreasing across areas in Canada below 55°N, especially from 1980 to 1990. Using the city of Toronto as a case study, specifically the urban center represented by the weather station at the University of Toronto’s downtown campus, the current study will add to our understanding of how precipitation phase in Canada’s more southern locations has been changing, especially since the turn of 21st century.
Toronto’s climate has been historically characterized by cold snowy winters, but one might ask, what does it mean for winter to be “snowy”? In scientific literature, several metrics of “snowiness” exist. These include snowfall, the amount of precipitation that is intercepted at the Earth’s surface in the form of snow [
40,
41]; snow cover, the spatial extent of the snow that remains as ground cover [
42,
43]; snow depth, or snow–on–ground [
44]. Previous studies have used snow to rain ratio metrics to quantify changes in precipitation phase. For example, Berghuijs et al. [
45] developed snow to rain ratio to characterize precipitation in a series of US catchment basins using a temperature formula to disaggregate precipitation into rainfall and snowfall. Hamlet et al. [
46], in an examination of climate change for the state of Indiana, projected a reduction of the snow to rain ratio due to increasing temperatures. Others have invoked reduced snow to rain ratio as an important factor in snowmelt and runoff in alpine environments [
47,
48,
49,
50].
In this study, we sought to identify trends and changes in three different precipitation phase metrics to quantify the changing nature of winter season precipitation for the urban center within the city of Toronto over 169 years from 1849 to 2017. We began by using the most conventional method, which we believe to be the fraction of total precipitation that falls as snow, presented by the SF:TP ratio [
24,
28,
30,
37,
39]. Next, we used a less common approach [
23], the fraction of total precipitation days that recorded snowfall, represented by the snow days to precipitation days (SD:PD) ratio. Finally, we developed a novel metric referred to as the precipitation phase index (PPI) that is derived from comparing the rainfall to the snowfall water equivalent [
45,
46,
47,
48,
49,
50]. Unlike the SF:TP and SD:PD ratios, which generate percentages, the PPI is a categorical variable, resulting in four categories describing the winter season precipitation phase (very snowy, snowy, rainy, and very rainy). To evaluate the usefulness of these three different metrics for quantifying the changing nature of the precipitation phase, we compared the strength of time–series trends that were identified for each metric. Furthermore, we also compared the strength of correlations between each precipitation phase metric and historical winter temperatures in Toronto (minimum, maximum, and mean temperatures).
2. Methods
Historical climate data were obtained from the oldest Environment Canada weather station in the country, the station located on the University of Toronto’s downtown campus, in the city’s urban center. Three variables representing daily temperature (maximum, minimum, and mean) and three variables representing precipitation (rainfall, snowfall water equivalent, and total precipitation) were obtained from the historical climate archives for the period from 1 December 1848, to 28 February 2017. For the purpose of this study, a winter season is defined as running consecutively from December 1st of one year to February 28th or 29th of the next year and is referred to as the winter of the year associated with the months of January and February. Furthermore, in relation to the climate station data obtained from Environment Canada, the mean daily temperature was equal to the average of the daily minimum and daily maximum, which also remained true when aggregated to the monthly or seasonal time scales. Similarly, total daily precipitation was equal to the sum of rainfall and the snowfall water equivalent. Although most days recorded either only rain or only snow, some days did have mixed precipitation, and the total precipitation was always equal to the sum of rainfall and the snowfall equivalent recorded on that day. On the monthly or seasonal scales, when it was much more common for total precipitation to be a mixture of both rain and snow, again, total precipitation was equal to the sum of total rainfall and total snowfall. Three more precipitation variables were deduced from this dataset by counting the number of days when trace (0.2 mm) or greater amounts of rain (rain days), amounts of snow (snow days), and amounts of total precipitation (precipitation days) were recorded.
From this daily climate data, several precipitation phase metrics were explored. The first of which was the snowfall to total precipitation ratio (SF:TP), which was computed at a seasonal timescale by summing daily snowfall and daily total precipitation values across each winter season and then calculating the ratio [
24,
28,
30,
37,
39]. There have been concerns reported with comparing snowfall to total precipitation since catch efficiency is typically lower for snow than for rain [
51,
52]; however, Knowles et al. [
38] found that catch efficiency did not affect trends in the snowfall water equivalent or in the SF:TP ratio across the western United States, and if anything, the under–catch phenomenon actually resulted in an underestimate of trends associated with these variables over time. The next metric was the snow days to total precipitation days ratio (SD:PD), which was also computed at a seasonal timescale by summing the number of days for each variable across the winter season and then calculating the ratio. This metric has also been used elsewhere [
23]. The final precipitation phase metric we explored was the precipitation phase index (PPI). PPI is calculated by comparing the rainfall to snowfall within a given winter month and then assigning a numeric code to the monthly totals: if rainfall was greater than snowfall in a given month, it received a value of +1; whereas, if snowfall was greater than rainfall in a given month, that month received a value of −1. To compute PPI at the seasonal timescale, the three coded monthly values were summed, generating a categorical metric for describing winter season precipitation: (−3) very snowy; (−1) snowy; (+1) rainy; +3) very rainy. Therefore, a winter season characterized as very snowy (−3) would be associated with three months that all recorded more snow than rain (−1); whereas, a winter season characterized as very rainy (+3) would be associated with three months that all recorded more rain than snow (+1). Other studies have also compared rainfall to snowfall to describe changes in precipitation phase [
45,
46,
47,
48,
49,
50].
Time–series trends in the temperature and precipitation variables were explored using linear regression as well as Kendall’s Tau rank correlation. Others have noted issues with using linear regression for trend detection in time series analysis; therefore, we were careful to check for both normal distributions among the datasets using the chi–square goodness–of–fit test as well as for autocorrelation within the datasets using the Durbin–Watson test statistic. If either of these assumptions associated with linear regression were violated, then we reported Kendall’s Tau rank correlation [
53,
54] in addition to the results of the linear regression analysis.
Finally, we explored the causal relationships between changes in temperature and changes in the three different precipitation phase metrics. Once again, we used both linear regression and Kendall’s Tau rank correlation to determine the amount of change in the precipitation phase metrics (SF:TP, SD:PD, and PPI) that could be explained by observed changes in the three temperature variables (Tmin, Tmax, and Tmean). However, since the PPI is a categorical variable (with only 4 potential values or categories: −3, −1, +1, +3), unlike the discrete values associated with both the SF:TP and SD:PD ratios (ranging from 0 to 1.00), we also used a series of one–way ANOVAs to further illustrate the causal relationship associated with changes in PPI due to changes in surface temperatures.
3. Results
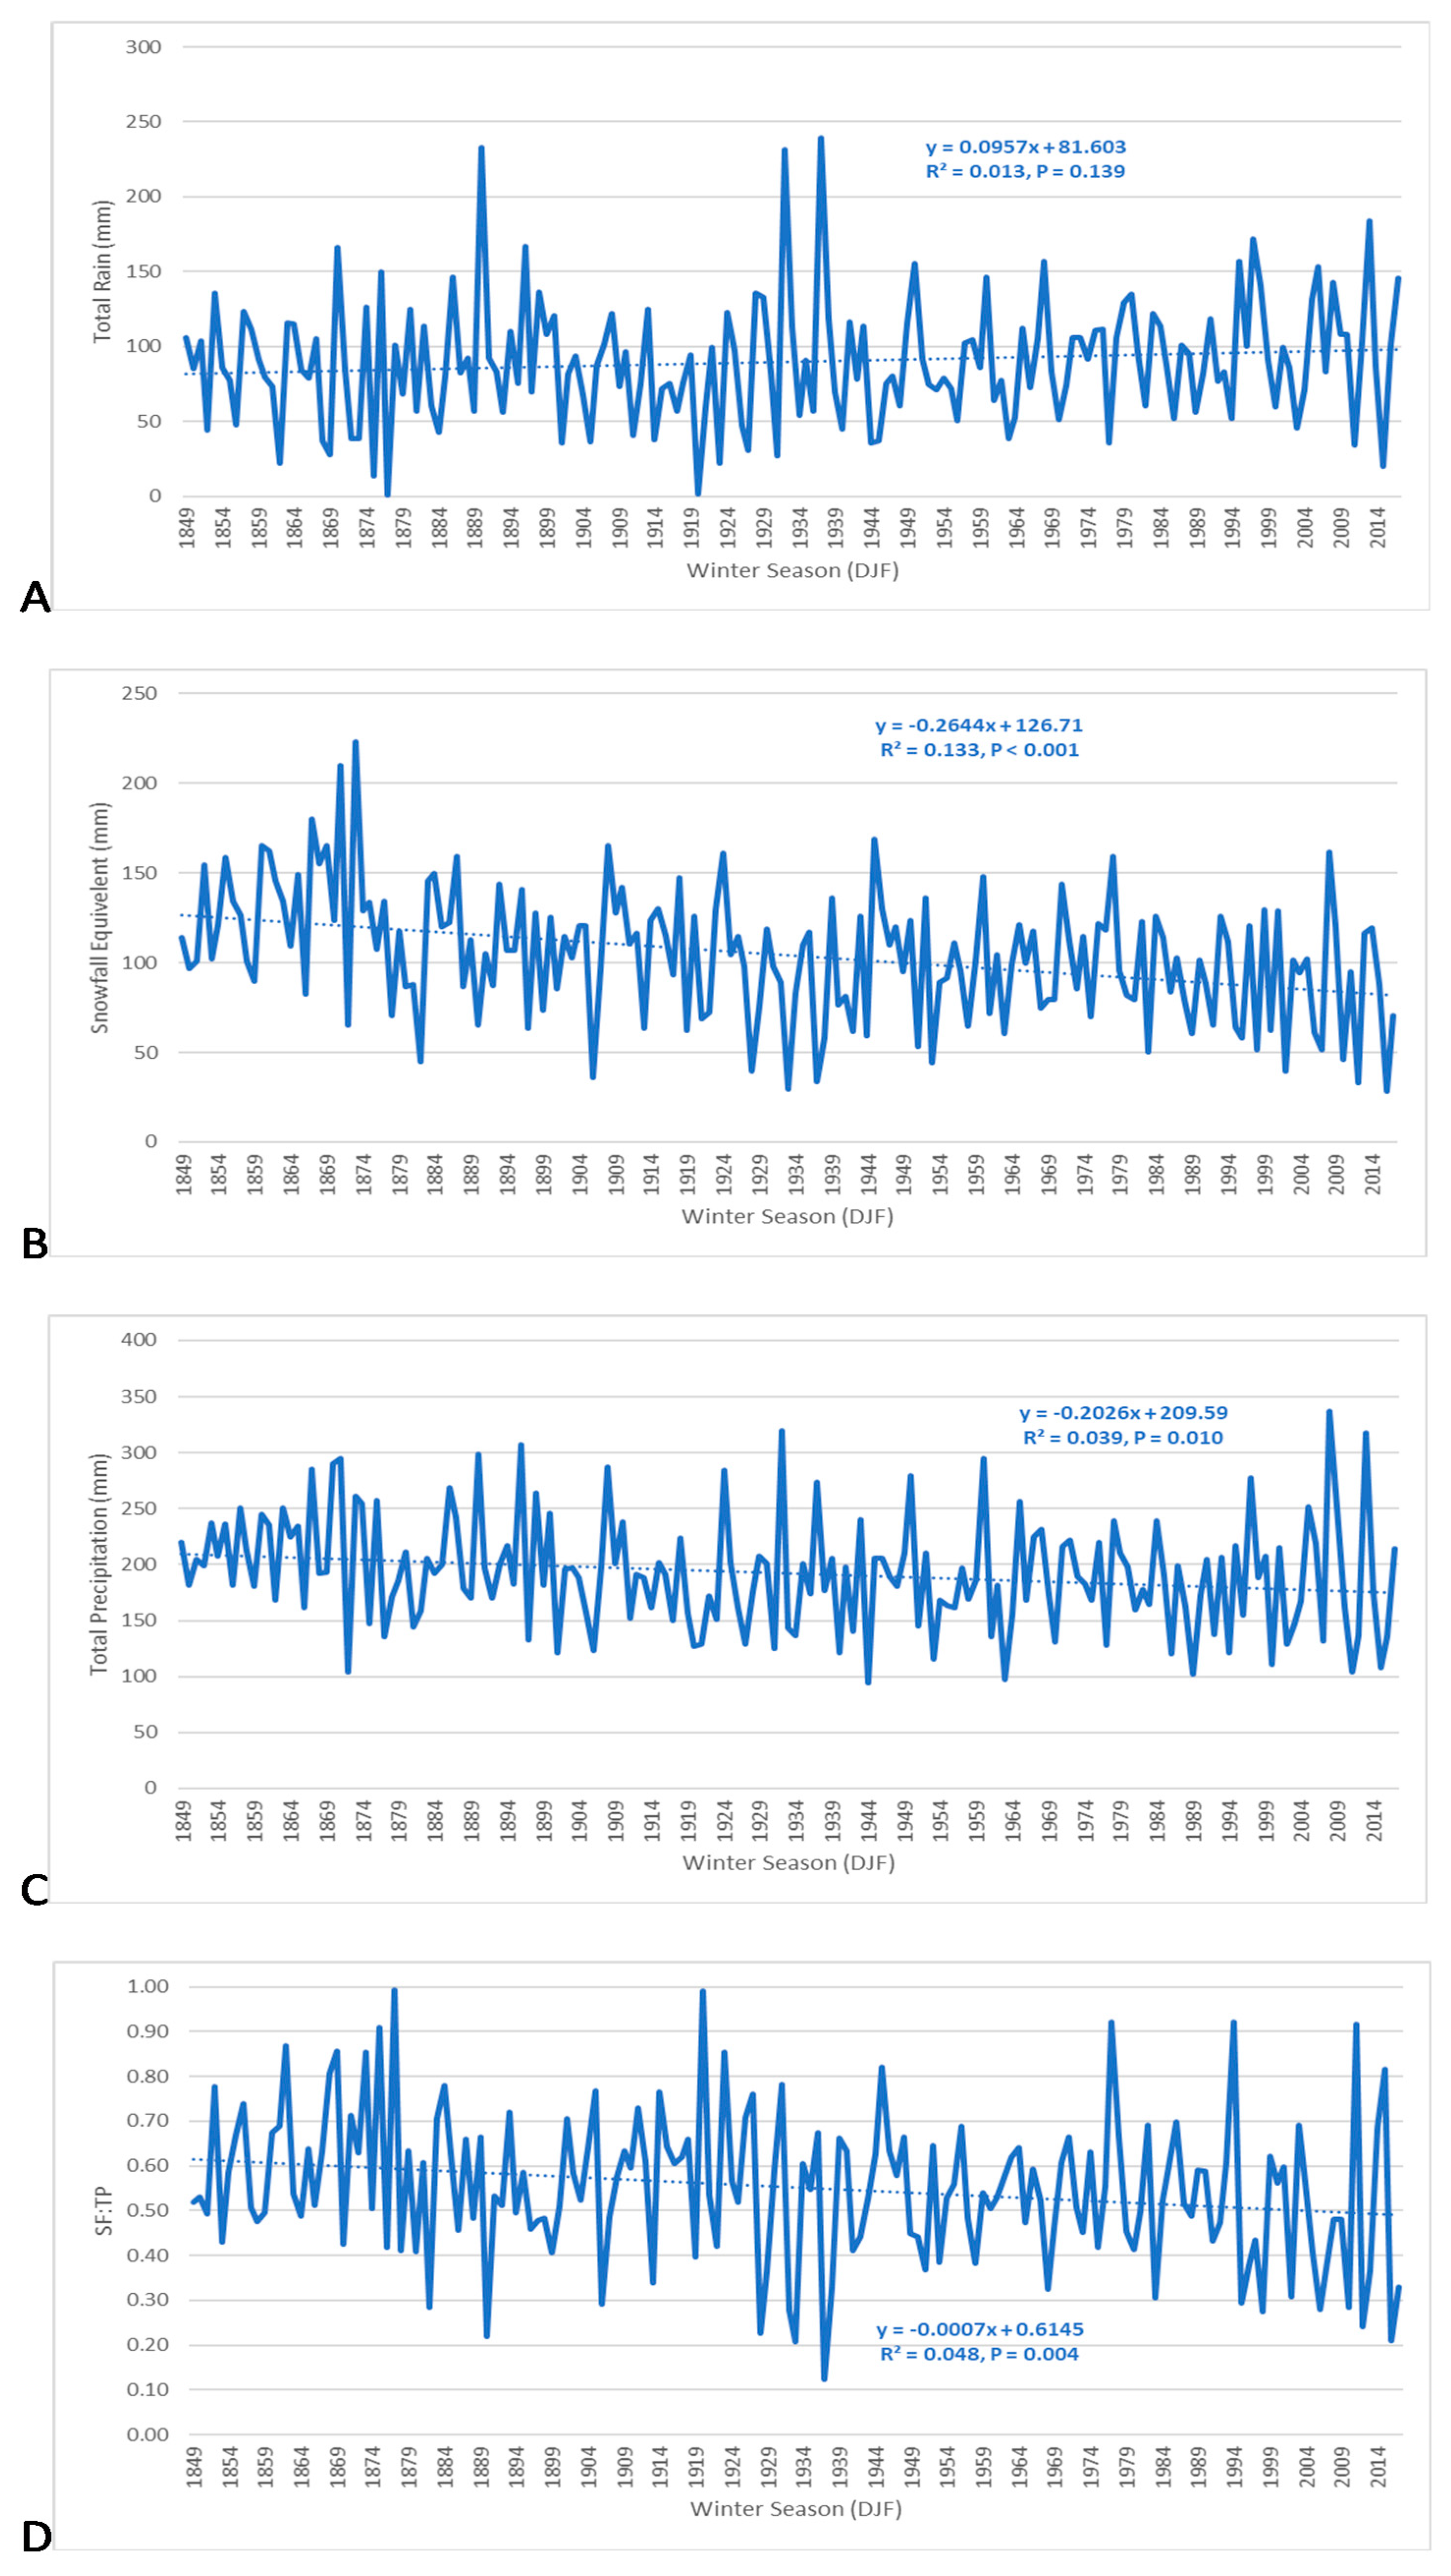
Over the considerable time period analyzed (1849 to 2017), several statistically significant trends in winter season precipitation for Toronto (Canada) were identified. Rainfall (
Figure 1A) during the winter season (DJF) in Toronto from 1849 to 2017 was increasing at a rate of 0.10 mm/year; however, this trend was not statistically significant at the 95% confidence level (R
2 = 0.013,
p = 0.139). Based on a chi–square goodness–of–fit test, the rainfall dataset was normally distributed (X
2 = 5.591,
p = 0.471). According to the Durbin–Watson test statistic (d = 2.192,
p > 0.05), the slight negative serial correlation detected (−0.102) was not statistically significant. Nonetheless, we also used Kendall’s Tau rank correlation and confirmed that there was no statistically significant time–series trend associated with rainfall in Toronto during this time period (T = 0.078,
p > 0.05).
Winter season snowfall equivalent (
Figure 1B) was decreasing at a statistically significant rate (R
2 = 0.133,
p < 0.001) of negative 0.26 mm/year. This negative linear trend suggested that winter season snowfall in Toronto decreased from an average of 126.7 mm per year (at the y–intercept) to an average of 82.0 mm per year by the end of the time series. Once again, the snowfall dataset was normally distributed (X
2 = 2.627,
p = 0.757). According to the Durbin–Watson test statistic (d = 2.285,
p > 0.05), the slight negative serial correlation detected (−0.143) was not statistically significant. Nonetheless, we also used Kendall’s Tau rank correlation (T = −0.239,
p < 0.05) to validate the linear regression findings and confirm the negative trend associated with decreasing snowfall in Toronto.
Total precipitation during the winter season in Toronto (
Figure 1C) was also decreasing at a statistically significant rate (R
2 = 0.039,
p = 0.010) of negative 0.20 mm/year. This negative linear trend suggested that winter season total precipitation in Toronto decreased from an average of 209.6 mm to an average of 175.4 mm by the end of the time series. The total precipitation dataset was normally distributed (X
2 = 13.066,
p = 0.110). Despite a negative serial correlation observed among the data (−0.193), the Durbin–Watson test statistic concluded this autocorrelation to not be statistically significant (d = 2.381,
p > 0.05). Nonetheless, we also used Kendall’s Tau rank correlation (T = −0.142,
p < 0.05) to validate the linear regression findings and confirm the negative trend associated with the total precipitation time series, indicating winters became drier in Toronto due mainly to less snowfall.
The ratio of snowfall to total precipitation (SF:TP) was one approach to quantifying the changing nature of the winter season precipitation phase in Toronto (
Figure 1D). The percentage of total precipitation that fell as the snow was decreasing at a statistically significant rate (R
2 = 0.048,
p = 0.004) of negative 0.07% per year. This negative linear trend suggested that the winter season SF:TP ratio in Toronto decreased from 61.5% to 49.6% by the end of the time series. This clearly demonstrated that winter’s in Toronto, which were once dominated by snowfall (62%), are now characterized by an even split between rainfall and snowfall (50%). The SF:TP dataset was normally distributed (X
2 = 5.892,
p = 0.207). Despite a negative serial correlation observed among the data (−0.116), the Durbin–Watson test statistic concluded this autocorrelation to not be statistically significant (d = 2.223,
p > 0.05). Nonetheless, we also used the Kendall’s Tau rank correlation (T = −0.149,
p < 0.05) to validate the linear regression findings and confirm the negative trend associated with the decreasing percentage of total precipitation that fell as snow in Toronto, indicating that winters were becoming less snowy and more rainy as this ratio continued to decline.
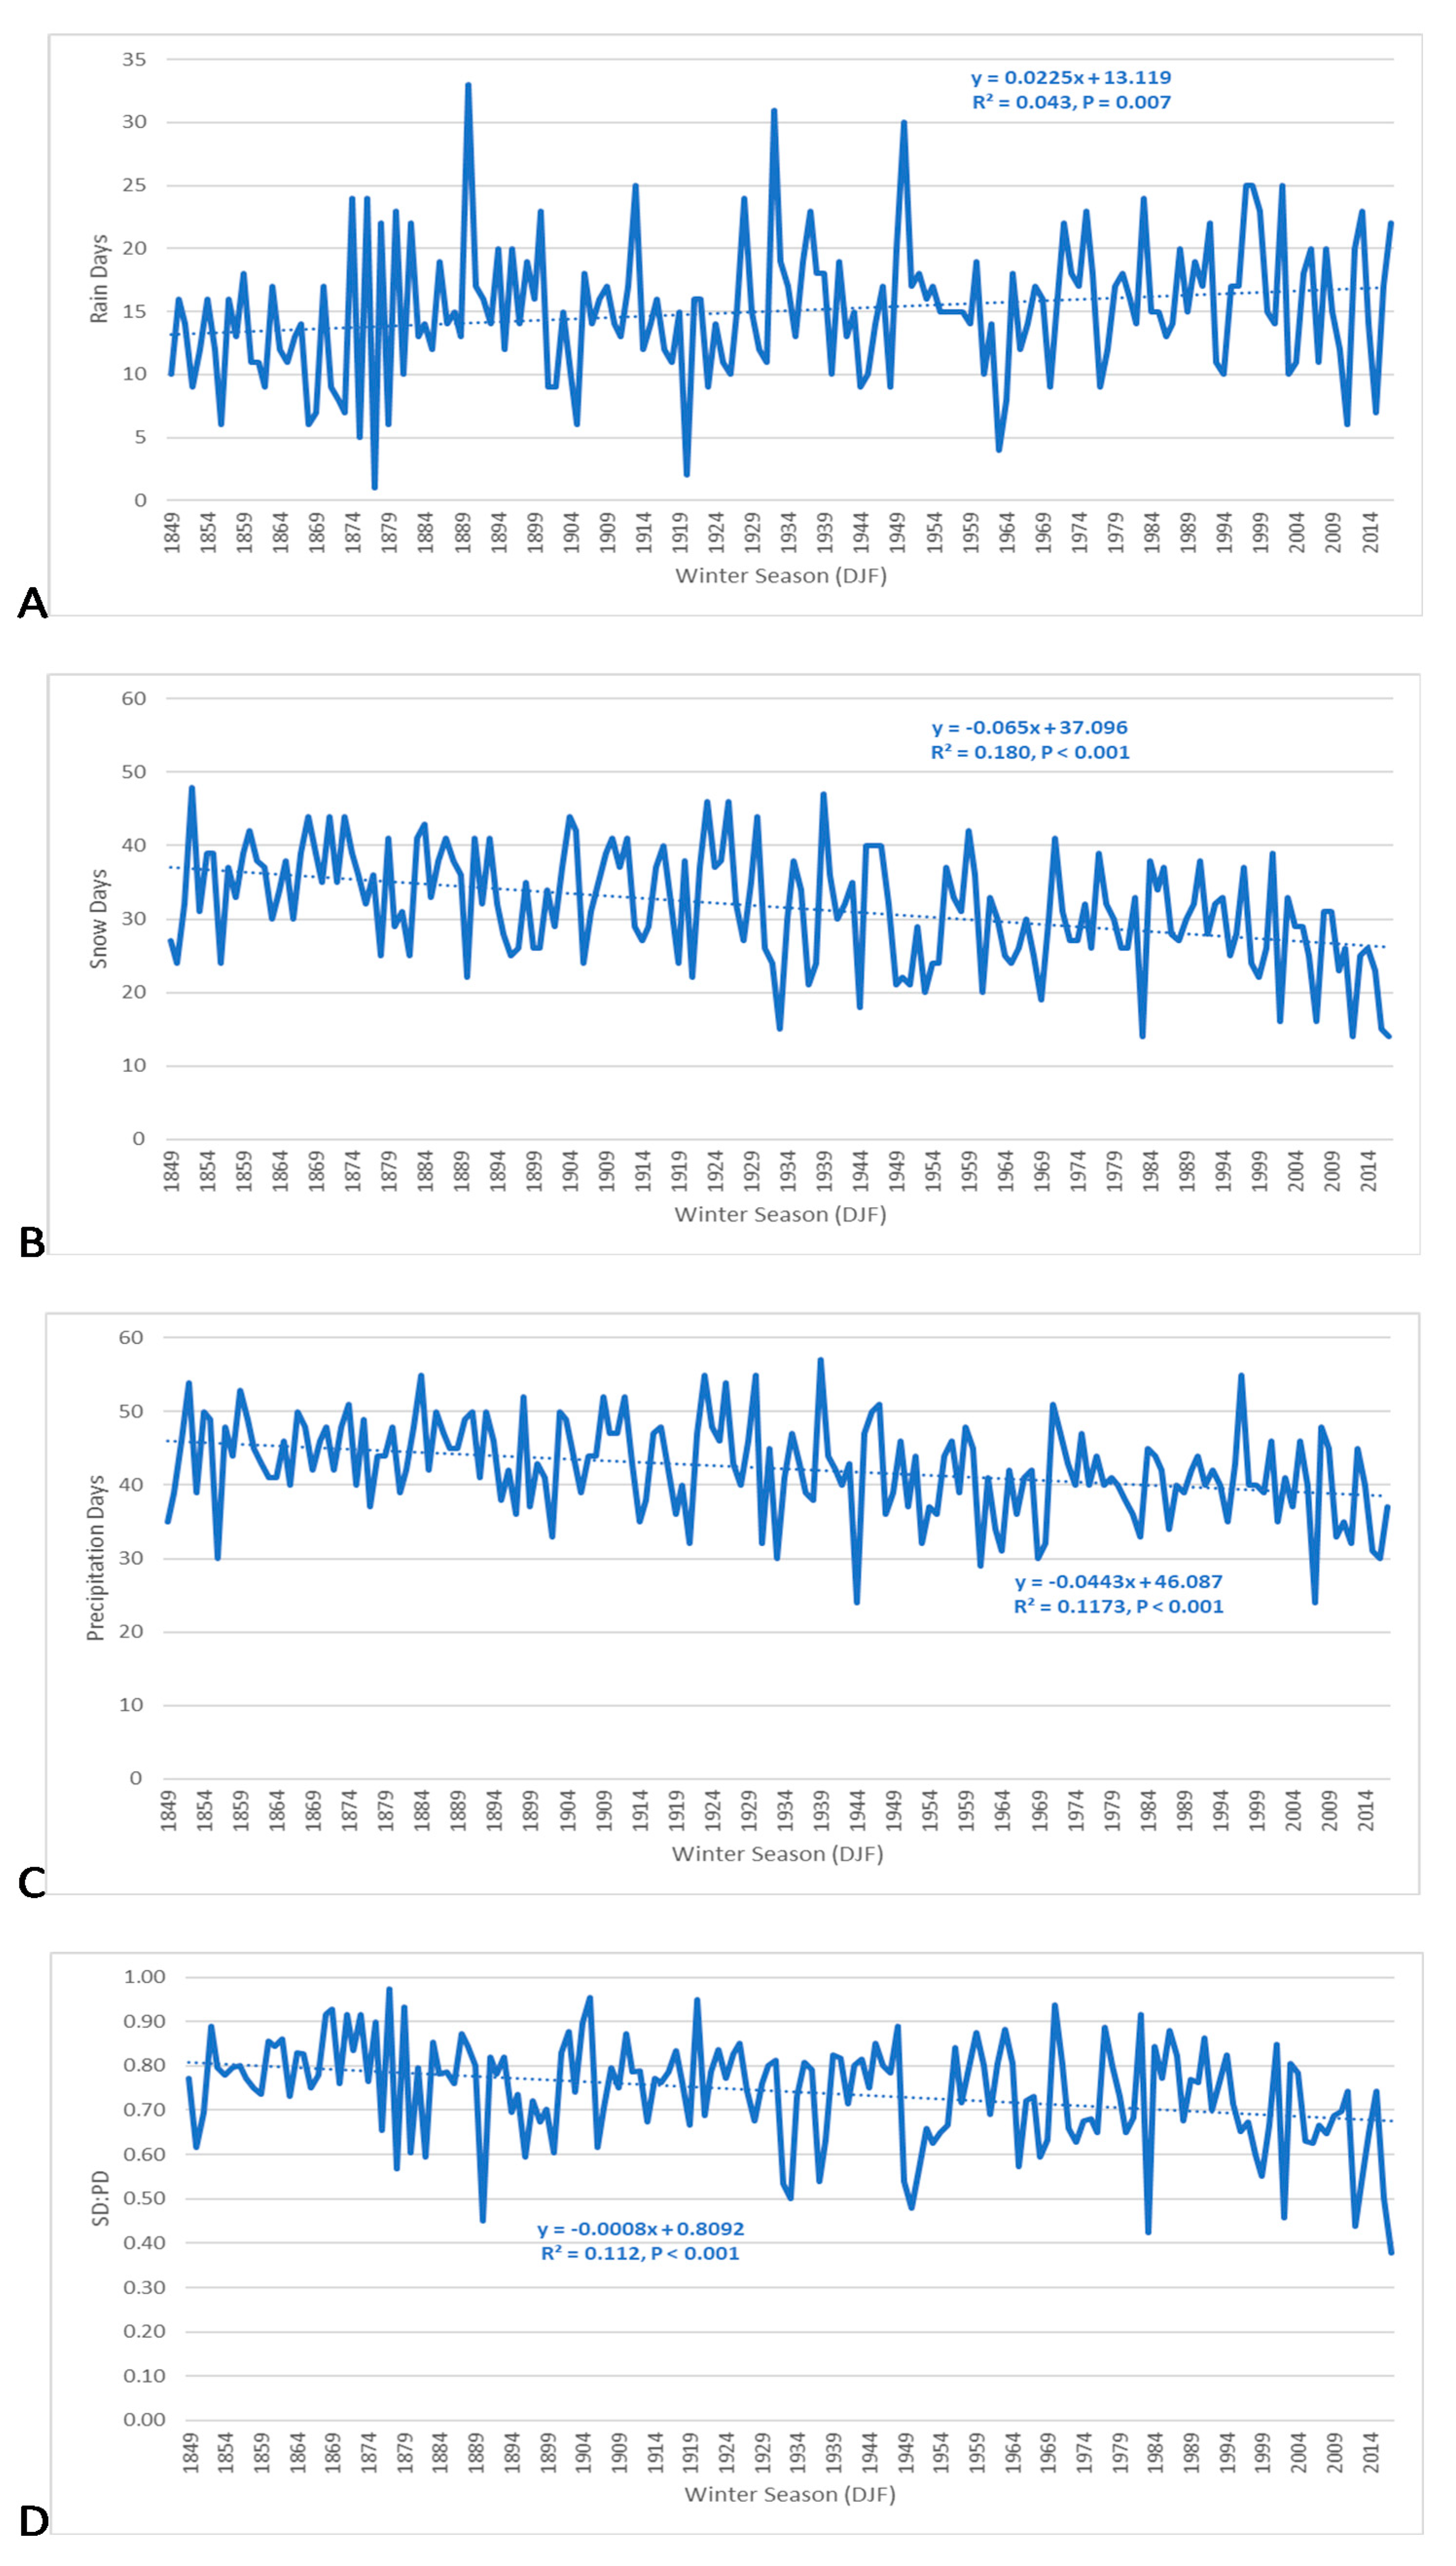
As an alternative to looking at the recorded amounts of winter season rainfall, snowfall, and total precipitation aggregated to the annual timescale over this 169–year time period, we also considered the number of rain days, snow days, and precipitation days during the winter season on an annual timescale. The total number of rain days (
Figure 2A) recorded during each winter season in Toronto’s downtown was increasing at a statistically significant rate (R
2 = 0.043,
p = 0.007) of 0.02 days/year. The equation for the slope of this linear trend line suggested that the average number of rain days each winter season in downtown Toronto increased from 13.1 days to 16.9 days, over the course of this time period. The annual sum of winter season rain days was normally distributed (X
2 = 12.001,
p = 0.151). According to the Durbin–Watson test statistic (d = 2.136,
p > 0.05), the slight negative serial correlation detected (−0.072) was not statistically significant. Nonetheless, we employed Kendall’s Tau rank correlation (T = 0.160,
p < 0.05) to validate the positive linear trend associated with the increasing number of winter season rain days in Toronto.
The total number of snow days during each winter season in Toronto (
Figure 2B) was decreasing from 1849 to 2017 at a statistically significant rate (R
2 = 0.180,
p < 0.001) of negative 0.07 days/year. The equation for the slope of this linear trend line suggested that the average number of snow days each winter season in Toronto decreased from 37.1 days to 26.1 days, over the course of this time period. The annual sum of winter season snow days was normally distributed (X
2 = 4.154,
p = 0.386). Despite a positive serial correlation observed among the data (0.110), the Durbin–Watson test statistic concluded that this autocorrelation was not statistically significant (d = 1.752,
p > 0.05). Still, we used Kendall’s Tau rank correlation (T = −0.280,
p < 0.05) to validate the negative trend associated with the decreasing number of snow days in Toronto.
The total number of precipitation days during each winter season in Toronto (
Figure 2C) was also decreasing from 1849 to 2017 at a statistically significant rate (R
2 = 0.117,
p < 0.001) of negative 0.04 days/year. The equation for the slope of this linear trend line suggested that the average number of precipitation days each winter season in Toronto decreased from 46.1 days to 38.6 days, over the course of this time period. The annual sum of winter season precipitation days in Toronto from 1849 to 2017 was normally distributed (X
2 = 10.090,
p = 0.433). A weak negative serial correlation was observed among the data (−0.015), but the Durbin–Watson test statistic concluded this autocorrelation not to be statistically significant (d = 2.009,
p > 0.05). Nonetheless, we also used Kendall’s Tau rank correlation (T = −0.280,
p < 0.05) to validate the negative slope of the linear trend line associated with the decreasing number of winter season precipitation days over time, indicating that winters in Toronto were experiencing fewer days with precipitation events over this time period.
The ratio of snow days to precipitation days (SD:PD) was another metric with which we could quantify the changing nature of the precipitation phase in Toronto (
Figure 2D). The percentage of total precipitation days that were considered snow days was decreasing from 1849 to 2017 at a statistically significant rate (R
2 = 0.112,
p < 0.001) of negative 0.08% per year. The equation for the slope of this linear trend line suggested that the SD:PD ratio for the winter season in Toronto decreased from 80.9% to 67.4%, over the course of this time period. From this, we can see that winter season precipitation days in Toronto have been predominantly snow days, and remain to be so, yet to a lesser degree. The winter season SD:PD ratio was normally distributed (X
2 = 2.638,
p = 0.267). A weak positive serial correlation was observed among the data (0.039), but the Durbin–Watson test statistic concluded that this autocorrelation was not statistically significant (d = 1.882,
p > 0.05). Yet still, we used Kendall’s Tau rank correlation (T = −0.209,
p < 0.05) to validate the negative slope of the linear trend line associated with the decreasing percentage of total precipitation days that were recorded as snow days over this time period.
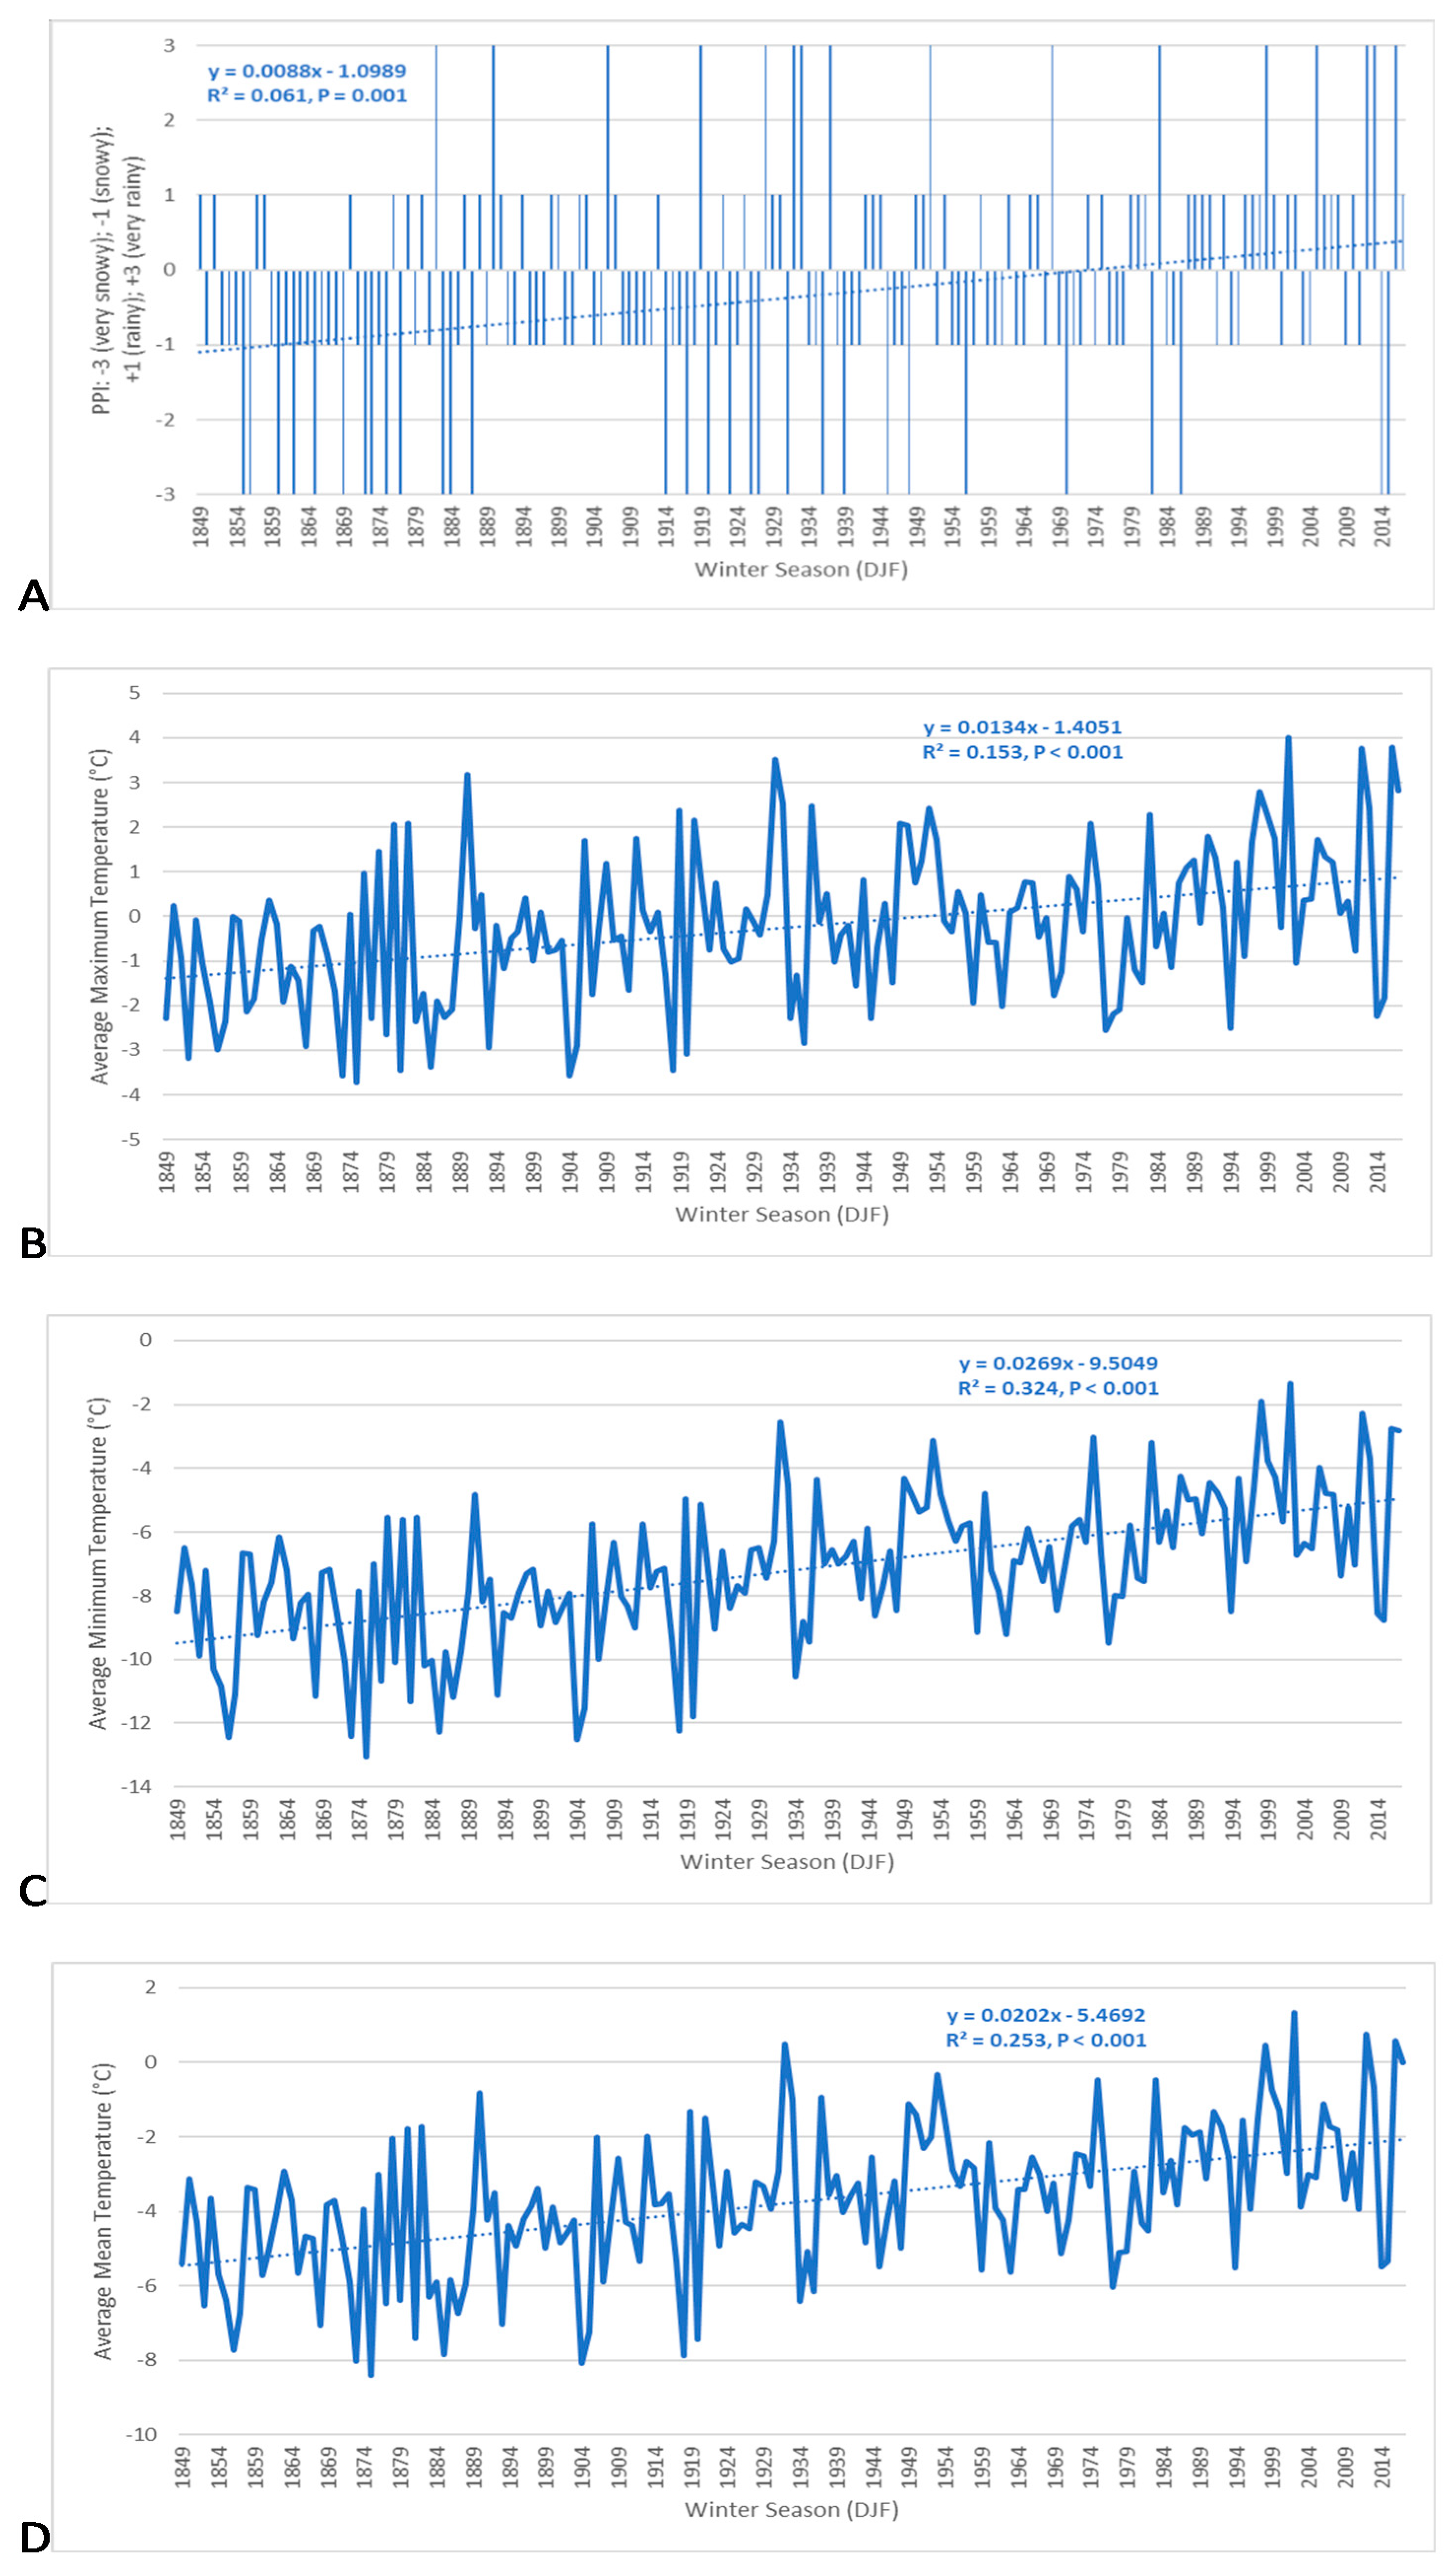
We explored one more alternative method for quantifying the changing nature of the precipitation phase in Toronto using the novel precipitation phase index (PPI). Winter season PPI values in Toronto (
Figure 3A) were increasing at a statistically significant rate (R
2 = 0.061,
p = 0.001). This positive linear trend line suggested that average winter season PPI values increased from −1.1 to 0.4 by the end of the time series. This trend indicated a historical transition away from snowy winters (PPI: −1) towards rainy winters (PPI: +1). Given the categorical nature of the PPI variable, values were not normally distributed (X
2 = 401.967,
p < 0.001); however, there were no significant issues of autocorrelation detected within the dataset (d = 2.144,
p > 0.05). Nonetheless, we used Kendall’s Tau rank correlation (T = 0.189,
p < 0.05) to validate the regression analysis, which confirmed the positive trend in PPI values over time.
We also sought to identify trends in winter season temperatures for Toronto, although already done before [
12,
16,
18]; since we also sought to establish correlations between the various precipitation phase metrics and temperature, we thought it appropriate to do so again and have all the information together in one study. Average maximum temperatures during the winter season (
Figure 3B) were increasing at a statistically significant rate (R
2 = 0.153,
p < 0.001) of 0.01°C/year from 1849 to 2017 in downtown Toronto. The positive slope of this linear trend line suggested that maximum temperatures during the winter season increased from an average of −1.41°C to +0.86°C by the end of the time series. Average winter season maximum temperatures were normally distributed (X
2 = 12.361,
p = 0.262). A weak negative serial correlation was observed among the data (−0.072), but the Durbin–Watson test statistic concluded that this autocorrelation was not statistically significant (d = 2.130,
p > 0.05). Nonetheless, we also used Kendall’s Tau rank correlation (T = 0.263,
p < 0.05) to validate the positive slope of the linear trendline associated with warming winter season maximum temperatures.
Average minimum temperatures during the winter season (
Figure 3C) were increasing at an even greater statistically significant rate (R
2 = 0.324,
p < 0.001) of 0.03°C/year from 1849 to 2017. The positive slope of this linear trend line suggested that minimum temperatures during the winter season increased from an average of −9.50°C to −4.96°C by the end of the time series. Minimum temperatures during the winter season were normally distributed (X
2 = 7.646,
p = 0.365). According to the Durbin–Watson test statistic (d = 1.964,
p > 0.05), the weak positive serial correlation detected (0.013) was not statistically significant. Still, we used Kendall’s Tau rank correlation (T = 0.395,
p < 0.05) to validate the positive slope of the linear trend line associated with warming winter season minimum temperatures.
Mean temperatures during the winter season (
Figure 3D) were increasing at a statistically significant rate (R
2 = 0.253,
p < 0.001) of 0.02°C/year from 1849 to 2017. The positive slope of this linear trend line suggested that the mean temperatures during the winter season increased from an average of −5.47°C to −2.06°C by the end of the time series. Mean temperatures during the winter season were normally distributed (X
2 = 5.206,
p = 0.391). Although a weak negative serial correlation was observed among the data (−0.042), the Durbin–Watson test statistic concluded that this autocorrelation was not statistically significant (d = 2.074,
p > 0.05). Nonetheless, we used Kendall’s Tau rank correlation (T = 0.342,
p < 0.05) to validate the positive slope of the linear trend line associated with warming winter season mean temperatures.
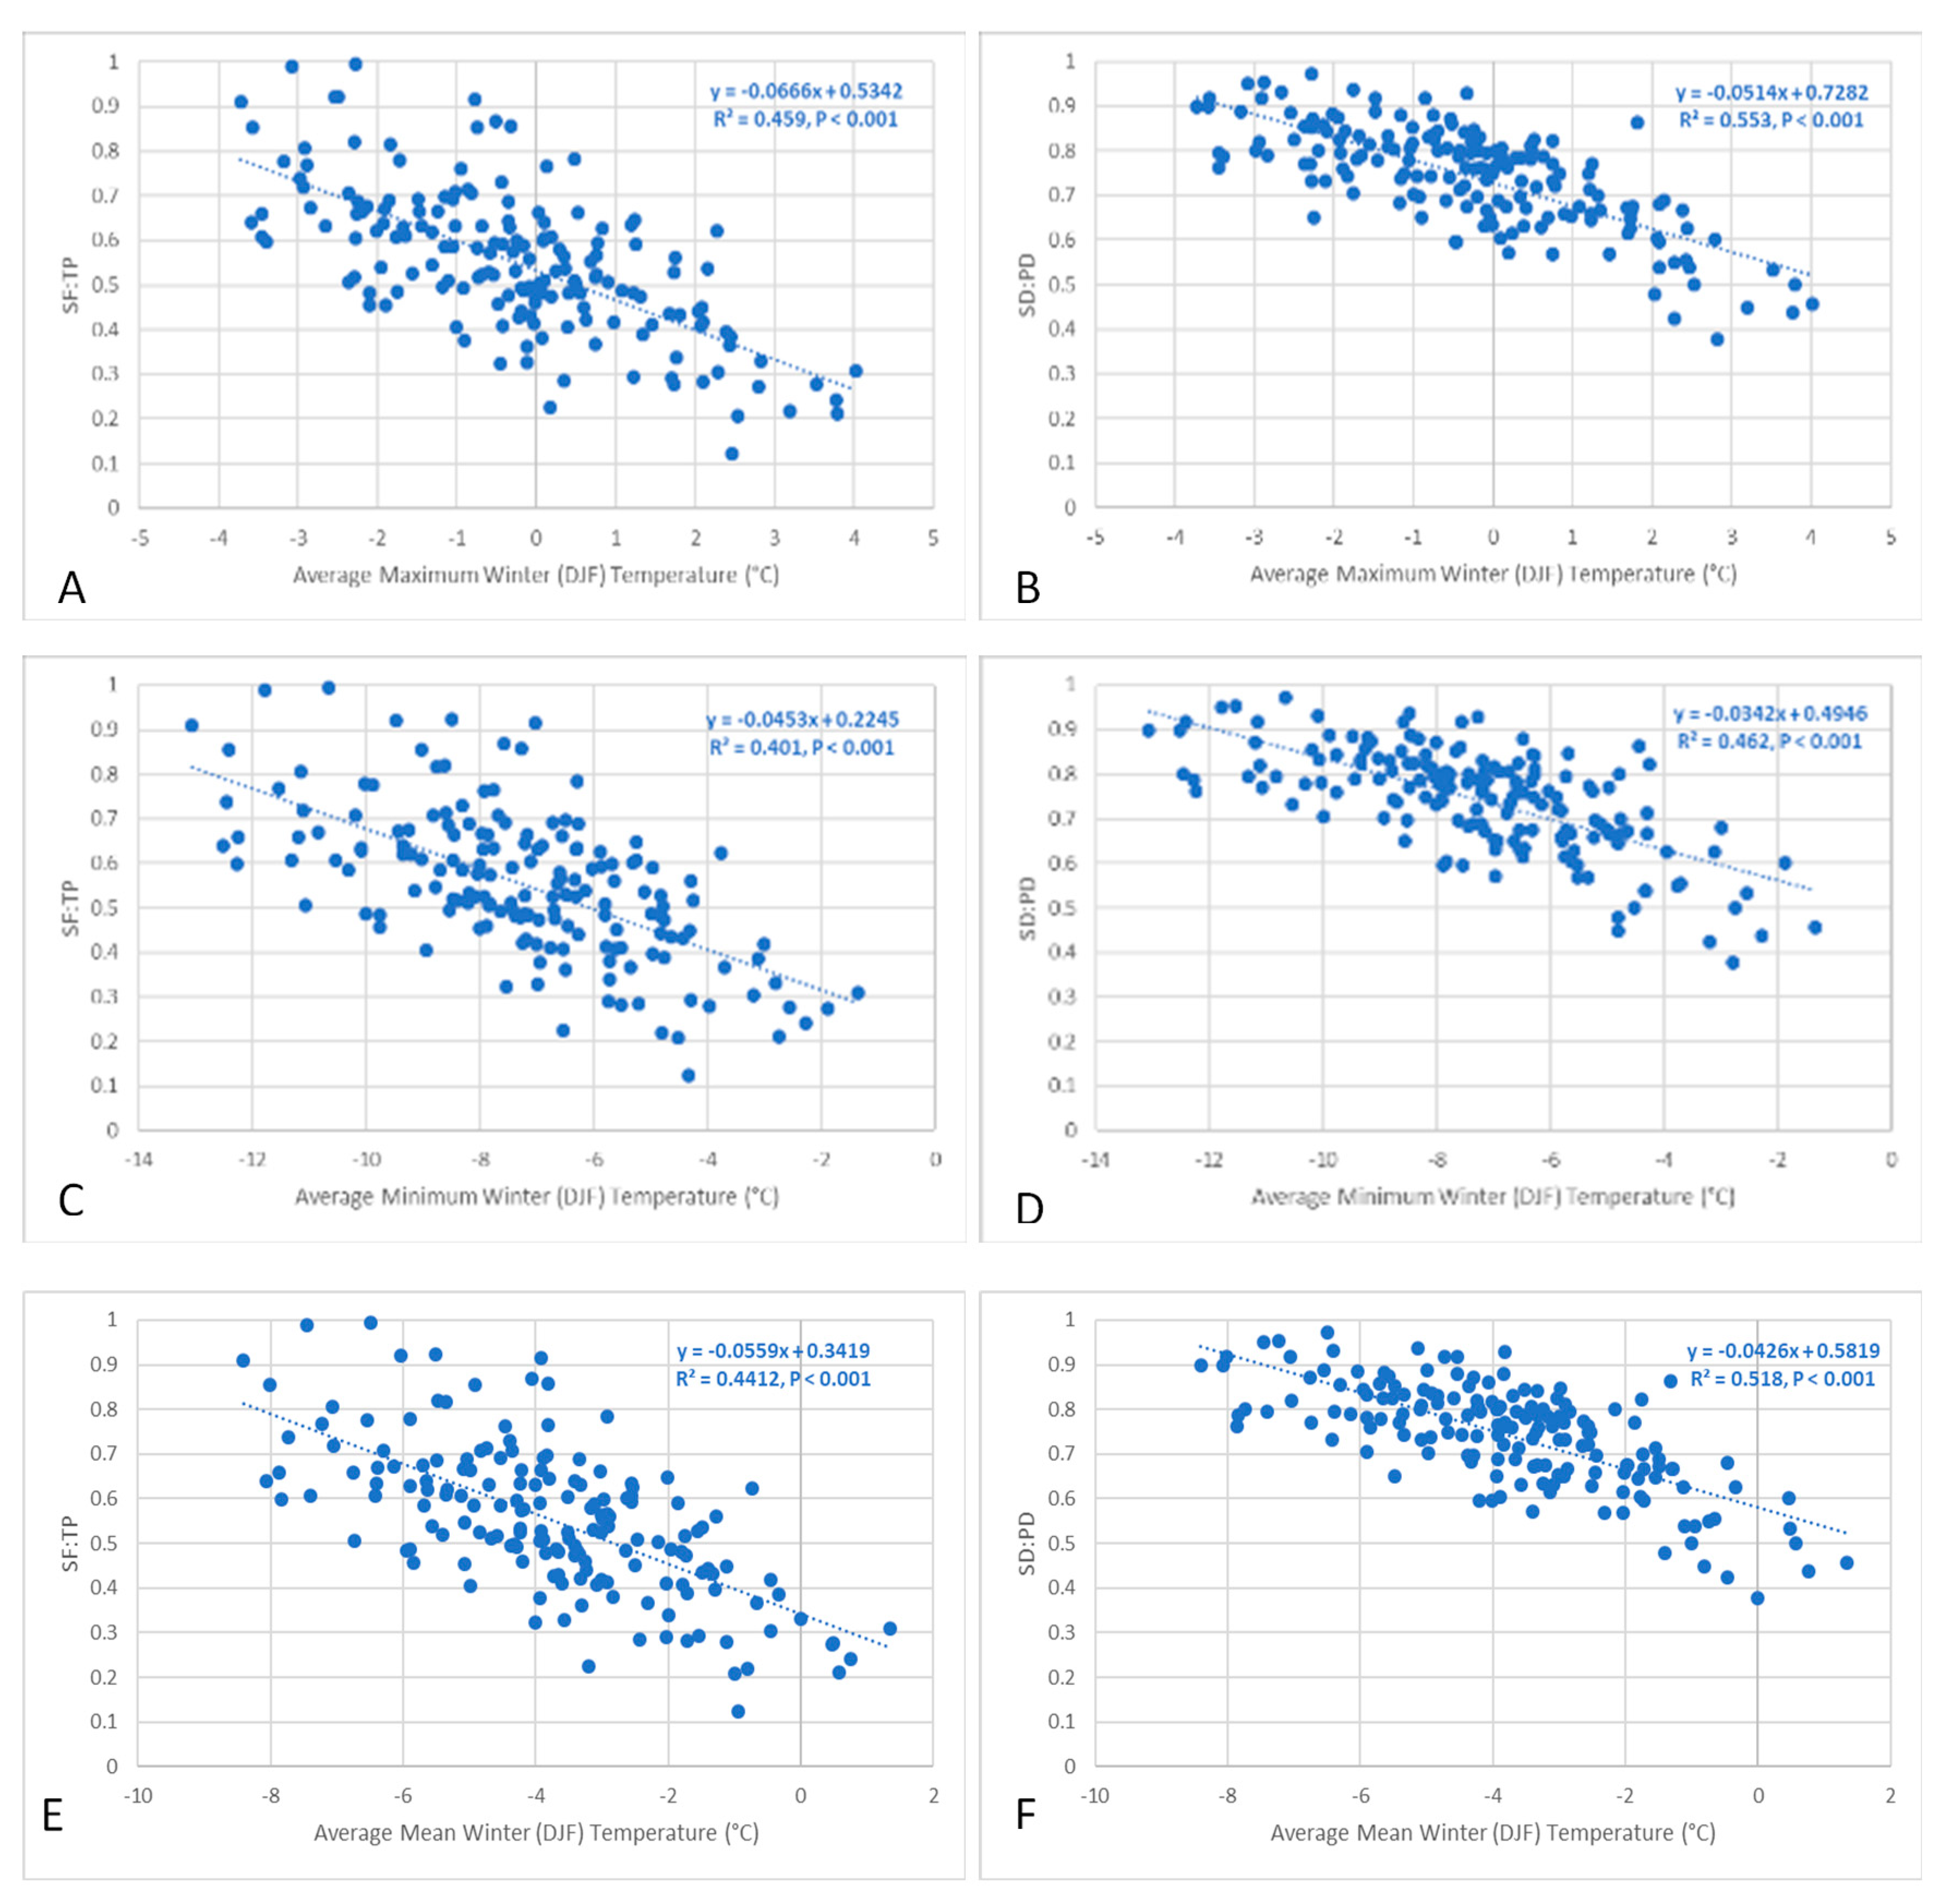
To evaluate the usefulness of the various precipitation phase metrics we explored in this study, we then examined correlations between them and the three temperature variables we presented above. Looking at panes A and B of
Figure 4, we can see that both the SF:TP ratio as well as the SD:PD ratio had strong and statistically significant correlations with maximum temperatures during the winter season in Toronto. We know from earlier in the study that all the variables considered (except the PPI index) fit a normal distribution; however, we also know that there were significant issues of autocorrelation among all these same variables. Therefore, to further validate the linear regression correlations between maximum temperatures and these precipitation phase metrics, we also used Kendall’s Tau rank correlation and found similar results. Changes in average maximum temperatures during the winter season in Toronto were able to explain 46–47% of the observed variability in the SF:TP ratio (R
2 = 0.459,
p < 0.001; T = −0.470,
p < 0.05) and 52–55% of the observed variability in the SD:PD ratio (R
2 = 0.553,
p < 0.001; T = −0.516,
p < 0.05). Based on the slope of the linear trend lines, a 1 °C increase in maximum temperatures during the winter season was associated with a 6.7% reduction in the percentage of total precipitation that fell as snow and a 5.1% reduction in the percentage of total precipitation days that were considered snow days.
Although minimum temperatures in Toronto are increasing at a greater rate than maximum temperatures (
Figure 3B,C), minimum temperatures had a weaker correlation with the precipitation phase metrics than maximum temperatures (
Figure 4C,D). Changes in average minimum temperatures during the winter season in Toronto were able to explain 40–44% of the observed variability in the SF:TP ratio (R
2 = 0.401,
p < 0.001; T = −0.441,
p < 0.05) and 46–47% of the observed variability in the SD:PD ratio (R
2 = 0.462,
p < 0.001; T = −0.473,
p < 0.05). Based on the slope of the linear trend lines, a 1 °C increase in minimum temperatures during the winter season was associated with a 4.5% reduction in the percentage of total precipitation that fell as snow and a 3.4% reduction in the percentage of total precipitation days that were considered snow days. It is interesting to note that changes in minimum and maximum temperatures were able to explain a greater percentage of the observed variability in the SD:PD ratio than they were able to explain for the SF:TP ratio; however, it was the SF:TP ratio that experienced the greater percent change per unit of increase in temperature.
Since mean daily temperatures were equal to the average of the minimum and maximum temperatures recorded each day, trends were not as pronounced for Tmean as they were for Tmin, yet still greater than Tmax, and the correlations were not as strong for Tmean as they were for Tmax, yet still stronger than Tmin. Panes E and F of
Figure 4 illustrate the correlation between average winter temperatures in Toronto and the SF:TP and SD:PD precipitation phase ratios. Changes in average winter temperatures in Toronto were able to explain 44–46% of the observed variability in the SF:TP ratio (R
2 = 0.441,
p < 0.001; T = −0.462,
p < 0.05) and 50–52% of the observed variability in the SD:PD ratio (R
2 = 0.517,
p < 0.001; T = −0.502,
p < 0.05). Based on the slope of the linear trend lines, a 1 °C increase in average temperatures during the winter season was associated with a 5.6% reduction in the percentage of total precipitation that fell as snow and a 4.3% reduction in the percentage of total precipitation days that were considered snow days.
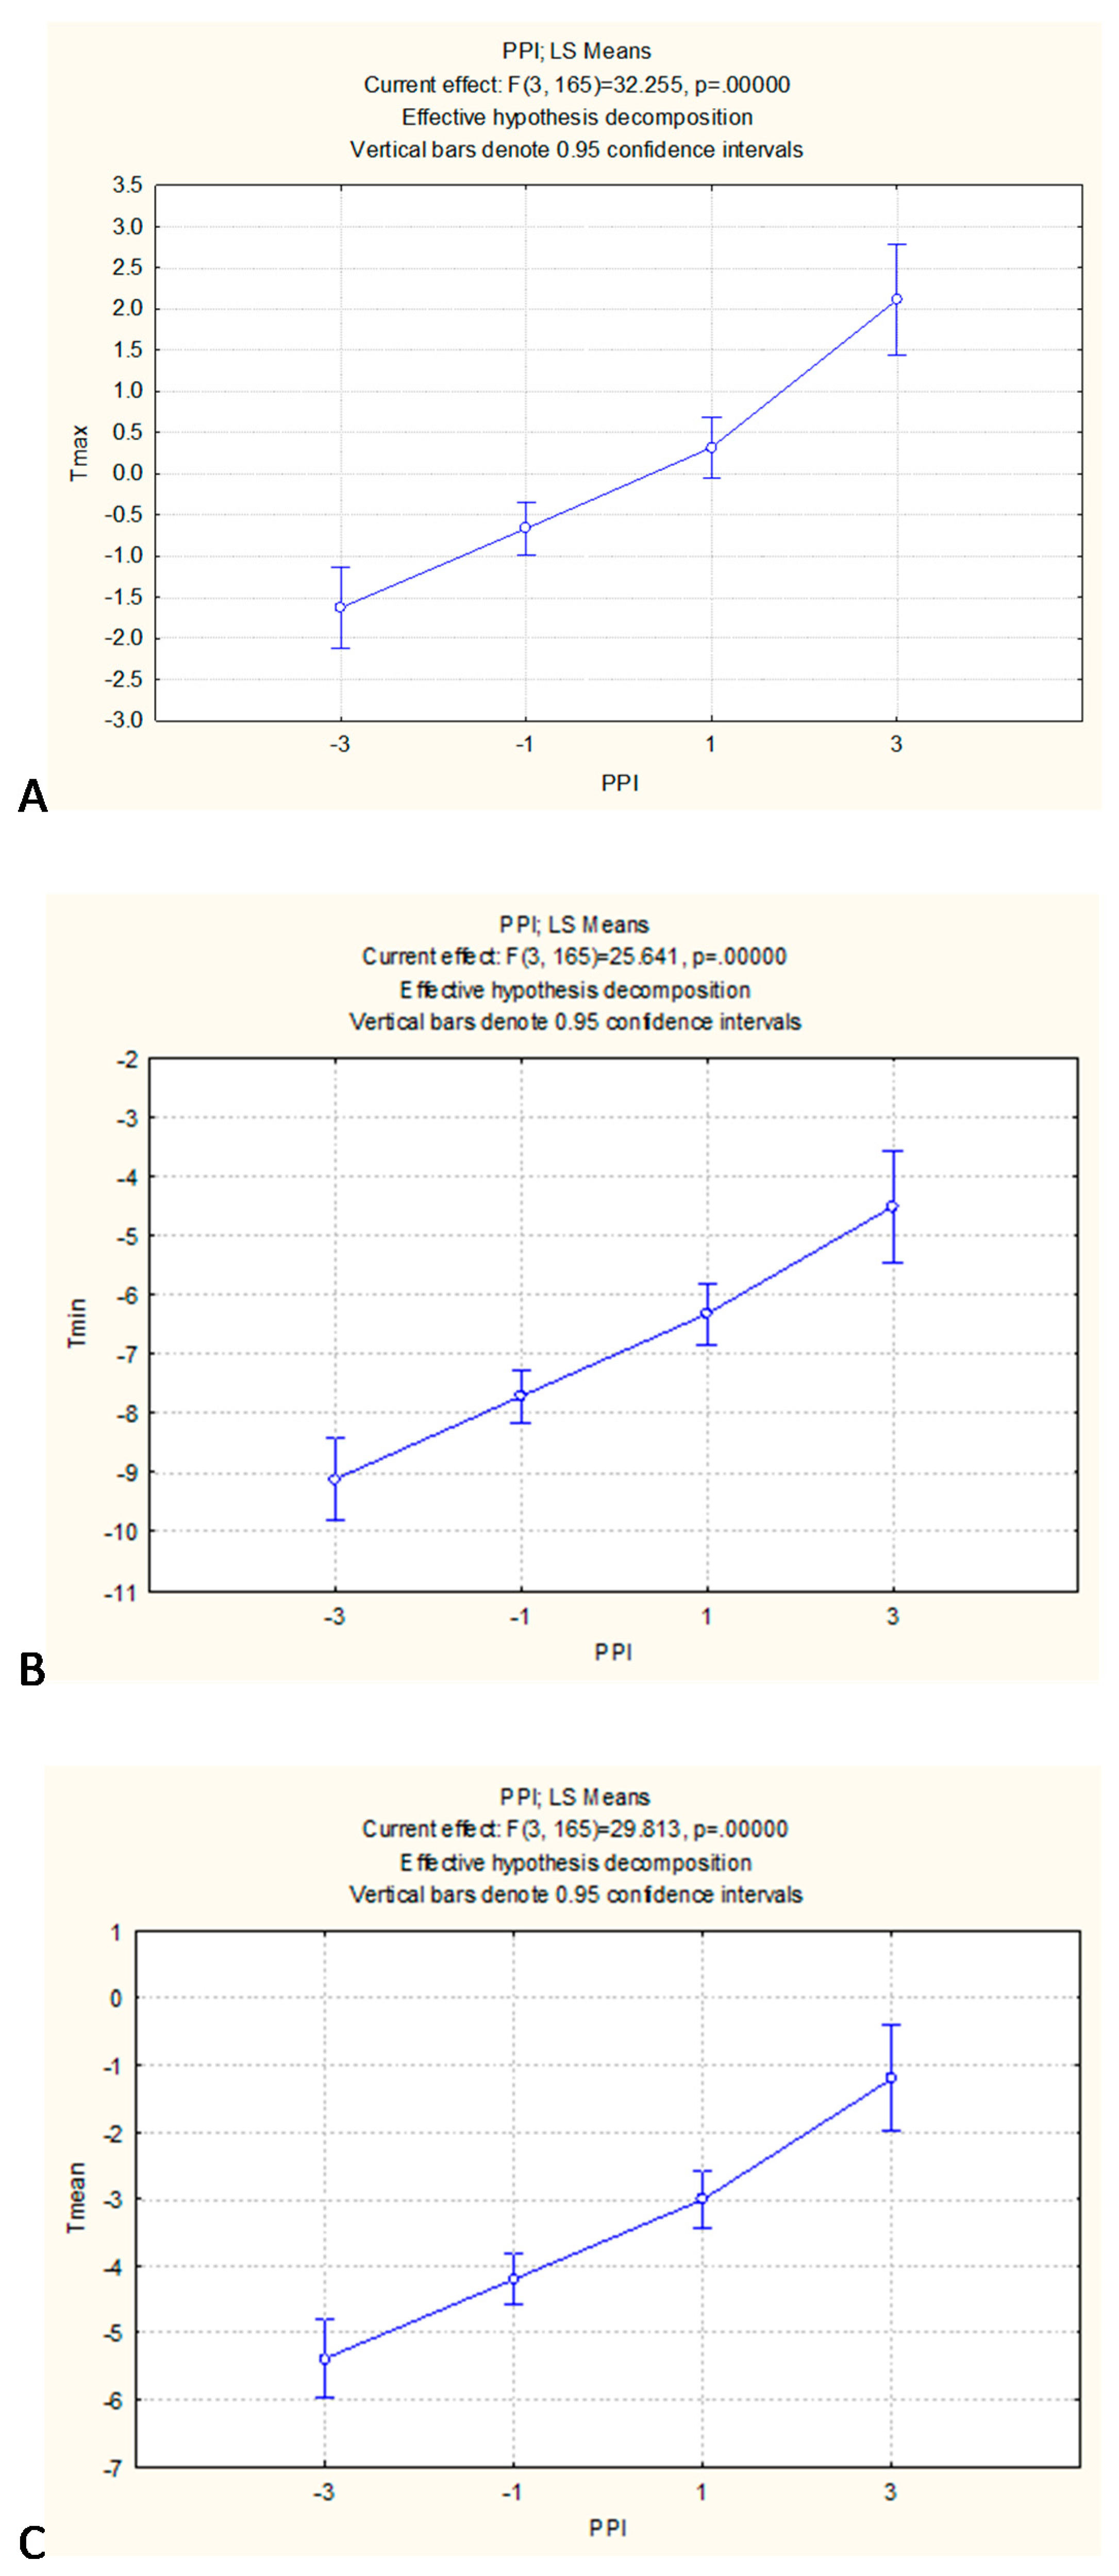
The final precipitation phase metric we explored to quantify the changing nature of the precipitation phase in Toronto was the precipitation phase index (PPI). Because the PPI variable is categorical, we presented the correlations with temperature using a series of one–way ANOVA effects graphs (
Figure 5A–C). However, we still ran the analysis for both linear regression and Kendall’s Tau rank correlation and have reported those results in conjunction with the one–way ANOVAs illustrated below.
The strongest and most informative correlation between winter temperatures and PPI (F = 32.255,
p < 0.001) was found in relation to the maximum temperature (
Figure 5A). On average, when maximum temperatures during the winter season in Toronto were above the freezing point (0 °C), the PPI was positive, indicating that winters were categorized as “rainy” (PPI = +1) rather than “snowy” (PPI = −1). Changes in average maximum temperatures during the winter season in Toronto were able to explain 36–45% of the observed variability in PPI (R
2 = 0.357,
p < 0.001; T = 0.448,
p < 0.05). Based on the slope of the linear trend line (y = 0.623x − 0.185), a 1°C increase in maximum temperatures during the winter season was associated with a 0.6–point increase in PPI. This slope suggested that future warming of 3.2 °C in maximum temperatures during the winter season in Toronto would result in another shift of phase within the index. We already saw a partial shift from snowy towards rainy due partly to observed warming of 2.3 °C in winter season maximum temperatures from 1849 to 2017 (
Figure 3B). Therefore, future warming of Tmax in Toronto under projected climate change could induce another winter season precipitation phase shift from rainy to very rainy; most likely by the end of the 21st century (the 2080s), when winter season Tmax is projected to warm by another 2.6 to 5.2 °C [
55].
Minimum temperatures during the winter season in Toronto also had a strong correlation with PPI (F = 25.641,
p < 0.001), but to a lesser degree than for maximum temperatures (
Figure 5B). Changes in average minimum temperatures during the winter season in Toronto were able to explain 32–43% of the observed variability in PPI (R
2 = 0.316,
p < 0.001; T = 0.433,
p < 0.05). Based on the slope of the linear trend line (y = 0.427x + 2.735), a 1 °C increase in minimum temperatures during the winter season was associated with a 0.4–point increase in PPI. This slope suggested that a warming of 4.7 °C in minimum temperatures during the winter season in Toronto would result in a shift of phase within the index. We already saw a partial shift from snowy towards rainy winters due partly to observed warming of 4.5 °C in winter season minimum temperatures from 1849 to 2017 (
Figure 3C). Thus, future warming of Tmin under climate change could induce another precipitation phase shift, this time from rainy to very rainy winters in Toronto.
Mean temperatures during the winter season in Toronto also had a strong correlation with PPI (F = 29.813,
p < 0.001), once again greater than the correlation between PPI and Tmin but less than that for Tmax (
Figure 5B). Changes in Tmean during the winter season in Toronto were able to explain 35–45% of the observed variability in PPI (R
2 = 0.346,
p < 0.001; T = 0.448,
p < 0.05). Based on the slope of the linear trend line (y = 0.525x + 1.622), a 1 °C increase in average temperatures during the winter season was associated with a 0.5–point increase in PPI. This slope suggested that future warming of 3.8 °C in average temperatures during the winter season in Toronto would result in a shift of phase within the index. We already saw a partial shift from snowy towards rainy due partly to observed warming of 3.4 °C in winter season mean temperatures from 1849 to 2017 (
Figure 3D); therefore, future warming of Tmean under climate change could induce another PPI shift, this time from rainy to very rainy.
4. Discussion and Conclusions
In this study, we examined time–series trends across nine different climate variables measured at the daily time scale, recorded at the downtown Toronto weather station during the winter months of December, January, and February, over the period from 1849 to 2017. These variables included rainfall (mm), snowfall water equivalent (mm), total precipitation (mm), rain days, snow days, precipitation days, minimum temperature (°C), maximum temperature (°C), and mean temperature (°C). Statistically significant time–series trends (at the 95% confidence level or greater) were detected using both linear regression and Kendall’s Tau rank correlation for eight of the nine variables, with only rainfall not showing any significant trends. Winter season temperatures were warming in Toronto with daily minimum temperatures warming at the fastest rate. Whereas, winter season precipitation was decreasing in Toronto, but with weaker time–series trends than was observed for increasing temperatures. Furthermore, snowfall and snow days were declining at a faster rate than total precipitation or precipitation days. Whereas, rain days were increasing but with the weakest time series trend.
Based on the six different precipitation variables described above, we were able to compute three different precipitation phase metrics: the fraction of total precipitation that fell as snow (SF:TP), the fraction of precipitation days that recorded snowfall (SD:PD), and finally, the novel precipitation phase index (PPI), which is based on comparing total monthly rainfall to the total monthly snowfall water equivalent and then calculating a winter season PPI value that categorizes winter season precipitation. The strongest time series trend in winter season precipitation phase for Toronto was detected for the SD:PD ratio (R
2 = 0.112,
p < 0.001; T = −0.209,
p < 0.05), followed by the PPI (R
2 = 0.061,
p = 0.001; T = −0.189,
p < 0.05) and then finally the SF:TP ratio (R
2 = 0.048,
p = 0.004; T = −0.149,
p < 0.05). This finding has important implications for the field of study seeing that the most conventional means of measuring changes in precipitation phase in North America has been based on the SF:TP ratio [
24,
28,
30,
37,
39], which was the metric which resulted in the least detectable time series trend within the current study. Whereas, the least common approach [
23] of counting the number of snow days and calculating the fraction of total precipitation days that recorded snowfall (SD:PD) resulted in the most detectable and strongest time series trend. Furthermore, the PPI index, which is derived from comparing the rainfall to the snowfall water equivalent, another common approach to quantifying changes in precipitation phase [
45,
46,
47,
48,
49,
50], also resulted in a stronger time series trend than the SF:TP ratio, but weaker than the SD:PD ratio.
Beyond comparing the strength of the time series trends identified across the three precipitation phase metrics, we also examined correlations with winter season temperatures in Toronto. Regardless of the precipitation phase metric considered, the strongest correlation was always found with maximum winter season temperatures, based on both Pearson’s correlation coefficient (R) as well as Kendall’s Tau rank correlation (T). Minimum winter season temperatures always had the weakest correlation with the precipitation phase metrics (but were still statistically significant), while mean winter season temperatures had a correlation roughly equal to the average between the minimum and maximum temperatures (due to the fact that Tmean is equal to the average of Tmax and Tmin for this climate station). This finding has implications for previous studies that have attributed changes in precipitation phase to changes in average winter temperatures [
28,
30,
32,
33,
35,
36,
38,
39], seeing that maximum winter temperatures had stronger correlations with all three precipitation phase metrics than average temperatures.
Regarding which precipitation phase metric had the strongest correlation with maximum winter temperatures, once again, the SD:PD ratio was the most useful metric for establishing a causal relationship with temperature. Changes in maximum winter temperatures were able to explain 52–55% of the observed variability in the SD:PD ratio; whereas, winter Tmax explained 46–47% of the observed variability in the SF:TP ratiotou and only 36–45% for the PPI. Therefore, the SD:PD ratio was found to be the best metric for identifying time–series trends in precipitation phase while also being the best metric for determining the causal relationship between changes in precipitation phase and warming temperatures. This is an important finding for the field of study, seeing that the SD:PD ratio is the least utilized approach, compared to the volume of studies using the SF:TP ratio or comparing the rainfall to snowfall, which forms the basis of the PPI. The SF:TP ratio did result in a stronger correlation with temperature than the PPI; however, this is likely since the PPI is a non–parametrical categorical variable, and the SF:TP ratio is a discrete variable with a normal distribution. This explains the relatively low Pearson correlation coefficient between PPI and Tmax (R
2 = 0.357,
p < 0.001), and the much highest Kendall’s Tau rank correlation (T = −0.448,
p < 0.05); whereas, this range was much smaller for the correlations between the SF:TP ratio and Tmax (R
2 = 0.459,
p < 0.001; T = −0.470,
p < 0.05). Therefore, considering the non–parametric statistics only, the explanatory power of maximum winter temperatures for the SF:TP ratio (47%) and the PPI (45%) was nearly equivalent (both below 50%); whereas Tmax was able to explain more than 50% of the observed variability in the SD:PD ratio (55%). This finding has implications for precipitation phase modeling [
23], seeing that the SD:PD ratio was the only metric considered for which maximum temperatures could explain more of the observed variability than the percentage that remained unexplained.
Clearly, there remains much more to be considered regarding explanatory factors associated with changes in precipitation phase. Although this case study for downtown Toronto (Canada) echoes the findings of Knowles et al. [
38], who reported that mean temperatures and the magnitude and direction of the surface temperature trends were the fundamental determinants of the amount of precipitation shifting from snow to rain, certain other factors also have a role in altering the nature of precipitation phase in this study area. For example, declining lake ice conditions over Lake Ontario may also be driving the shift from snow to rain [
5,
6,
56]. Additionally, the urban heat island effect associated with the City of Toronto could also be playing an influential role in conjunction with rising temperatures under global warming [
13,
19], potentially altering atmospheric circulation patterns around the city and thereby affecting precipitation phase. Furthermore, due to pioneering work [
57,
58], precipitation phase modeling now incorporates the effects of humidity [
59,
60], as well as atmospheric temperature profiles [
61]. Another thought would be to include the role of sea surface temperatures and ocean oscillations [
28,
38]. However, Knowles et al. [
38] did conclude that although fluctuations in the pacific decadal oscillation have impacted temperatures and subsequently snowfall to total precipitation ratios, it is also apparent that longer–term climate warming has had an effect as well, similar to findings reported for snowpack melt [
35] and snowmelt run–off [
25].
Due to Toronto’s midlatitude geographic location, especially as it is one of Canada’s more southerly cities, being situated in the Great Lakes basin, this region is susceptible to climatic changes in the form of winter season precipitation phase because average winter temperatures are currently near the freezing point (0 °C). Based on the climate record considered (1849 to 2017), average winter temperatures were −5.0 °C during the first 30–year climate normal (1849 to 1880), whereas average winter temperatures have risen to −2.1 °C during the most recent 30–year climate normal (1988 to 2017). Knowles et al. [
38] reported that precipitation phase change occurred when a station’s winter season (wet–day) minimum temperature rose above −5 °C. Additionally, Karl et al. [
37] found that the annual ratio of snow to total precipitation was decreasing across areas in Canada below 55°N, which would geographically be associated with certain temperature profiles typically warmer than locations above 55°N.
The results of the current study found that each precipitation phase metric was associated with different temperature thresholds, the point at which characterizing change in precipitation phase would be likely to occur. In Toronto, it is likely that the fraction of total precipitation that falls as snow (SF:TP) will decline below 50% when average maximum winter temperatures exceed 0.5 °C and/or when average minimum winter temperatures exceed −6 °C. For the fraction of precipitation days that are considered snow days (SD:PD), it is likely that this ratio will drop below 50% when the average winter Tmax exceeds 4 °C and/or when the average winter Tmin exceeds 0°C. Finally, for the PPI, it is likely that the transition from snowy (PPI:−1) to rainy (PPI:+1) winters in downtown Toronto will occur when the average winter Tmax exceeds 0 °C and/or when average winter Tmin exceeds −7 °C. Observed and projected climate change in the Toronto area suggest this magnitude of warming is likely to occur during the 21st century [
55,
56]. The subsequent shift in precipitation phase to more rain and less snow characterizing winter seasons in the region will negatively impact recreation and tourism activities that rely on snow and ice [
62].
Considering these temperature parameters, an important area of future research would involve exploring trends and changes in these three precipitation phase metrics for other Canadian cities that share climates similar to that of Toronto (i.e., those located below 55°N), or that are associated with average winter temperatures where Tmax is near 0°C and/or Tmin is near −6 °C. Looking at the most recent 30–year climate normal from the dataset we analyzed (1988 to 2017), Toronto has already exceeded the temperature thresholds for dropping the SF:TP ratio below 50% as well as for moving the PPI index from snowy to rainy, seeing that average winter Tmax is currently 0.9 °C, and average winter Tmin is now −5.1 °C. Therefore, the results of this study conclude that the nature of winter season precipitation in Toronto has changed from snowy to rainy based on a variety of precipitation phase metrics. However, the city’s core still experiences more snow days than rainy days across the winter season. Thus, the downtown station data suggests that the frequent snow events currently experienced are much lighter in volume than the less common but heavier rain events. Future research is required to better quantify and explain this apparent phenomenon associated with precipitation phase, especially regarding the form in which precipitation falls during extreme weather events in Toronto and for other study areas. Finally, a similar study that considers more weather stations across the city, like previous studies looking at temperature trends across the city [
15,
16,
19], would be another important area of future research to determine if these observed changes in winter season precipitation phase within the downtown core are also being observed in other locations across the city.


