1. Introduction
Due to the impact of volcanic activity on air pollution, damage to buildings and crops, and air traffic closures [
1,
2,
3], potentially affected regions require information on ash dispersion trajectories and ground deposition patterns [
4,
5]. Although ashfall rarely endangers human life directly, disruptions can lead to substantial impacts and costs, even at deposit thicknesses of only a few millimeters [
6].
Ecuador hosts about 85 volcanoes, about 25 of which are currently erupting, active, or potentially active. Over the last 20 years, five volcanoes have produced small to large explosive eruptions with significant ash plumes (Pichincha, Sangay, Tungurahua, El Reventador, and Cotopaxi). Therefore, research into the dispersion and forecasting of volcanic ash is a priority in Ecuador.
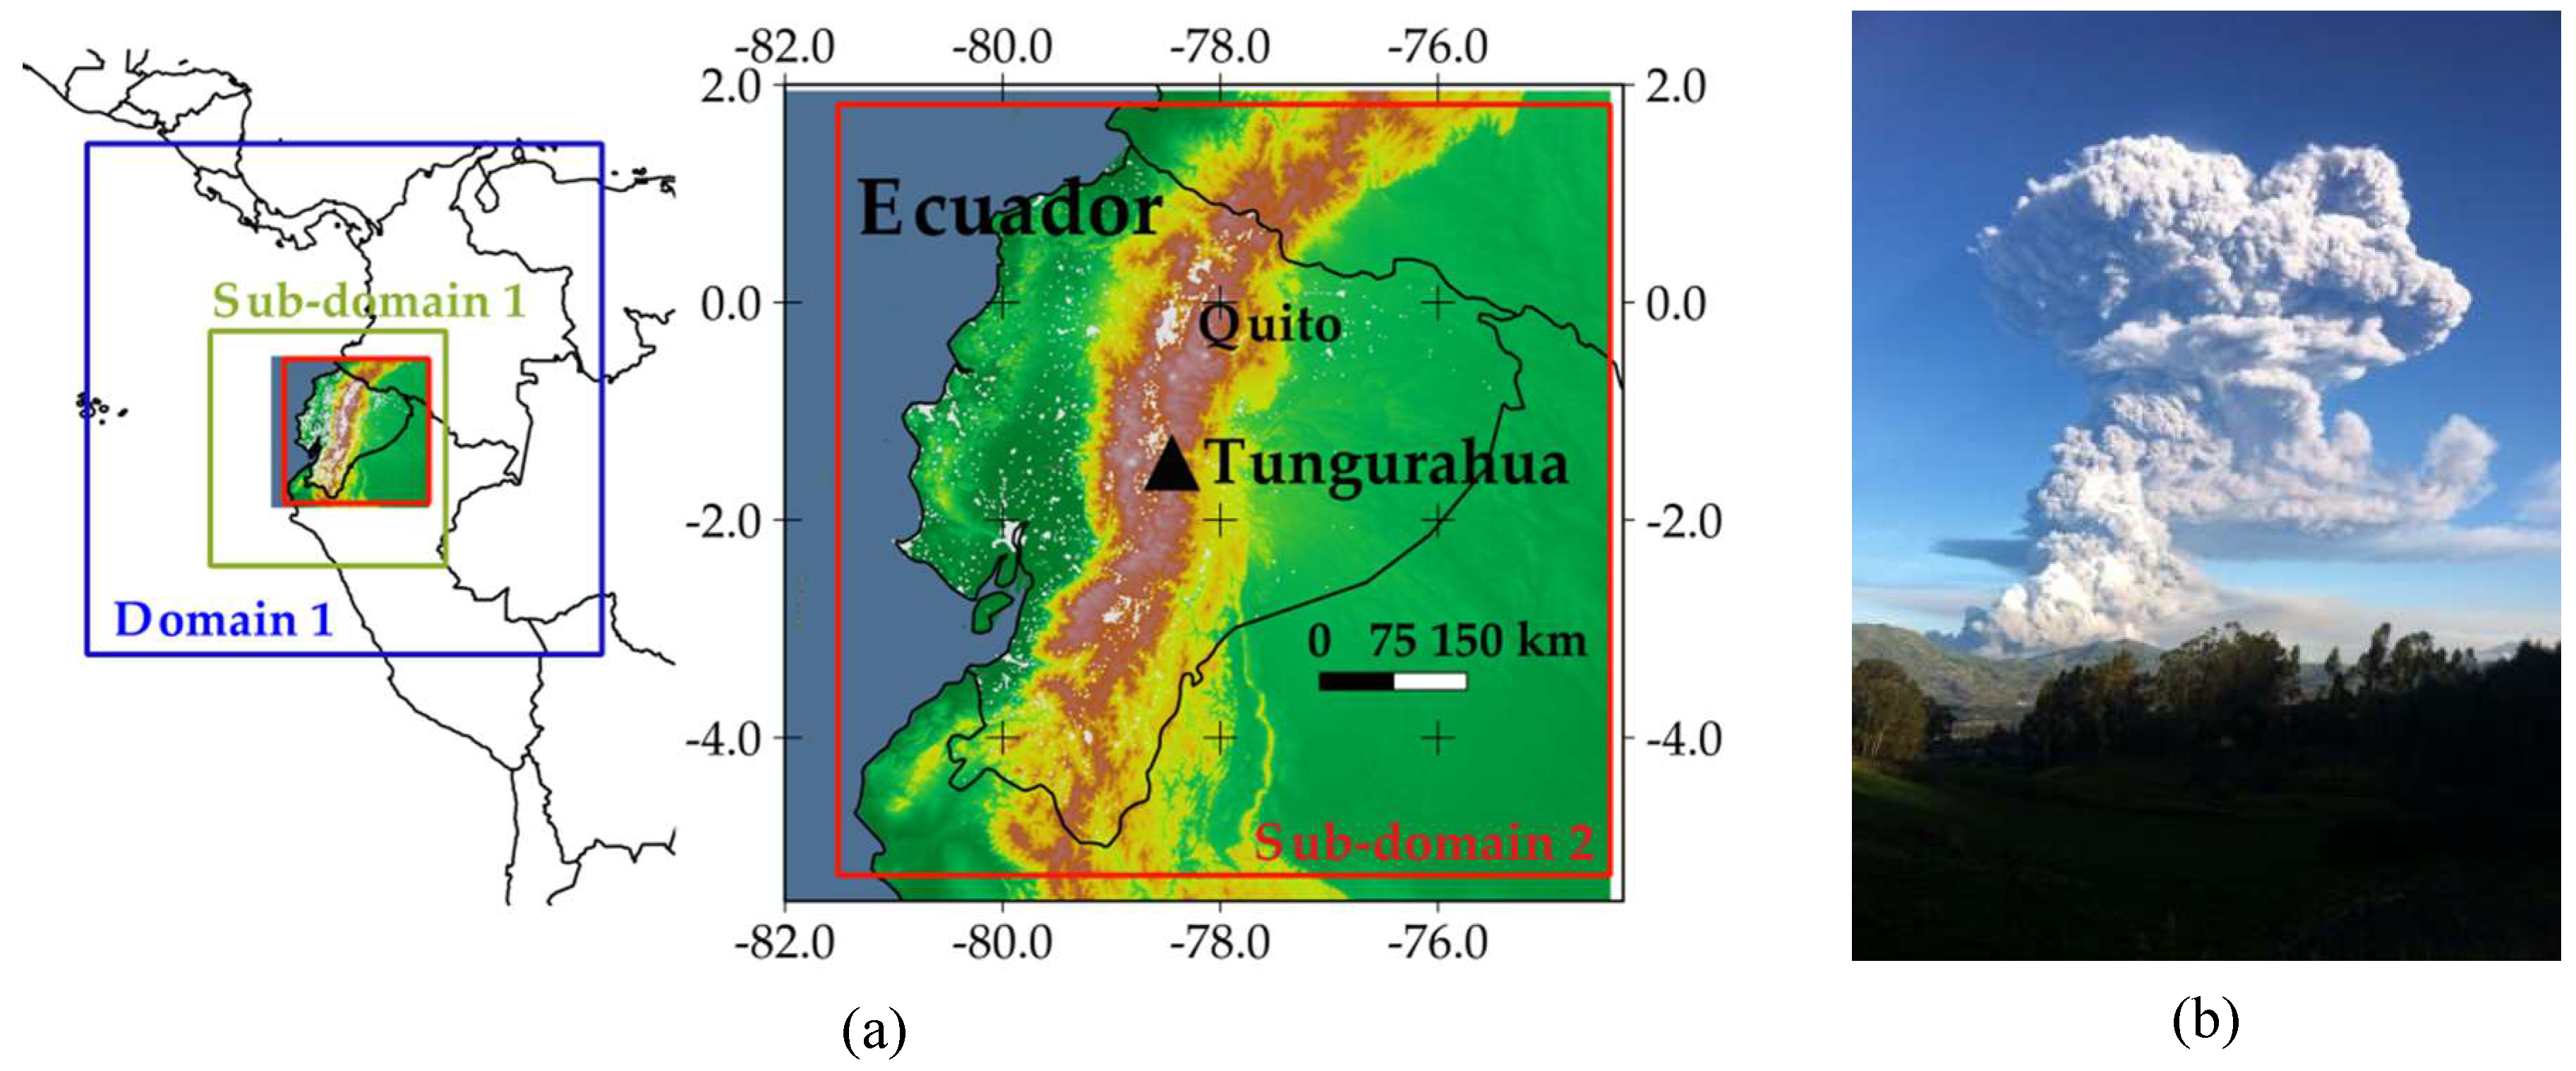
Since April of 2015, the ash dispersion and ash fallout due to Vulcanian eruptions at Tungurahua (Lon. 78.446° W, Lat. 1.468° S, 5023 m a.s.l.,
Figure 1), a large stratovolcano located in the Real Cordillera of the Ecuadorian Andes, have been forecasted daily. Since the beginning of its current activity in October 1999, ash fallout has been the most frequent and widespread volcanic hazard [
7,
8]. Emissions have been discontinuous, being Strombolian and Vulcanian explosions [
9] with volcano explosivity index (VEI) levels of <1 to 3 [
10].
1.1. Eruption Source Parameters and Forecasting System for Vulcanian Eruptions at Tungurahua Volcano
The geometry of ash fallout deposits reflects the combination of eruptive style, intensity, and meteorology [
11]. Therefore, based on field data and laboratory analyses of ash fallout deposits, complemented with numerical studies, the eruption source parameters (ESP) for Tungurahua have been previously proposed (
Table 1) [
12]. These ESP correspond to the eruption on 14 July 2013. On that day, an explosion at 6:47 LT (LT = UTC − 5 h) produced short-term columns rising to 9 km above the vent. Based on its characteristics, this eruption was classified as Vulcanian and is a well-studied event; it was considered representative for similar current eruptions at Tungurahua volcano.
These ESP suggest a high (8.80 km over the vent) and short (3 min) column, followed by a second medium height (4.85 km) and longer (22 min) pulse. The mass flow rate was estimated by the model of Mastin et al. [
13], which uses the column height as input. The source type distributes the emitted mass along the vertical axis. The total grain size distribution (bi-Gaussian) was established by laboratory analysis of ash fallout collected from the eruption on 14 July 2013.
These predefined ESP were validated through the simulation of two historical Vulcanian eruptions, which occurred on 16 December 2012 (6:02 LT) and 01 February 2014 (17:13 LT;
Figure 1). These simulations were carried out assuming that, except for the eruption starting time, no other inputs were available. During the eruption in December 2012, wind traveled in the NNE–N–NNW direction, causing fallout in the provinces of Tungurahua and Cotopaxi. During the eruption in February 2014, the wind direction was mainly towards the south and ash fallout affected the provinces of Chimborazo, Cañar, Bolivar, and Azuay, reaching the city of Cuenca [
12].
Table 2 indicates the modeling performance for the eruptions on 14 July 2013, 16 December 2012, and 01 February 2014. The correlation coefficient (R
2) and parameters “a” and “b” correspond to linear interpolations (y = ax + b; perfect fitting implies R
2 = 1, a = 1, and b = 0) after comparison between ground ash load measurements with the corresponding modeled values at four stations. More details can be found in [
12].
Our forecasting provides information about the dispersion and dynamics of volcanic ash at different Flight Levels (FLs; 200, 300, and 400), and of the area affected by ash fallout, under the assumption that an explosive eruption similar to that on 14 July 2013 takes place each day. FLs are delivered in 100 feet units, measured above mean sea level when the pressure at sea level is 1013.2 mb (e.g., FL300 = 30,000 feet ≈ 9.1 km).
Our forecasting system uses the meteorological Weather Research and Forecasting (WRF) [
16] and the FALL3D [
17] models, which are both Eulerian models. WRF is a last-generation non-hydrostatic model used for forecasting and weather research, with applicability to global, mesoscale, regional, and local scales. FALL3D is a 3D time-dependent model for the dispersion of volcanic ash, which solves the advection–diffusion–sedimentation equation on a terrain-following grid.
A master domain of 80 × 80 cells (36 km per side) and two nested sub-domains (see
Figure 1) were used for modeling. Sub-domain 2 covers Ecuador with 199 × 199 cells (4 km) and 35 vertical levels. The resolution of 4 km is a good compromise for forecasting volcanic ash dispersion in Ecuador, with proper modeling performance. The use of coarser meteorological data, as a direct result from global forecasting datasets, led to lower modeling performance and provided larger areas affected by ash clouds, compared to results when modeling with higher resolutions [
18].
The forecasting system works with the following approach:
First, the system downloads the forecasted global meteorology from the GFS dataset [
19], in order to set the initial and boundary conditions for the nested sub-domains (
Figure 1).
Then, WRF generates the meteorology over Ecuador.
Table 3 indicates the physical parameterization used for this component.
Next, the meteorological output from the second sub-domain is input into FALL3D, which also uses the predefined ESP of
Table 1. FALL3D writes the results into a NetCDF file. Hence, the forecasting system is based on an offline approach, without interactions between meteorology and volcanic ash in the atmosphere.
Finally, the system generates animated (.gif) files, which are uploaded to the web page of the Grupo de Investigación sobre la Ceniza Volcánica en el Ecuador (GICVE, due to its nomenclature in Spanish; 2020) [
20]. GICVE is a group of researchers interested in the study of the dispersion of volcanic ash in Ecuador.
Parra (2018) [
21] described the components of this forecasting system in more detail, whose historical results are available at the web link of GICVE.
1.2. Advisories by the Washington VAAC
To provide arrangements for monitoring volcanic ash and warnings to the aviation community, the International Civil Aviation Organization (ICAO) established the International Airways Volcano Watch (IAVW) program in 1994. Under this program, nine Volcanic Ash Advisory Centers (VAACs) were constituted, in 1997, as entities designed by the IAVW for issuing volcanic ash warnings. When an ash cloud is detected, the VAACs provide information about its boundary and speed and, using atmospheric transport models, they predict the cloud path at different FLs [
23].
Ecuador is monitored by the Washington VAAC, whose advisories of detected ash clouds are based on satellite imagery, pilot reports, and observatory information [
24]. The Washington VAAC provides the coordinates of corners of polygons representing the shape of the detected ash clouds. The forecasting of trajectories in the following 6, 12, and 18 h after ash cloud detection is based on the Hybrid Single-Particle Lagrangian Integrated Trajectory (HYSPLIT) model [
25]. Due to the presence of clouds in the Andean region of Ecuador, in the case of weak eruptions, the consequent volcanic ash clouds are sometimes not detected by the Washington VAAC [
21]. Over the Andean region of Ecuador, on average, the cloud-top-height reaches about 7 km a.s.l., with values of the liquid water path (total amount of liquid water) between 225 to 375 g m
−2 [
26]. The ice-water content in tropical convective clouds at 10 km a.s.l. can be higher than 1.5 g m
−3 [
27].
1.3. Monitoring and Data of Tungurahua Volcano
The Instituto Geofísico–Escuela Politécnica Nacional (IG-EPN) monitors Tungurahua volcano [
9,
10]. As part of the hazard information related to this volcano, IG-EPN delimitated the zones potentially affected by ash fallout. This delimitation was published in 2008, based on the analysis of ash fallout distribution of past eruptions, showing two ellipsoidal contours oriented west of the vent. The values of these contours correspond to eruptions with VEI levels of 2, 3, and ≥4 [
9]. At present, there exists no information about the probability of ash fallout.
Despite this tendency towards the west, volcanic ash emitted by Tungurahua can be dispersed in other directions, as previously indicated by the eruptions on 16 December 2012 (towards NNE–N–NNW) and 01 February 2014 (towards the south). The volcanic ash may even be dispersed in all directions.
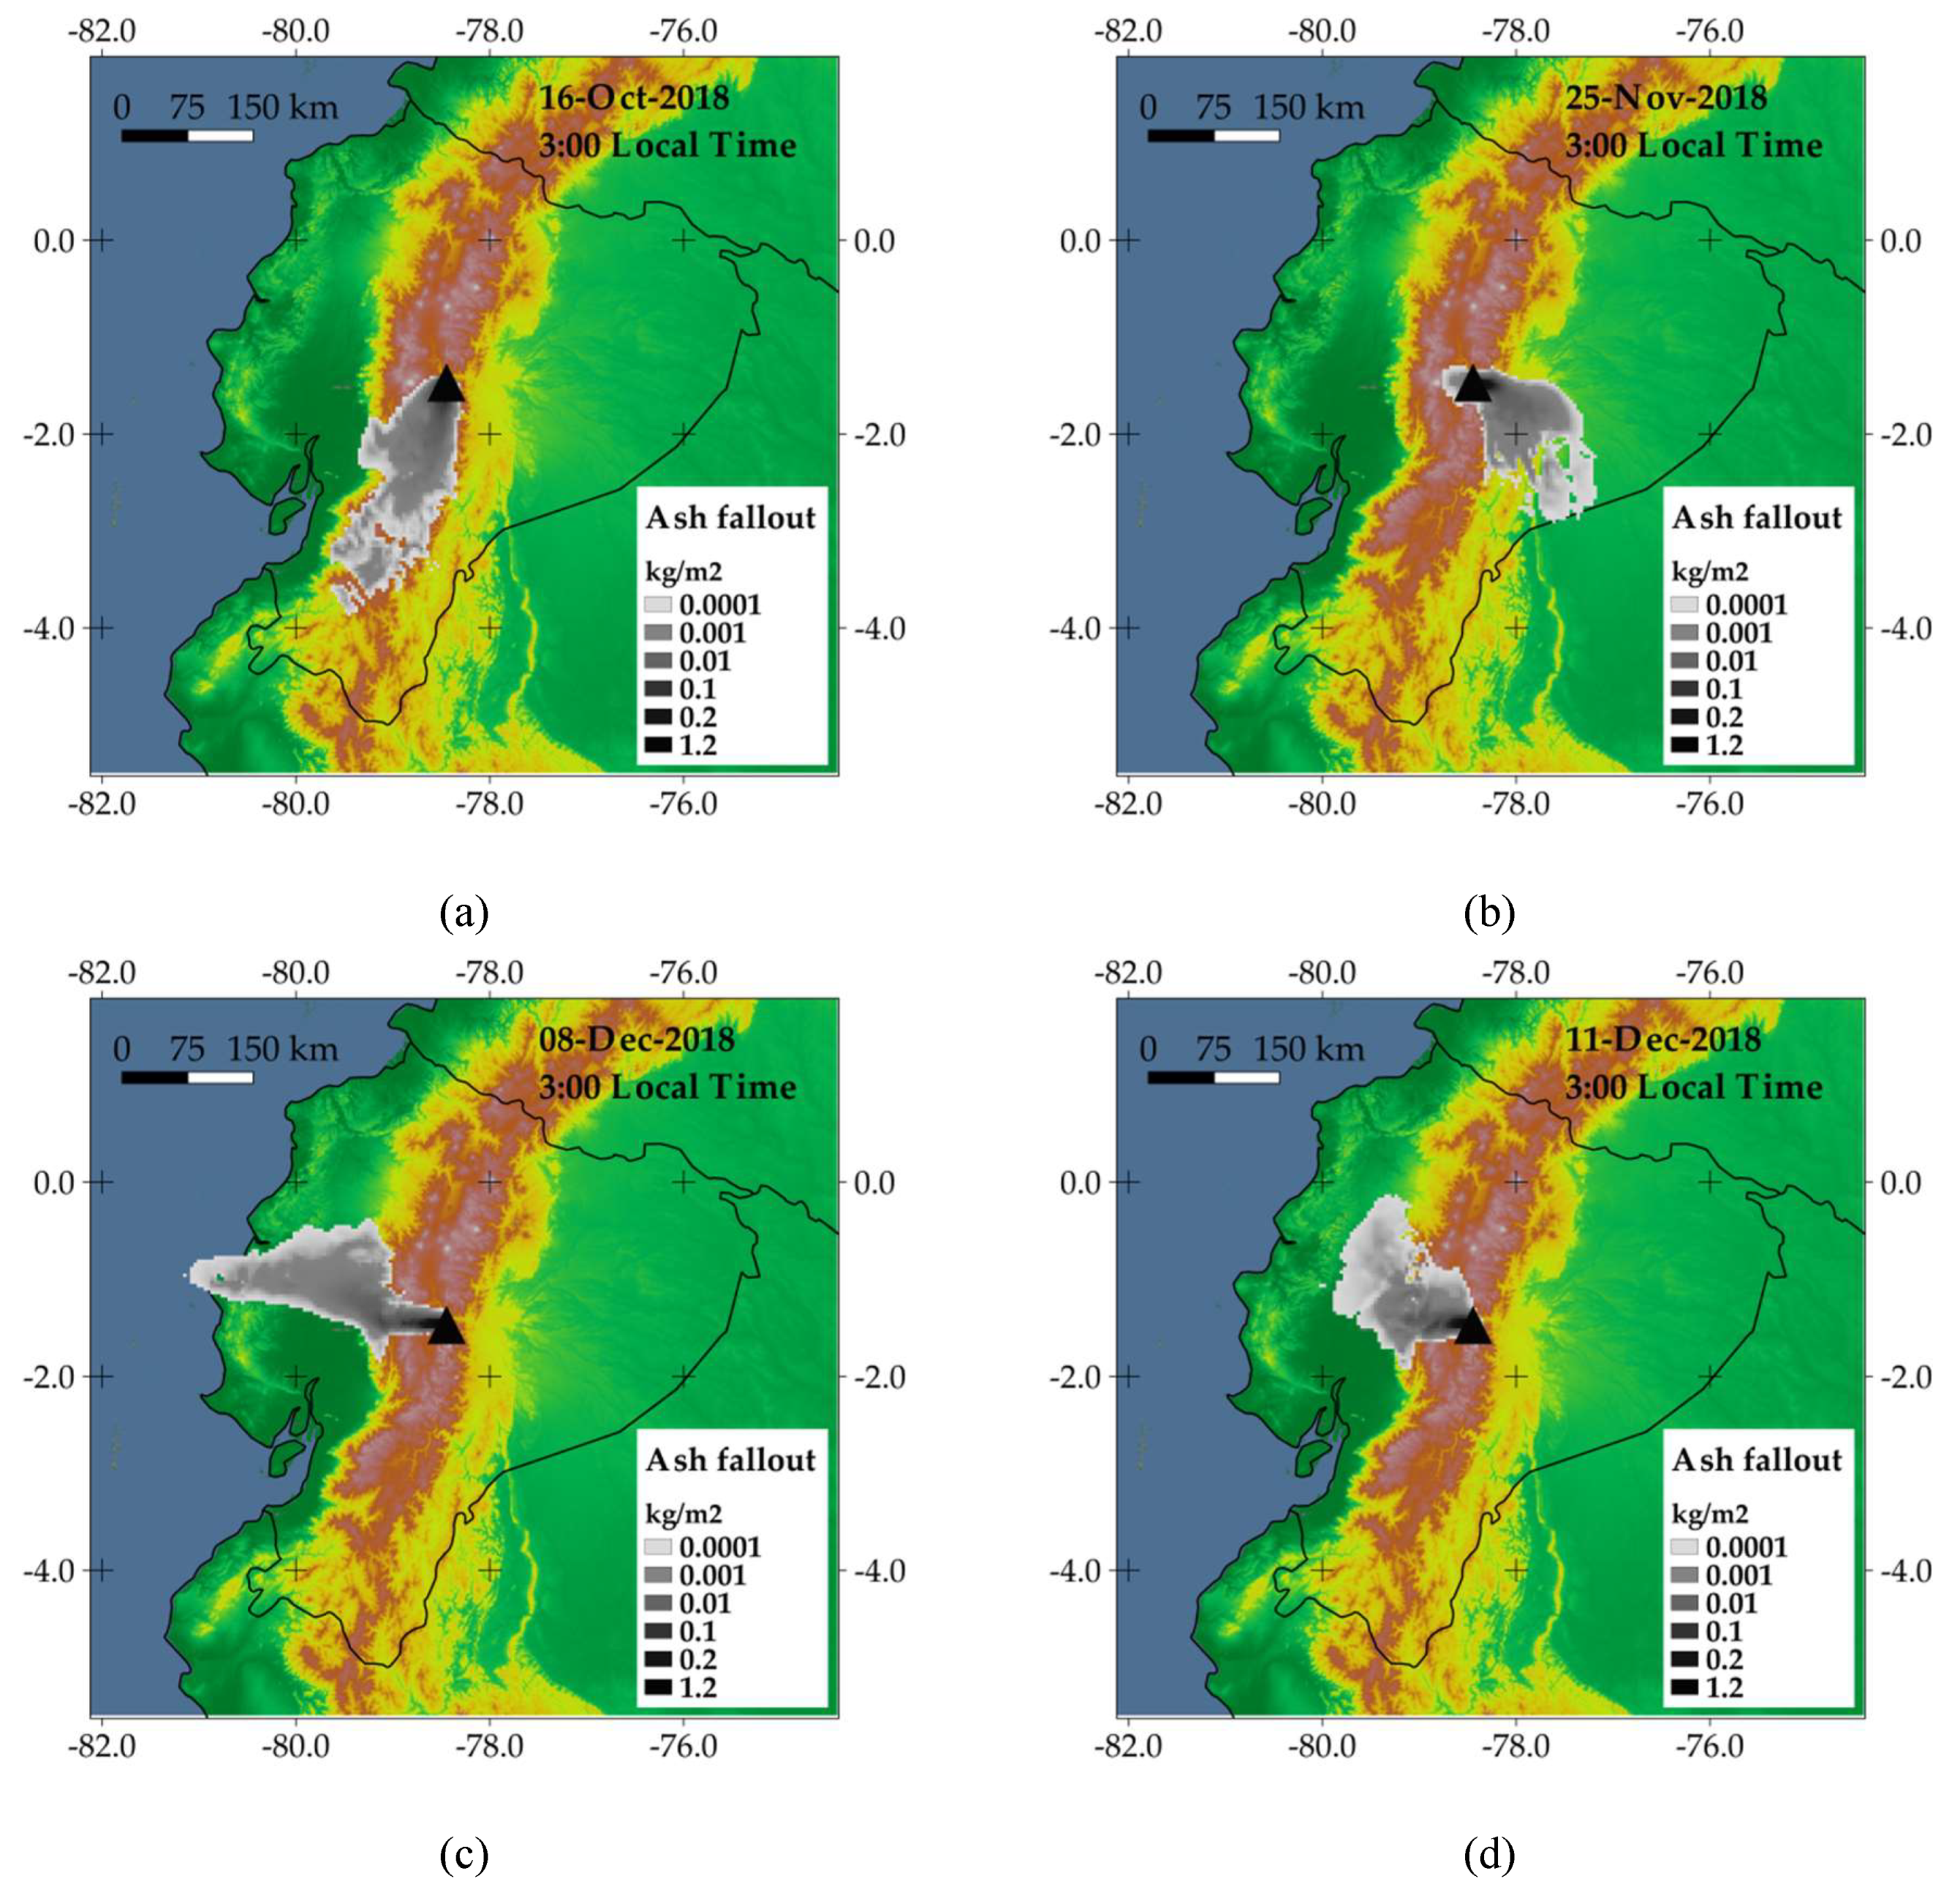
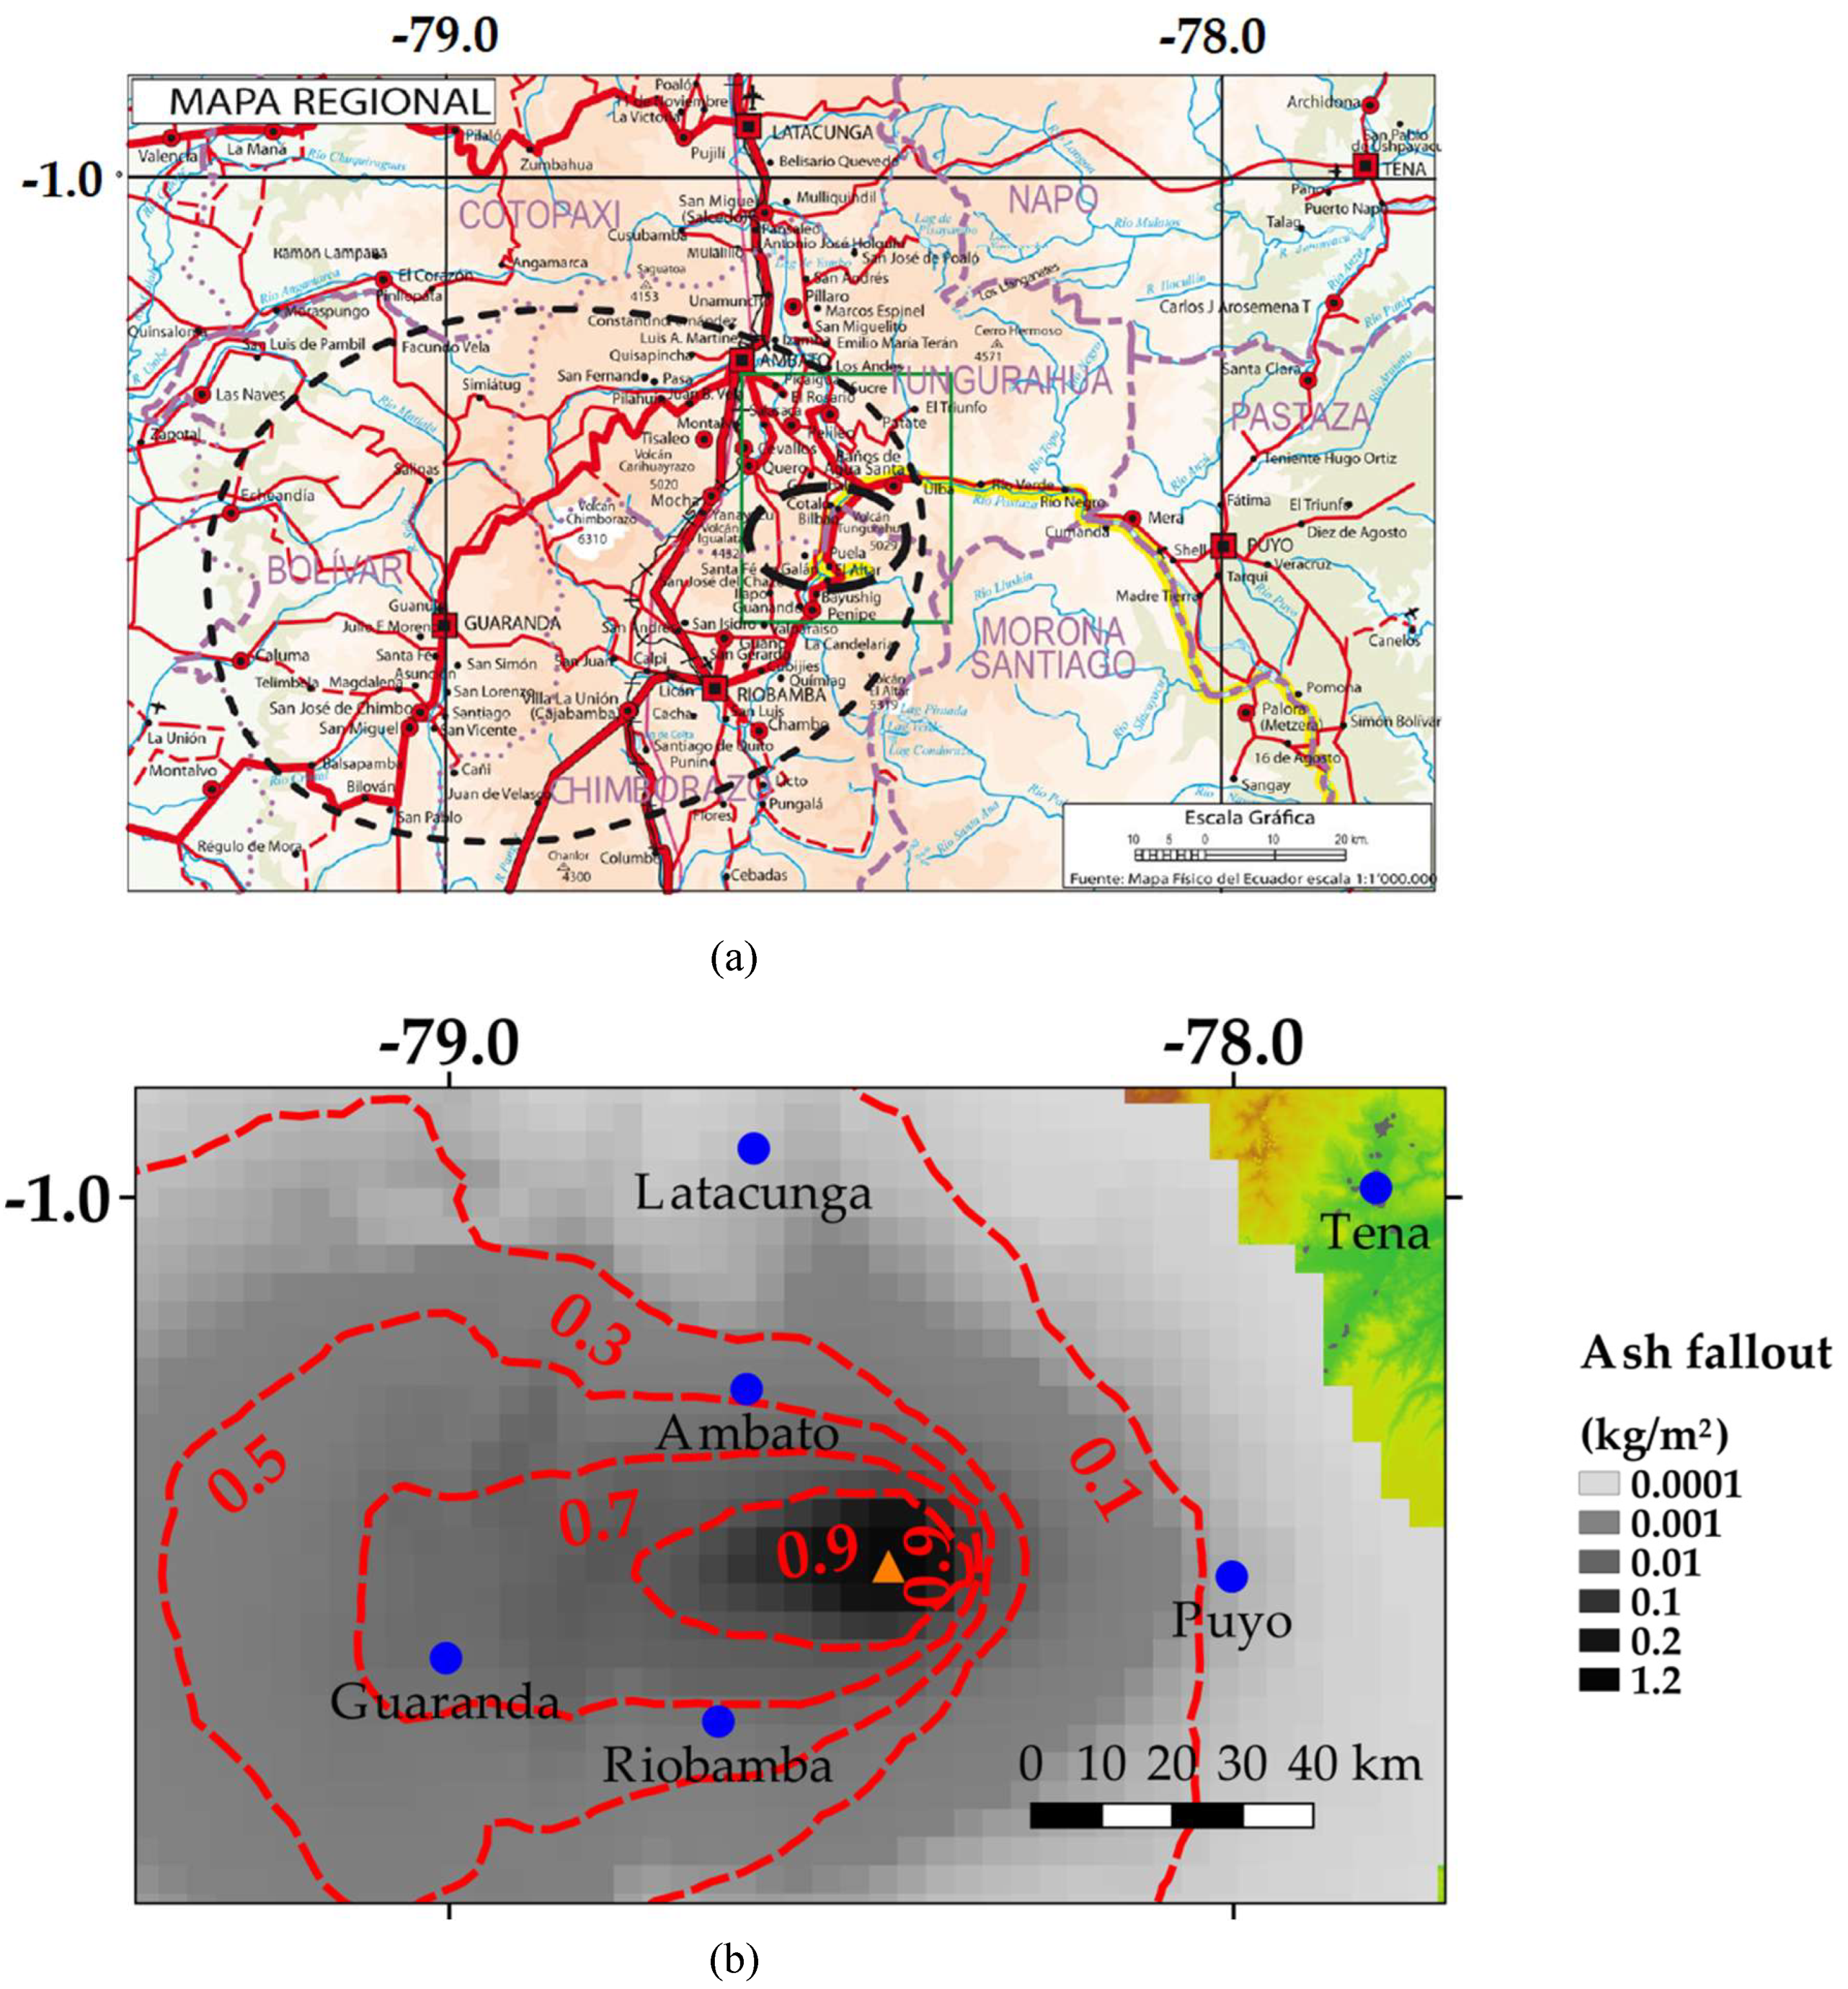
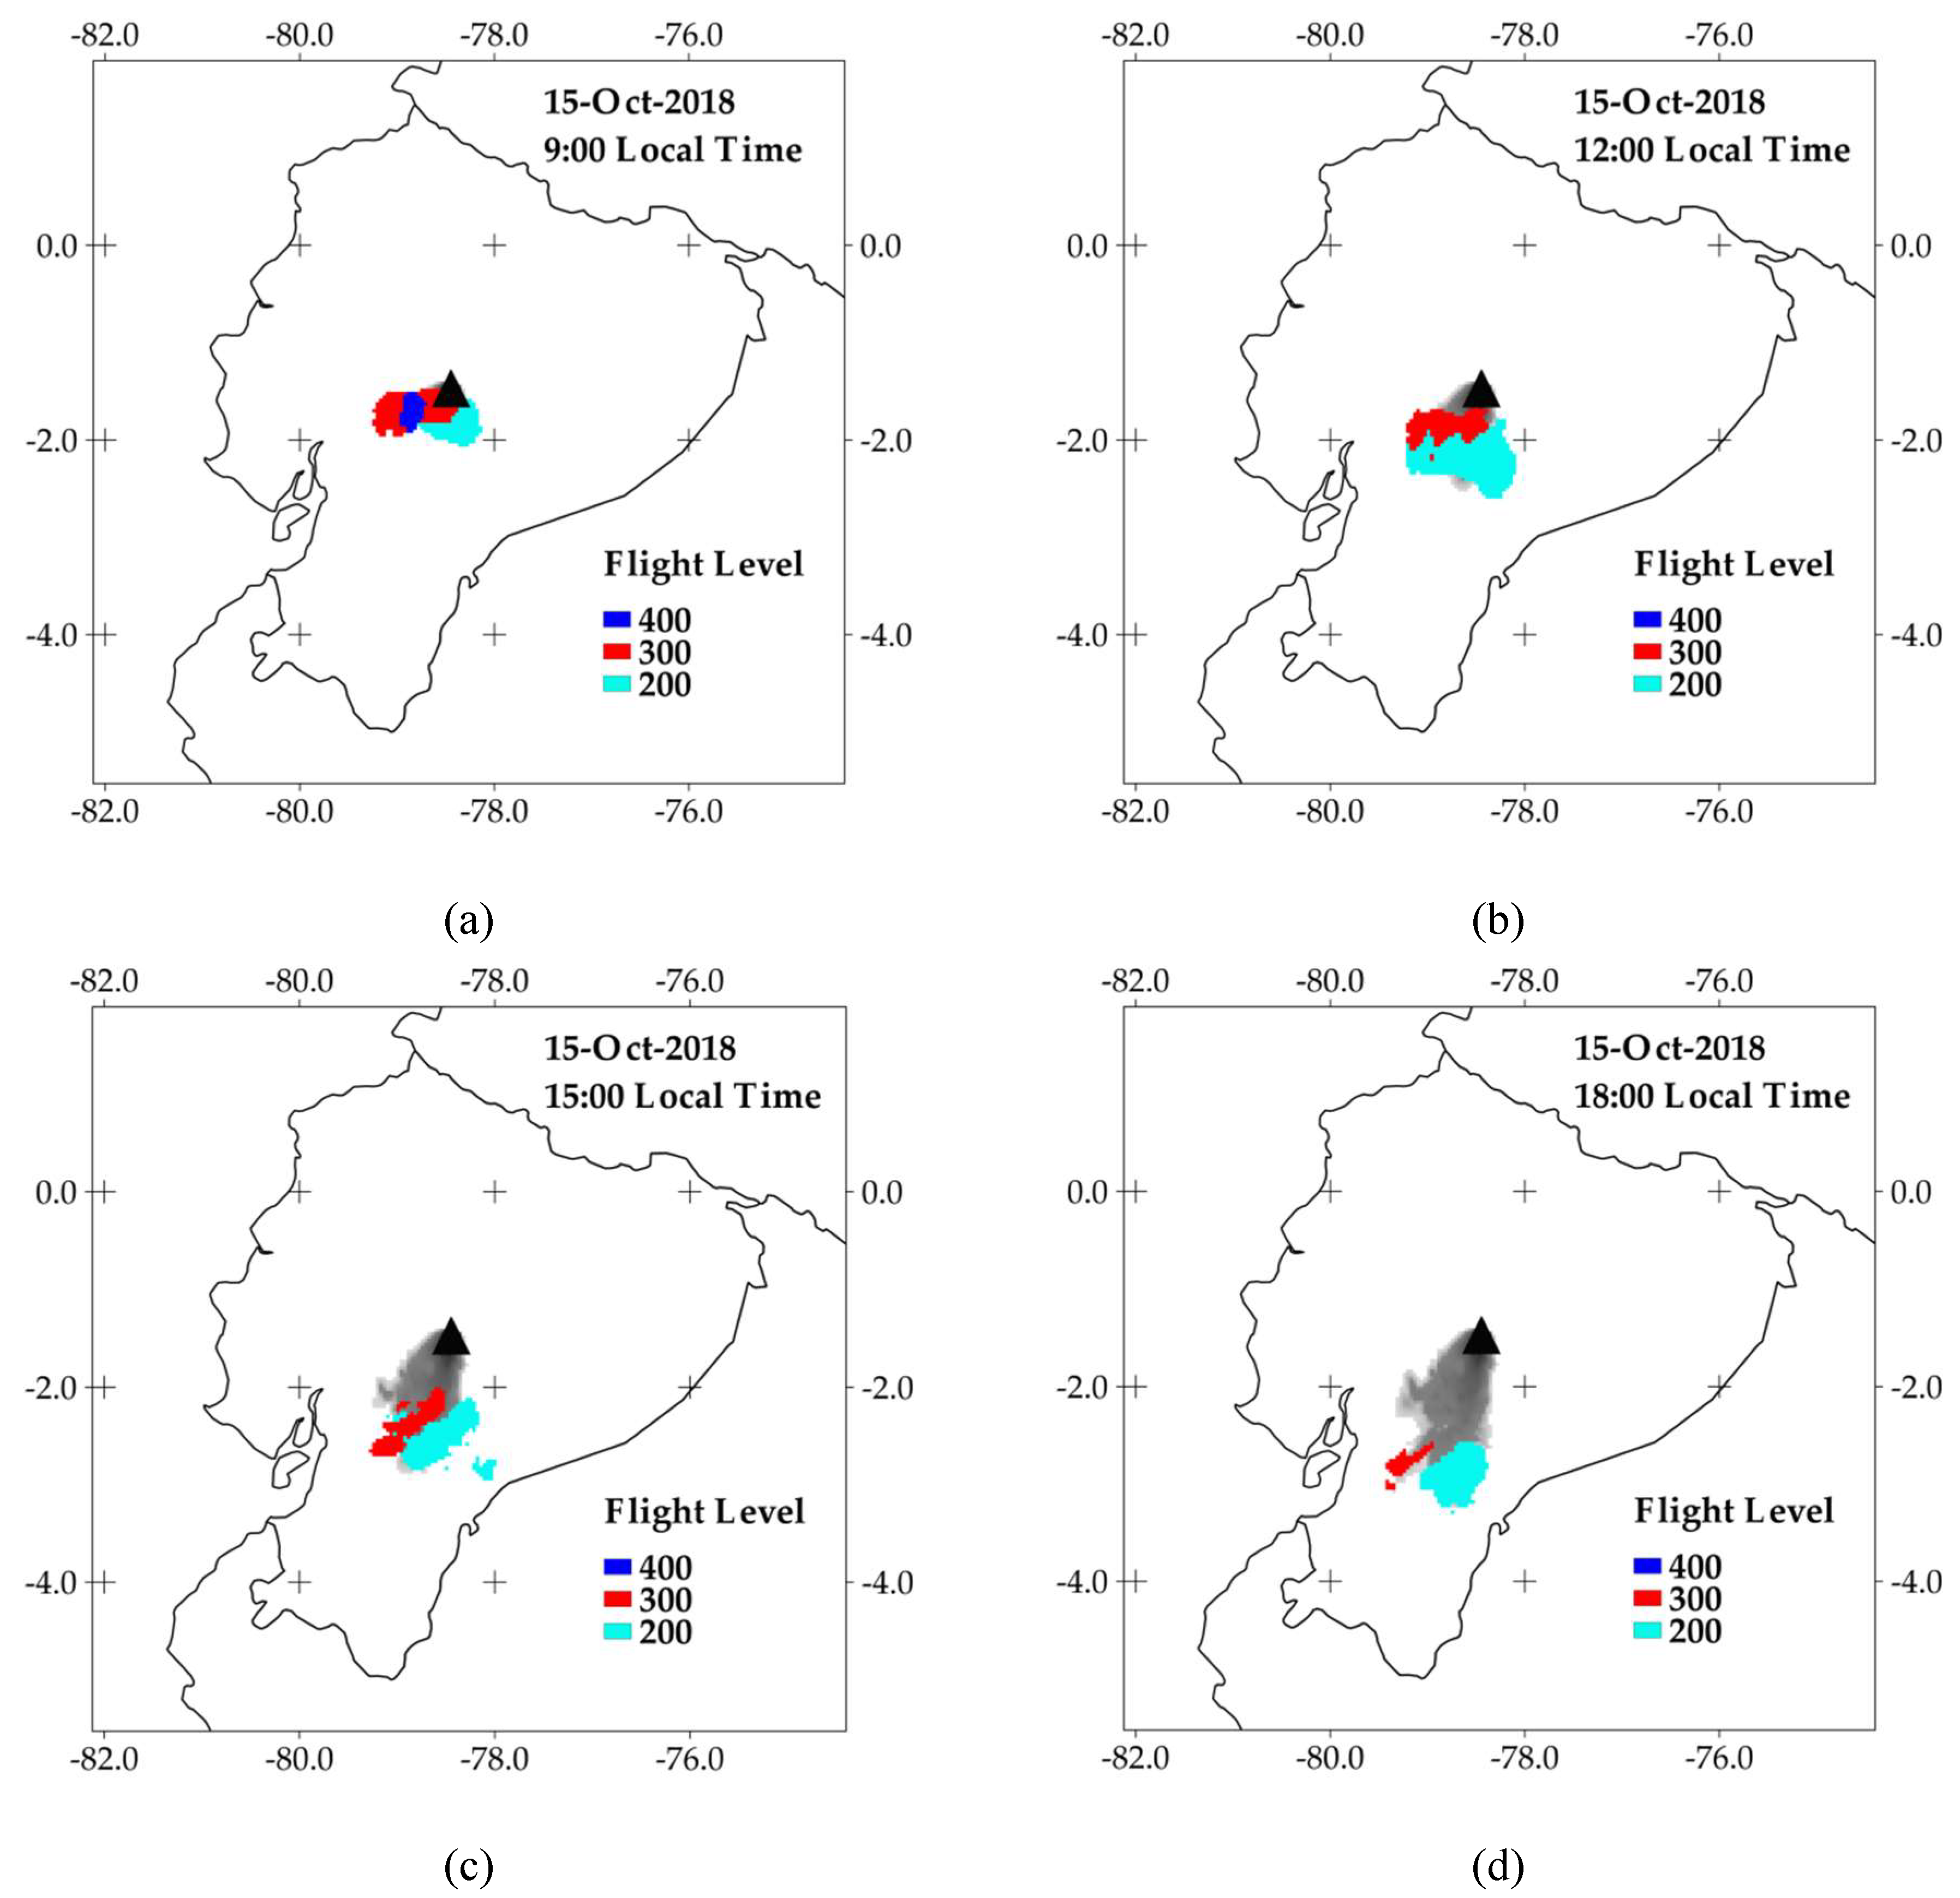
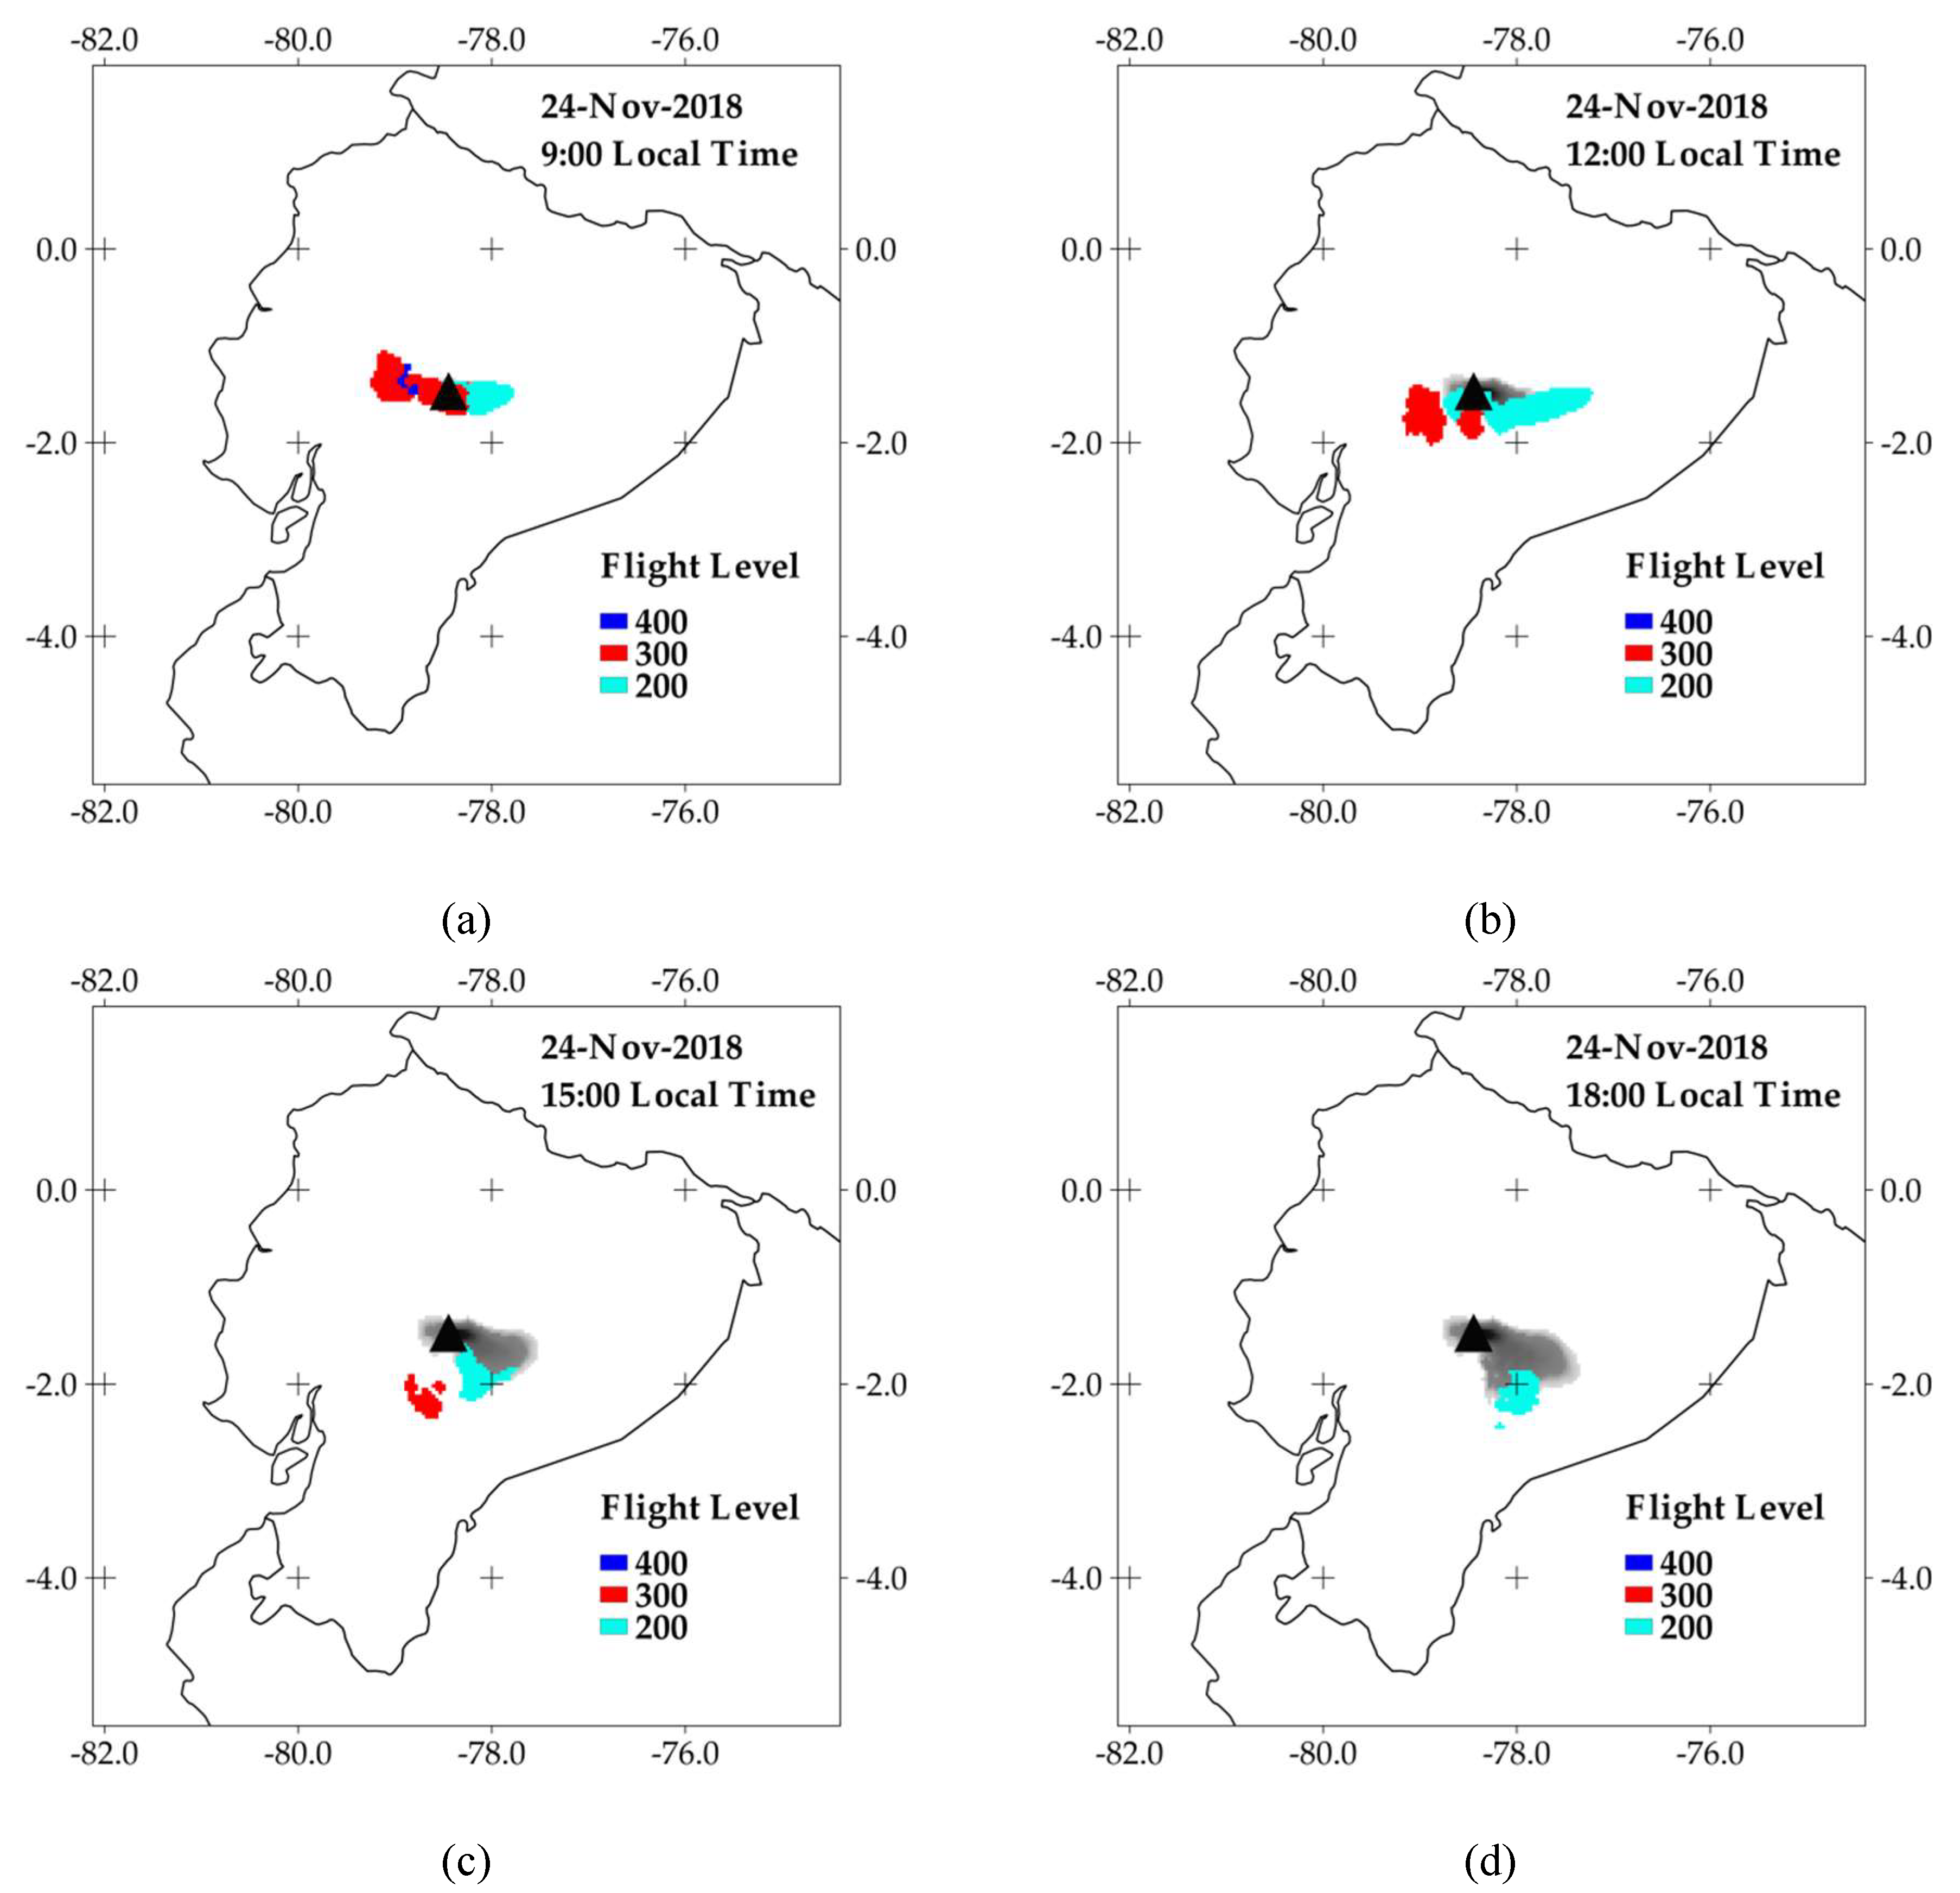
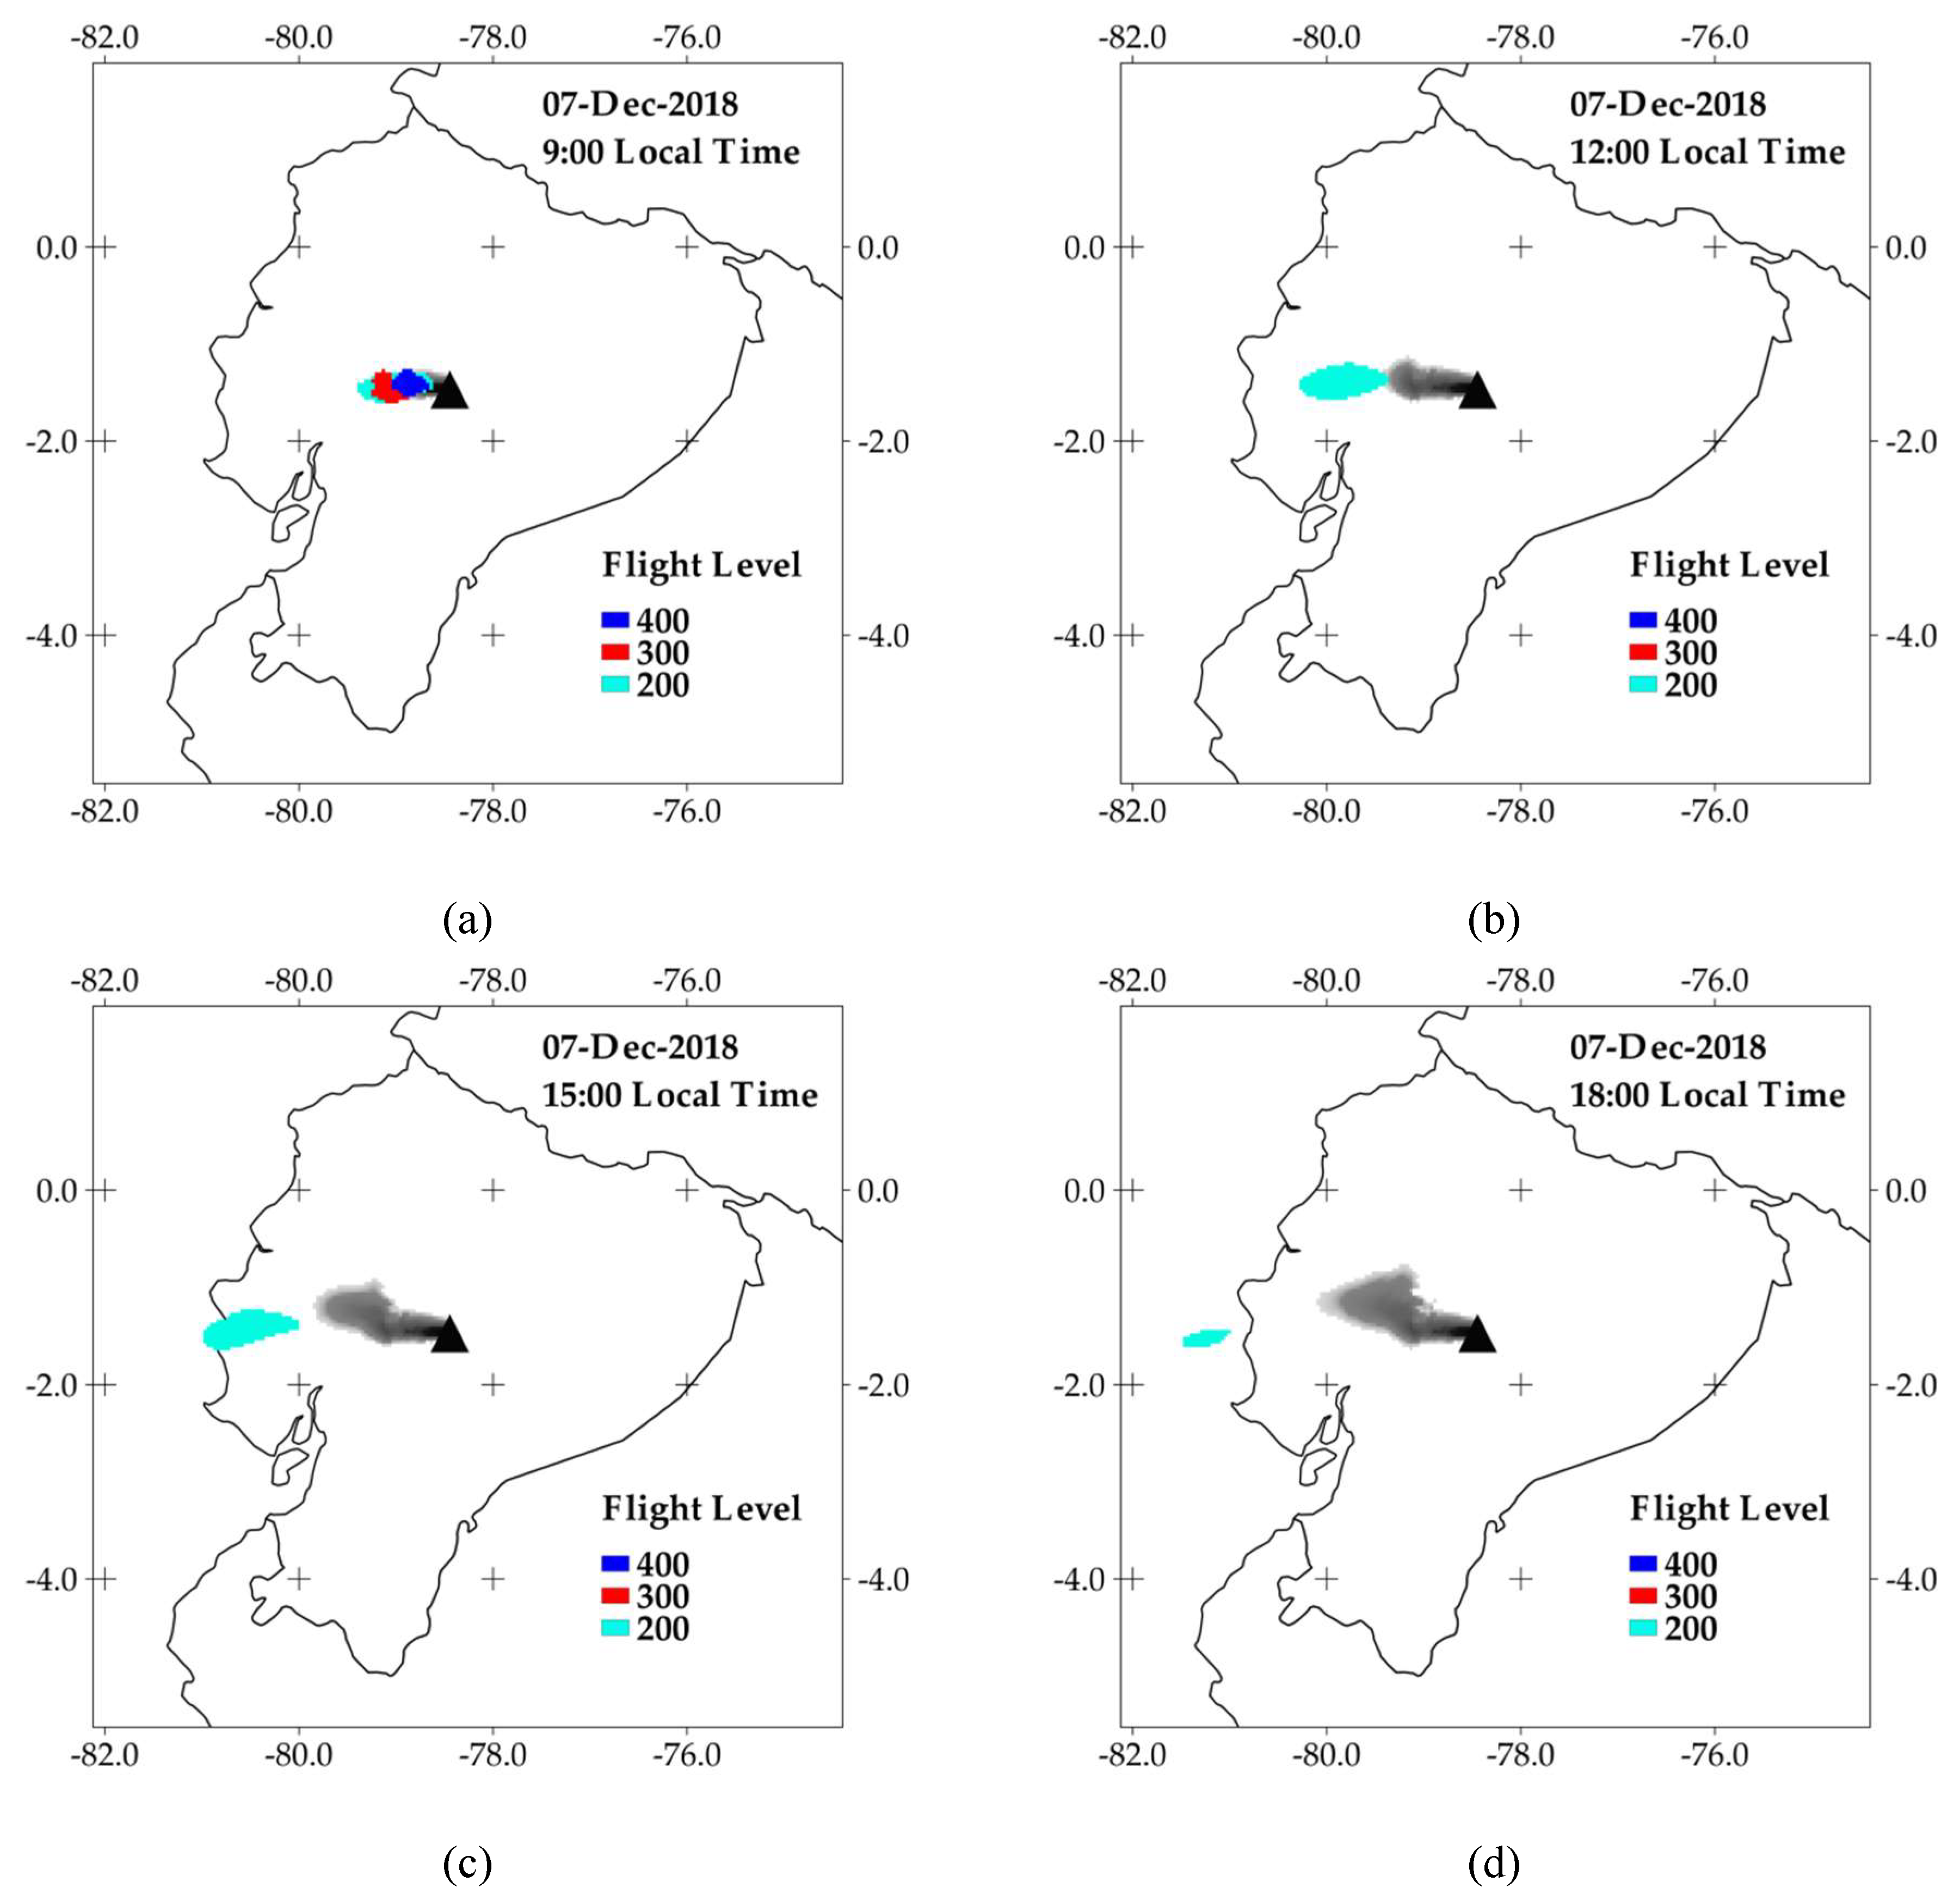
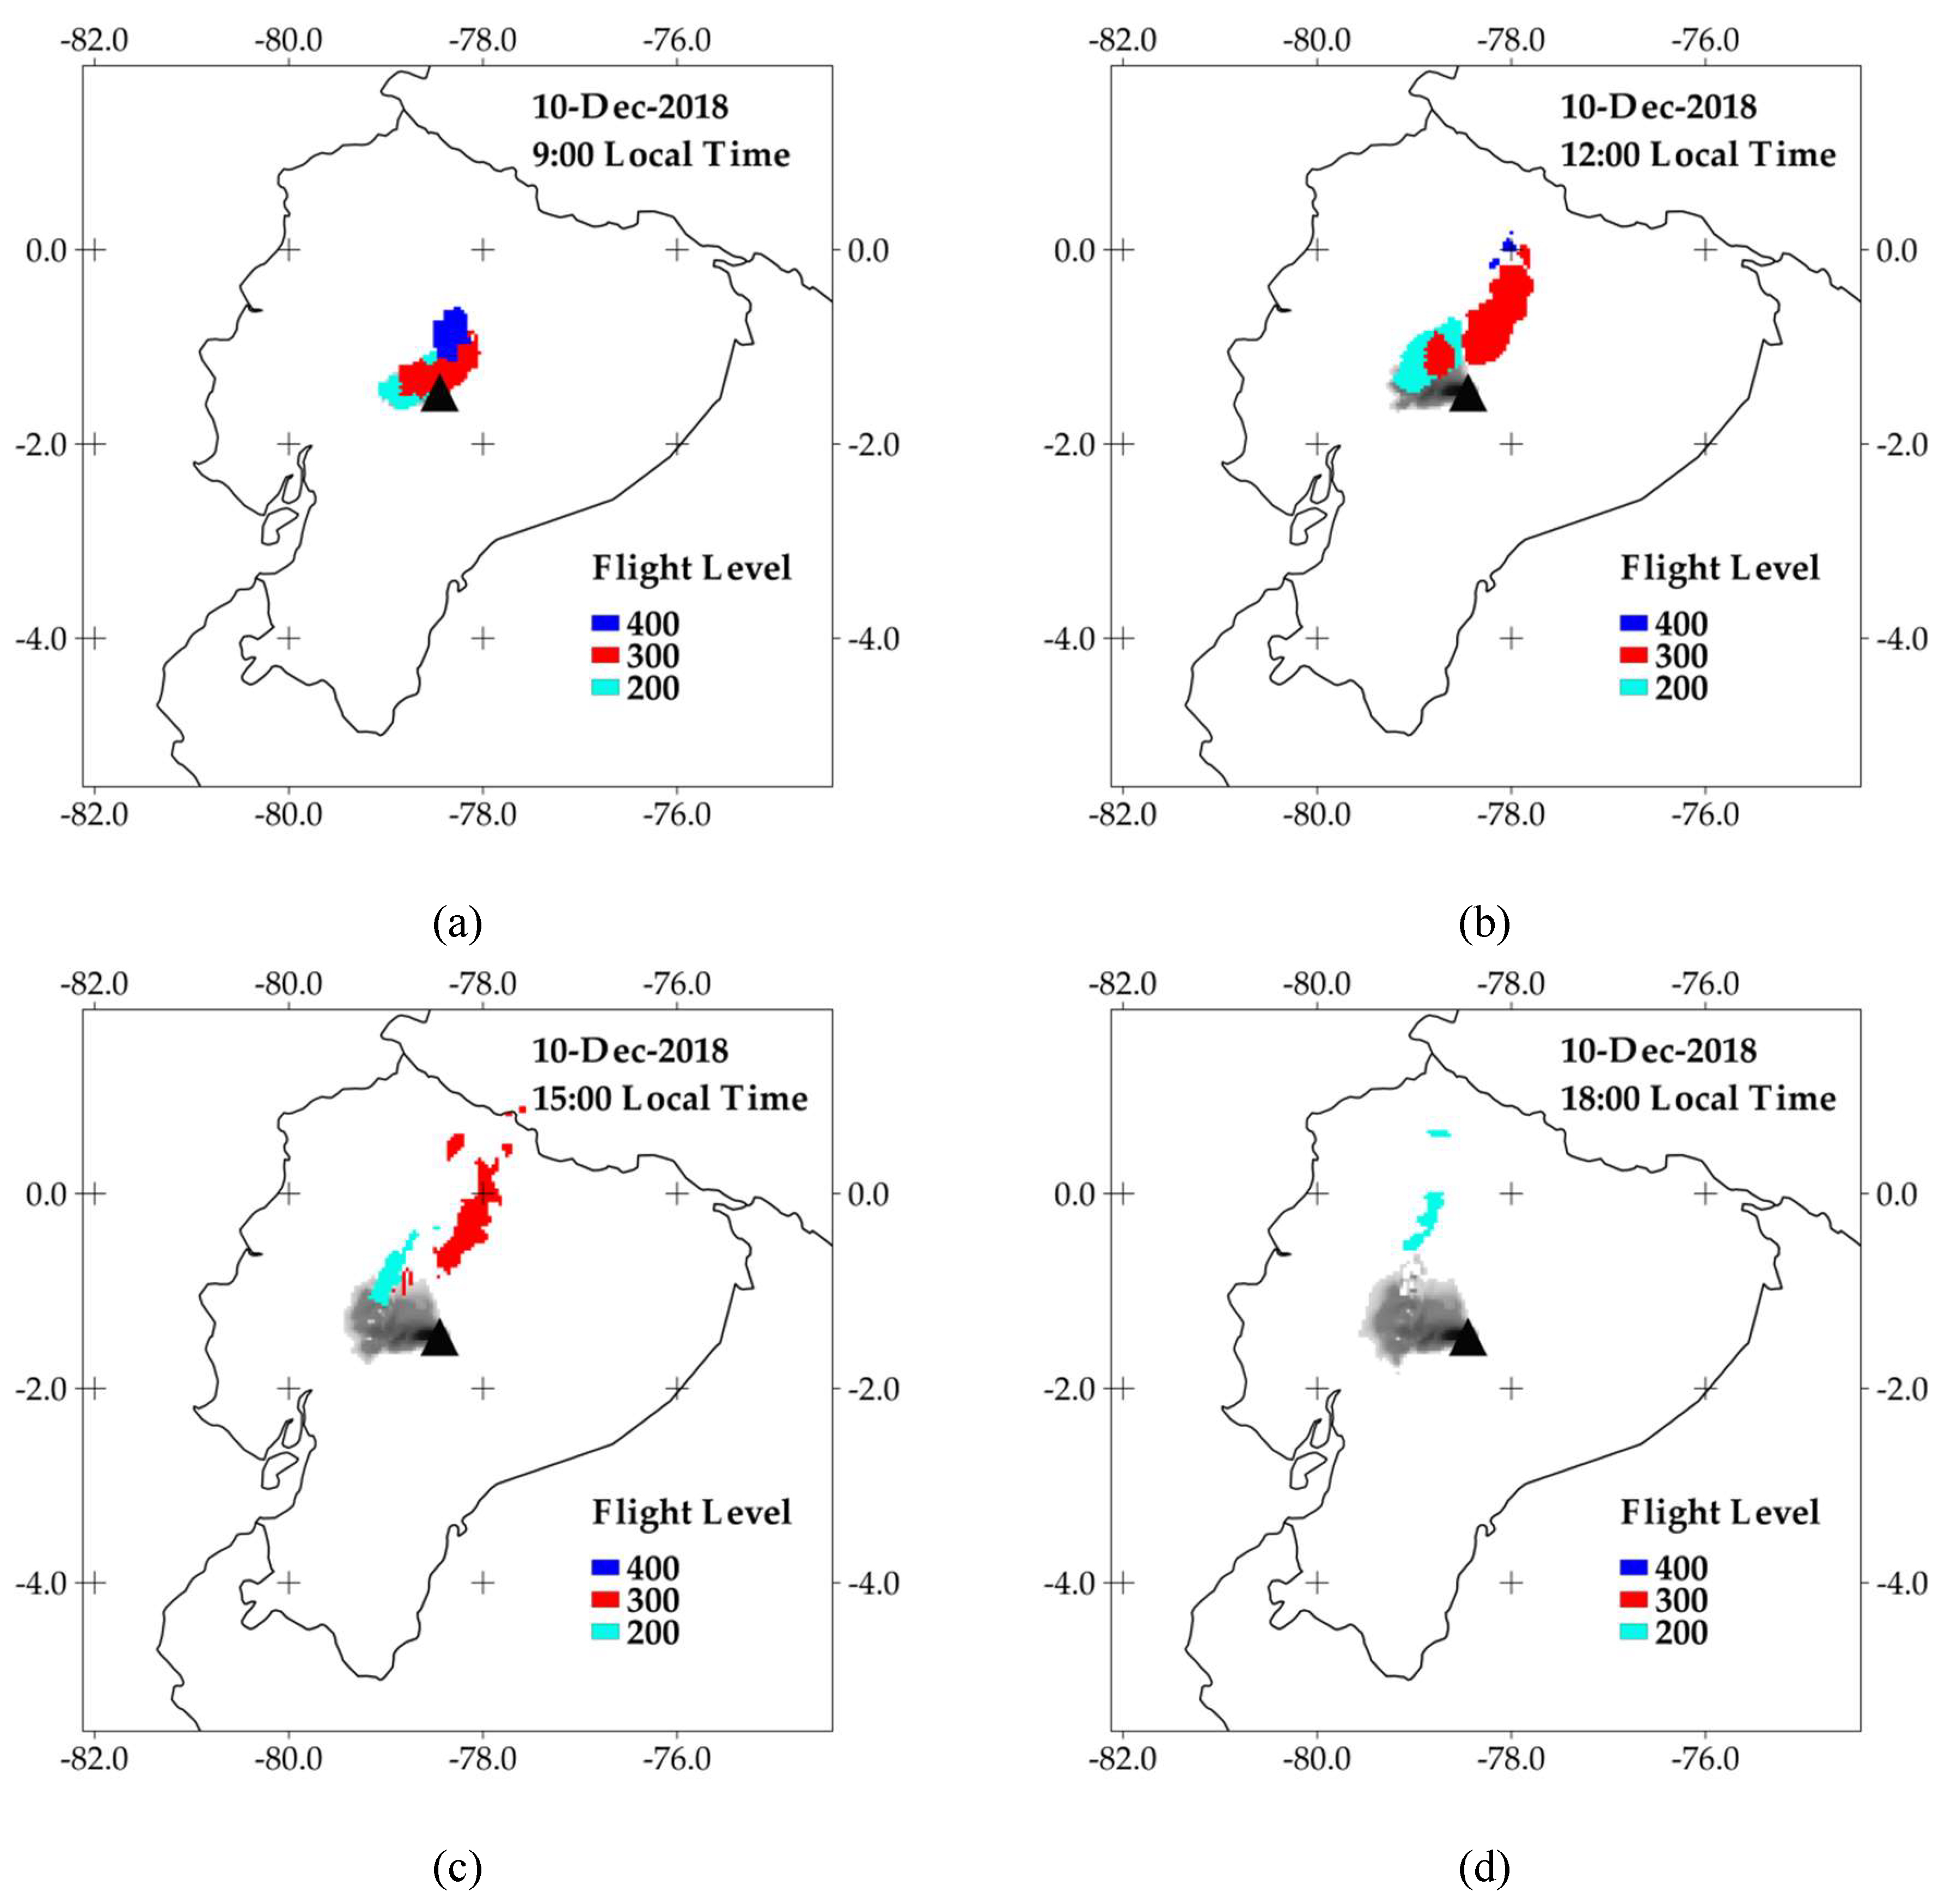
Figure 2 shows the ash fallout maps for 15 October 2018, 24 November 2018, 07 December 2018, and 10 December 2018; days selected from the historical forecasting data. The corresponding ash clouds at 9:00, 12:00, 15:00, and 18:00 of these simulations, are given in
Appendix A.
For 15 October 2018, ash clouds and areas affected by ash fallout were forecasted mainly towards the south. For 24 November 2018, ash fallout was forecasted towards the SE, although the ash cloud at FL300 moved in different directions. For 07 December 2018, ash fallout and ash clouds were forecasted towards the west. For 10 December 2018, the forecasted ash fallout was towards NE, although the FL300 and FL400 ash clouds moved north of the vent.
Based on satellite imagery from September 1999 to September 2014, Toulkeridis and Zach (2016) [
28] reported, for the period April to September, a uniform east to west direction of ash clouds emitted by the Tungurahua, Reventador, Sangay, Pichincha, and Cotopaxi volcanoes. For the other months, movement of the ash clouds varied slightly from this direction.
Although the east to west direction has been reported as the main direction of ash clouds,
Figure 2 and the figures in
Appendix A highlight that the ash fallout can affect areas located in diverse directions from the vent, and even that ash clouds at different FLs can move in different directions, compared to wind near the surface (which is directly linked to ash fallout).
Our historical forecasting dataset and the information about detected ash clouds by the Washington VAAC allowed us to explore the following topics:
The variation of the isomass and probability maps of ash fallout due to Vulcanian eruptions at Tungurahua volcano;
The relationship between ash fallout patterns with ash cloud direction at different FLs.
2. Method
2.1. Isomass and Probability Maps of Ash Fallout
From the historical dataset produced by our forecasting system, we extracted ash fallout results from four years (April 2015 to March 2019, one NetCDF file per day). We set FALL3D to generate results for the following 24 h after the beginning of the eruption (7:00 LT), which is a convenient period to reach defined quantities of ash fallout over the country. The field storing the computed ash fallout quantities accumulated the amount of settled ash over the previous hours. Therefore, we extracted the results of this variable at the end of the simulations. These quantities were organized and processed, in order to generate the isomass and probability maps of ash fallout, classifying the results for three-month periods: February–March–April (FMA), May–June–July (MJJ), August–September–October (ASO), and November–December–January (NDJ). These trimesters were centered on March and September, which are the months where solar radiation reaches the region of Ecuador directly [
29], influencing the seasonal variations of atmospheric parameters (e.g., rainfall) [
30,
31].
To generate the isomass maps, we obtained the average values of ash fallout for each cell of Sub-domain 2 (199 × 199 cells, 4 km;
Figure 1). Probability per cell was obtained as the ratio between the number of days with ash fallout higher than 0.0001 kg m
−2 to the total number of forecasted days. From April 2015 to March 2019, there were 1332 days with forecasting, covering 91.1% of the total number of days.
2.2. Wind Direction at Tungurahua Volcano
We collected the information of ash clouds detected since 2013 by the Washington VAAC (2020) [
24] at Tungurahua volcano. The wind direction of each ash cloud was obtained through the following procedure:
The shape was mapped into a GIS system, using the coordinates of corners of the polygon representing the shape of the detected ash cloud.
The centroid of each ash cloud was obtained using GIS tools.
Wind direction at corresponding FLs was deduced from the coordinates of centroids and coordinates of the vent.
From the reported wind speed and direction of ash clouds, we generated wind roses for three ranges of FLs, classified in the same trimesters of isomass and probability maps of ash fallout.
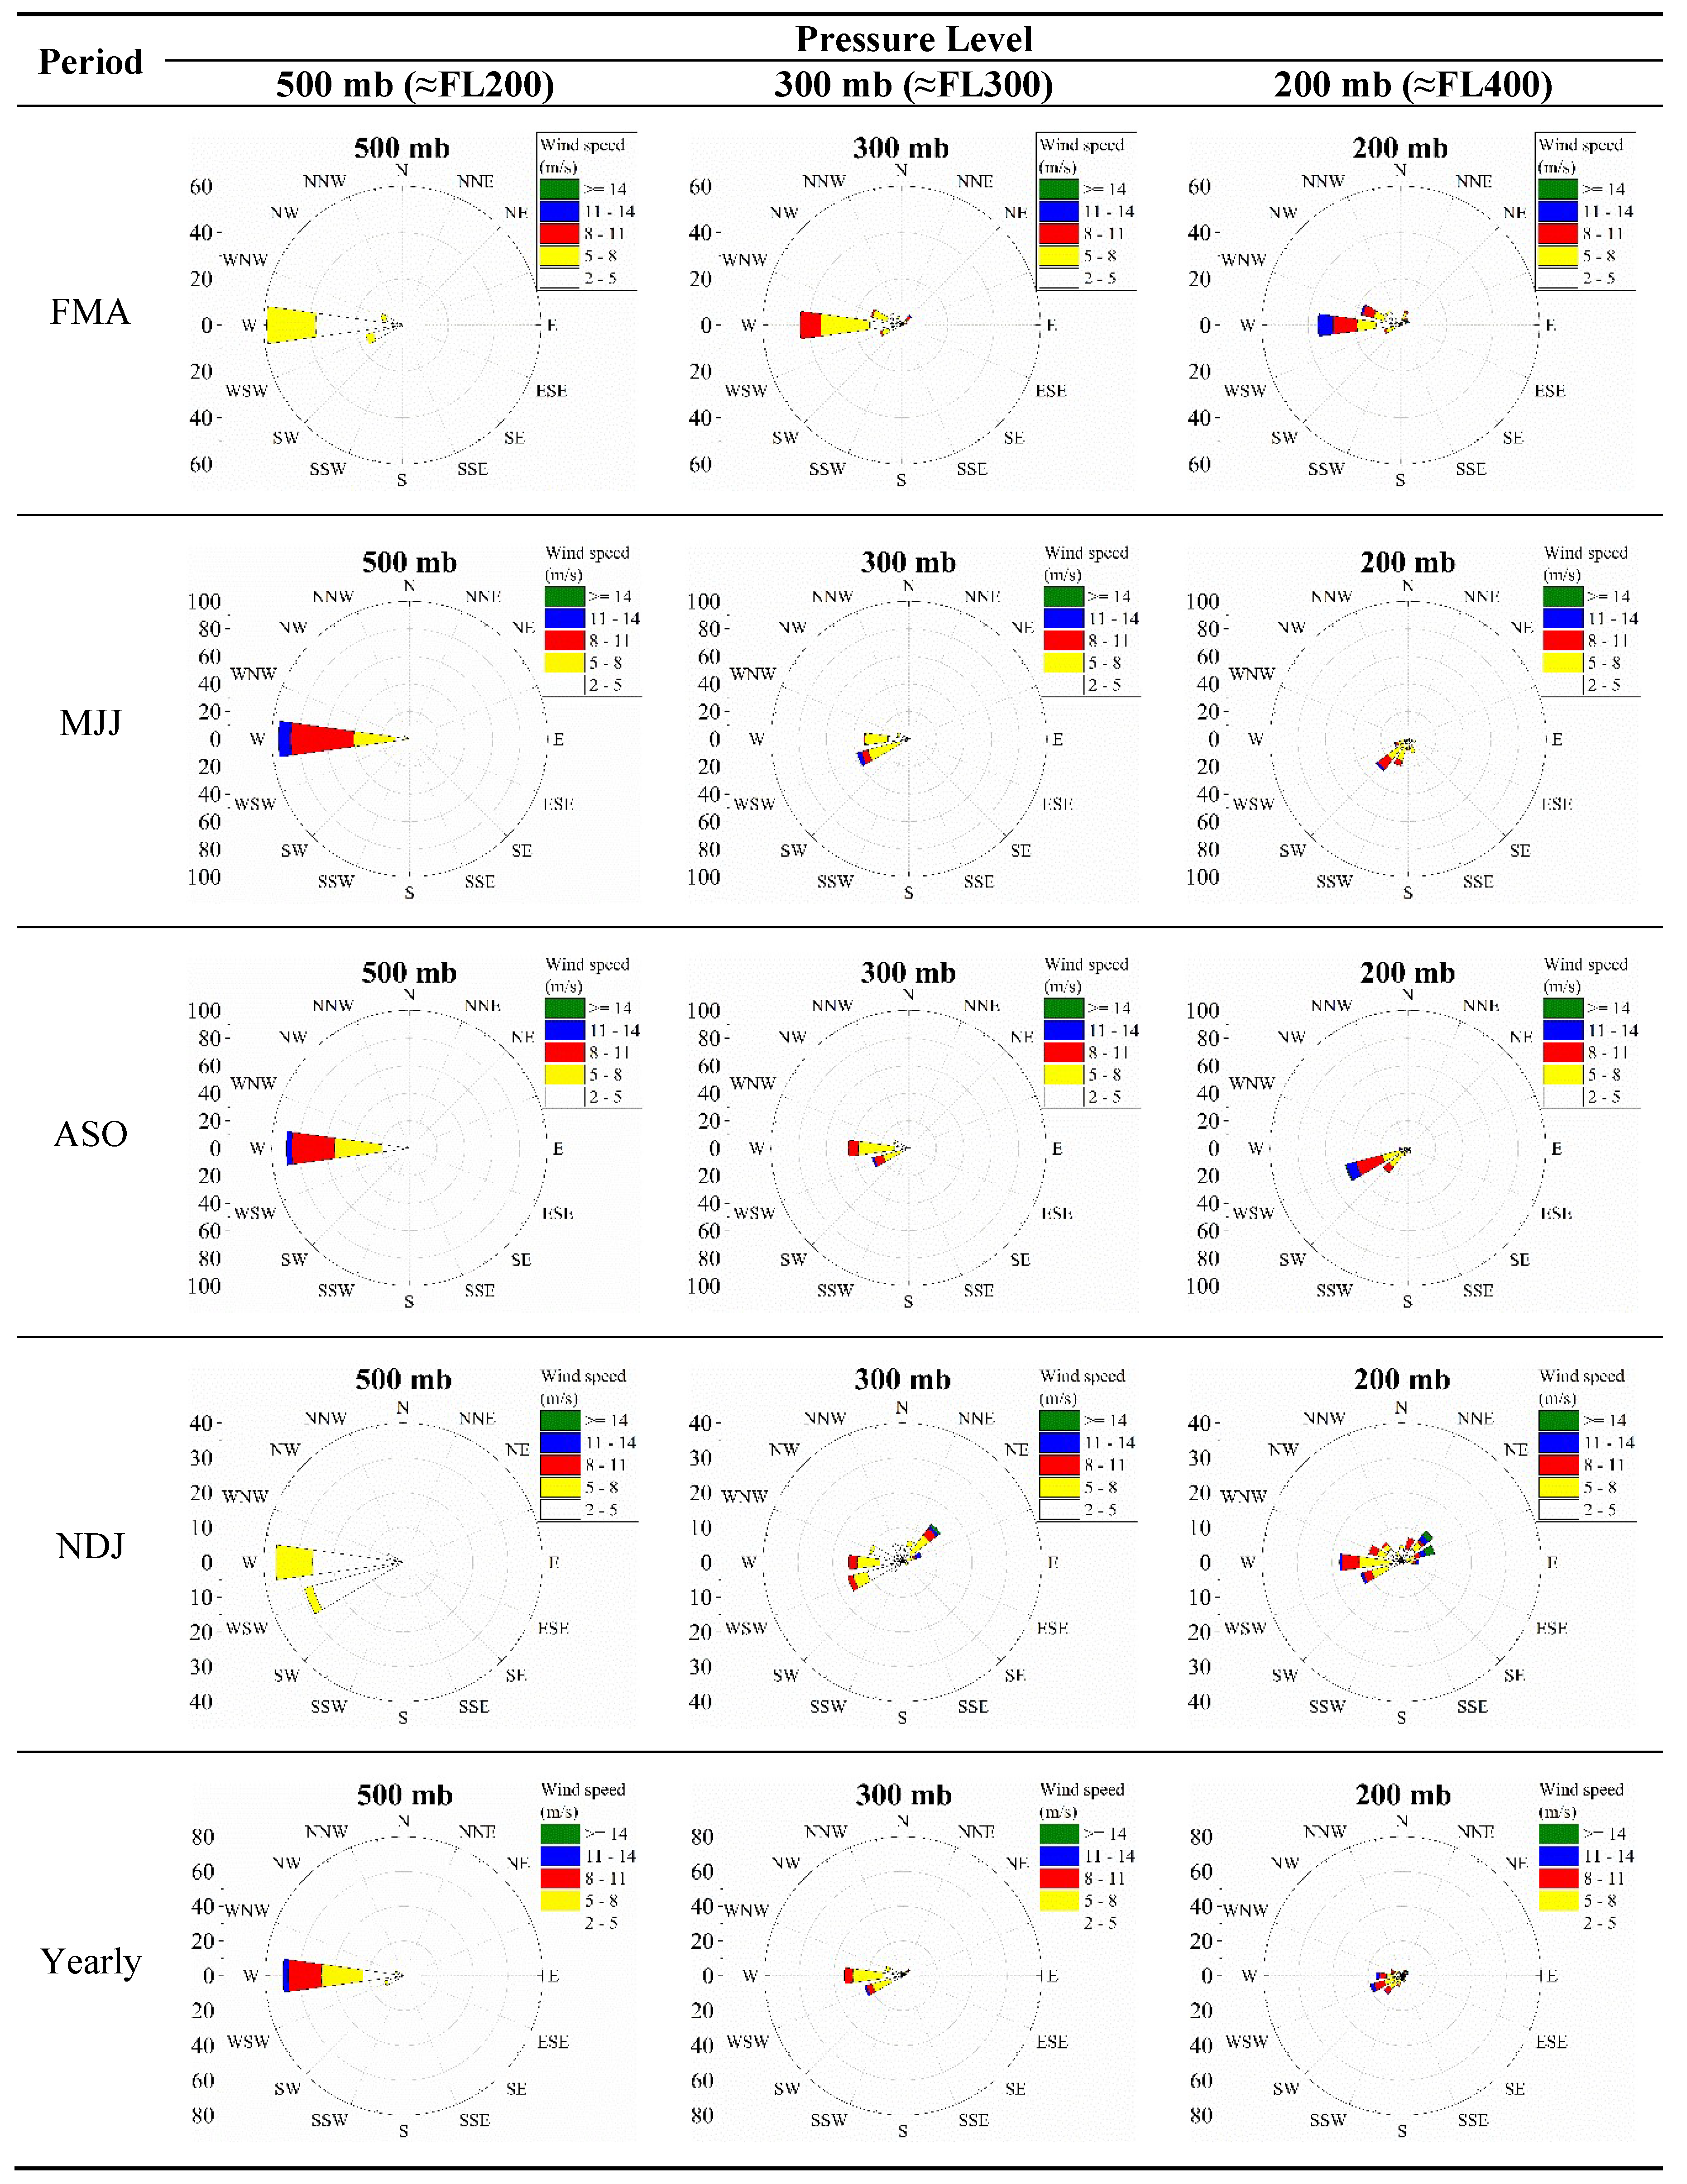
Furthermore, we also collected the ERA5 average monthly mean horizontal components (u, v) of wind at levels of 500 mb (≈FL200), 300 mb (≈FL300), and 200 mb (≈FL400) at the location of Tungurahua volcano, from 1979 to 2019 (i.e., 41 years). ERA5 is the fifth-generation reanalysis for global climate and weather [
32], provided by the European Centre for Medium-Range Weather Forecast (ECMWF). We generated wind roses for each pressure level, classified in the same trimesters of isomass and probability maps of ash fallout.
3. Results
3.1. Isomass and Probability Maps of Ash Fallout
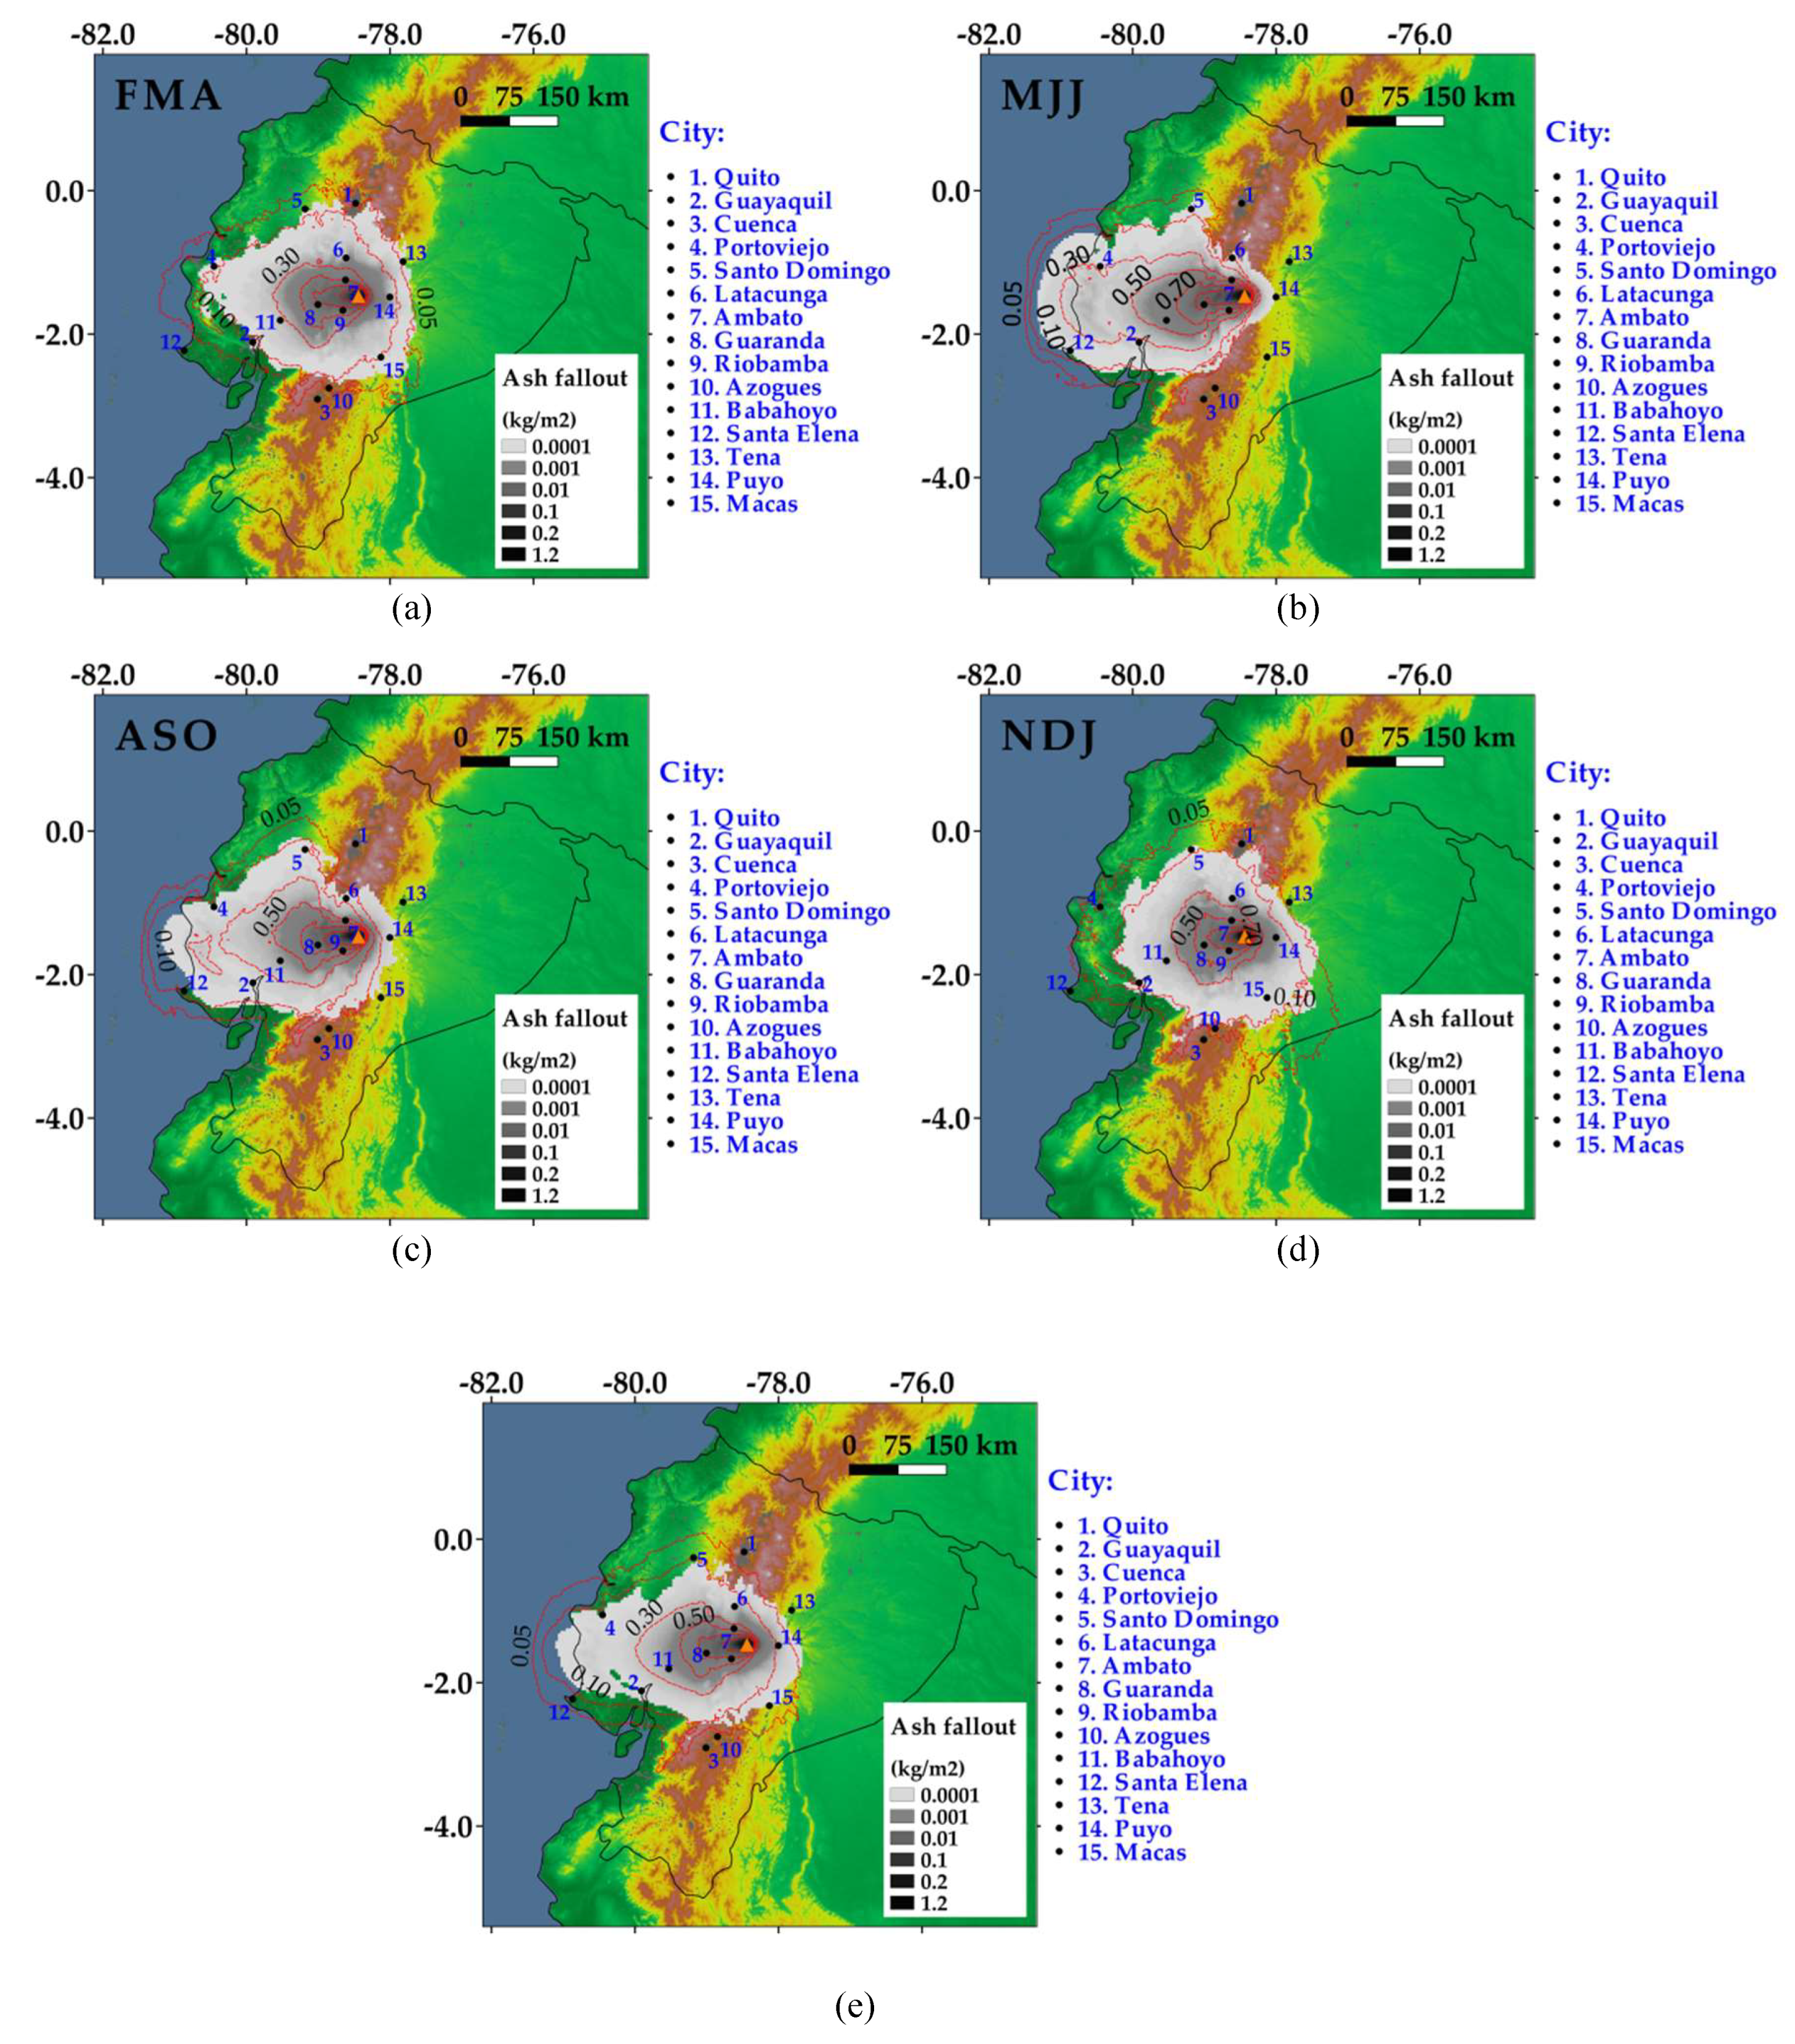
Although west was the main direction of ash fallout during FMA (
Figure 3), it reached regions to the north, south, and even east of the volcano. Westward, probability contours of 10%, 50%, and 70%, appeared at 250, 90, and 67 km, respectively, from the crater (
Table 4). Contours of 10% toward north, south, and east reached 90, 100, and 57 km, respectively.
During MJJ, there was a clear tendency of ash fallout toward the west (
Figure 3). The 10% contour was displaced up to 330 km from the vent, even reaching the sea. Compared to FMA, the 10% contours toward north, south, and east were closer to the crater, at distances of 30, 35, and 21 km, respectively.
Maps from ASO were similar to those of MJJ, showing a clear tendency of ash fallout toward the west. Maps from NDJ, although similar to FMA, showed a slight tendency toward west.
The proximal region west of the volcano (about 100 km to the left) had the highest probability (>70%) to be affected by ash fallout (mean values between 0.01 to 1.2 kg m
−2;
Figure 3). The distant region to the west (100 km, up the coast border) presented low–medium probabilities (10% to 70%) of ash fallout. Most of the Ecuadorian regions to the north, south, and east of the volcano had very low probability (<10%) of being affected by ash fallout.
Considering the capitals of provinces, Guaranda (a city located to the west of the vent) had the highest probability (60%–90%) of being affected by ash fallout due to Vulcanian eruptions at Tungurahua volcano (
Table 5). Riobamba, a city to the SW of the vent, had a probability of 70%. To the NW, Ambato also had a high probability (50%–60%) of being affected by ash fallout.
Among the biggest cities, Guayaquil (SW of the vent) had a low probability (10%–30%) of ash fallout. Quito (≤5%) and Cuenca (<5%), located to the north and SSE, respectively, had very low probabilities of being affected.
Table 6 summarizes the number of days and percentages with ash fallout reported in the cities of
Table 5, due to the seven real Vulcanian eruptions at Tungurahua volcano, which we identified, since 2010 [
9,
10,
12]. These percentages were generated based on the corresponding daily reports by IG-EPN [
9]. Although corresponding to only seven real eruptions, the percentages of
Table 6 were consistent with the probabilities of
Table 5. Both of them indicate that Ambato, Guaranda, and Riobamba are the cities with the highest probabilities and percentages of volcanic ash arriving.
3.2. Wind Direction at Tungurahua Volcano
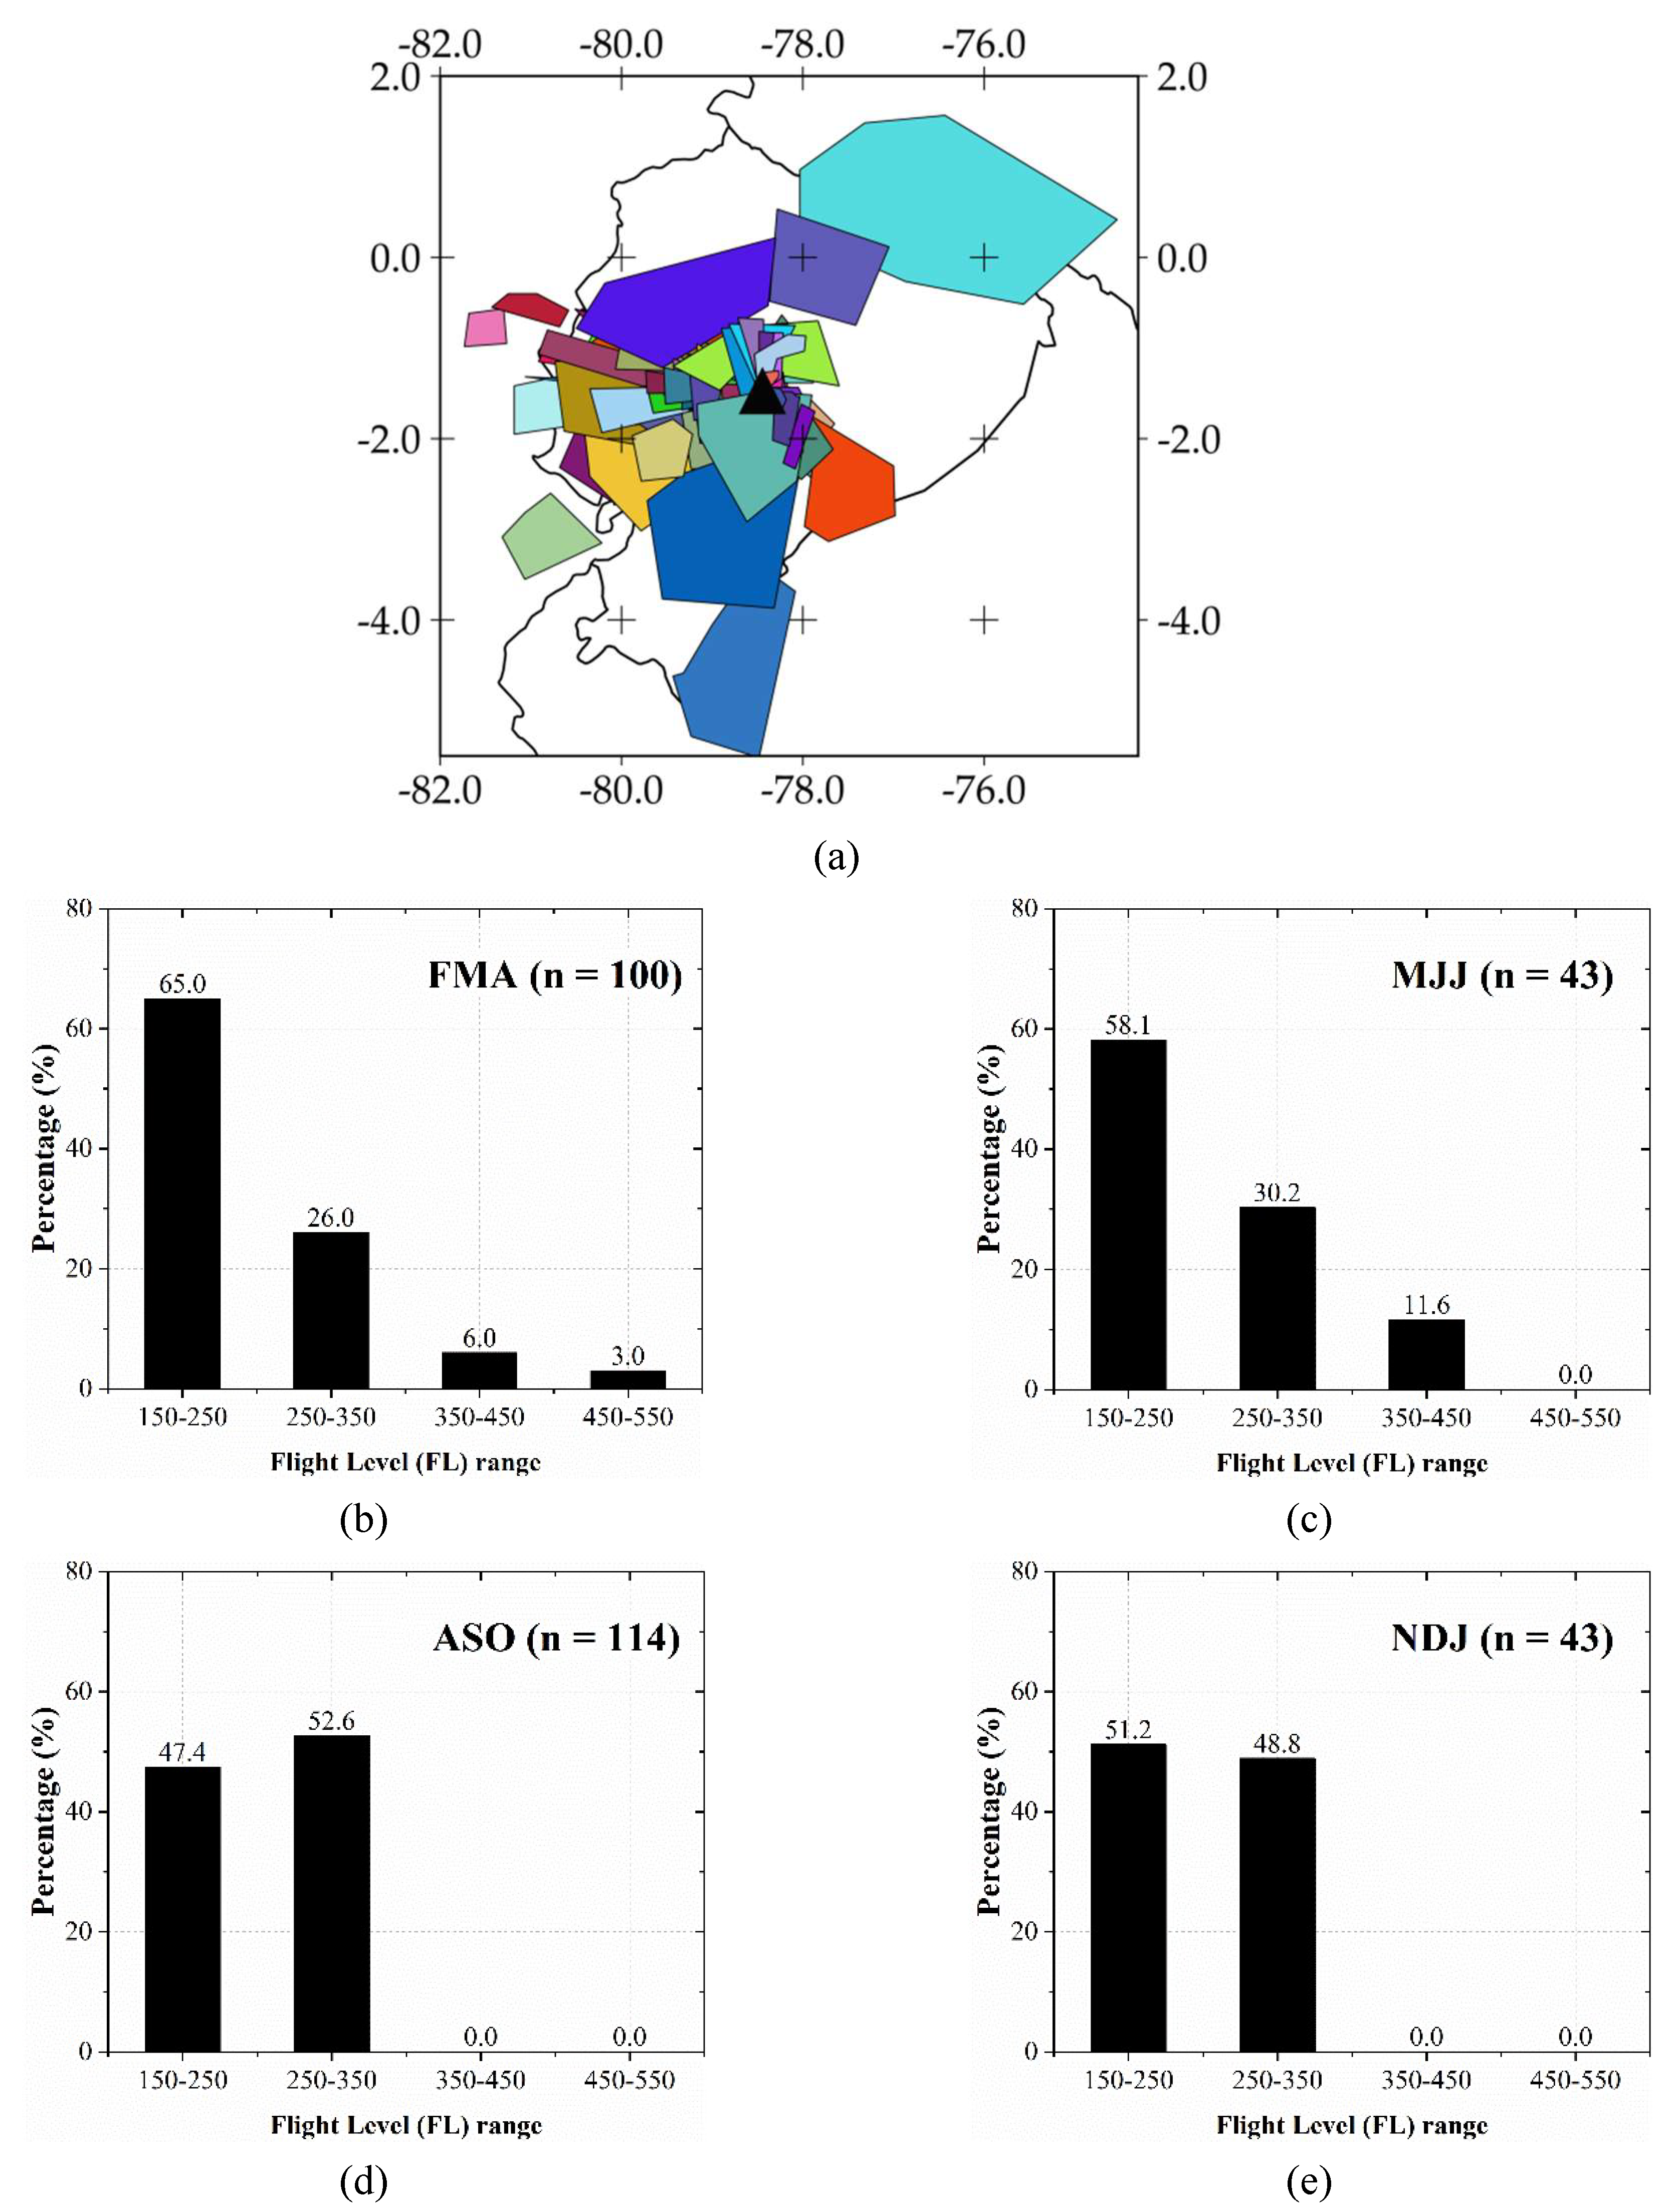
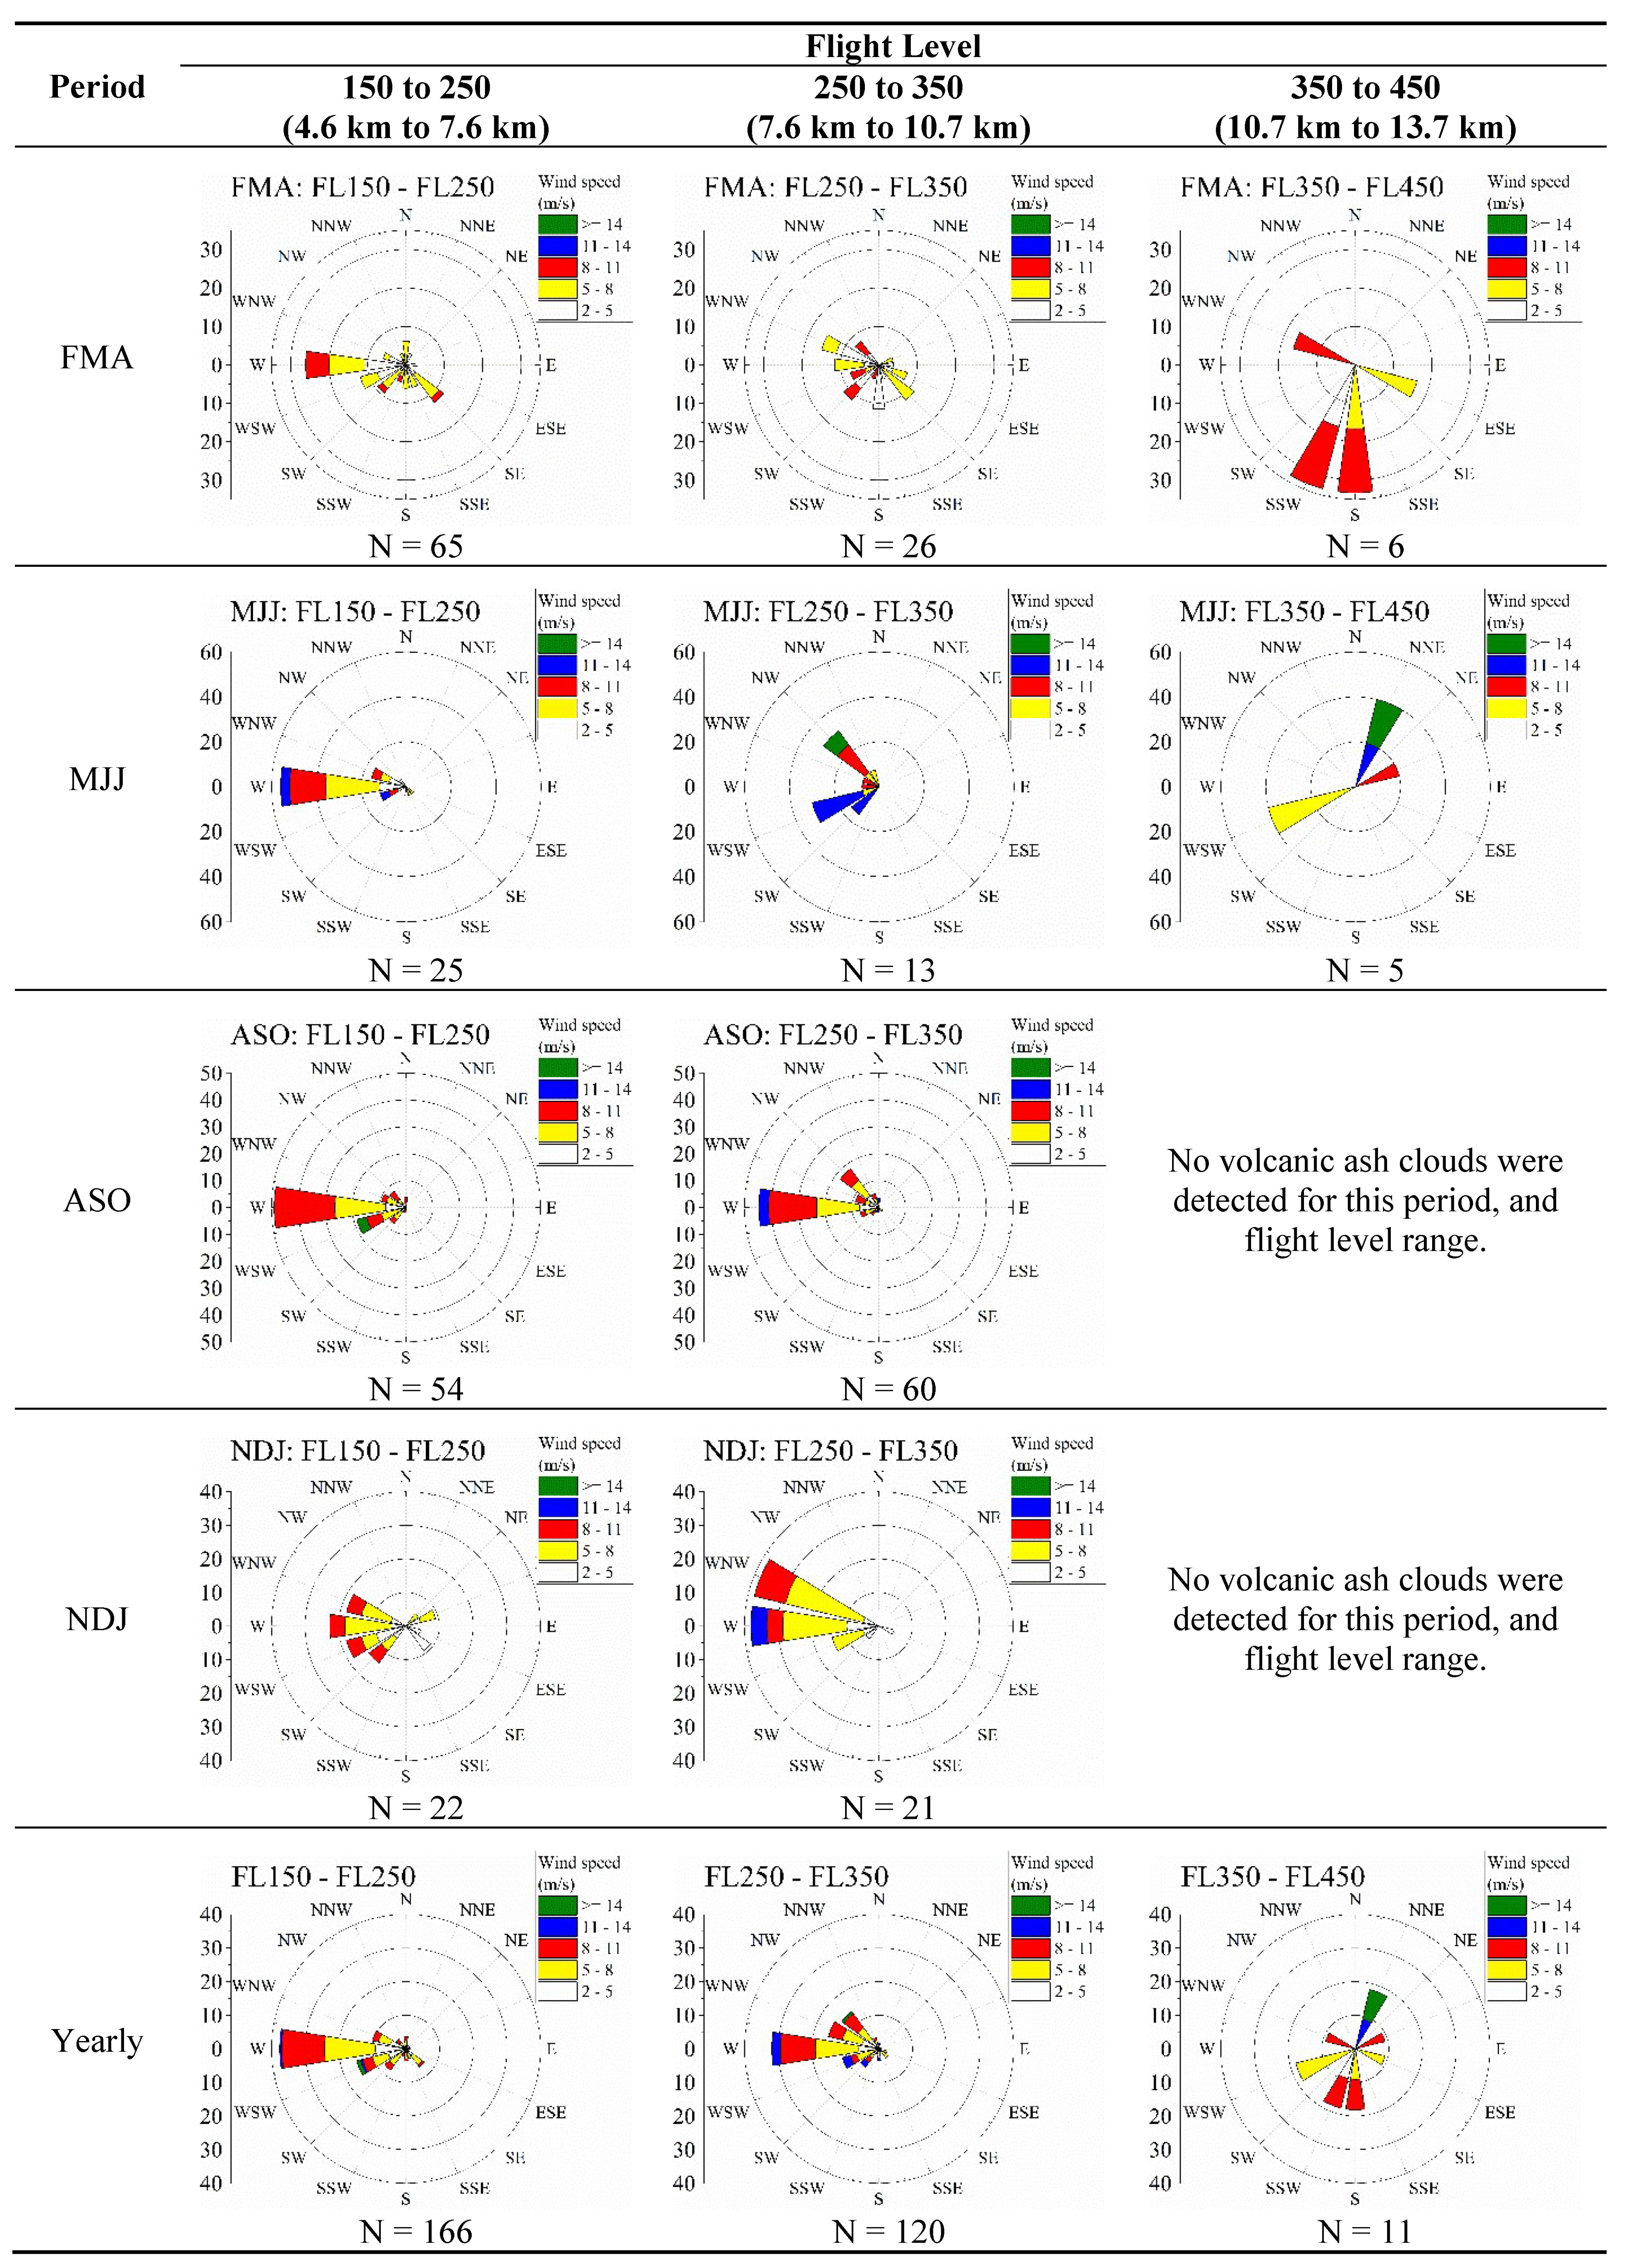
From 2013 to 2016, the Washington VAAC (
Figure 4) detected 300 volcanic ash clouds at Tungurahua. About 38% and 33% of these clouds were detected during ASO and FMA, respectively.
About 55% of these clouds reached maximum vertical heights between FL150 to FL250 (i.e., 4.6 to 7.6 km). These clouds dispersed mainly to the west during MJJ (52%) and ASO (50%;
Figure 4). During FMA (25%) and NDJ (23%), the frequency toward the west was lower than that in MJJ and ASO.
About 40% of the detected clouds reached maximum vertical heights between FL250 to FL350 (i.e., 7.6 to 10.7 km). The highest frequency towards the west took place during ASO (45%), followed by NDJ (38%). Other directions with significant frequencies of these clouds were WNW (38%) during NDJ, NW (30%), and WSW (30% during MJJ). During FMA, these clouds showed frequencies of about 10% toward SE, S, SW, west, and WNW. Only 4% of detected clouds reached maximum vertical heights between FL350 to FL450 (10.7 to 13.7 km). These clouds moved in different directions (
Figure 5) without a defined tendency.
Wind roses at 500 mb (≈FL200) deduced from the ERA5 mean monthly dataset indicated frequencies higher than 90% towards west during MJJ and ASO, with speeds up to 14 m s
−1 (
Figure 6). During NDJ and FMA, frequencies to the west decreased to 36% and 60%, respectively, with wind speeds up to 8 m s
−1.
At 300 mb (≈FL300), wind direction towards west was more frequent during FMA (45%) and ASO (40%). WSW was the most frequent direction during MJJ (40%) and NDJ (15%). During NDJ, west (≈15%) and NNE (≈15%) directions were frequent.
At 200 mb (≈FL400), wind directions showed diversity, especially during NDJ, west (18%), WSW (12%), WNW (10%), NE (10%), and ENE (10%) being the most frequent.
4. Discussion
The yearly ash fallout map configuration due to Vulcanian eruptions at Tungurahua volcano was consistent with the delimitation of affected zones by ash fallout currently provided by IG-EPN (
Figure 7). We note that the delimitation by IG-EPN, published in 2008, was based on the study of ash fallout distribution of past eruptions; the maps presented in this contribution were generated by modeling, based on historical forecasting data from four recent years.
The inner delimitation of the IG-EPN corresponds to a region with a probability higher than 90% of being affected by ash fallout (
Figure 7). The outer delimitation of the IG-EPN, which encloses the cities of Guaranda, Ambato, and Riobamba, approximately corresponds to the probability contour of 50% presented in this contribution. To our knowledge, we generated the first ash fallout probability maps of this volcano, describing their variation during the year with high spatial resolution and enclosing regions with probabilities higher than 5% of being affected by ash fallout. Therefore, our maps can be used as input for planning, risk assessment, and management purposes.
Some of the ash clouds detected by the Washington VAAC may correspond to new positions of previously detected ash clouds produced by the same emission pulse. Therefore, the frequencies of the wind roses of
Figure 5 may have been overestimated. However, even with this limitation, these wind roses provide a useful comparative reference. Although covering two different periods, we highlight the consistency of the maps obtained from our historical forecasting data (April of 2015 to March of 2019) with the direction of detected ash clouds by the Washington VAAC from 2013 to 2016.
Our results indicated similar ash fallout shapes during MJJ and ASO, with a clear and defined tendency towards the west of the volcano. This tendency was less defined during NDJ and FMA. These ash fallout shapes were consistent with the wind roses derived from 41 years of data from the ERA5 mean monthly dataset. At 500 mb (≈FL200), a level directly involved with ash fallout patterns, frequencies towards the west were higher than 90% during MJJ and ASO, accompanied by intense wind speeds (up to 14 m s−1). During NDJ and FMA, although still the majority, frequencies to west decreased to 36% and 60%, respectively, compared to MJJ/ASO, with lower wind speeds (up to 8 m s−1). Therefore, during NDJ and FMA, ash fallout may also affect regions in other directions, with less scope to the west.
Although there are different elements behind the wind dynamics involved in volcanic ash dispersion, one of the most important is the Intertropical Convergence Zone (ITCZ). In January, the ITCZ is located near Ecuador, reaching its southernmost position during the boreal winter. The ITCZ represents a convergence zone, resulting from the coincidence of trade winds from the North and South Hadley cells [
33]. This convergence promotes convective movements of the atmosphere and, consequently, produces rainfall [
30,
31]. During NDJ and FMA, wind fields involved with volcanic ash dispersion do not show this strong tendency to west. During July (boreal summer), the ITCZ reaches its northernmost position, far from the Equator. Therefore, during MJJ and ASO, Ecuador is under the influence of the outer winds around the meridional high, showing a strong wind component toward the west.
Our maps indicate the direction of ash fallout of the eruption from 14 July 2013, the basis for the predefined ESP currently used for forecasting, toward the west, corresponded to an event with a high probability of occurrence. They also indicate that the direction of ash fallout of the eruption from 1 February 2014, towards the south, corresponded to an event with low probability. The city of Cuenca, which shows probabilities lower than 5%, was affected by the eruption in February 2014. This event highlights the complementarity between ash fallout/probability maps and forecasting data. Our maps provide information about the regions which are statistically expected to be affected by ash fallout. However, the forecasting, based on the daily meteorology and the predefined ESP, could indicate ash fallout affecting regions with a low probability of occurrence.
In Ecuador, satellite detection of volcanic ash is limited to layers over the meteorological clouds. Considering that detected ash clouds can be transported in different directions, compared to wind near the surface, ash fallout forecasting provides relevant information. Therefore, studies to improve the forecasting of volcanic ash are a priority field of research in Ecuador.
Although our maps were obtained from four years of historical forecasting data, based on state-of-the-art meteorological and volcanic ash dispersion models, and produced with a proper spatial resolution (4 km), one limitation of these maps is related to the use of a unique and fixed set of predefined ESP. The nature of Vulcanian eruptions, being short-lived and discrete explosions, implies more difficulties than when modeling sustained Plinian or Sub-Plinian eruptions [
34]. However, the consistency between our results, with detected ash clouds and wind roses made with monthly data collected over 41 years, indicates that our approach can be applied to generate ash fallout and probability maps for other ESP and other volcanoes.
These maps may change in the future, as a consequence of climate change. Future studies are, therefore, required to foresee the effects on components as the ITCZ behavior and other atmospheric variables involved in volcanic ash dispersion in Ecuador.
5. Conclusions and Summary
We generated isomass and probability maps of ash fallout due to Vulcanian eruptions at Tungurahua volcano, based on four years of historical forecasting data. To our knowledge, we generated the first ash fallout probability maps of this volcano, describing their variation during the year with high spatial resolution. The consistency of our results with information from the sources used in this manuscript (i.e., Washington VAAC, IG-EPN, and the ERA5 dataset) indicates that our approach can be applied to generate ash fallout and probability maps for other ESP at Tungurahua and other volcanoes in Ecuador.
Our results showed similar ash fallout shapes during MJJ and ASO, with a clear and defined tendency towards the west of the volcano. This tendency was less defined during NDJ and FMA. The cities of Guaranda (W, 60% to 90%), Riobamba (SW, 70%), and Ambato (NW, 50% to 60%) had the highest probabilities of being affected by ash fallout. Among the biggest Ecuadorian cities, Guayaquil (SW, 10% to 30%) had a low probability, and Quito (N, ≤5%) and Cuenca (SSE, <5%) had very low probabilities of being affected by ash fallout. However, ash fallout affected Cuenca during the eruption on 01 February 2013, despite it being a city with very low probability to be affected. This demonstrates a reason why we should permanently forecast volcanic ash dispersion in Ecuador.
High ash clouds can move toward different directions, compared to wind near the surface. Therefore, it is possible to detect ash clouds by remote sensing which, in Ecuador, is limited to the layers over the meteorological clouds, which move in a different direction than low winds, producing ash fallout over regions in different directions, compared to detected ash clouds. Therefore, in addition to the isomass/probability maps and detected ash clouds, forecasting is permanently required in Ecuador. Numerical forecasting can provide useful information hours or even days in advance, compared to remote sensing which, where available, provides information only after the capturing and processing of ash clouds.
Forecasting information is particularly useful, in cases of weak eruptions and cloudy conditions when volcanic ash is emitted below the meteorological clouds, which are difficult to detect using the satellites currently monitoring the region of Ecuador. In these cases, forecasting is probably the unique source of information about the potential trajectories of dispersion and areas affected by ash fallout.
Being a research priority in Ecuador, we explored some components of Eulerian models involved in the dispersion of volcanic ash, such as the ESP proposed for Vulcanian eruptions at Tungurahua volcano and the influence of spatial resolution. However, there are other components which have not yet been assessed, such as the influence of spin-up time in meteorology, the contribution of data assimilation, or the theoretical benefits of using online approaches.


