Validation of Satellite and Merged Rainfall Data over Ghana, West Africa

 , , , and
Abstract
:
1. Introduction
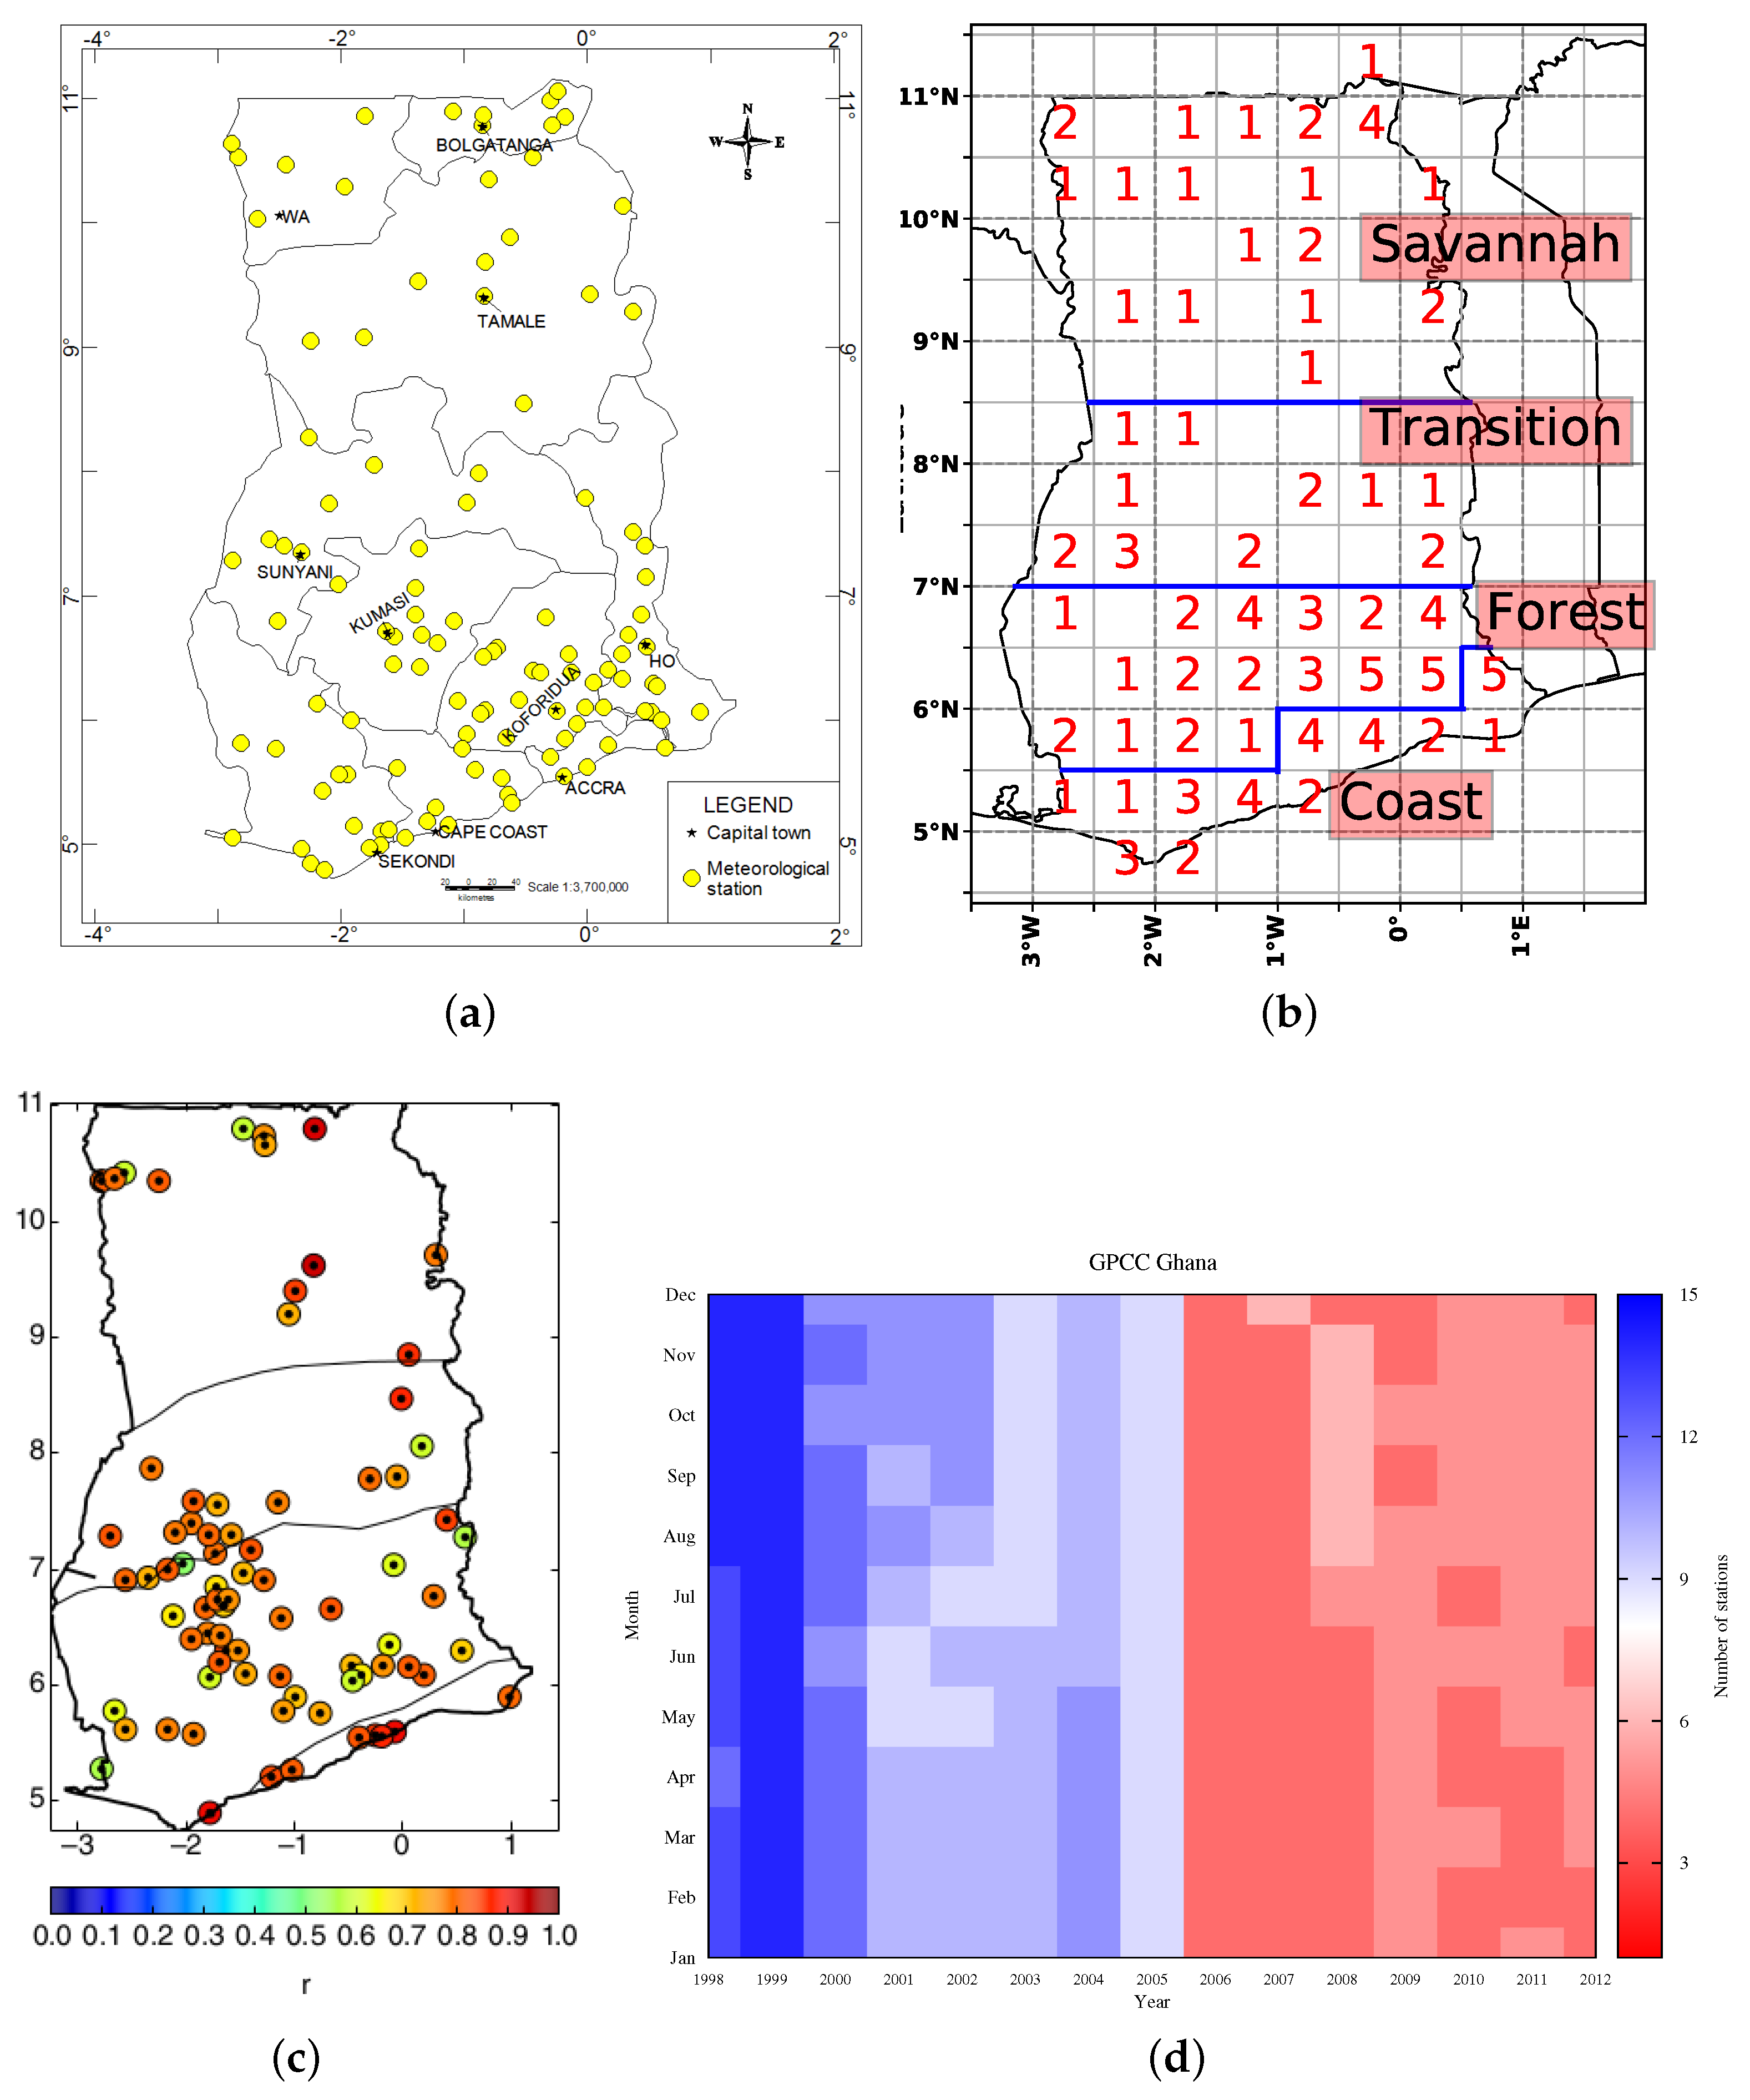
2. Study Area
3. Data Source
3.1. Gauge Data
3.2. Validated Rainfall Products (VRPs)
4. Validation Methodology
5. Results and Discussion
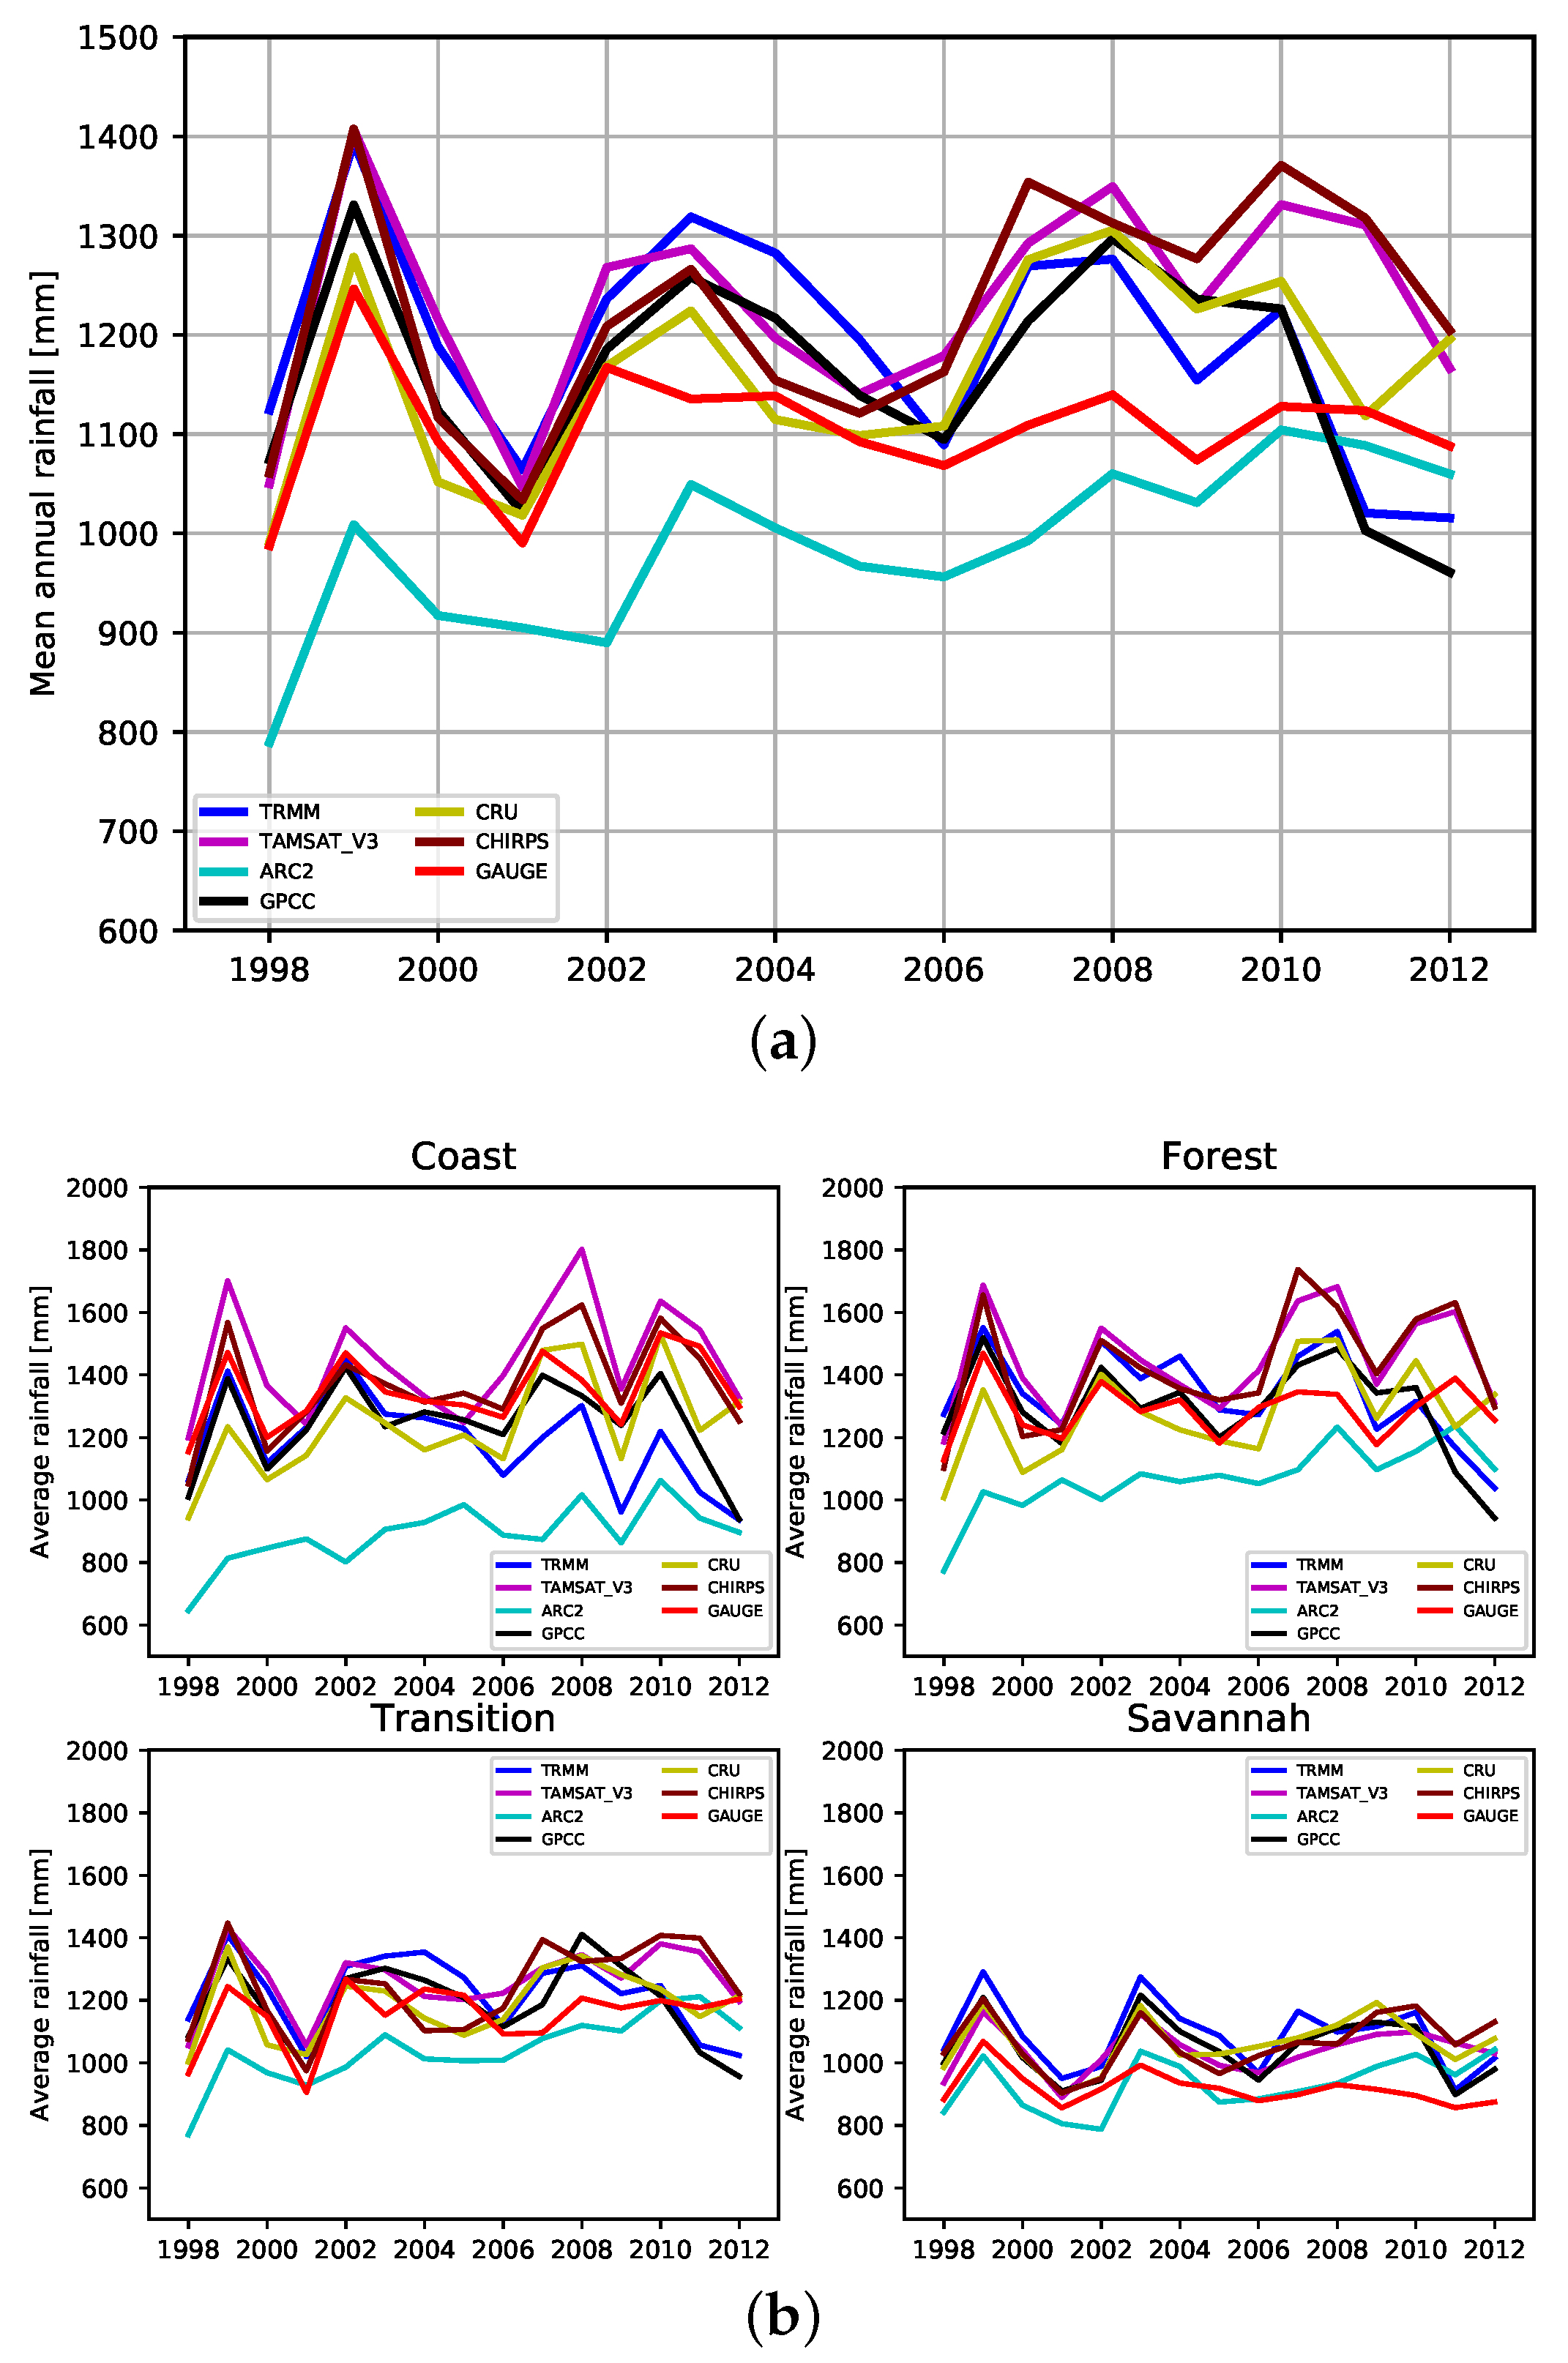
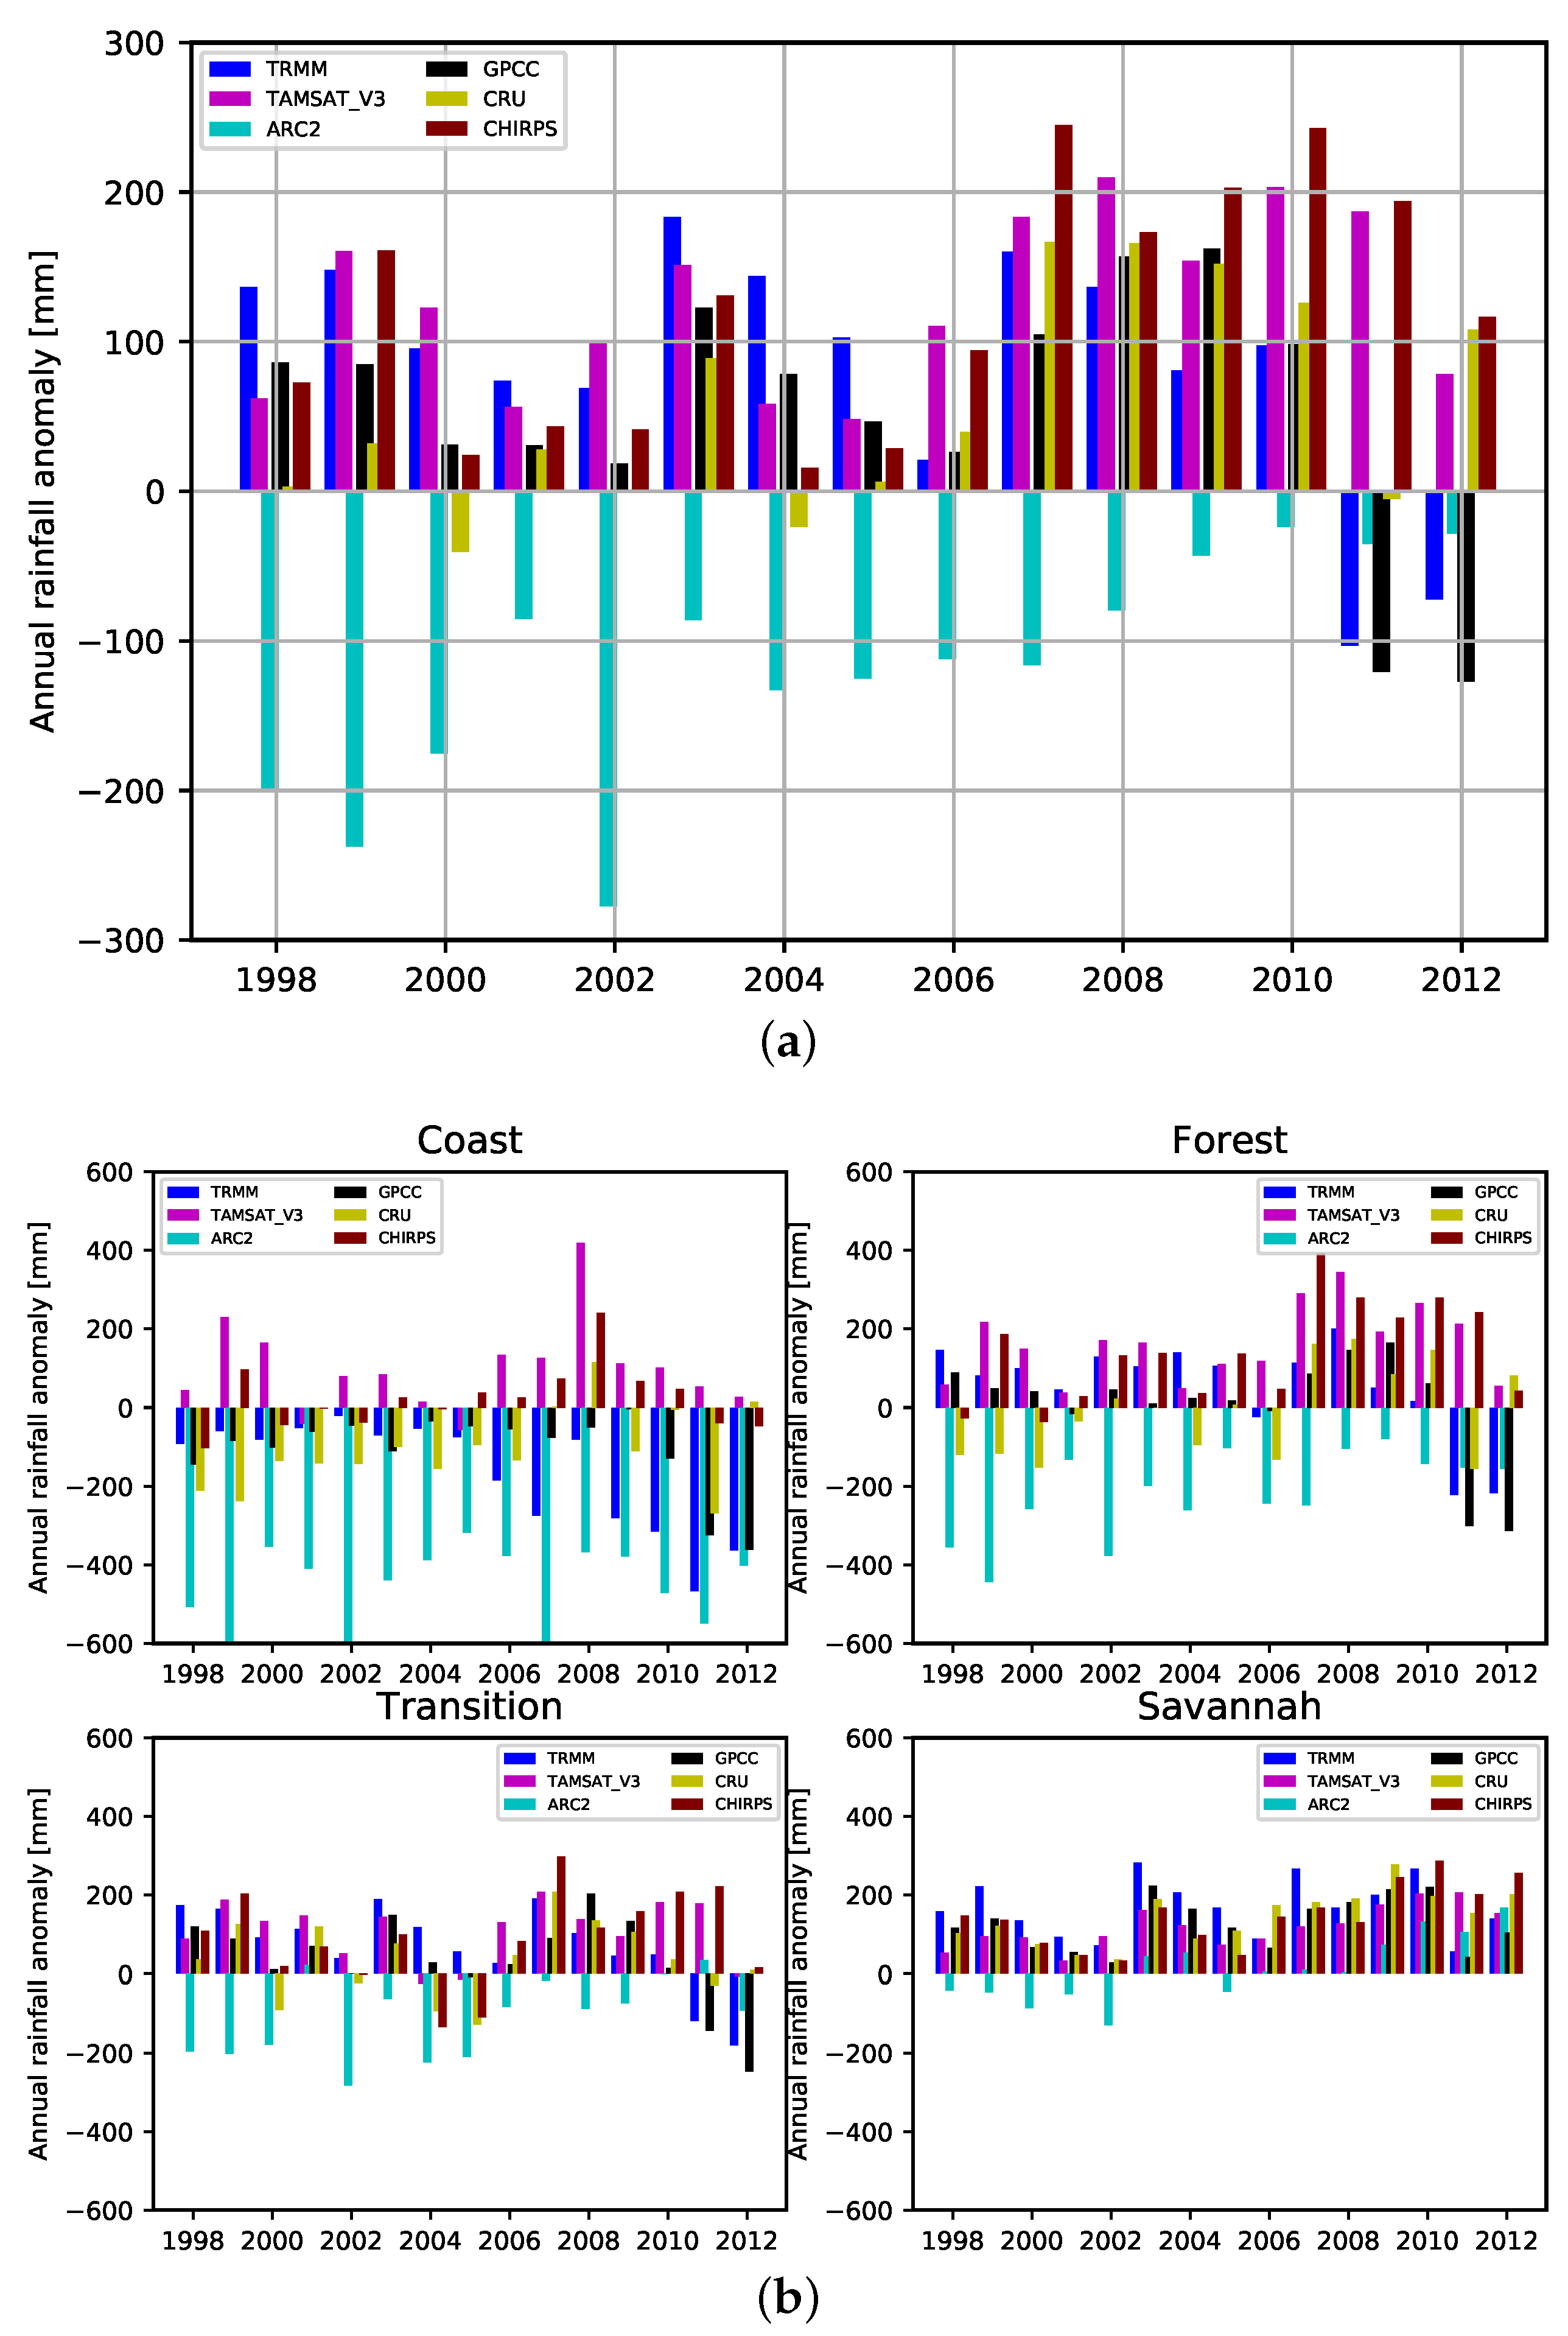
5.1. Inter-Annual Comparisons of VRPs
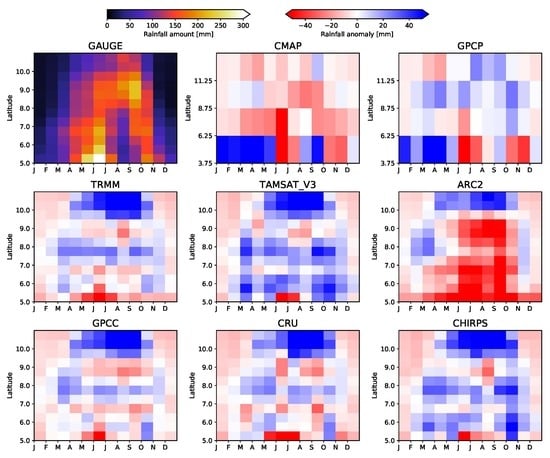
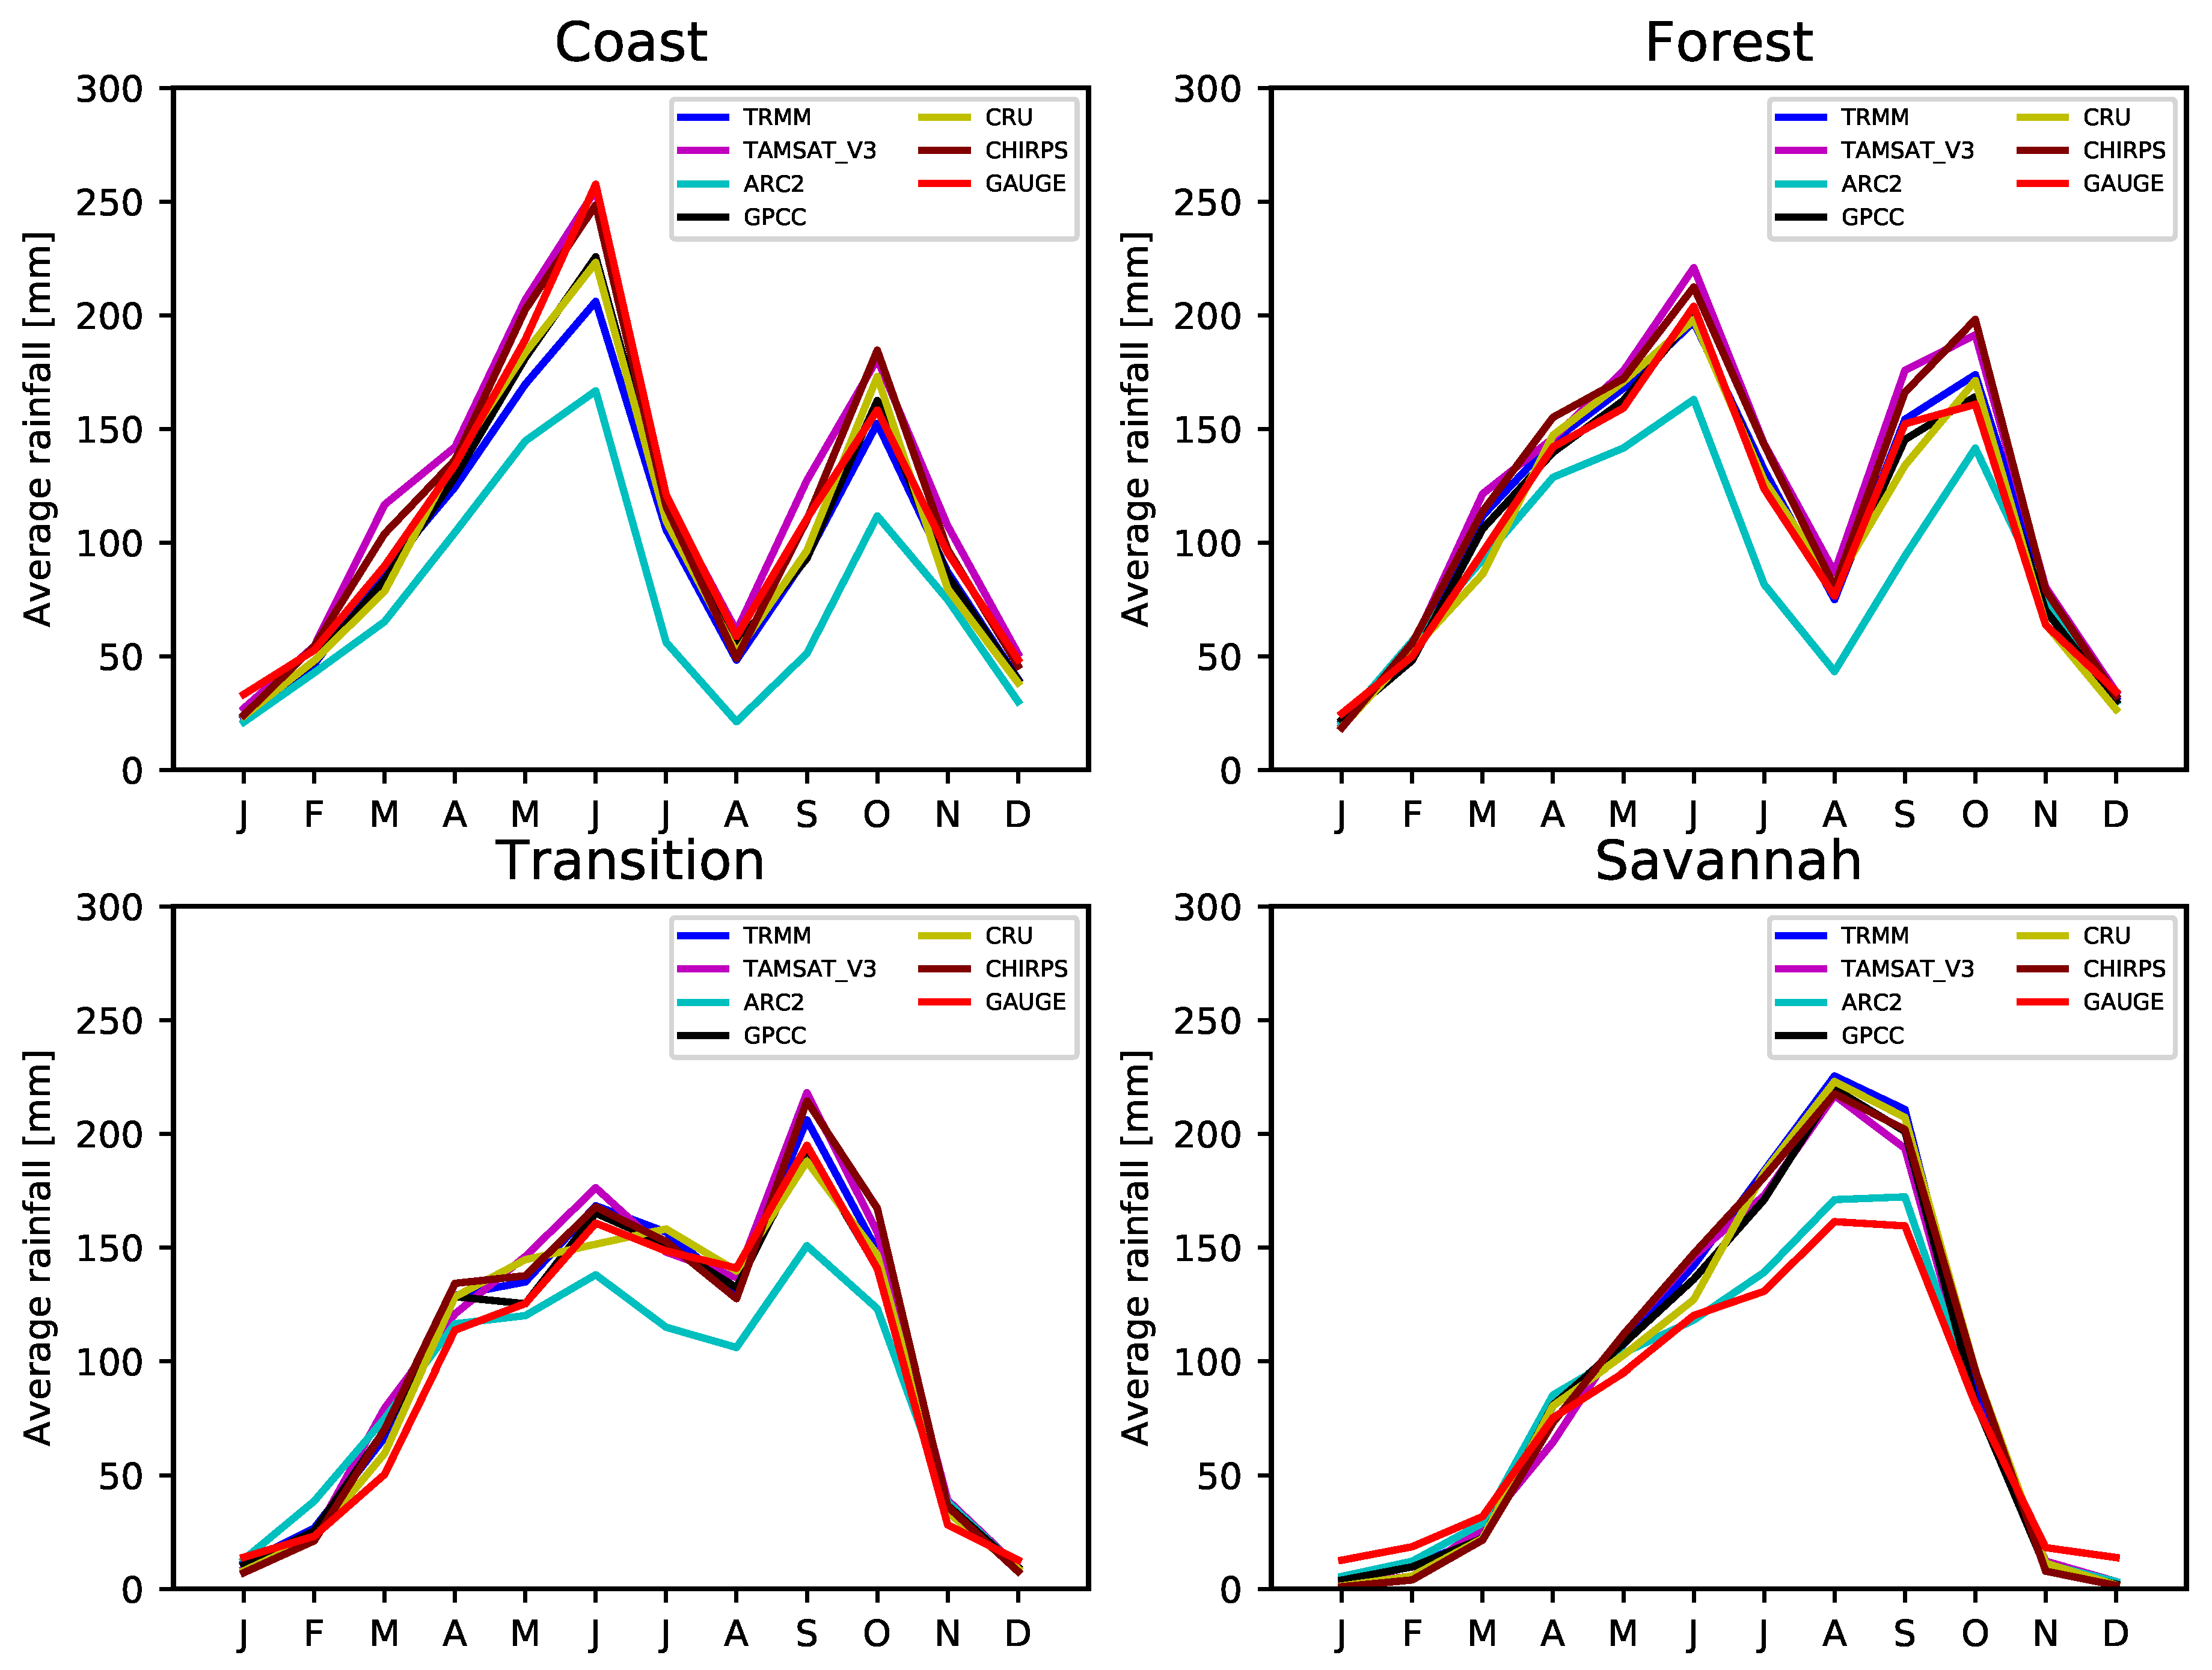
5.2. Inter-Seasonal Comparisons of VRPs
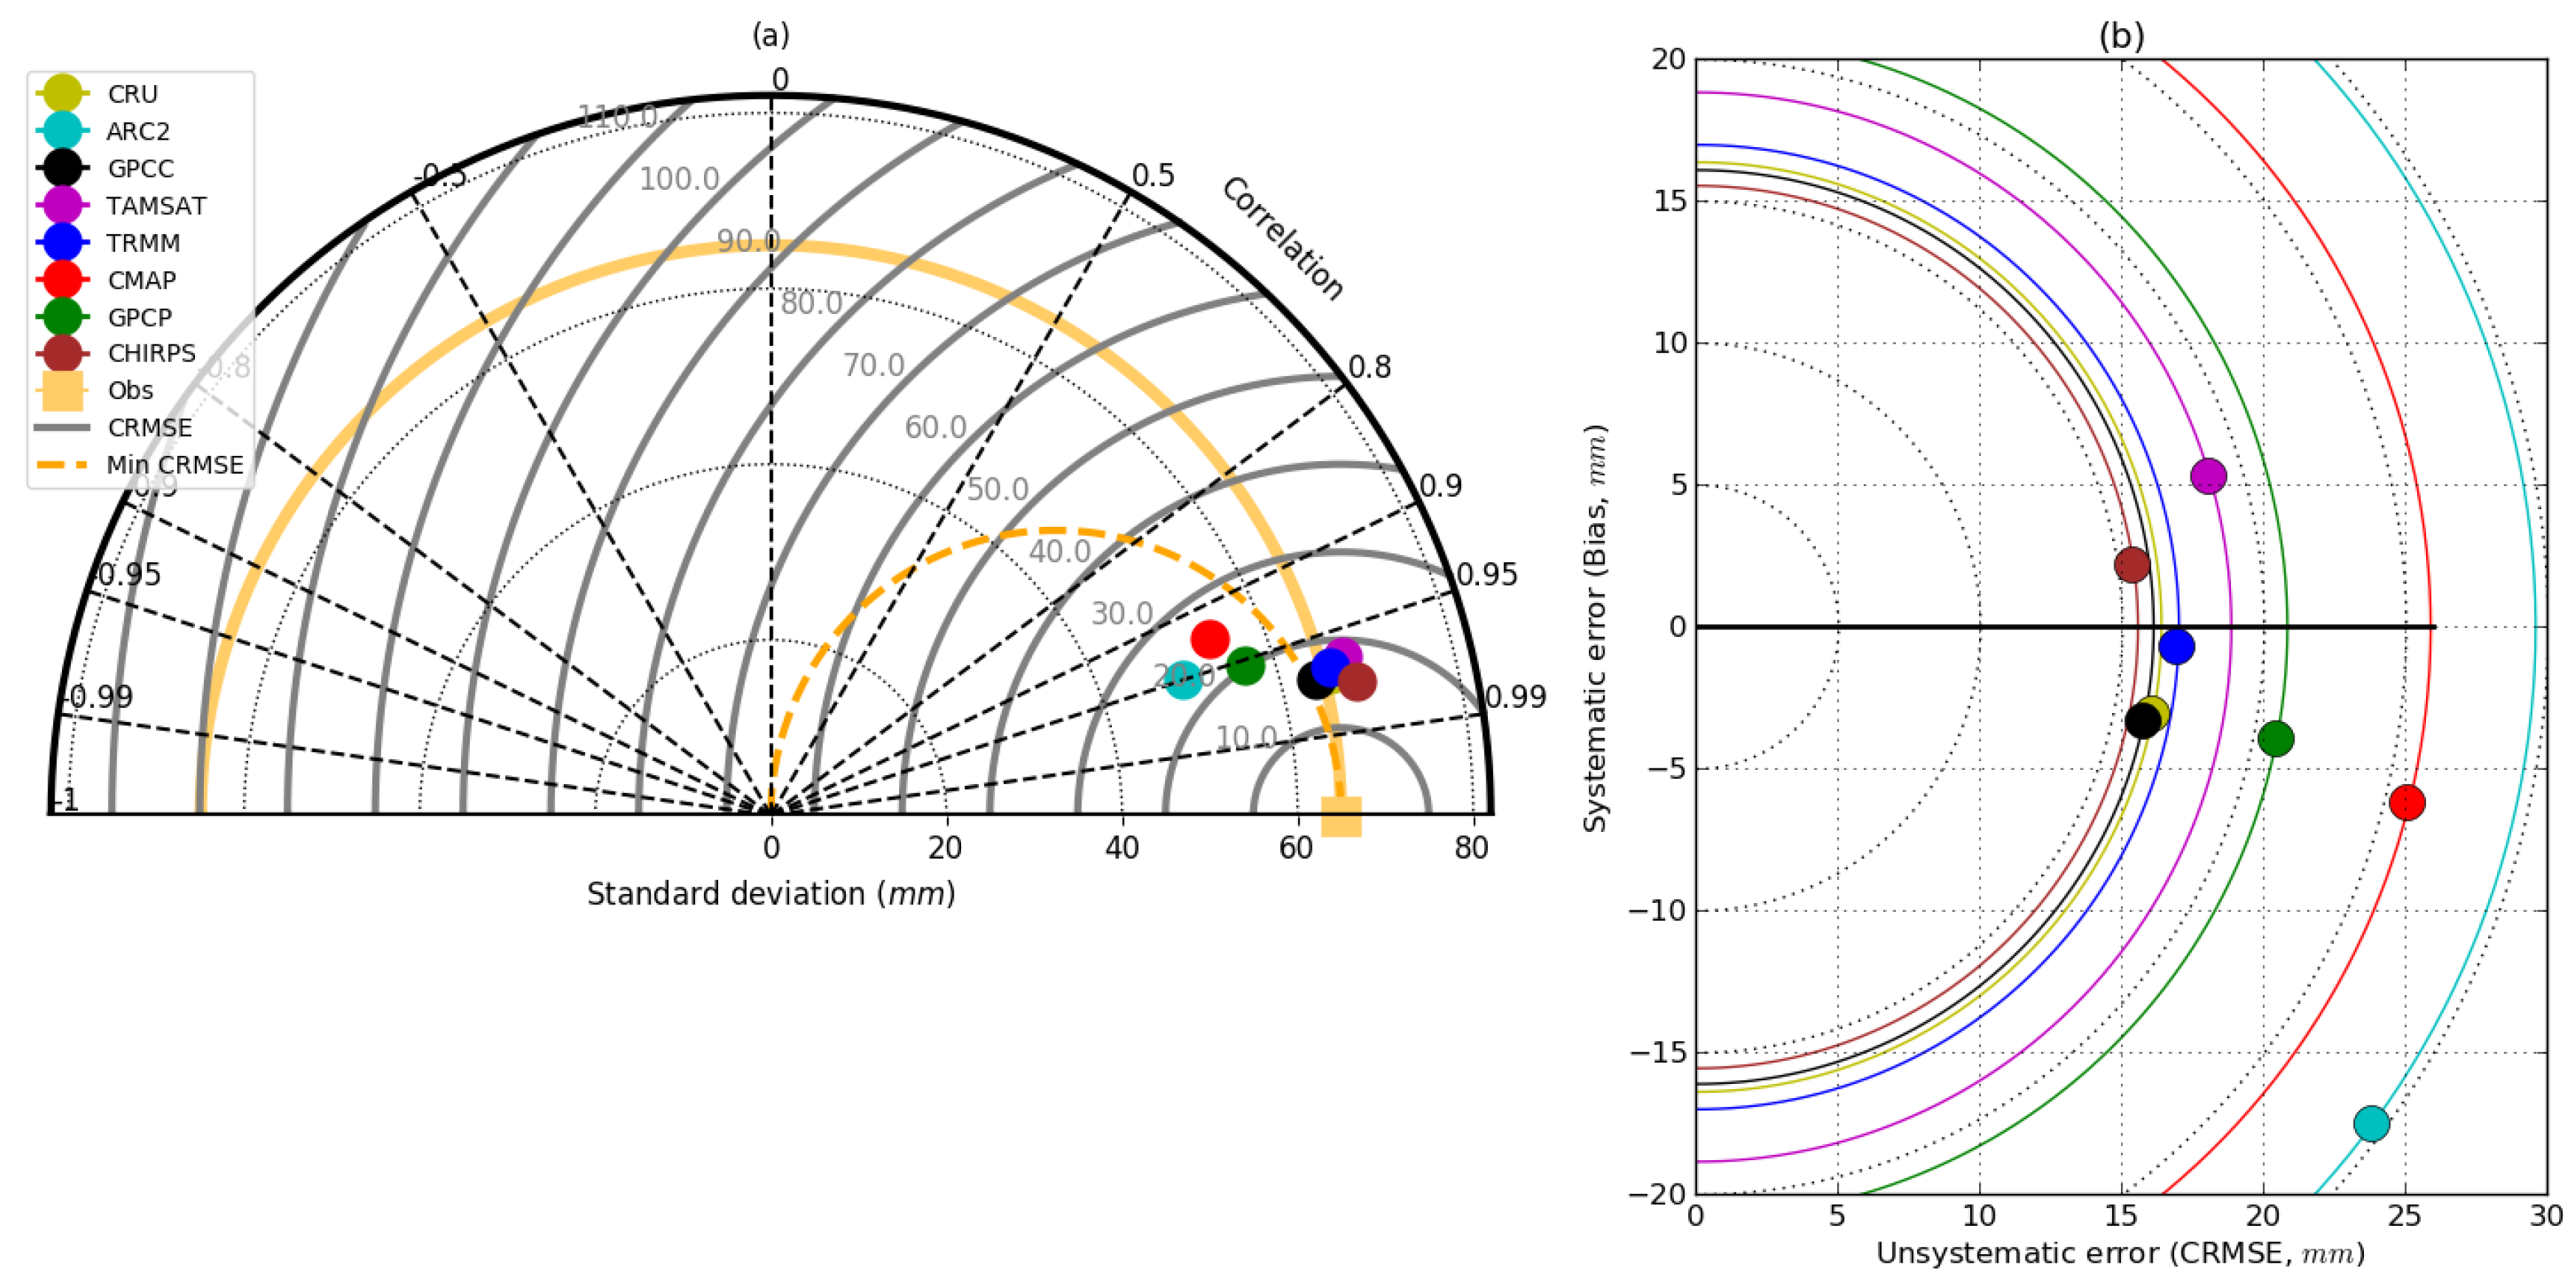
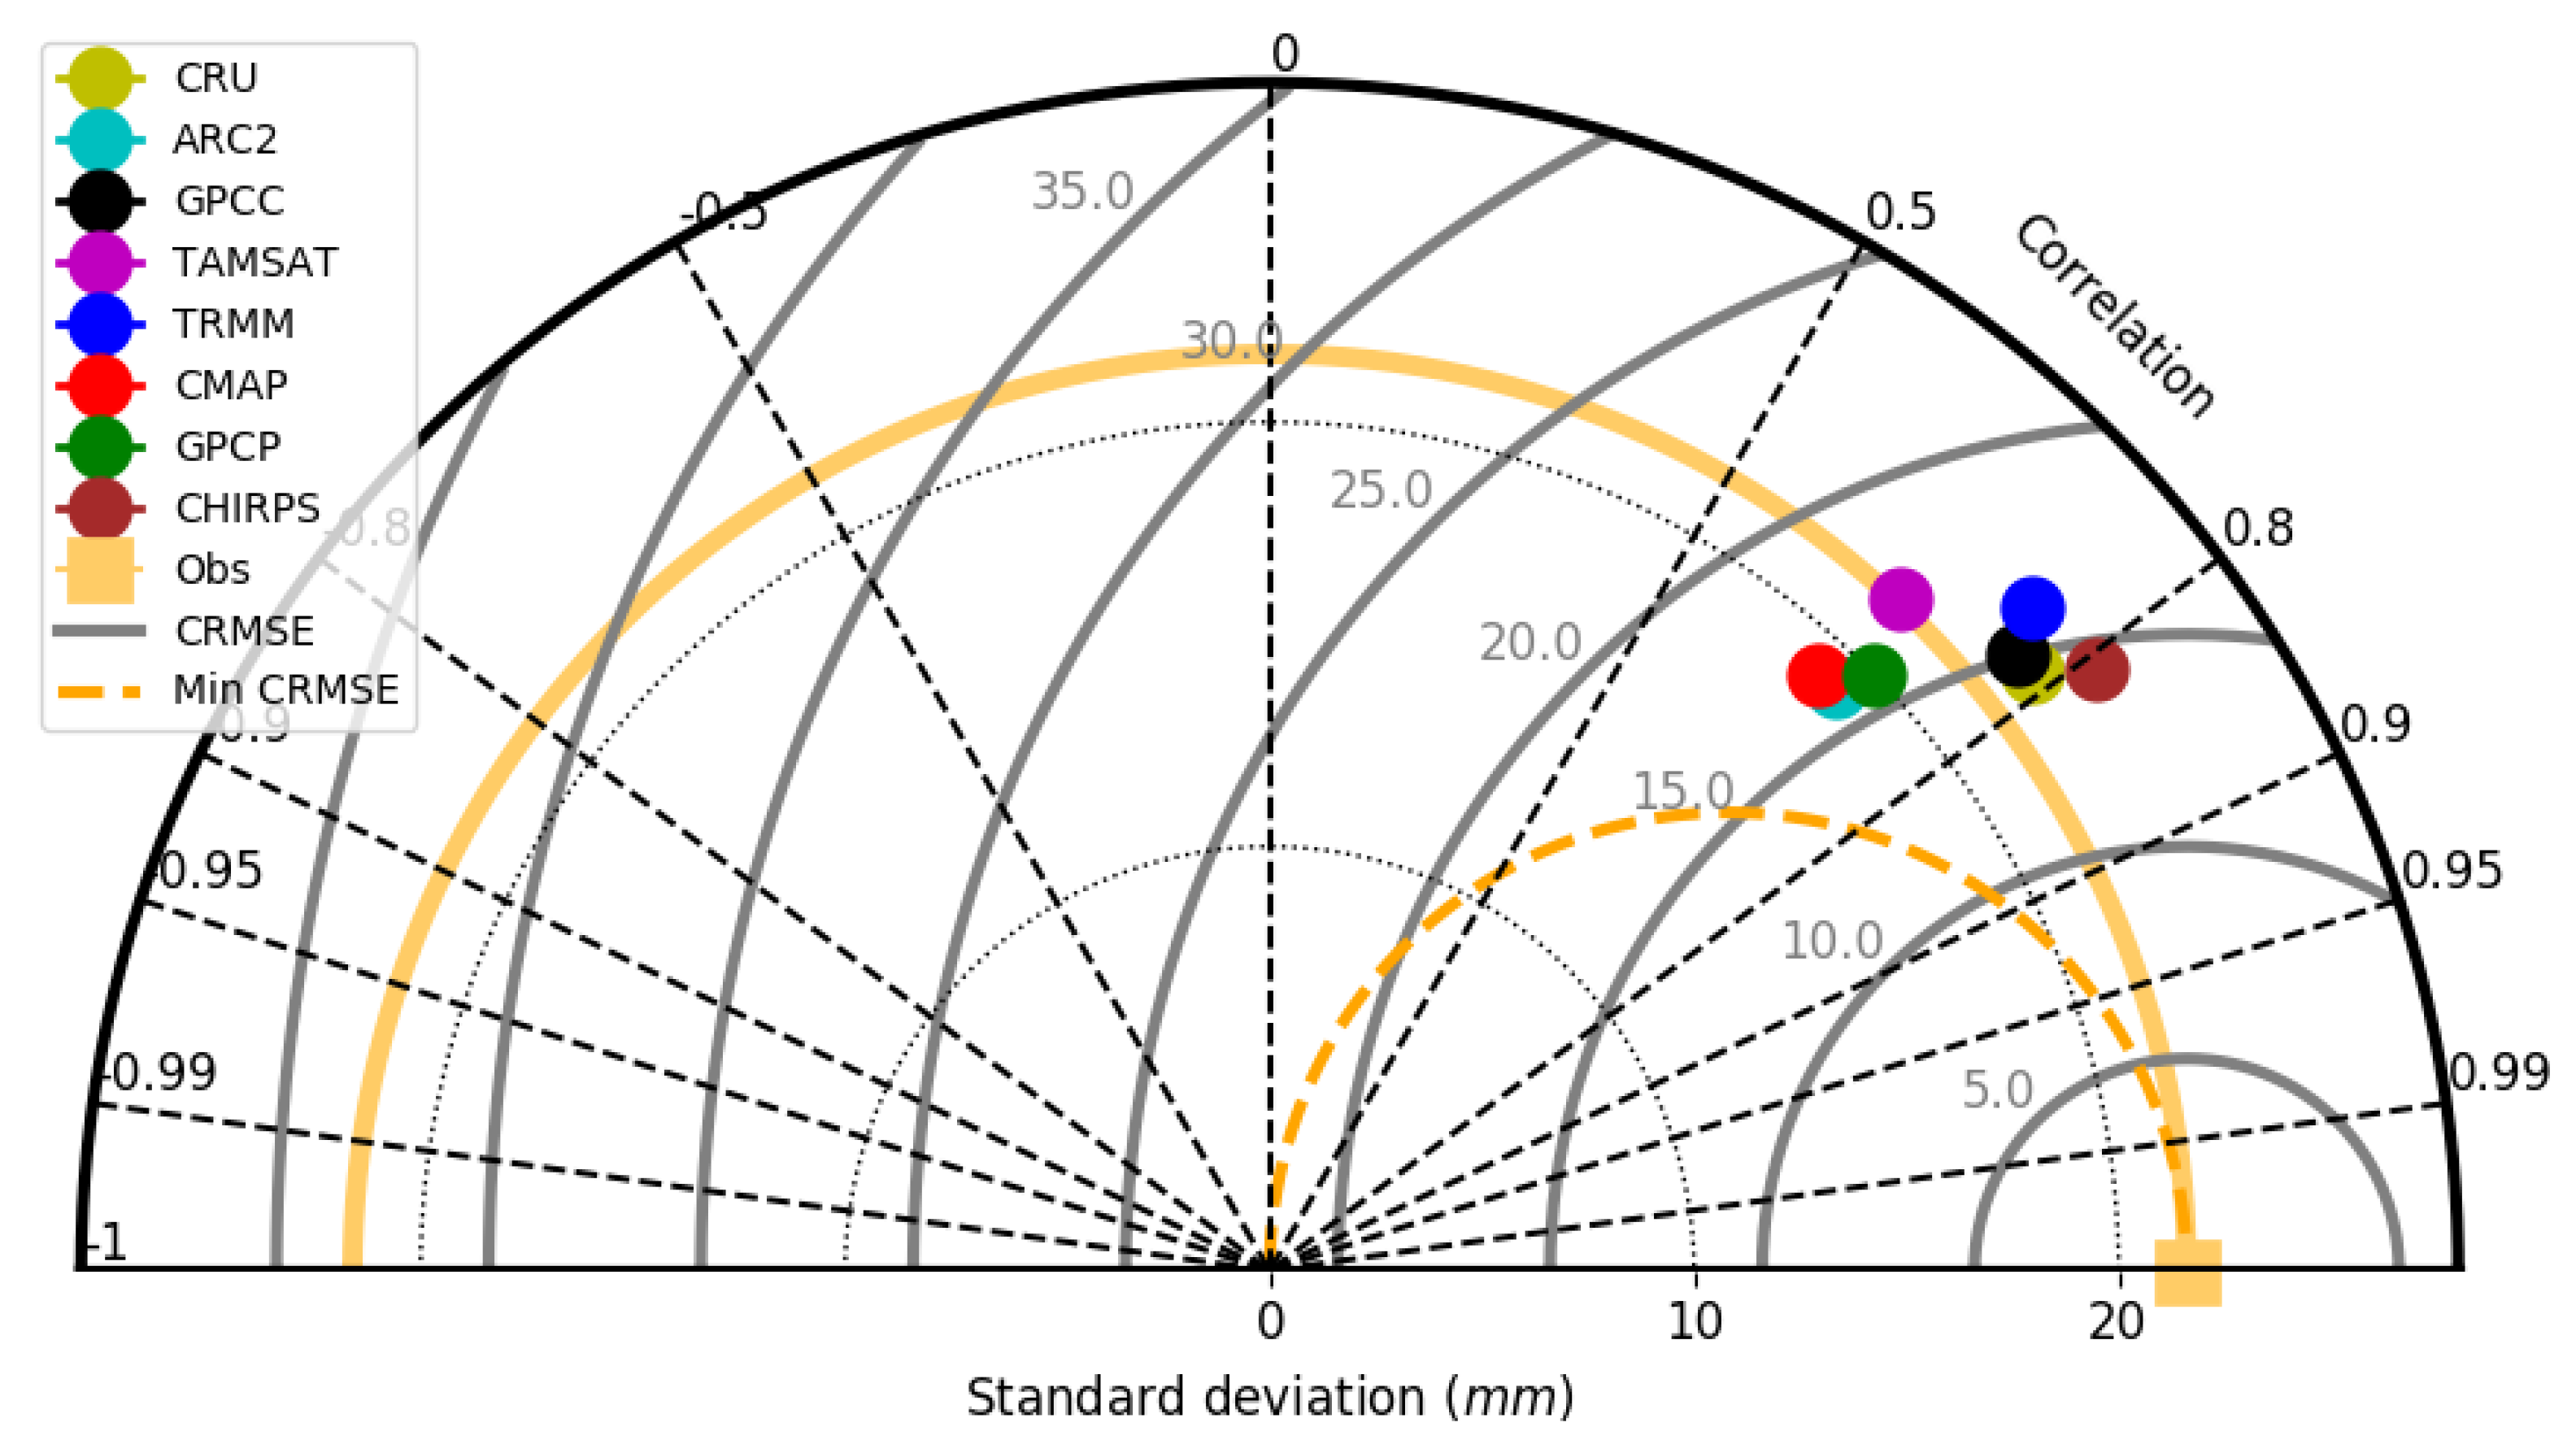
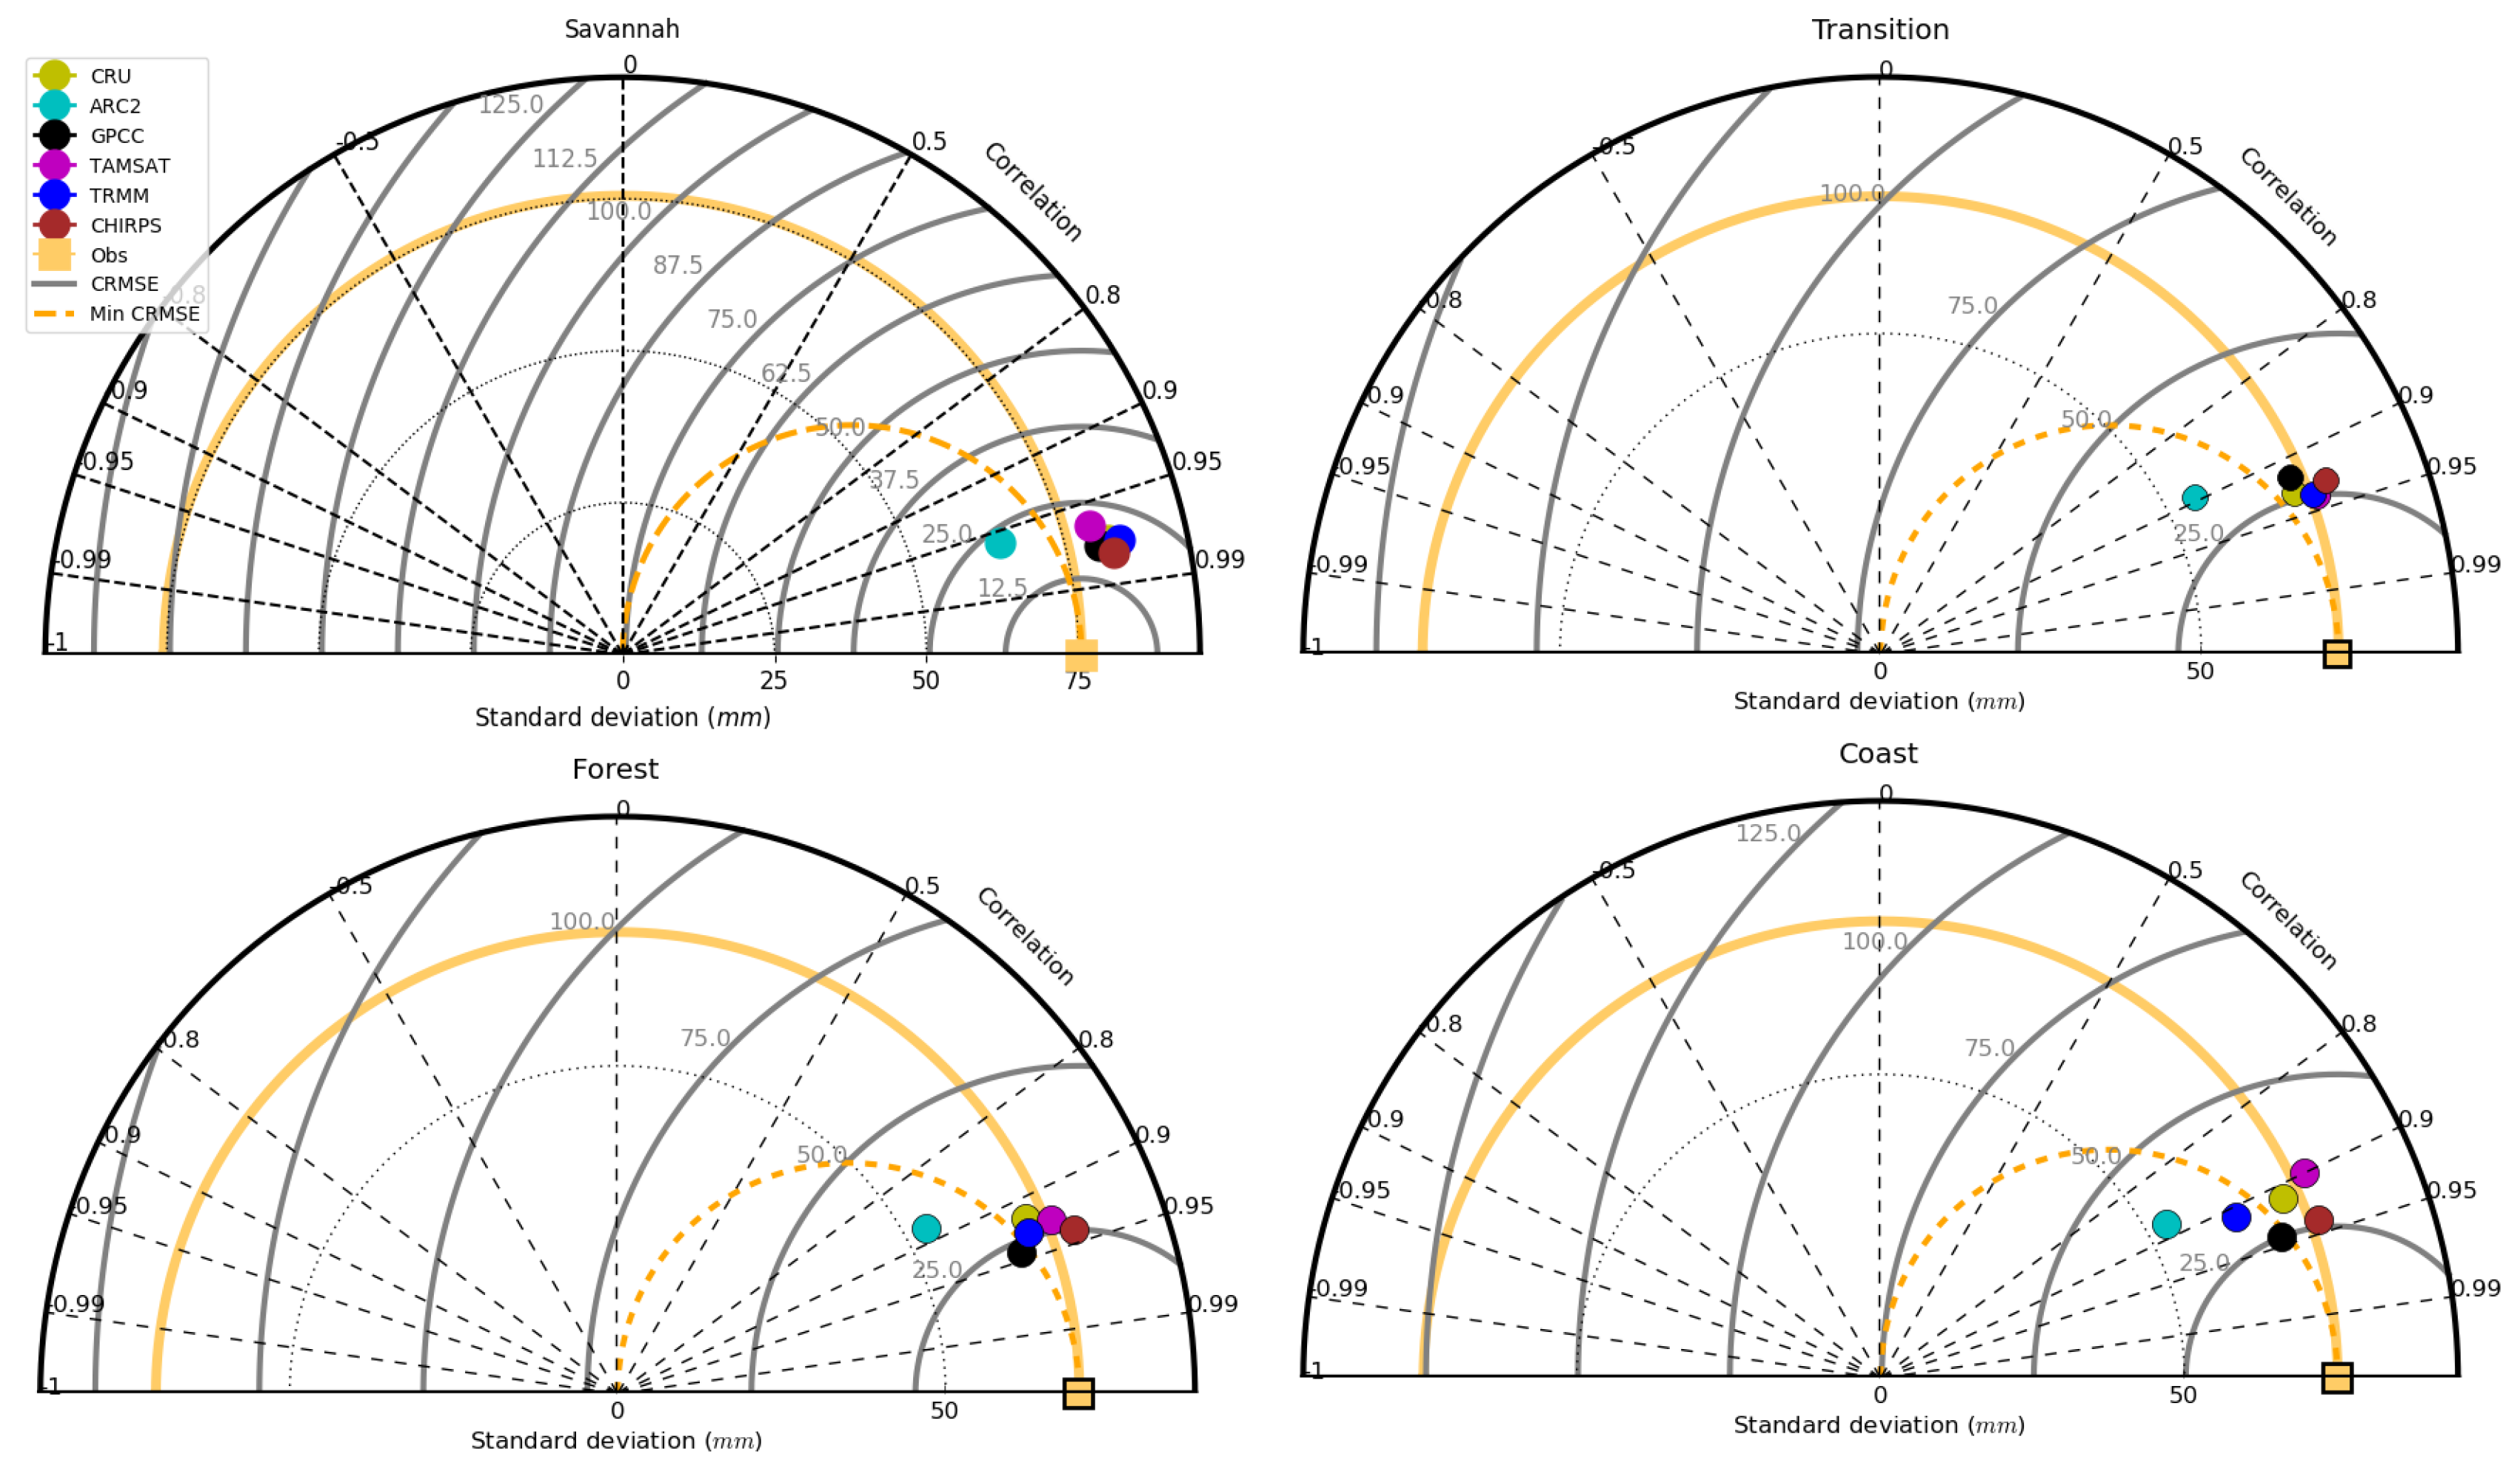
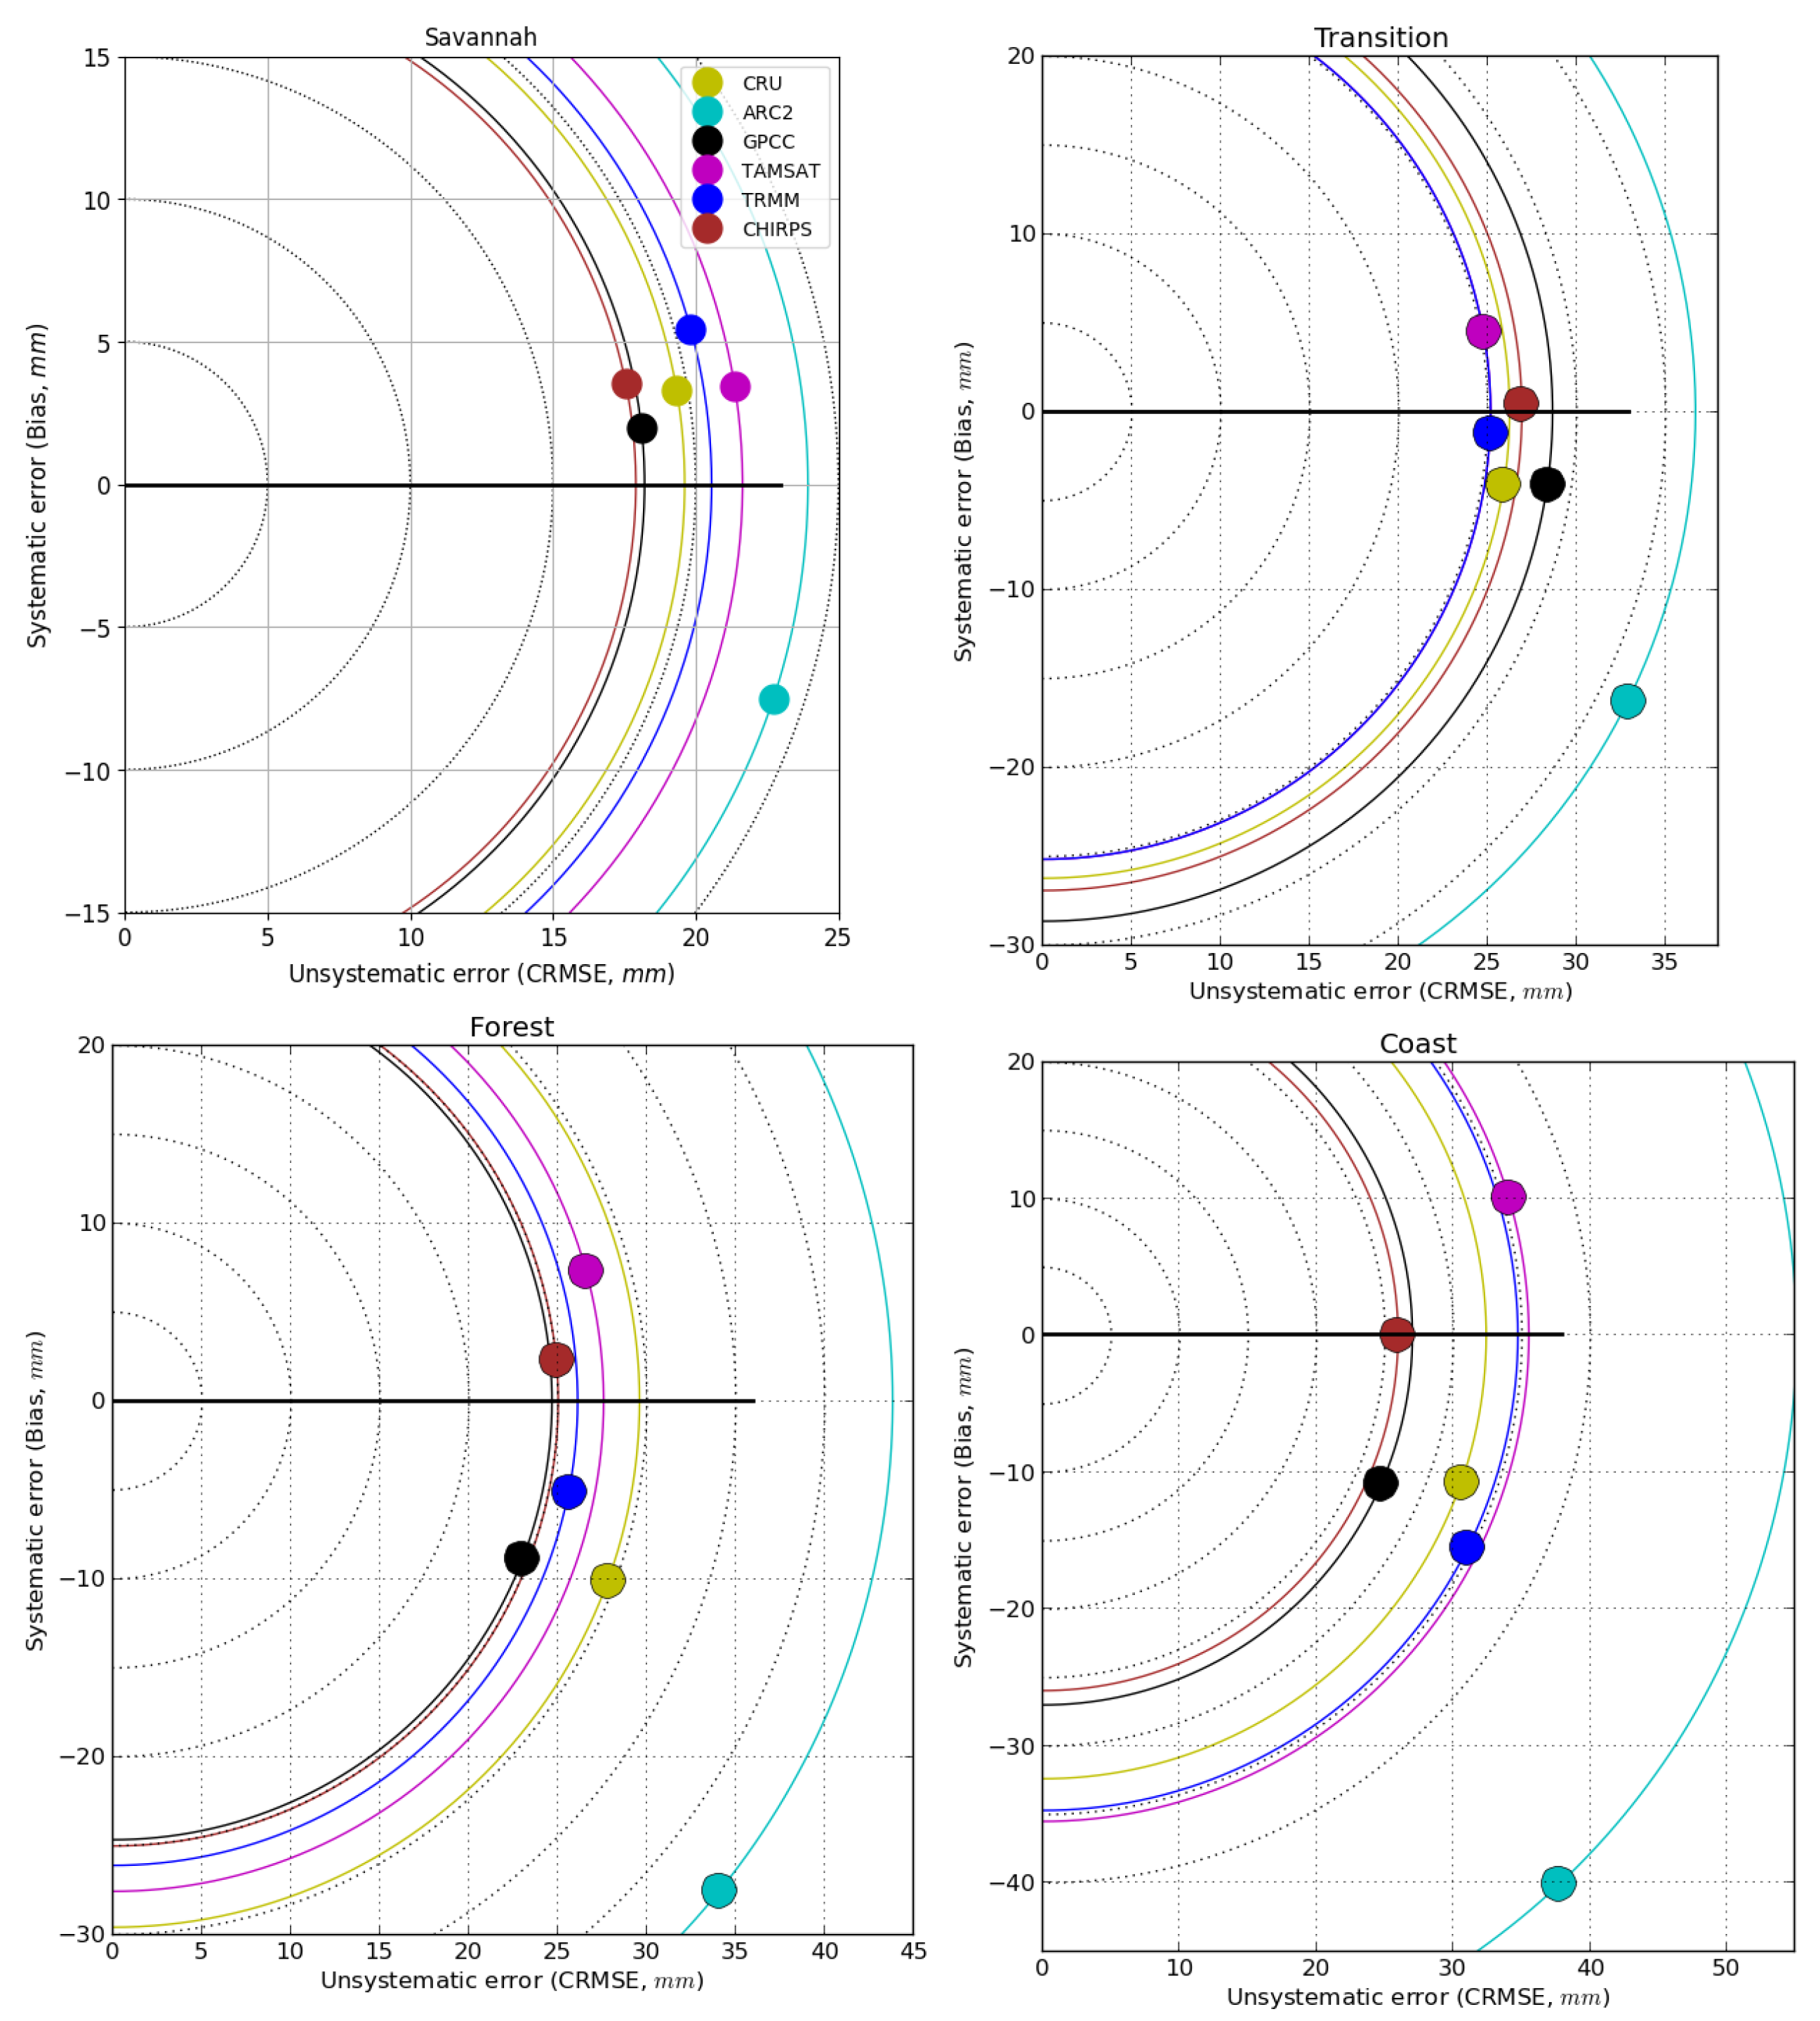
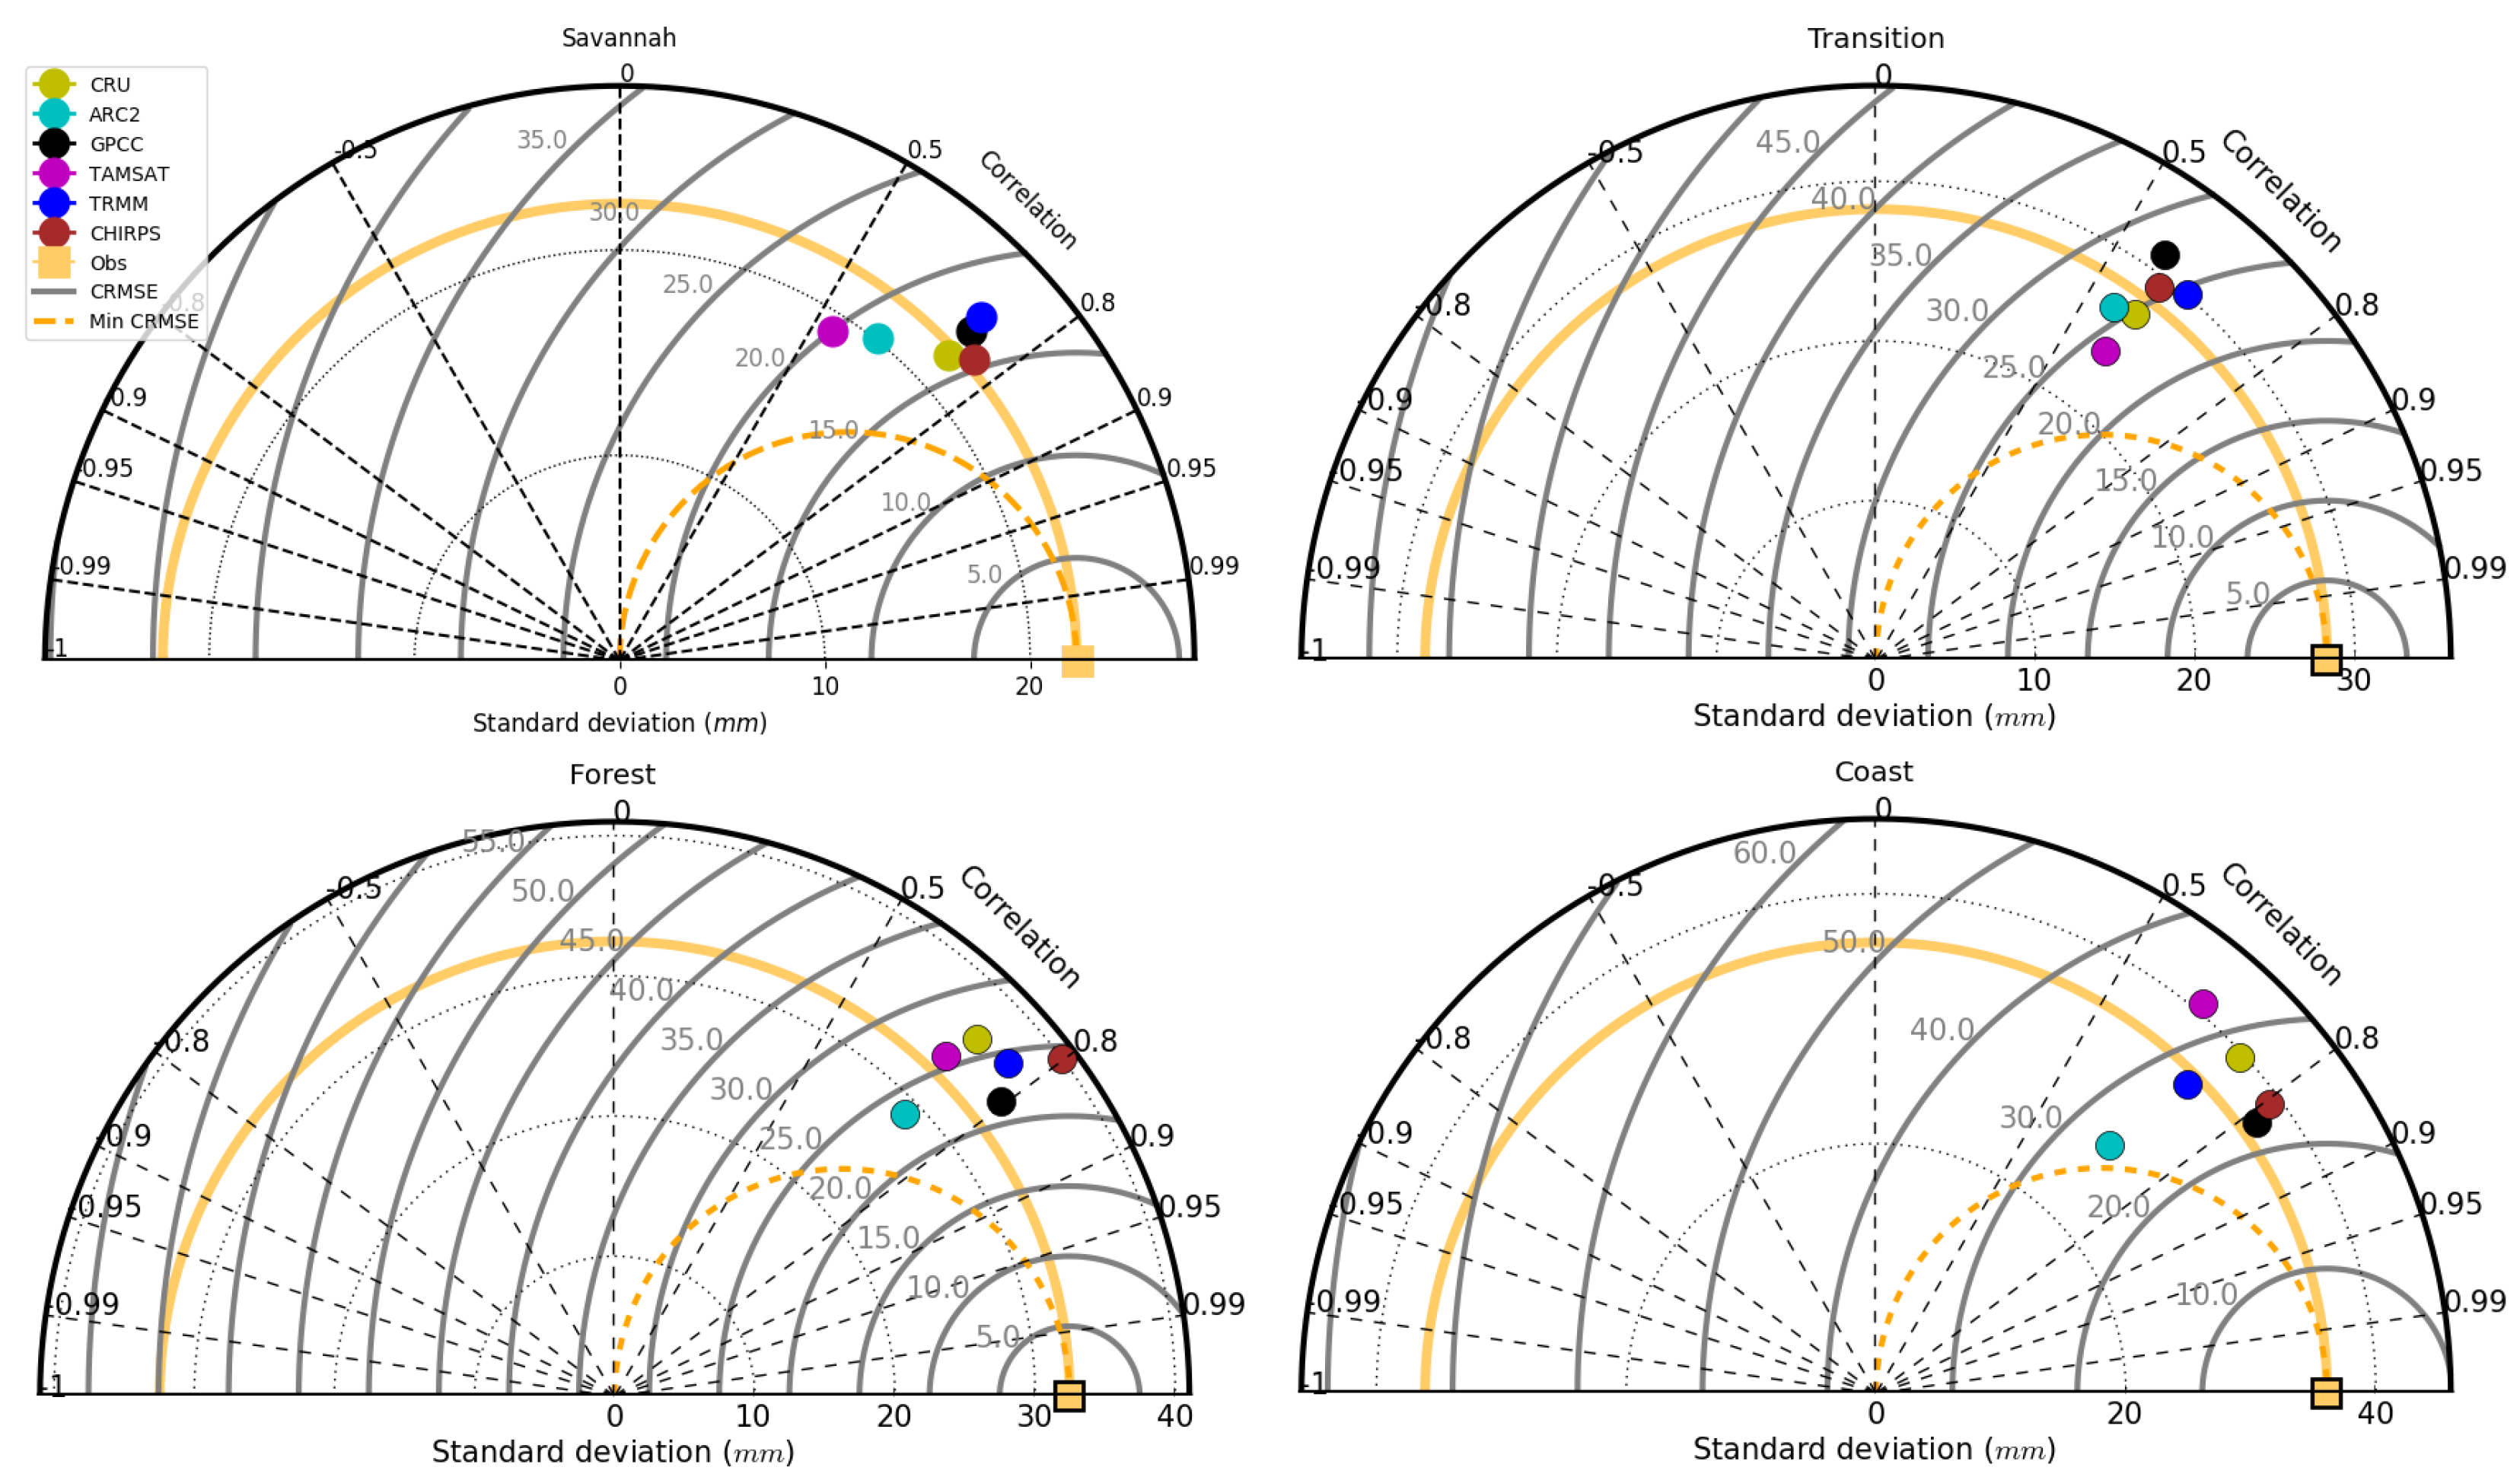
5.3. Statistical Evaluation of VRPs
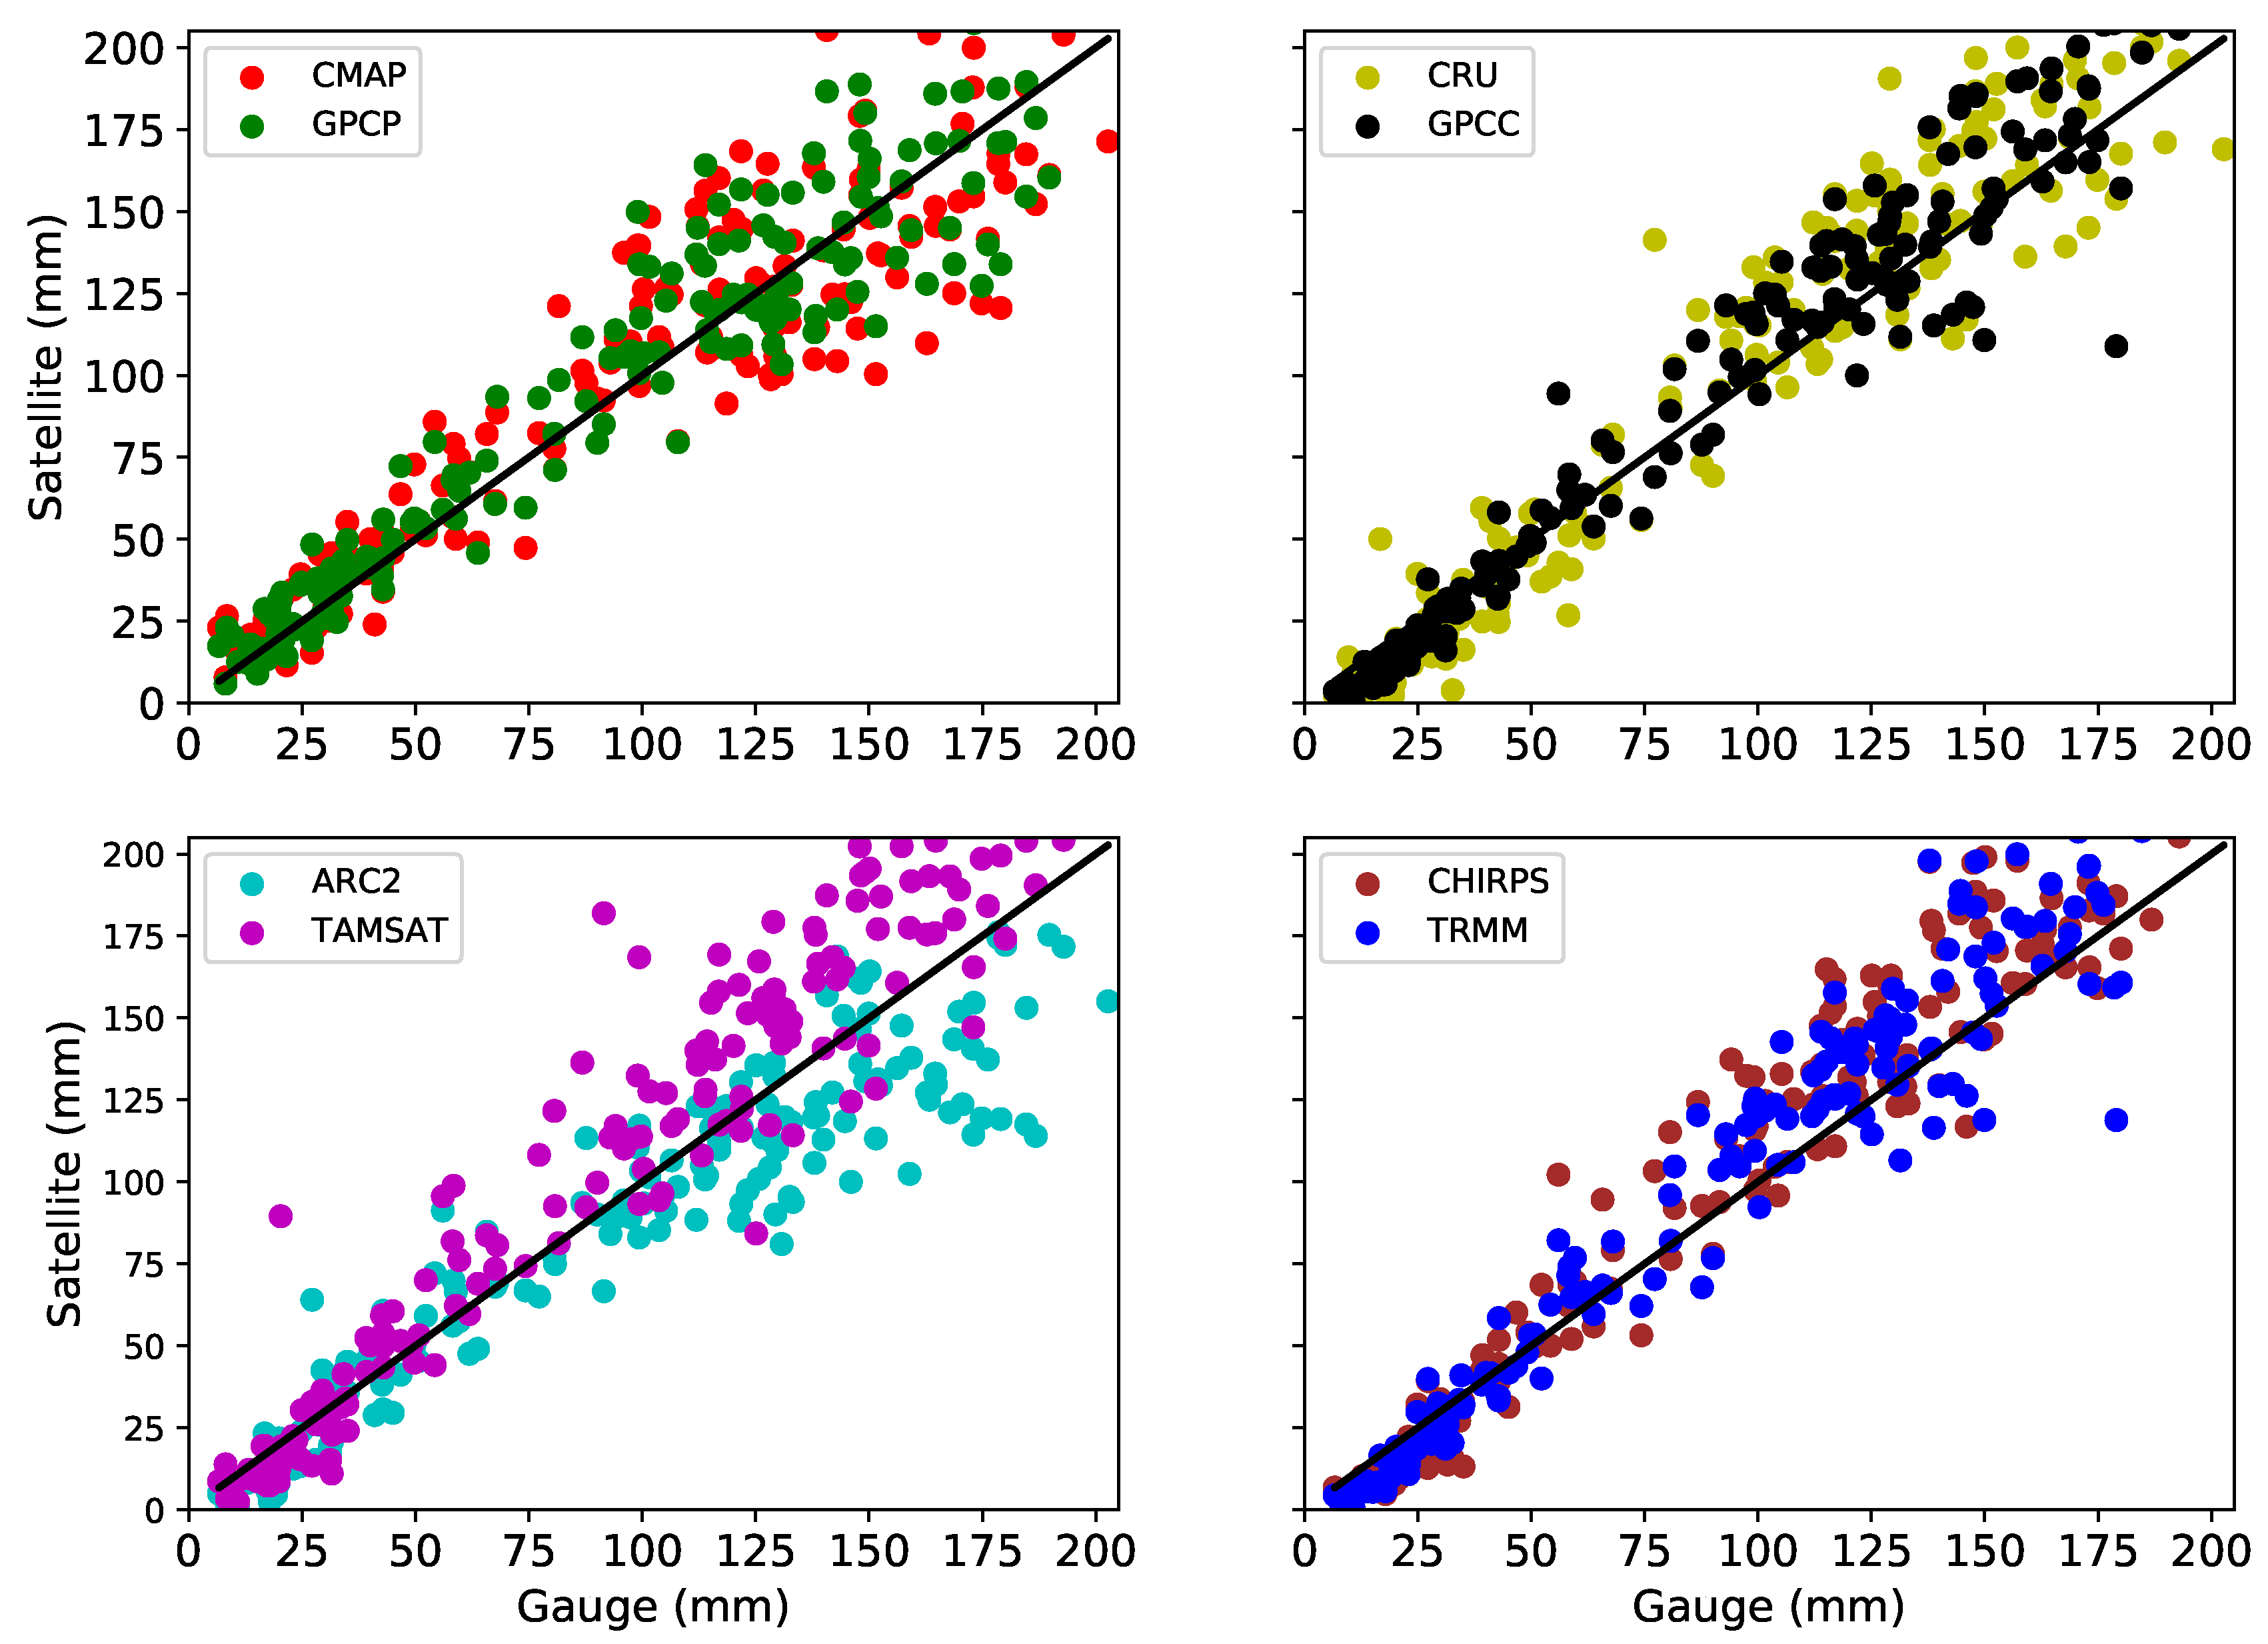
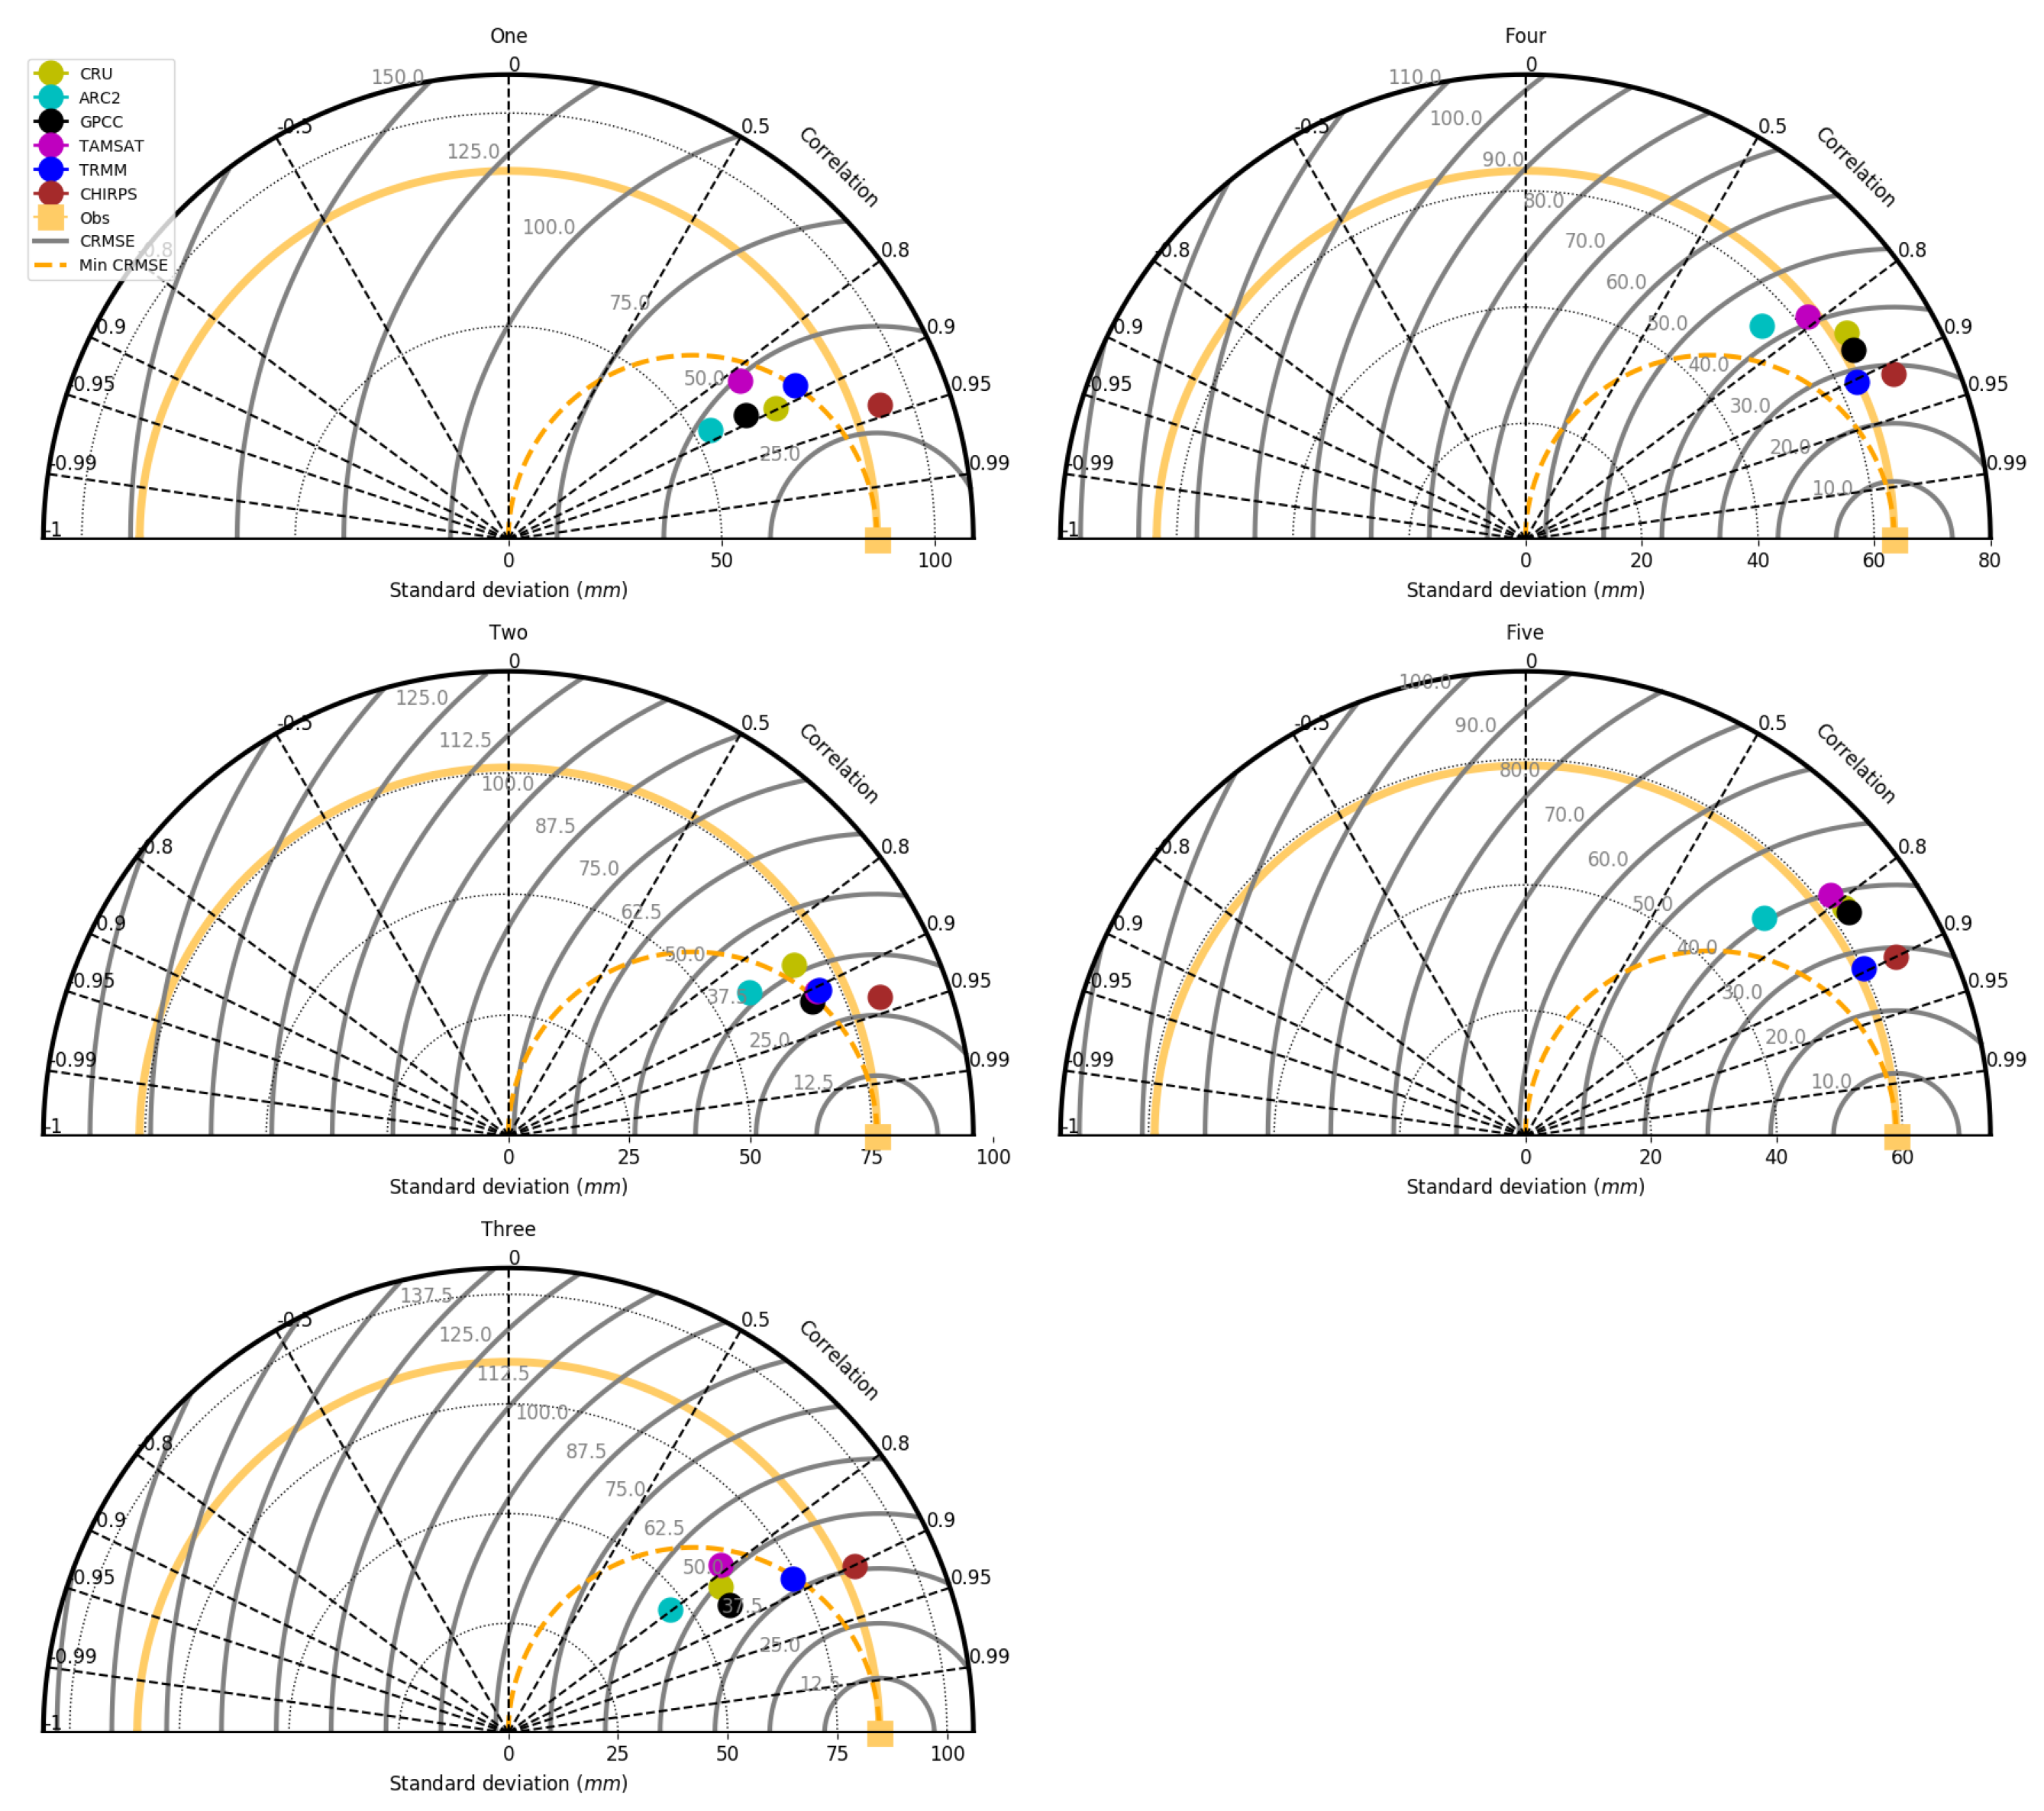
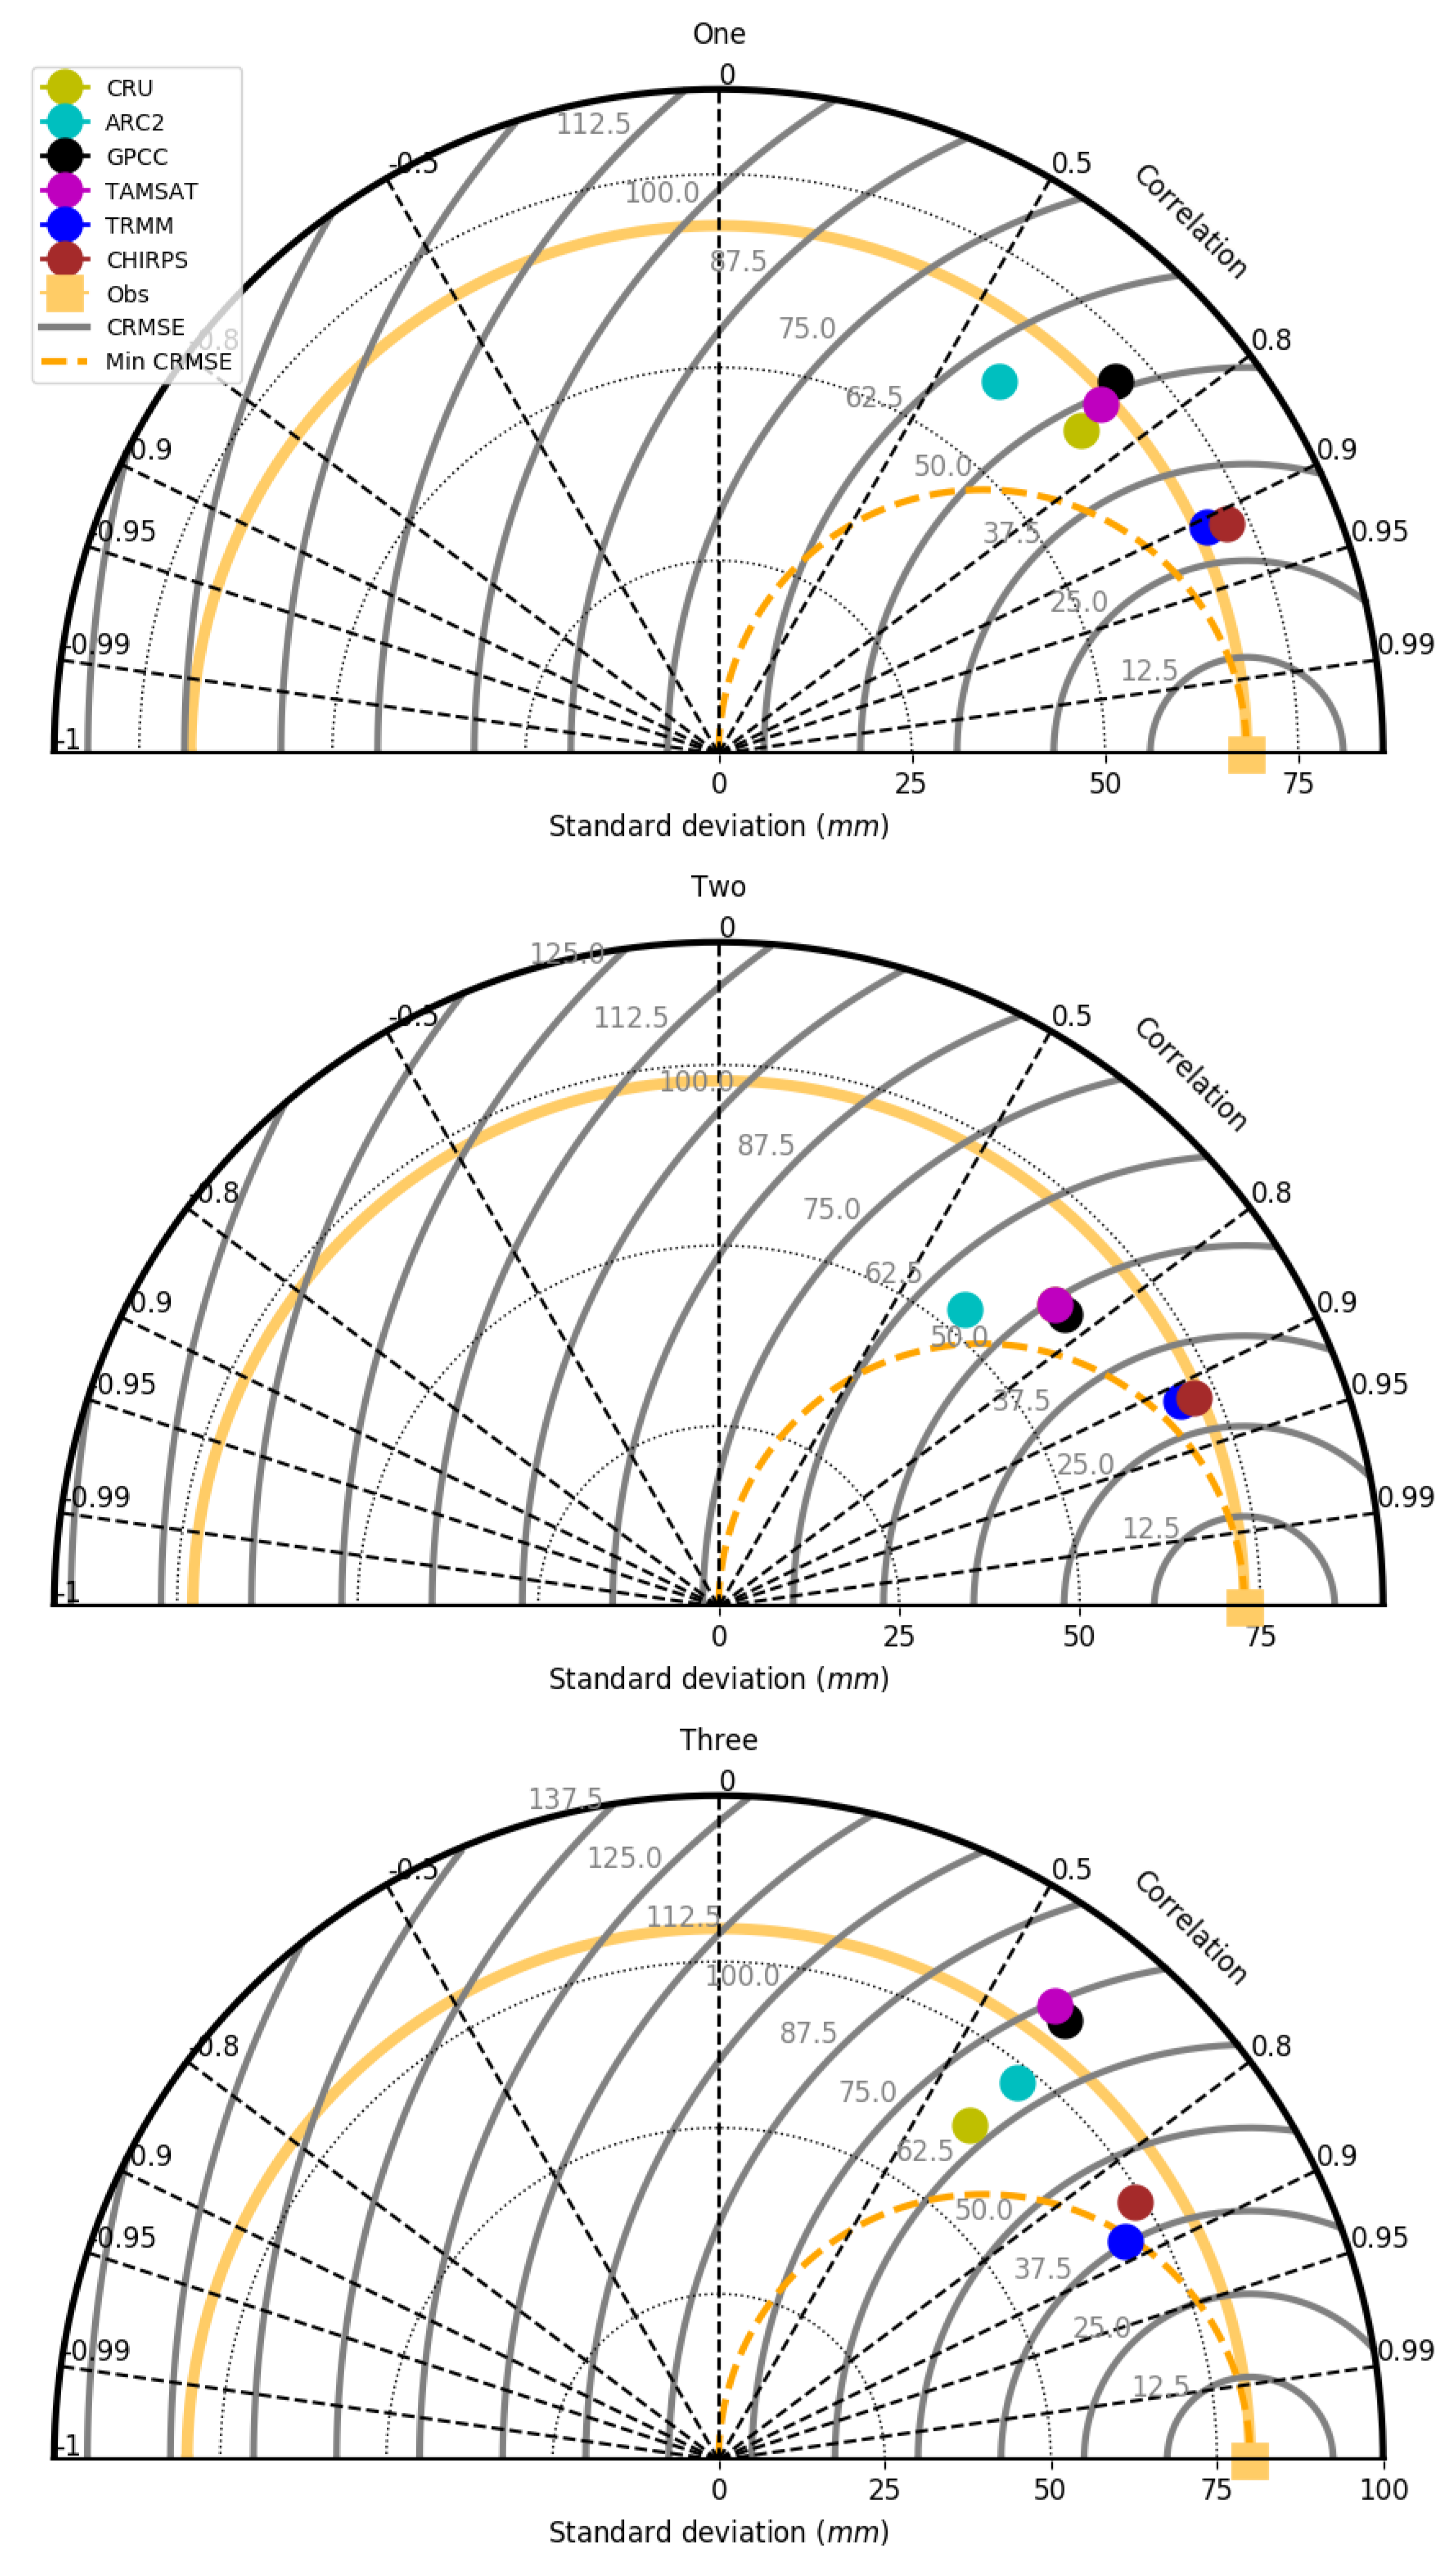
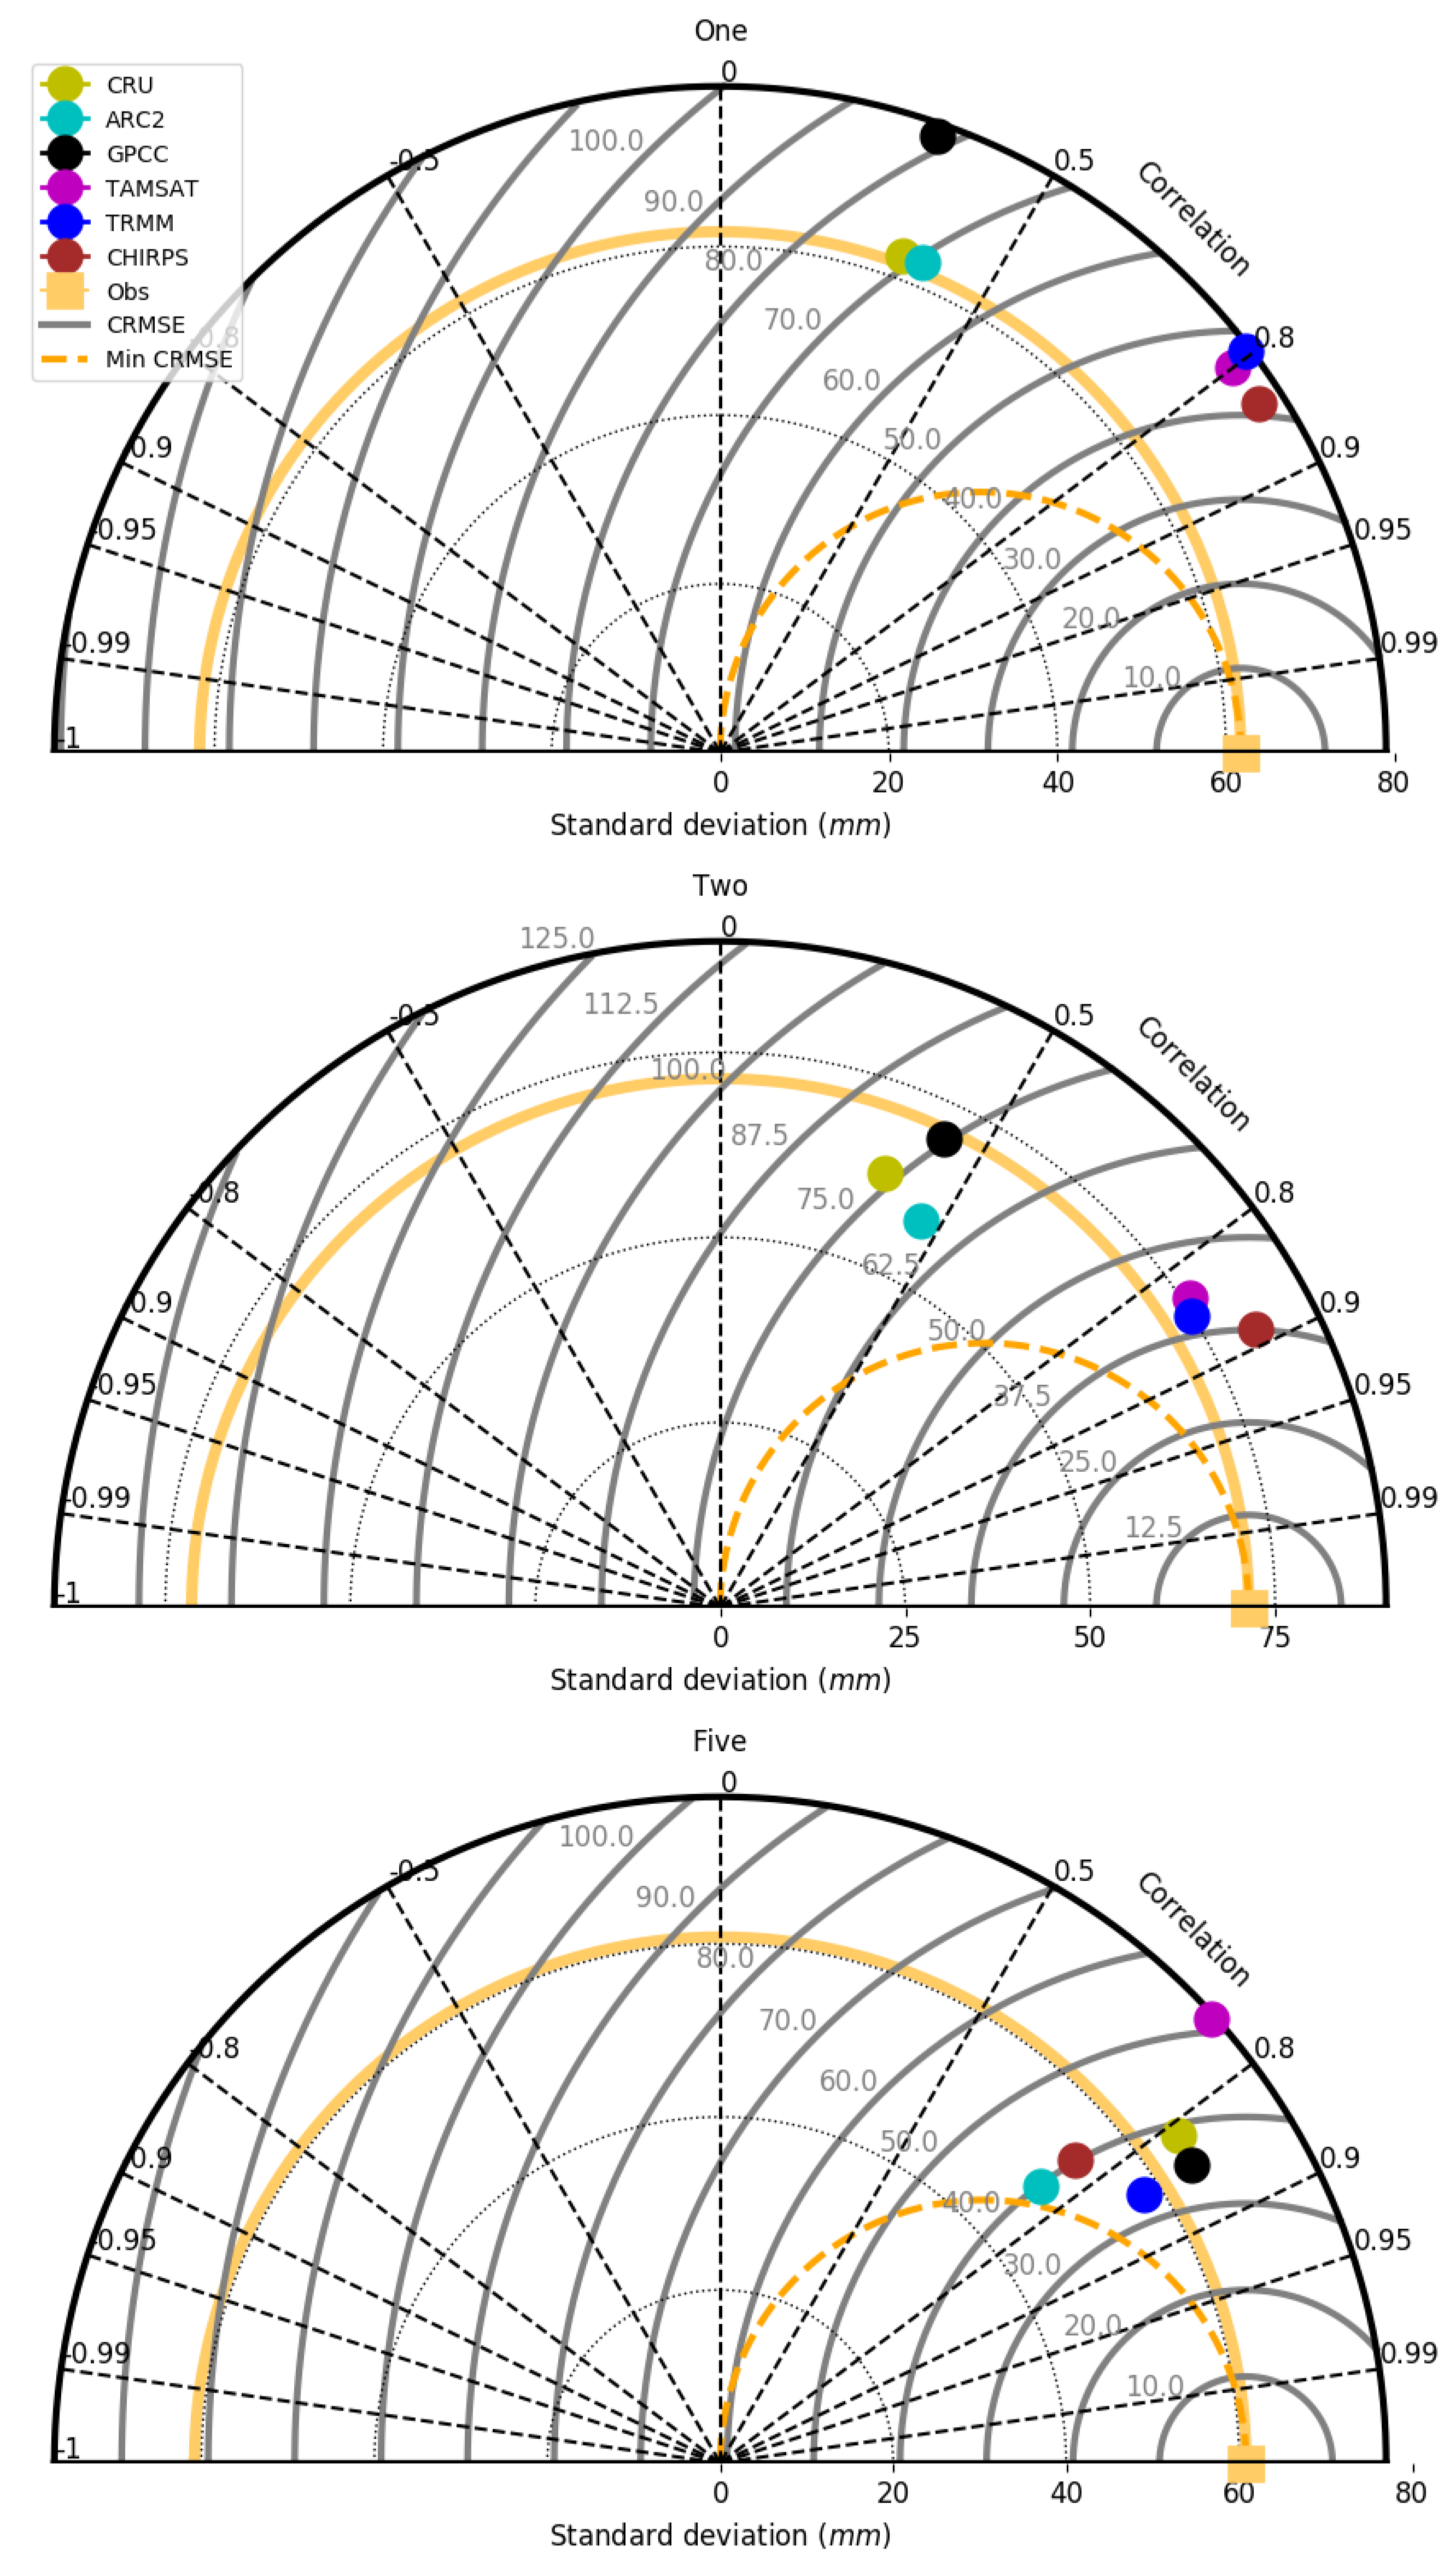
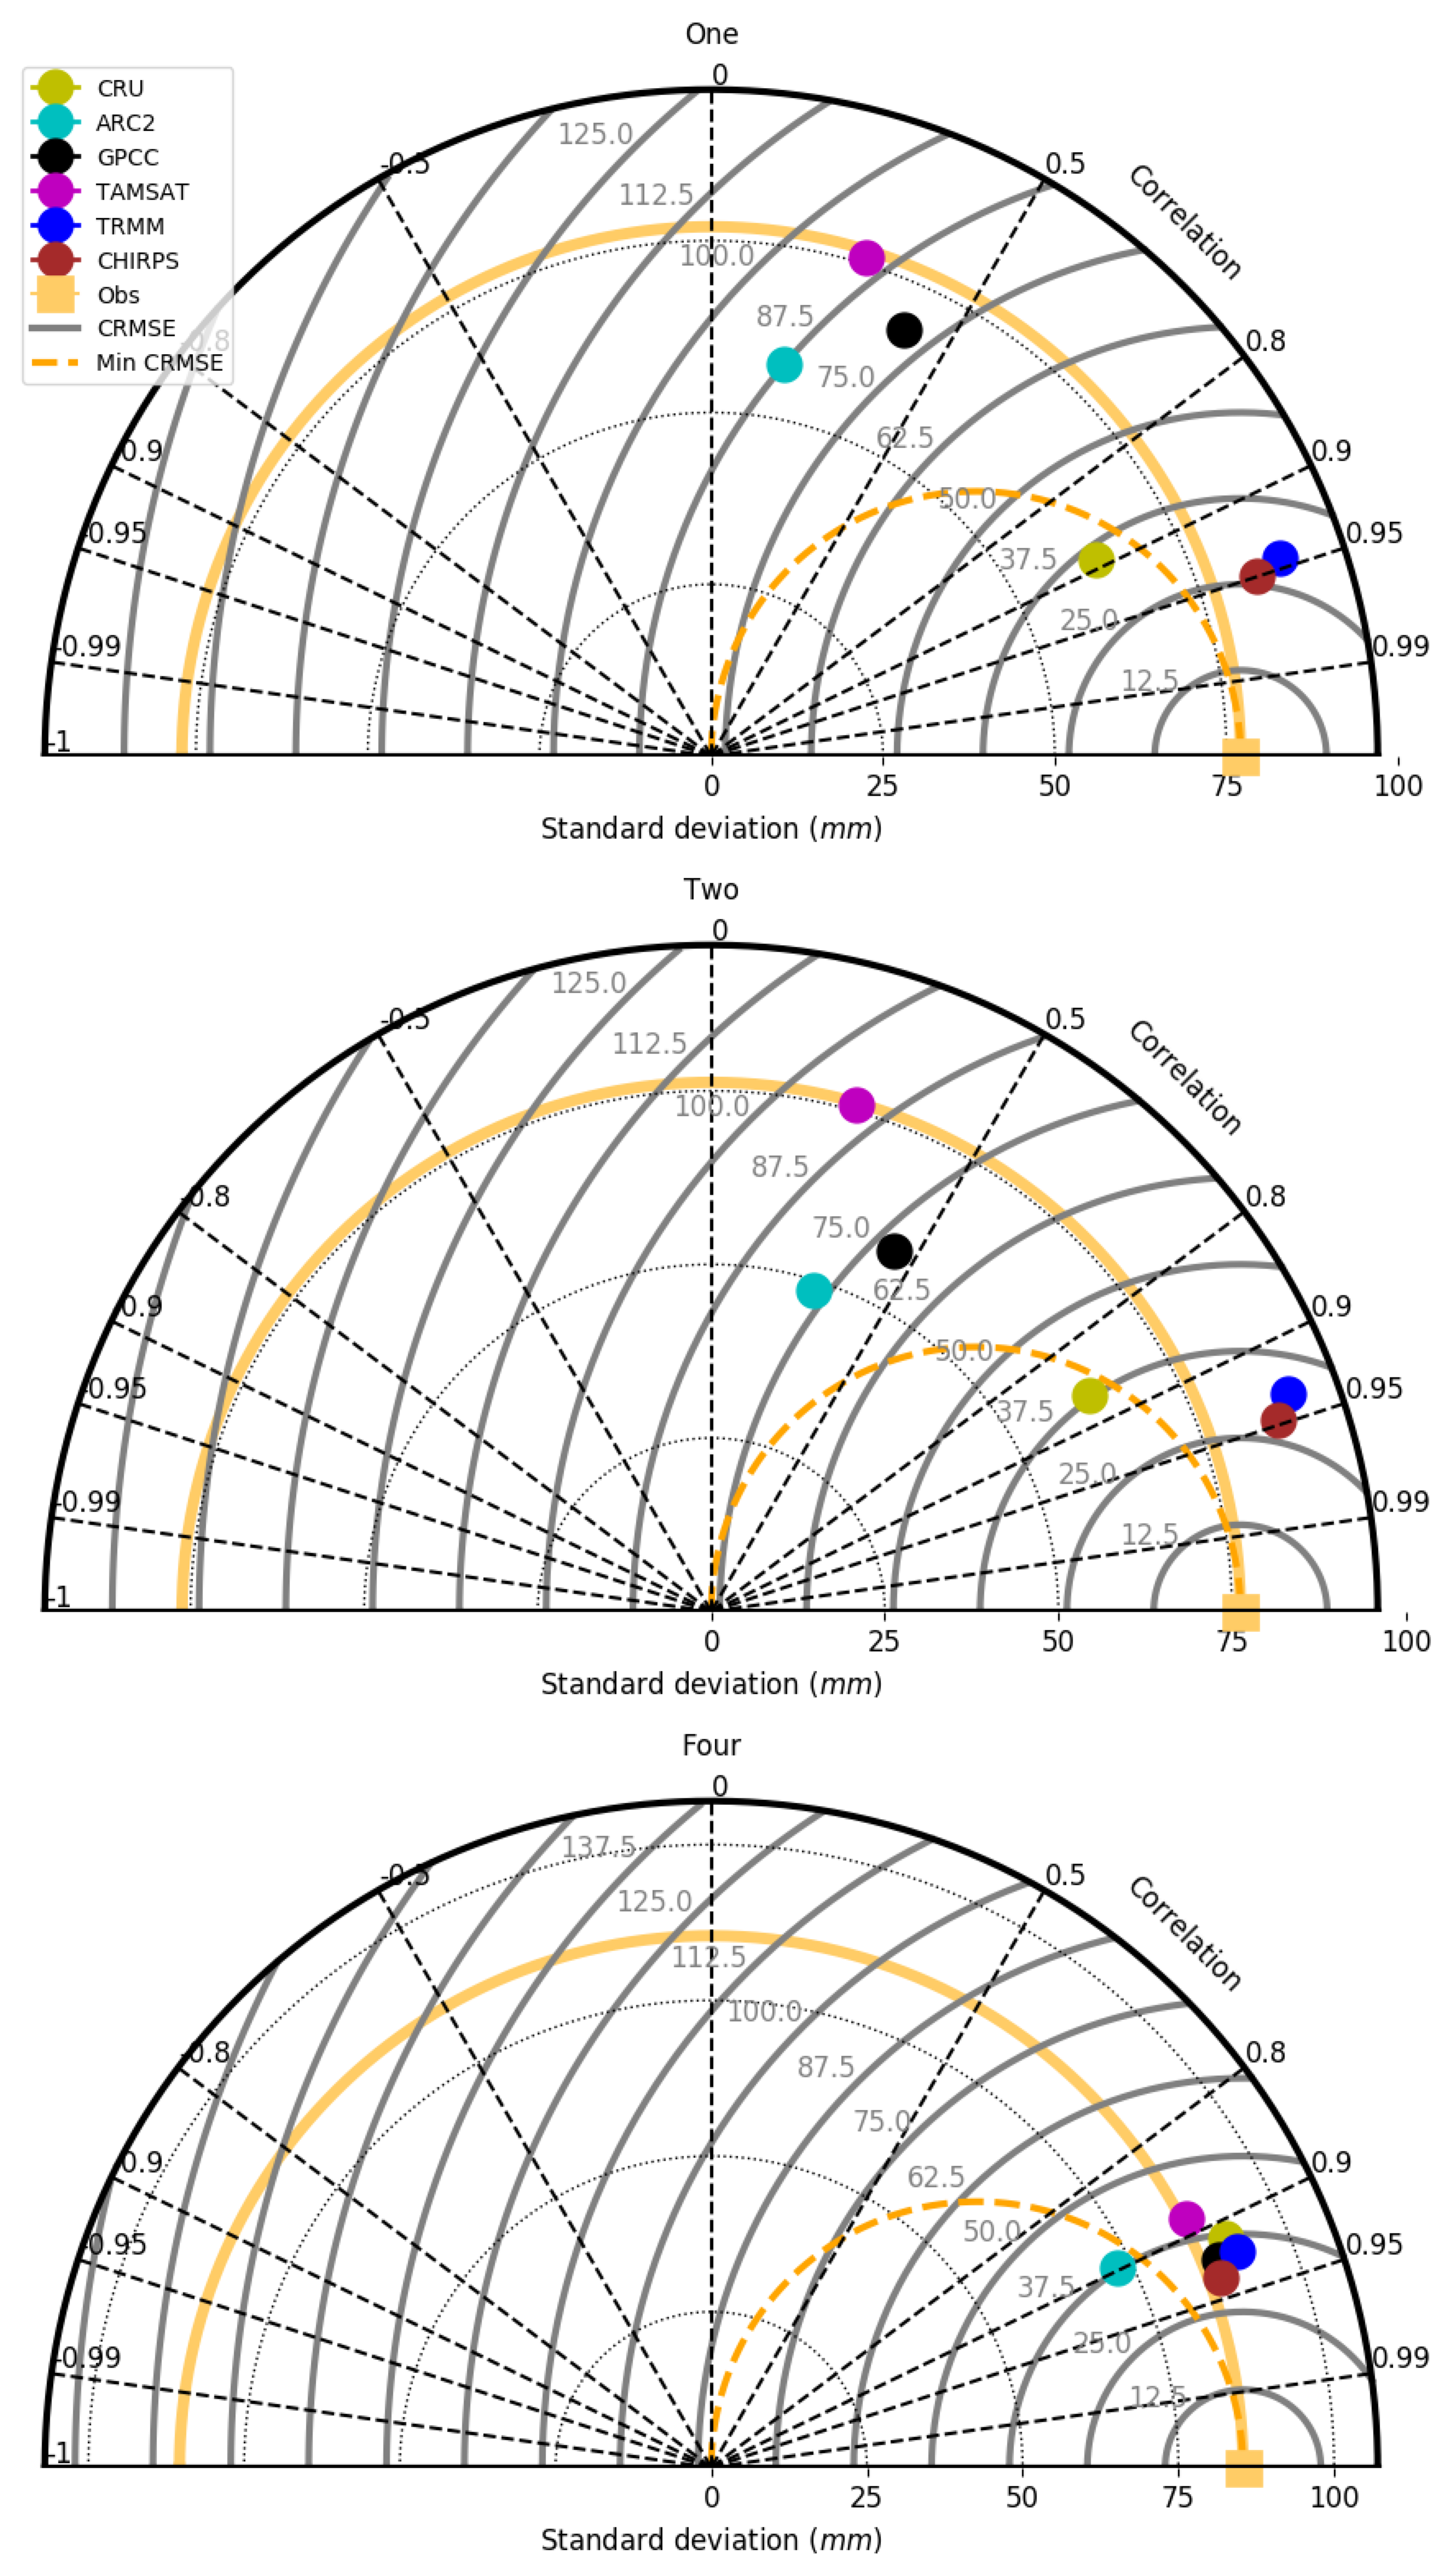
5.4. Pixel–Pixel Evaluation of VRPs
6. Conclusions
Author Contributions
Funding
Acknowledgments
Conflicts of Interest
Abbreviations
| GPCP | Global Precipitation Climatology Project |
| GPCC | Global Precipitation Climatology Center |
| TRMM | Tropical Rainfall Measuring Mission |
| CRU | Climate Research Unit |
| ARC2 | African Rainfall Climatology |
| TAMSAT | Tropical Applications of Meteorology Using Satellite Data and Ground-Based Observations |
| CHIRPS | Climate Hazards Group Infra-Red Precipitation with Station Data |
| CMAP | Climate Prediction Center (CPC) Merged Analysis of Precipitation |
| VRP | Validated Rainfall Product |
References
- Amekudzi, L.K.; Yamba, E.I.; Preko, K.; Asare, E.O.; Aryee, J.; Baidu, M.; Codjoe, S.N. Variabilities in rainfall onset, cessation, and length of rainy season for the various agro-ecological zones of Ghana. Climate 2015, 3, 416–434. [Google Scholar] [CrossRef]
- Aryee, J.; Amekudzi, L.; Quansah, E.; Klutse, N.; Atiah, W.; Yorke, C. Development of high spatial resolution rainfall data for Ghana. Int. J. Climatol. 2018, 38, 1201–1215. [Google Scholar] [CrossRef]
- Atiah, W.A.; Tsidu, G.M.; Amekudzi, L.; Yorke, C. Trends and interannual variability of extreme rainfall indices over Ghana, West Africa. Theor. Appl. Climatol. 2020, 1–15. [Google Scholar] [CrossRef]
- Manzanas, R.; Amekudzi, L.; Preko, K.; Herrera, S.; Gutiérrez, J. Precipitation variability and trends in Ghana: An intercomparison of observational and reanalysis products. Clim. Chang. 2014, 124, 805–819. [Google Scholar] [CrossRef] [Green Version]
- Atiah, W.A.; Amekudzi, L.K.; Quansah, E.; Preko, K. The Spatio-Temporal Variability of Rainfall over the Agro-Ecological zones of Ghana. Atmos. Clim. Sci. 2019, 9, 527. [Google Scholar] [CrossRef] [Green Version]
- Sanogo, S.; Fink, A.H.; Omotosho, J.A.; Ba, A.; Redl, R.; Ermert, V. Spatio-temporal characteristics of the recent rainfall recovery in West Africa. Int. J. Climatol. 2015, 35, 4589–4605. [Google Scholar] [CrossRef]
- Kotchoni, D.V.; Vouillamoz, J.M.; Lawson, F.M.; Adjomayi, P.; Boukari, M.; Taylor, R.G. Relationships between rainfall and groundwater recharge in seasonally humid Benin: A comparative analysis of long-term hydrographs in sedimentary and crystalline aquifers. Hydrogeol. J. 2019, 27, 447–457. [Google Scholar] [CrossRef] [Green Version]
- Worqlul, A.W.; Yen, H.; Collick, A.S.; Tilahun, S.A.; Langan, S.; Steenhuis, T.S. Evaluation of CFSR, TMPA 3B42, and ground-based rainfall data as input for hydrological models, in data-scarce regions: The upper Blue Nile Basin, Ethiopia. Catena 2017, 152, 242–251. [Google Scholar] [CrossRef]
- Breinl, K.; Di Baldassarre, G.; Lopez, M.G.; Hagenlocher, M.; Vico, G.; Rutgersson, A. Can weather generation capture precipitation patterns across different climates, spatial scales, and under data scarcity? Sci. Rep. 2017, 7, 1–12. [Google Scholar] [CrossRef] [Green Version]
- Nicholson, S.E. The West African Sahel: A review of recent studies on the rainfall regime and its interannual variability. ISRN Meteorol. 2013, 2013. [Google Scholar] [CrossRef]
- Stocker, T. Climate Change 2013: The Physical Science Basis: Working Group I Contribution to the Fifth Assessment Report of the Intergovernmental Panel on Climate Change; Cambridge University Press: Cambridge, UK, 2014. [Google Scholar]
- Bayissa, Y.; Tadesse, T.; Demisse, G.; Shiferaw, A. Evaluation of satellite-based rainfall estimates and application to monitor meteorological drought for the Upper Blue Nile Basin, Ethiopia. Remote Sens. 2017, 9, 669. [Google Scholar] [CrossRef] [Green Version]
- Maidment, R.I.; Grimes, D.; Black, E.; Tarnavsky, E.; Young, M.; Greatrex, H.; Allan, R.P.; Stein, T.; Nkonde, E.; Senkunda, S.; et al. A new, long-term daily satellite-based rainfall dataset for operational monitoring in Africa. Sci. Data 2017, 4, 170063. [Google Scholar] [CrossRef]
- Cattani, E.; Merino, A.; Levizzani, V. Evaluation of monthly satellite-derived precipitation products over East Africa. J. Hydrometeorol. 2016, 17, 2555–2573. [Google Scholar] [CrossRef]
- Kirstetter, P.E.; Hong, Y.; Gourley, J.J.; Cao, Q.; Schwaller, M.; Petersen, W. Research framework to bridge from the Global Precipitation Measurement Mission core satellite to the constellation sensors using ground-radar-based national mosaic QPE. Remote Sens. Terr. Water Cycle 2014, 61–79. [Google Scholar] [CrossRef]
- Gosset, M.; Viarre, J.; Quantin, G.; Alcoba, M. Evaluation of several rainfall products used for hydrological applications over West Africa using two high-resolution gauge networks. Q. J. R. Meteorol. Soc. 2013, 139, 923–940. [Google Scholar] [CrossRef]
- Schneider, U.; Finger, P.; Meyer-Christoffer, A.; Rustemeier, E.; Ziese, M.; Becker, A. Evaluating the hydrological cycle over land using the newly-corrected precipitation climatology from the Global Precipitation Climatology Centre (GPCC). Atmosphere 2017, 8, 52. [Google Scholar] [CrossRef] [Green Version]
- Schneider, U.; Ziese, M.; Meyer-Christoffer, A.; Finger, P.; Rustemeier, E.; Becker, A. The new portfolio of global precipitation data products of the Global Precipitation Climatology Centre suitable to assess and quantify the global water cycle and resources. Proc. Int. Assoc. Hydrol. Sci. 2016, 374, 29. [Google Scholar] [CrossRef] [Green Version]
- Dembélé, M.; Zwart, S.J. Evaluation and comparison of satellite-based rainfall products in Burkina Faso, West Africa. Int. J. Remote Sens. 2016, 37, 3995–4014. [Google Scholar] [CrossRef] [Green Version]
- Akinsanola, A.; Ogunjobi, K.; Ajayi, V.; Adefisan, E.; Omotosho, J.; Sanogo, S. Comparison of five gridded precipitation products at climatological scales over West Africa. Meteorol. Atmos. Phys. 2017, 129, 669–689. [Google Scholar] [CrossRef]
- Thiemig, V.; Rojas, R.; Zambrano-Bigiarini, M.; Levizzani, V.; De Roo, A. Validation of satellite-based precipitation products over sparsely gauged African river basins. J. Hydrometeorol. 2012, 13, 1760–1783. [Google Scholar] [CrossRef]
- Funk, C.C.; Peterson, P.J.; Landsfeld, M.F.; Pedreros, D.H.; Verdin, J.P.; Rowland, J.D.; Romero, B.E.; Husak, G.J.; Michaelsen, J.C.; Verdin, A.P.; et al. A quasi-global precipitation time series for drought monitoring. US Geol. Surv. Data Ser. 2014, 832. [Google Scholar] [CrossRef]
- Ashouri, H.; Hsu, K.L.; Sorooshian, S.; Braithwaite, D.K.; Knapp, K.R.; Cecil, L.D.; Nelson, B.R.; Prat, O.P. PERSIANN-CDR: Daily precipitation climate data record from multisatellite observations for hydrological and climate studies. Bull. Am. Meteorol. Soc. 2015, 96, 69–83. [Google Scholar] [CrossRef] [Green Version]
- Kimani, M.W.; Hoedjes, J.C.; Su, Z. An assessment of satellite-derived rainfall products relative to ground observations over East Africa. Remote Sens. 2017, 9, 430. [Google Scholar] [CrossRef] [Green Version]
- Novella, N.S.; Thiaw, W.M. African rainfall climatology version 2 for famine early warning systems. J. Appl. Meteorol. Climatol. 2013, 52, 588–606. [Google Scholar] [CrossRef]
- Usman, M.; Nichol, J.E.; Ibrahim, A.T.; Buba, L.F. A spatio-temporal analysis of trends in rainfall from long term satellite rainfall products in the Sudano Sahelian zone of Nigeria. Agric. For. Meteorol. 2018, 260, 273–286. [Google Scholar] [CrossRef]
- Amekudzi, L.K.; Osei, M.A.; Atiah, W.A.; Aryee, J.N.; Ahiataku, M.A.; Quansah, E.; Preko, K.; Danuor, S.K.; Fink, A.H. Validation of TRMM and FEWS satellite rainfall estimates with rain gauge measurement over Ashanti region, Ghana. Atmos. Clim. Sci. 2016, 6, 500. [Google Scholar] [CrossRef] [Green Version]
- Fink, A.H.; Engel, T.; Ermert, V.; van der Linden, R.; Schneidewind, M.; Redl, R.; Afiesimama, E.; Thiaw, W.M.; Yorke, C.; Evans, M.; et al. Mean climate and seasonal cycle. Meteorol. Trop. West Afr. Forecast. Handb. 2017, 1–39. [Google Scholar] [CrossRef]
- Maranan, M.; Fink, A.H.; Knippertz, P. Rainfall types over southern West Africa: Objective identification, climatology and synoptic environment. Q. J. R. Meteorol. Soc. 2018, 144, 1628–1648. [Google Scholar] [CrossRef] [Green Version]
- Adler, R.F.; Sapiano, M.R.; Huffman, G.J.; Wang, J.J.; Gu, G.; Bolvin, D.; Chiu, L.; Schneider, U.; Becker, A.; Nelkin, E.; et al. The Global Precipitation Climatology Project (GPCP) monthly analysis (new version 2.3) and a review of 2017 global precipitation. Atmosphere 2018, 9, 138. [Google Scholar] [CrossRef] [Green Version]
- Adler, R.; Sapiano, M.; Huffman, G.; Bolvin, D.; Gu, G.; Wang, J.; Nelkin, E.; Xie, P.; Chiu, L.; Ferraro, R.; et al. The New Version 2.3 of the Global Precipitation Climatology Project (GPCP) Monthly Analysis Product; University of Maryland: College Park, MD, USA, 2016; pp. 1072–1084. [Google Scholar]
- Schneider, U.; Becker, A.; Finger, P.; Meyer-Christoffer, A.; Ziese, M.; Rudolf, B. GPCC’s new land surface precipitation climatology based on quality-controlled in situ data and its role in quantifying the global water cycle. Theor. Appl. Climatol. 2014, 115, 15–40. [Google Scholar] [CrossRef] [Green Version]
- Judewicz, M.G.; González, S.A.; Echeverría, N.I.; Fischer, J.R.; Carrica, D.O. Generalized predictive current control (GPCC) for grid-tie three-phase inverters. IEEE Trans. Ind. Electron. 2015, 63, 4475–4484. [Google Scholar] [CrossRef]
- Trenberth, K.E.; Dai, A.; van der Schrier, G.; Jones, P.D.; Barichivich, J.; Briffa, K.R.; Sheffield, J. Global warming and changes in drought. Nat. Clim. Chang. 2014, 4, 17–22. [Google Scholar] [CrossRef]
- Harris, I.; Jones, P.; Osborn, T.; Lister, D. Updated high-resolution grids of monthly climatic observations–the CRU TS3. 10 Dataset. Int. J. Climatol. 2014, 34, 623–642. [Google Scholar] [CrossRef] [Green Version]
- Behrangi, A.; Stephens, G.; Adler, R.F.; Huffman, G.J.; Lambrigtsen, B.; Lebsock, M. An update on the oceanic precipitation rate and its zonal distribution in light of advanced observations from space. J. Clim. 2014, 27, 3957–3965. [Google Scholar] [CrossRef] [Green Version]
- Khan, A.; Masud, T.; Attaullah, H.; Khan, M. Accuracy assessment of gridded precipitation datasets in the Upper Indus Basin. In Proceedings of the EGU General Assembly Conference Abstracts, Vienna, Austria, 23–28 April 2017; Volume 19, p. 11897. [Google Scholar]
- Okoro, U.K.; Chen, W.; Chineke, C.; Nwofor, O. Comparative analysis of gridded datasets and gauge measurements of rainfall in the Niger Delta region. Res. J. Environ. Sci. 2014, 8, 373–390. [Google Scholar] [CrossRef] [Green Version]
- Seyama, E.S.; Masocha, M.; Dube, T. Evaluation of TAMSAT satellite rainfall estimates for southern Africa: A comparative approach. Phys. Chem. Earth Parts A/B/C 2019, 112, 141–153. [Google Scholar] [CrossRef]
- Quesada-Montano, B.; Wetterhall, F.; Westerberg, I.K.; Hidalgo, H.G.; Halldin, S. Characterising droughts in Central America with uncertain hydro-meteorological data. Theor. Appl. Climatol. 2019, 137, 2125–2138. [Google Scholar] [CrossRef] [Green Version]
- Zhang, W.; Brandt, M.; Guichard, F.; Tian, Q.; Fensholt, R. Using long-term daily satellite based rainfall data (1983–2015) to analyze spatio-temporal changes in the sahelian rainfall regime. J. Hydrol. 2017, 550, 427–440. [Google Scholar] [CrossRef] [Green Version]
- Tan, M.L.; Ibrahim, A.L.; Duan, Z.; Cracknell, A.P.; Chaplot, V. Evaluation of six high-resolution satellite and ground-based precipitation products over Malaysia. Remote Sens. 2015, 7, 1504–1528. [Google Scholar] [CrossRef] [Green Version]
- Dinku, T.; Funk, C.; Peterson, P.; Maidment, R.; Tadesse, T.; Gadain, H.; Ceccato, P. Validation of the CHIRPS satellite rainfall estimates over eastern Africa. Q. J. R. Meteorol. Soc. 2018, 144, 292–312. [Google Scholar] [CrossRef] [Green Version]
- Maidment, R.I.; Grimes, D.; Allan, R.P.; Tarnavsky, E.; Stringer, M.; Hewison, T.; Roebeling, R.; Black, E. The 30 year TAMSAT African rainfall climatology and time series (TARCAT) data set. J. Geophys. Res. Atmos. 2014, 119, 10–619. [Google Scholar] [CrossRef] [Green Version]
- Pfeifroth, U.; Trentmann, J.; Fink, A.H.; Ahrens, B. Evaluating Satellite-Based Diurnal Cycles of Precipitation in the African Tropics. J. Appl. Meteorol. Climatol. 2016, 55, 23–39. [Google Scholar] [CrossRef] [Green Version]
- Dinku, T.; Ceccato, P.; Connor, S.J. Challenges of satellite rainfall estimation over mountainous and arid parts of east Africa. Int. J. Remote Sens. 2011, 32, 5965–5979. [Google Scholar] [CrossRef]
- Toté, C.; Patricio, D.; Boogaard, H.; Van der Wijngaart, R.; Tarnavsky, E.; Funk, C. Evaluation of satellite rainfall estimates for drought and flood monitoring in Mozambique. Remote Sens. 2015, 7, 1758–1776. [Google Scholar] [CrossRef] [Green Version]
- Jobard, I.; Chopin, F.; Bergès, J.C.; Roca, R. An intercomparison of 10-day satellite precipitation products during West African monsoon. Int. J. Remote Sens. 2011, 32, 2353–2376. [Google Scholar] [CrossRef]
- Sevruk, B. Methods of Correction for Systematic Error in Point Precipitation Measurement for Operational Use; World Meteorological Organization: Geneva, Switzerland, 1982. [Google Scholar]


| Dataset | Spatial Resolution [°] | Temporal Resolution | Product Type | Coverage | References | ||
|---|---|---|---|---|---|---|---|
| Original | Used | Original | Used | ||||
| CMAP | 2.50 | 2.50 | Monthly | Monthly | Satellites + gauge | Global | Khan et al. [37] |
| GPCP V2.2 | 2.50 | 2.50 | Monthly | Monthly | Satellites + gauge | Global | Adler et al. [30] |
| GPCC V6 | 0.50 | 0.50 | Monthly | Monthly | Gauge-only | Global | Schneider et al. [17] |
| ARC2 | 0.10 | 0.50 | Daily | Monthly | Satellites + gauge | Africa | Zhang et al. [41] |
| CRU TS3.21 | 0.50 | 0.50 | Monthly | Monthly | Gauge-only | Global | Harris et al. [35] |
| TAMSAT V3 | 0.0375 | 0.50 | Daily | Monthly | Satellites + gauge | Africa | Seyama et al. [39] |
| TRMM 3B43 | 0.25 | 0.50 | Monthly | Monthly | Satellites + gauge | Tropics | Schneider et al. [17] |
| CHIRPS V2 | 0.25 | 0.50 | Daily | Monthly | Satellites + gauge | Africa | Atiah et al. [3] |
| Dataset | Savannah | Transition | Forest | Coast | Countrywide | |||||
|---|---|---|---|---|---|---|---|---|---|---|
| r | RMSE | r | RMSE | r | RMSE | r | RMSE | r | RMSE | |
| CMAP | – | – | – | – | – | – | – | – | 0.742 | 0.086 |
| GPCP | – | – | – | – | – | – | – | – | 0.784 | 0.063 |
| GPCC | 0.763 | 0.066 | 0.376 | 0.121 | 0.583 | 0.251 | 0.681 | 0.139 | 0.600 | 0.084 |
| ARC2 | 0.738 | 0.117 | 0.682 | 0.205 | 0.542 | 0.324 | 0.531 | 0.558 | 0.759 | 0.221 |
| CRU | 0.872 | 0.055 | 0.594 | 0.093 | 0.788 | 0.118 | 0.850 | 0.124 | 0.884 | 0.050 |
| TAMSAT | 0.591 | 0.080 | 0.637 | 0.082 | 0.747 | 0.092 | 0.535 | 0.138 | 0.713 | 0.075 |
| TRMM | 0.697 | 0.093 | 0.393 | 0.104 | 0.539 | 0.103 | 0.313 | 0.213 | 0.509 | 0.089 |
| CHIRPS | 0.858 | 0.059 | 0.659 | 0.084 | 0.905 | 0.068 | 0.802 | 0.070 | 0.928 | 0.042 |
| Satellite Product | RMSE | Eff | r | Bias |
|---|---|---|---|---|
| CMAP | 0.276 | 0.769 | 0.928 | 0.938 |
| GPCP | 0.217 | 0.865 | 0.953 | 0.960 |
| GPCC V5 | 0.167 | 0.936 | 0.970 | 0.967 |
| ARC2 | 0.359 | 0.643 | 0.949 | 0.824 |
| CRU | 0.169 | 0.938 | 0.970 | 0.969 |
| TAMSAT | 0.179 | 0.922 | 0.963 | 1.053 |
| TRMM | 0.171 | 0.933 | 0.966 | 0.992 |
| CHIRPS | 0.152 | 0.948 | 0.975 | 1.021 |
© 2020 by the authors. Licensee MDPI, Basel, Switzerland. This article is an open access article distributed under the terms and conditions of the Creative Commons Attribution (CC BY) license (http://creativecommons.org/licenses/by/4.0/).
Share and Cite
Atiah, W.A.; Amekudzi, L.K.; Aryee, J.N.A.; Preko, K.; Danuor, S.K. Validation of Satellite and Merged Rainfall Data over Ghana, West Africa. Atmosphere 2020, 11, 859. https://doi.org/10.3390/atmos11080859
Atiah WA, Amekudzi LK, Aryee JNA, Preko K, Danuor SK. Validation of Satellite and Merged Rainfall Data over Ghana, West Africa. Atmosphere. 2020; 11(8):859. https://doi.org/10.3390/atmos11080859
Chicago/Turabian StyleAtiah, Winifred Ayinpogbilla, Leonard Kofitse Amekudzi, Jeffrey Nii Armah Aryee, Kwasi Preko, and Sylvester Kojo Danuor. 2020. "Validation of Satellite and Merged Rainfall Data over Ghana, West Africa" Atmosphere 11, no. 8: 859. https://doi.org/10.3390/atmos11080859