1. Introduction
Thermal comfort is a bio-meteorological index based on the principle of heat exchange between human body and near-Earth atmosphere to evaluate human comfort in different climate conditions from the perspective of meteorology [
1]. Thermal comfort has an important impact on human society in many fields, such as public health [
2,
3], energy consumption [
4], urban planning [
5], tourism and leisure [
6]. Since the industrial revolution, the global climate is experiencing a significant change, characterized by warming [
7]. In this process, changes in climate factors such as temperature, humidity, wind speed, radiation and so on will have an impact on climate comfort. The research on climate comfort and its change can provide a scientific basis for the development of related fields and the formulation of adaptive measures. The simple thermal indices have been developed over the last 150 years. Most of them are two-parameter indices. The indices usually consist of combinations of air temperature and one of a variety of expressions for humidity for warm conditions, while for cold conditions, the combination consists typically of air temperature combined in some way with wind speed [
8]. Simple indices are easy to calculate and forecast. Therefore, they are communicated readily to the general public and stakeholders such as health service providers [
9]. However, because of their simple formulation, i.e., neglecting significant fluxes or variables, these indices can never fulfil the essential requirement. These indices only consider some of the relevant meteorological parameters and do not account for thermal physiology. They might be helpful in very specific situations [
10]. The results are often not comparable and often lead to misrepresentations of the thermal environment, and additional features such as safety thresholds have to be defined arbitrarily and cannot be transferred to other locations [
8].
In the 1960′s, under the background of the development of computer technology, the thermal biometeorology based on the heat budget models developed rapidly [
11,
12,
13,
14,
15]. Because of persistent deficiencies in relation to thermo-physiology and heat exchange theory, none of them are accepted as a fundamental standard [
8]. Stepping into the 21st century, with the high integration of multi-disciplinary techniques, on the basis of the latest scientific progress in human response-related thermo-physiological modeling over the past few decades, the Universal Thermal Climate Index (UTCI) is a combination of multi-disciplinary cutting-edge achievements, including in thermo-physiology, occupational medicine, physics, meteorology, biometeorological and environmental sciences [
8]. The UTCI attempts to extend available approaches using human heat budget models [
10,
16]. The human reaction was simulated by a multi-node model of human thermoregulation, which was integrated with an adaptive clothing model [
17]. Vinogradova [
18] found that all categories of cold and heat stress were observed in Russia, but the cold stress conditions prevailed. To optimize regionalization and assess regional-scale variations for the UTCI, a rotated empirical orthogonal function (REOF)-cluster-empirical orthogonal function (EOF) hybrid model was established in China [
19]. Yang et al. [
20] examined the spatial differentiation of China’s summer tourist destinations based on the UTCI and tourism resources data and analyzed climatic suitability. Roshan [
21] also presented a spatiotemporal analysis of bioclimatic comfort conditions for Iran and demonstrated that there is, at any point in time, a location with climatic conditions suitable for tourism. A new method based on defining comfortable calendar days was proposed to identify regions thermally suitable for sunbird tourism and their comfortable periods in China [
22].
Similarly, there are other studies that have applied other indices to assess thermal comfort in recent years. Mihaila et al. [
23] analyzed the trends of the annual series of physiological equivalent temperature (PET) data for the interval 1961–2015 in the North-East Development Region of Romania and outlined a series of changes that are likely to intervene in the relationship between climate and tourism in this region in the immediate future. Salata et al. [
24] examined the climatic conditions and outdoor thermal comfort through the Mediterranean Outdoor Comfort Index for local tourism and through the predicted mean vote for international tourism and reported a map of the entire Italian territory reporting the seasonal average values of these indexes. Climatic conditions of a vast area in Iran have been evaluated and compared by using synoptic climatic indices and the tourism climate index (TCI) together with the holiday climate index (HCI) in different months [
25]. Similar thermal comfort assessments have been studied in Hungary [
26], Algeria [
27], Croatia [
28], etc. However, it was shown that these indices express bioclimatic conditions reasonably only under specific meteorological situations. For example, climate index for tourism (CIT) rates the climate resource for activities that are highly climate/weather-sensitive, specifically, beach “sun, sea and sand” holidays [
29]. UTCI represents specific climates, weather and locations much better. UTCI is very sensitive to changes in ambient stimuli and depicts temporal variability of thermal conditions well [
30].
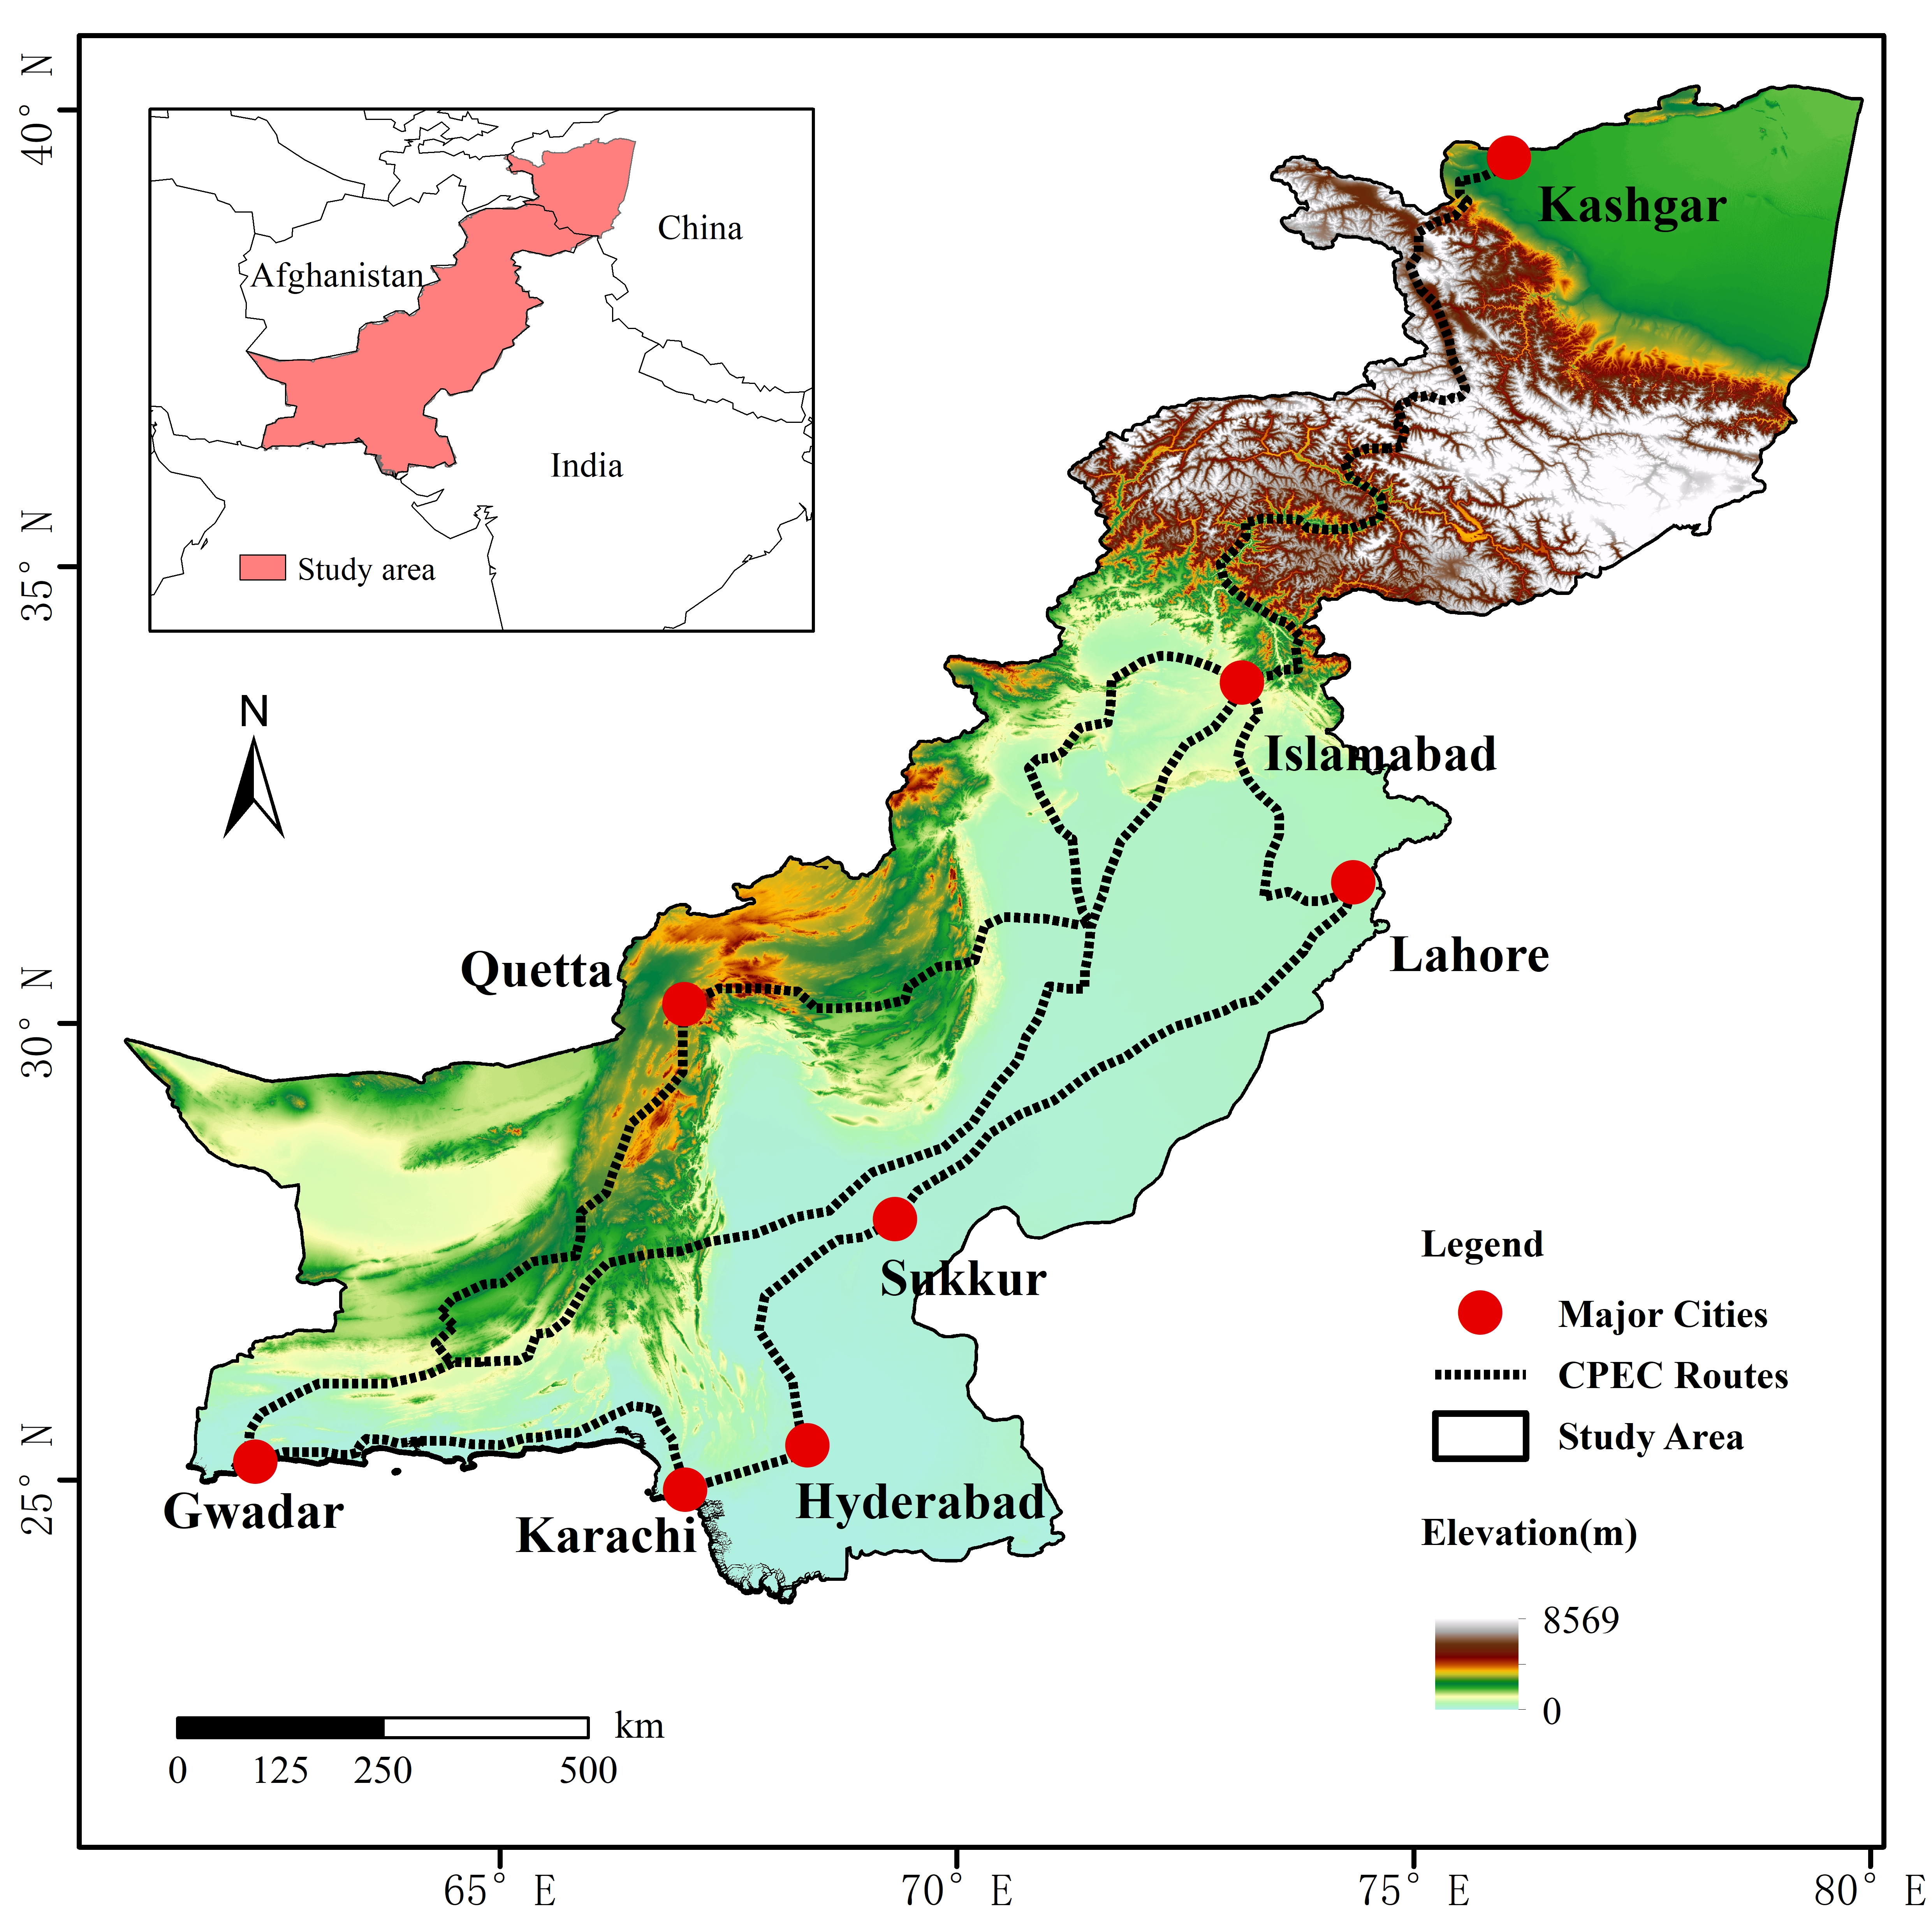
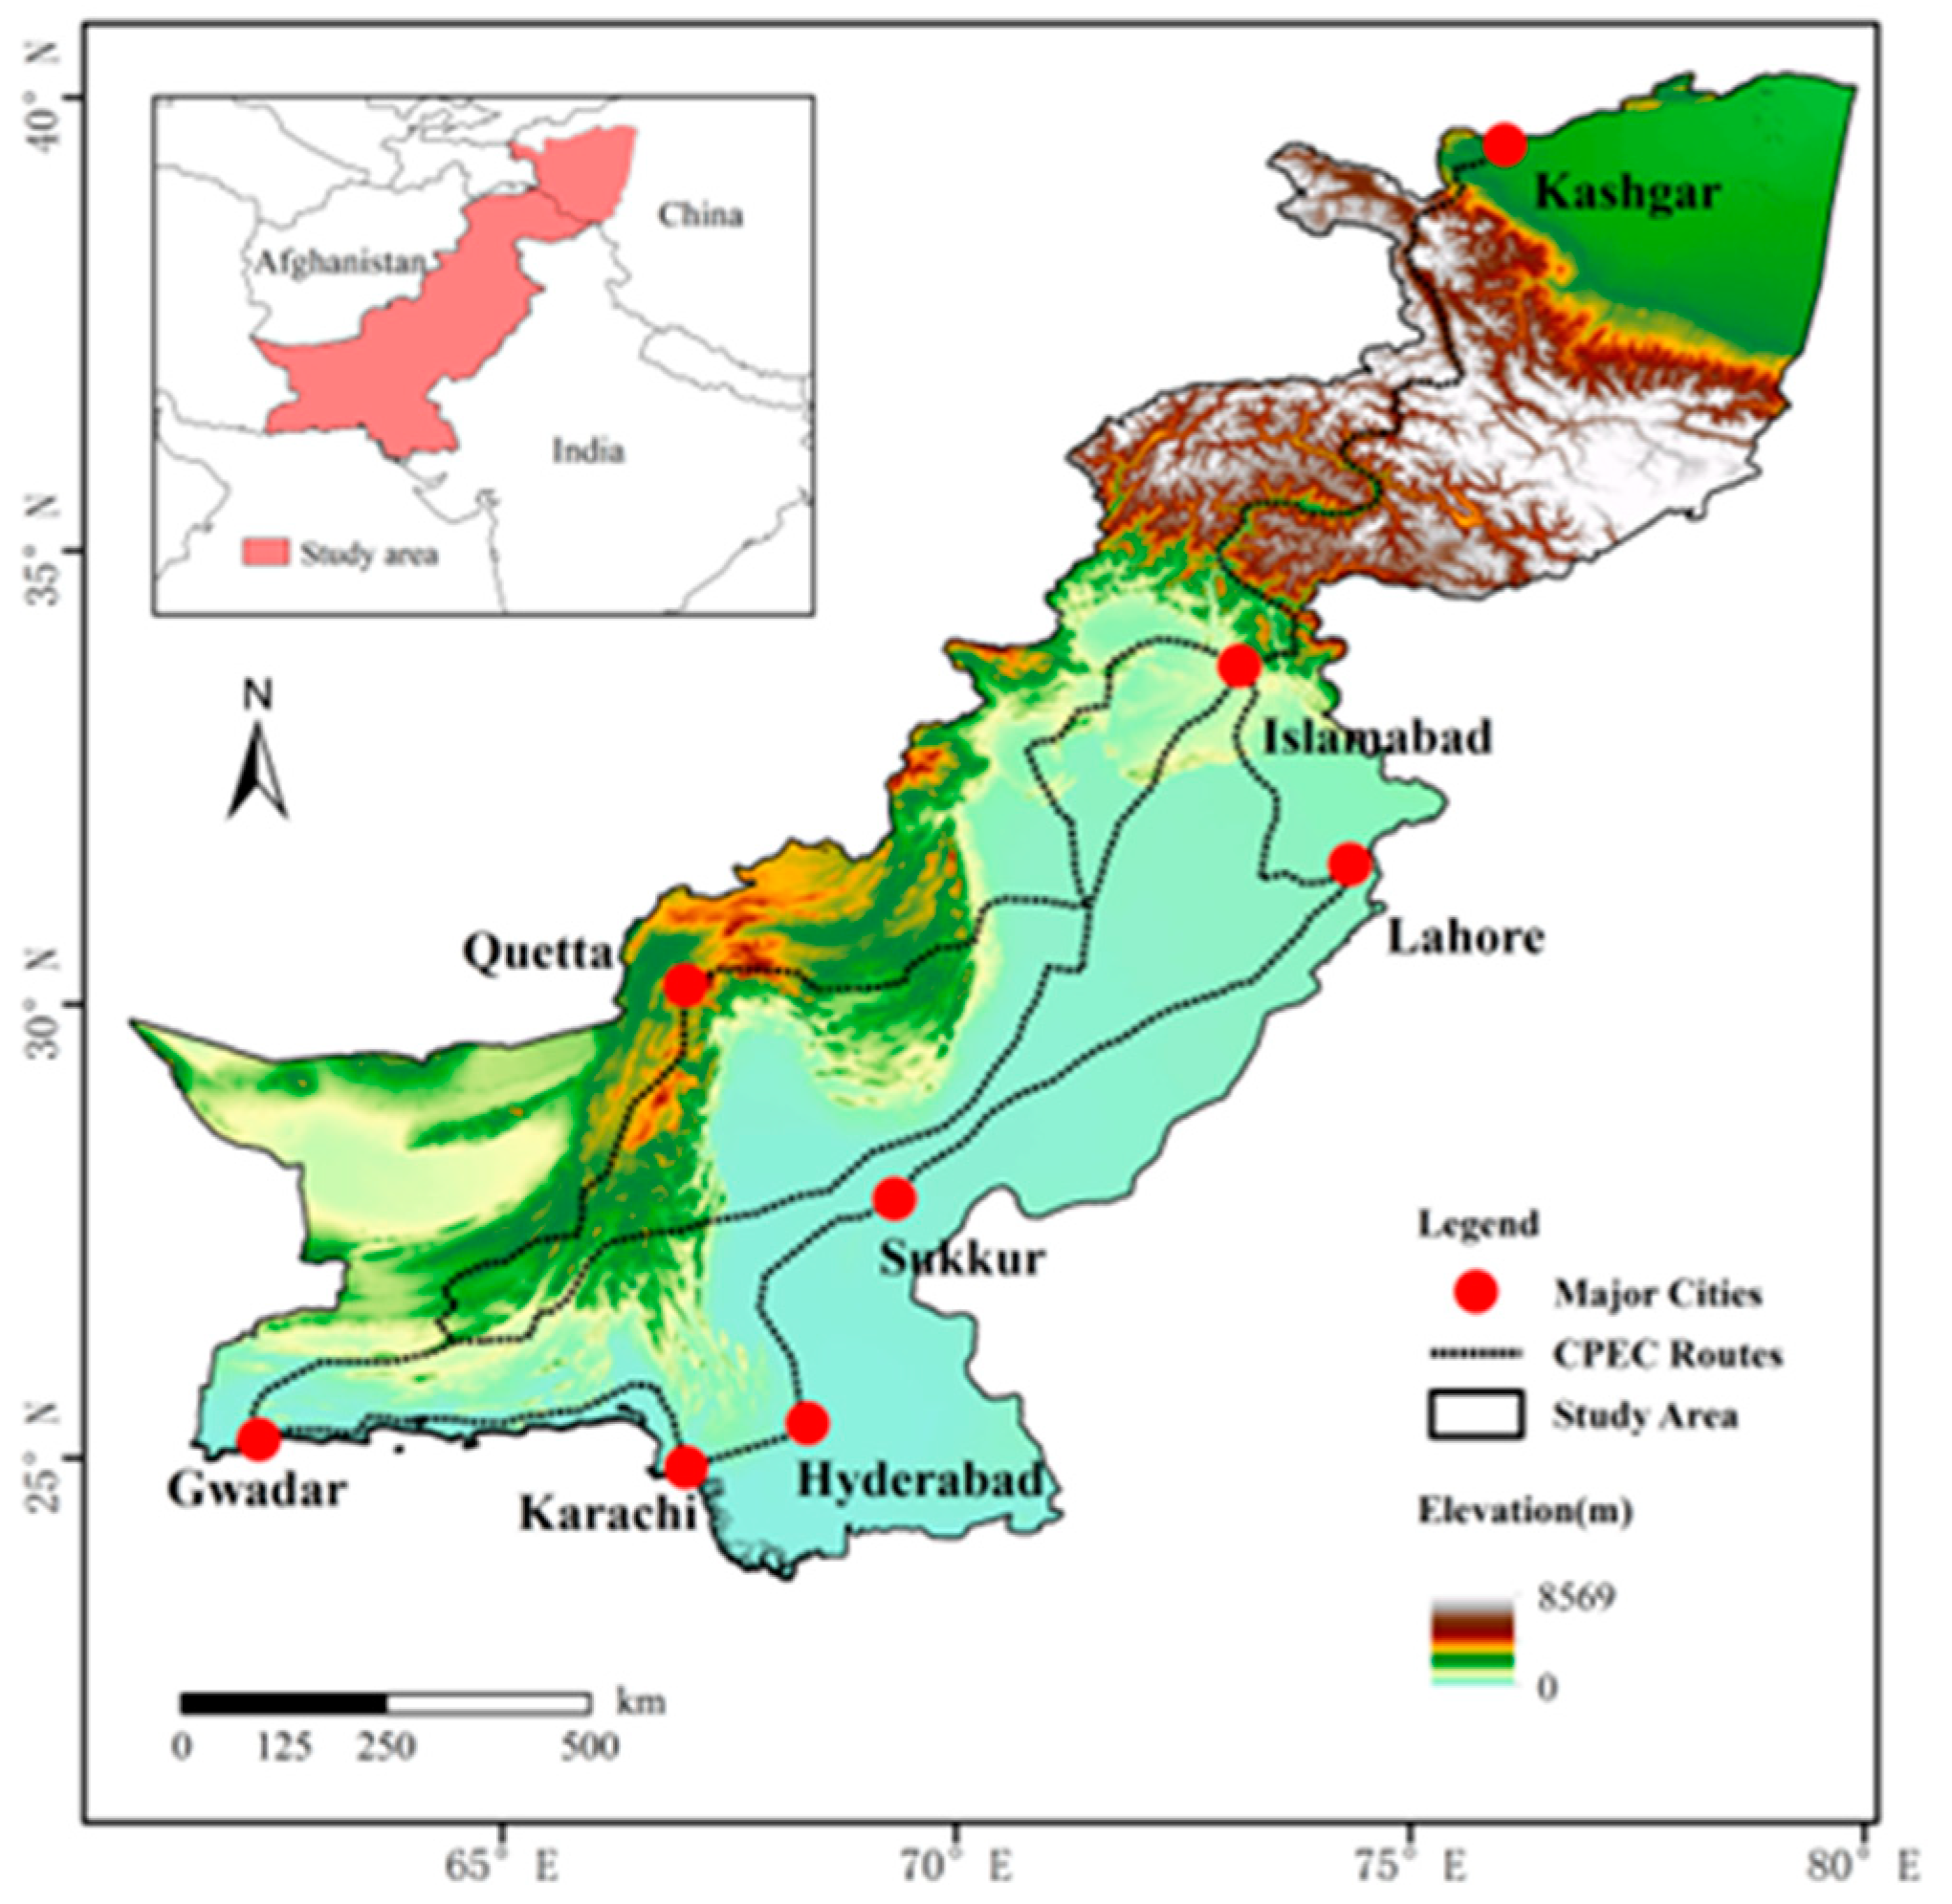
The China-Pakistan Economic Corridor (CPEC) is the flagship project of the Belt and Road Initiative. It is more than 3000 km long and extends from the northeast to the south of Pakistan, connecting Kashgar, Xinjiang, China to Gwadar Port, Pakistan. CPEC is a trade corridor including roads, railways, oil and gas and optical cable channels. The whole corridor extends from the north to south, and its road, railway and other transportation networks are planned to extend to the whole territory of Pakistan. The infrastructure in the region has been greatly improved in recent years. The Karakorum Highway connects China and Pakistan, and many highways including the Peshawar-Karachi Expressway are about to be completed in Pakistan. The Main Railway Line 1 (ML-1) is being upgraded. The development of CPEC will surely have great prospective. The area has a demand for thermal comfort in terms of public health, tourism and leisure, energy consumption and urban planning. However, the research on thermal comfort in CPEC is still in its infancy. At present, there is little research on indoor thermal comfort and urban outdoor heat exposure [
31,
32], while the research on regional thermal environment assessment is still blank. So, it is very urgent and necessary to evaluate the thermal comfort of the CPEC.
Thus, the main objective of this study was to investigate (1) the temporal and spatial pattern of thermal bioclimatic conditions of the CPEC, (2) which meteorological factor has more influence on the UTCI and (3) the suggestions on the application of the UTCI in Tourism.
The remaining sections are organized as follows:
Section 2 highlights characterization of the study area, data and methodology, and the results are given in
Section 3. Finally, discussion and conclusion are presented in
Section 4 and
Section 5, respectively.
3. Results
3.1. Spatial Patterns of UTCI
3.1.1. The Annual Distribution
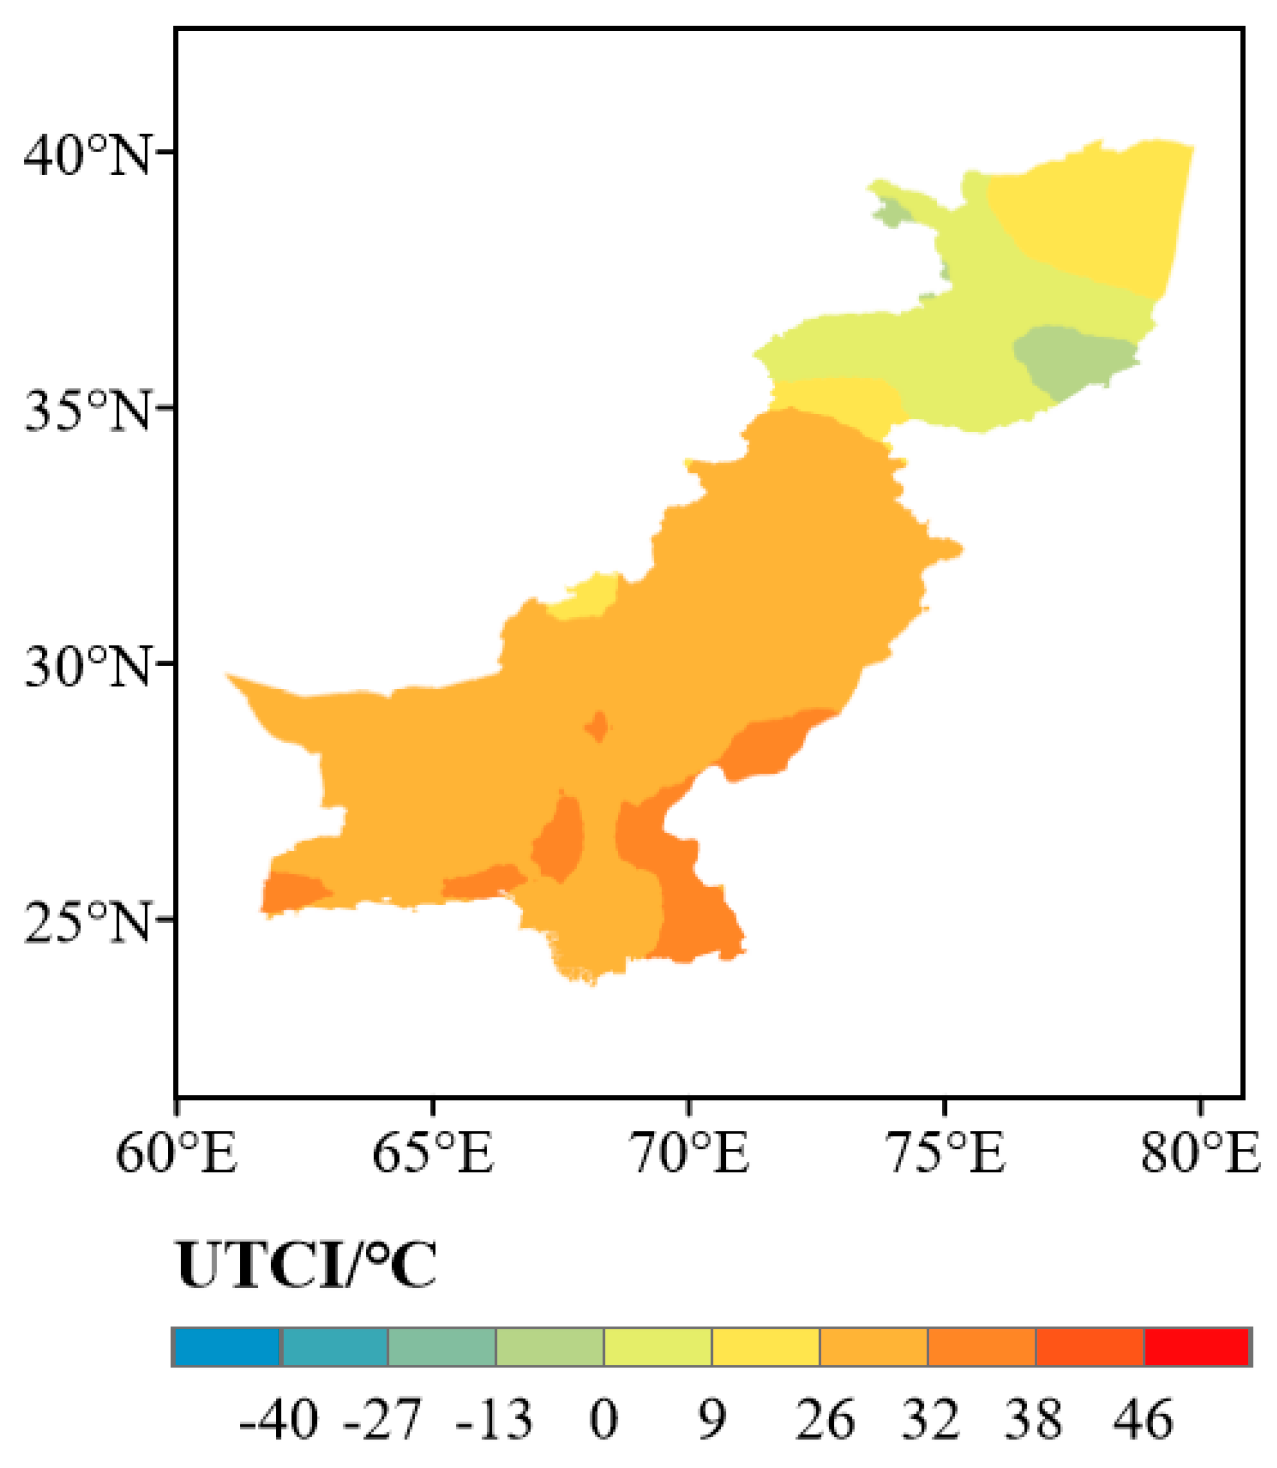
As shown in
Figure 2 and
Table 2, the UTCI across the CPEC decreased with the increase of latitude and altitude, indicating that it was under the influence of the natural geographical conditions. For the stress categories, most of the areas exhibited as “moderate heat stress” reached 61.63%. “Strong heat stress” was mainly distributed in the South CPEC, while “slight cold stress” was mainly in the middle of Karakoram and reached 15.51%. Because of the high altitude and low air temperature, the UTCI showing “strong cold stress” in the high mountain area in Karakoram accounts for 2.68%. “No thermal stress” prevailed in the South and north of the Karakoram, as well as mountainous regions in Baluchistan Province, and reached 11.49%.
3.1.2. The Seasonal Distribution
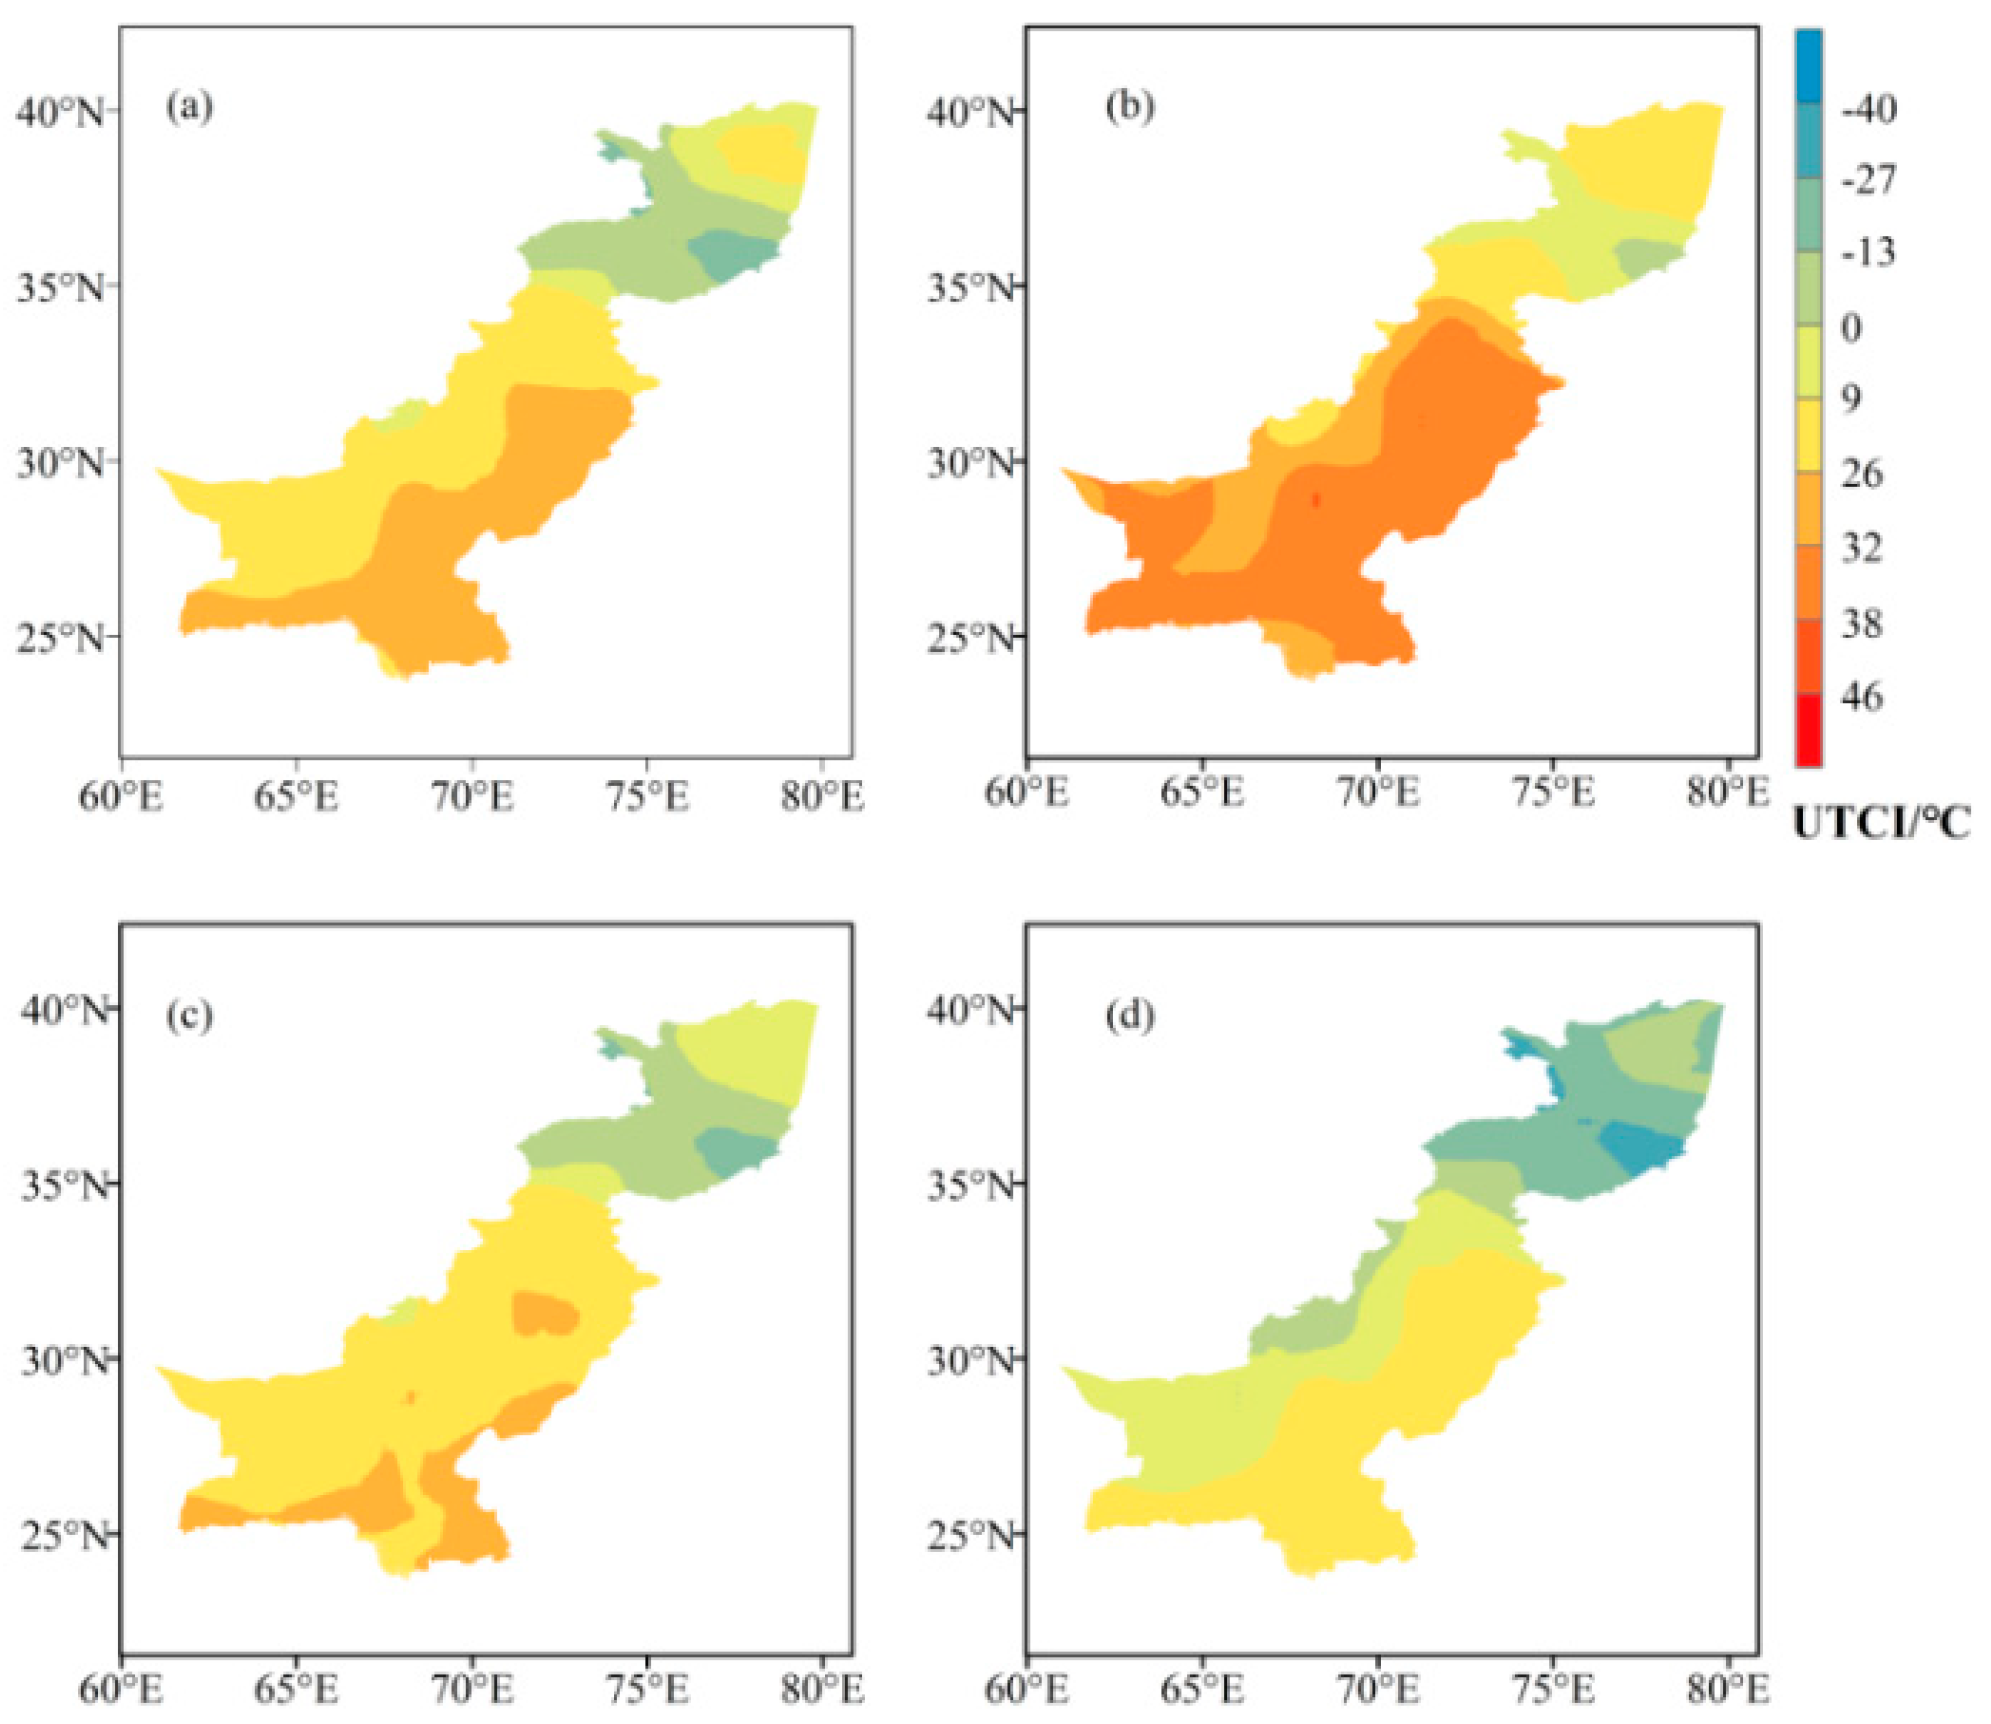
The distribution of the UTCI in the CPEC in different seasons showed different characteristics (
Figure 3). The categories of thermal stress were rich in each season, covering several categories from heat stress to cold stress.
In spring, 39.95% of the area was “no thermal stress”, including part of Kashgar and Western Plateau. The cold stress was mainly around Karakoram and accounted for 26.45%, while the heat stress was mainly in the Indus River Plain and reached 33.6%.
In summer, the heat stress area accounts for a large proportion, reaching 67.84%, mainly including the Indus River Plain and most of the mountainous areas in western Pakistan. The cold stress area was less than that in spring, reaching 12.23%, mainly distributed near the Karakoram, and the “no thermal stress” is mainly distributed in Kashi and a small part of the mountainous areas in western Pakistan, reaching 19.92%.
In autumn, in addition to the decrease of the area of heat stress distribution in the Indus River Plain, the distribution of UTCI was similar to that in spring. Furthermore, the area with “no thermal stress” was largest in autumn, reaching 55.42%.
In winter, 39.14% of the area was “no thermal stress”, which was mainly distributed in the Indus River Plain; except for the “no thermal stress”, all of them were cold stress. There was no heat stress distribution in winter.
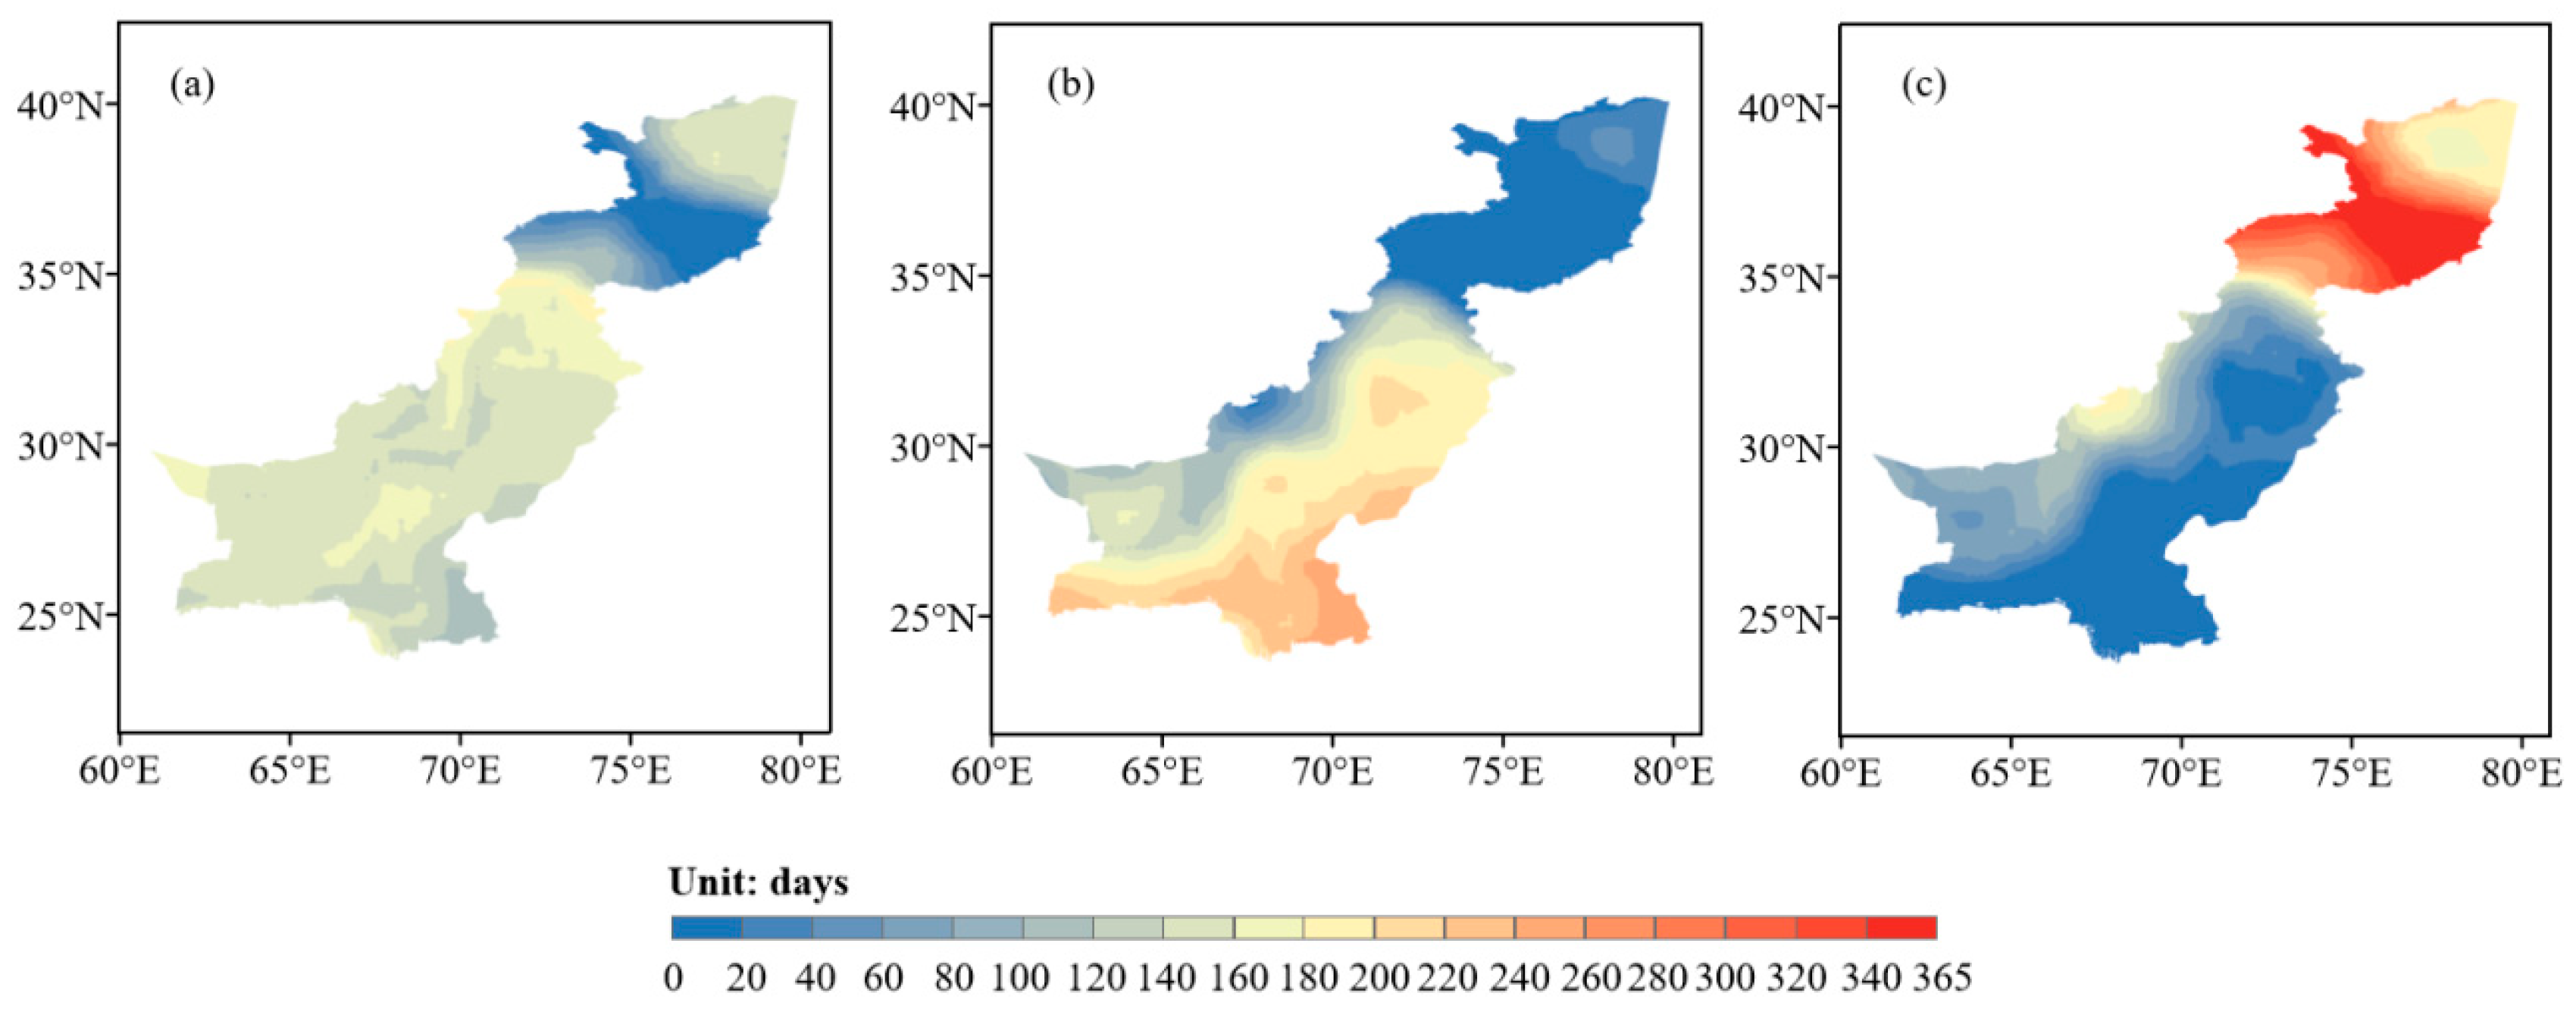
3.1.3. The Distribution of Stress Days
Figure 4a shows the distribution of annual number of days with “no thermal stress” in the CPEC. “No thermal stress” was the most comfortable thermal comfort category. The distribution of “no thermal stress” days in the CPEC was relatively uniform. It reached 180 days in the north and south of the Karakoram, whereas the number of days in the Karakoram and nearby areas were significantly less, with the least close to 0 days.
Figure 4b, c shows the distribution of annual number of days with heat stress and cold stress in the CPEC. The number of heat stress days in high-altitude areas was less, and the number in low-altitude areas was more, reaching 260 days. The spatial distribution of cold stress was completely opposite to that of heat stress, and the regional difference was more obvious. The days of cold stress was close to 0 in the Indus Plains, and even 365 days in the Karakoram.
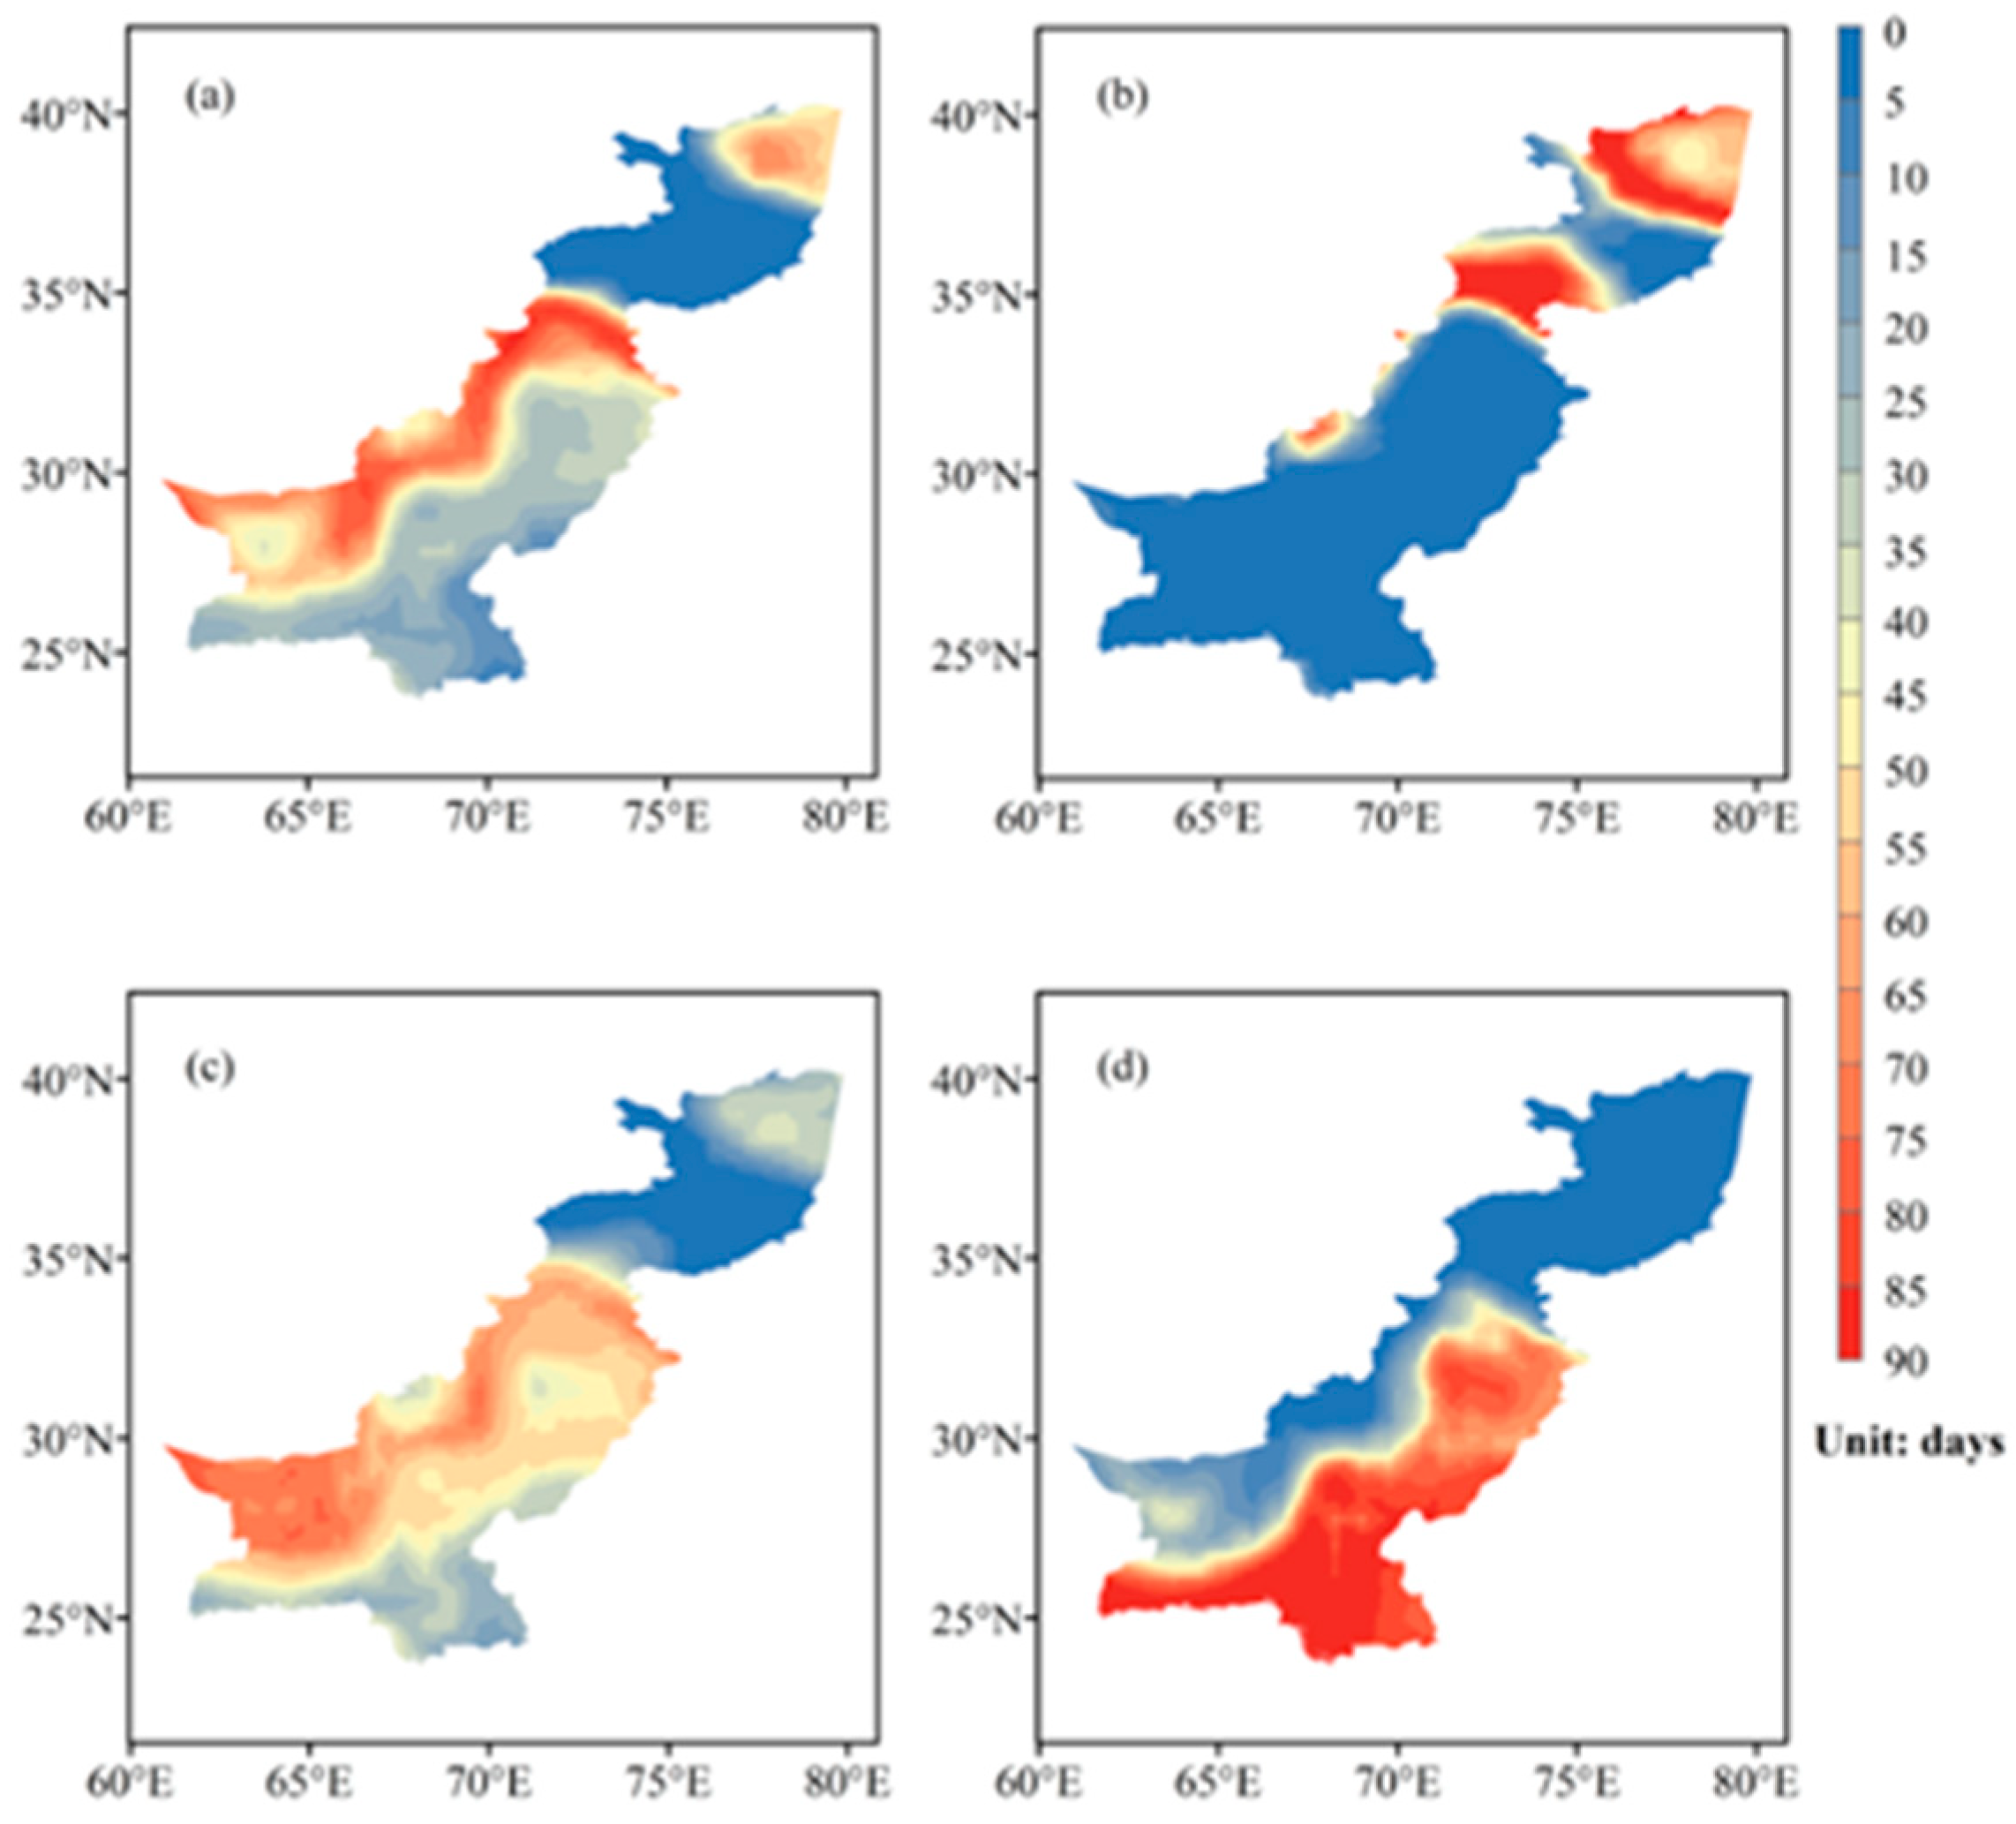
Figure 5 shows the distribution of seasonal number of days of “no thermal stress” in the CPEC. We found that the distribution characteristics of spring and autumn are more complex than those of summer and winter.
In spring, there is no “no thermal stress” distribution in the Karakoram and nearby areas. There are more days in the western mountainous areas of Pakistan, reaching more than 70 days. The areas with more days are regularly consistent with the terrain characteristics. Kashgar also has many days, reaching 45–70 days. There are few days in the Indus River Basin, most of which are less than 30 days, some even less than 5 days.
In summer, there are more days of “no thermal stress” in parts of Kashgar and southern Karakoram and a small part of the mountainous areas in western Pakistan, most of which are over 70 days, and 85 days account for a large proportion. In addition to these areas, the days of “no thermal stress” in other places are less than 5 days.
The distribution of “no thermal stress” days in autumn is the most complex. The days near Karakoram are still 0 days, 25–40 days in Kashi area, more than 50 days in most areas in the south and only 15–40 days in coastal and southeast areas.
In winter, the number of days of “no thermal stress” is polarized, reaching more than 75 days in the Indus plain, and less than 10 days in most other areas.
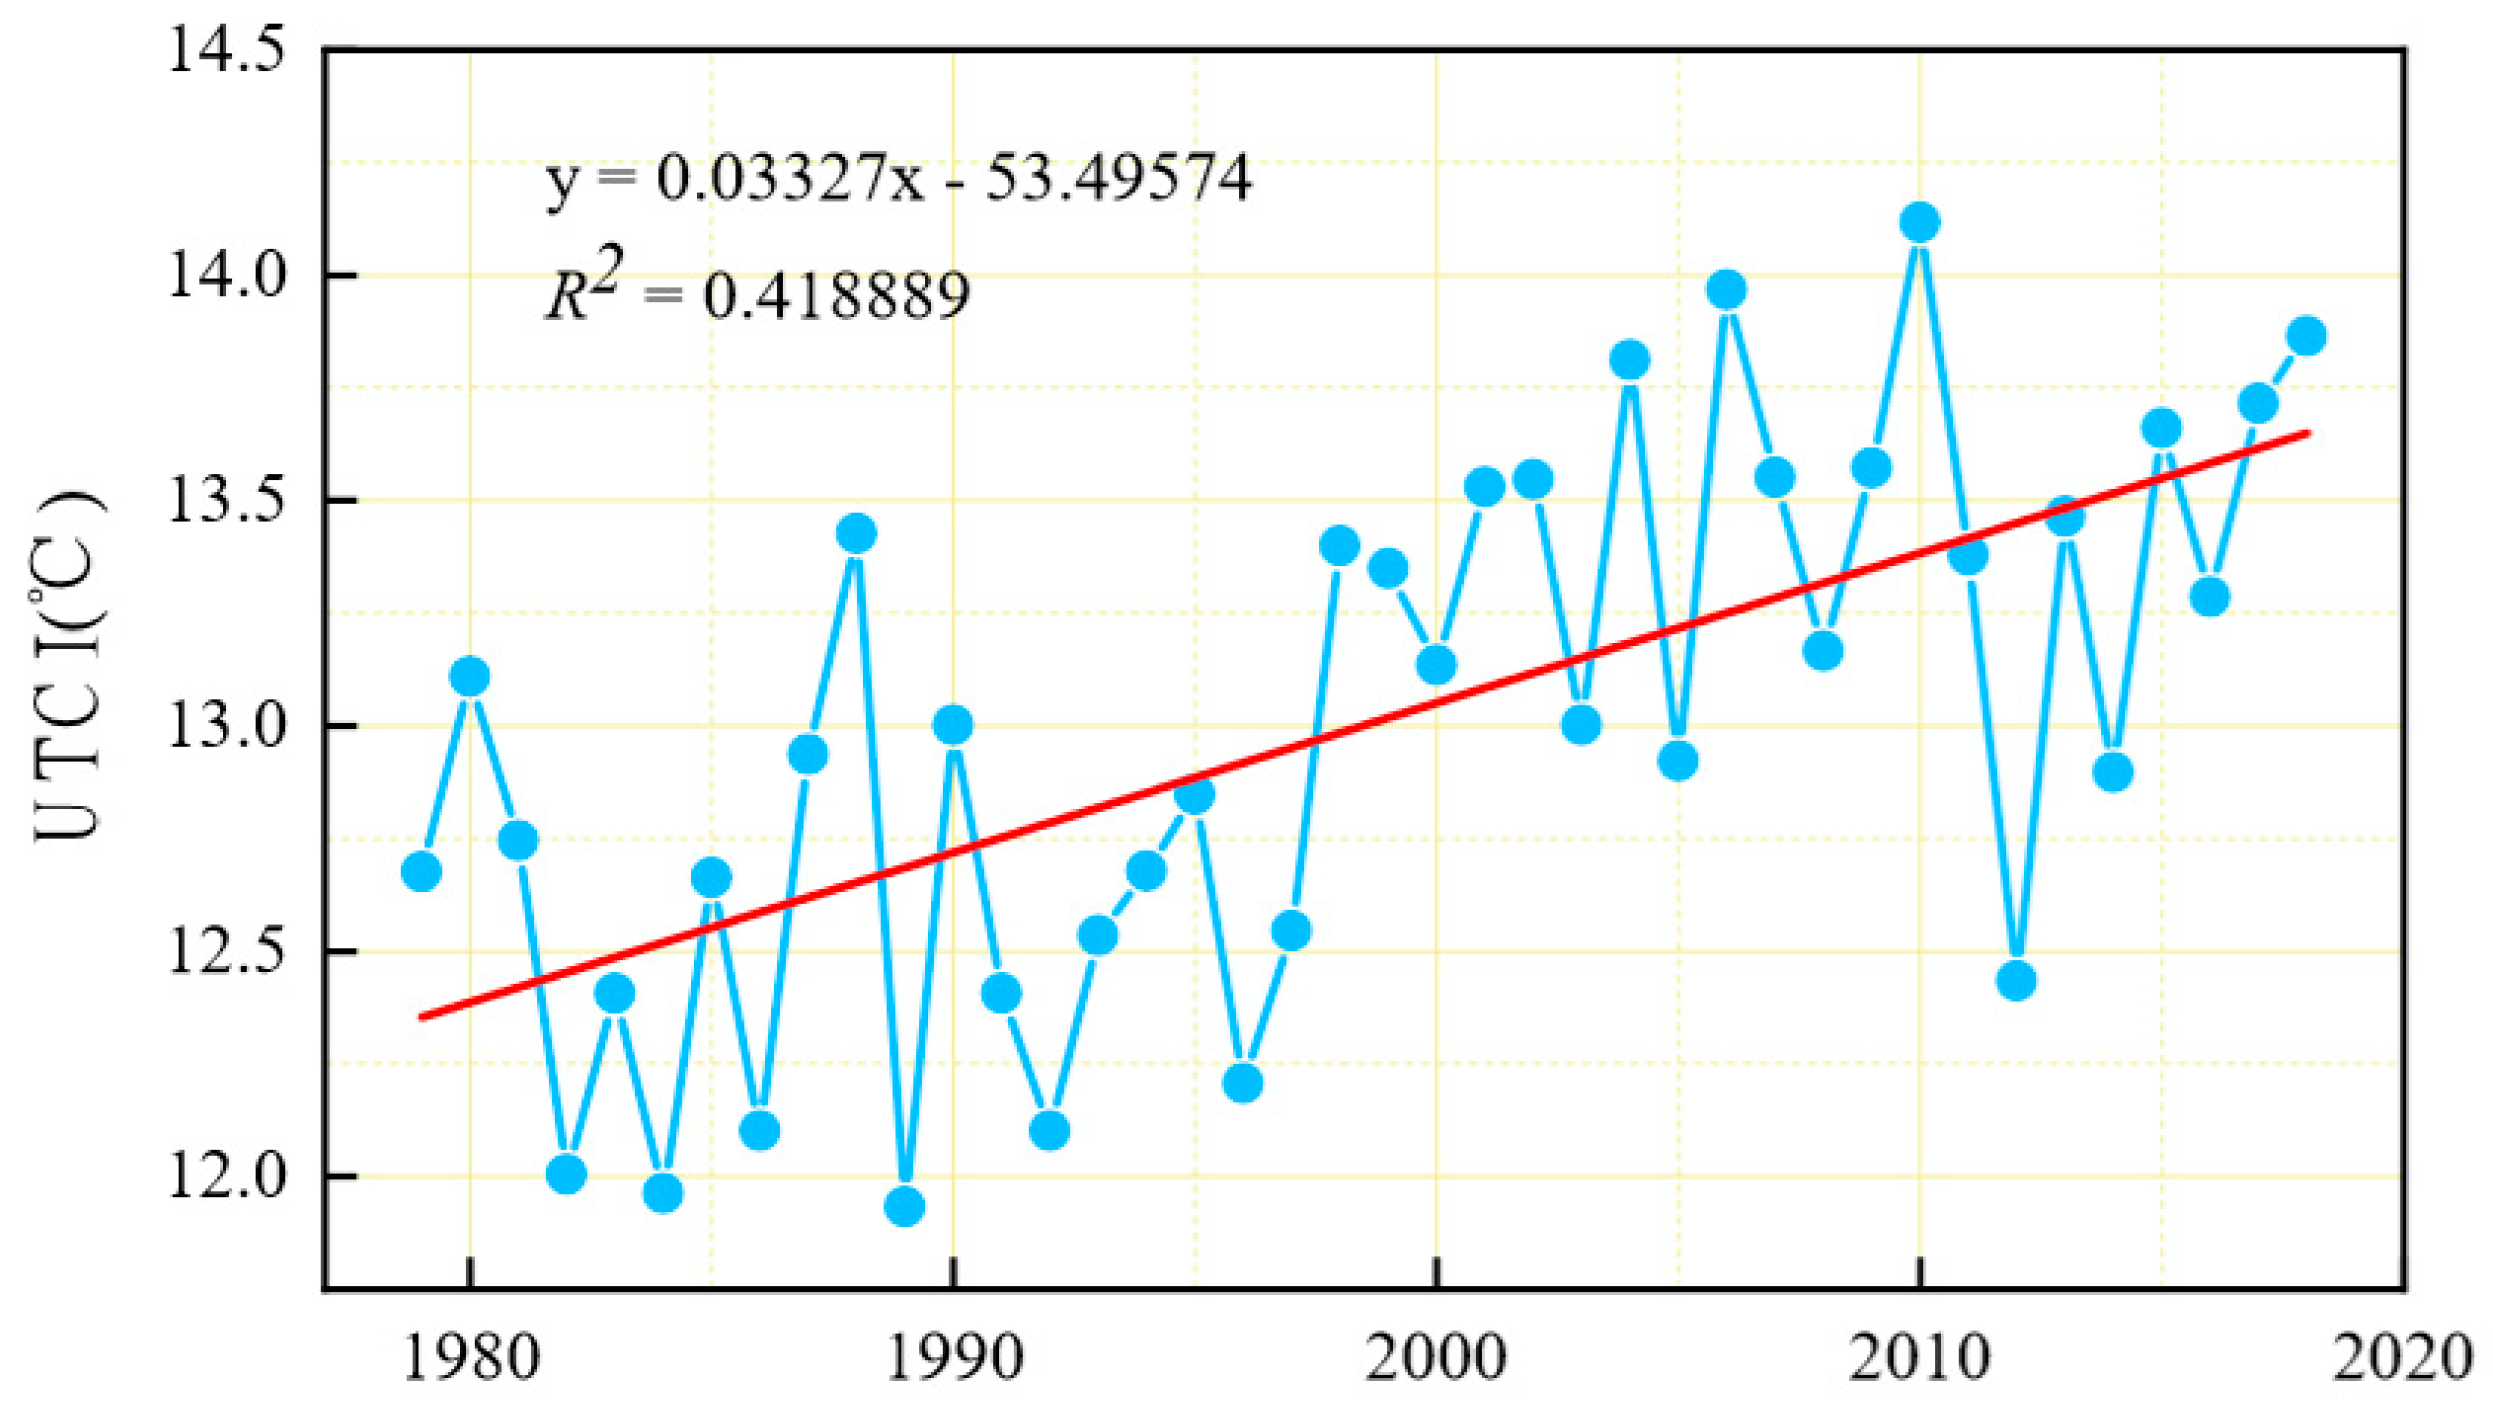
3.2. Trend Analysis of the UTCI
As shown in
Figure 6, the UTCI in the CPEC showed a great fluctuation from the minimum value of 11.93 °C in 1989 to the maximum value of 14.12 °C in 2010 during the period of 1979–2018. However, the UTCI generally exhibited a positive trend of 0.33 °C/10a with an average value of 13.0 °C, with a significant upward trend (
R2 = 0.42) over the past 40 years. Before 1998, most of the UTCI was below the average value, and after 1998, most of the UTCI was above the average value. According to the research results of climate change, the annual temperature has been on the rise for more than 100 years [
44]. Because air temperature is one of the calculation factors of the UTCI, the annual change of the UTCI was consistent with the trend of climate change in the past 40 years.
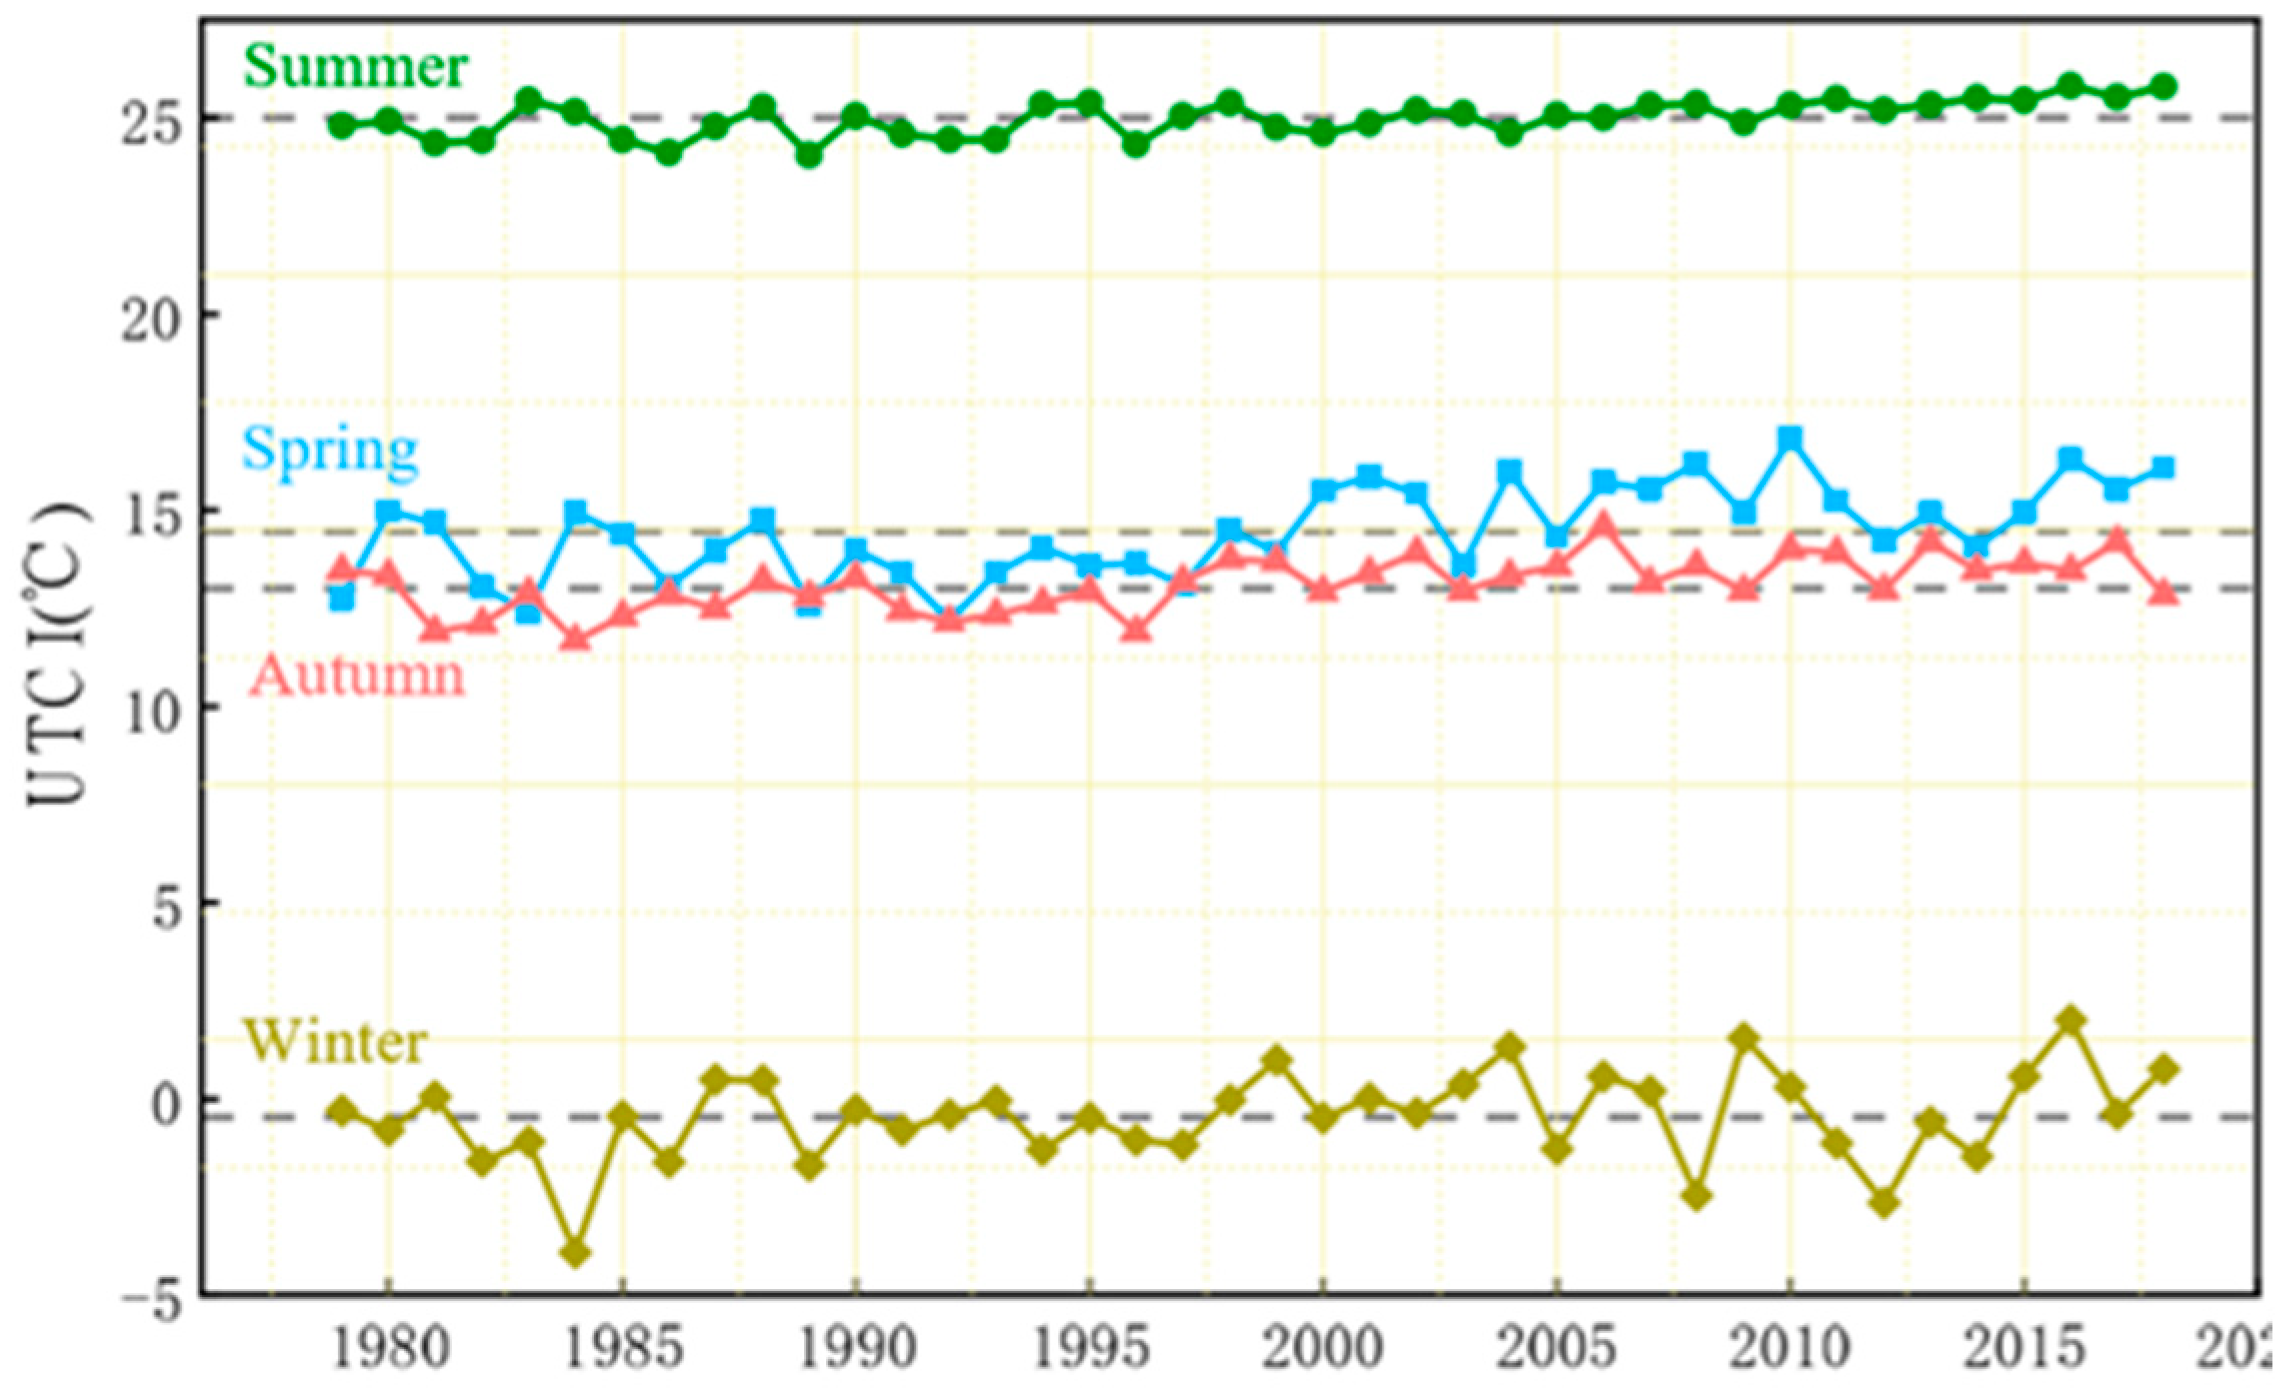
In the recent 40 years, the seasonal variation characteristics of the UTCI in the CPEC showed that the difference among the four seasons is obvious (
Figure 7), with the highest in summer, the second in spring and autumn and the lowest in winter. The average UTCI value in spring was 14.46 °C, and in summer, autumn and winter were 25.0, 13.11 and −0.45 °C, respectively. The value of UTCI assumed the obvious growth tendency in the CPEC from 1979 to 2018, and the results show that the increment of the UTCI in the CPEC was 0.61, 0.24, 0.35 and 0.28 °C/10a for spring, summer, autumn and winter respectively, and
R2 was 0.38, 0.37, 0.35 and 0.08, respectively. Spring had the fastest growth trend, far exceeding the other three seasons.
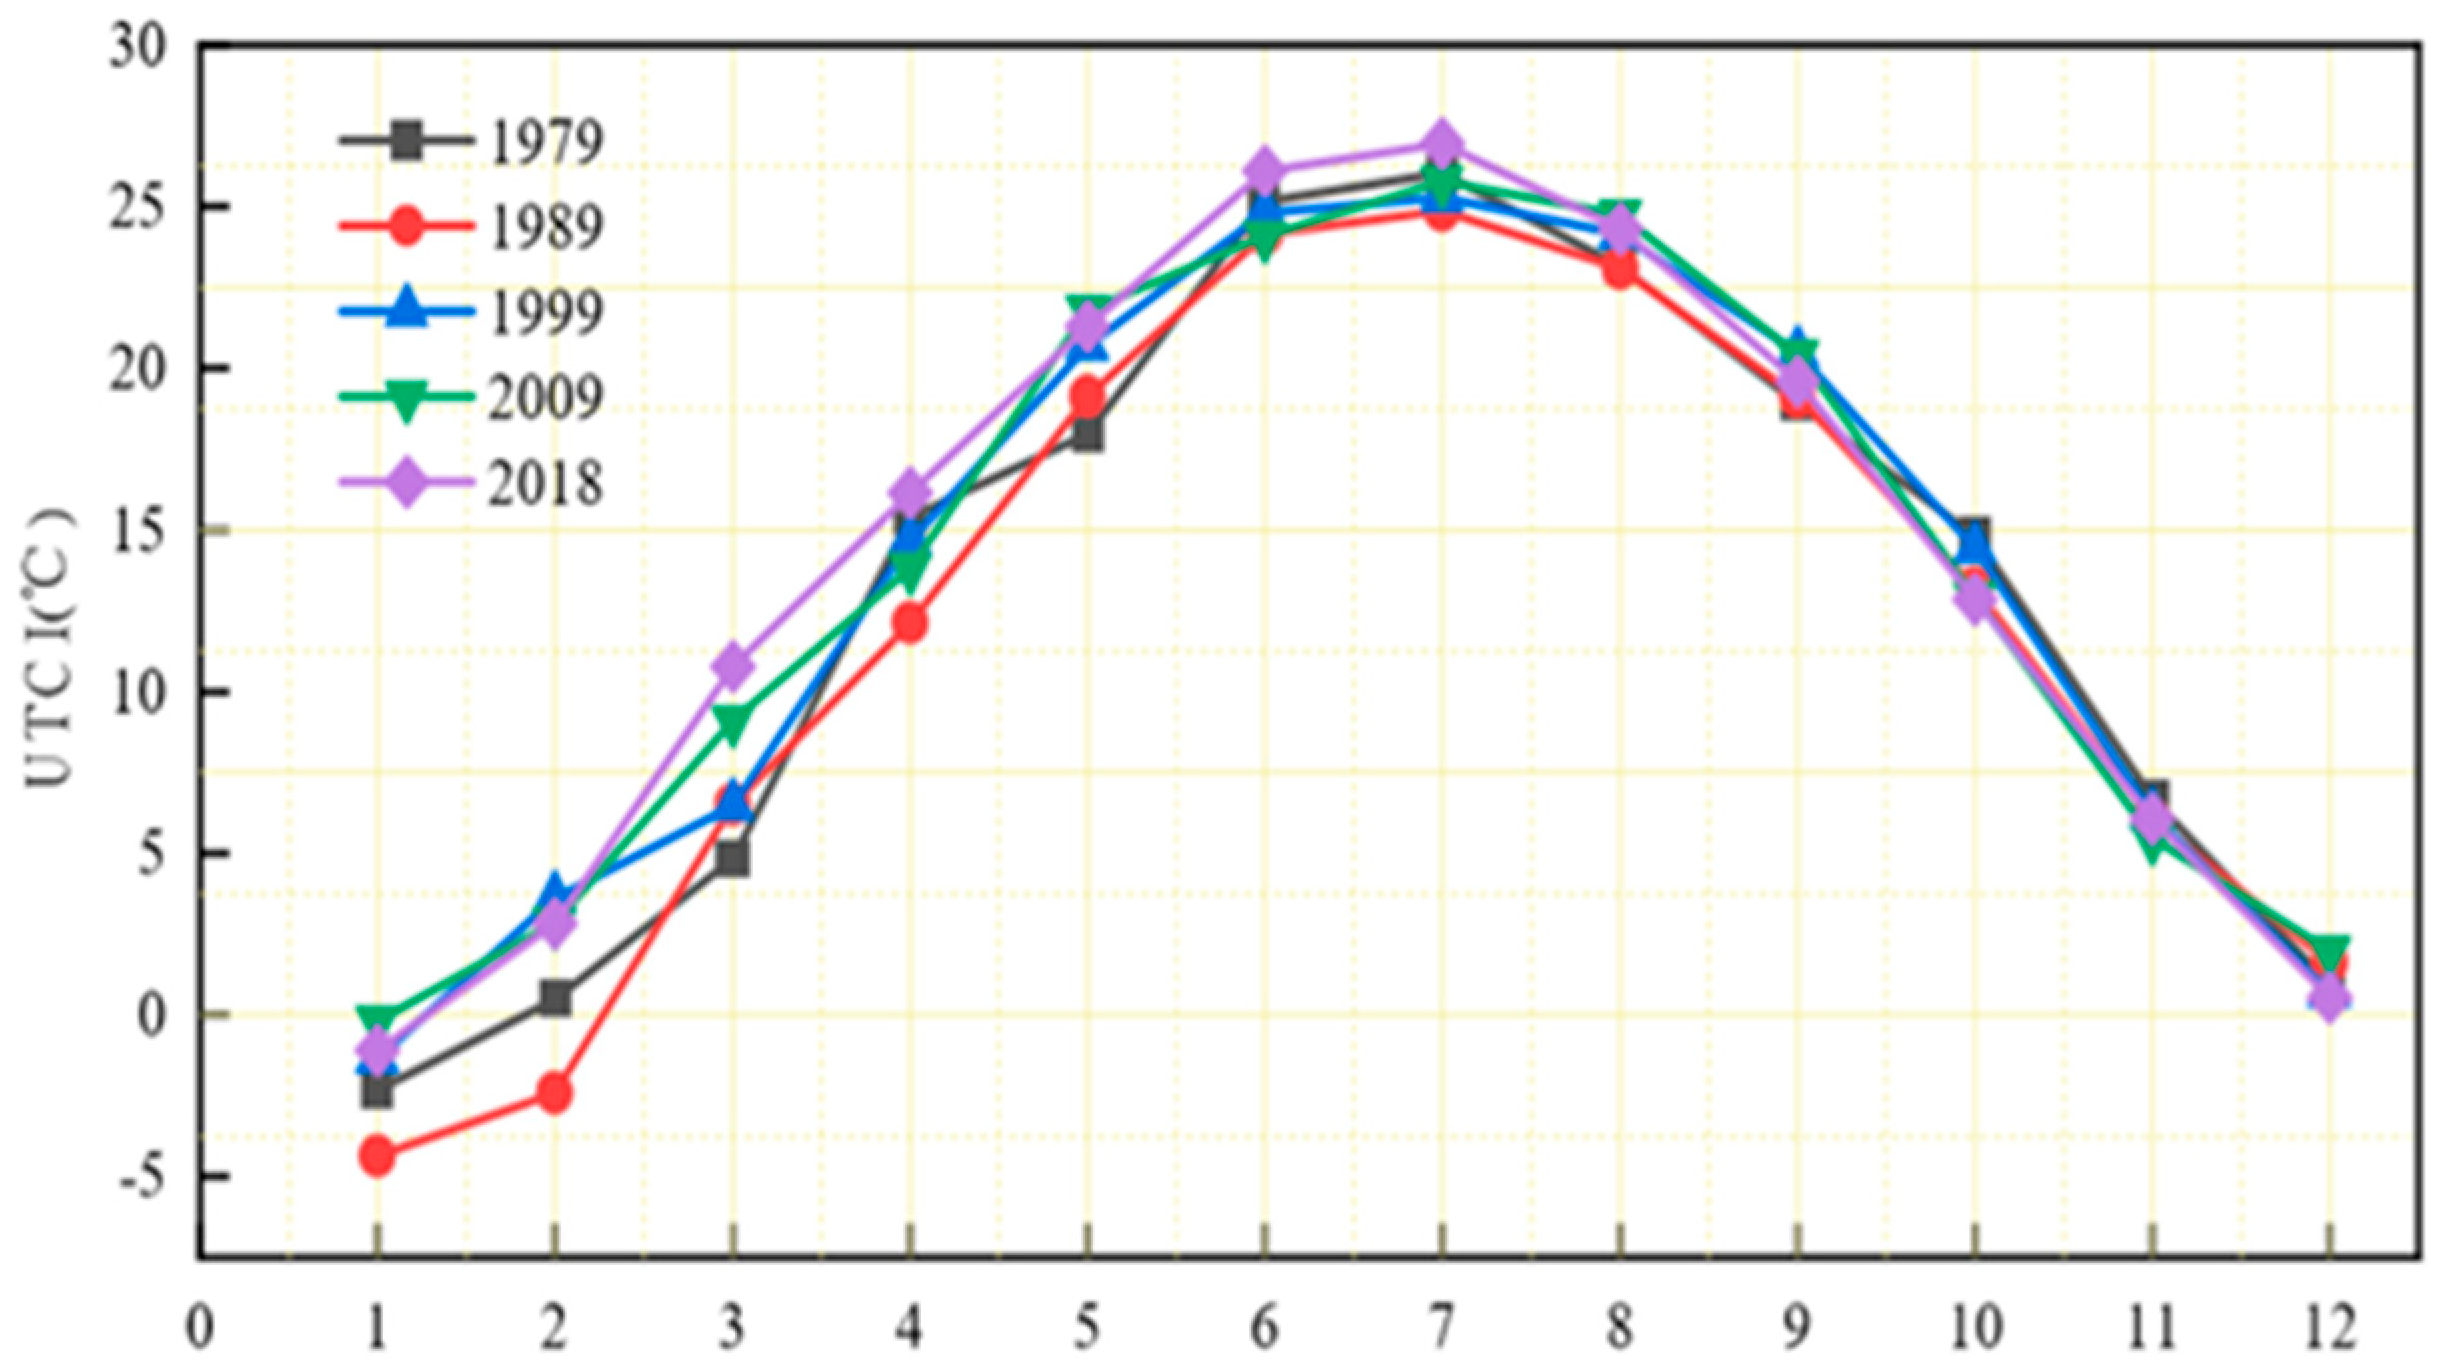
Figure 8 shows the monthly characteristics of the UTCI during 1979, 1989, 1999, 2009 and 2018 in the CPEC. On an annual scale, the UTCI showed an overall upward trend from 1979 to 2018 in the first half of the year, but in the second half of the year, it was not obvious. On a monthly scale, the results showed that the lowest month of the UTCI was January, followed by December and February. The highest month was July, followed by June and August. The results showed that July, January and December were the most uncomfortable months of the year for tourism. May, June, September and October were the most comfortable months. The curve changed slowly from January to July, and changed violently from August to December. The results showed that there was a slow climbing process of the UTCI from January to July, and the trend of the UTCI from August to December showed a rapid decline.
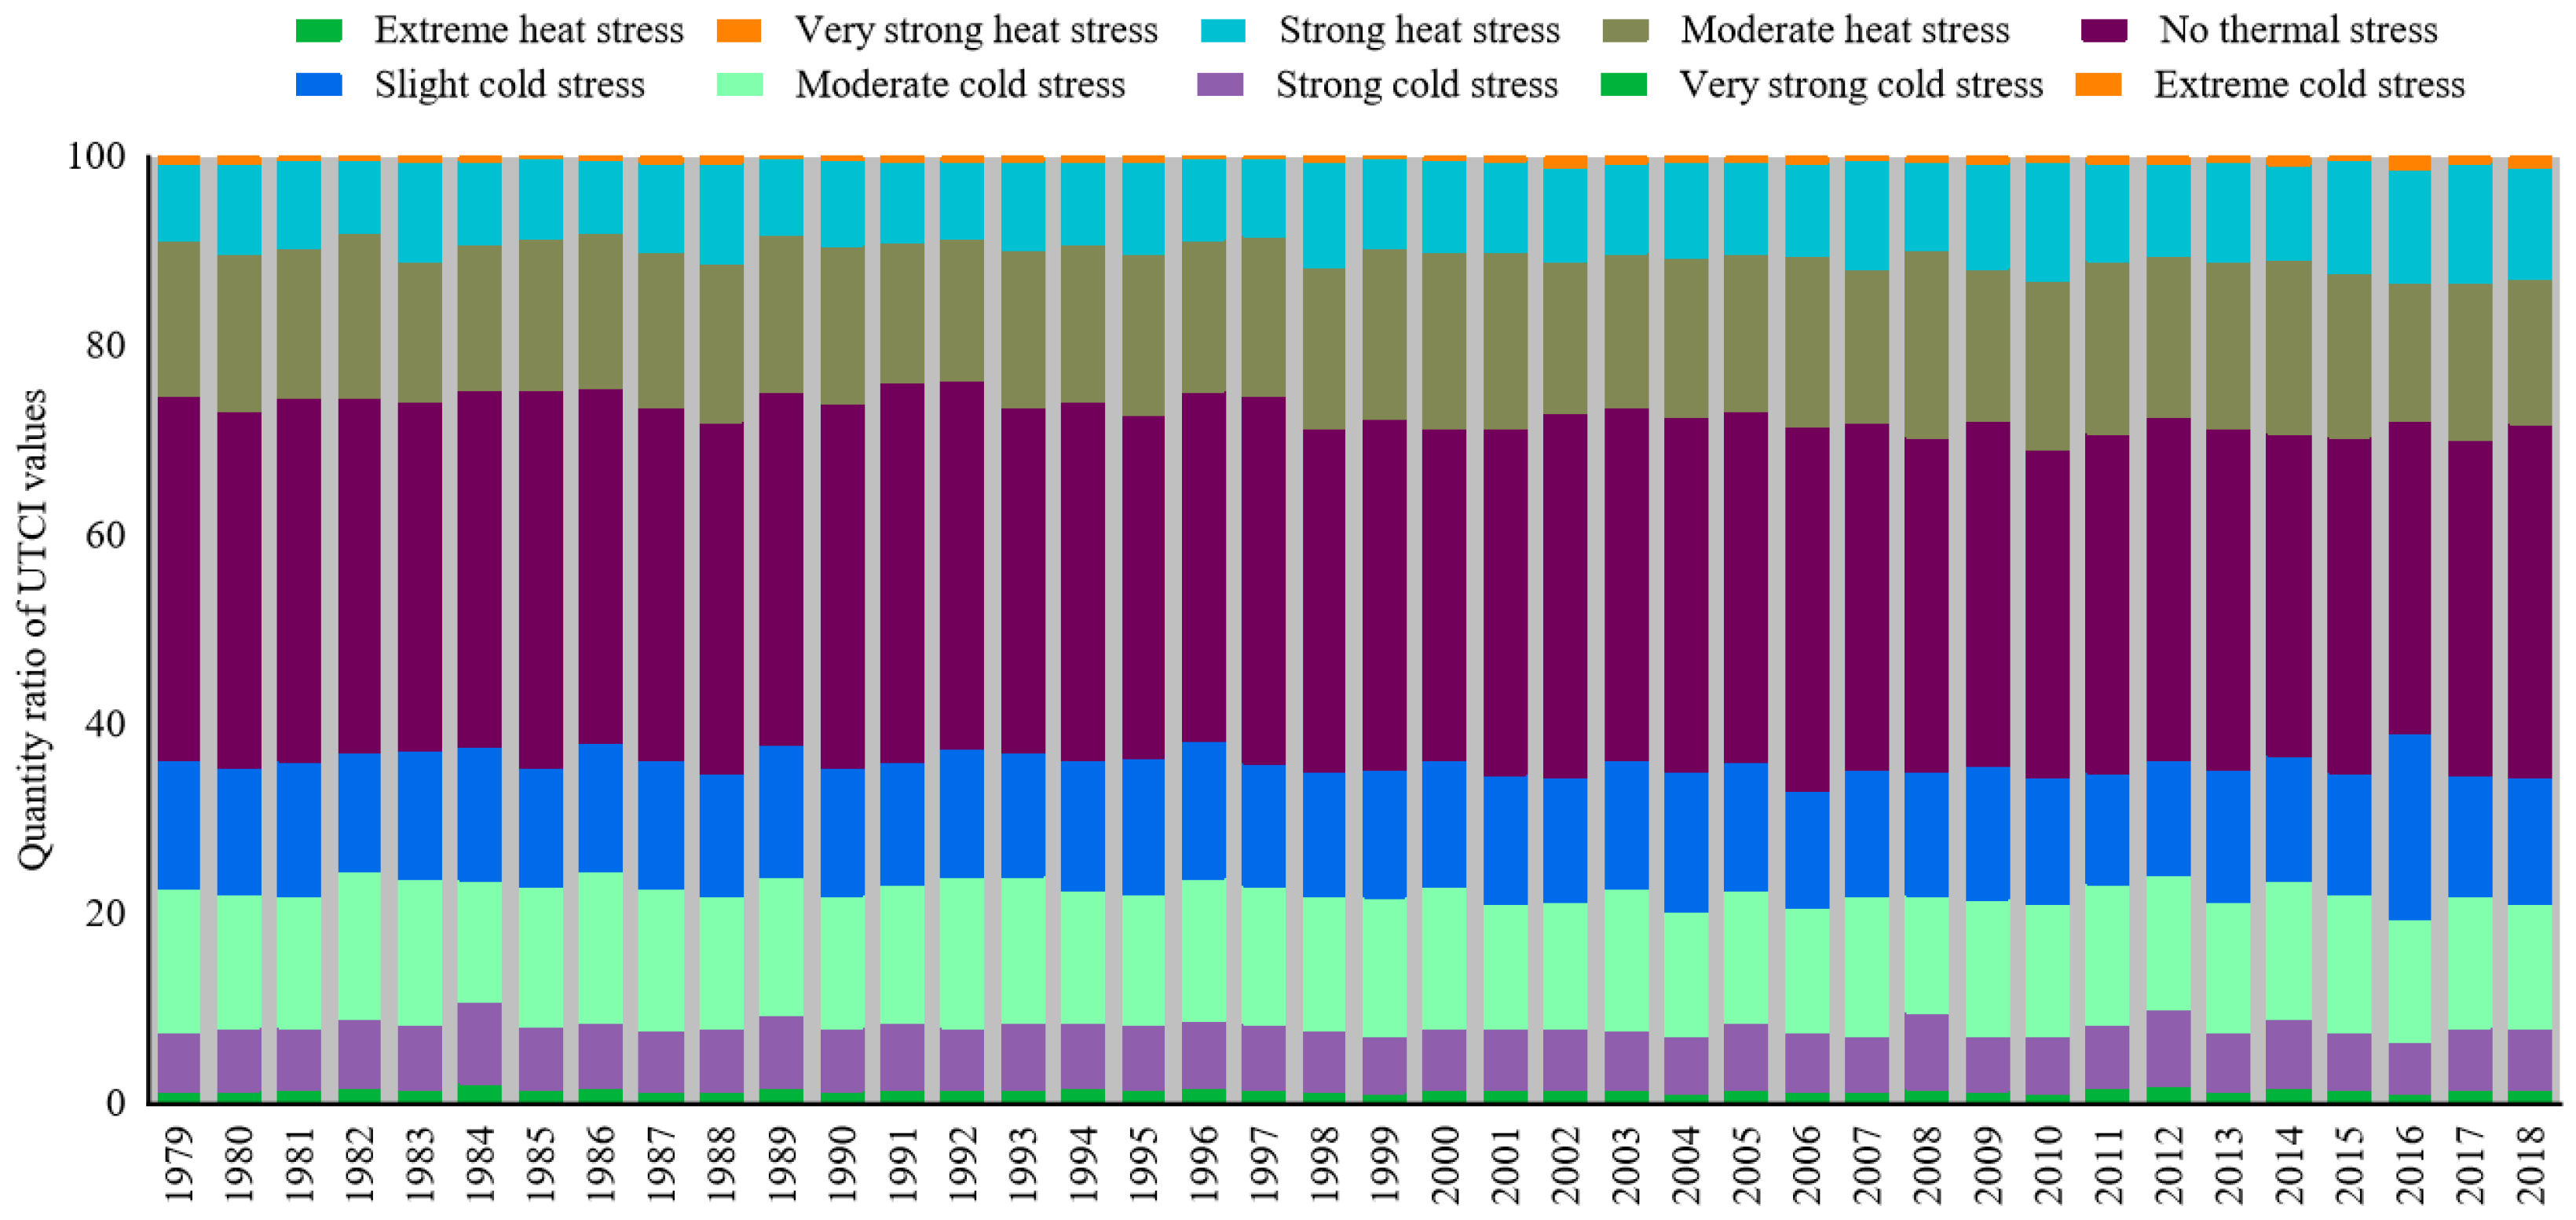
The area of different categories of thermal stress in each year is represented in
Figure 9, which clearly shows the distribution characteristics of different categories of thermal stress in different years. In the past 40 years, the proportion of areas with different thermal stress categories was relatively similar, with only slight fluctuation. The area of the “no thermal stress” was always the largest, and the areas of “very strong cold stress” and of “very strong thermal stress” were always the smallest. This showed that even if the thermal categories changed, there are still many places suitable for tourism in the CPEC, which are not affected by the change of the UTCI.
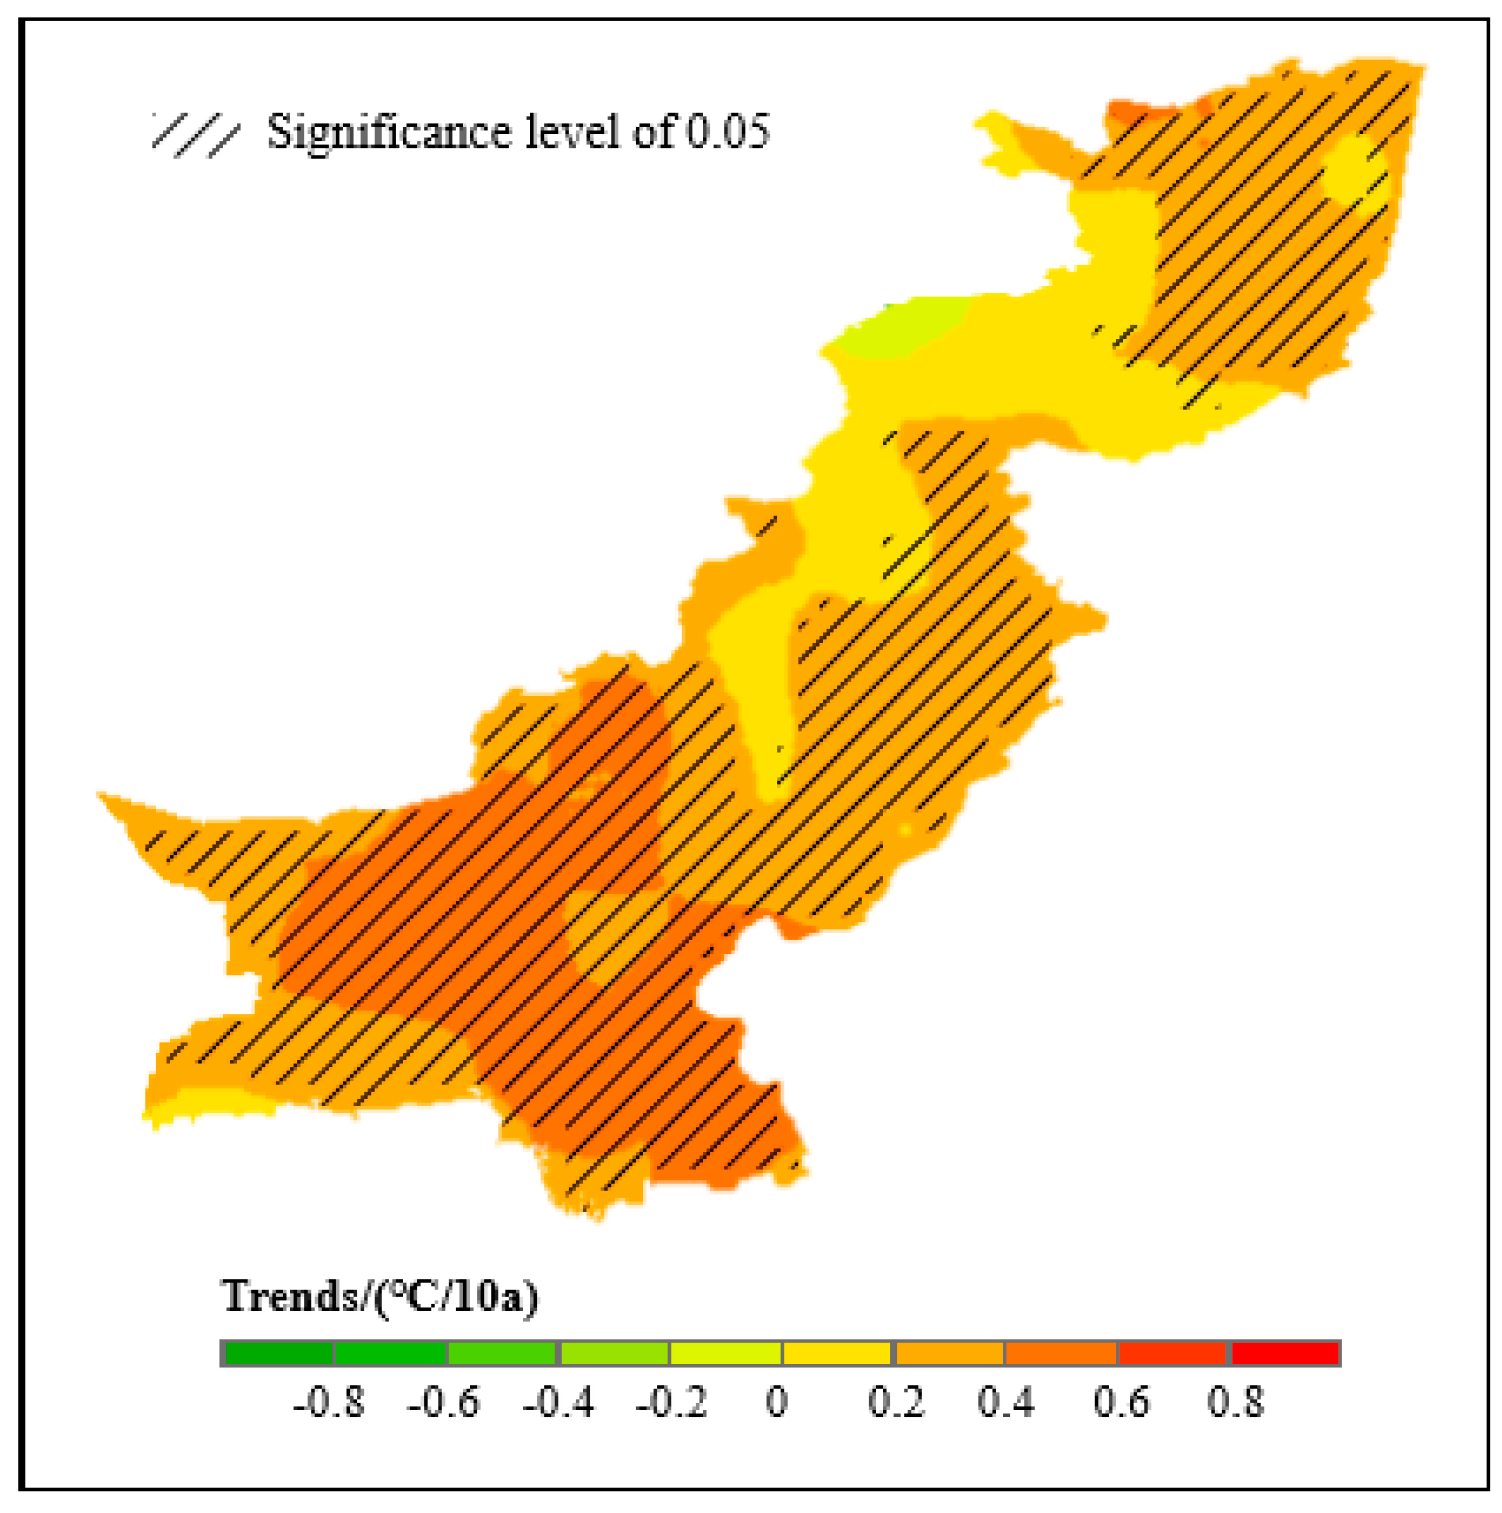
As shown in
Figure 10, the annual UTCI of the CPEC from 1979 to 2018 almost showed a significant positive trend. The outdoor thermal comfort seemed to be improved more in the south of Pakistan ((0.4~0.8) °C/10a), and the rising trend was significant (
p < 0.05). However, on the left edge of the Karakoram, there was a small area with a weak negative trend of annual UTCI ((−0.2~0) °C/10a), but no statistical significance (
p > 0.05). In CPEC, 76.52% of the areas passed the
t-test, mainly distributed in the north of Karakoram, the south of Pakistan and the upper Indus River Plain. The demand for summer tourism in the CPEC will continue to expand due to the concentration of population and the rising level of thermal stress in the southern region.
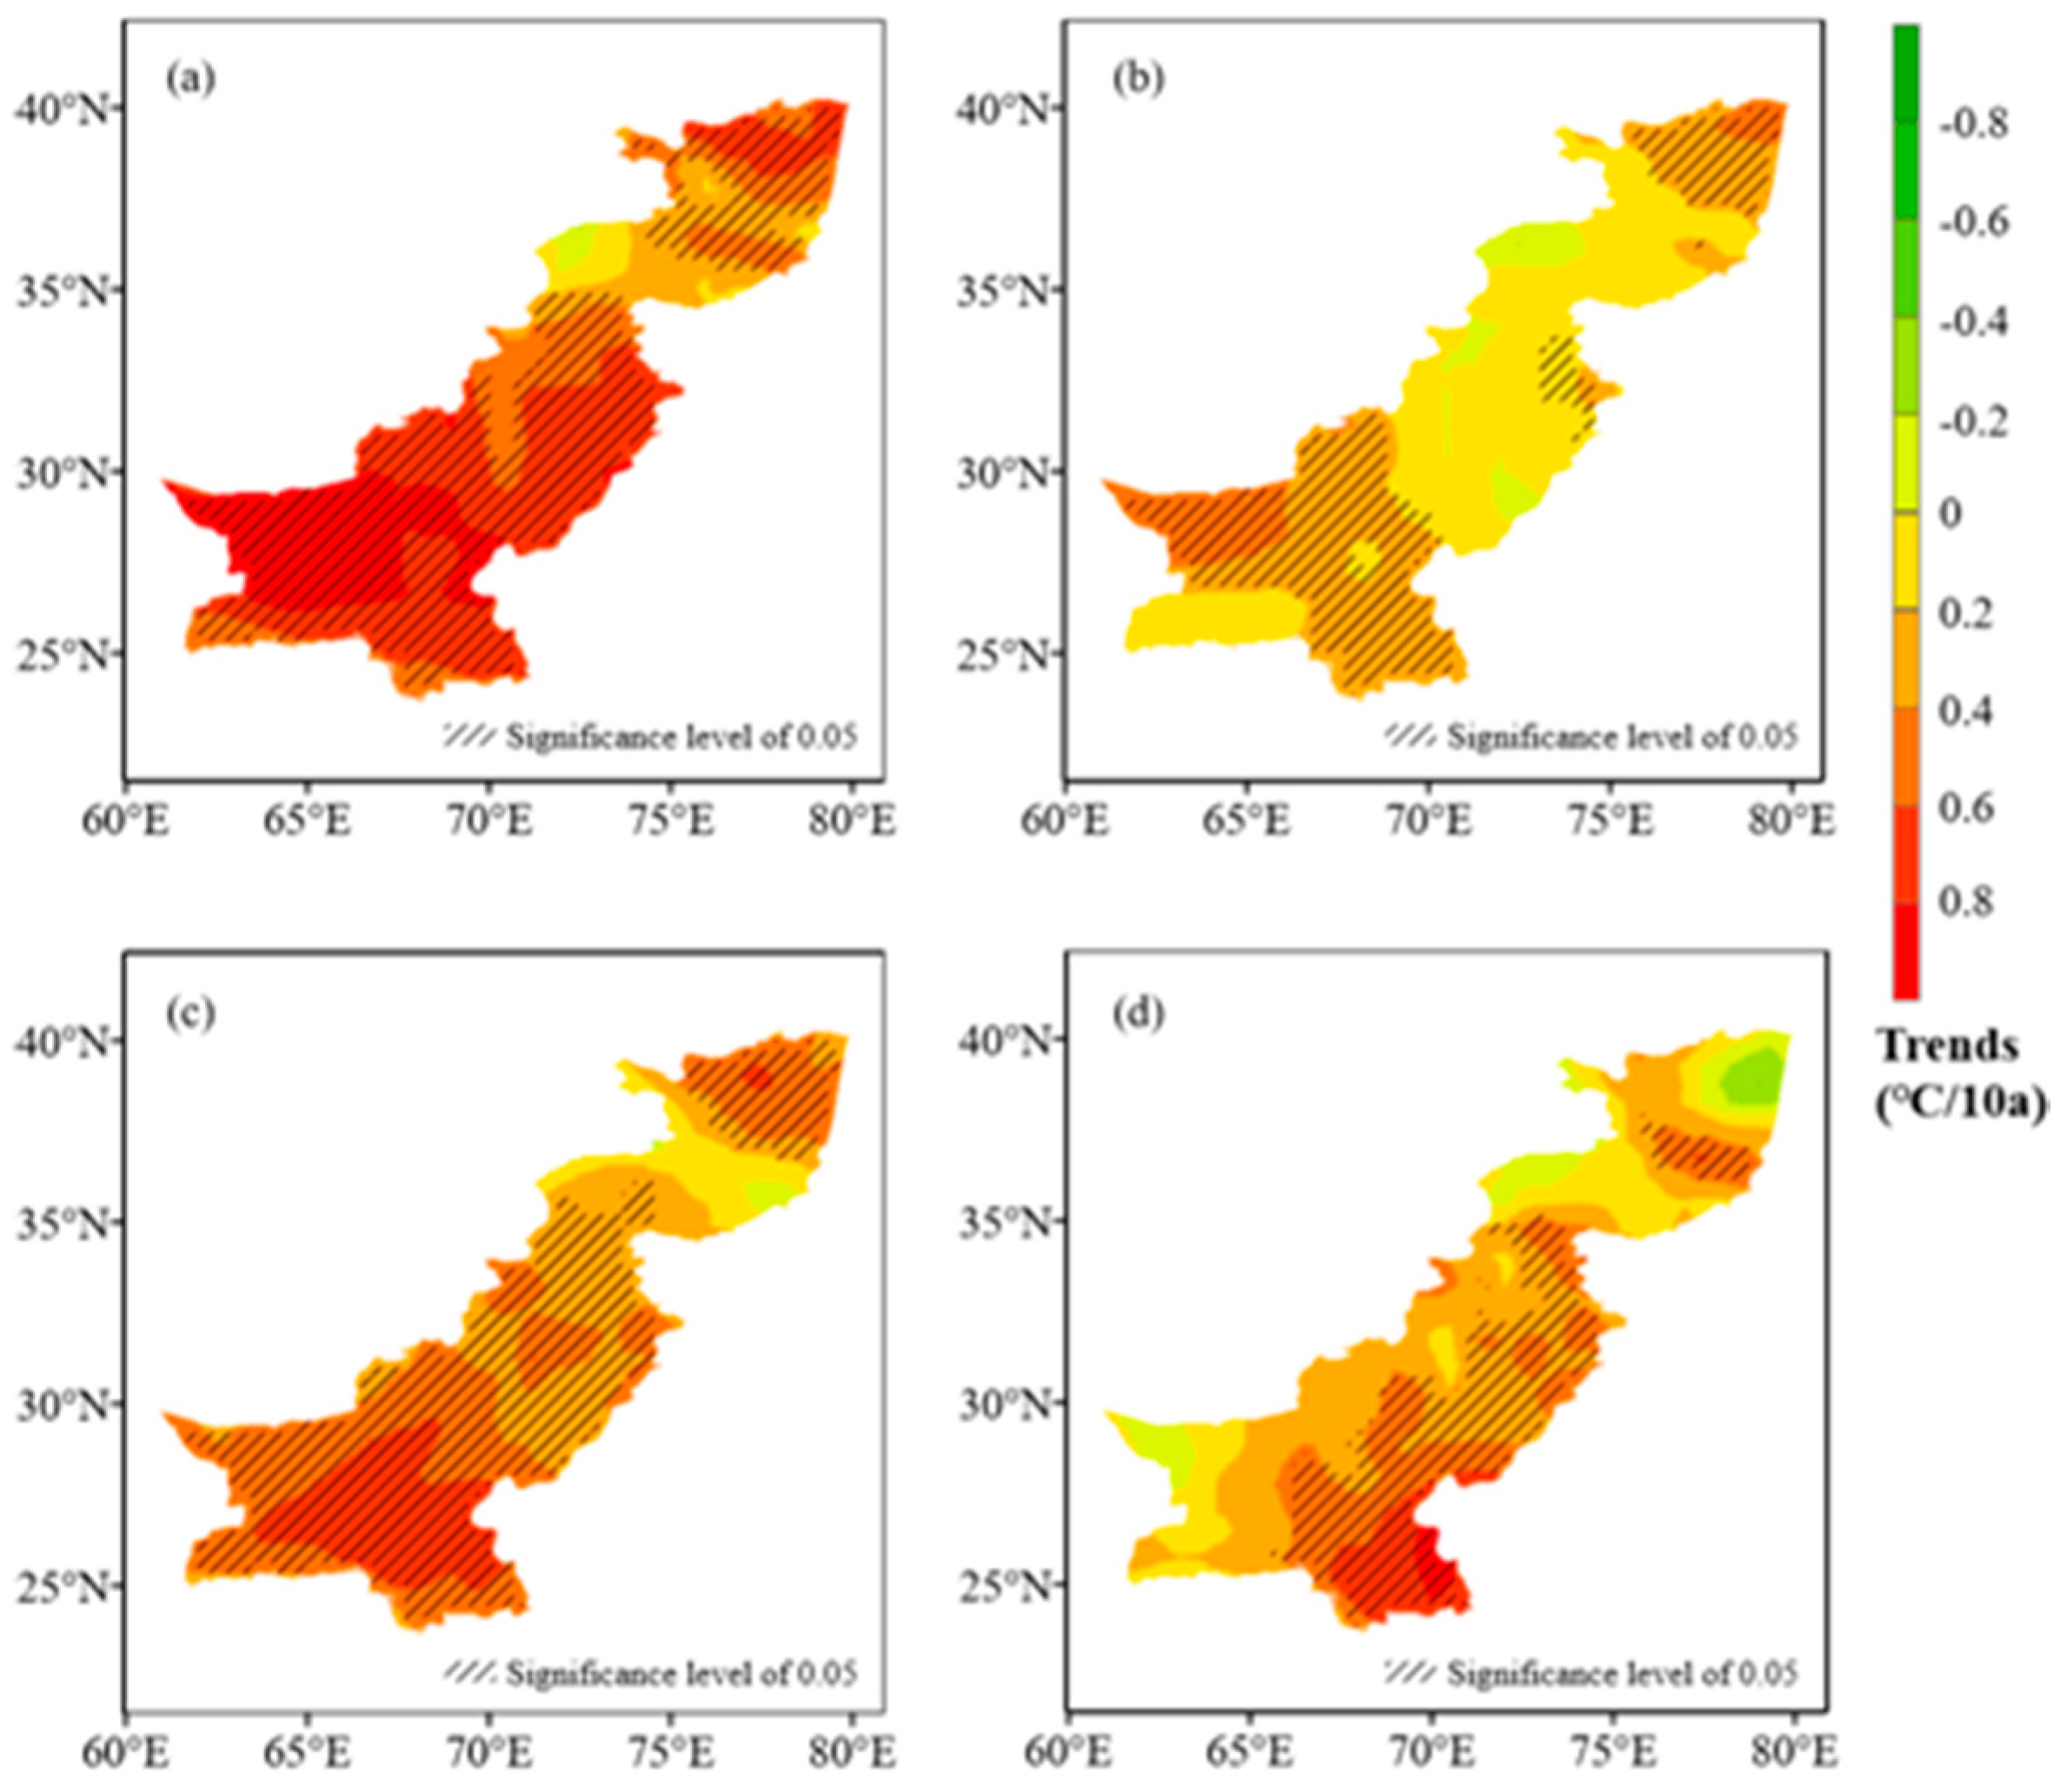
From the perspective of seasonal scale (
Figure 11), the trend of the UTCI in spring was the most extensive, showing a significant positive trend (
p < 0.05), except for the area near the Karakoram. The increase in most of the southern CPEC and Kashgar region was more than 0.8 °C/10a.
In summer, the rising trend of the UTCI was not obvious. Only in the south of Pakistan and the Kashgar region did the uptrend reach (0.2~0.6) °C/10a. The central region of the CPEC is overall not statistically significant and has not passed the t-test.
The trend of the UTCI in autumn was similar to that in spring, but the upward trend was not as obvious as that in spring. The upward trend in most regions was (0.2~0.6) °C/10a, but it also exceeded 0.6 °C/10a in some regions in southern Pakistan.
In winter, the downward trend of the UTCI in the CPEC was more than that in other seasons. In the Kashgar region and southwest Pakistan, the decreasing range reached (−0.4~−0.2) °C/10a, and the upward trend was more than 0.6 °C/10a in southeast Pakistan.
3.3. Contributions of Meteorological Factors to UTCI Variations
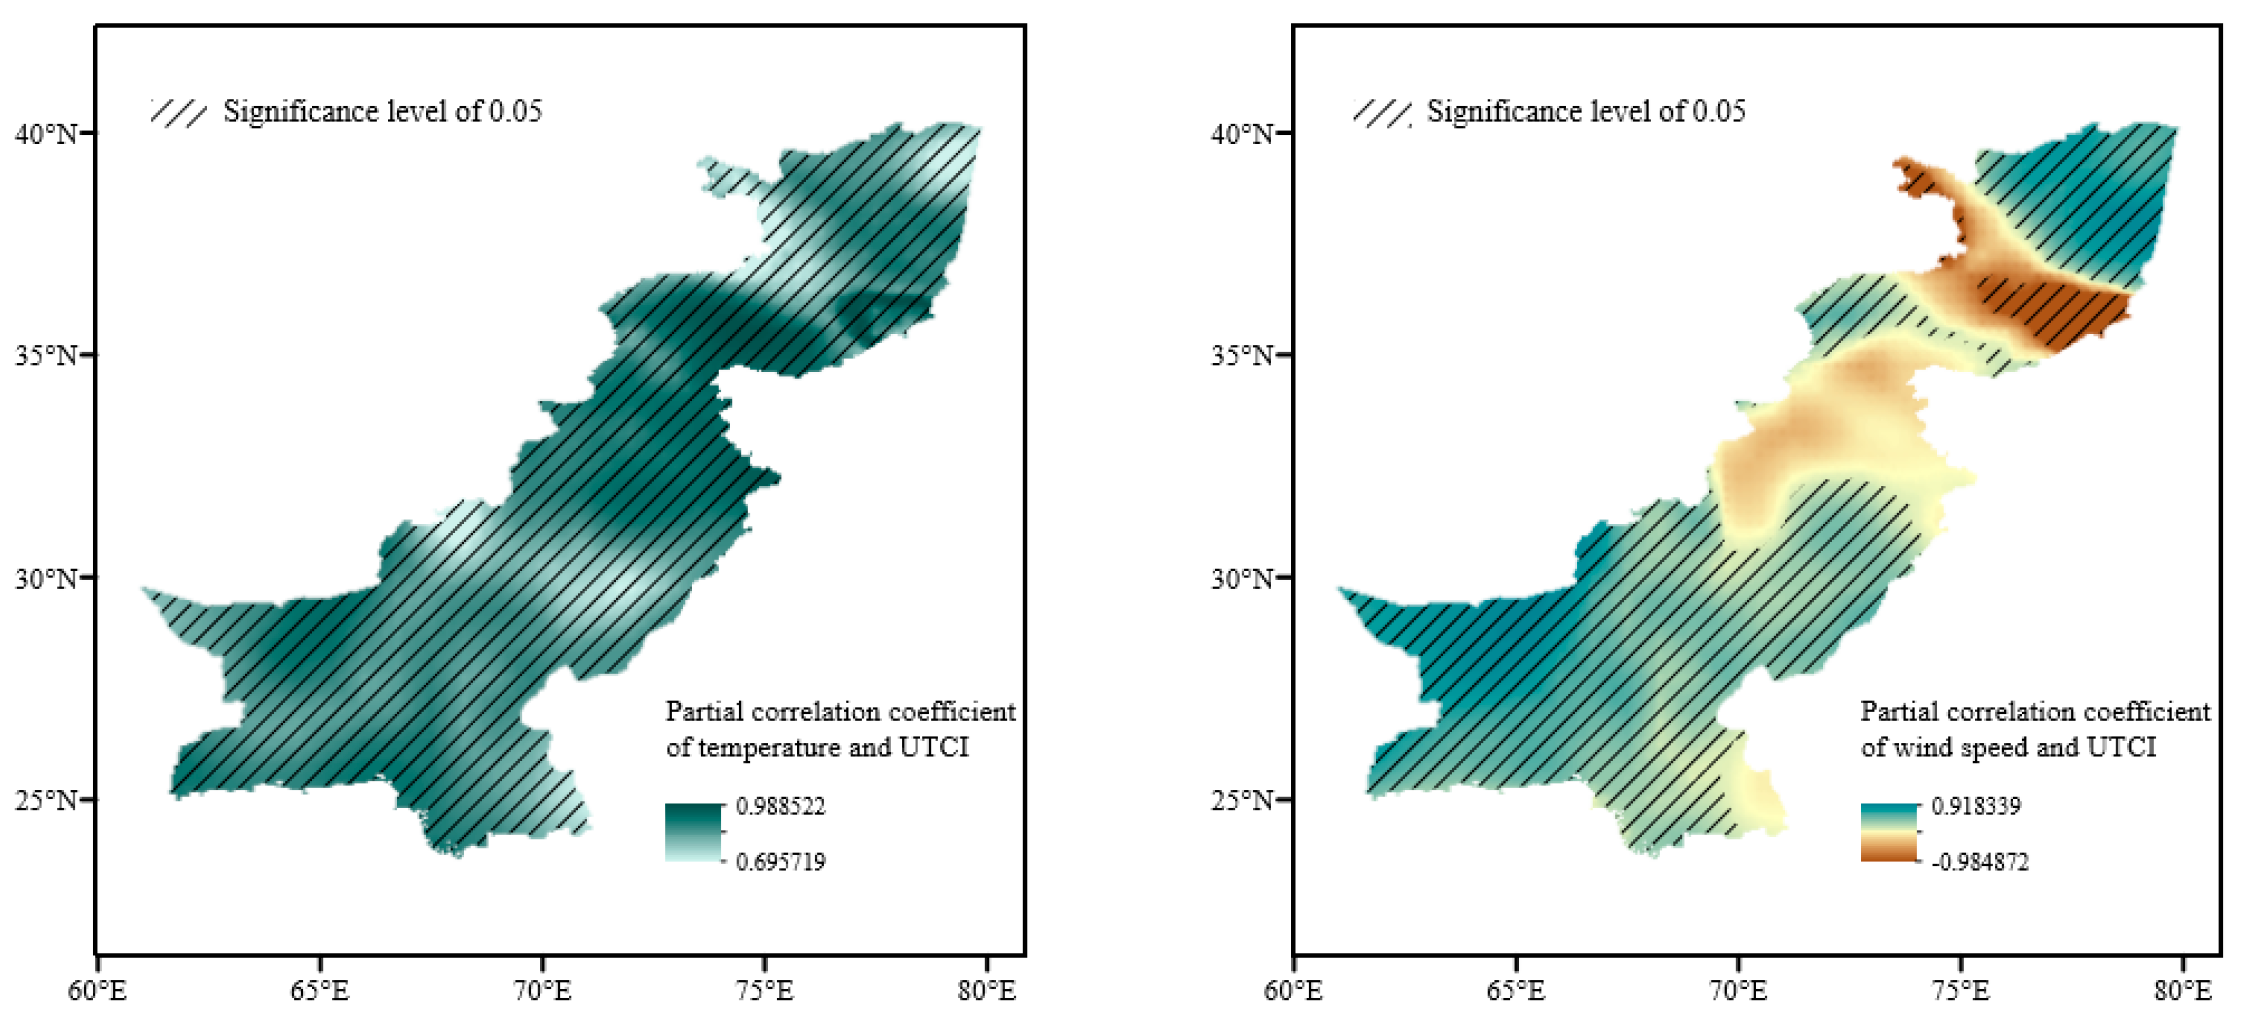
The spatial distribution of the partial correlation coefficients of meteorological factors and the UTCI are shown in
Figure 12. The partial correlation coefficients between air temperature with UTCI and between wind speed with UTCI were quite different. Temperature and UTCI were mainly positively correlated and had a strong significance. Wind speed and UTCI were negatively correlated in some areas, and some areas were not statistically significant.
From the partial correlation coefficient of air temperature with UTCI, the spatial distribution was even, and the correlation was positive in the whole area from 1979 to 2018. The area fractions were 100%, the partial coefficient was between 0.70 and 0.99 and 100% of the study area passed the t-test (p < 0.05). The places with low correlation were mainly distributed in Kashi area, the left edge of Karakoram and the central area of Indus River Plain.
The spatial distribution of the partial correlation coefficients of UTCI with wind speed had an obvious difference. The partial correlation coefficient between UTCI with wind speed was −0.98~0.92. The results showed that the area of positive correlation between UTCI with wind speed accounted for 91.41% of the total area, which was mainly distributed in Kashi area, the southern edge of Karakoram and the south-central area of Indus River Plain. The area fraction of 75.57% passed the t-test in the basin. The insignificant pixels were distributed mainly in the left edge of Karakoram and the upper Indus River Plain.
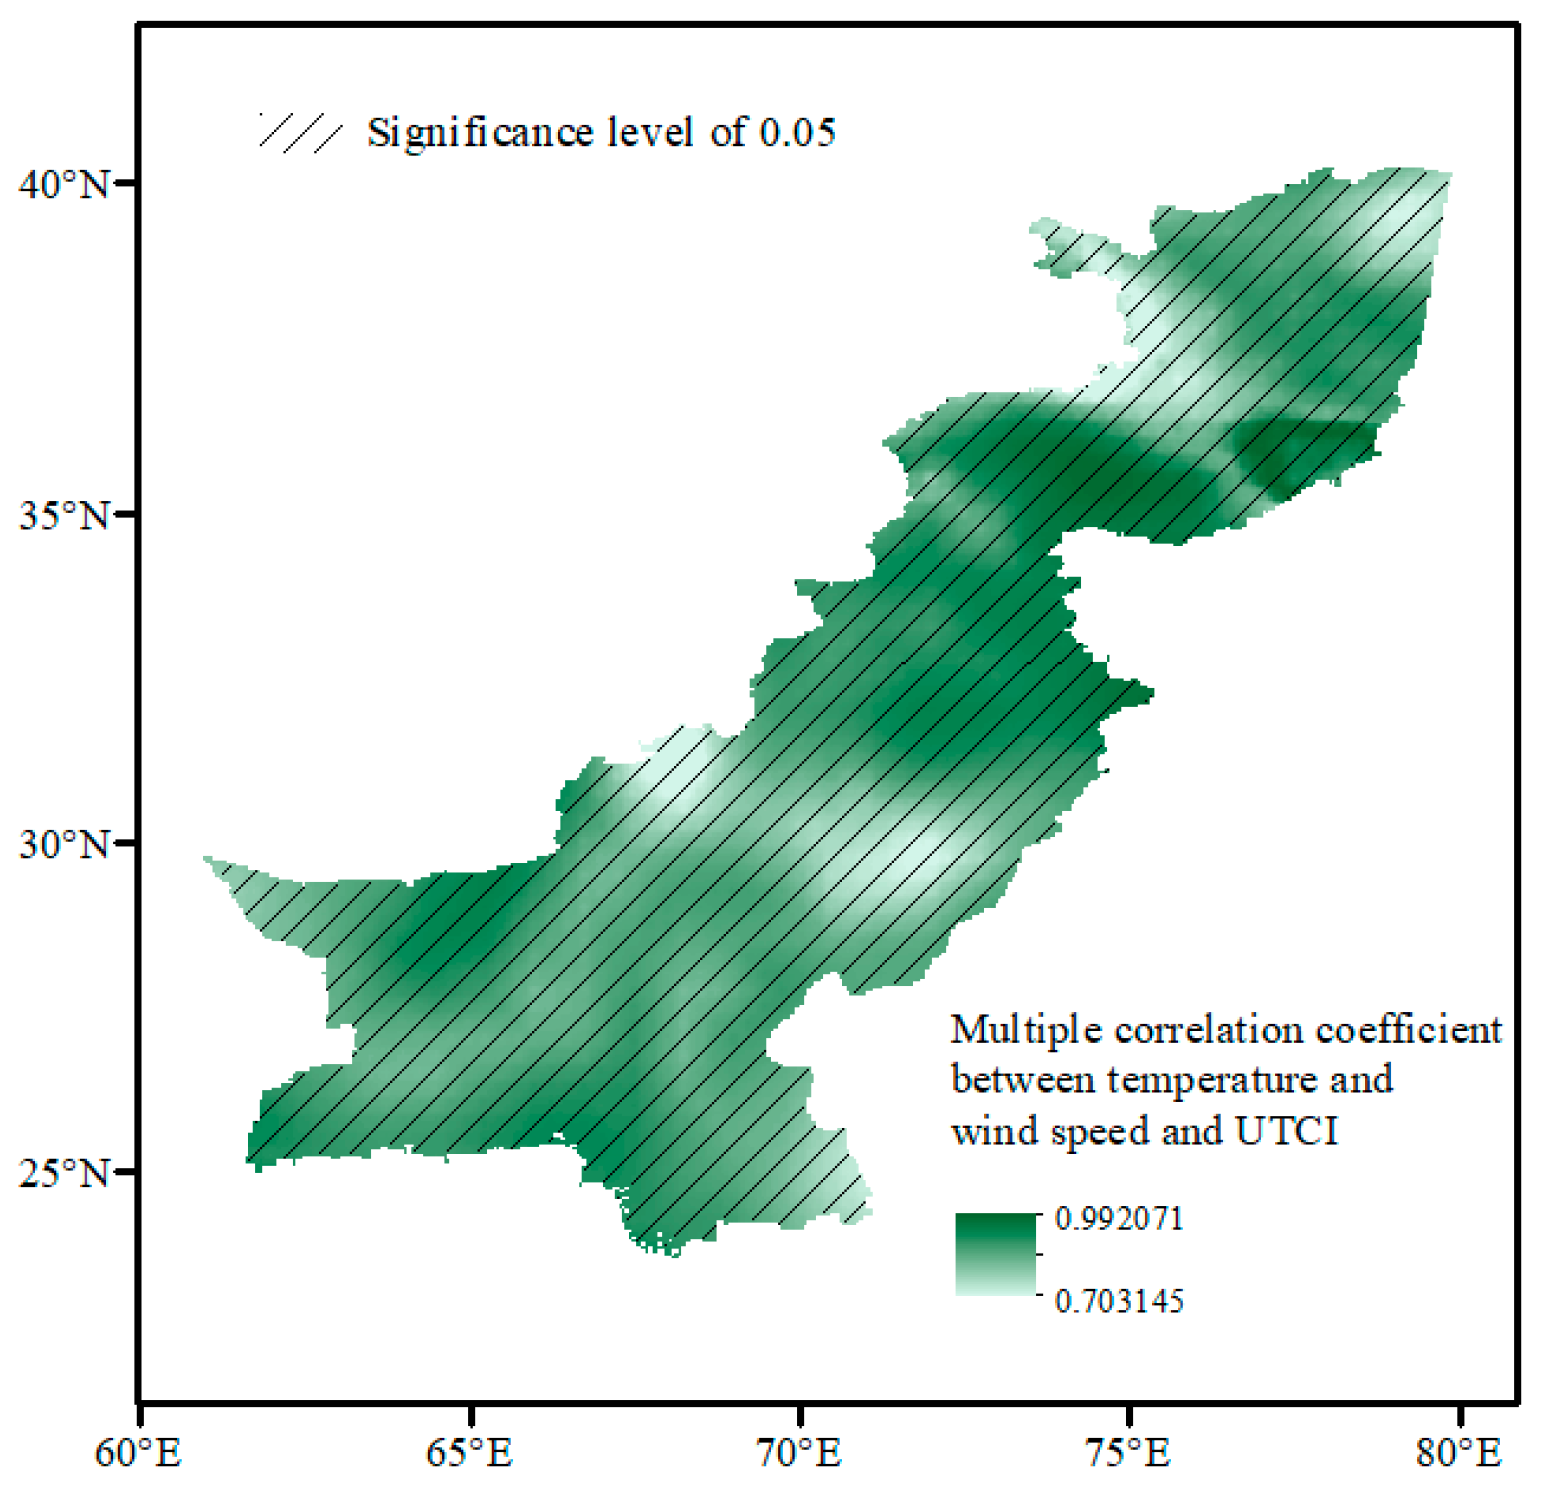
The spatial distribution of the multiple correlation coefficients between UTCI with air temperature and wind speed was shown in
Figure 13. The distribution characteristics of UTCI were consistent with the partial correlation coefficient of temperature with UTCI. The multiple correlation coefficient between UTCI and meteorological factors was concentrated between 0.70 and 0.99. The coefficient was only slightly higher than the partial correlation coefficient of temperature, indicating that temperature had a significant impact on UTCI. 100% of the area passed the
F-test (
p < 0.05).
4. Discussion
In this study, the spatial pattern and spatial-temporal changes of thermal comfort of the CPEC based on the UTCI were studied. The annual UTCI distribution of the whole region is affected by topography and latitude, which is consistent with the research conclusion of China [
42]. As the distribution of the CPEC is very long and narrow from the south to the north, most of the heat stress and cold stress can be observed in this region, which is more consistent with the characteristics of Russia [
18]. But, compared with Russia, the distribution of cold stress in the CPEC is more concentrated and stable, which is mainly distributed in the northern alpine region year-round. The natural barrier formed in the north mountain area blocks the cold air from going south, so even in winter, there is still no cold stress in the large area of the south. The UTCI value of the CPEC is generally increasing. Temperature is an important factor affecting the UTCI, so the rising trend may be related to the background of global warming. However, the reason why the growth trend of the UTCI in the first half of the year is faster than that in the second half of the year needs to be further studied.
The distribution characteristics of the UTCI can provide a scientific basis for the development of related fields and the formulation of adaptive measures. Take tourism as an example: tourism development is still in its infancy in this region, but with the economic development and the improvement of people’s living standard in the CPEC, there are broad prospects for tourism development. After applying the results of the UTCI to tourism, it was found that the CPEC is suitable for tourism in any season from the perspective of thermal comfort. Moreover, we expressed this conclusion in the form of a distribution map. The scientific thermal comfort products and services can help tourists to choose travel destinations and can be helpful for regional tourism planning. The CPEC has a large number of people, reaching 212.55 million. The high temperature is common in the Indus River Plain, with the maximum temperature of 40~45 °C. A high temperature of 53 °C has appeared in Jacobabad. At present, the world is in the background of climate warming. According to the Fifth Assessment Report of the Intergovernmental Panel on Climate Change (IPCC), the global average ground temperature has increased by 0.85 °C in more than 100 years [
44]. In these backgrounds, there is a strong demand for summer-avoiding tourism. Therefore, it is possible to develop Karakoram and its surrounding areas with cold stress as summer resorts, improve various glacier tourism projects, such as scenic spots and ski resorts, and also set up an International Ice and Snow Festival. Karachi is the largest city in Pakistan, located in the seaside area, with a wide demand for ice and snow tourism. The mountains around the city are the most attractive summer resort. Islamabad, the capital, is just near the plateau, and is also an important source of glacier tourists. For people in areas with strong cold stress, such as the western and Northern plateaus of Pakistan, they can go to the southern coastal areas, such as Karachi and other cities, to escape the cold. Therefore, the coastal areas can develop coastal sightseeing, sailing, diving and other special tourism projects. Meanwhile, Karachi is the nearest coastal city in Xinjiang Province, China, so Xinjiang Province is also a very important potential tourist market in the future. However, it is worth mentioning that tourism is not entirely dependent on the category of thermal stress but is also closely related to tourism elements such as traffic accessibility. Geological disasters such as mudslides, avalanches and landslides often occur in the northern mountainous areas. In addition, the situation in Pakistan is unstable and terrorism has not been completely eliminated. Therefore, the planning of the tourism industry should also consider the above factors.
The UTCI mainly considers the dressing habits of North America and Europe and may not be consistent with Asians on this point, which may have a certain impact on the calculation results. In addition, in this paper, the mean radiation temperature was calculated by using the radiation flux obtained from the simulation of cloud amount and temperature. There will be some errors in the results. However, it is found that the uncertainty of four meteorological inputs in the UTCI will not have a significant impact on the annual and seasonal thermal comfort assessment results [
45]. The UTCI in this paper was calculated at 00:00, 06:00, 12:00 and 18:00 UTC per day, i.e., 05:00, 11:00, 17:00 and 23:00 local time, which can only represent the overall UTCI value of a day. Therefore, if the UTCI is applied to tourism, it is necessary to consider the separation of daytime and nighttime. For specific tourism activities, higher time resolution thermal perception information is needed to provide more detailed and accurate reference for tourists and travel agencies in decision-making. Therefore, specific conditions need to be considered when the UTCI is applied to different fields in the future.
5. Conclusions
This paper is the first to investigate the spatial and temporal variations of the thermal bioclimatic conditions using the Universal Thermal Climate Index (UTCI) of the China-Pakistan Economic Corridor (CPEC). Our results showed that the UTCI across the CPEC decreased with the increase of latitude and altitude, indicating that it was under the influence of the natural geographical conditions. Most of the areas exhibited as “moderate heat stress” reached 61.63%. For the stress categories, most of the areas exhibited as “moderate heat stress” were in central and southern areas of the CPEC. “Strong heat stress” was mainly distributed in the south CPEC, while “slight cold stress” was mainly in the middle of Karakoram. Because of the high altitude and low air temperature, the UTCI showed “strong cold stress” in the high mountain area in Karakoram. “No thermal stress” prevailed in the south and north of the Karakoram, as well as mountainous regions in Baluchistan Province, reaching 11.49%. The distribution of the days of “no thermal stress” was relatively uniform in all areas, except around the Karakoram, at about 100–180 days per year. On the seasonal scale, “no thermal stress” accounts for the largest proportion in autumn, followed by spring, winter and summer.
The UTCI has generally exhibited a positive trend of 0.33 °C/10a over the past 40 years. However, the trend is negative for a small part of the edge of the Karakoram on the spatial scale. In the past 40 years, the area of the “no thermal stress” was the largest, and the areas of “very strong cold stress” and of “very strong thermal stress” were the smallest. On monthly scales, July, January and December are the most uncomfortable months of the year for tourism, and May, June, September and October are the most comfortable months. Temperature and UTCI were positively correlated in the CPEC, and wind speed had both a positive and negative correlation with the UTCI. Compared with wind speed, temperature has more influence on the UTCI.
The results of this study will be helpful for regional planning and will also contribute to comprehending the characteristics of the thermal environment in the CPEC.

 ,
, 


