Article

Local Weather Types by Thermal Periods: Deepening the Knowledge about Lisbon’s Urban Climate

Universidade de Lisboa, Institute of Geography and Spatial Planning (IGOT), Centre of Geographical Studies, Rua Branca Edmée Marques, Cidade Universitária, 1600-276 Lisboa, Portugal
*
Author to whom correspondence should be addressed.
Atmosphere 2020, 11(8), 840; https://doi.org/10.3390/atmos11080840
Submission received: 15 June 2020 / Revised: 1 August 2020 / Accepted: 5 August 2020 / Published: 8 August 2020
(This article belongs to the Special Issue Challenges in Applied Human Biometeorology)

Abstract

:
Urbanized hot spots incorporate a great diversity of microclimates dependent, among other factors, on local meteorological conditions. Until today, detailed analysis of the combination of climatic variables at local scale are very scarce in urban areas. Thus, there is an urgent need to produce a Local Weather Type (LWT) classification that allows to exhaustively distinguish different urban thermal patterns. In this study, hourly data from air temperature, wind speed and direction, accumulated precipitation, cloud cover and specific humidity (2009–2018) were integrated in a cluster analysis (K-means) in order to produce a LWT classification for Lisbon’s urban area. This dataset was divided by daytime and nighttime and thermal periods, which were generated considering the annual cycle of air temperatures. Therefore, eight LWT sets were generated. Results show that N and NW LWT are quite frequent throughout the year, with a moderate speed (daily average of 4–6 m/s). In contrast, the frequency of rainy LWT is considerably lower, especially in summer (below 10%). Moreover, during this season the moisture content of the air masses is higher, particularly at night. This methodology will allow deepening the knowledge about the multiple Urban Heat Island (UHI) patterns in Lisbon.

1. Introduction

The intensified artificialization of the earth’s surface is an ongoing process with severe impacts on local climate conditions. Cities are becoming extremely hot spots, forming Urban Heat Islands (UHIs), which correspond to the warmer air and surfaces compared to the surrounding countryside [1,2]. These thermal patterns are the most prominent climatic modification due to human activities [3]. Extensive research on UHI features has been carried out during the past several decades in over 400 major cities around the world [4,5,6]. According to [6] an urban area can be, on average, 4–5 °C warmer than its surroundings and, at peak, may duplicate its intensity. Along with these thermal heating patterns, future climate projections point to an increase of air temperatures and the number of very hot days (Tx ≥ 35 °C) and tropical nights (Tn ≥ 20 °C), particularly in the Mediterranean region. For instance, by the end of this century air temperatures will be 0.6 to 4 °C higher (RCP 4.5) in Europe and we will experience more frequent, intense, and longer heat wave events [7]. Furthermore, the last decade (2009–2018) was the warmest on record for the European land area, with an increase of 1.6 to 1.7 °C above the pre-industrial level on the average annual temperature [8].
Today, over half of the world’s population (55%) lives in urban areas and by 2050 there will be almost 70% of urban dwellers [9], which correspond to approximately 6 billion citizens [10]. The combined effects of UHI patterns and climate change scenarios will strongly jeopardize human thermal comfort and wellbeing in urban areas [6,11,12].
Meteorological conditions are one of many driving factors of UHI intensity and spatial distribution [1,13,14,15]. Particularly, wind (speed and direction) and cloud cover (amount and height) are considered the most relevant meteorological parameters [16,17,18]. According to [5], this happens because the amount of clouds and wind affect both insolation and ventilation and, consequently, the radiative and turbulent exchanges in and around an urban area. Regarding the first climatic element, in general, lower cloud heights and denser cloud cover can effectively weaken UHI. As for the wind component, in general UHI intensity decreases with the increase of wind speed [5,12]. For these reasons, anticyclonic weather situations (calm, dry, and clear nights in most cases) are considered ideal for the development of strong urban thermal patterns [1,17,19]. Additionally, there are several studies that highlight the effect of precipitation on UHI mitigation because during this process urban temperatures drop and, then, the difference between its surroundings is reduced, even though this effect is dependent on both the intensity and duration of rainfall [12].
Despite these conclusions, little is known about the variation of UHI by weather types that classify atmospheric conditions in an urban area because the analysis period is usually very limited and focused on the conditions that generate the strongest UHI patterns [5,14,20]. In addition to that, only a limited amount of studies tried to evaluate the combined effect of all meteorological parameters and not only cloud cover and wind by constructing and applying a LWT classification.
In order to reduce the complexity of atmospheric conditions to a limited number of distinctive frequent patterns, atmospheric systems can be classified by weather types, air masses, synoptic conditions, barometric patterns, etc. [21]. The terms “pattern” and “type” are often misleading in the literature. On one hand, weather or circulation patterns usually describe the regional synoptic conditions and the types of atmospheric circulation in altitude, while the latter term refers to local climate conditions described by surface meteorological observations such as air temperature, wind, cloud cover, humidity parameters, precipitation, etc. [18,22,23]. Most research dedicated to the driving factors of UHI focused on the effects of regional synoptic conditions. For instance, the authors of [14] examined the characteristics of UHI in Melbourne (Australia) by synoptic weather conditions using local weather data and reanalysis data of mean sea level pressure between 1973 and 1991. Results showed that statistically significant anomalous anticyclonic conditions were associated with the warmest 17% and coolest 1% of UHI events. Later, the authors of [23] produced a weather pattern classification in order to determine the relevant conditions for UHI and their future changes in Hamburg (Germany). They also concluded that anticyclonic weather patterns are favorable for the development of an intense UHI. In addition to that, the frequency of days with these strong thermal patterns will stay the same in the future (2071–2100).
According to [14], the weather phenomena occurring in urban areas is part of the continuum of large-scale atmospheric circulation systems whose interactions with urban scales of climate vary daily, depending upon the prevailing synoptic conditions. Despite this dependency relation, it is crucial to closely evaluate the UHI variations by weather types because one synoptic pattern does not generate the same meteorological conditions in two locations close to each other but with distinct morphologic and topographic features [24,25]. Trying to open the door for a better analysis and communication of climate information in local climate studies, [18] presented and tested a LWT classification in Toulouse (France) which will be the starting point for the present study. According to the authors, a LWT refers to a description of states of the atmosphere above a location in their usual succession that define its local climate.
Therefore, this research focuses on an adaptation and application of a LWT methodology in an urban area located in the Mediterranean Region (Lisbon) suited for a future detailed analysis of the distinct thermal patterns and spatial contrasts/gradients in the city (UHI, cool islands, etc.). Additionally, the generation of synoptic patterns will allow investigating the influence of large-scale circulation patterns on local meteorological conditions. This final task of the research aims to obtain the identification of the main types of synoptic circulation that lead to the establishment of the different LWTs in Lisbon, by applying an objective approach.

2. Materials and Methods

2.1. Study Area

Lisbon’s city, with an area of ≈ 100 km2 and almost 550,000 inhabitants (2011 census), is located on the Portuguese west coast (38°43′ N; 9°9′ W), approximately 30 km east of the Atlantic Ocean and on the right bank of the Tagus river. This urban area has a rugged relief with four main valleys on the meridional part and a plateau at north. The maximum altitude varies between 160 m, in the built area near the estuary, and 226 m on the western half where the Monsanto hill often prevents the penetration of maritime air masses, which are also partially blocked by the Sintra mountain (529 m) located NW of Lisbon [21,26,27,28].
According to [29], climate conditions of an urban area are dependent on its macroclimate, regional conditions, local context, and the particular features of its urban fabric. The proximity of the Atlantic Ocean and the Tagus estuary, the topography, and wind regime shape the climate conditions of this city at a regional and local context [21,30,31]. Lisbon has a temperate climate (Köppen Csa) with a dry and hot summer and a moderate and rainy winter [31,32,33]. Its geographical position implies a seasonal shift between Subtropical Highs and the Subpolar Low-Pressure Belt. For this reason, this city and the whole Mediterranean region are very sensitive to changes in the global mean climate state [34]. Mean annual temperatures stay around 16.8 °C, even though the average minimum temperatures stay below 10 °C in January and in August (the hottest month) the average maximum temperatures reach 28.3 °C [33], 1971–2000 Climatological Normal—https://www.ipma.pt/pt/oclima/normais.clima/1971–2000/012/. However, recently, 2018 year was really hot with five heat waves in mainland Portugal, two in the summer season and three in autumn. Furthermore, the month of August was the second hottest month since 1931 and especially the period between days 1 and 6, where maximum temperatures surpassed 40 °C during four consecutive days. At Lisbon’s airport weather station (Figure 1) the highest recorded value (43.9 °C) was reached during this time period [35]. The total mean annual precipitation is quite moderate and varies between 650 and 760 mm. Most of the rainfall occurs between November (160 mm) and February [33]. N and NW winds are very common in the city despite the great seasonal variability of the wind regime [26,27]. These N air flows occur in 45% of summer days (June to August), especially in summer afternoons (70%) and promote pollutant dispersal and a significant cooling of the city [36]. On the other hand, weak and humid SE to SW breezes from the ocean and the Tagus estuary appear only in 30% of the late mornings and early summer afternoons, when N winds weaken or disappear. Nevertheless, they are responsible for an important cooling of the riverfront and city center, which are usually warmer than the remaining urban area [26,27,28,32]. It should also be noted that clouds are common throughout the year, especially in winter where there are ten to fifteen days per month with maximum cloud coverage [37].
Lisbon’s UHI has been investigated since the 1980s decade but only in 2004 a meteorological network was installed with approximately eight points spread throughout the city by the CliMA Research group (at present Zephyrus-Climate Change and Environmental Systems) from the University of Lisbon [28,38,39]. This network allowed a more detailed observation and modelling of UHI features. Therefore, recent work has shown that this thermal heating pattern can be observed throughout the year, even though it is more pronounced in summer (UHI > 4 °C) than in winter. Median values of 2 °C were recorded at night and 1.8 °C during the daytime. As opposed to what has been recorded in most studies, in Lisbon the highest UHI frequencies took place with N, NW, and SW winds of 2 to 4 m/s and 4 to 6 m/s [28].

2.2. Input Meteorological Data

The workflow for the classification of weather types was based on the approach of [21], who applied a statistical clustering method using a set of climatic variables to define the weather situations representative of Toulouse. According to the authors, input meteorological data must cover a sufficiently long period, so the full diversity of a LWT affecting the site will be represented, typically over about ten years. Therefore, hourly data of air temperature, specific humidity (kg/kg), wind speed (m/s) and direction (degrees), cloud cover (tenths), and precipitation (mm) from 2009 to 2018 recorded at the Airport weather station (Figure 1; elevation: 114 m) and from reanalysis (European Centre for Medium-Range Weather Forecasts model or ECMWF), in cases when station data was not available or had too many missing records, were used as input variables in the case of Lisbon. Table 1 describes the features of data sources used.
The selection of cells in the case of reanalysis data was based on the proximity to the airport weather station and the greatest possible distance from a mountainous alignment Sintra-Montejunto, located at NW of the city, which has significant influence on the cloud cover and precipitation amounts of the surrounding area. Furthermore, it was crucial to choose a cell relatively away from the model boundaries in the case of ERA 5 Land since this reanalysis model is not available for large water masses such as the Atlantic Ocean.
A specific humidity was calculated in the R software (version 3.2.3; humidity package [40]) using as input data hourly air temperature recorded at the airport weather station and average sea level pressure from the reanalysis. Wind direction was classified in octants (Table 2). Cloud cover was only available for Lisbon with a higher spatial resolution (25 km).
Unlike [18], who first determined the number and features of weather types and then analyzed them by season of the year, in this study meteorological input data were initially divided by daytime/nighttime periods and by thermal periods. The separation of the data in daytime and nighttime periods considered the variation of the sunrise and sunset hours throughout the year. However, the twilight hours covering dawn and eventide were excluded. Thus, the daytime period starts exactly 1 h after the sunrise and ends 1 h before the sunset and the nighttime period starts 1 h after the sunset and ends 1 h before the sunrise. From these two data sets, daily averages of each climatic variable were estimated with the exception of cloud cover, in which the most frequent daily value was determined.

2.3. Thermal Periods

So far, seasonal analysis of thermal patterns in the urban climatology field has been carried out according to either astronomical seasons, that are based on the natural rotation of the earth, or meteorological seasons, which correspond to three months sets designed according to the annual thermal cycle and the Gregorian calendar. However, none of these seasonal divisions fits the present study because current climate modifications are changing weather and temperature patterns and, consequently, the timing and duration of seasons. One of the most concerning modification is the expansion of summer as a thermal season [41]. For instance, in Lisbon hot weather conditions and its related effects (heat waves and forest fires, for instance) linger towards the month of October which is traditionally part of the transition season (summer to winter) and temperatures should drop slowly while the amount of precipitation increases. Therefore, there is an urgent need to redefine the traditional season periods.
In this investigation a new seasonal division was built based only on the annual cycle of maximum and minimum air temperatures to identify the hottest and coldest periods of the year which may be masked in the transition periods. Therefore, daily air temperature data from the last ten years (2009–2018) registered at the Lisboa/Portela Airport weather station were used for this purpose and a cluster analysis (Software: Genesis 1.8.1) was applied to the time series in an attempt to pinpoint time periods with similar thermal features throughout the annual temperature cycle. K-means was used as an optimization method, which corresponds to a relatively simple and robust non-hierarchical clustering technique that minimizes the intra-cluster compactness of the output, in terms of mean squared error [42]. Initially, the number of clusters is chosen, and each input point is assigned to the nearest cluster centroid based on a distance measure. The software chosen offers eleven different similarity distance measurements, ranging from a simple Pearson correlation or Euclidean distance (the latter was selected in this case as well as for the generation of LWT) to more sophisticated approaches such as mutual information or Spearman’s rank correlation coefficients [43]. Four clusters were selected with the purpose of identifying extreme and intermediate thermal periods. As for the settings a maximum of 50 iterations was chosen as well as five runs on each attempt (these parameters were maintained for the generation of LWT). The results allowed constructing a frequency table that counts the number of times that each day of the year, during the 10 years, is part of each cluster. If at least in seven of the ten years of observations a certain day is classified in a given group, then it stays permanently in that season. The deadlines for each thermal period were defined based on the distribution of the clusters throughout the year, considering that a given period ends when there is a sequence of five or more consecutive days classified in another cluster. Table 3 presents the four thermal periods generated and Figure 2 shows the annual cycle of maximum, mean, and minimum air temperatures.
The traditional designations were maintained but it should be noted that this classification is related only to the thermal characteristics. There are significant differences in timing and duration between the thermal periods generated and traditional astronomical seasons. The coldest period of the year starts about one month before the astronomical winter and ends about two weeks before expected, with an average minimum temperature below 9 °C and an average maximum temperature reaching 15 °C. Successively, spring keeps its duration with a two-week lag. The most notable modification happens in summer and autumn: The hottest period of the year starts two weeks earlier than the traditional summer and lasts 120 days, with a mean temperature of 23 °C and a mean maximum temperature about 30 °C, shortening the astronomical autumn by half. Transition periods present a similar thermal behavior with decimal differences on mean temperature values (average temperature of 17 °C). However, the daily average thermal amplitude is greater in spring (8.1 °C) than in autumn (6.8 °C), showing that the transition from the coldest period of the year to the warmest lasts longer than the transition from summer to winter and does not happen gradually. Instead, in fall, the temperature drop is quite regular and sharp and lasts about one and a half month. Ultimately, it is relevant to consider that the temporal period chosen for the construction of these thermal periods was particularly hot compared to previous decades, which may largely explain the expansion of the warm season towards autumn.

2.4. LWT Classification

Considering that each urban area has its unique topographic, climatic, and morphological features, and a great diversity of relationships between synoptic conditions and topoclimatic contrasts, any attempt to produce a LWT classification has its amount of subjectivity and peculiarity [24]. Therefore, at the surface and on a local scale the description of atmospheric conditions should incorporate a combination of climatic variables observed at a certain location. As described in Section 2.1. (input meteorological data), for Lisbon air temperature, specific humidity, wind speed and direction, precipitation, and cloud cover were chosen as input variables for the LWT classification. These data were divided into daytime and nighttime periods and in thermal periods, thus generating eight sets of weather types (winter day and night, spring day and night, summer day and night, and autumn day and night). Since some climatic elements have a wide range of values, especially wind direction, all input data were normalized by calculating the mean and standard deviation of each distribution.
As for the generated thermal periods, the combination of these climatic variables on a daily scale was made through a cluster analysis, using the K-means method. According to the literature, this is the most commonly used method for classifying weather patterns and types [23,43,44]. The optimal number of LWT was defined from the sum of the intra-cluster variance, after its successive increment. Thus, the greatest difference between the sum of the variance of a given cluster and the previous cluster defines the final number of weather types obtained. Table 4 presents the several attempts which sought to maximize the similarity between the combinations of climatic elements in each daily period.
The diversity of LWT generated is lower in the transition periods than in extreme thermal periods. A detailed label was assigned to each LWT based on average meteorological conditions. Table 5 and Table 6 define the respective designations and thresholds for all five climate variables.

2.5. Synopitc Patterns

In order to establish a bridge between local meteorological conditions and regional synoptic patterns, weather circulation types were calculated for the same time period of the LWT. This classification was based on the work of [45], who developed a geographically extended weather type classification over Europe. In addition, the authors of [46] applied the same methodology in order to analyze the precipitation regime in Portugal. This atmospheric categorization was constructed according to the Jenkinson-Collinson (JC) classification system. Therefore, the ERA 5 reanalysis sea level pressure data (spatial resolution: 25 km; coordinates (selected pixel): 38°75’ N; −9°25’ W; https://www.ecmwf.int/en/forecasts/datasets/reanalysis-datasets/era5; retrieved at 25/10/2019) at 12:00 p.m. were introduced in a “jcext” package [46] from the R software exclusively dedicated to produce a classification of weather pattern and for a given location it computes at each grid 11 main weather patterns (Table 7) during the time period designated for the analysis.
Even though it was assumed that local meteorological conditions may change between day and night, synoptic weather patterns were generated only for the daytime period since it was assumed that regional conditions do not differ as widely within hours. Therefore, synoptic conditions estimated at noon were presumed as representative of the entire day (including the nighttime period). A score between 0 and 1 was assigned to each day. Basic weather patterns are classified with a score of 1 and scores of 0.5 or 0.33 correspond to hybrid weather patterns. Hence, hybrid patterns represent the combination of two (0.5 + 0.5) or three basic flows (0.33 + 0.33 + 0.33) and were also considered in the analysis. Days with a weak flow from any direction are classified as “U” (undefined). This situation occurs more often in summer, where approximately 19% of the days were excluded of the classification, against 11% in autumn, 9% in spring, and 5% in winter.
Ultimately, the correspondence between synoptic weather patterns and local meteorological conditions, specially wind direction, was analyzed to confirm the influence of regional flows on the local climate.

3. Results and Discussion

3.1. Lisbon’s LWT

This section describes in detail all eight sets of LWT generated for Lisbon by thermal periods and day periods. In general, meteorological conditions in this city are characterized by a low moisture content of the air (average daily specific humidity below 0.01 kg/kg), except in summer, especially at night, and in some autumn LWT. Furthermore, wind blows generally from N and NW, often with moderate speed (average daily values of 4–6 m/s), slightly higher during the daytime. These general results are consistent with other investigations. Firstly, the authors of Ref. [21] built a weather type classification also for Lisbon using as input variables a thermal anomaly (difference between air temperature and monthly average), cloud cover, the zonal and meridian component of the wind and wind rotation between 12 p.m. and 18 p.m. Furthermore, the author carried out a detailed analysis of the weather types generated and the relationships with thermal comfort conditions. His results showed that weather types with a consistent N or NW wind represented 34% of the time period analyzed.
Table 8 and Table 9 present the average meteorological conditions in winter. First and foremost, daily mean air temperatures are relatively low in winter (below 15 °C in all daytime and nighttime LWTs) and cloud cover is usually moderate to high. Air masses coming from the E quadrant are usually dry and in some winter days are responsible for the occurrence of extreme cold events from Siberian cold air masses trajectories that cross the European continent reaching Portugal extremely cold and with a very low moisture content.
Very cold, sunny, and dry with light NE and E wind days present the lowest daily mean air temperatures both in daytime (10.9 °C) and in the nighttime period (8.5 °C), along with the lowest daily mean specific humidity (0.0053 kg/kg during day and 0.0052 kg/kg at night). Moreover, the presence of clouds is relatively low and, for that, the occurrence of precipitation is unusual (0.9 mm on average in both day periods), although in 5% of the days the daily average accumulated precipitation can be greater than 24 mm.
In addition, even though the daily average wind speed is relatively weak, on 10% of days wind blows at speeds greater that 11 m/s. These local meteorological conditions occur in 26% of winter days and in 22% of winter nights. According to [21] findings, NE and E LWTs are frequent in winter and in the transition periods and can be characterized by weak wind speeds and clear skies. These LWTs represented 16% of the studied days and only in some cases registered high cloud coverage.
Differently, cold and rainy LWTs (between 14 and 15 mm on average; in 5% of day cases over 46 mm and in 5% of nights 25 mm) develop from SW air masses and are described by an usually high cloud coverage (eight tenths during day and nine tenths at night), which explains the lowest radiative losses and, consequently, the highest daily mean air temperatures (14.5 °C during the day and 13.4 °C at night). In addition, wind speed is often moderate to strong (daily mean wind speed over 6 m/s both during the day and night; on 5% of winter days and on 10% of nights wind speed reaches at least 10 m/s) and, even though according to the thresholds defined, these LWTs are considered dry, the daily average specific humidity is the highest of all winter LWTs (0.009 kg/kg during day and 0.0088 kg/kg for the nighttime period). Rainy conditions are the less frequent LWT of winter days and nights (14% in each day period). The authors of [21] pointed out that on days with W weather types SW and W flows are predominantly associated with very cloudy sky conditions. These LWTs were observed in 16.4% of days.
The most frequent winter LWTs correspond, on one hand, to N air masses that, despite their Atlantic origin, have a low moisture content (daily average specific humidity of 0.0058 kg/kg during the day and 0.0061 during the night), provide very low rainfall (2.3 mm on average during the daytime and 2.8 during the nighttime) and even though their average speed is quite moderate (4.2 m/s), on 5% of days wind blows at a speed greater that 8 m/s. Furthermore, they provide relatively sunny (three tenths during the daytime and four tenths at night) but cold weather conditions, with daily average air temperatures close to NE and E LWTs, 12.4 °C (daytime) and 9.8 °C (nighttime), even though on 5% of days average temperatures reach 7 °C and in 5% of nights drop to 5 °C. These meteorological conditions occur in 23% of winter days and 33% of winter nights.
On the other side, in 37% of winter days and in 31% of winter nights wind blows at a light to moderate speed (4 m/s at the daytime period and 3 m/s during the nighttime period) without a dominant direction. Therefore, weather conditions are characterized by relatively low air temperatures (13.7 °C during the day and 12 °C during the night; on 5% of days air temperatures drop to 7 °C and lower), high cloud coverage (eight tenths for the day and seven tenths for the night) and, consequently an accumulated average precipitation of 2.4 mm during the daytime period and 2.8 mm during the nighttime, besides the relatively low humidity content of these air masses (0.008 kg/kg for both day periods).
The LWTs of the transition period between winter and summer are quantitatively described in Table 10 and Table 11. Similar to winter, the moisture content of all spring LWT is relatively low (below 0.01 kg/kg) and the sky is often half covered by clouds (cloud coverage varies between four and seven tenths). Rainy weather (17% of spring days and 28% of winter nights), both during the day and night, are responsible for lower daily average air temperatures, especially during the daytime where this LWT also corresponds to the coldest meteorological conditions (15.5 °C). Likewise, during the daytime period cloud coverage is higher (seven tenths) and wind blows stronger (daily average wind speed of 6.2 m/s; in 5% of days exceeds 10 m/s), with a well-defined direction (W and S), which may explain the higher daily average accumulated precipitation (12.6 mm on average; in 5% of days reaches 27 mm). In contrast, during the nighttime period average wind speed is considerably lower (3.8 m/s) and with a variable direction and, then, the daily average accumulated precipitation falls below 6 mm but the 5% rainiest nights register an average accumulated rainfall equal or higher than 24 mm.
The remaining spring LWTs are relatively similar to each other, both during the day and night, but with differences in the thermal field. They may be defined by the influence of N and NW air masses during the daytime and only N at nighttime, with a moderate speed (between 4 and 6 m/s) but slightly higher during the day (even though on 5% of cold and cool dry N wind nights the average wind speed reaches 8 m/s) and also a very low average accumulated precipitation (equal or less than 2 mm daily). According to [21], the spring N LWTs present average wind speeds of 3 to 6 m/s and, in some days, higher than 6 m/s.
The first set of these N and NW LWTs (“Cold or Cool and dry with moderate wind”) and the most frequent (42% of spring days and 40% of nights) presents a lower daily average air temperature (15.6 °C during the day and 12 °C during the night), while in the second one the thermal conditions are more pleasant (21.5 °C by day and 16.7 °C by night) and is almost as frequent as the previous one (occurs in 41% of spring days and in 32% of spring nights).
Sequentially, summer weather conditions are described in Table 12 and Table 13. As one can see, the moisture content of summer LWT is generally high. Rainy conditions are the least frequent LWT in this season (occur in only 2% of days and 9% of nights) and can be described by a significant amount of cloud coverage, especially during the day (seven tenths against five tenths at night). Additionally, these LWTs are the most humid both during the day and night (daily average specific humidity of 0.0130 and 0.0121 kg/kg, respectively).
Nevertheless, the meteorological conditions differ slightly between both periods of the day: Air masses coming from S and SW register high speeds during the day, greater than 7 m/s and in 5% of days can reach 12 m/s, and are generally weak at night, with a daily average speed of 3.9 m/s. Consequently, daily accumulated precipitation at daytime is significant heavier during the day (16.8 mm on average; on 5% of days surpasses 42 mm) than at night (5.8 mm; on 5% of nights reach 16 mm).
In the remaining summer LWT the sky is relatively clear and the probability of rain is very low. During the daytime two other LWT sets can be differentiated based on their thermal conditions. In the first set (“Hot, sunny, dry and windy from N quadrant” in 27% of summer days and “Hot and humid with a light NW wind” in 29%) average daily air temperatures are similar (22.7 °C) but the N air masses from the first LWT present a significant higher speed (7.6 m/s on average; on 5% of days reach 10 m/s), similar to the daytime rainy LWT, a lower moisture content (0.0095 kg/kg on average) and are responsible for an increase in the cloud coverage (five tenths). In contrast, NW air masses present a weaker speed (4.8 m/s on average) and a higher water vapor content (daily average specific humidity of 0.0113 kg/kg) but the amount of clouds associated is considerably lower (two tenths).
Ultimately, two very hot daytime LWTs can occur (“Very hot, sunny and dry with moderate and variable wind” and “Very hot, sunny and humid with moderate W and NW winds”) and must be taken into special consideration given their harmful effects on human health and thermal comfort and their frequency (11% of summer days for the first LWT and 31% for the second one). They are described by a very low cloud cover (two tenths and one tenth, respectively), high daily average air temperatures (between 26 and 27 °C; on 10% of these two very hot LWT air temperatures reach, on average, 31 °C) and moderate wind flow (4.6 and 4.7 m/s on average, respectively). Nonetheless, the first very hot LWT wind direction varies considerably throughout the day, the moisture content of the air masses is lower (daily average specific humidity of 0.0095 kg/kg), and air temperature is, on average, lower by 1 °C against the second very hot LWT, with well-defined humid (daily average specific humidity of 0.0101 kg/kg) and hotter (27.2 °C) W and NW winds.
At night, besides rainy weather conditions, other three summer LWTs were defined and can be distinguished, at first glance, by their thermal characteristics (Cool, Mild, and Hot, respectively). The first one (“Cool, clear and humid”) occurs in 37% of summer nights and is defined by a low cloud cover (two tenths), moderate N wind (daily average wind speed of 6.1 m/s; on 5% of nights reaches 9 m/s), high humidity content (daily average specific humidity of 0.0101 kg/kg), and an average temperature of 18 °C. The second one (“Mild and humid”) also occurs in 37% of summer nights but presents a more significant cloud coverage (five tenths) and weaker N and NW winds (4 m/s on average), slightly wetter (daily average specific humidity of 0.0110 kg/kg), and almost 1 °C warmer (on 5% of nights air temperature reaches on average 28 °C). Finally, the third LWT (“Hot, clear and dry”, on 17% of summer nights) presents the least amount of cloud cover during summer nights (one tenth), the higher nighttime average air temperatures (almost 24 °C), corresponding to typical tropical nights, and the weakest and driest winds (daily average speed of 3.6 m/s and daily average specific humidity of 0.00860 kg/kg) from N. According to [21], the summer N LWT presented clear skies or with very low cloud coverage, weak or moderate winds (3 to 6 m/s on average) and occurred in 35% of July and August days.
Similar to spring, in the transition season between summer and winter the diversity of local weather conditions is less than in extreme thermal periods (Table 14 and Table 15). During autumn nights, all LWTs present a higher humidity content (daily average specific humidity above 0.01 kg/kg), while during daytime only rainy weather situations are relatively humid (0.0105 kg/kg on average). Regarding this latter LWT set, in 28% of autumn days and 24% of nights cloud cover is expectedly high both during the day and night (eight tenths) and wind flow is moderate (5 m/s on average; on 10% of days and on 5% of nights wind speed reaches 9 m/s).
Even though during the daytime the wind direction is well defined (S, SW, and W), at night the wind flow is often variable and rainfall is much heavier (14.8 against 8.9 mm on average during autumn days; on 5% of days and on 10% of nights the average rainfall surpasses 26 mm).
The second set of LWT composed of NE and E air masses occurs in 42% of autumn days and in 30% of nights and presents better cloud cover conditions, especially during the day (three tenths against five tenths during the nighttime period), along with the highest daily average air temperatures during this season (21 °C during day and 18.1 °C at night). However, the moisture content is usually higher during the nighttime period (daily average specific humidity of 0.0104 kg/kg against 0.0089 kg/kg at daytime) but the probability of rain is almost null.
The final and most frequent autumn LWT set (occurs in 30% of days and in 46% of nights) is characterized by the presence of cool or cold N air masses, which generate a moderate cloud coverage (four tenths in both periods) and the lowest daily average air temperatures (15.8 °C during the day and 13.9 °C at night; on 5% of nights air temperature drops to 10 °C and lower). During the day, these air masses are quite dry (daily average specific humidity of 0.00730 kg/kg) but with an average accumulated precipitation of 3.2 mm, and windier (daily average wind speed of 5.2 m/s). At night, the wind speed drops to 3.4 m/s on average but the moisture content maintains (daily average specific humidity of 0.0079 kg/kg) and the average accumulated precipitation is only 2.1 mm.
In order to understand which local meteorological conditions may inhibit or intensify the UHI intensity, a connection between [28] the detailed research previously presented and these LWTs was established. According to the authors, a strong UHI (>4 °C) is more frequent in the summer, while in winter the lowest UHI mean was verified (1.7 °C). Furthermore, higher intensities were not associated with an atmospheric calm but with N, NW, and SW winds of 2 to 4 m/s and 4 to 6 m/s, due to the importance of the shelter effect from Northern cold or cool winds. On the other hand, winds blowing above 8 m/s at the Airport area seemed to inhibit the occurrence of strong UHI inside the city [28]. According to these findings, three daytime summer LWTs (hot and humid with a light NW wind; very hot, sunny, and dry with moderate and variable winds; very hot, sunny, and humid with moderate W and NW winds) and three nighttime summer LWTs (mild, humid, and rainy with a light and variable wind, especially from S and SW; mild and humid with a light N and NW wind; hot, clear, and dry with a light N wind) provide favorable conditions for the development of strong UHI patterns. This fact presents huge concerns for thermal comfort and health conditions since these meteorological conditions present the higher daily mean air temperatures, especially during the daytime.
In addition, it is relevant to highlight some limitations related to this investigation: First of all, the sources of input meteorological data are quite distinct due to the lack of homogeneous series. Consequently, some variables were obtained through complex models that reconstruct the past climate conditions and do not correspond exactly to direct field measurements. In addition, two different reanalysis datasets were used with different spatial resolutions and, for that, different levels of subjectivity and uncertainty. Furthermore, only the current LWTs were produced and interpreted but the assessment of the evolution of the frequency and characteristics of these LWTs since the mid-20th century would make a powerful contribution to this work in order to recognize the influence of climate change at a local scale.

3.2. LWT and Regional Synoptic Patterns

Throughout the year the prevailing regional synoptic conditions that influence Lisbon’s local climate are marked by the presence of an anticyclonic flow or A (Table 16 and Table 17 and Figure 3). Correspondingly, the authors of [46], that performed a weather pattern classification for the European Continent, verified that A is the most frequent type, followed by C, W, and LF. Furthermore, the authors of [21] argued that in Lisbon the anticyclonic weather pattern corresponds to a great diversity of LWT and covers very distinct situations, which may cause the advection of different air masses over mainland Portugal.
As one might see in rainy LWTs, which are often distinguished by a SW local flow, the prevailing regional pattern is anticyclonic. However, summer day and night rainy LWTs present a regional pattern conducive with local wind flow (SW and W). These findings are in line with [21] results, who stated that W LWT with SW and W flows were associated with disturbed circulation situations from W to SW or to the south bank of depressions (autumn and winter). Sometimes, on early and late summer and on intermediate periods, these LWTs were linked to the anticyclonic margin with a low pressure gradient. Likewise, regional synoptic conditions leading to winter and autumn NE and E LWTs are characterized by an anticyclonic flow which, in this case, might explain the predominantly low moisture content of these air masses. As reported by [21], NE and E LWTs were associated with an anticyclonic circulation on a continental trajectory and to situations in which the anticyclone is located between the Iberian Peninsula (IP) and the Mediterranean or the North of Africa. In some cases, these LWTs were linked to stationary depression cells.
LWTs with prevailing N winds are influenced by distinct regional flow conditions (W, A, NE, and U in most cases). Nevertheless, N LWTs defined by [21] were associated with N and A regional flows. In addition, the significance of hybrid regional patterns in this investigation is minimal throughout the year.
In winter and even though the IP is more affected by low-pressure systems, in most LWTs the anticyclonic flow corresponds to the most frequent synoptic pattern. Only cold, sunny, and dry winter days with moderate N winds and cold and rainy winter nights evade this pattern, with W regional flow as the prevailing synoptic pattern (with a frequency of 17.4% and 14.7%, respectively). Furthermore, some secondary synoptic patterns should be considered due to their frequency: On one hand, on cold, sunny, and dry winter days with moderate N winds the regional anticyclonic and cyclonic flows have a frequency of 12.3% each and, on the other hand; on cold and rainy winter nights the cyclonic flow represents almost 15% of days, as well as on cold and rainy nights the anticyclonic pattern (14%) has almost the same influence on local weather conditions as the W flow (14.7%). According to [47], in winter and autumn, apart from A and C regional patterns, there is a large proportion of W, SW, and NW synoptic flows.
In spring, the conflict between the Low-Pressure systems and Subtropical High-Pressure Systems is notable, with low pressures tending to rise in latitude as the Northern Hemisphere summer approaches. Thereafter, the frequency of synoptic patterns is more evenly distributed across different regional flows. Despite this, in spring rainy LWT the anticyclonic and cyclonic flows at a regional scale share similar weighting: During the daytime period anticyclonic flow is slightly more frequent (17% against 15% of days with a cyclonic flow) and the reverse happens at the nighttime period (cyclonic flow represents 18% of rainy spring nights and the anticyclonic flow is the prevailing flow on 15% of rainy nights). In the remaining spring LWT the anticyclonic and E flows have greater relevance in local climatic conditions, with a frequency of days ranging between 13% and 18%. Nonetheless, it is important to highlight the portion of days with an undefined/weak regional flow (frequency of 7% to 11% in most spring LWTs). As mentioned by [21], spring N LWTs are linked both with the progression of NW perturbations (cyclonic circulation) and the influence of a depression located at N of the IP.
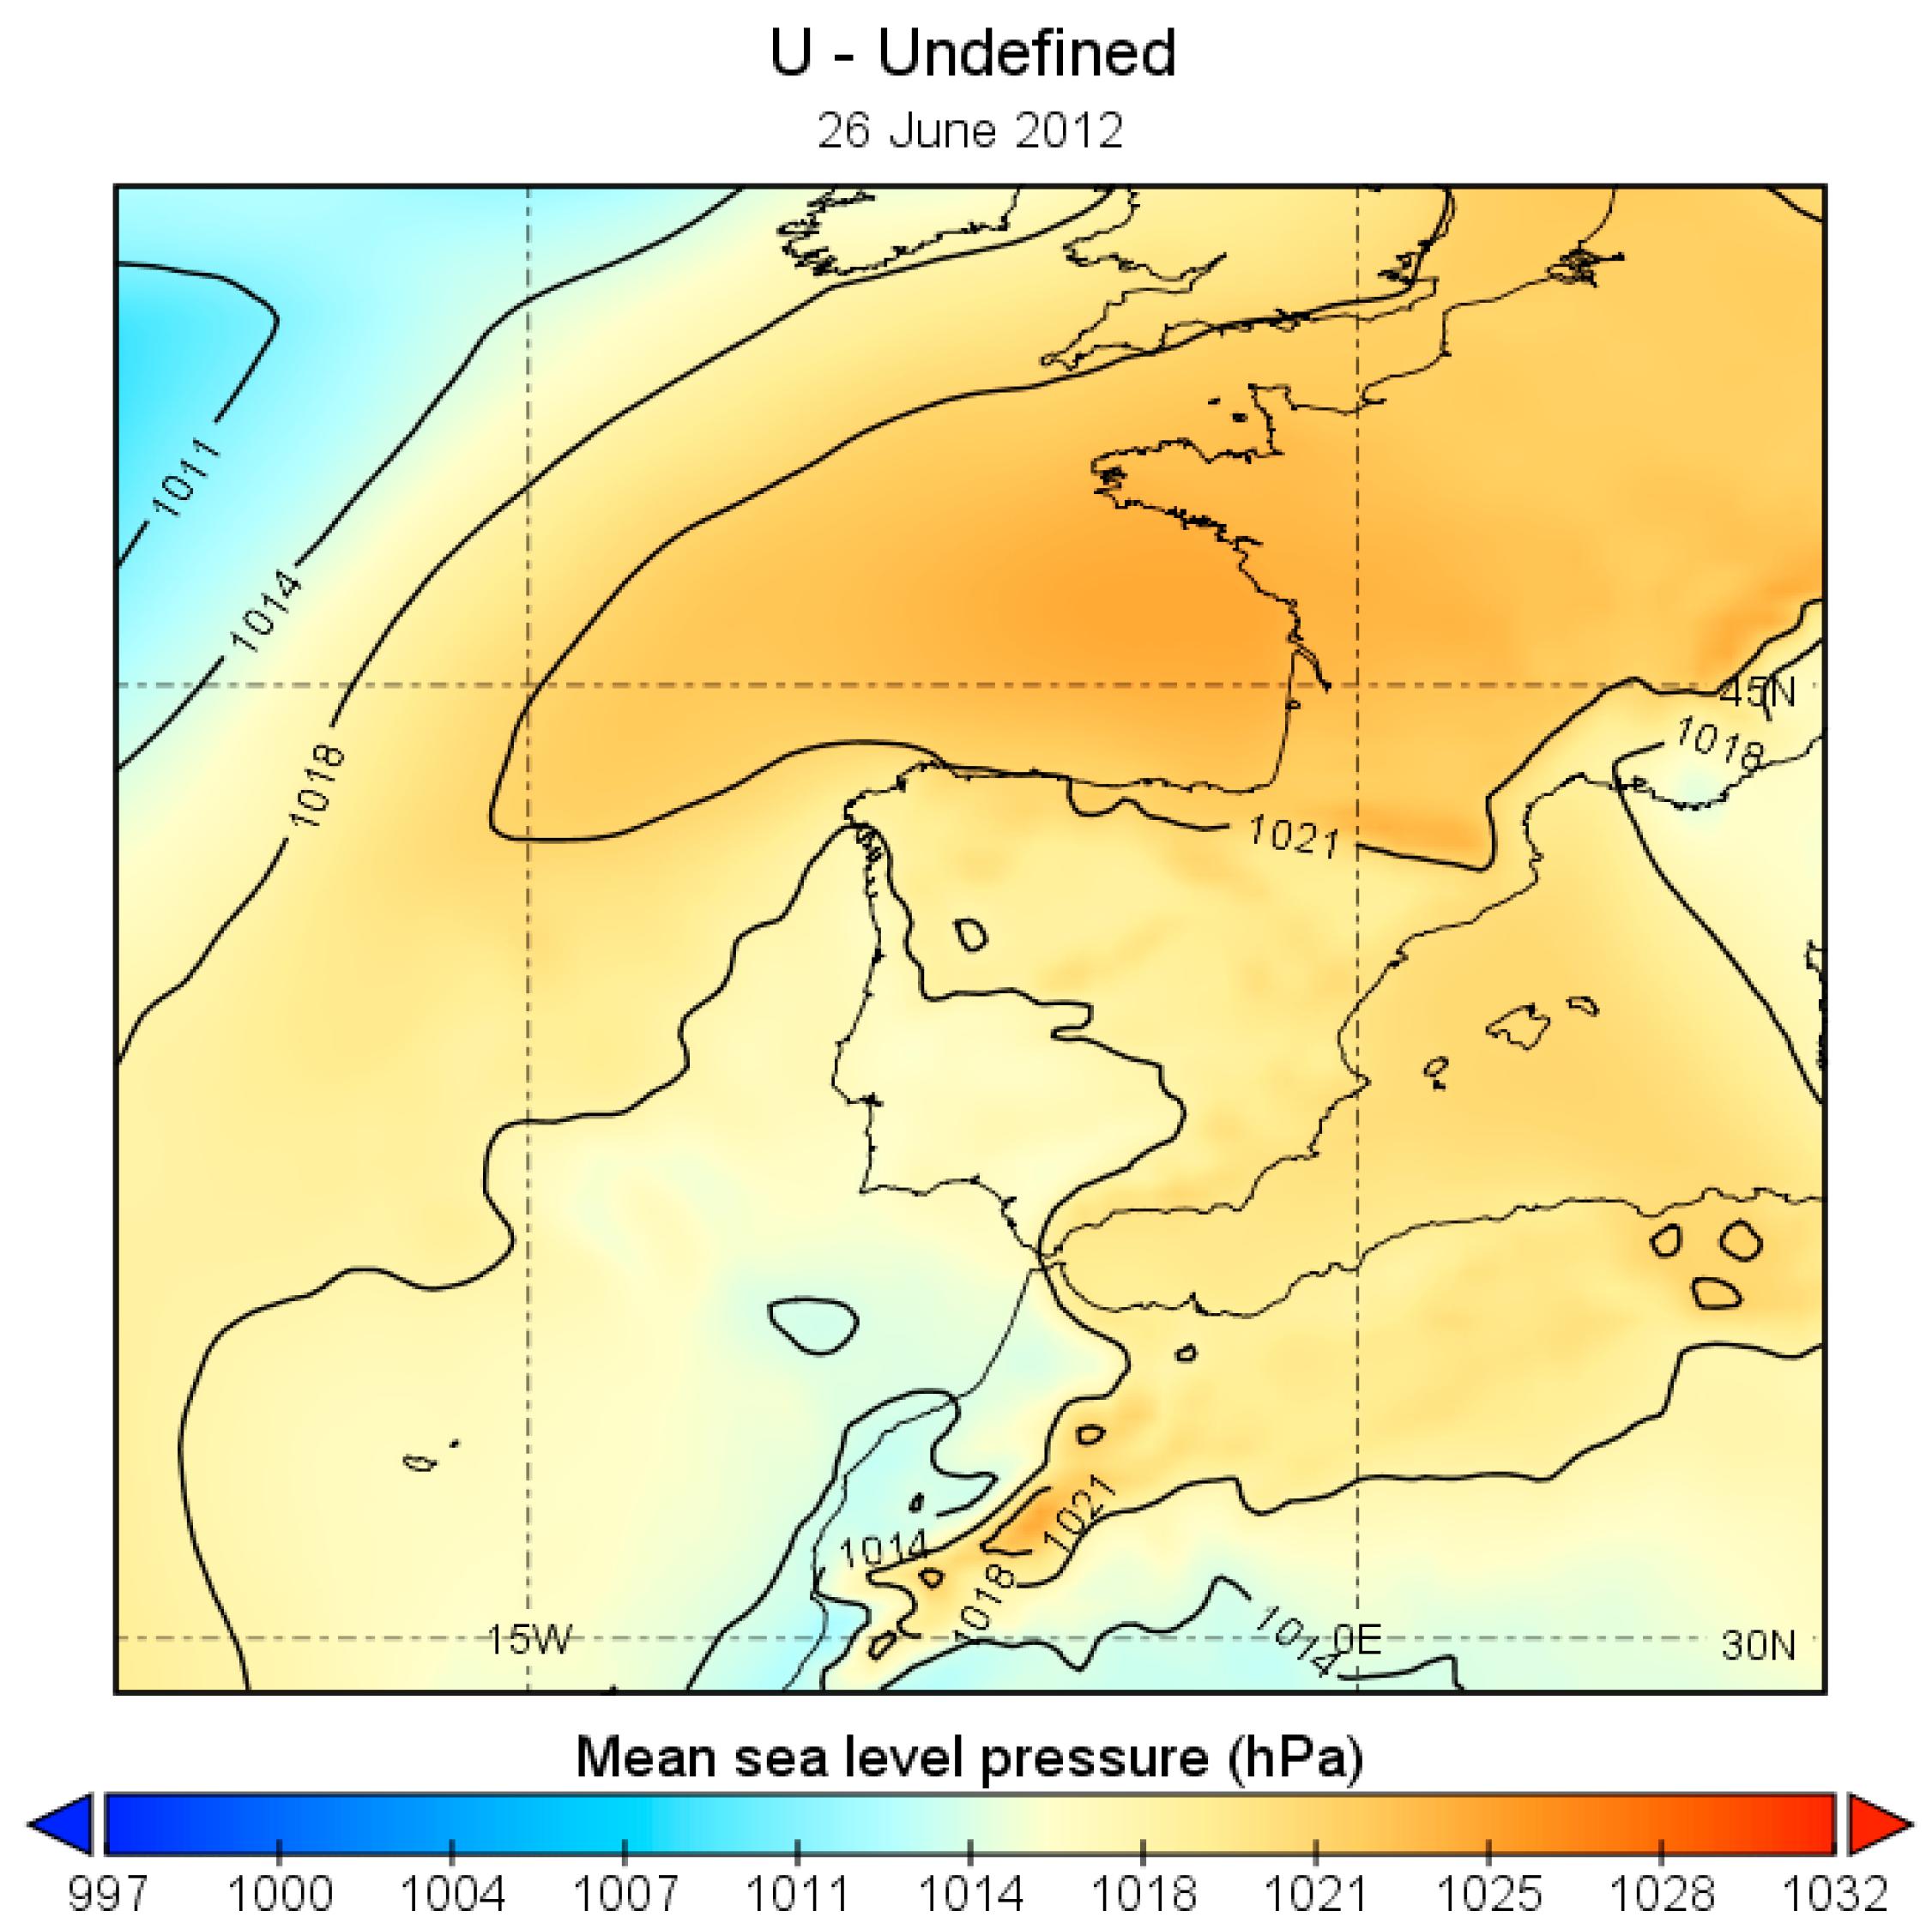
Sequentially, summer weather conditions in Lisbon are highly influenced by the Subtropical Highs, particularly the semi-permanent Azores High. However, the anticyclonic regional flow no longer represents the most frequent regional pattern in any summer LWT and it is only the second most important regional flow in one daytime LWT (in 21% of hot and humid days with a light NW wind) and in two nighttime LWTs (in 19% of both cool, clear, and humid nights and mild and humid nights). The number of days with a weak regional flow is considerably higher in this season (Figure 4): During the daytime, especially in hot and humid conditions with a light NW wind (23%) and in hot, sunny, and humid days (26%). Nevertheless, at night the undefined flow represents 26% of mild and humid LWT, 18% of rainy LWT, and 21% of hot, clear, and dry LWT. The relevance of the “undefined” synoptic circulation is clearly related to the frequent formation of thermal lows above the Iberian Peninsula during summer [48], due to the intense surface heating over land.
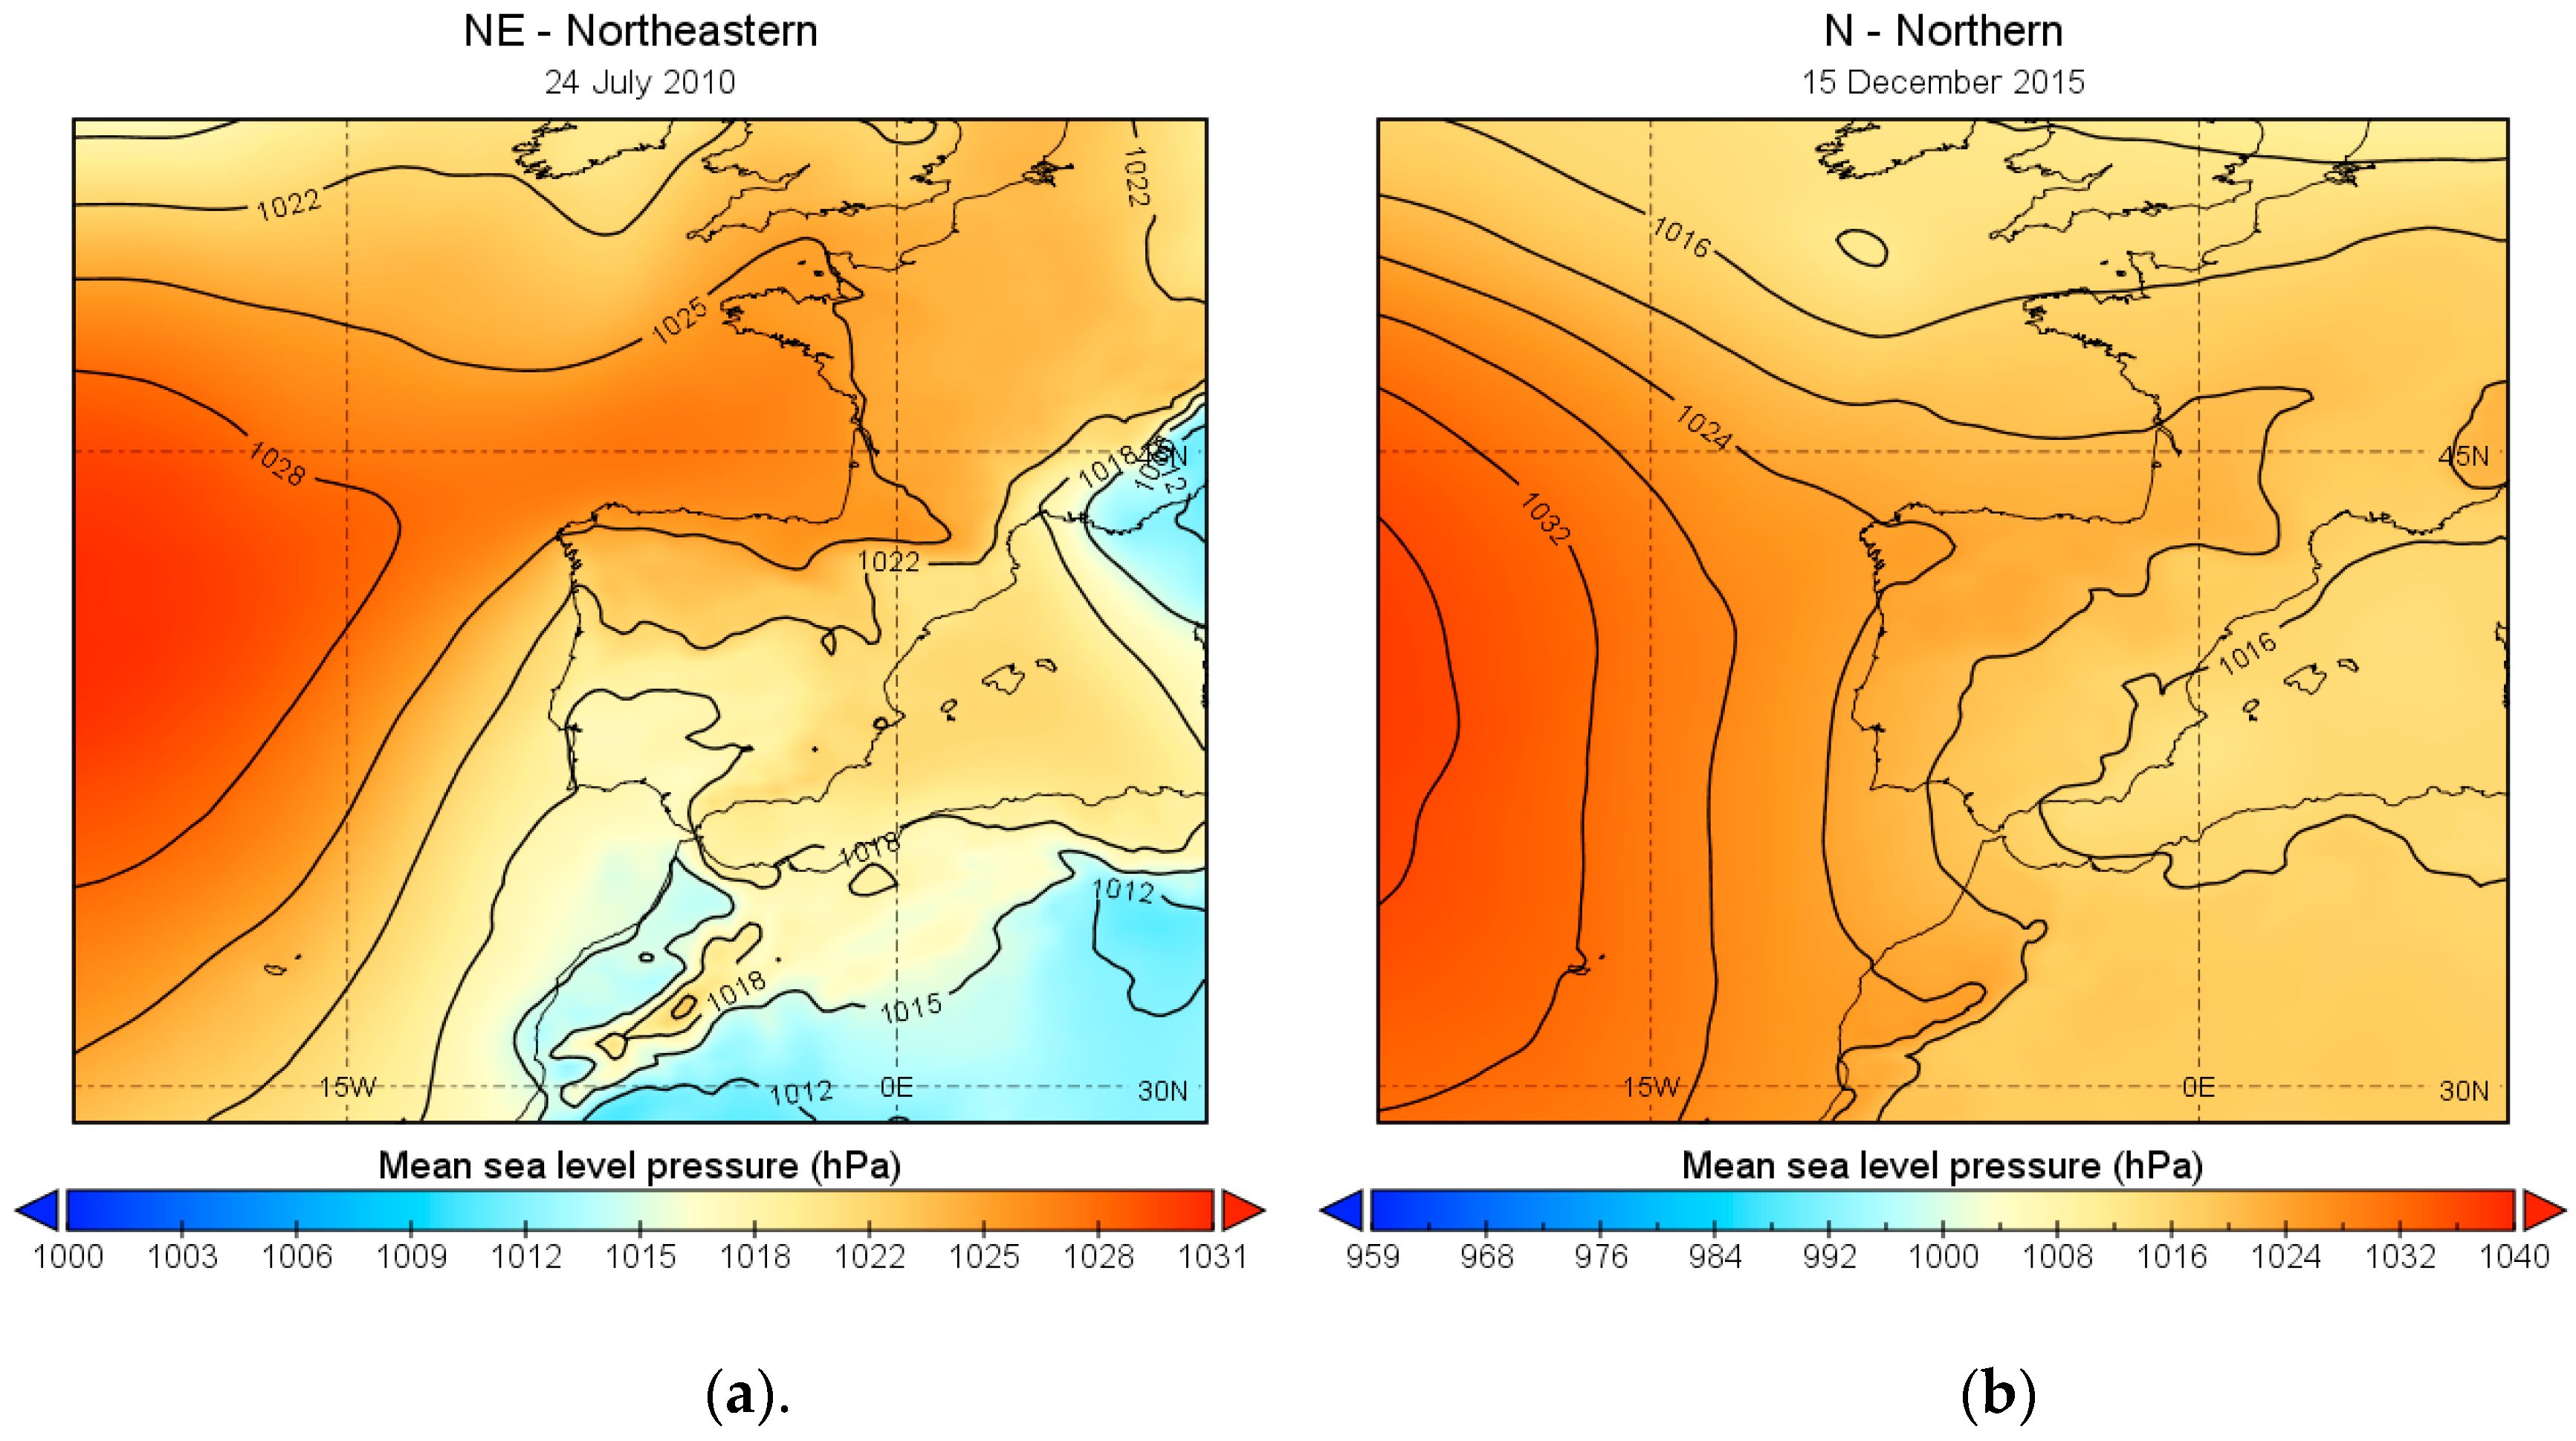
Along with this, the NE (Figure 5a) regional flow is relatively frequent in summer, with a higher frequency of occurrence on day and night LWT with a clear sky. Although less important, the regional N (Figure 5b) flow is relatively frequent in weather types with local N and, sometimes, NW winds. These results are in line with [49] conclusions, in which in spring and summer the E, NE, and N regional flows appear to be more frequent in Europe, unlike the S synoptic patterns which are less common on these seasons.
Furthermore, the authors also reported that LF conditions become more frequent in summer, although in autumn and spring there is also an enhanced frequency of LF days. Focusing on synoptic patterns over Portugal and the IP, the authors of [21] found that summer N LWTs are associated to the margin of the Atlantic Anticyclone and, often, the presence of a thermal depression over the IP.
Finally, in autumn the anticyclonic regional flow dominates all day and night LWTs, with a frequency between 18% and 30% of days and is especially relevant in NE and E LWTs. Furthermore, the undefined flow is always the second most relevant synoptic pattern, ranging between 7% on mild and humid autumn nights with a weak NE wind, and 15% on cold and rainy nights.

4. Conclusions

In the present study, a LWT was produced for the city of Lisbon allowing a more detailed knowledge of its climate conditions across thermal periods and throughout the day. Hence, several conclusions can be drawn:
  • All LWTs are usually dry (average daily specific humidity below 0.01 kg/kg), except in summer, especially at night, and in nighttime autumn LWTs; this is specially concerning between hot and humid conditions that generate regularly human thermal discomfort;
  • N and NW LWTs are quite frequent throughout the year with a frequency that ranges between 23%, on winter days, and 46% on autumn nights;
  • NE and E LWTs often originate clear sky conditions, very low or null rainfall and on winter they are responsible for the lowest average temperatures and, consequently, extreme weather events (cold waves);
  • Rainy LWTs are less frequent throughout the year: In summer, they occur only on 9% of days and 2% of nights and are more common on winter (on 37% of days and on 14% of nights), followed by the intermediate periods;
  • Anticyclonic weather patterns are common throughout the year and do not influence a very wide range of LWTs;
  • The number of days with a weak and, for that, an undefined regional flow is considerable in summer, and secondly, in autumn.
As referred and confirmed by the literature, this methodology can be replicated in other urban areas in order to produce a LWT adapted to a specific climate, topographic and morphology realities. However, its potential is not limited to urban climatology since it can be useful to any kind of investigation that seeks to evaluate the influence of local climate and local meteorological conditions. Future work will imply an application of these LWTs to the modeling of distinct thermal patterns in Lisbon.

Author Contributions

Conceptualization, C.R. and A.L.; methodology, C.R., A.L., E.C., and M.F.; software, C.R. and M.F.; validation, A.L., E.C., and M.F.; formal analysis; A.L., E.C., and M.F.; investigation, C.R.; resources, C.R., A.L., and M.F.; writing—original draft preparation, C.R.; writing—review and editing, A.L., E.C., and M.F.; supervision, A.L. All authors have read and agreed to the published version of the manuscript.

Funding

This research was funded by FCT (Fundação para a Ciência e Tecnologia), grant number (SFRH/BD/146757/2019) and the ZEPHYRUS research group of the CEG/IGOT—Universidade de Lisboa (UIDB/00295/2020 and UIDP/00295/2020).

Conflicts of Interest

The authors declare no conflict of interest.

References

  1. Montávez, J.P.; Rodríguez, A.; Jiménez, J.I. A study of the urban heat island of Granada. Int. J. Climatol. J. R. Meteorol. Soc. 2000, 20, 899–911. [Google Scholar] [CrossRef]
  2. Deilami, K.; Kamruzzaman, M.; Liu, Y. Urban heat island effect: A systematic review of spatio-temporal factors, data, methods, and mitigation measures. Int. J. Appl. Earth Obs. Geoinf. 2018, 67, 30–42. [Google Scholar] [CrossRef]
  3. Oke, T.R. Boundary Layer Climates; Routledge: London, UK, 1987. [Google Scholar]
  4. Arnfield, A.J. Two decades of urban climate research: A review of turbulence, exchanges of energy and water, and the urban heat island. Int. J. Climatol. J. R. Meteorol. Soc. 2003, 23, 1–26. [Google Scholar] [CrossRef]
  5. Morris, C.J.G.; Simmonds, I.; Plummer, N. Quantification of the influences of wind and cloud on the nocturnal urban heat island of a large city. J. Appl. Meteorol. 2001, 40, 169–182. [Google Scholar] [CrossRef]
  6. Santamouris, M. Recent progress on urban overheating and heat island research. Integrated assessment of the energy, environmental, vulnerability and health impact. Synergies with the global climate change. Energy Build. 2020, 207, 109482. [Google Scholar] [CrossRef]
  7. IPCC. Working Group I Contribution to the IPCC Fifth Assessment Report: Climate Change 2013: The Physical Science Basis. Summary for Policymakers; IPCC: Geneva, Switzerland, 2013.
  8. European Environment Agency. Global and European Temperature. Copenhagen, Denmark, 2019. Available online: https://www.eea.europa.eu/data-and-maps/indicators/global-and-european-temperature-9/assessment (accessed on 15 September 2019).
  9. United Nations, Department of Economic and Social Affairs, Population Division. Available online: https://www.un.org/en/development/desa/population/index.asp (accessed on 2 May 2020).
  10. McCarthy, M.P.; Best, M.J.; Betts, R.A. Climate change in cities due to global warming and urban effects. Geophys. Res. Let. 2010, 37, 1–5. [Google Scholar] [CrossRef] [Green Version]
  11. Mohajerani, A.; Bakaric, J.; Jeffrey-Bailey, T. The urban heat island effect, its causes, and mitigation, with reference to the thermal properties of asphalt concrete. J. Environ. Manag. 2017, 197, 522–538. [Google Scholar] [CrossRef]
  12. He, B.J. Potentials of meteorological characteristics and synoptic conditions to mitigate urban heat island effects. Urban Clim. 2018, 24, 26–33. [Google Scholar] [CrossRef]
  13. Eliasson, I. Urban nocturnal temperatures, street geometry and land use. Atmos. Environ. 1996, 30, 379–392. [Google Scholar] [CrossRef]
  14. Morris, C.J.G.; Simmonds, I. Associations between varying magnitudes of the urban heat island and the synoptic climatology in Melbourne, Australia. Int. J. Climatol. J. R. Meteorol. Soc. 2000, 20, 1931–1954. [Google Scholar] [CrossRef]
  15. Du, H.; Wang, D.; Wang, Y.; Zhao, X.; Qin, F.; Jiang, H.; Cai, Y. Influences of land cover types, meteorological conditions, anthropogenic heat and urban area on surface urban heat island in the Yangtze River Delta Urban Agglomeration. Sci. Total Environ. 2016, 571, 461–470. [Google Scholar] [CrossRef] [PubMed]
  16. Travis, D.J.; Meentemeyer, V.; Suckling, P.W. Influence of meteorological conditions on urban/rural temperature and humidity differences for a small city. Southeast. Geogr. 1987, 27, 90–100. [Google Scholar] [CrossRef]
  17. Unger, J. Heat island intensity with different meteorological conditions in a medium-sized town: Szeged, Hungary. Theor. Appl. Clim. 1996, 54, 147–151. [Google Scholar] [CrossRef]
  18. Hidalgo, J.; Jougla, R. On the use of local weather types classification to improve climate understanding: An application on the urban climate of Toulouse. PLoS ONE 2018, 13, e0208138. [Google Scholar] [CrossRef] [PubMed]
  19. Gedzelman, S.D.; Austin, S.; Cermak, R.; Stefano, N.; Partridge, S.; Quesenberry, S.; Robinson, D.A. Mesoscale aspects of the urban heat island around New York City. Theor. Appl. Clim. 2003, 75, 29–42. [Google Scholar] [CrossRef]
  20. Hoffmann, P.; Schoetter, R.; Schlünzen, H. Statistical-dynamical downscaling of the urban heat island in Hamburg, Germany. Meteorol. Z. 2018, 27, 89–109. [Google Scholar] [CrossRef]
  21. Andrade, H.J.N. Bioclima Humano e Temperatura do ar em Lisboa. Ph.D. Thesis, Physical Geography, Faculty of Letters, University of Lisbon, Lisbon, Portugal, 2003. [Google Scholar]
  22. Cantat, O.; Savouret, E. A catalog of ‘weather types’ in metropolitan France. Climatologie 2014, 11, 65–71. [Google Scholar] [CrossRef]
  23. Hoffmann, P.; Schlünzen, K.H. Weather pattern classification to represent the urban heat island in present and future climate. J. Appl. Meteorol. Clim. 2013, 52, 2699–2714. [Google Scholar] [CrossRef]
  24. Ganho, N. Classificação de tipos de tempo aplicada à análise topoclimática: Uma proposta metodológica. Cad. de Geogr. 2001, 20, 53–63. [Google Scholar] [CrossRef]
  25. Carrega, P. Avant-propos sur les «types de temps». Norois Environ. Aménage. Soc. 2004, 191, 7–9. [Google Scholar] [CrossRef]
  26. Lopes, A. Modificações no Clima de Lisboa Como Consequência do Crescimento Urbano. Ph.D. Thesis, Physical Geography, Institute of Geography and Spatial Planning, University of Lisbon, Lisbon, Portugal, 2003. [Google Scholar]
  27. Alcoforado, M.J.; Andrade, H.; Oliveira, S.; Festas, M.J.; Rosa, F. Alterações Climáticas e Desenvolvimento Urbano; Política de Cidades—4, 2009. Available online: http://www.forumdascidades.pt/content/alteracoesclimaticas-e-desenvolvimento-urbano (accessed on 27 April 2019).
  28. Lopes, A.; Alves, E.; Alcoforado, M.J.; Machete, R. Lisbon Urban Heat Island Updated: New Highlights about the Relationships between Thermal Patterns Wind Regimes; Hindawi: London, UK, 2013; p. 11. [Google Scholar] [CrossRef]
  29. Lowry, W.P. Empirical estimation of urban effects on climate: A problem analysis. J. Appl. Meteorol. 1977, 16, 129–135. [Google Scholar] [CrossRef] [Green Version]
  30. Alcoforado, M.J. Brisas estivais do Tejo e do Oceano na região de Lisboa. Finisterra 1987, 22, 71–122. [Google Scholar] [CrossRef] [Green Version]
  31. Alcoforado, M.J.; Andrade, H.; Viera Paulo, M.J. Weather and recreation at the Atlantic shore near Lisbon, Portugal: A study on applied local climatology. Adv. Tour. Clim. 2004, 12, 38–48. [Google Scholar]
  32. Alcoforado, M.J.; Lopes, A.; Andrade, H.; Vasconcelos, J. Orientações Climáticas Para o Ordenamento Em Lisboa; Centro de Estudos Geográficos da Universidade de Lisboa: Lisbon, Portugal, 2005. [Google Scholar]
  33. Baltazar, S.C.P. Mapas Bioclimáticos de Lisboa. Master’s Thesis, Physical Geography and Spatial Planning, Instituto de Geografia e Ordenamento do Território, Universidade de Lisboa, Lisboa, Portugal, 2010. [Google Scholar]
  34. Barcikowska, M.J.; Kapnick, S.B.; Feser, F. Impact of large-scale circulation changes in the North Atlantic sector on the current and future Mediterranean winter hydroclimate. Clim. Dyn. 2018, 50, 2039–2059. [Google Scholar] [CrossRef]
  35. Instituto Português do Mar e da Atmosfera (IPMA). Boletim Climatológico Anual. Portugal Continental, 2018. Lisboa, Instituto Português do Mar e da Atmosfera, 2019. Available online: http://www.ipma.pt/resources.www/docs/im.publicacoes/edicoes.online/20200318/piMisHmKRkiueuXQgHpM/cli_20191201_20191231_pcl_aa_co_pt.pdf (accessed on 28 September 2019).
  36. Lopes, A.; Saraiva, J.; Alcoforado, M.J. Urban boundary layer wind speed reduction in summer due to urban growth and environmental consequences in Lisbon. Environ. Model. Softw. 2011, 26, 241–243. [Google Scholar] [CrossRef]
  37. Câmara Municipal de Lisboa. (2012). Plano Diretor Municipal de Lisboa. Available online: https://www.lisboa.pt/cidade/urbanismo/planeamento-urbano/plano-diretor-municipal (accessed on 24 September 2019).
  38. Alcoforado, M.J.; Andrade, H.; Lopes, A.; Vasconcelos, J.; Vieira, R. Observational studies on summer winds in Lisbon (Portugal) and their influence on daytime regional and urban thermal patterns. Merhavim 2006, 6, 90–112. [Google Scholar]
  39. Lopes, A. O sobreaquecimento das cidades. Causas e medidas para a mitigação da ilha de calor de Lisboa. Territorium 2008, 15, 39–52. [Google Scholar] [CrossRef] [Green Version]
  40. Cai, J. Humidity: Calculate Water Vapor Measures from Temperature and Dew Point. R Package Version 0.1.5. 2019. Available online: https://github.com/caijun/humidity (accessed on 3 October 2019).
  41. Plano Metropolitano de Adaptação às Alterações Climáticas da Área Metropolitana de Lisboa (2018). CEDRU—Centro de Estudos e Desenvolvimento Regional e Urbano, LDA. Available online: https://www.aml.pt/susProjects/susWebBackOffice/uploadFiles/wt1wwpgf_aml_sus_pt_site/componentPdf/SUS5BD0A09029884/PMAAC_AML_P021_VOL1_CENARIO_BASE_ADAPTACAO (accessed on 27 September 2019).
  42. He, J.; Tan, A.H.; Tan, C.L.; Sung, S.Y. On quantitative evaluation of Clustering systems. In Information Retrieval and Clustering; Wu, W., Xiong, H., Eds.; Kluwer Academic: Norwell, MA, USA, 2002. [Google Scholar]
  43. Sturn, A.; Quackenbush, J.; Trajanoski, Z. Genesis: Cluster analysis of microarray data. Bioinformatics 2002, 18, 207–208. [Google Scholar] [CrossRef] [Green Version]
  44. Huth, R.; Beck, C.; Philipp, A.; Demuzere, M.; Ustrnul, Z.; Cahynová, M.; Kyselý, J.; Tveito, O.E. Classifications of atmospheric circulation patterns: Recent advances and applications. Ann. N. Y. Acad. Sci. 2008, 1146, 105–152. [Google Scholar] [CrossRef]
  45. Trigo, R.M.; DaCamara, C.C. Circulation weather types and their influence on the precipitation regime in Portugal. Int. J. Climatol. J. R. Meteorol. Soc. 2000, 20, 1559–1581. [Google Scholar] [CrossRef]
  46. Otero, N.; Sillmann, J.; Butler, T. Assessment of an extended version of the Jenkinson–Collison classification on CMIP5 models over Europe. Clim. Dyn. 2018, 50, 1559–1579. [Google Scholar] [CrossRef] [Green Version]
  47. Hidalgo, J.; Masson, V.; Baehr, C. From daily climatic scenarios to hourly atmospheric forcing fields to force Soil-Vegetation-Atmosphere transfer models. Front. Environ. Sci. 2014, 2, 40. [Google Scholar] [CrossRef] [Green Version]
  48. Hoinka, K.P.; Castro, M.D. The Iberian peninsula thermal low. Q. J. R. Meteorol. Soc. J. Atmos. Sci. Appl. Meteorol. Phys. Oceanogr. 2003, 129, 1491–1511. [Google Scholar] [CrossRef] [Green Version]
  49. Otero, N. jcext: Extended Classification of Weather Types. 2019. Available online: https://cran.r-project.org/web/packages/jcext/index.html (accessed on 17 October 2019).
Figure 1. Geographic framework of Lisbon (Portugal). (a) ASTER digital elevation model (NASA GOV); (b) urban morphology and green spaces distribution and Lisbon’s weather station location (Source: Geodados, Lisbon City Hall, CML).
Atmosphere 11 00840 g001
Figure 2. Annual cycle of maximum, mean, and minimum air temperatures in Lisbon (2009–2018)—five-day moving average.
Atmosphere 11 00840 g002
Figure 3. Synoptic condition representative of an anticyclonic flow in Portugal: 11 January 2009.
Atmosphere 11 00840 g003
Figure 4. Synoptic condition representative of an undefined flow in Portugal: 26 June, 2012.
Atmosphere 11 00840 g004
Figure 5. Synoptic condition representative of (a) a NE flow (24 July, 2010) and (b) a N flow (15 December, 2015).
Atmosphere 11 00840 g005
Table 1. Input meteorological variables, sources, and missing data.
Meteorological DataData SourceMissing Data (% of Hourly Records)
Air TemperatureNational Climatic Data Center (NOAA—https://www.ncdc.noaa.gov/cdo-web/; retrieved at 22/09/2019)0.9
Wind Speed
Specific HumidityNOAA (air temperature); reanalysis (average sea level pressure; ERA 5 Land: Spatial resolution: 9 km; coordinates (selected pixel): 38°8’ N; 9°2’ W; https://cds.climate.copernicus.eu/cdsapp#!/dataset/reanalysis-era5-land?tab=overview; retrieved at 25/05/2019)0.9
Wind DirectionReanalysis (ERA 5 Land—ECMWF)
Precipitation--
Cloud CoverReanalysis (ERA 5: Spatial resolution: 25 km; coordinates (selected pixel): 38°75’ N; −9°25’ W; https://www.ecmwf.int/en/forecasts/datasets/reanalysis-datasets/era5; retrieved at 28/09/2019)--
Table 2. Wind direction classification.
OrientationRange (°)
N337.6–360; 0–22,5
NE22.6–67.5
E67.6–112.5
SE112.6–157.5
S157.6–202.5
SW202.6–247.5
W247.6–292.5
NW292.6–337.5
Table 3. Thermal periods—duration and attributes.
PeriodsDuration T °C
MinimumMean Maximum
Winter26/11 to 04/038.611.714.7
Spring05/03 to 10/0612.516.620.6
Summer11/06 to 08/1017.722.727.7
Autumn90/10 to 25/1113.416.820.2
Table 4. Optimal number of daytime and nighttime LWT: Sum of the intra-cluster variance.
ClustersDaytimeNighttime
WinterSpringSummerAutumnWinterSpringSummerAutumn
21.11.23.81.11.80.33.12.2
31.41.43.01.42.60.13.83.1
41.81.53.61.64.50.25.83.5
52.01.75.91.84.90.025.83.6
62.21.86.11.85.50.16.54.1
72.31.85.61.96.10.13.74.6
Table 5. LWT: Thresholds for classification of thermal conditions, cloud cover, and precipitation.
Air Temperature (°C)Cloud Cover (Tenths)Precipitation (mm)
DesignationThresholdDesignationThresholdDesignationThreshold
Very cold≤ 11Sunny/Low/Clear≤ 3.9Rainy≥ 5
Cold11.1–15Moderate4–6.9
Cool15.1–18High/Cloudy≥ 7
Mild18.1–22
Hot22.1–25
Very Hot≥ 25
Table 6. LWT: Thresholds for classification of humidity and wind conditions.
Specific Humidity (kg/kg)Wind Speed (m/s)
DesignationThresholdDesignationThreshold
Dry< 0.1Light/Weak< 4
Humid≥ 0.1Moderate4–6
Strong/Windy≥ 7
Table 7. Synoptic weather patterns (according to [46]).
Weather TypeDescription
VorticityAAnticyclonic
CCyclonic
DirectionalEEast flow
NNorth flow
NENE flow
NWNW flow
SS flow
SESE flow
SWSW flow
UUndefined
WW flow
HybridE + A; E + C; N + A; N + C; N + E+A; N + E+C; NW + A; NW + C; S + C; S + W+A; S + W+C; W + A; W + CCombination of two or three directional or vorticity weather types
Table 8. Winter LWT (daytime period)—average daily conditions in Lisbon.
LWT Designation Climate Variables
Frequency of Days (%)Cloud Cover (Tenths)Wind Speed (m/s)Specific Humidity (kg/kg)Air Temperature (°C)Total Daily Precipitation (mm)
Very Cold, Sunny, and Dry with Light NE and E Winds2634.30.005310.90.9
Cold and Rainy with Strong SW winds1487.40.009014.514.7
Cold, Sunny, and Dry with Moderate N Winds2336.20.005812.42.8
Cold, Cloudy, and Dry with Moderate and Variable Winds37840.008013.72.4
Table 9. Winter LWT (nighttime period)—average daily conditions in Lisbon.
LWT Designation Climate Variables
Frequency of Days (%)Cloud Cover (Tenths)Wind Speed (m/s)Specific Humidity (kg/kg)Air Temperature (°C)Total Daily Precipitation (mm)
Very Cold, Sunny, and Dry with Light NE and E Winds2233.60.00528.50.9
Cold and Rainy with Moderate SW Winds1496.30.008813.414.1
Very Cold and Dry with Moderate N Winds3344.20.00619.82.3
Cold, Cloudy with Light, Dry, and Variable Wind Directions31730.0080122.8
Table 10. Spring LWT (daytime period)—average daily conditions in Lisbon.
LWT Designation Climate Variables
Frequency of Days (%)Cloud Cover (Tenths)Wind Speed (m/s)Specific Humidity (kg/kg)Air Temperature (°C)Total Daily Precipitation (mm)
Cool and Rainy with Moderate W and S Winds1776.20.008815.512.6
Cool and Dry with Moderate N and NW Winds4256.10.006815.61.3
Mild with Dry and Moderate N and NW Winds4144.60.008921.50.4
Table 11. Spring LWT (nighttime period)—average daily conditions in Lisbon.
LWT Designation Climate Variables
Frequency of Days (%)Cloud Cover (Tenths)Wind Speed (m/s)Specific Humidity (kg/kg)Air Temperature (°C)Total Daily Precipitation (mm)
Cold and Rainy with Light and Variable Winds2853.80.008414.85.6
Cold and Dry with Moderate N Winds4044.40.0069122
Cool and Dry with Moderate N Winds3254.40.009116.71.5
Table 12. Summer LWT (daytime period)—average daily conditions in Lisbon.
LWT Designation Climate Variables
Frequency of Days (%)Cloud Cover (Tenths)Wind Speed (m/s)Specific Humidity (kg/kg)Air Temperature (°C)Total Daily Precipitation (mm)
Mild, Rainy, and Windy (S and SW)277.60.013021.316.8
Hot, Sunny, Dry, and Windy (N Quadrant)2727.60.009522.70.2
Hot and Humid with a Light NW Winds2954.80.011322.70.8
Very Hot, Sunny, and Dry with Moderate and Variable Winds1124.70.009526.30.4
Very Hot, Sunny, and Humid with Moderate W and NW Winds3114.60.010127.20.1
Table 13. Summer LWT (nighttime period)—average daily conditions in Lisbon.
LWT Designation Climate Variables
Frequency of Days (%)Cloud Cover (Tenths)Wind Speed (m/s)Specific Humidity (kg/kg)Air Temperature (°C)Total Daily Precipitation (mm)
Mild, Humid, and Rainy with Light and Variable Winds, Especially from S and SW953.90.012119.55.8
Cool, Clear, and Humid with Moderate N winds3726.10.0101180.1
Mild and Humid with Light N and NW Winds37540.01118.70.4
Hot, Clear, and Dry with Light N winds1713.60.008623.70
Table 14. Autumn LWT (daytime period)—average daily conditions in Lisbon.
LWT Designation Climate Variables
Frequency of Days (%)Cloud Cover (Tenths)Wind Speed (m/s)Specific Humidity (kg/kg)Air Temperature (°C)Total Daily Precipitation (mm)
Cool, Humid, and Rainy with Moderate S, SW, and W Winds2885.10.010517.98.9
Mild, Sunny, and Dry with Light NE and E Winds4233.70.0089210.5
Cool and Dry with Moderate N Winds3045.20.007315.83.2
Table 15. Autumn LWT (nighttime period)—average daily conditions in Lisbon.
LWT Designation Climate Variables
Frequency of Days (%)Cloud Cover (Tenths)Wind Speed (m/s)Specific Humidity (kg/kg)Air Temperature (°C)Total Daily Precipitation (mm)
Cold and Rainy with Moderate and Variable Winds2484.70.010015.414.8
Mild and Humid with Light NE Winds3052.90.010418.11.4
Cool with Dry and Light N Winds4643.40.007913.92.1
Table 16. Frequency of regional weather patterns by daytime LWT in Lisbon.
LWTSynoptic Types
Most Frequent Flow2nd Most Frequent3rd Most Frequent
DaytimeWinterVery cold and dry with light NE and E windsA (36%)U (7.4%)NE (7%)
Rainy with strong SW windsA (36.6%)W + A (6.8%)W (6.6%)
Cold, sunny, and dry with moderate N windsW (17.4%)A (12.3%); C (12.3%)--------
Cold, cloudy, and with light and variable windsA (25.2%)N (9.1%)NW (8.3%)
SpringWindy (W and S), rainy, and coolC (18.7%)A (15.1%)W (13.9%)
Windy (N and NW), dry, and coolNE (15%)A (13.1%);U (10.7%); N (10.7%)
Mild with dry and moderate N and NW windsA (18.2%)NE (13.1%)U (7.4%)
SummerMild, rainy, and windy (S and SW)SW (41.7%)W (25%)--------
Hot, sunny, dry, and windy (N quadrant)N (21%)NE (19.8%)A (16.7%)
Hot and humid with a light NW windU (23.1%)A (20.6%)N (9.4%)
Very hot and dry with light and variable windsU (26.3%)E (18%)NE (15.8%)
Very hot, sunny, and humid with moderate W and NW windsNE (26.3%)U (23.1%)A (9.8%)
AutumnCool, humid, and rainy with moderate S, SW, and W windsA (21.2%)U (11.8%)SW (9.7%)
Mild, sunny, and dry with light NE and E windsA (30%)U (10%)SW (7.7%)
Cool and dry with moderate N windsA (17.7%)U (11.6%)W (10.2%)
Table 17. Frequency of regional weather patterns by nighttime LWT in Lisbon.
LWTSynoptic Types
Most Frequent Flow2nd Most Frequent3rd Most Frequent
NighttimeWinterCold and rainy with light and variable windsA (16.8%)C (14.6%)U (9.5%); E (9.5%)
Very cold and dry with light NE and E windsA (33.5%)----------------
Cold and rainy with moderate SW windsW (14.7%)A (14%)C (10.5%)
Very cold and dry with moderate N windsA (29.7%)N (8.4%)W (6.9%)
SpringCold and rainy with light and variable windsA (16.8%)C (14.6%)U (9.5%); E (9.5%)
Cool and dry with moderate N windsNE (15.9%)A (13.3%)U (11.3%)
Cold and dry with moderate N windsA (16.4%)NE (13.6%)N (9.1%)
SummerMild, humid, and rainy with light and variable winds, especially from S and SWSW (21%)U (18.1%)W (14.3%)
Cool, clear, and humid with moderate N windsNE (29.1%)A (19.1%)N (16.6%)
Mild and humid with light N and NW windsU (26.1%)A (19%)N (11.6%)
Hot, clear, and dry with light N windsNE (24.6%)U (20.7%)E (18.2%)
AutumnCold and rainy with moderate and variable windsA (20.5%)U (15.2%)SW (10.7%)
Mild and humid with light NE windsA (27.2%)U (6.8%); E + S + C (6.8%)-------
Cool with dry and light N windsA (20.4%)U (11.6%)W (9.1%)

