Multi-Scale Transects of Three North American Drylines


1
Department of Chemistry, Physics, and Atmospheric Science, Jackson State University, Jackson, MS 39217, USA
2
School of Natural Resources, University of Missouri-Columbia, Columbia, MO 65211, USA
*
Author to whom correspondence should be addressed.
Atmosphere 2020, 11(8), 854; https://doi.org/10.3390/atmos11080854
Submission received: 2 July 2020
/
Revised: 6 August 2020
/
Accepted: 10 August 2020
/
Published: 13 August 2020
(This article belongs to the Section Meteorology)
Abstract
:North American drylines are distinct air mass boundaries that have often been examined for their relation to the initiation of severe convective storms. Three cases of drylines occurring in synoptically quiescent environments are analyzed using data obtained from a single mobile platform in concert with data from operational synoptic and mesoscale observing systems. Very distinct moisture contrasts were noted in a nocturnal April case in mountainous terrain in the Trans-Pecos region of West Texas. The other two cases revealed multi-step moisture transitions within synoptically diffuse moisture gradients. Their evolution over time suggests that such multi-step patterns may be associated with diurnal and geographic forcing transitions, as well as positioning of deep moist convection.
Keywords:
dryline; mobile mesonet; convection; nocturnal; diurnal; mesoscale; observations; planetary boundary layer; radiosonde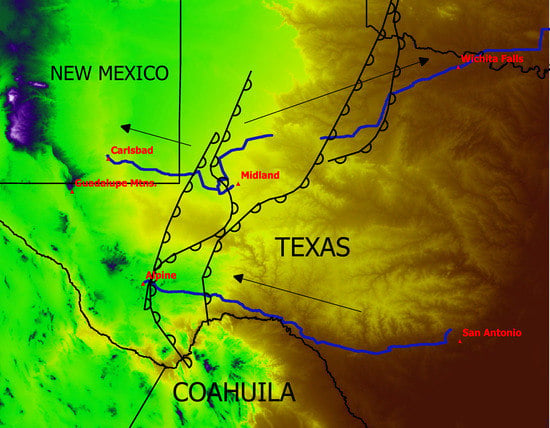
1. Introduction
Various investigations of the structure and evolution of drylines have been conducted since the initial description in 1958 [1]. As observed in North America, a typical dryline can be conceptually described as the surface boundary separating a moist subtropical air mass (largely originating over the Gulf of Mexico) from much drier vertically well-mixed air originating over high plateaus of the Southwestern United States and Northern Mexico [2]. Lack of a sustained baroclinic gradient or vertical continuity with mid- and upper-tropospheric waves helps to distinguish drylines from fronts. Fine-scale measurements of the dryline environment with aircraft, remote sensing (radar/lidar), and mobile observing systems [3] have focused in particular on factors related to the initiation of severe convective storms over Western Oklahoma and Northern Texas during spring and early summer, such as during the VORTEX-95 (Verification of the Origins of Rotation in Tornadoes Experiment) [4] and IHOP (International H2O Project) [5,6,7,8] field campaigns. Drylines and similar features have also been recognized to occur outside of this core domain [9,10] and often without initiating significant deep convection [11,12,13]. Relatively few studies have documented detailed characteristics of these types of drylines. Interactions of drylines with topography of the Rocky Mountains foothills in Southeastern Wyoming have been investigated [14]. However no intensive data have been published from research field campaigns across the southern extent of the dryline, which is commonly analyzed southward to the Mexican border.
It has been well established from peer-reviewed dryline case studies in the Southern Great Plains that a dryline commonly develops in the vicinity of a lee trough, moves eastward during day and regresses westward at night, and may have horizontal gradients of the mixing ratio that locally exceeds 1 g/kg per km in the immediate vicinity of the boundary [3]. Horizontal density contrast across the dryline has sometimes been determined to be consistent with density current theory at certain phases of the diurnal cycle [15], while the depth of the underlying moist air east of the dryline is recognized to be closely tied with a synoptic scale subsidence inversion and mid-tropospheric flow of dry air from the high plateaus of Northern Mexico [11,16,17,18]. Accordingly, the air above such inversions is commonly described as an advected “elevated mixed layer”. Much attention has been focused on conditions for convective initiation in association with drylines [19]. On the other hand, no systematic study has been made of drylines near the U.S.-Mexico border. In particular, seasonal variations of dryline occurrence in this region may be relevant to different mechanisms for cross-border severe thunderstorms.
During 2017, transects were made through three dryline environments with the Jackson State University (JSU) mobile meteorology unit (MMU). Through analysis of these (primarily) thermodynamic data in concert with operational datasets, the character and evolution of dryline features will be explored outside of classical dryline environments. All of the cases considered are “synoptically quiescent” according to the classification of [12], although one was transitioning to a more active environment at the end of the time considered. The synoptically quiescent character was evidenced by the absence of synoptic frontal features interacting with or in close proximity to the dryline. Key questions to be considered from these cases include:
- Is a distinct dryline moisture gradient and structure maintained when the low-latitude nocturnal dryline retrogresses into the high terrain of the Trans-Pecos in far West Texas?
- Could it sometimes be more appropriate to conceptualize the dryline as a “peripheral boundary” that separates different convective regimes rather than as a “forcing boundary” upon which air mass convection is preferentially focused and initiated?
- Is there evidence to link the diurnal cycle of boundary layer processes to variations in broadness of the dew point gradient and evolution of multi-step dryline structures?
2. Data Methodology
2.1. Description of Mobile Meteorology System
The JSU MMU has evolved incrementally from the earlier system that was described in [20,21]. The core measurements have remained temperature and humidity, using removable mounting systems on a standard passenger vehicle. For the cases reported here, temperature and humidity were measured with a Rotronics HygroClip HC2S3 (from Campbell Scientific, Logan, UT, USA) [22], with meteorological data and GPS position logged to a CR23X datalogger (from Campbell Scientific, Logan, UT, USA) at 2-s increments. Since February 2017, two HygroClips have been used concurrently, with one in a U-Tube shield (primarily for heavy rain) [23] and one in a Gill shield. Since there was very little rain encountered during the transects and experience has shown faster thermal responsiveness with the Gill shield, data from the Gill shield are preferred when available. Comparisons between sensors in the two shields for the current cases showed that mean temperature differed by less than 0.2 °C and relative humidity by less than 0.3%. Additional measurements include pressure (Vaisala PTB101B) for use in the calculation of potential temperature.
2.2. Operational Surface Observing Networks
Archived surface synoptic data records in raw METAR format were obtained from the Iowa Environmental Mesonet (IEM) web server [24], and then parsed for desired stations, timeframes, and parameters to determine winds, potential temperature, and water vapor mixing ratio. Additional surface meteorological datasets have been retrieved from the West Texas Mesonet [25,26] and MesoWest [27,28] to fill gaps, particularly of wind direction.
2.3. Upper Air Data
Operational radiosonde data were accessed from the “NOAA/ESRL” database [29] and the University of Wyoming [30]. In general, the soundings have been converted to formatting suitable for comparative analysis with SHARPpy [31]. For the 8 April 2017 dryline case, lower tropospheric soundings were also obtained with a mobile Windsond system [32]. This system uses a much smaller balloon with slower ascent rates compared to Vaisala and other operational radiosonde systems, and is primarily intended for lower tropospheric applications.
2.4. Operational HRRR Model Data
To complement observed datastreams (especially for a three-dimensional structure), archived data products from the operational 3-km HRRR (high-resolution rapid refresh) model [33,34,35] were used. Hourly data are available through the NOAA Air Resources Lab (ARL) READY (real-time environmental applications and display system) website [36,37]. Challenges in the depiction and identification of drylines in operational numerical model data have been considered [38]. Since the resolution and operational constraints limit the potential for the HRRR to describe details of dryline structure, these data will be utilized primarily for the larger mesoscale environment and approximate location of features consistent with drylines, such as concentrated moisture gradients in concert with lower tropospheric confluence patterns. Within these limitations, the operational model can provide spatial and temporal context in between observational datapoints as well as similarity to products that would be used in real-time forecasting and analysis.
2.5. Radar Data
Storm development and clear-air fine lines [39] are monitored using operational NOAA NEXRAD WSR-88D weather radar data when available. Primarily the base elevation reflectivity is used, but Doppler velocity and dual polarization parameters are also examined when useful. Although mosaic products were used for broader perspectives, only the Level II data from the NEXRAD radar sites (from the National Centers for Environmental Information) [40] were presented here.
3. Results
3.1. Case 1: 8 April 2017 Alpine, Texas
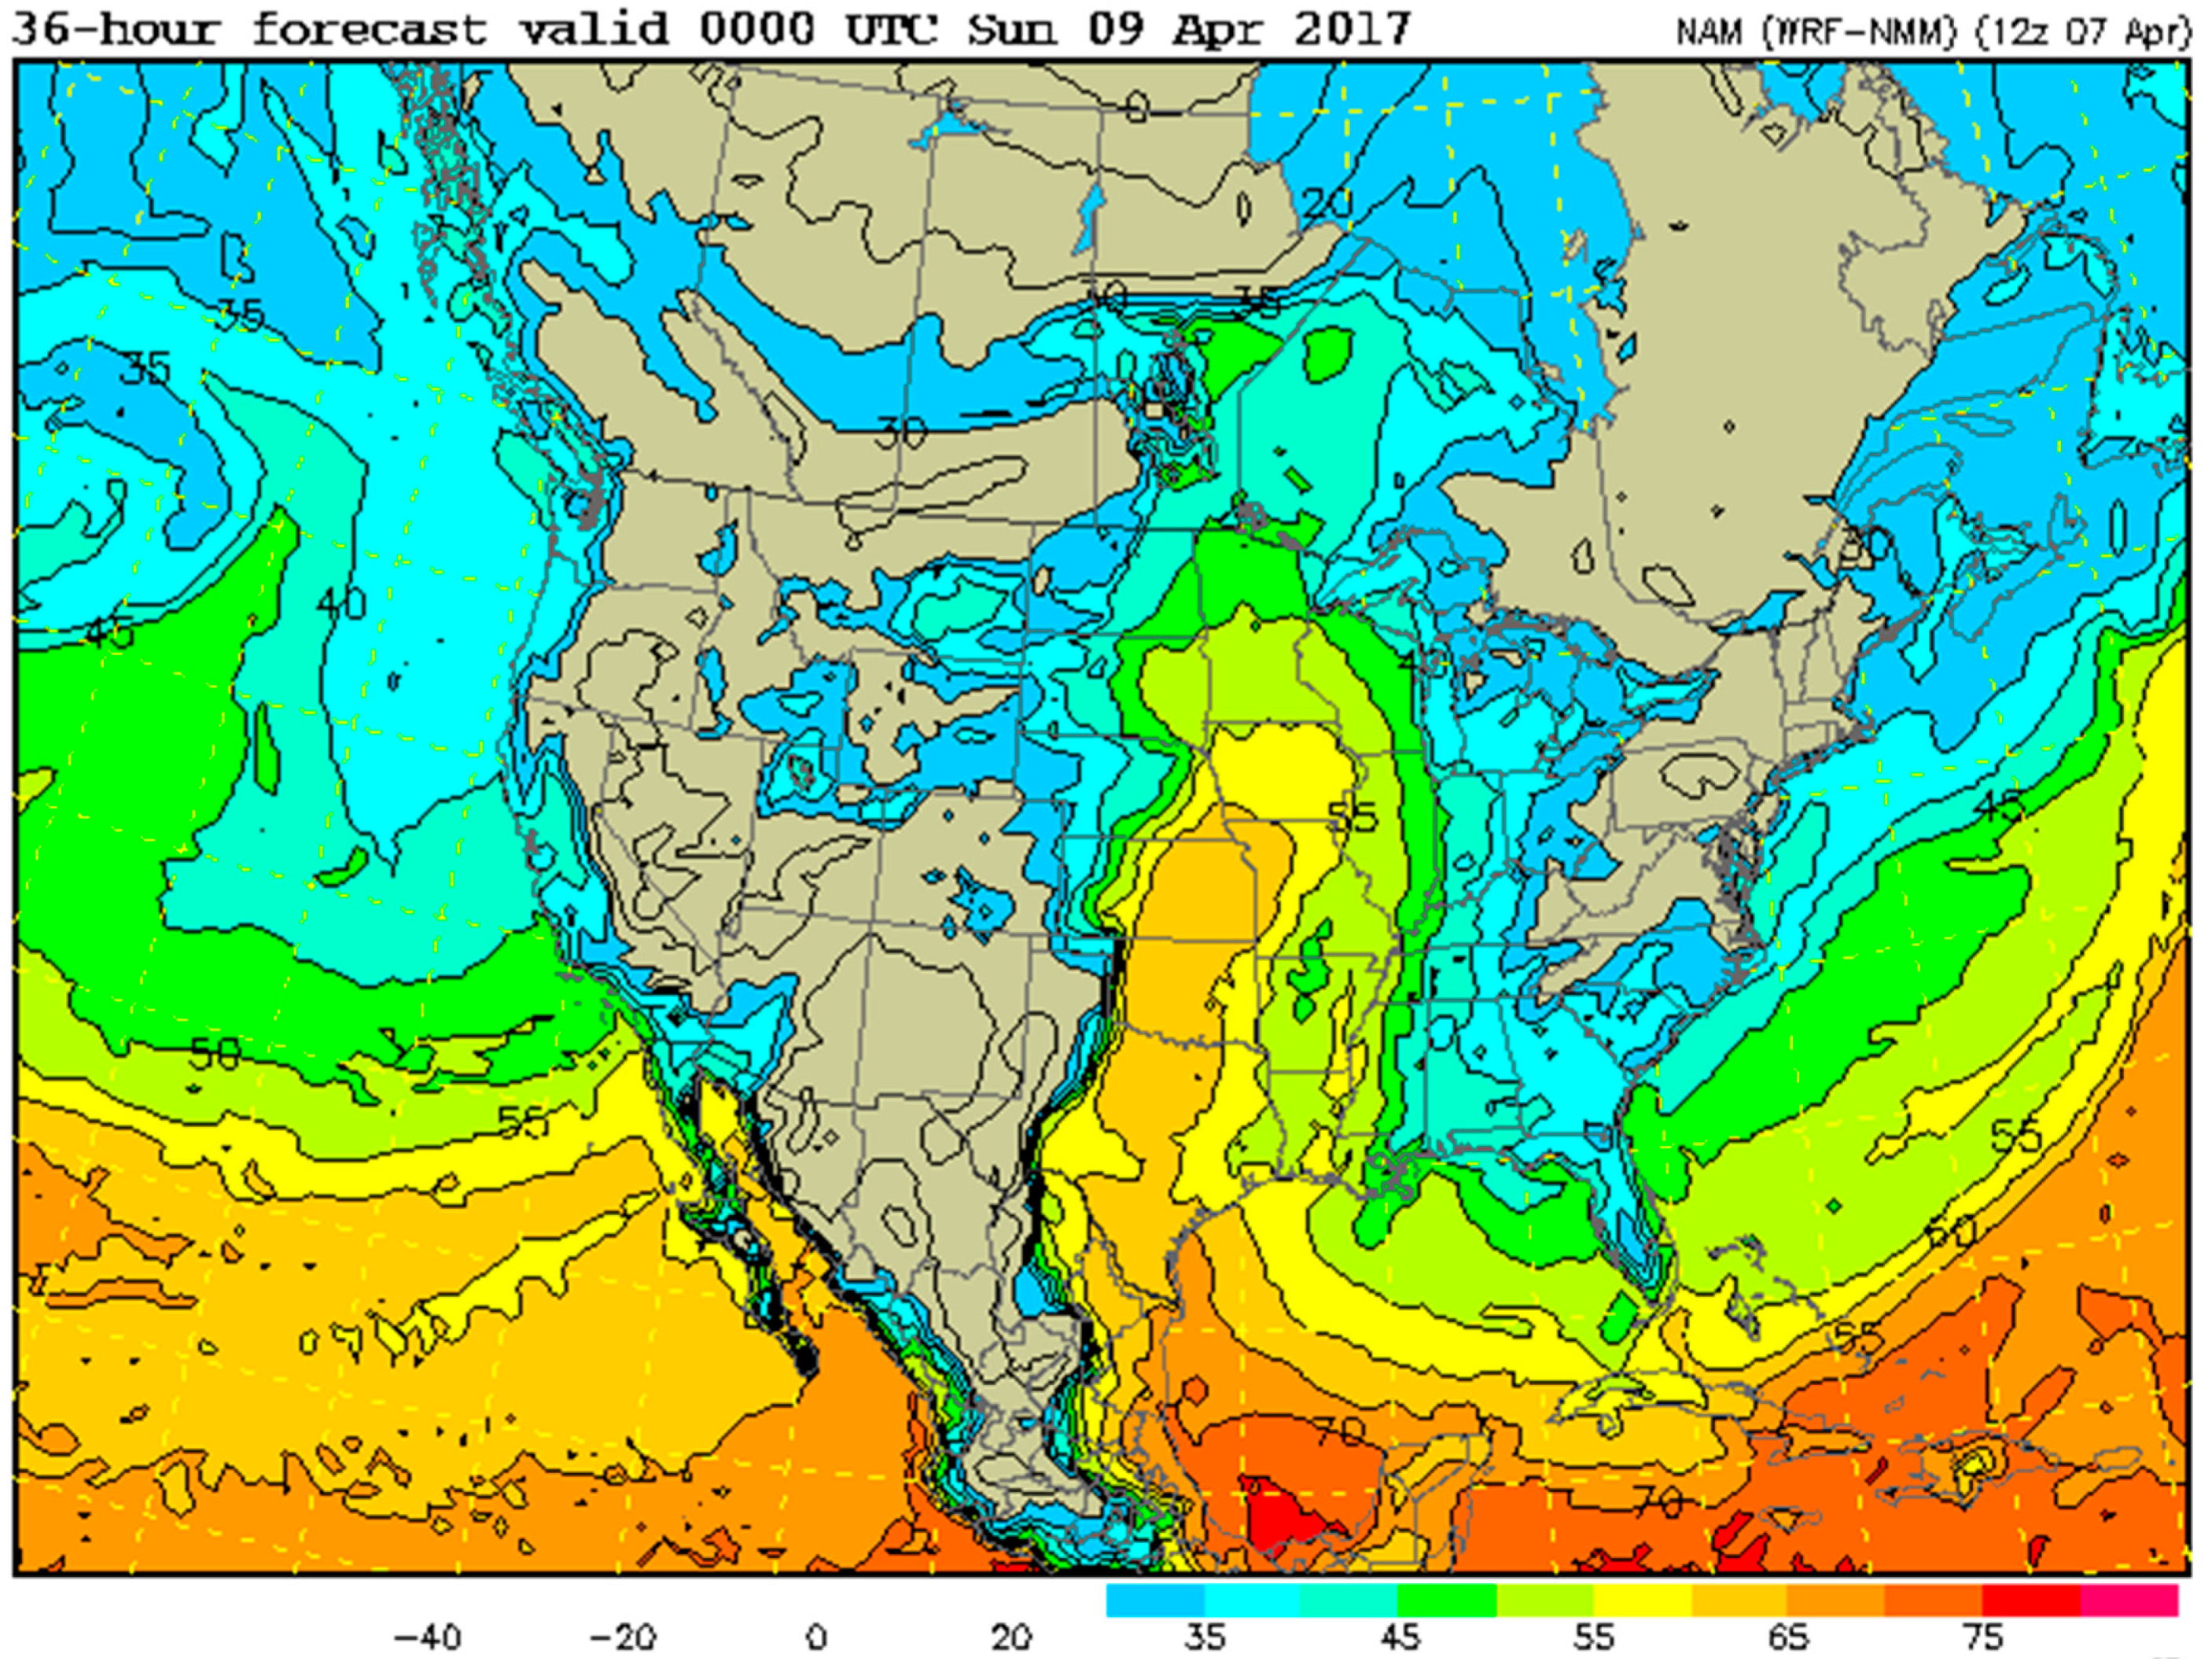
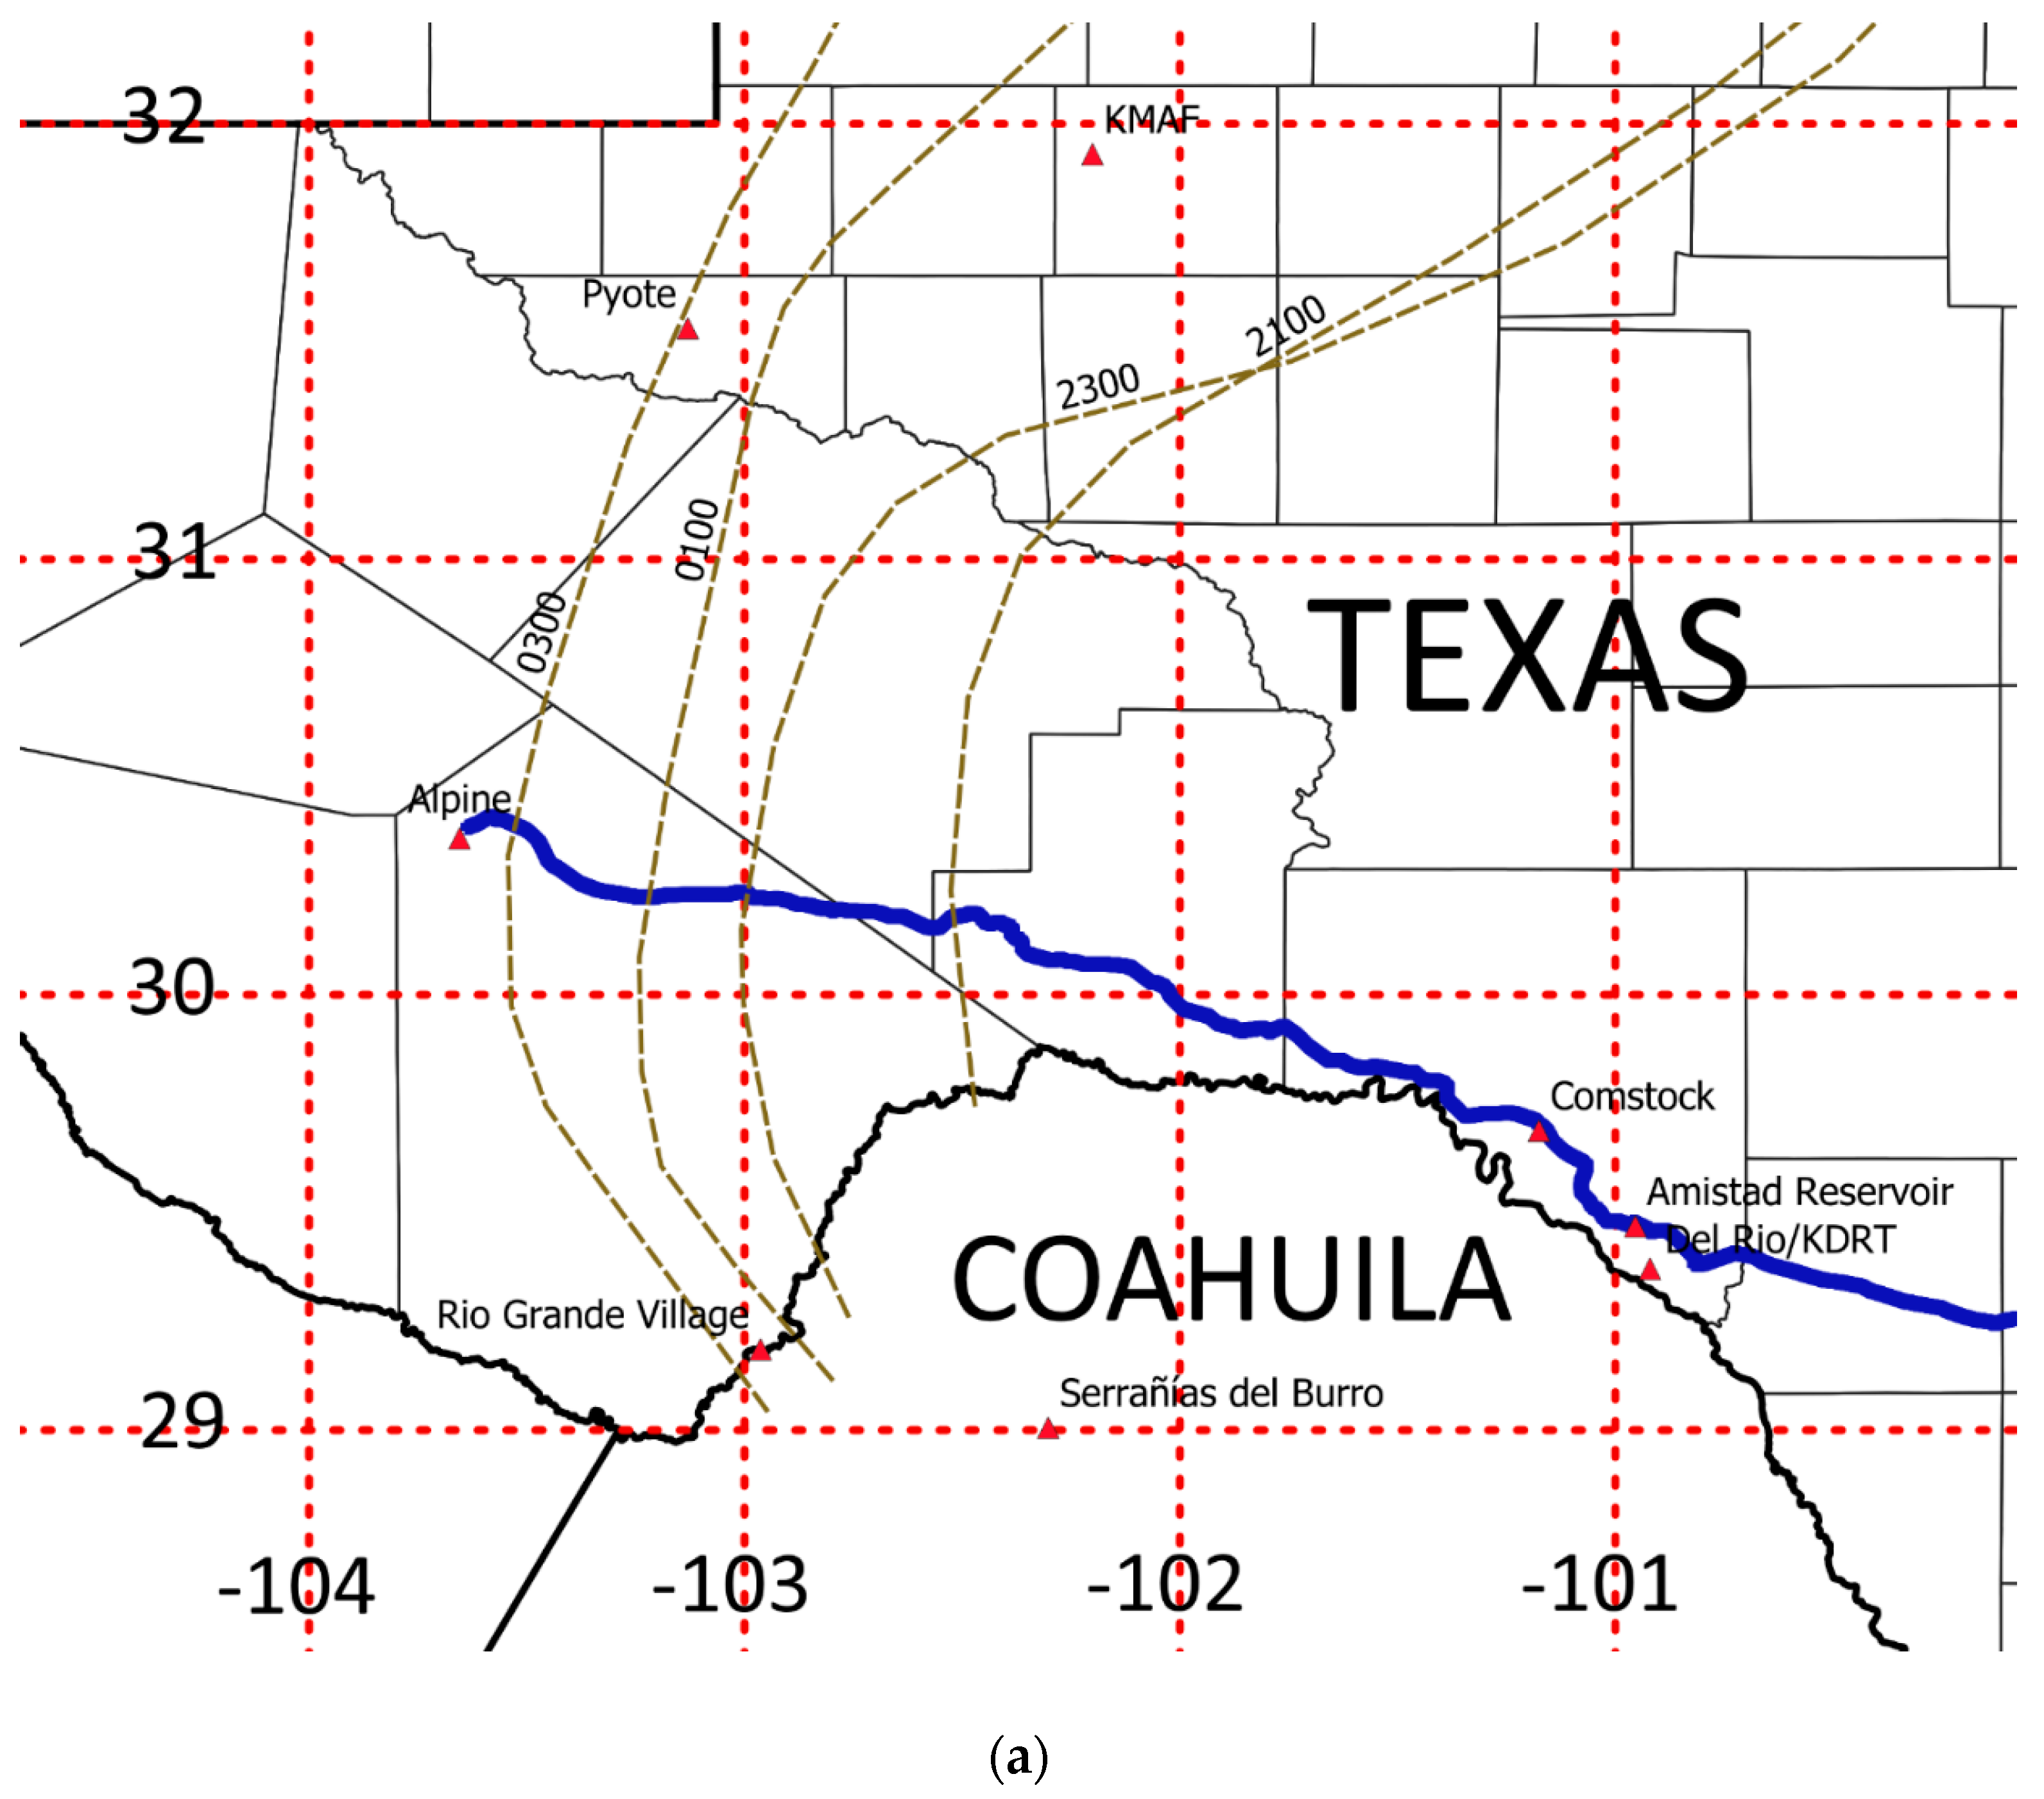
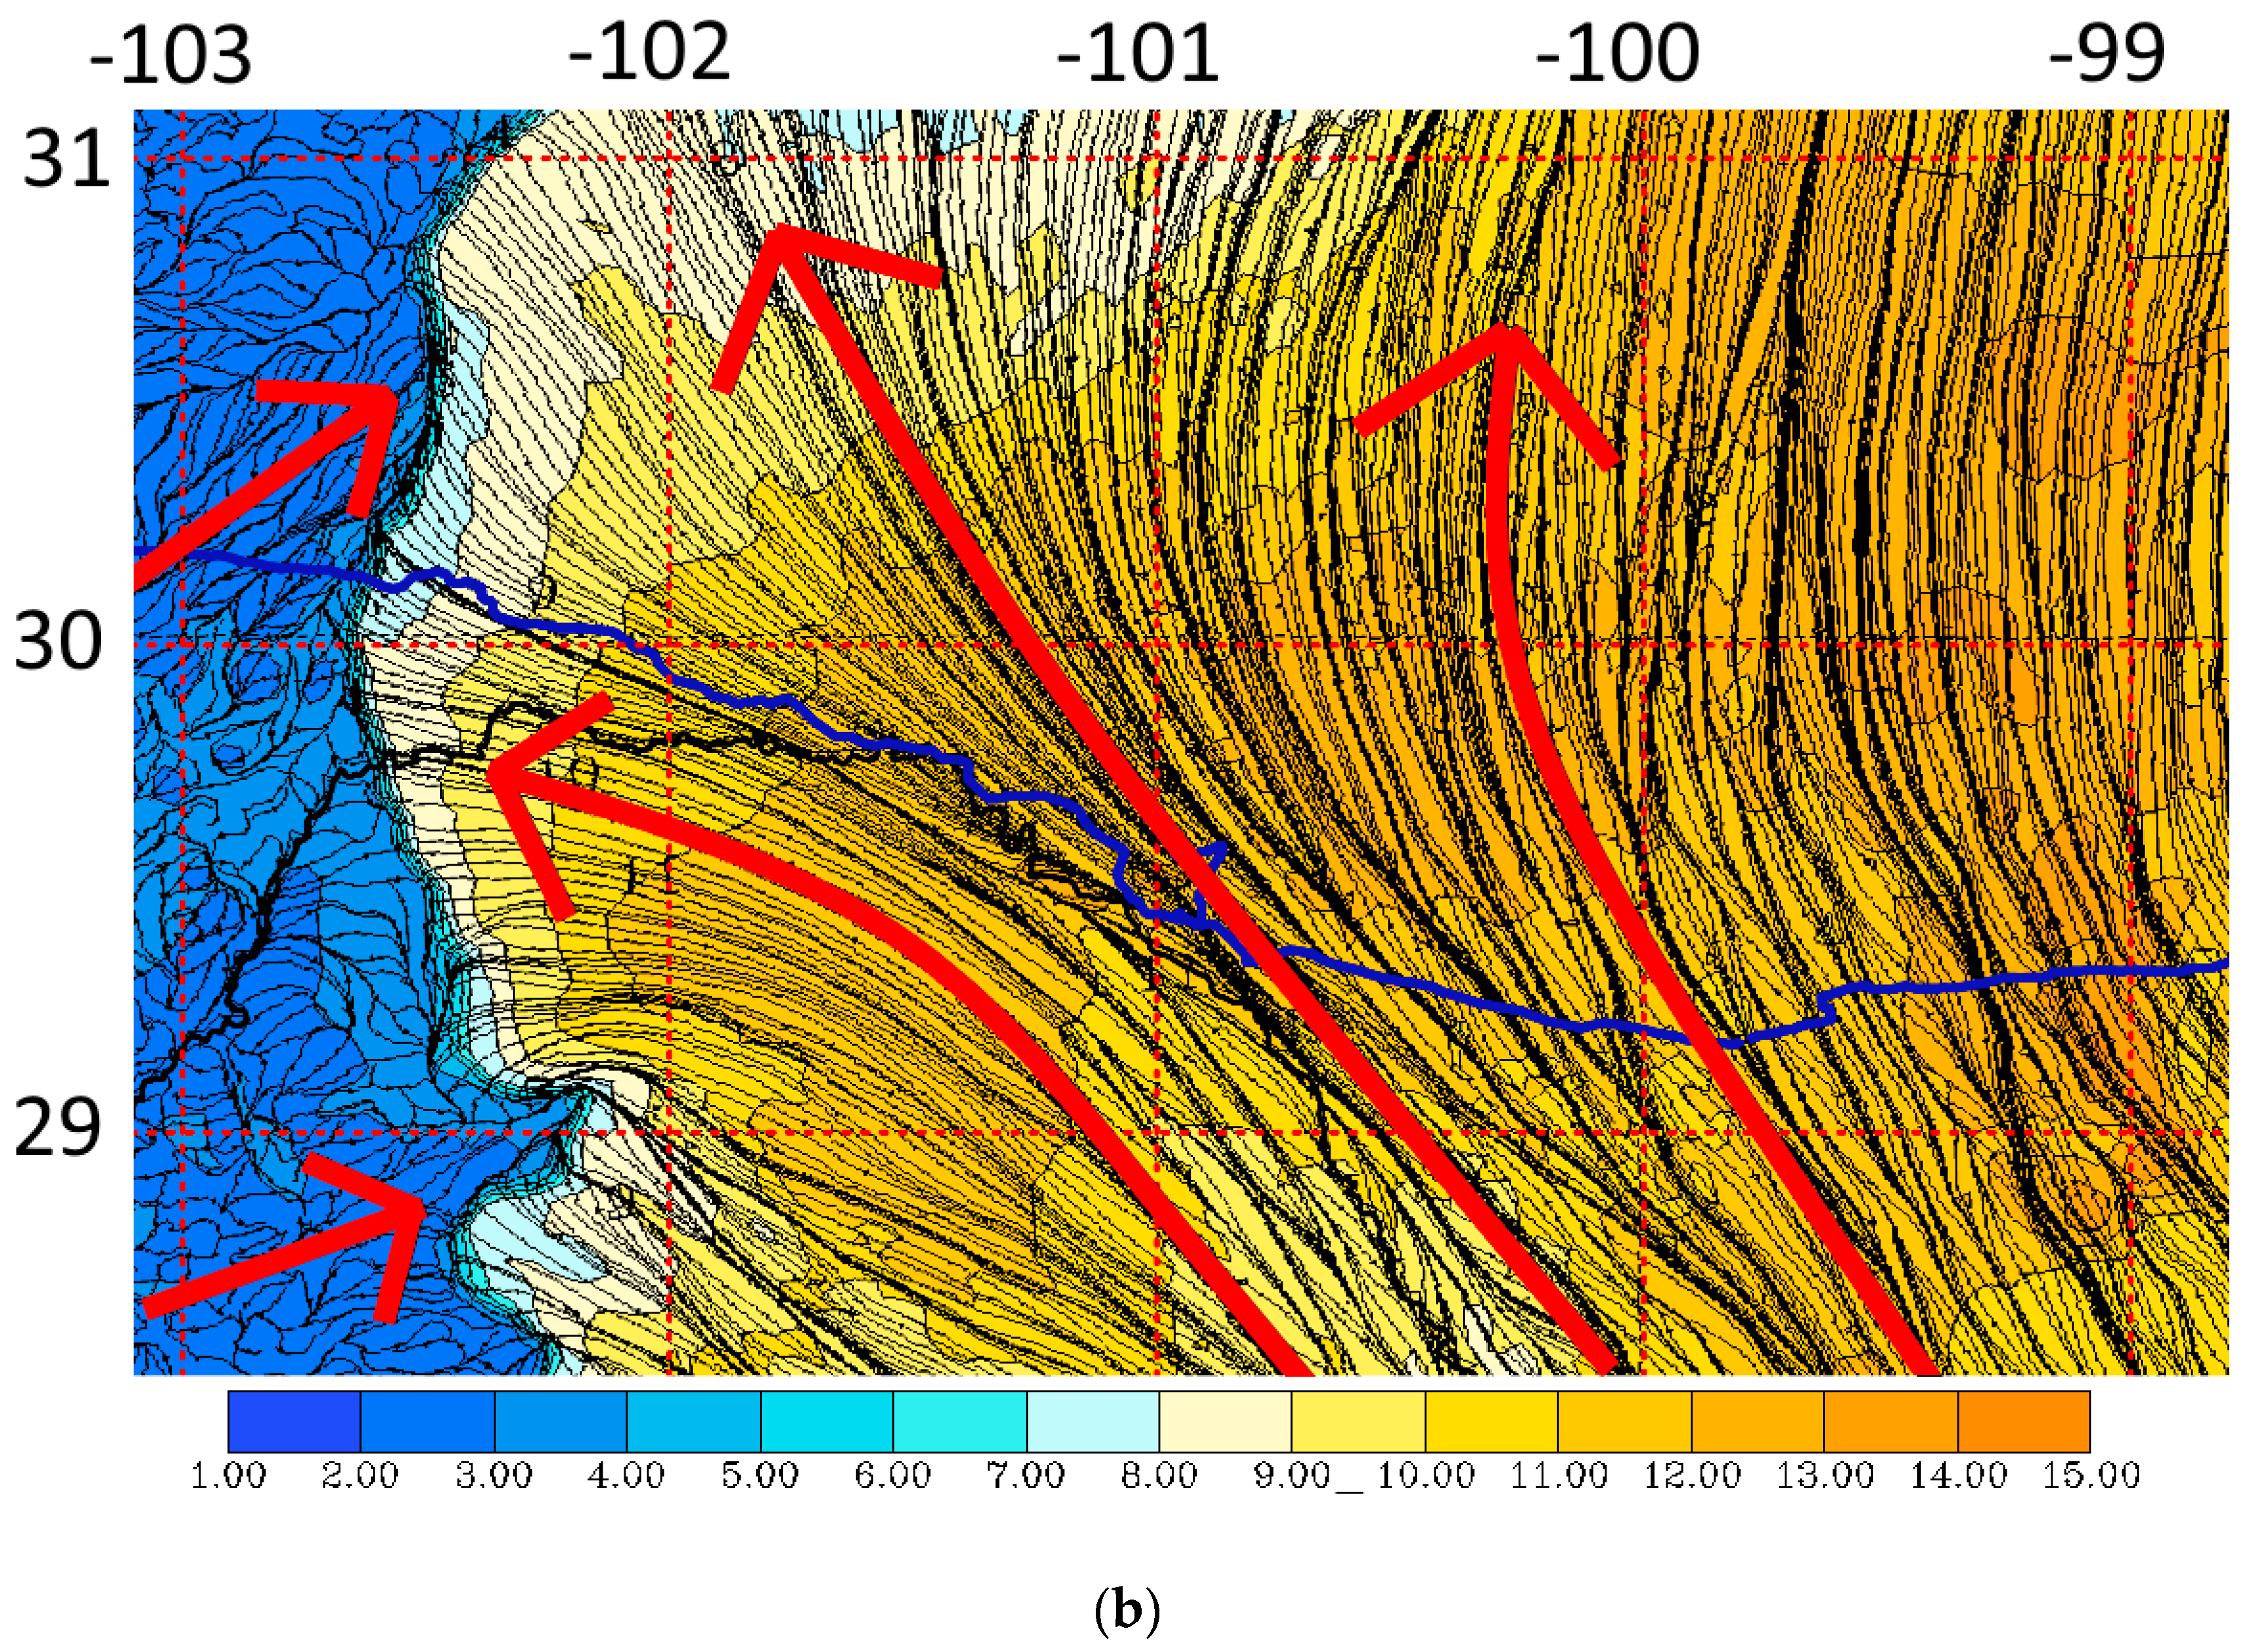
During the period of 7 through to 10 April 2017, operational model guidance called for a dryline to develop in Western Texas (Figure 1). The upper tropospheric pattern was characterized by a broad ridge across the central United States (not shown). A mobile transect with the JSU MMU was planned for the evening of 8 April across the southernmost section of the dryline. Including stops, the transect along U.S. highway 90 from San Antonio (96.8 W) to Alpine (103.6 W; Figure 2a) was conducted from 1603 UTC on 8 April until 0252 UTC on 9 April. The mobile data between Comstock (101.2 W) and Alpine will be emphasized since stops were minimal on this segment. The strong moisture contrast in the HRRR extended southward through the mountainous terrain of the Northern Coahuila state in Mexico. Maximum convective available potential energy (CAPE) of over 2100 J/kg was indicated by the HRRR around the Serrañías del Burro mountains, where severe convection is often preferentially initiated [41,42,43]. However skies remained generally clear across most of the region west of 100 W during the period. At 2049 UTC a Windsond lower tropospheric sonde was launched at Amistad Reservoir near Del Rio (29.5 N, 101.0 W), about 170 km east of the HRRR dryline position (102.6 W). This location was well within the near-surface moist southeasterly flow (Figure 2b).
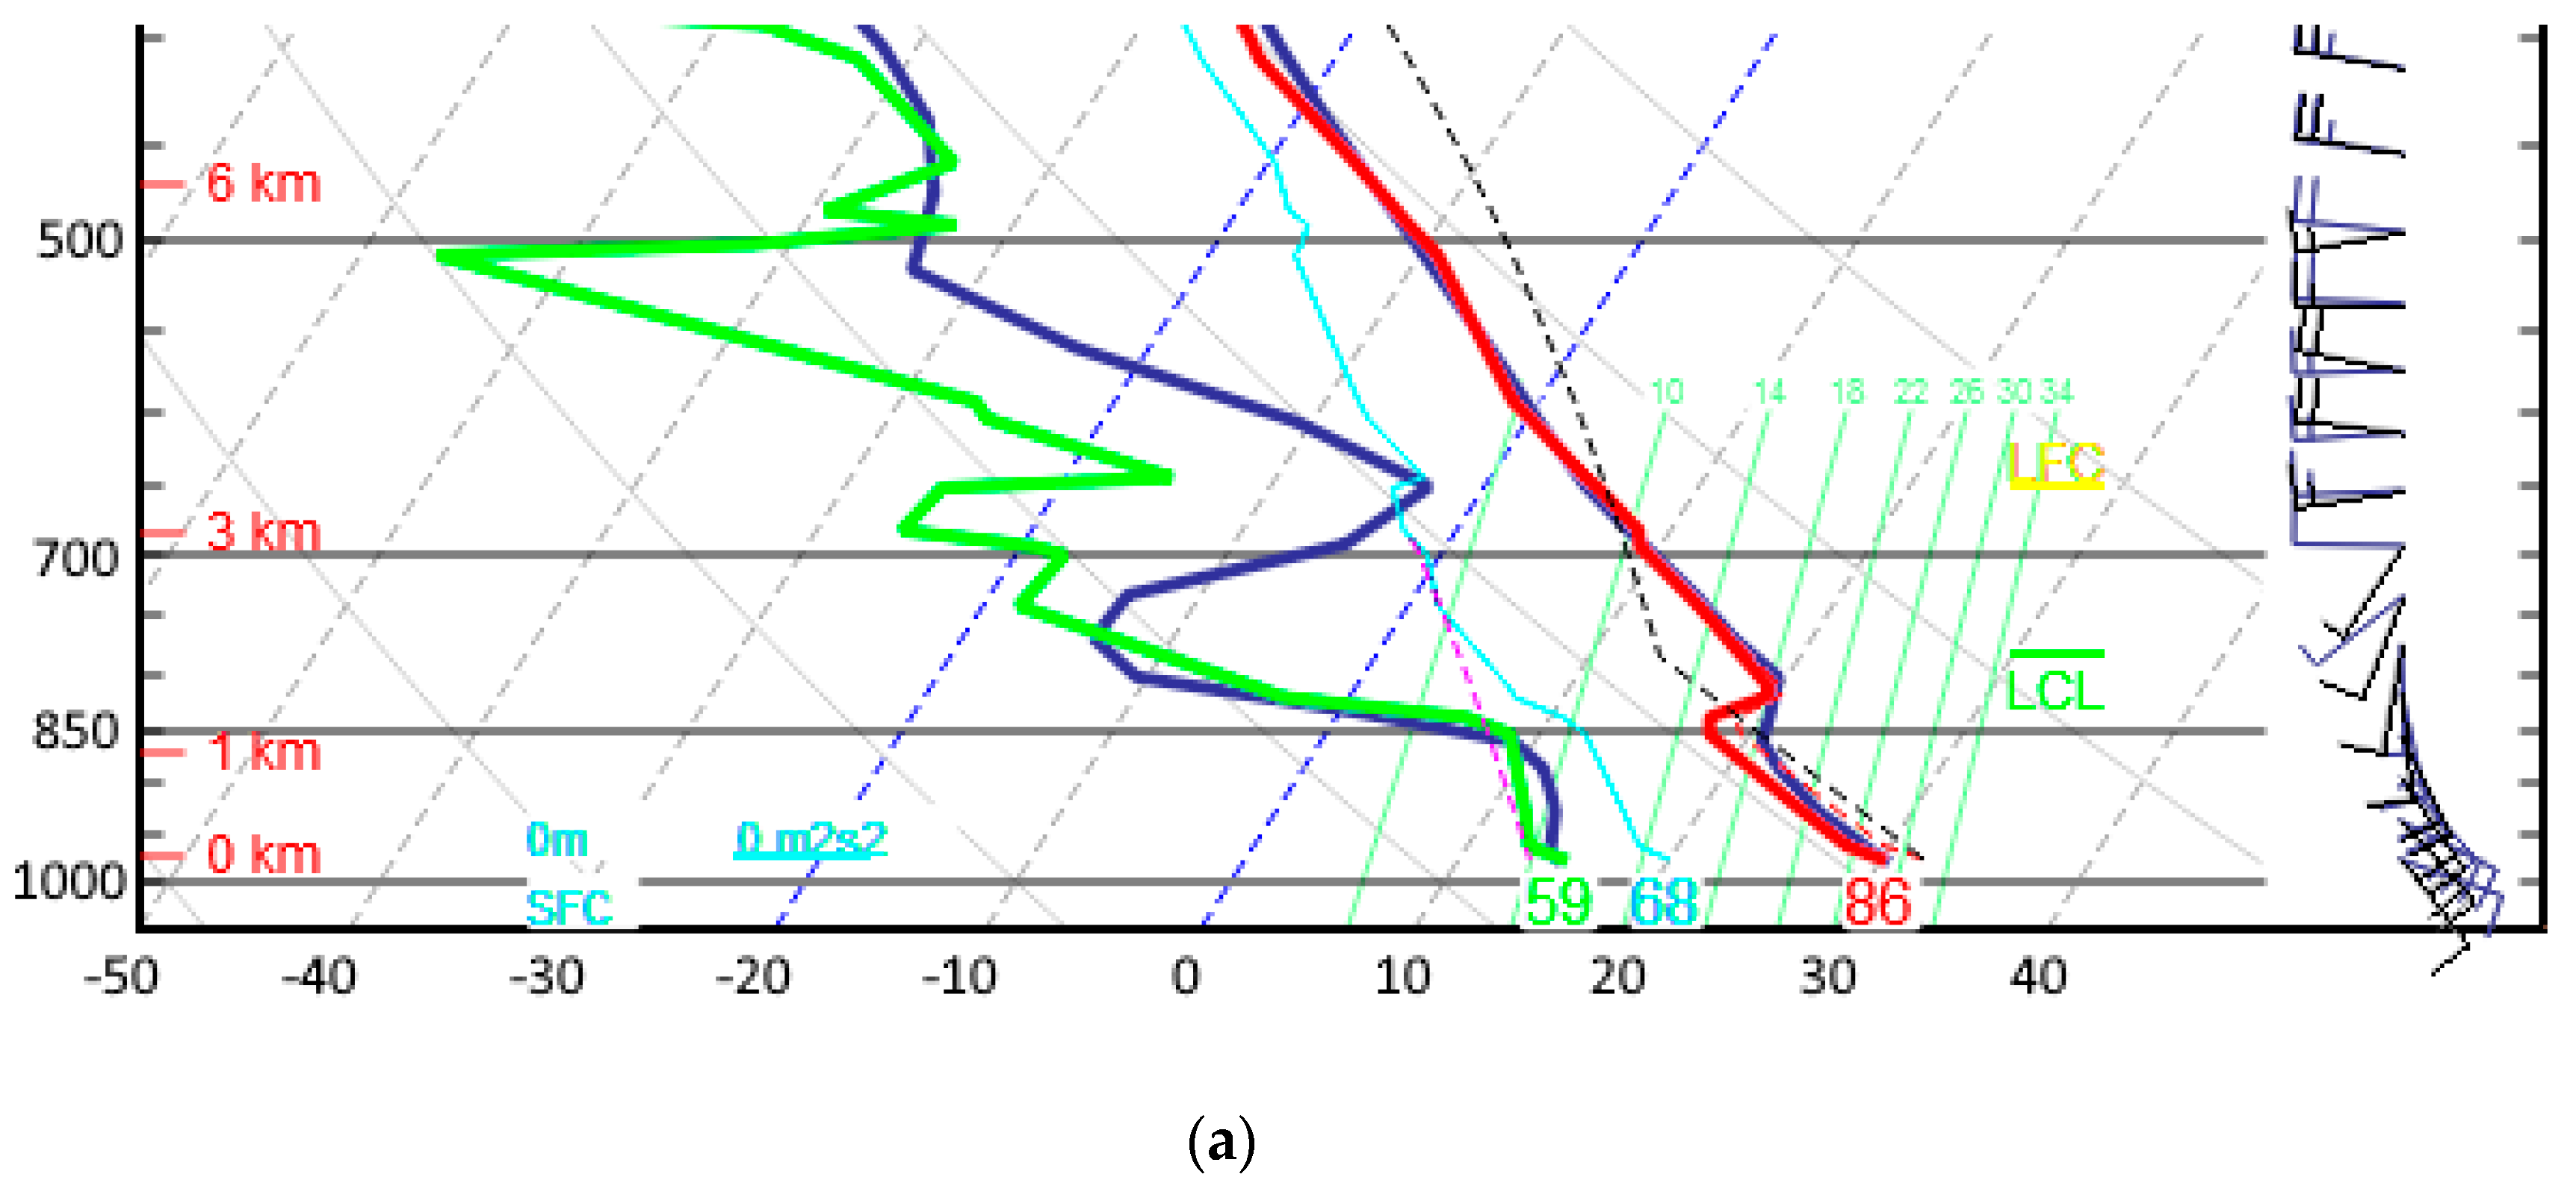
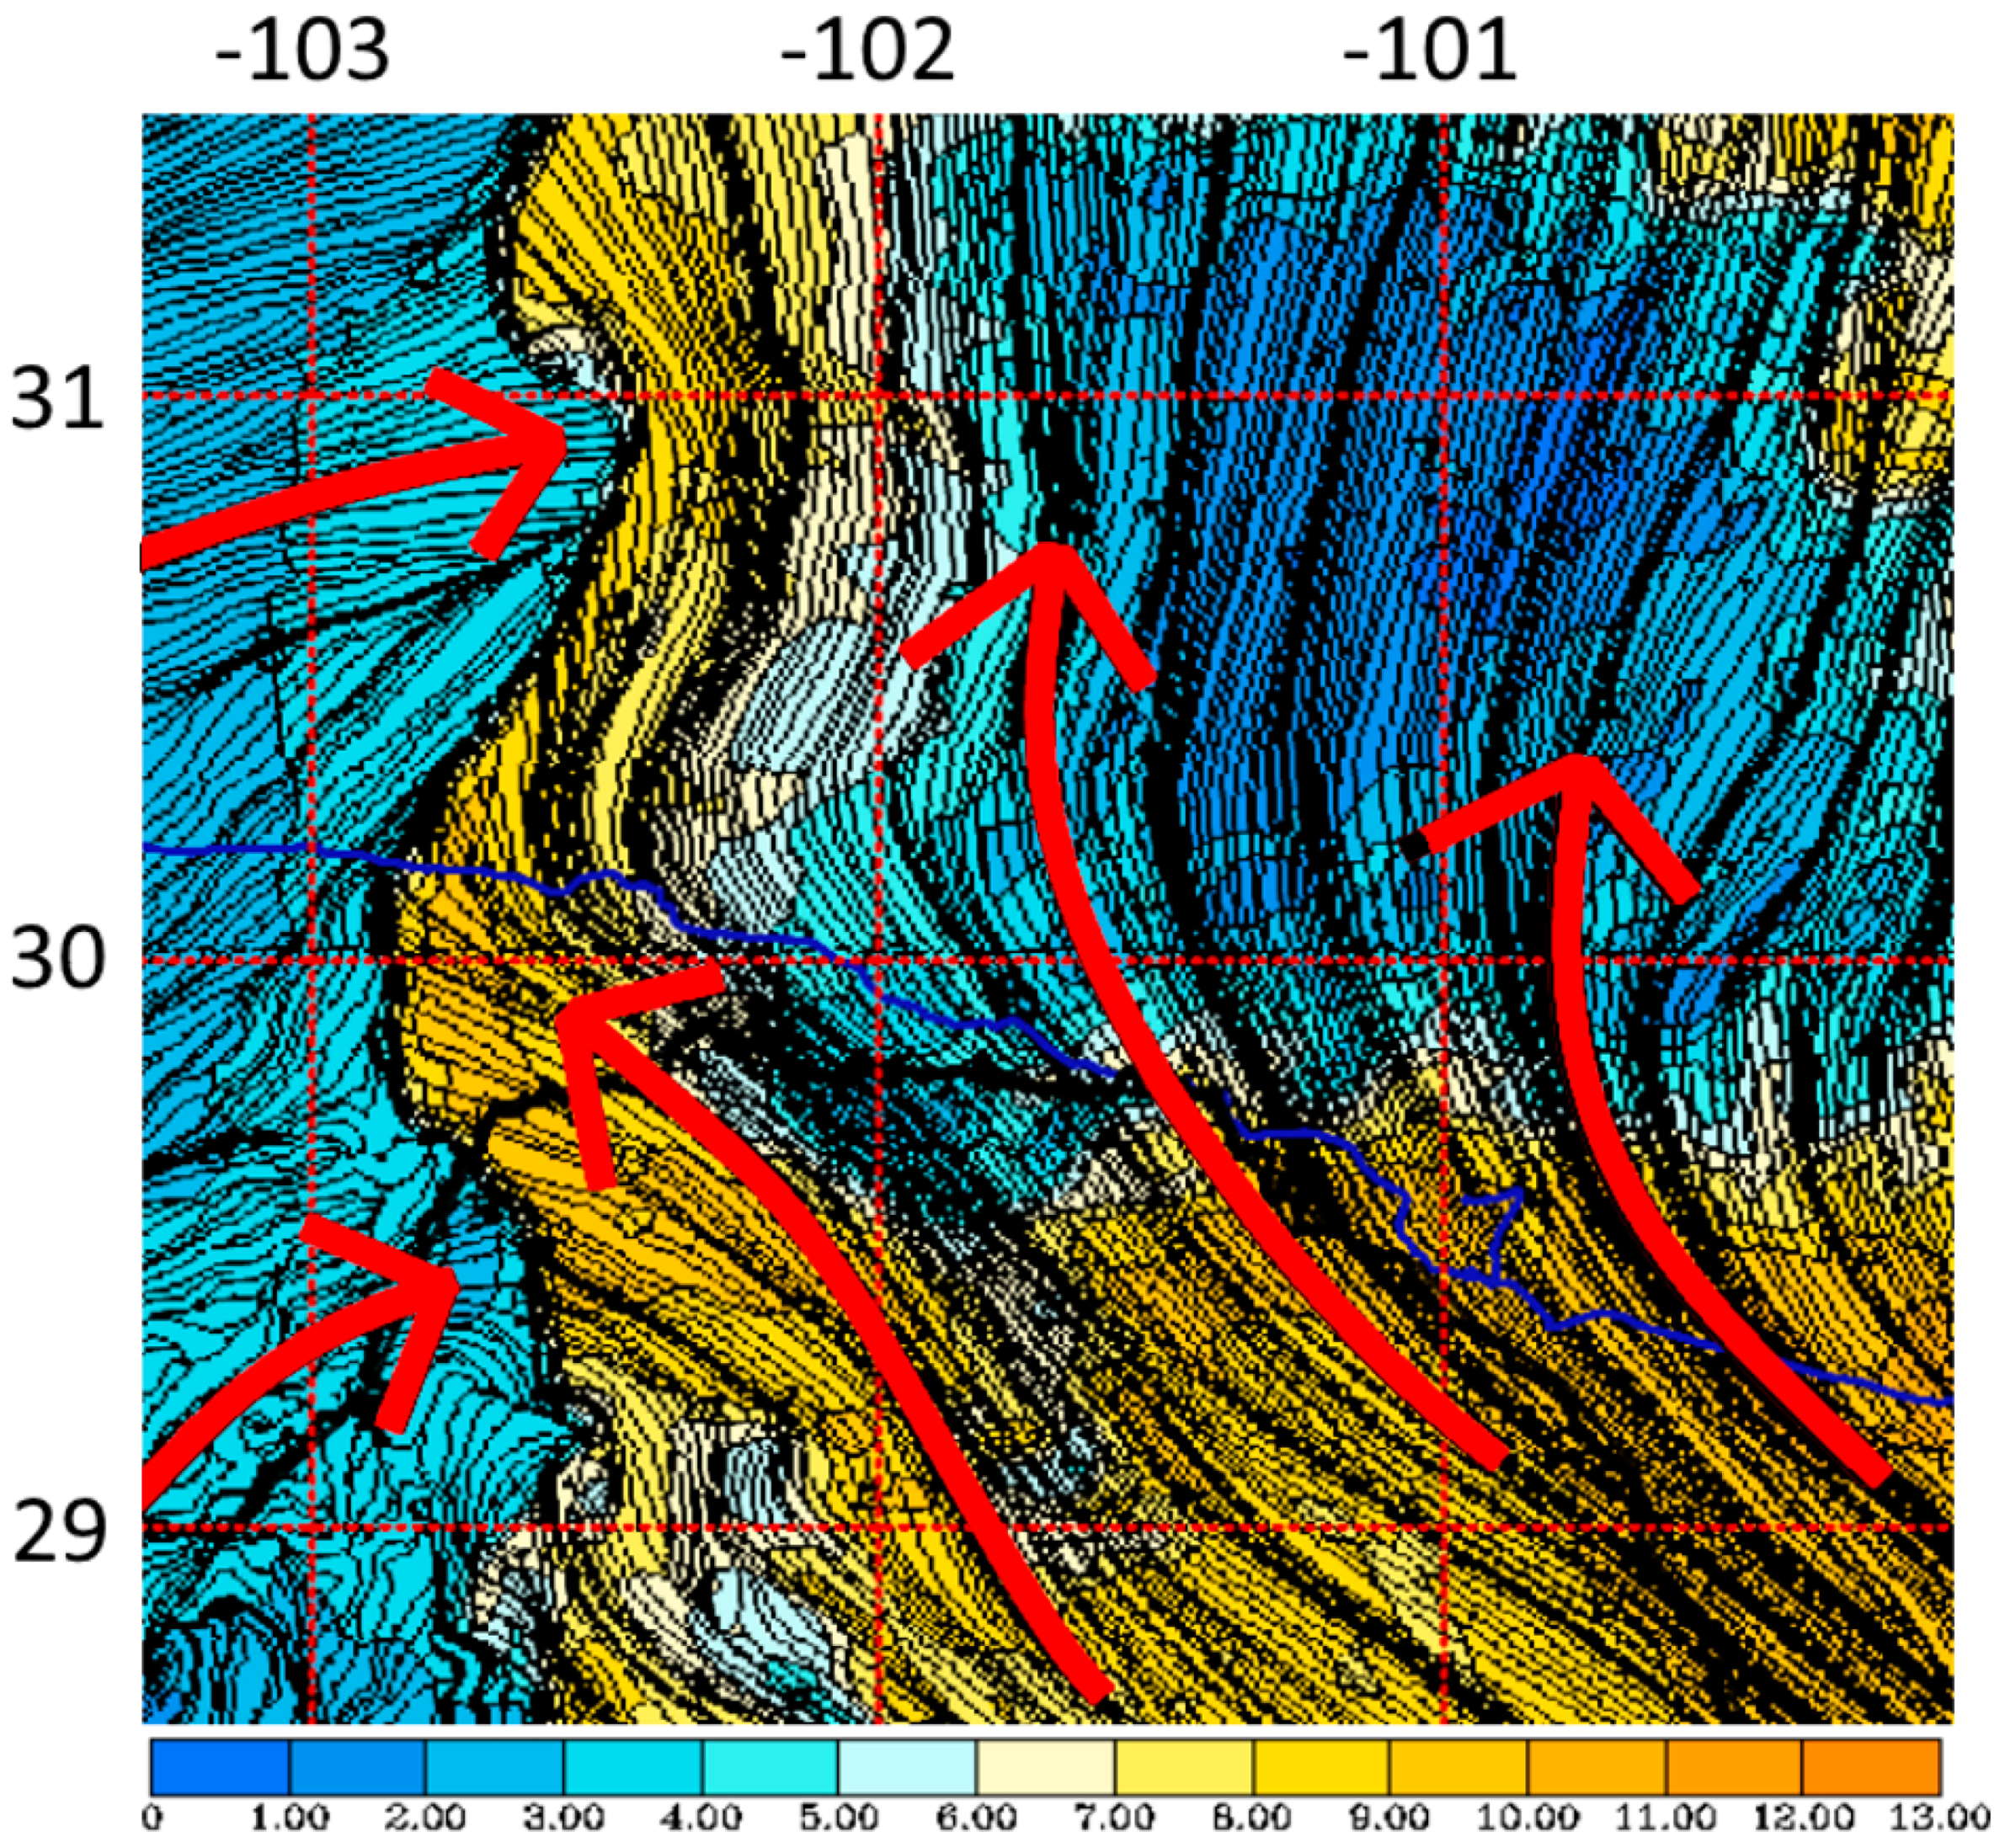
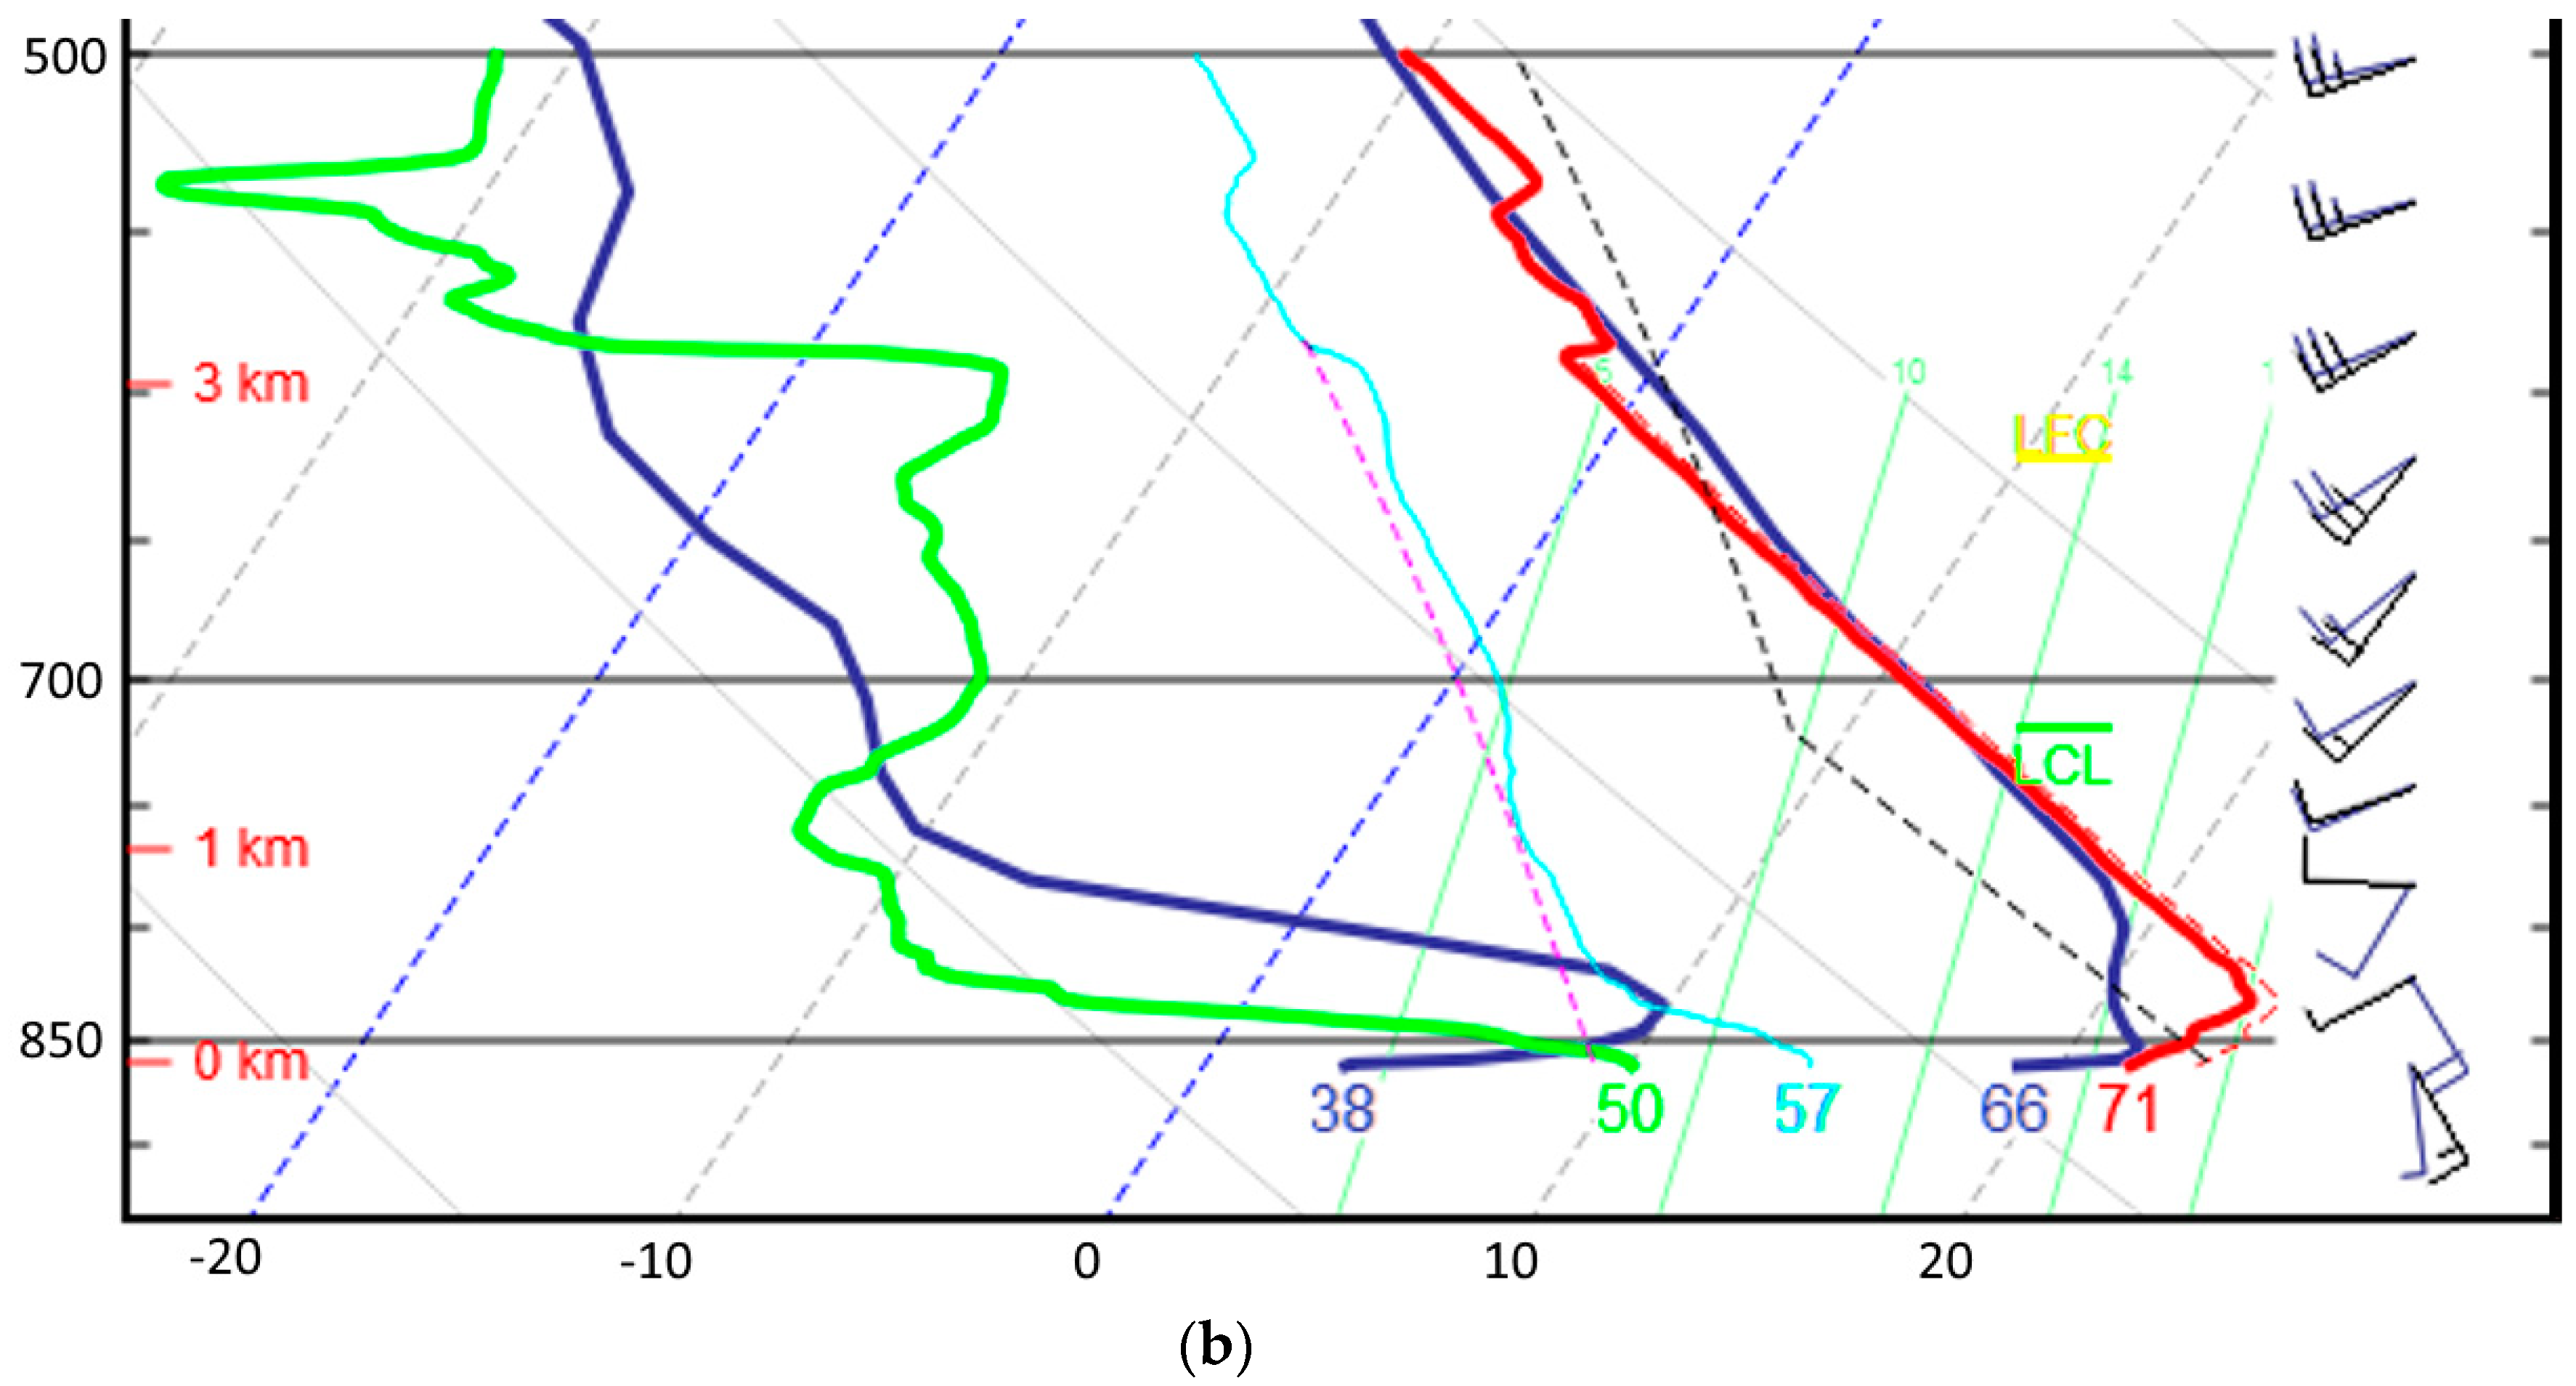
The sounding from Amistad Reservoir ascended up to 724 hPa before it was terminated, showing a very pronounced inversion between 856 to 841 hPa (1450–1630 m MSL; Figure 3). Data plots from the Windsond software (v. 2.90) show that the peak wind speed of 20 kt was just below the inversion base, while the wind shift from SSE to SW began near the speed minimum around 1750 m. It should be noted that the Windsond software indicates height MSL whereas SHARPpy uses height AGL. Comparison with the HRRR profile from 2100 UTC shows a similar inversion and wind shift. However the inability of the model to produce as abrupt of a transition results in the inversion base appearing about 200 m lower. The strengths and weaknesses of the HRRR above 700 hPa are similarly evident in comparison with the nearby (20 km southeast) KDRT radiosonde that was launched at 2307 UTC. Aside from the more diffuse inversion layer in the HRRR, the temperature and wind agreed fairly well. There are larger differences in dew point, particularly between 600 and 700 hPa. This appears to be related to the HRRR’s overdevelopment of isolated deep convection in Northern Coahuila between 2200 and 2300 UTC whose mid-level moisture plume extended toward Del Rio. The thermodynamic contrast across the dryline is indicated observationally at 0000 UTC by comparison of the soundings from KDRT and KMAF (although nearly 300 km farther north) (Figure 4). Radar coverage was inadequate to delineate the dryline south of about 31 N, but there was a fine line detected at 2245 UTC in the Permian Basin area and isolated precipitation echoes in the Serrañías del Burro. At 0000 UTC the HRRR indicated a narrow band of upward vertical motion at 0.85 sigma along the dryline even though it was inadequate to produce convective cloud [44], and a resulting relatively broad area of higher humidity at 0.90 sigma east of the dryline convergence (Figure 5).
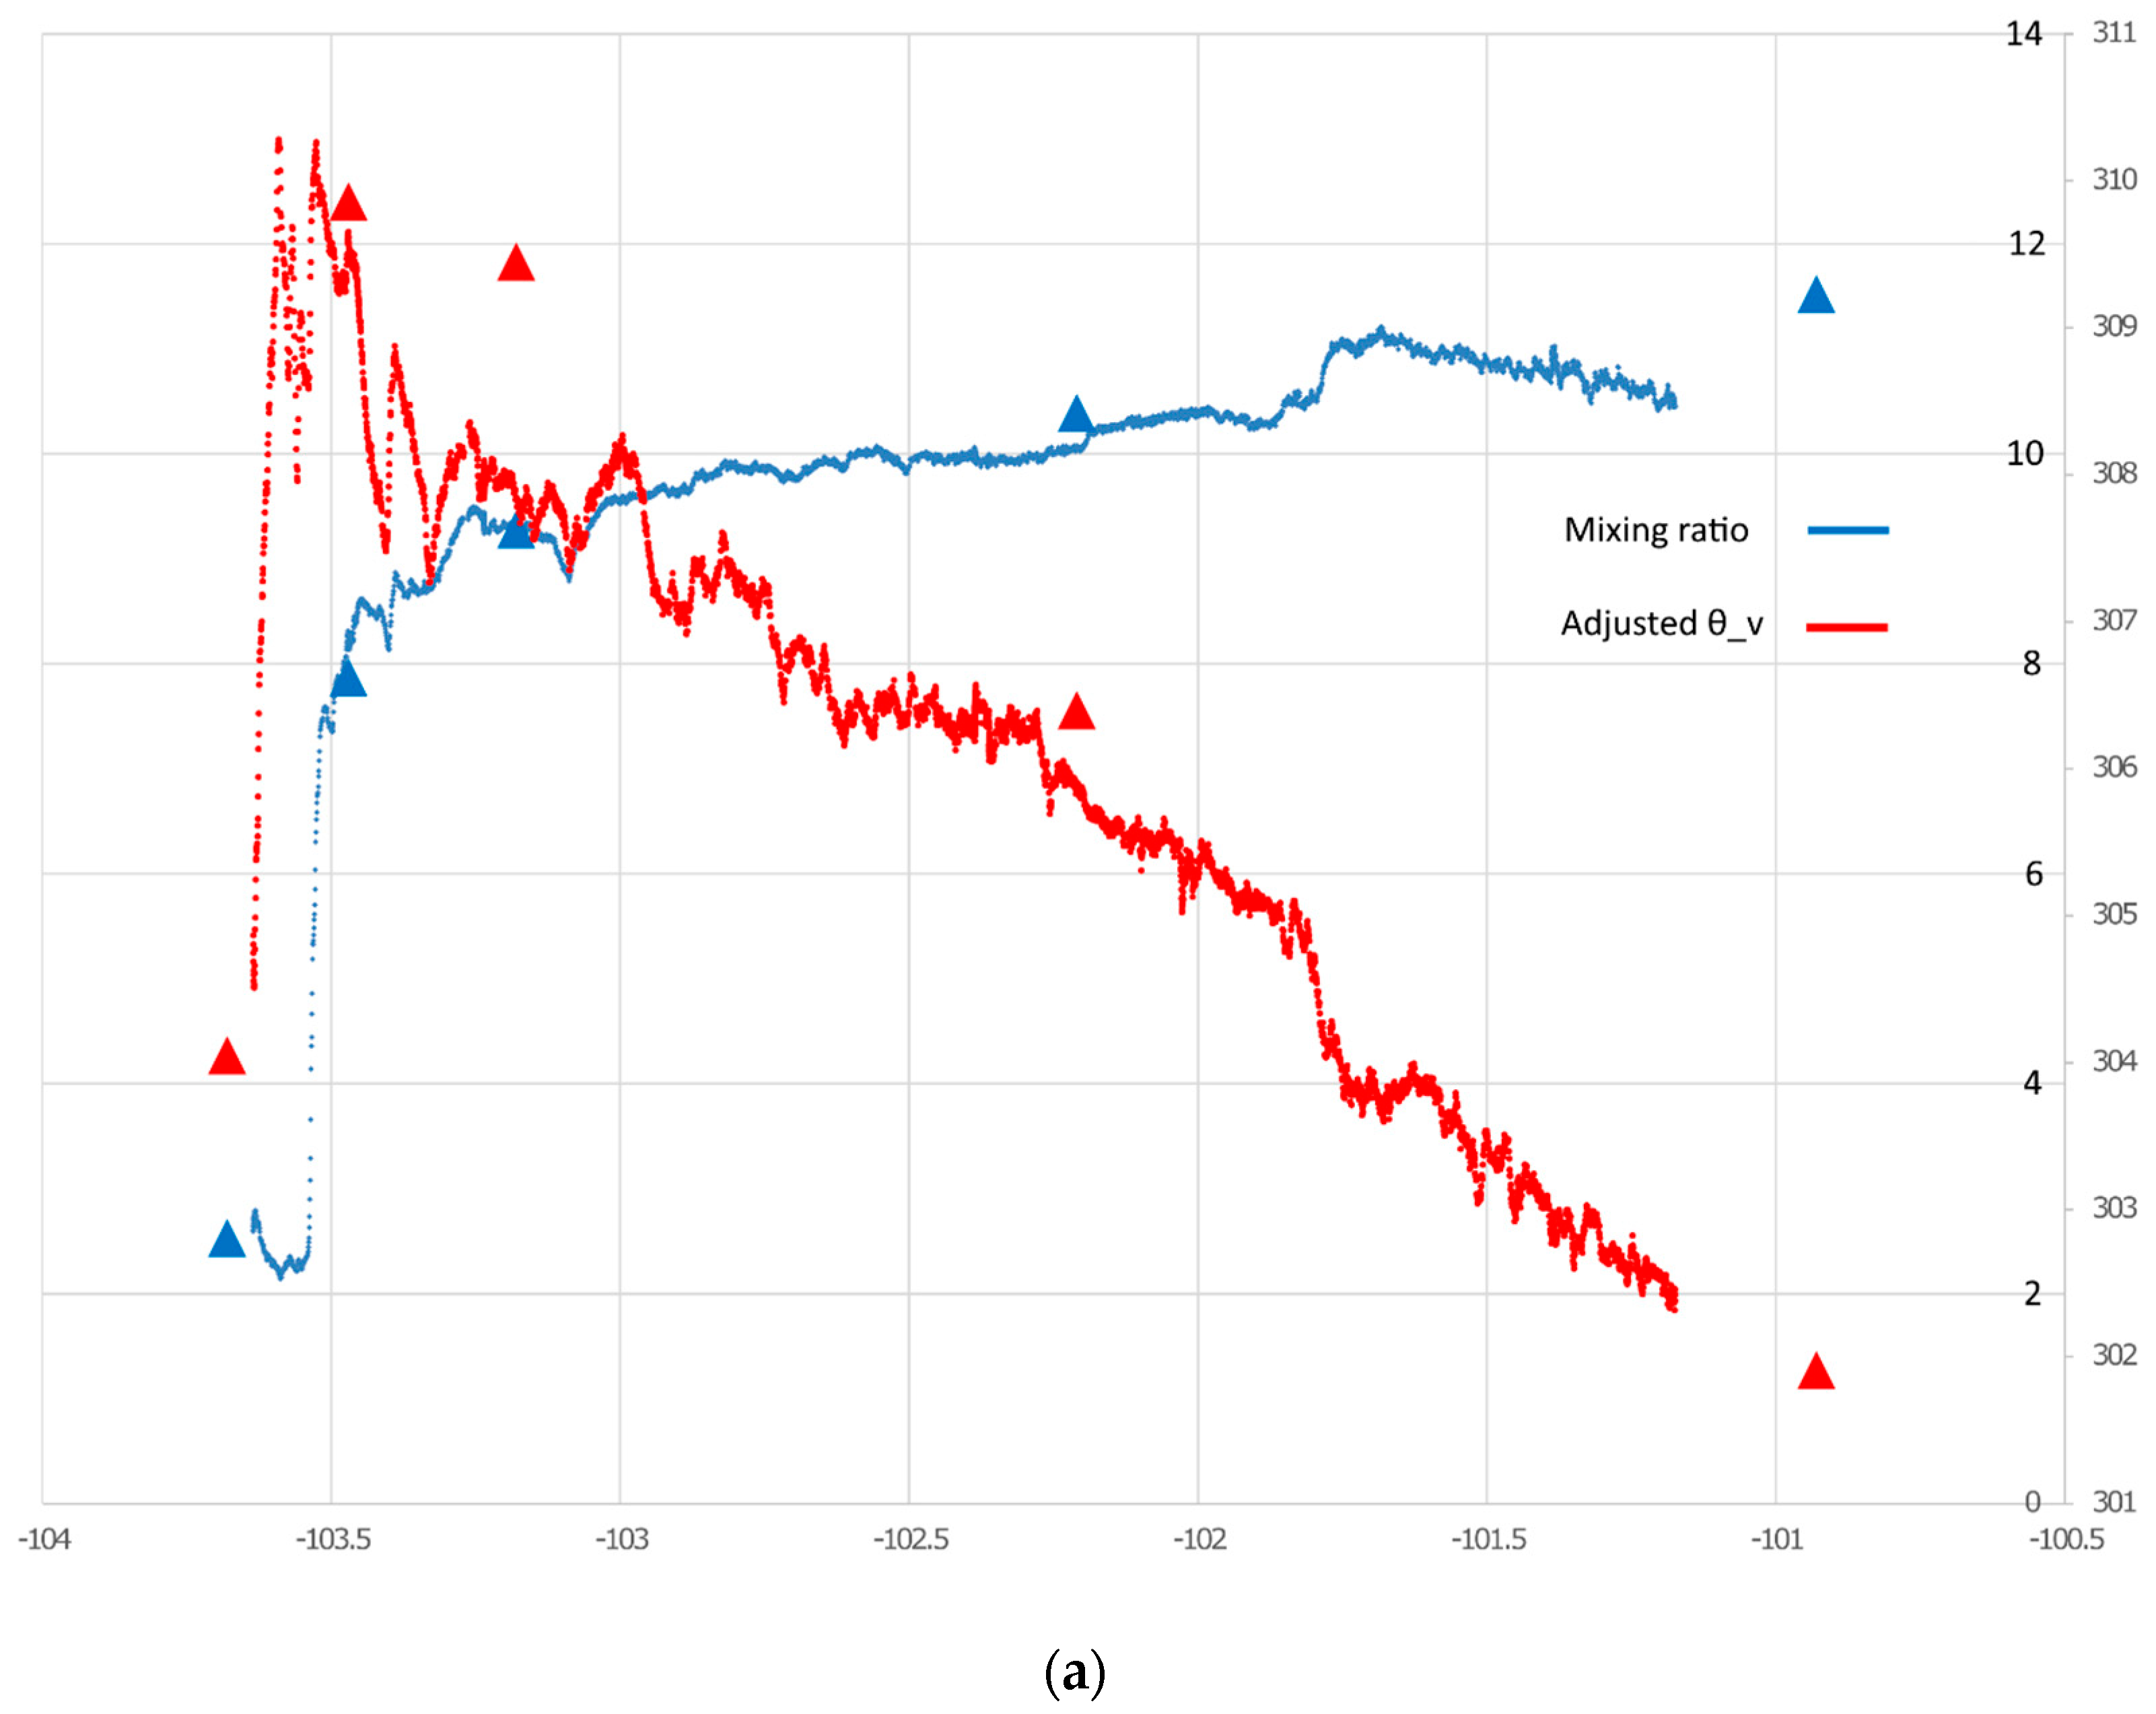
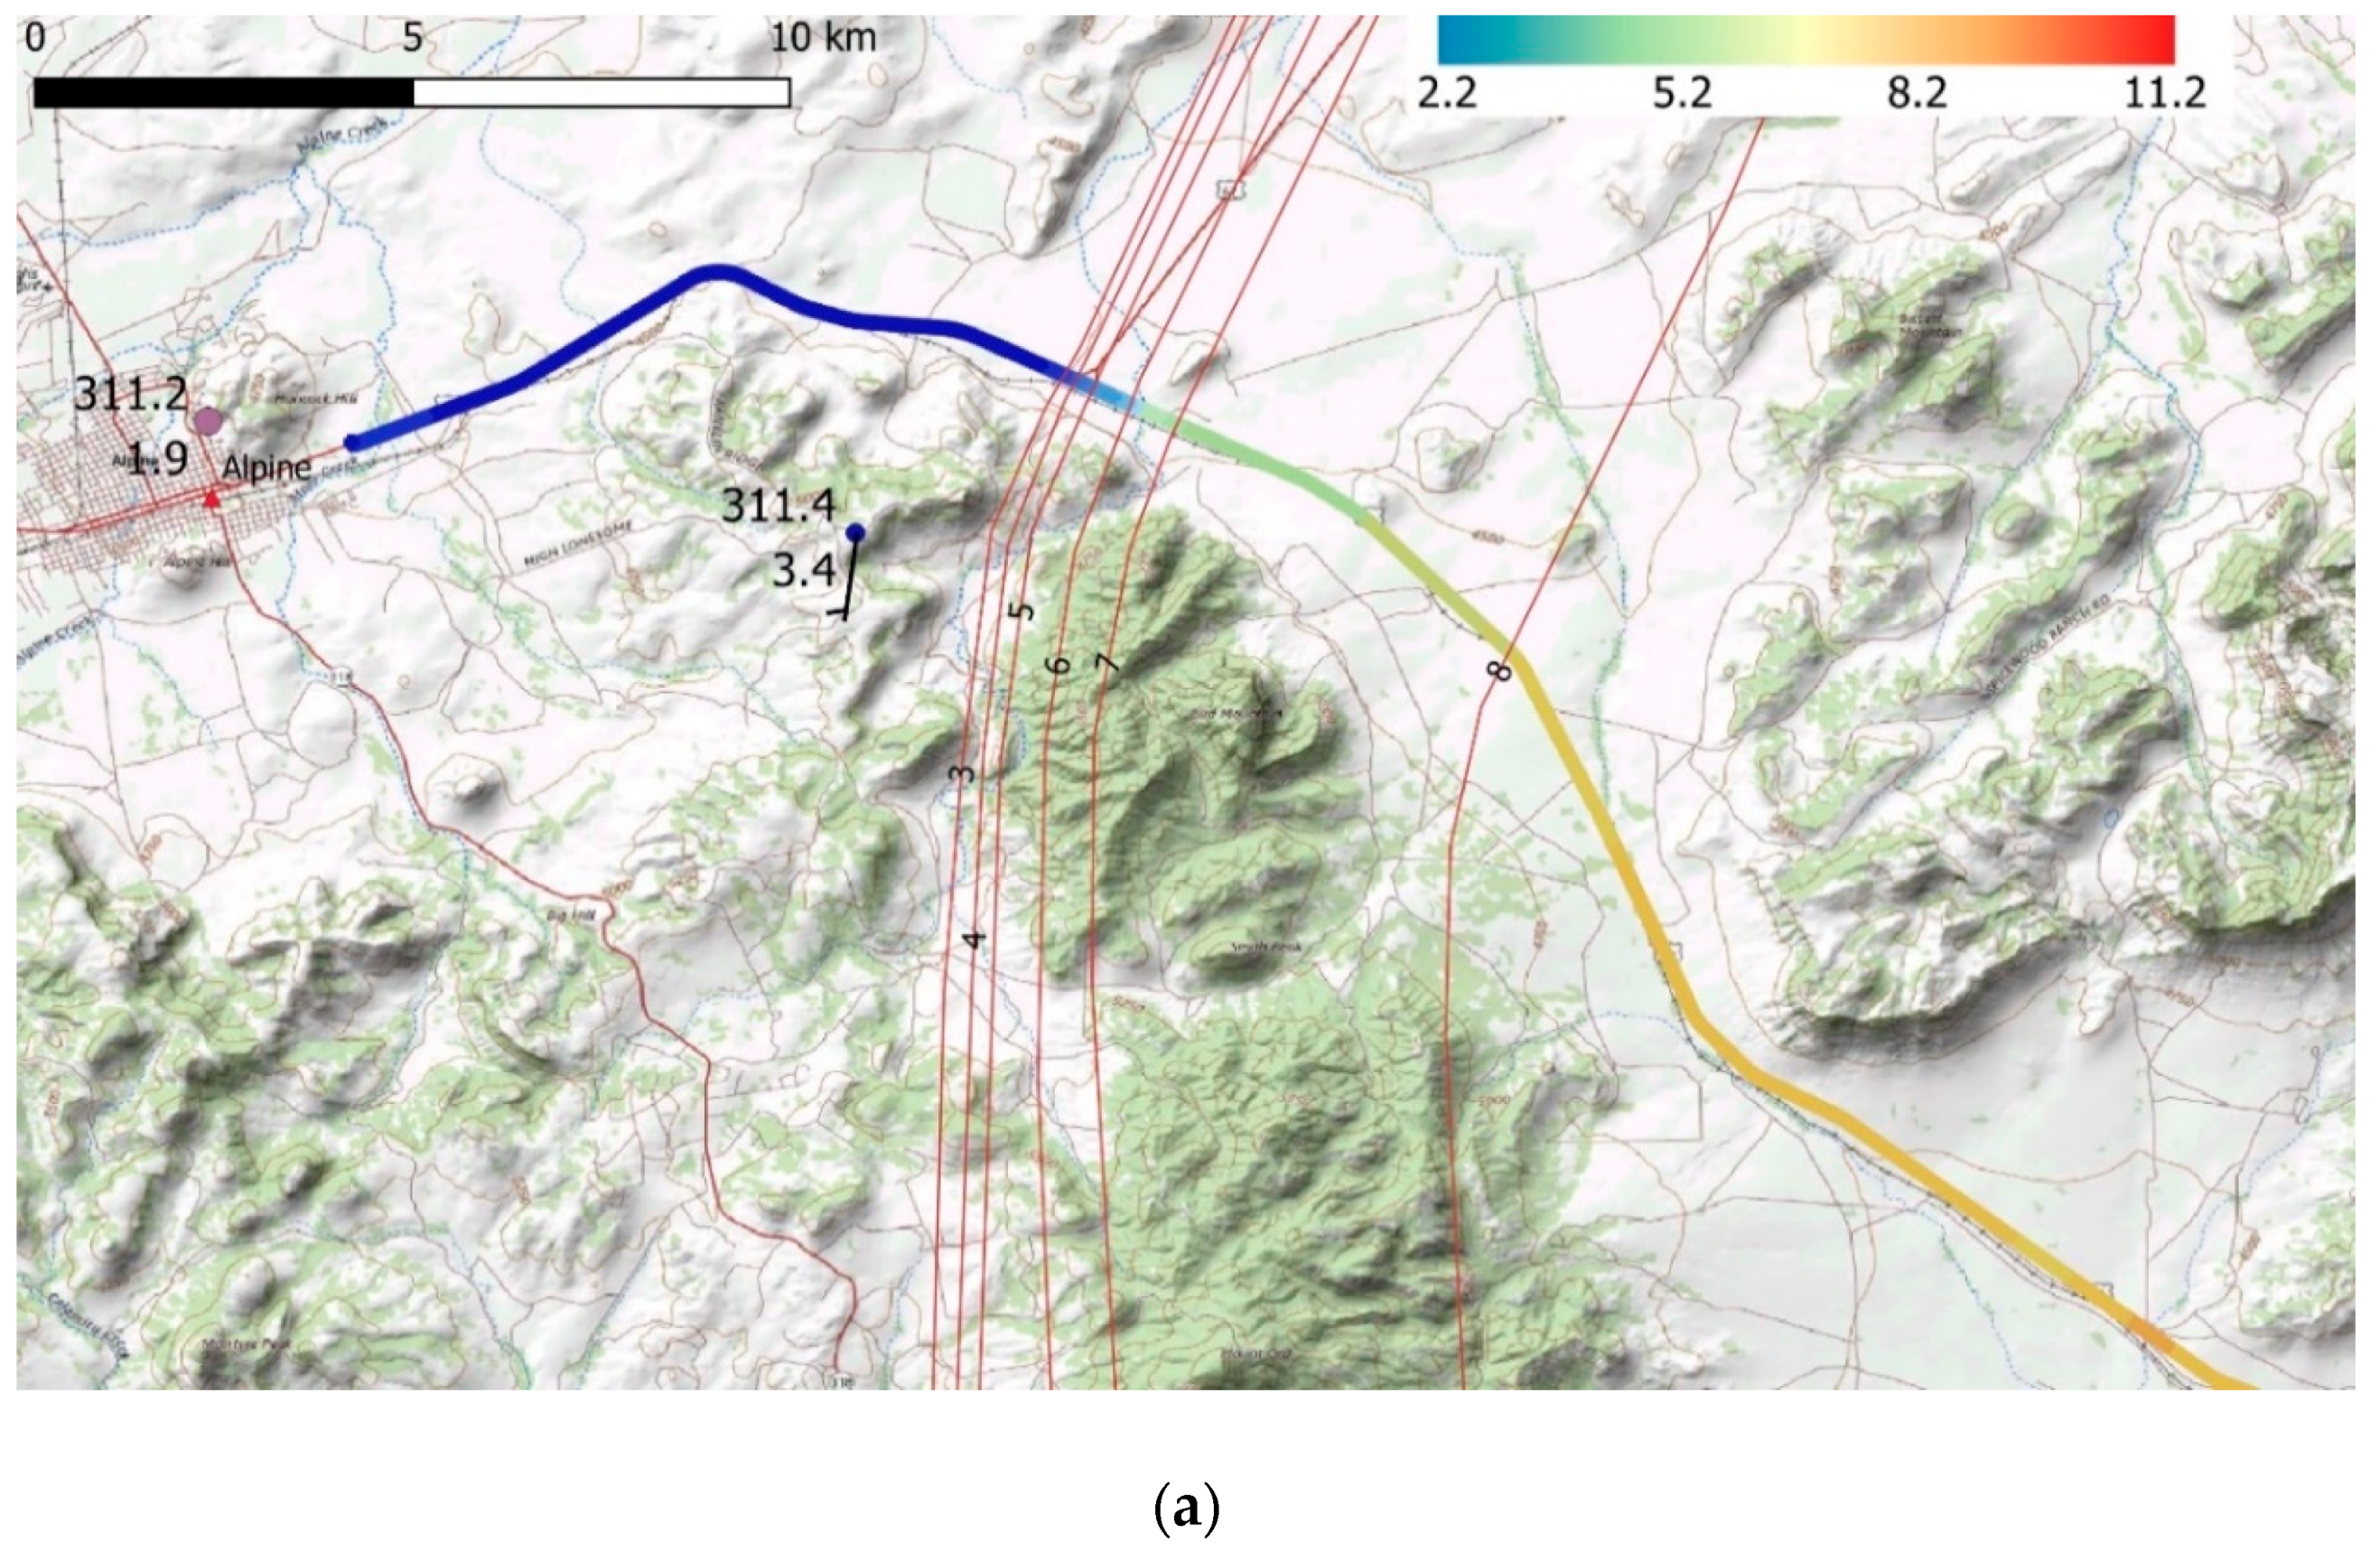
The mobile transect from Comstock to Alpine traversed from a dissected plateau of around 400 m MSL up to mountain valleys at about 1400 m, with surrounding mountain peaks near Alpine of over 2000 m. Sunset was at 0113 UTC and the dryline retrogressed westward about 100 km by the time that it was intercepted below the slopes of the Del Norte Mountains about 10 km east of Alpine at 0244 UTC. Virtual potential temperatures () from the mobile system along this segment have been adjusted to 0300 UTC by temporal linear interpolation of the changes (mainly from a diurnal cycle) observed at synoptic/mesonet stations along the route. This method to analyze long-distance mobile datasets was introduced in [20]. This had little impact near the dryline since the mobile observations were close to 0300 UTC. However, the time span of the full transect was long enough that significant nocturnal cooling (more than 4 °C) occurred at eastern locations. Adjusting to a standard time facilitates a “synoptic” spatial examination of the data, in order to depict variations within the moist air mass and to allow direct comparison with station observations. The use of stations from significantly different elevation than the mobile transect (in particular at 103.2 W) for temporal adjustment is acceptable because the longitudinal position relative to the dryline is expected to produce similar diurnal variations (note that much of the westward increase of can be attributed to increasing elevation). No adjustment has been done with humidity measurements since dew points generally changed by less than 1 °C during the period except in association with dryline passage.
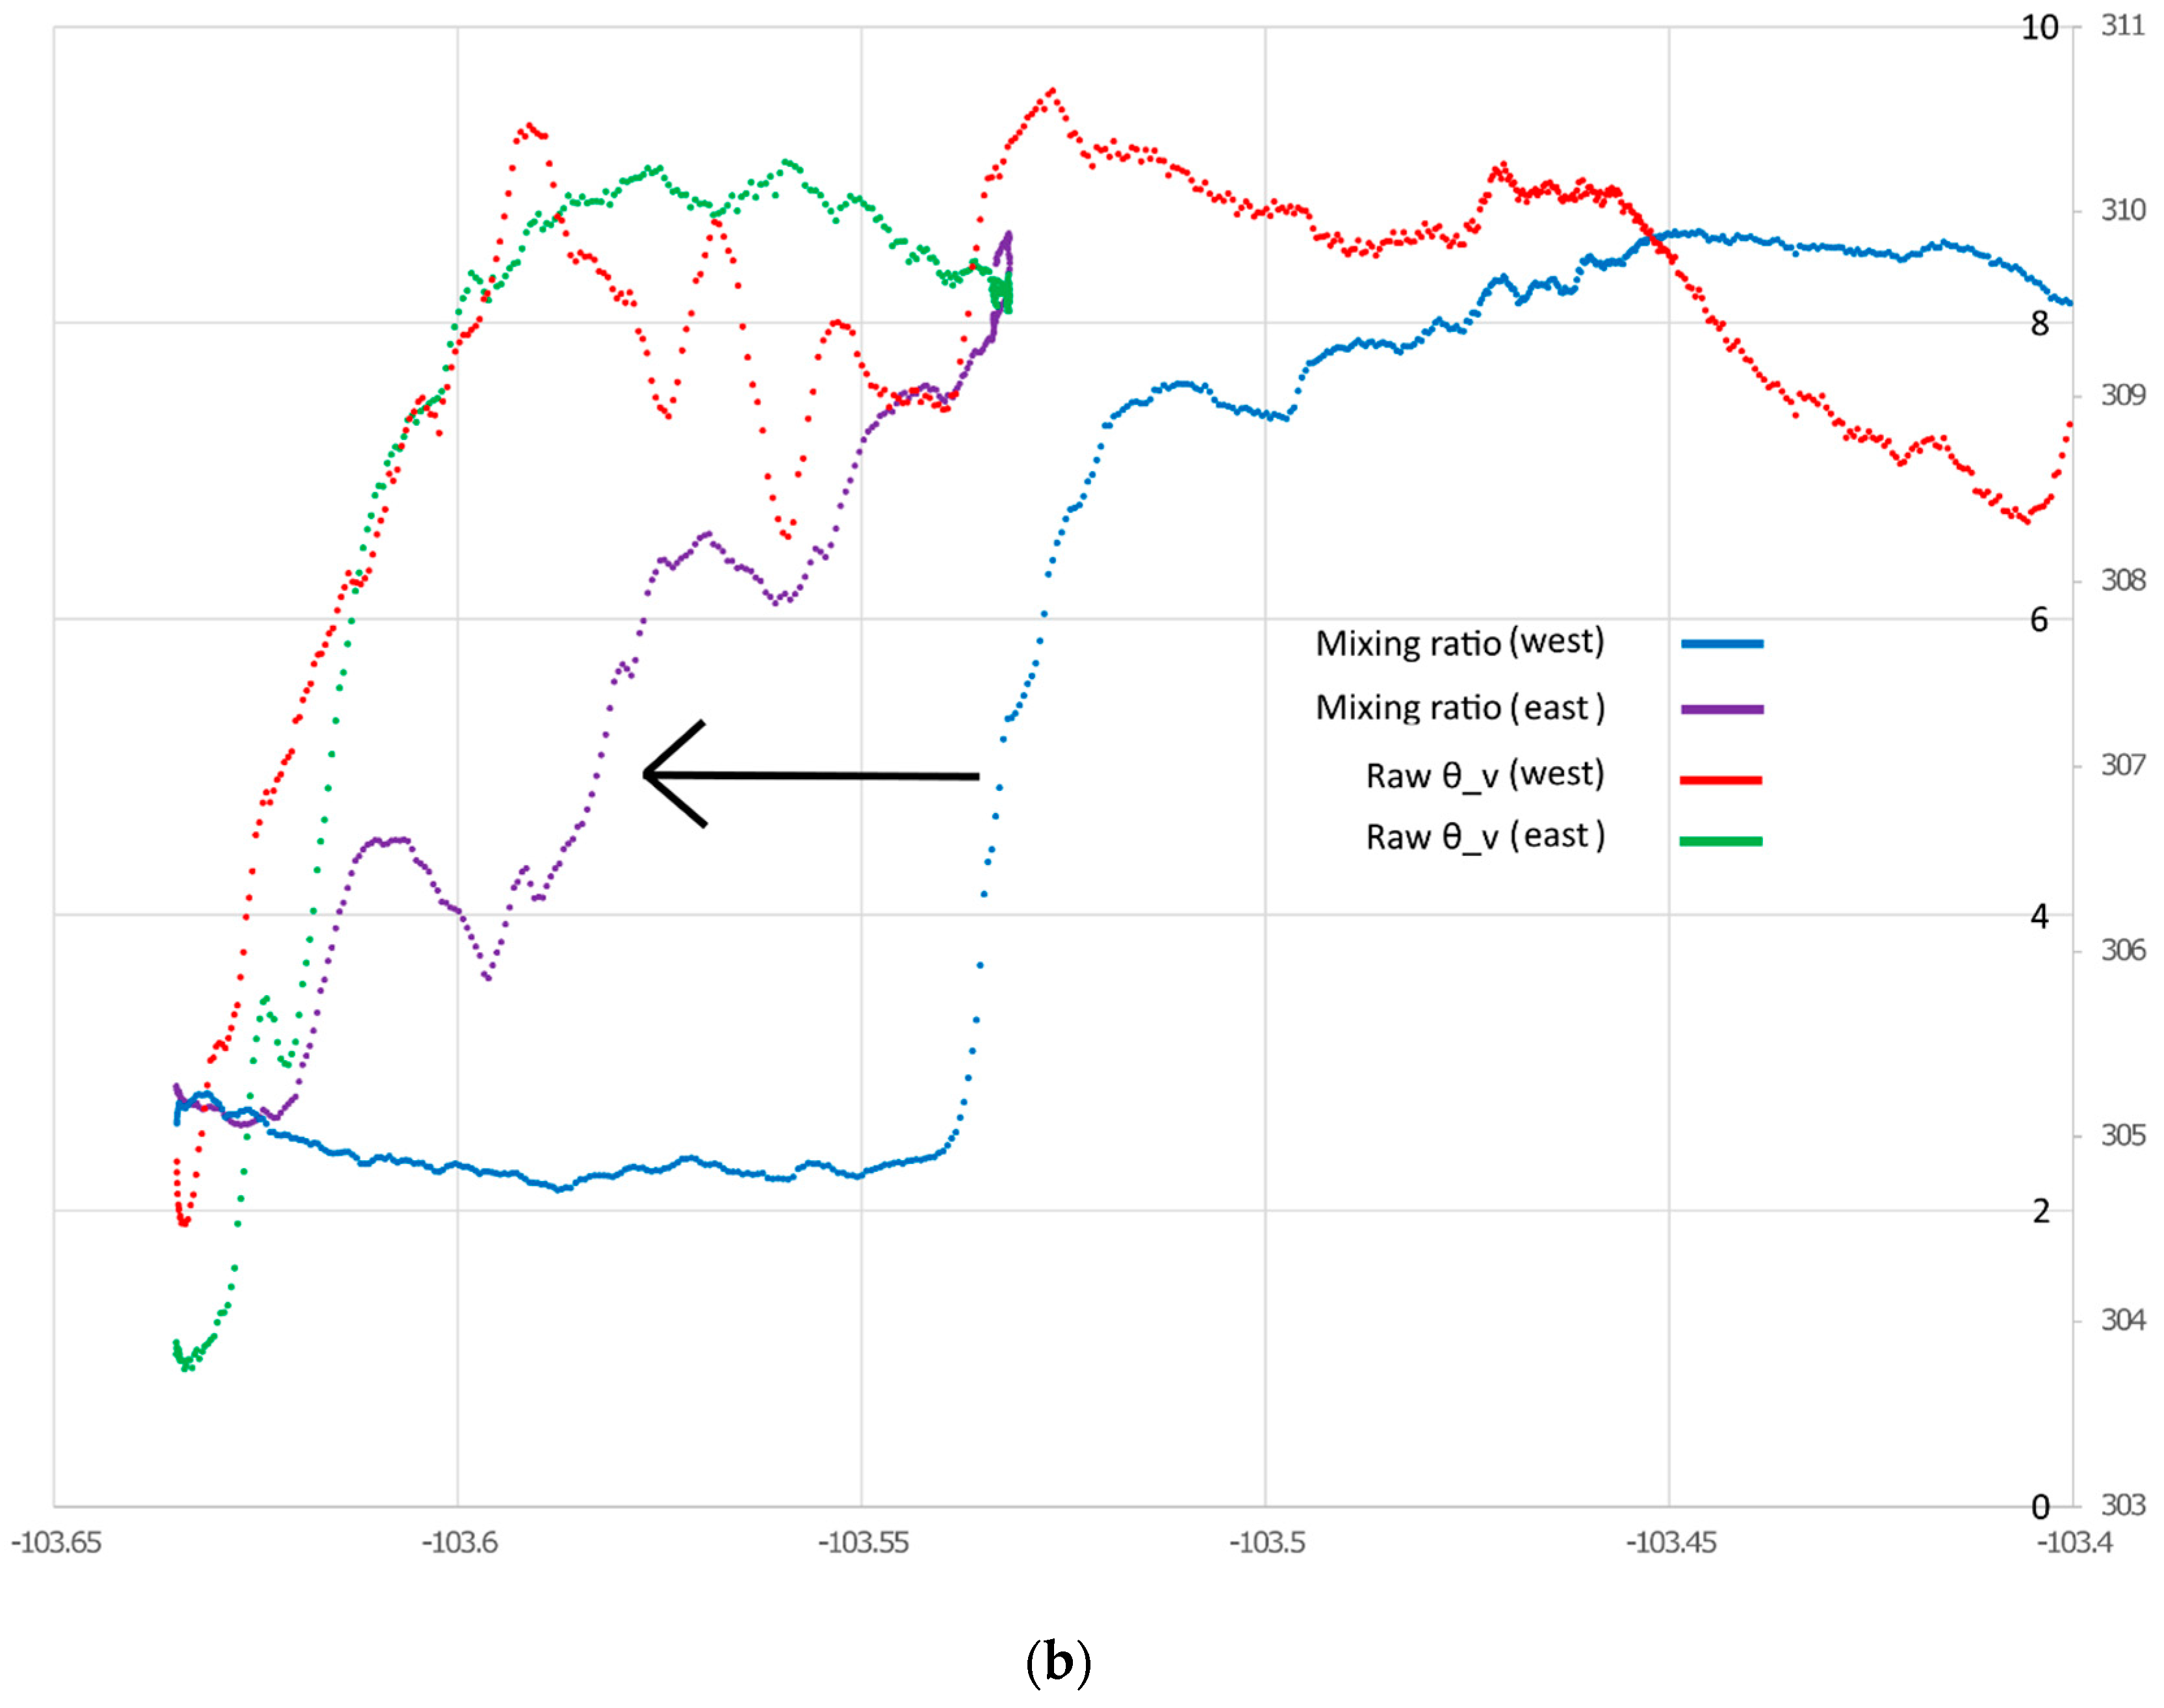
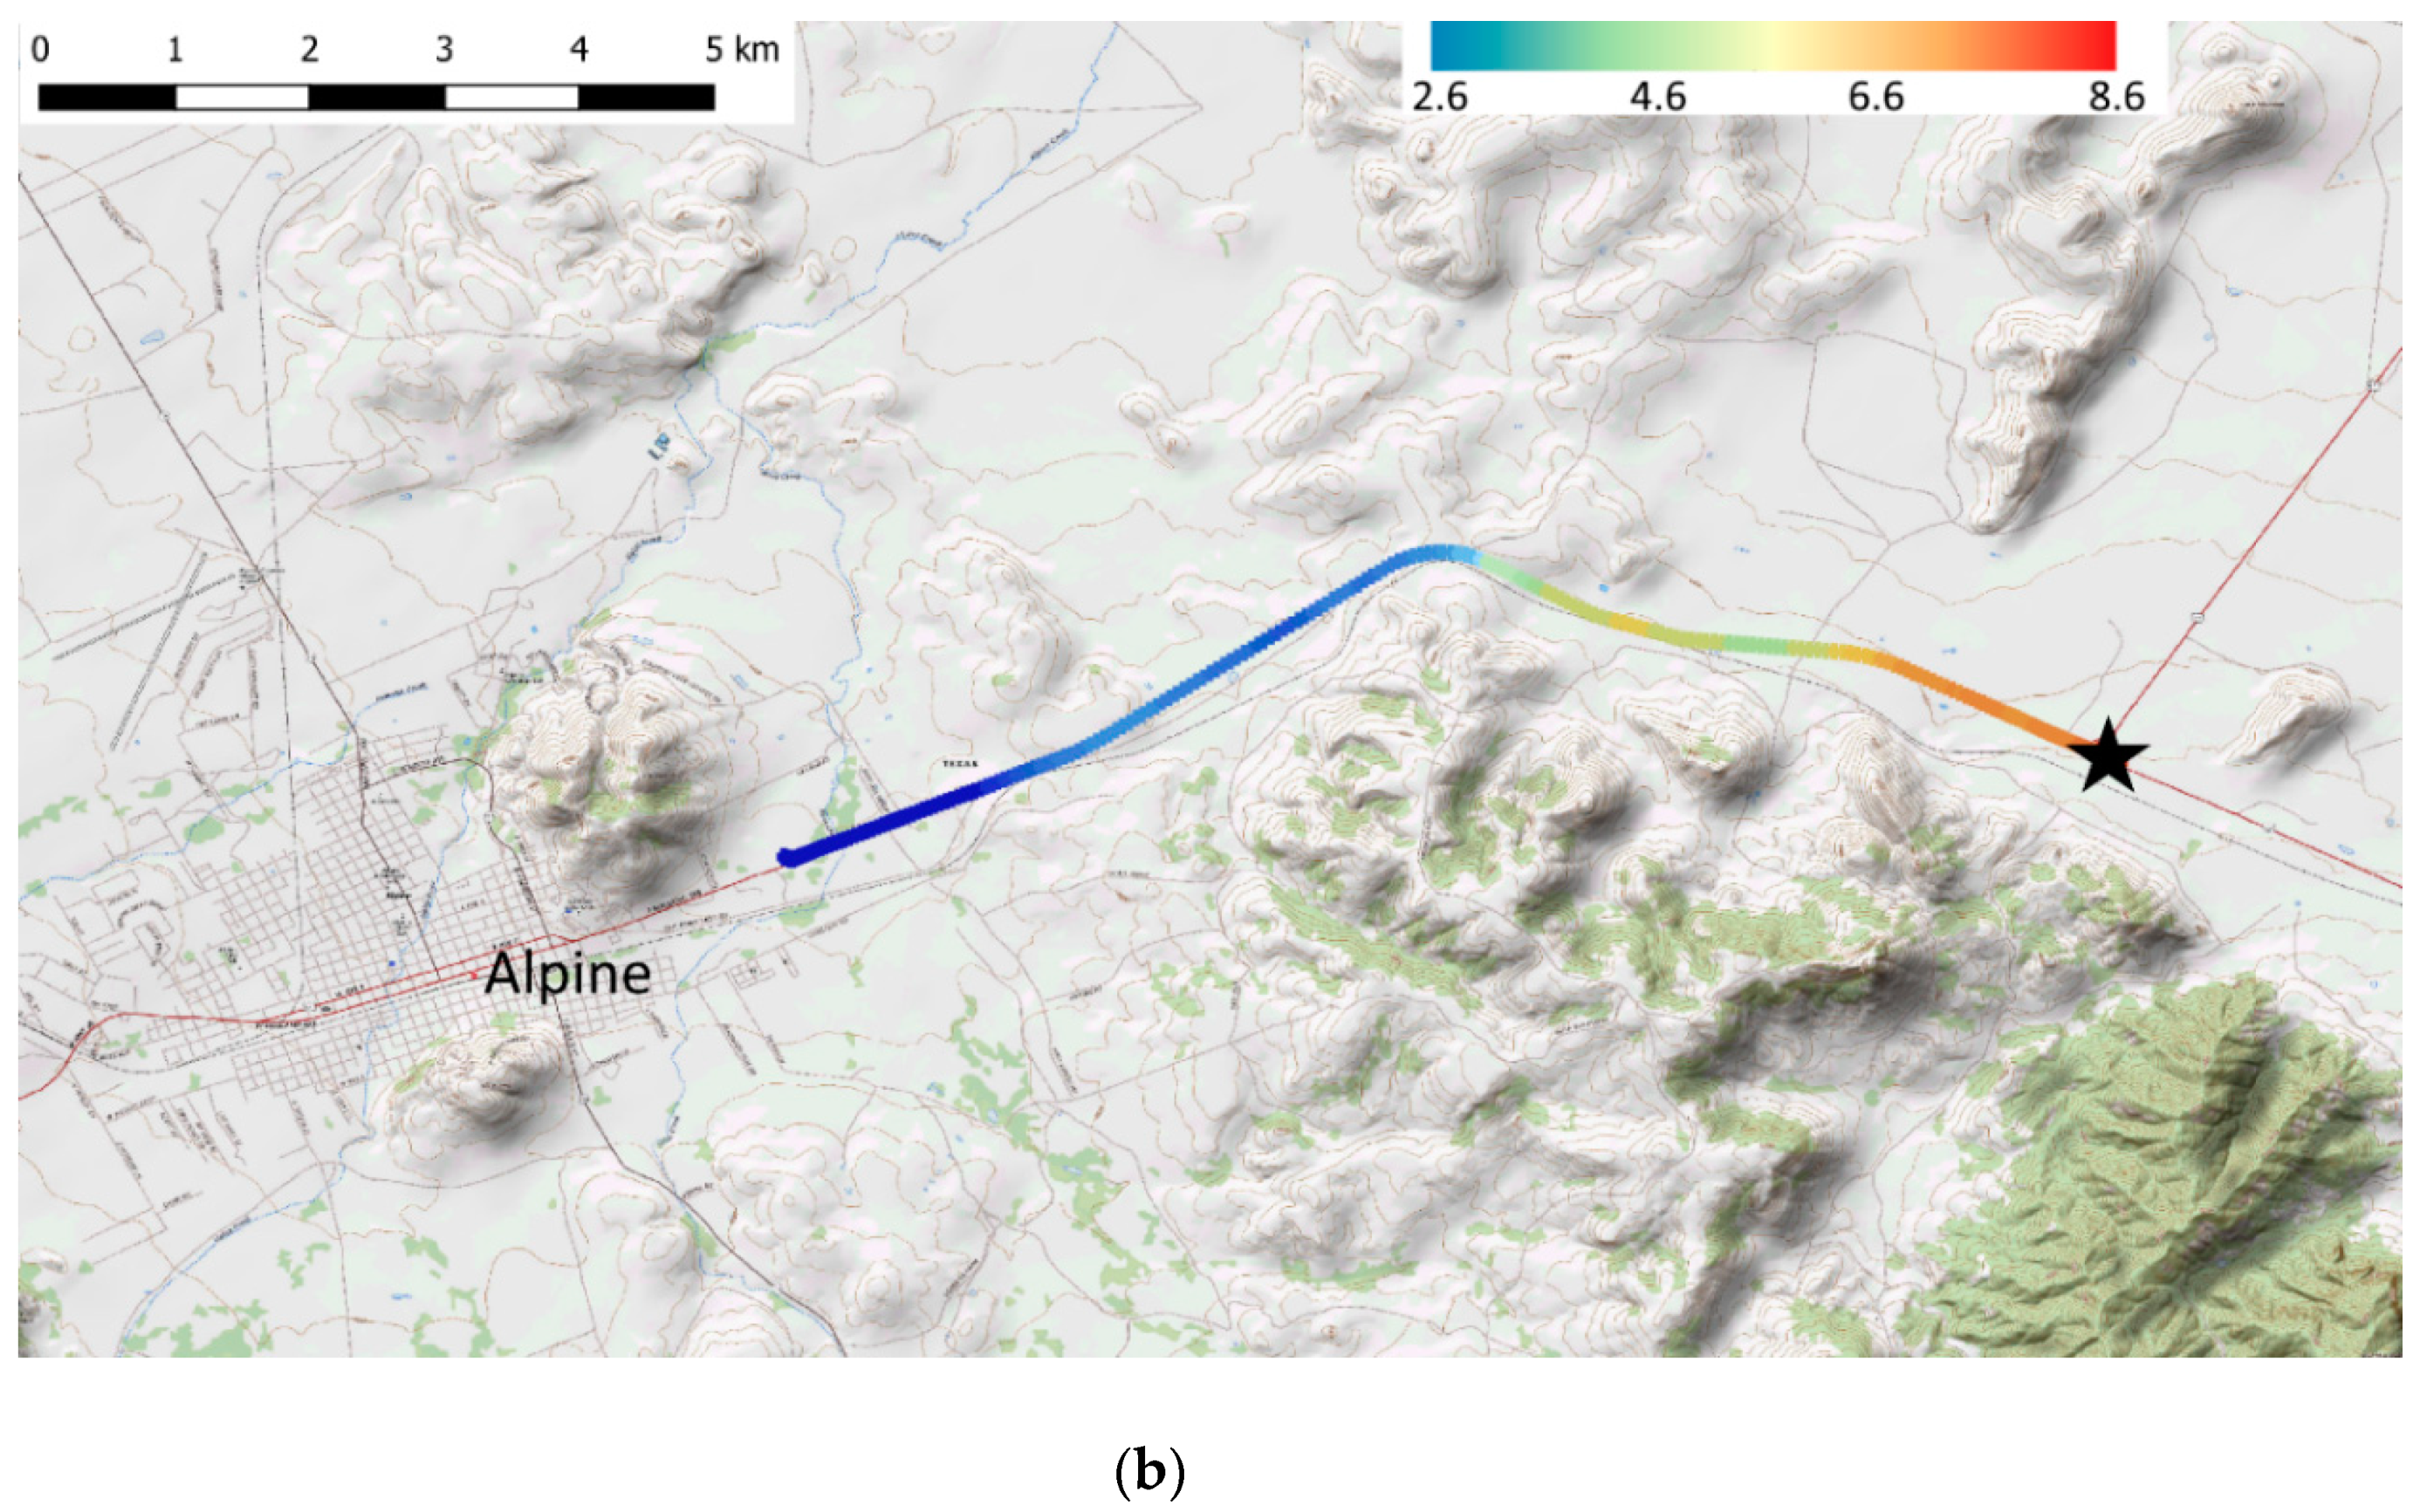
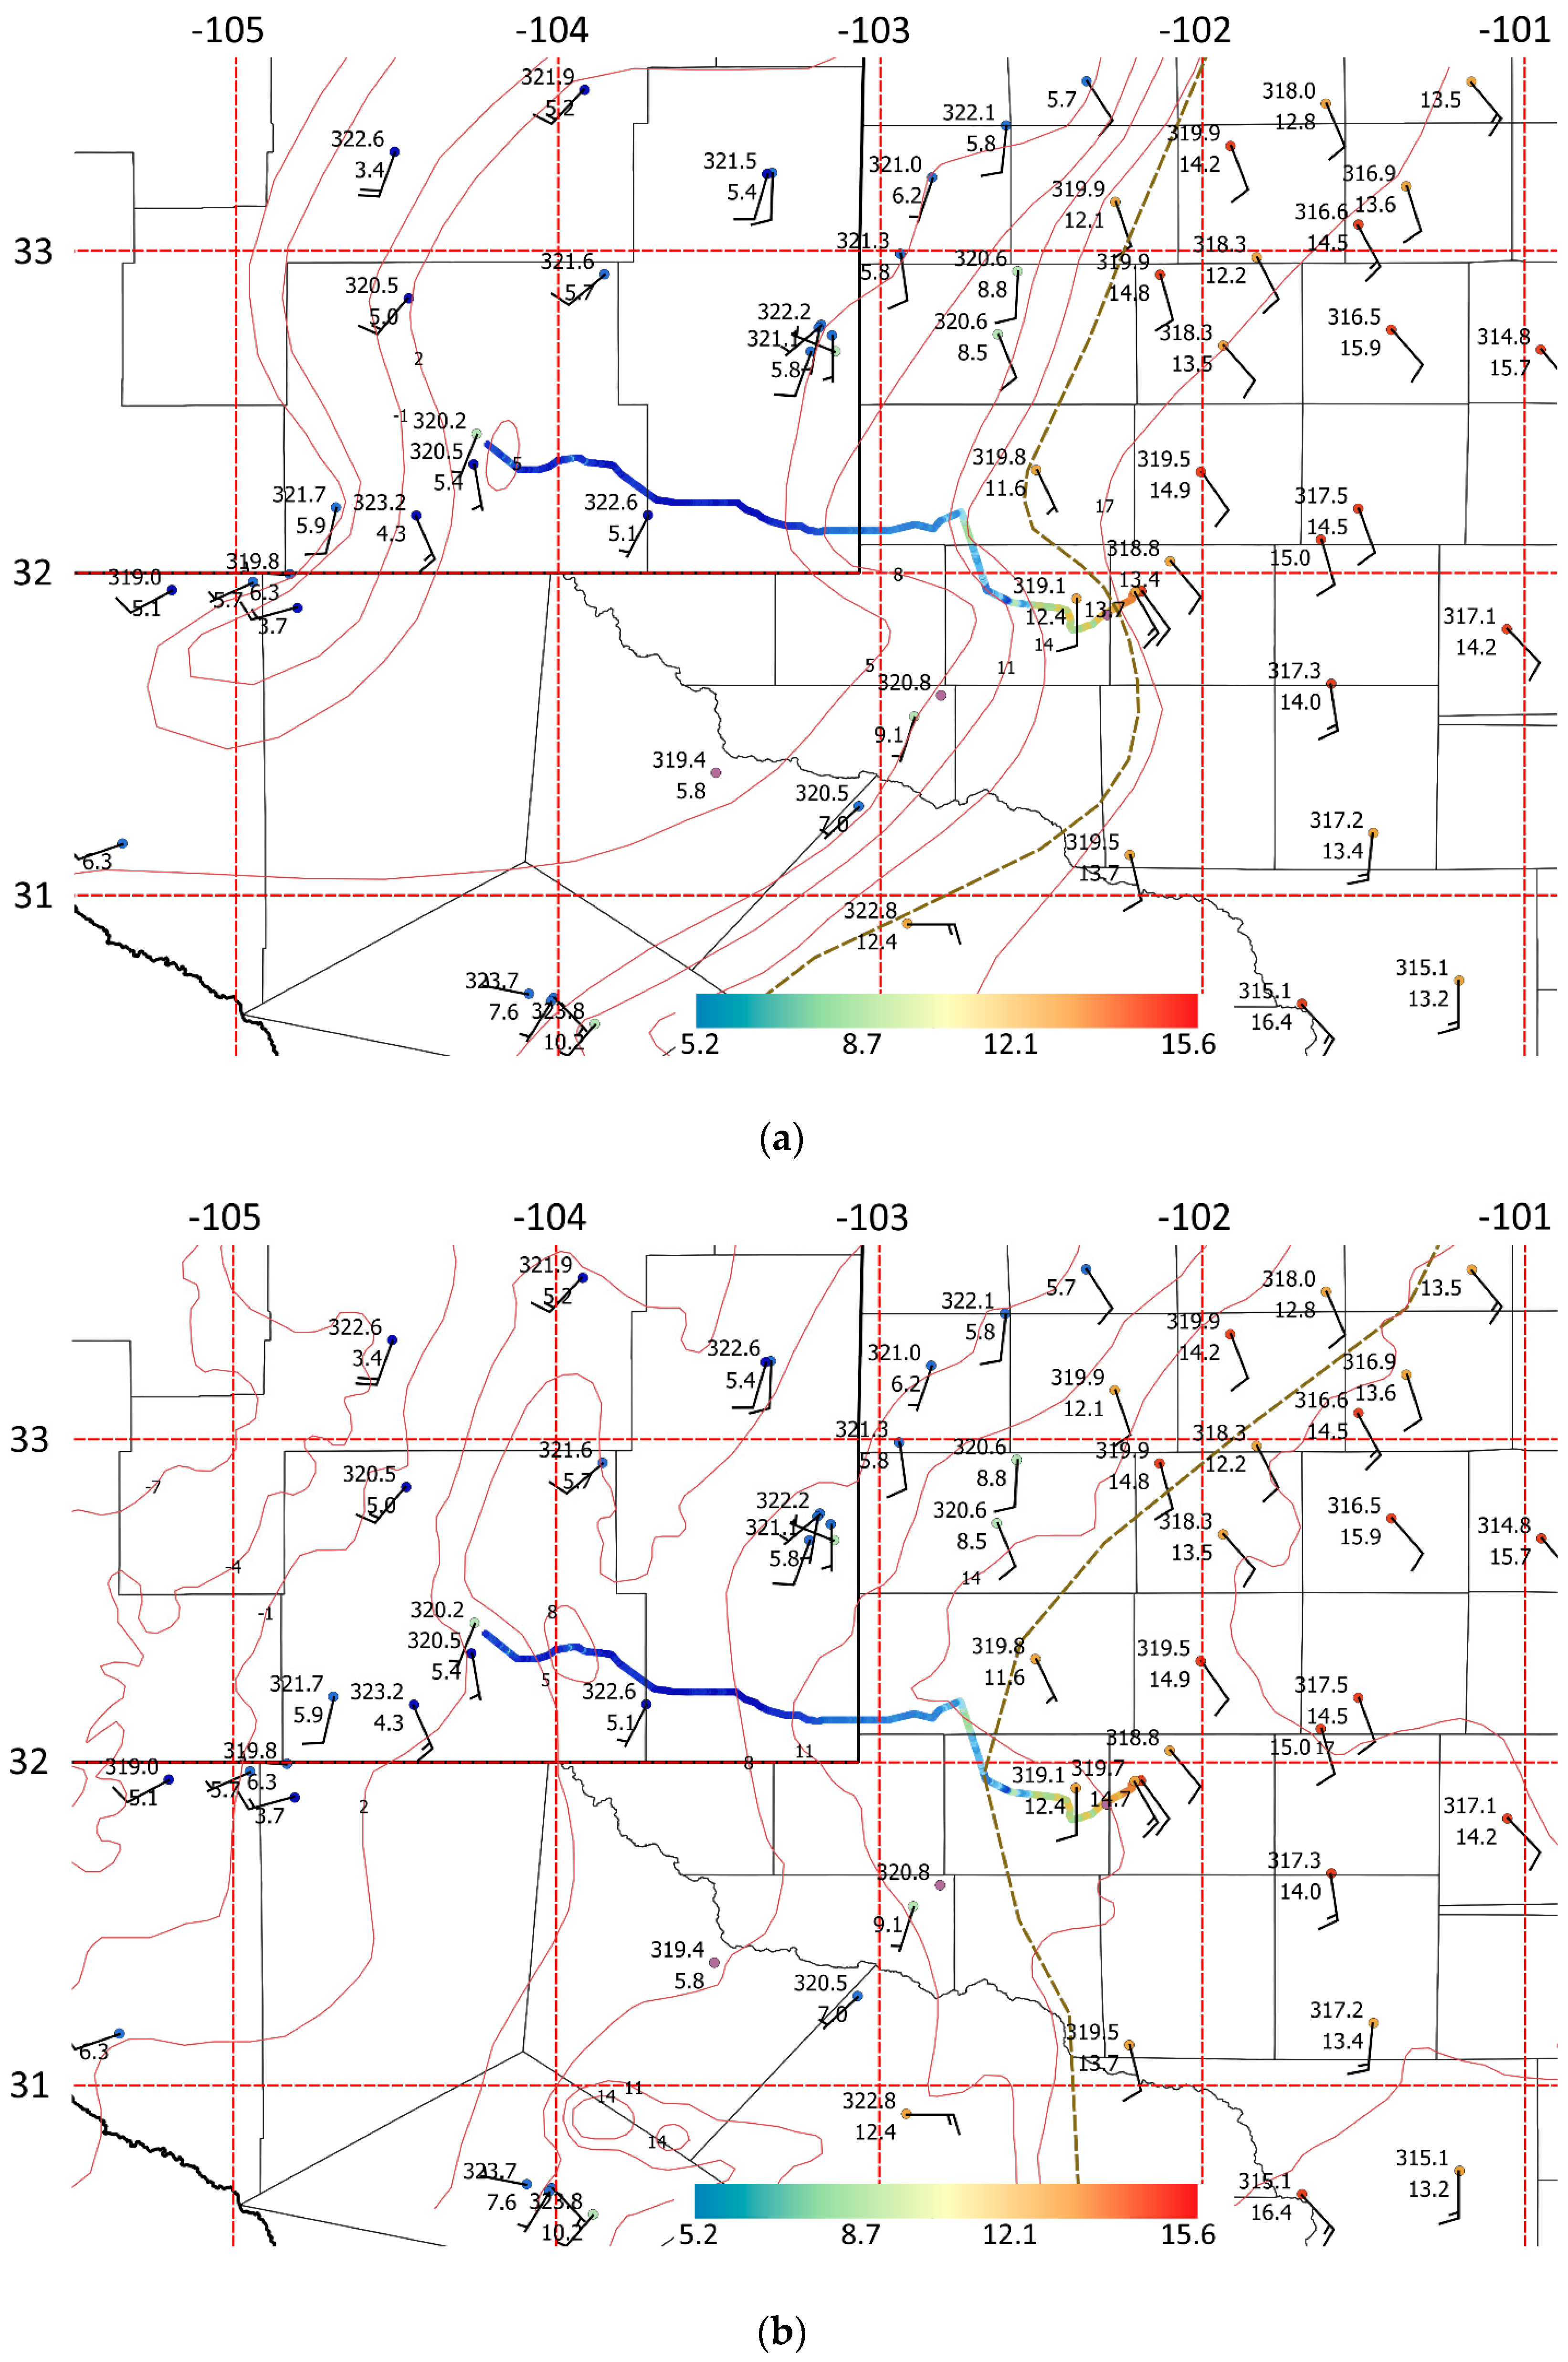
Mobile and station observations at 0300 UTC (Figure 6) document the homogeneity of the air masses on each side of the dryline and surface flow patterns affecting the region. Between 101 and 103.5 W, the mixing ratio from the mobile system decreased from about 11 to 8 g/kg (potentially related to land use and soil moisture gradation; Figure 7a), while increased by more than 7 K. At the dryline, a mixing ratio drop of about 6 g/kg was recorded within a distance of only a couple of km (Figure 7b). Between the 3 and 4 g/kg isopleths, the gradient exceeded 5.5 g/kg per km. The virtual potential temperature in this area oscillated up and down for about 5 km, before dropping about 5 K over the remaining 5 km into Alpine. Returning eastward a half hour later, the moisture change had transformed into three steps with the easternmost boundary about 3 km farther west than before. The proximity of topographic features suggests that the cooling near Alpine may be more strongly forced by nocturnal drainage flow than by direct dryline influence. The rapidly changing fine-scale moisture pattern may also be impacted by interactions between the dryline and detailed (<1 km) topography of the surrounding Del Norte Mountains (Figure 8). The HRRR did an adequate job of simulating mesoscale surface conditions, with good agreement at observing sites, but positioning the dryline about 15 km too far east and spreading the gradient out over several kilometers. The analyzed dryline from observations extended south to the Mexican border near Rio Grande Village and north across the Pecos River to Pyote.
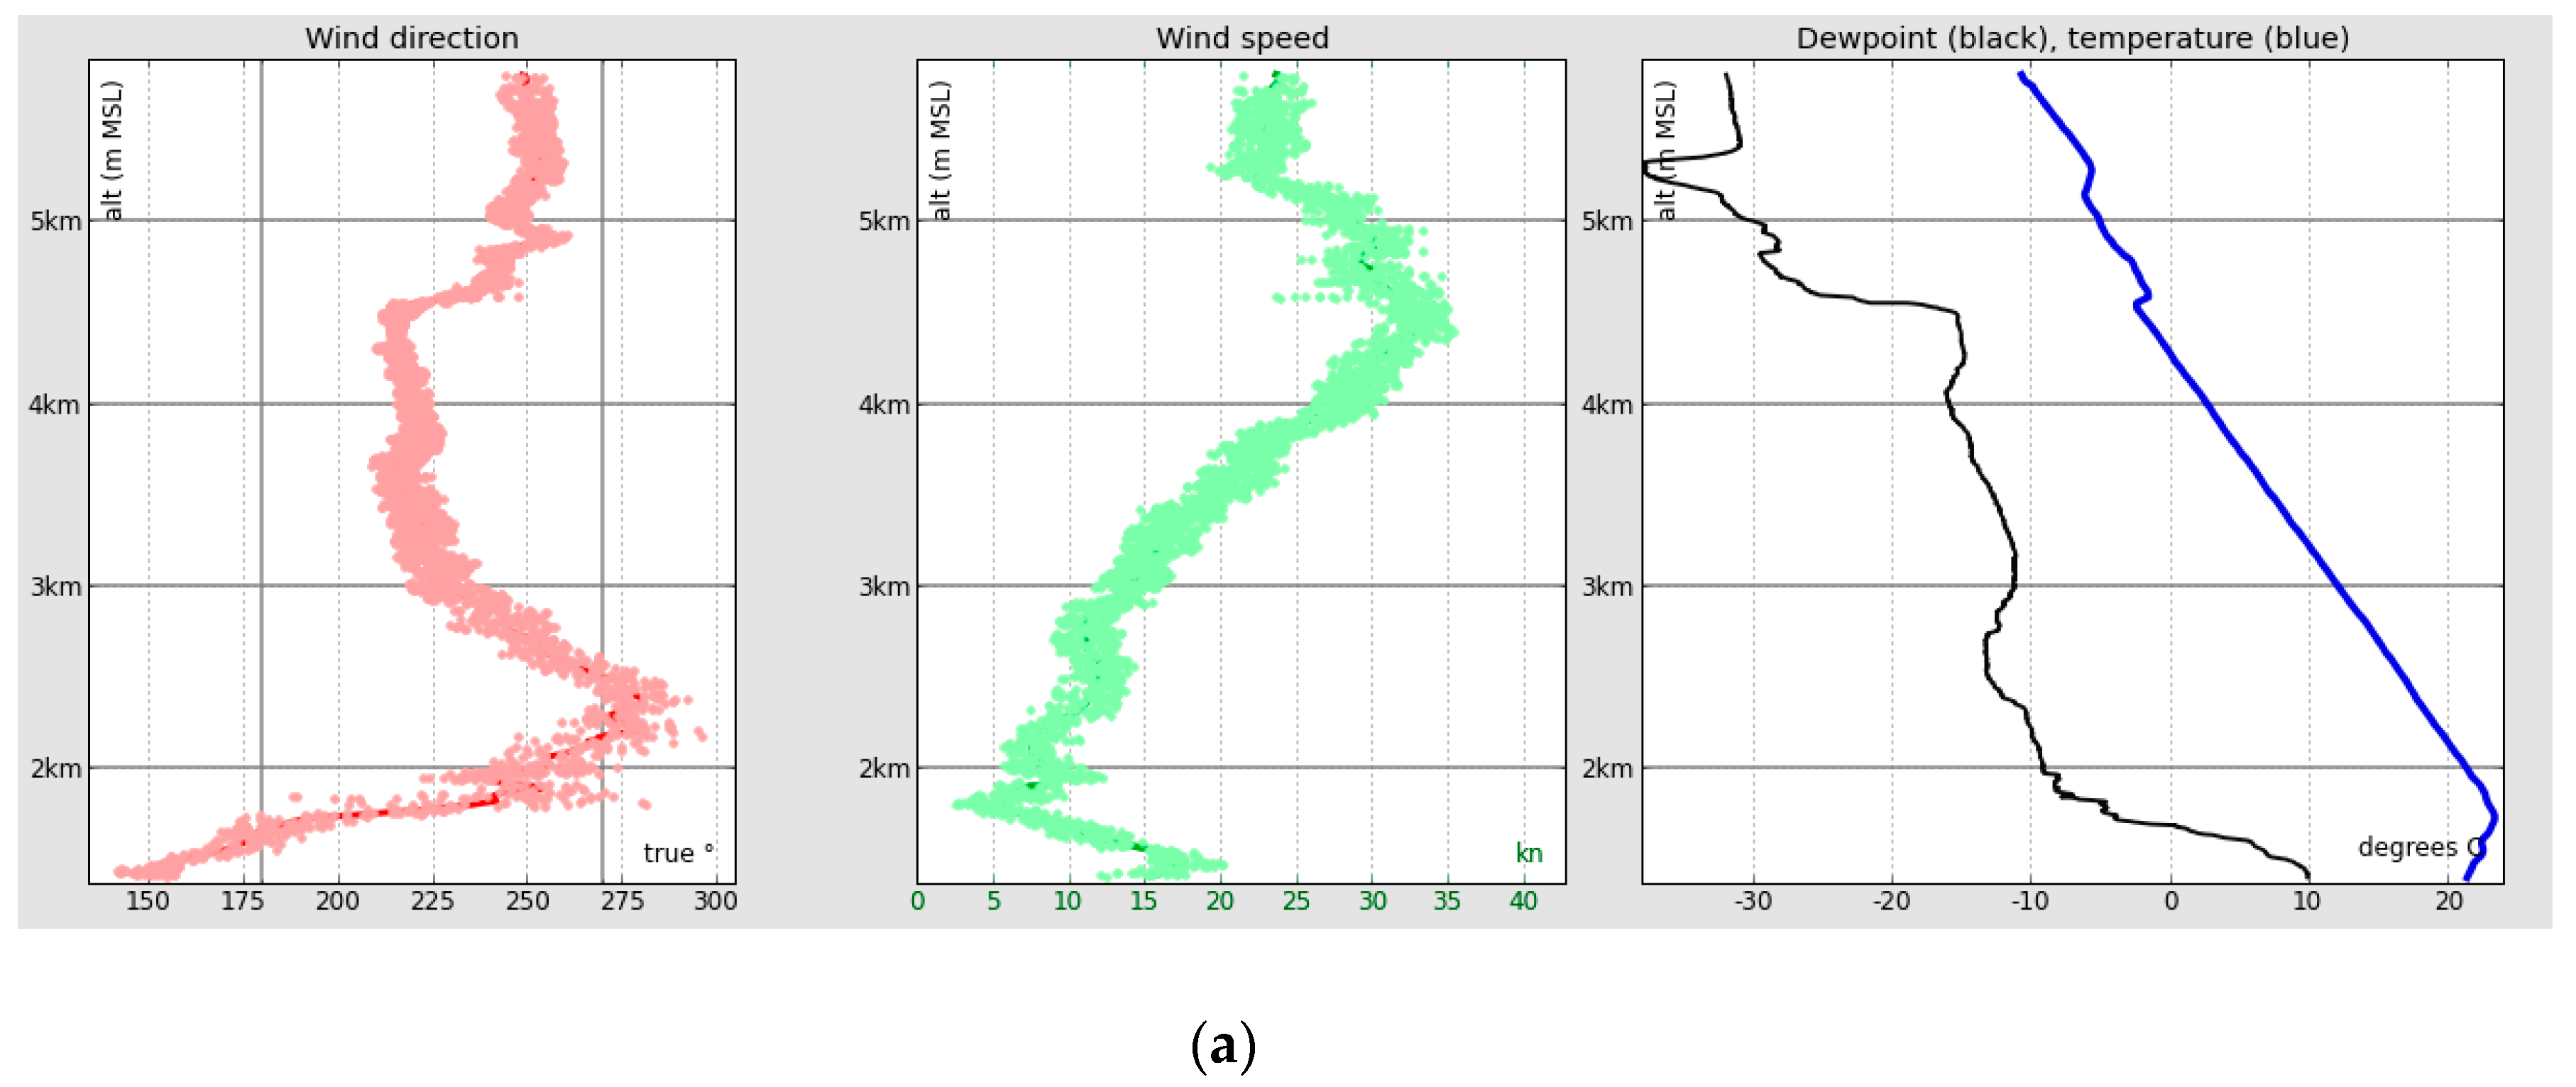
A mobile sounding was launched at 0340 UTC within a couple km of the eastern edge of the dryline where the surface dew point was about 10 °C (9 g/kg mixing ratio). The wind rapidly veered from southeasterly to southwesterly through a surface-based inversion only about 350 m deep (Figure 9), as dew point dropped down to below 0 °C. The inversion and moist layer did not extend as high as the crests of the nearby Del Norte Mountains and other ranges. Above the inversion the temperature dropped at a steady lapse rate of around 10 °C/km up to a minor inversion at 587 hPa. A relatively moist layer was embedded within the dry air mass from 750 hPa up to the minor inversion. In spite of SSE surface winds and some qualitative agreement, the 0300 UTC HRRR profile at the Windsond site (but west of the HRRR dryline) only shows a radiation inversion and has significant differences in dew point. While the HRRR near-surface moisture differences are consistent with dryline displacement and a shallow radiation inversion, the discrepancies between 700 hPa and 500 hPa seem more likely due to very limited upper air data upwind in Northern Mexico rather than related to model depiction of the dryline.
Using a combination of HRRR, Windsond, and surface observations, vertical cross-sections of at 2200 and 0400 UTC illustrate the relation of the moist air mass to regional terrain (Figure 10). The cross-sections were analyzed using a subjective combination of mobile surface, fixed surface, radiosonde, and HRRR model data. The HRRR data from each model level were plotted at a 0.5 degree of longitude intervals and other strategic locations along the mobile track, and were adjusted to reduce local biases noted by comparison with radiosonde data. It is assumed that observed soundings provide ideal vertical resolution where available, surface mobile data provide ideal horizontal resolution of near-surface features, and the HRRR model data are able to broadly depict upper-air patterns between radiosondes. The 0.5 degree spacing of profiles appeared adequate to capture the scales of relevant coherent structures noted in model level plots, except near the surface, dryline, and areas of organized convection (not crossing the transect). Profiles were chosen closer together in the proximity of the dryline for Figure 10b. Near the soundings and near the surface, much more weight was given to the observed versus model data so that the horizontal dryline gradient and vertical inversion gradient could be represented better than through model data alone. The 15 km spatial displacement of the dryline by the HRRR was accounted for. A similar procedure was utilized by [20]. Between 2200 UTC and 0400 UTC, the cross-sections show the westward upslope retrogression of the dryline. The lowest 500 m or so on the moist side generally have mixing ratios greater than 8 g/kg, while air to the west of the dryline is well under 4 g/kg. The moist layer is trapped below a subsidence inversion, although the HRRR model does indicate some upward transport within about 50–100 km to the east of the dryline boundary.
Although there was only one mobile radiosonde system and one mobile observing system crossing the dryline (twice), the observations were able to conclusively show intense fine-scale dryline contrasts close to the Mexican border (far south of similar published data) in relatively high and complex terrain, as well as linkage of the dryline to the inversion and wind shear at heights comparable to the local terrain. It is believed that the 0340 UTC Windsond profile is both the closest that a sounding has been reported to a nocturnal dryline and the shallowest stable moist layer documented in association with a dryline. The most similar case study was that of [45], which considered nocturnal evolution of a dryline in the vicinity of Midland. Their case differed mainly in being over much smoother terrain and by the approach of a squall line and cold front.
3.2. Case 2: 9 April 2017 Snyder, Texas
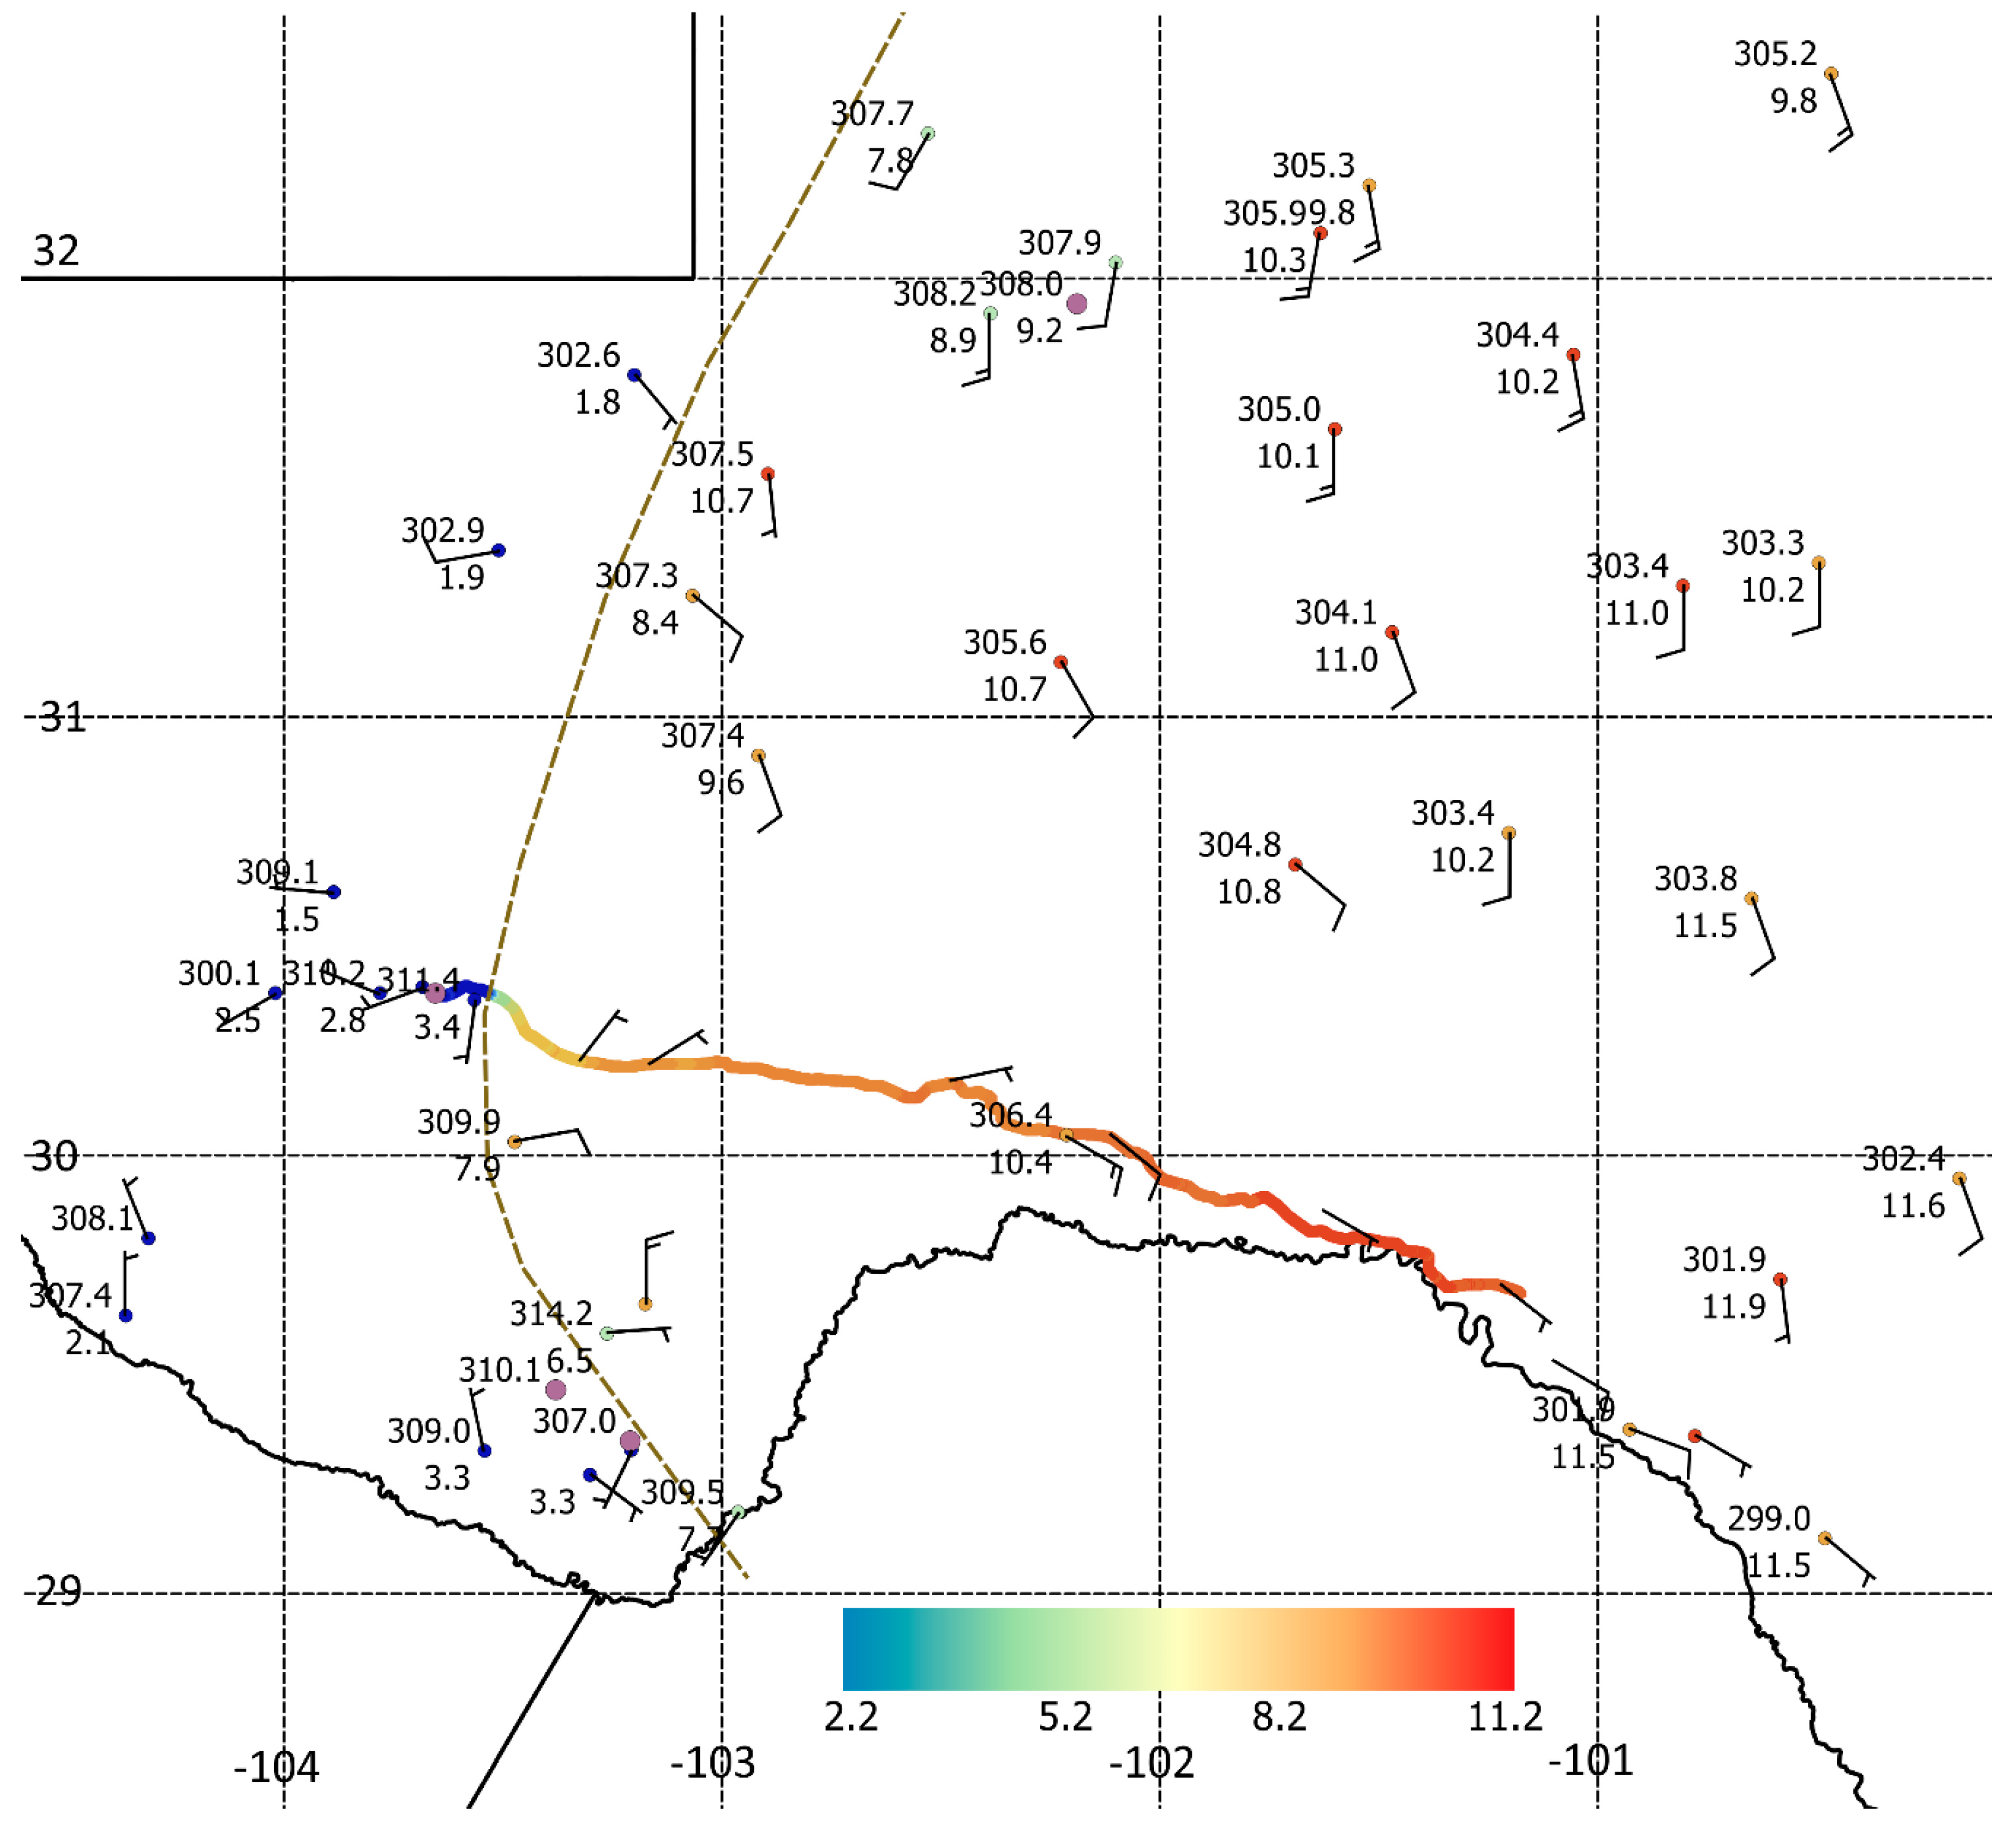
The dryline was intercepted under very different circumstances on the afternoon of 9 April 2017 east of the Caprock Escarpment near Snyder, Texas. No radiosonde or clear-air radar data were collected in the area, and some surface data from the MMU were lost due to equipment malfunctions. However data from the HygroClip within the U-Tube shield were available along the most relevant segments. The first indication of a dryline was at 100.6 W about 120 km east of (below) the Caprock at 2135 UTC, along an eastward transect roughly 300 km farther north than the previous day’s transect (Figure 11). Evidence of a secondary weaker dryline was found farther east at about 2300 UTC, although the mobile track was less favorably oriented relative to it. Similar double dryline structures have been previously reported from various studies [5]. The main synoptic difference from the previous day was the approach of an upper tropospheric trough into the Southwestern United States. Although some convective clouds and precipitation developed, they were not obviously connected to forcing attributable to the dryline itself or the approaching trough. As indicated in the moderate resolution imaging spectroradiometer (MODIS) imagery, the character and scale of convection was generally different west of and east of the western dryline boundary. Scattered rain showers were observed in the area, but none were intercepted by the MMU. Although the character of the convection was not indicative of direct forcing by the dryline boundaries, the moister air masses east of them were more favorable for moist convection. The observed cloud cover across North-Central Texas during the afternoon was probably an intersection of marginal forcing from an undetected weak short wave with diurnal heating of the moist air mass. It may be more appropriate to attribute the relative lack of productive convection to the west of the dryline position/passage than it is to attribute the precipitating convection to dryline forcing or initiation. In the absence of observed vertical moisture profiles or high-resolution numerical simulations, determination of convective instability mechanisms remains inconclusive. This sense of a dryline sometimes having an indirect role as a boundary between convective environments without contributing directly to trigger forced convection may be described as a “peripheral” boundary role, as opposed to a direct forcing role.
The MMU track extended northeastward from Odessa, Texas (102.4 W) at 1806 UTC on 9 April to Sulphur, Oklahoma (97.0 W) at 0323 UTC on 10 April. At the western dryline, the mixing ratio increased from roughly 4 to 8 g/kg (Figure 12), most of which occurred over about a 2 km distance. As might be expected during peak diurnal heating, there was no clear relationship between dryline position and . The eastern dryline had a similar increment from 8 to 12 g/kg, but it appeared to be a broader gradient over about a 50 km distance. The HRRR indicated CAPE above 3000 J/kg at 2200 UTC, a broad moisture gradient in the vicinity, and generally confluent surface winds (Figure 13). It failed to clearly distinguish the sudden transitions at the two dryline features, but it was consistent with the existence of two zones of enhanced moisture gradient. The combined observational evidence seems to point to a split from a single dryline into two drylines somewhere about 50 km south of the western dryline intercept. Other double dryline structures in published studies have not usually reported such similar sized mixing ratio changes across the two structures [5,7,47,48]. It is noted that published accounts of double dryline structures are all from mid to late afternoon, suggesting that they may be related to diurnal cycle transitions. This could be partly related to variable land surface forcing as the dryline tends to be quickly advancing eastward into different vegetation and soil moisture regimes at this time of day.
The pattern of dew point between 31 and 35 N in the HRRR (not shown) evolved from a distinct boundary near 103 W in the early morning (1200 UTC) to a quite broad gradient at 1800 UTC, with a more distinct dryline to the north and south. Around 0000 UTC it appears to collapse back into a well-defined single dryline near 100 W, which retrogresses westward by 0300 UTC (within Texas). Sunset along the mobile track was at 0100 UTC. Observations are consistent with the general pattern evolution from the HRRR. Widespread middle and upper level clouds moved rapidly into the domain from the west around sunset, in association with a wave in the subtropical jet stream. At least for this particular transect, it seems that the double dryline pattern occurred as a transitional stage before the coalescence of the moisture gradient back into a single well-defined dryline before sunset.
3.3. Case 3: 12 June 2017 Midland, Texas
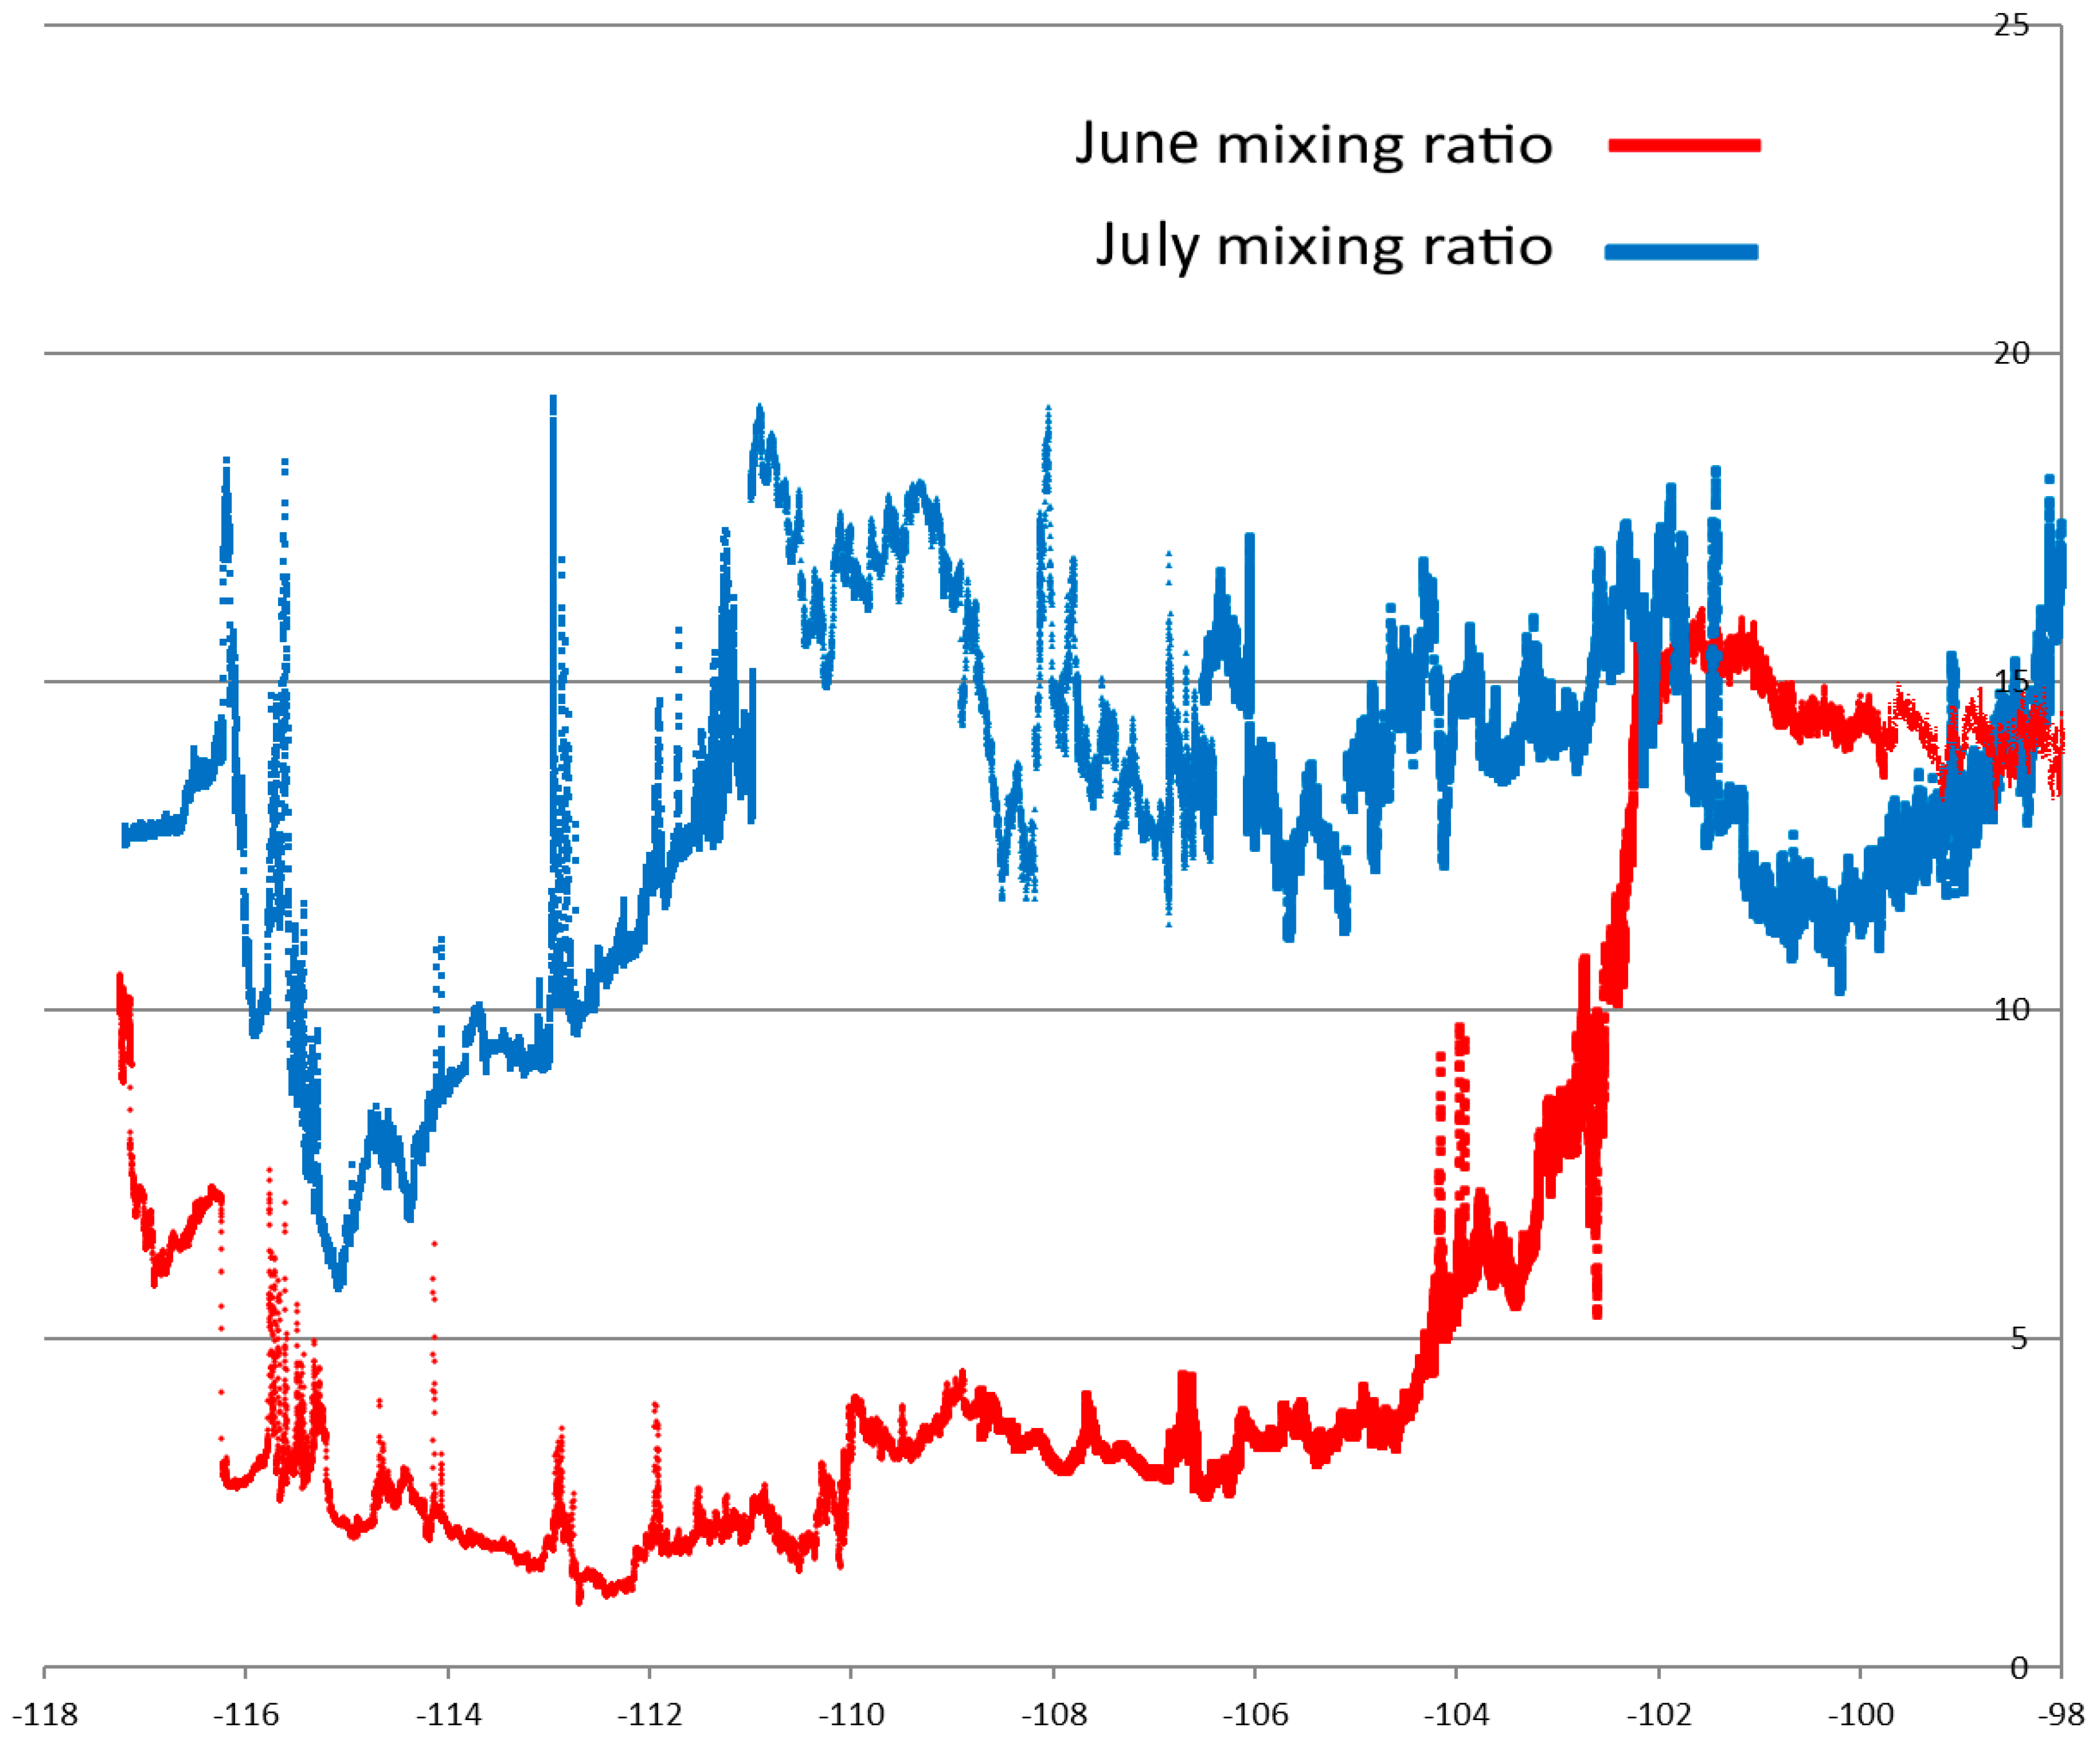
Except at higher latitudes (e.g., Wyoming), the frequency of drylines tends to dramatically decrease from the beginning to end of June. On the larger scale, this seems related to seasonal changes that are also associated with onset of the North American monsoon system around the beginning of July [8]. This regional moisture pattern change is anecdotally demonstrated by longitudinal variation of mixing ratio from multi-day mobile transects that were collected during mid-June and late June between central Texas and Southern California (Figure 14). While such multi-day continental scale mobile transects are quite non-standard in synoptic meteorology, they provide spatial structure to climatological patterns and have been utilized previously for air quality measurements [49,50]. The mobile transect of 12 June 2017 was conducted from Odessa, Texas (1840 UTC) to Carlsbad, New Mexico (2134 UTC), with the expectation of intercepting a weak dryline near 103 W at around 2000 UTC.
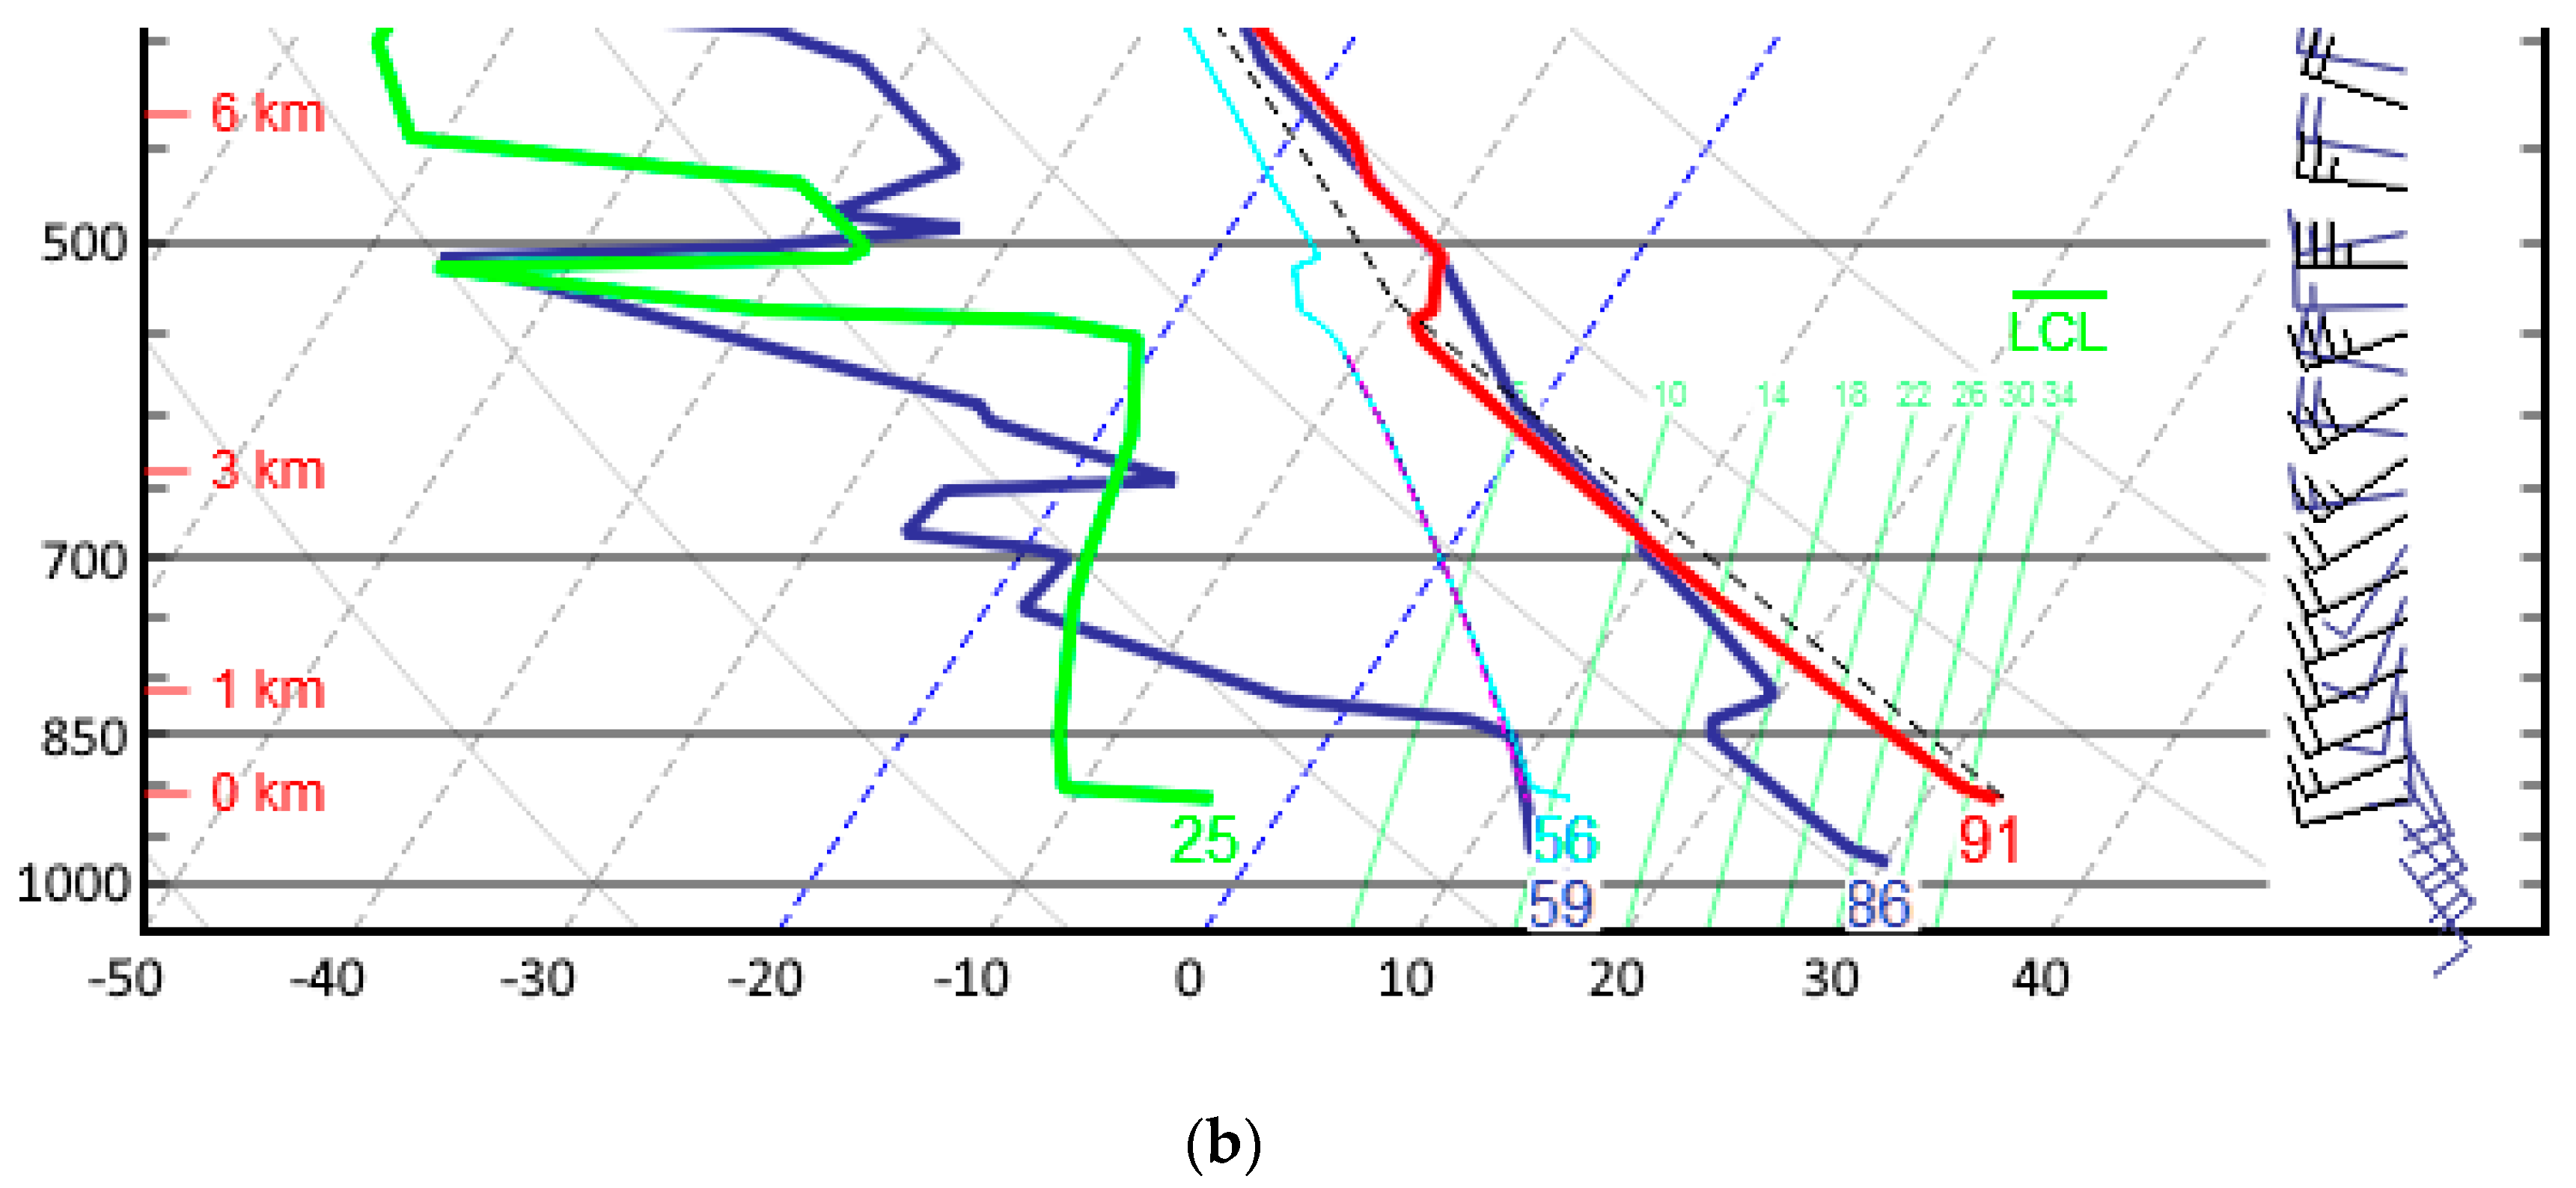
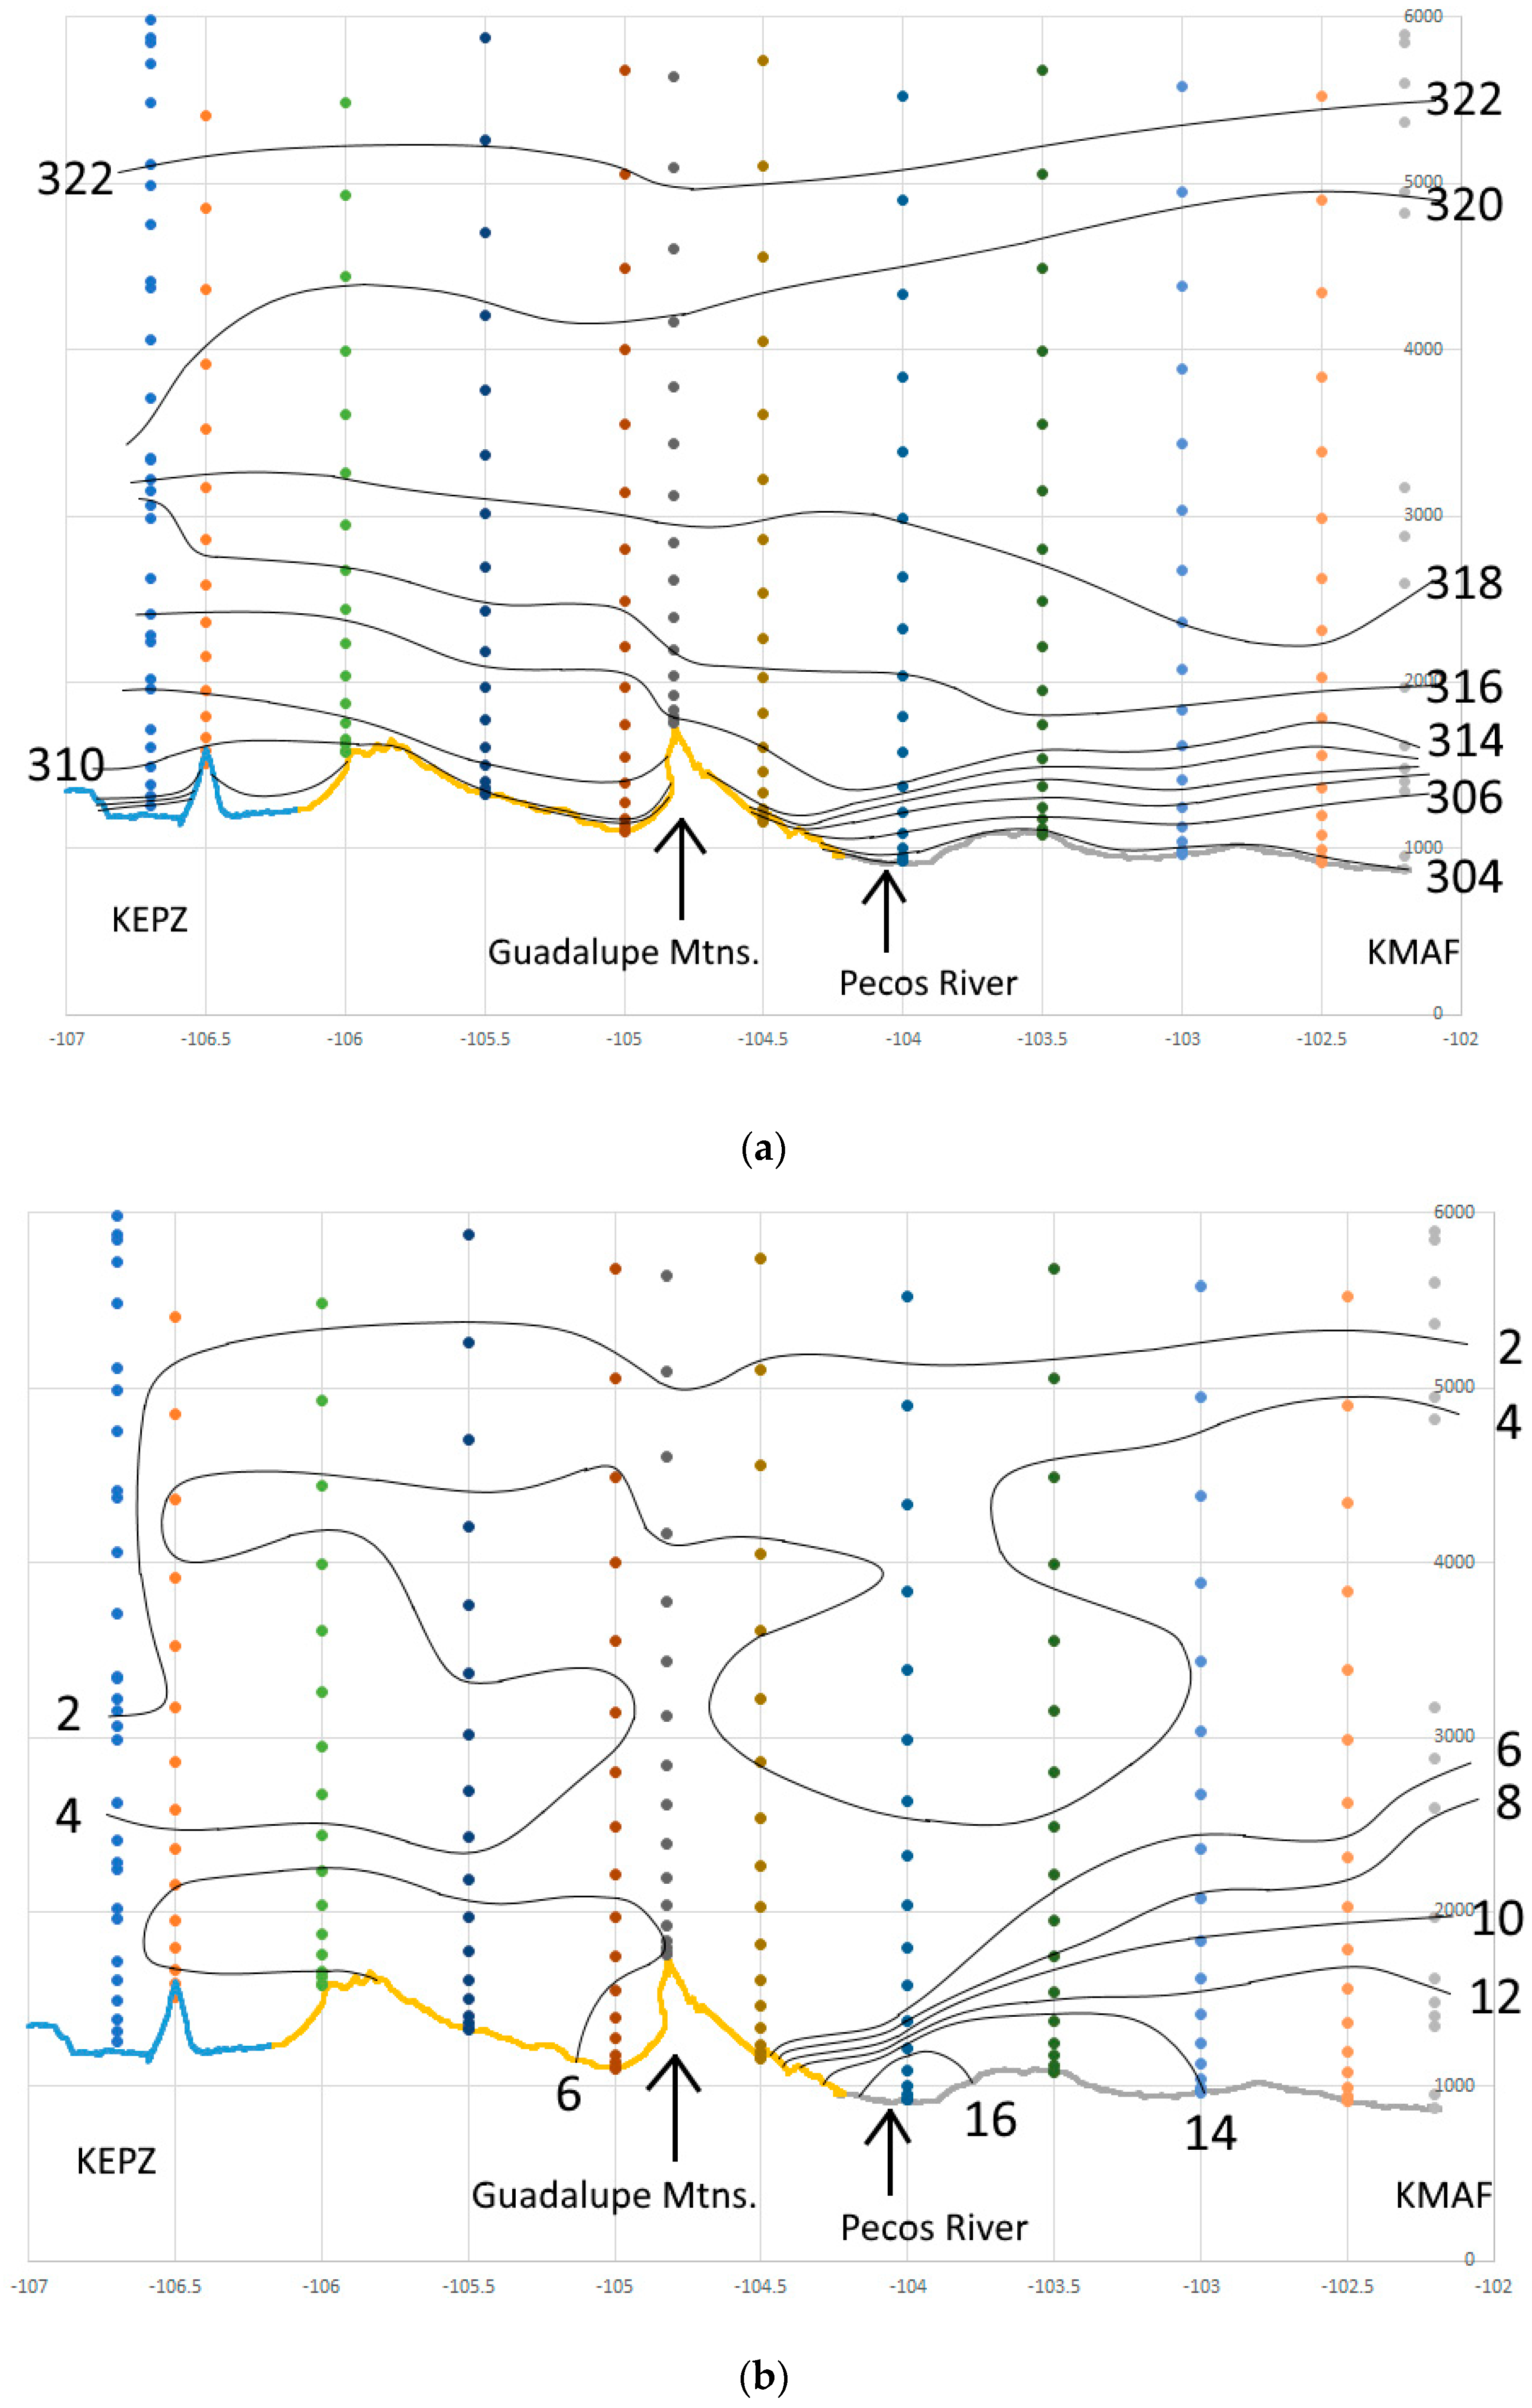
At sunrise an intense dryline was located west of 104 W between the Pecos River and foothills of the Guadalupe Mountains. Cross-sections of potential temperature and mixing ratio were constructed from a combination of radiosondes (KMAF and KEPZ), HRRR, and surface observations at 1100 UTC along the vehicle track (Figure 15). The top of the stable layer capping the moist air mass sloped downward from 1600 m MSL at Midland to intersect the topography at about 1100 m west of Carlsbad [51]. Mixing ratio increased westward from Midland, before suddenly dropping to less than 6 g/kg west of the dryline. Between 1500 and 3000 m, temperatures generally decreased to the west from a thermal maximum that was tilted upward to the east above the subsidence inversion. West of the dryline, very shallow surface inversions were consistent with nocturnal drainage driven by radiative cooling under light winds, while no well-defined surface inversion was present in the moist air at Midland.
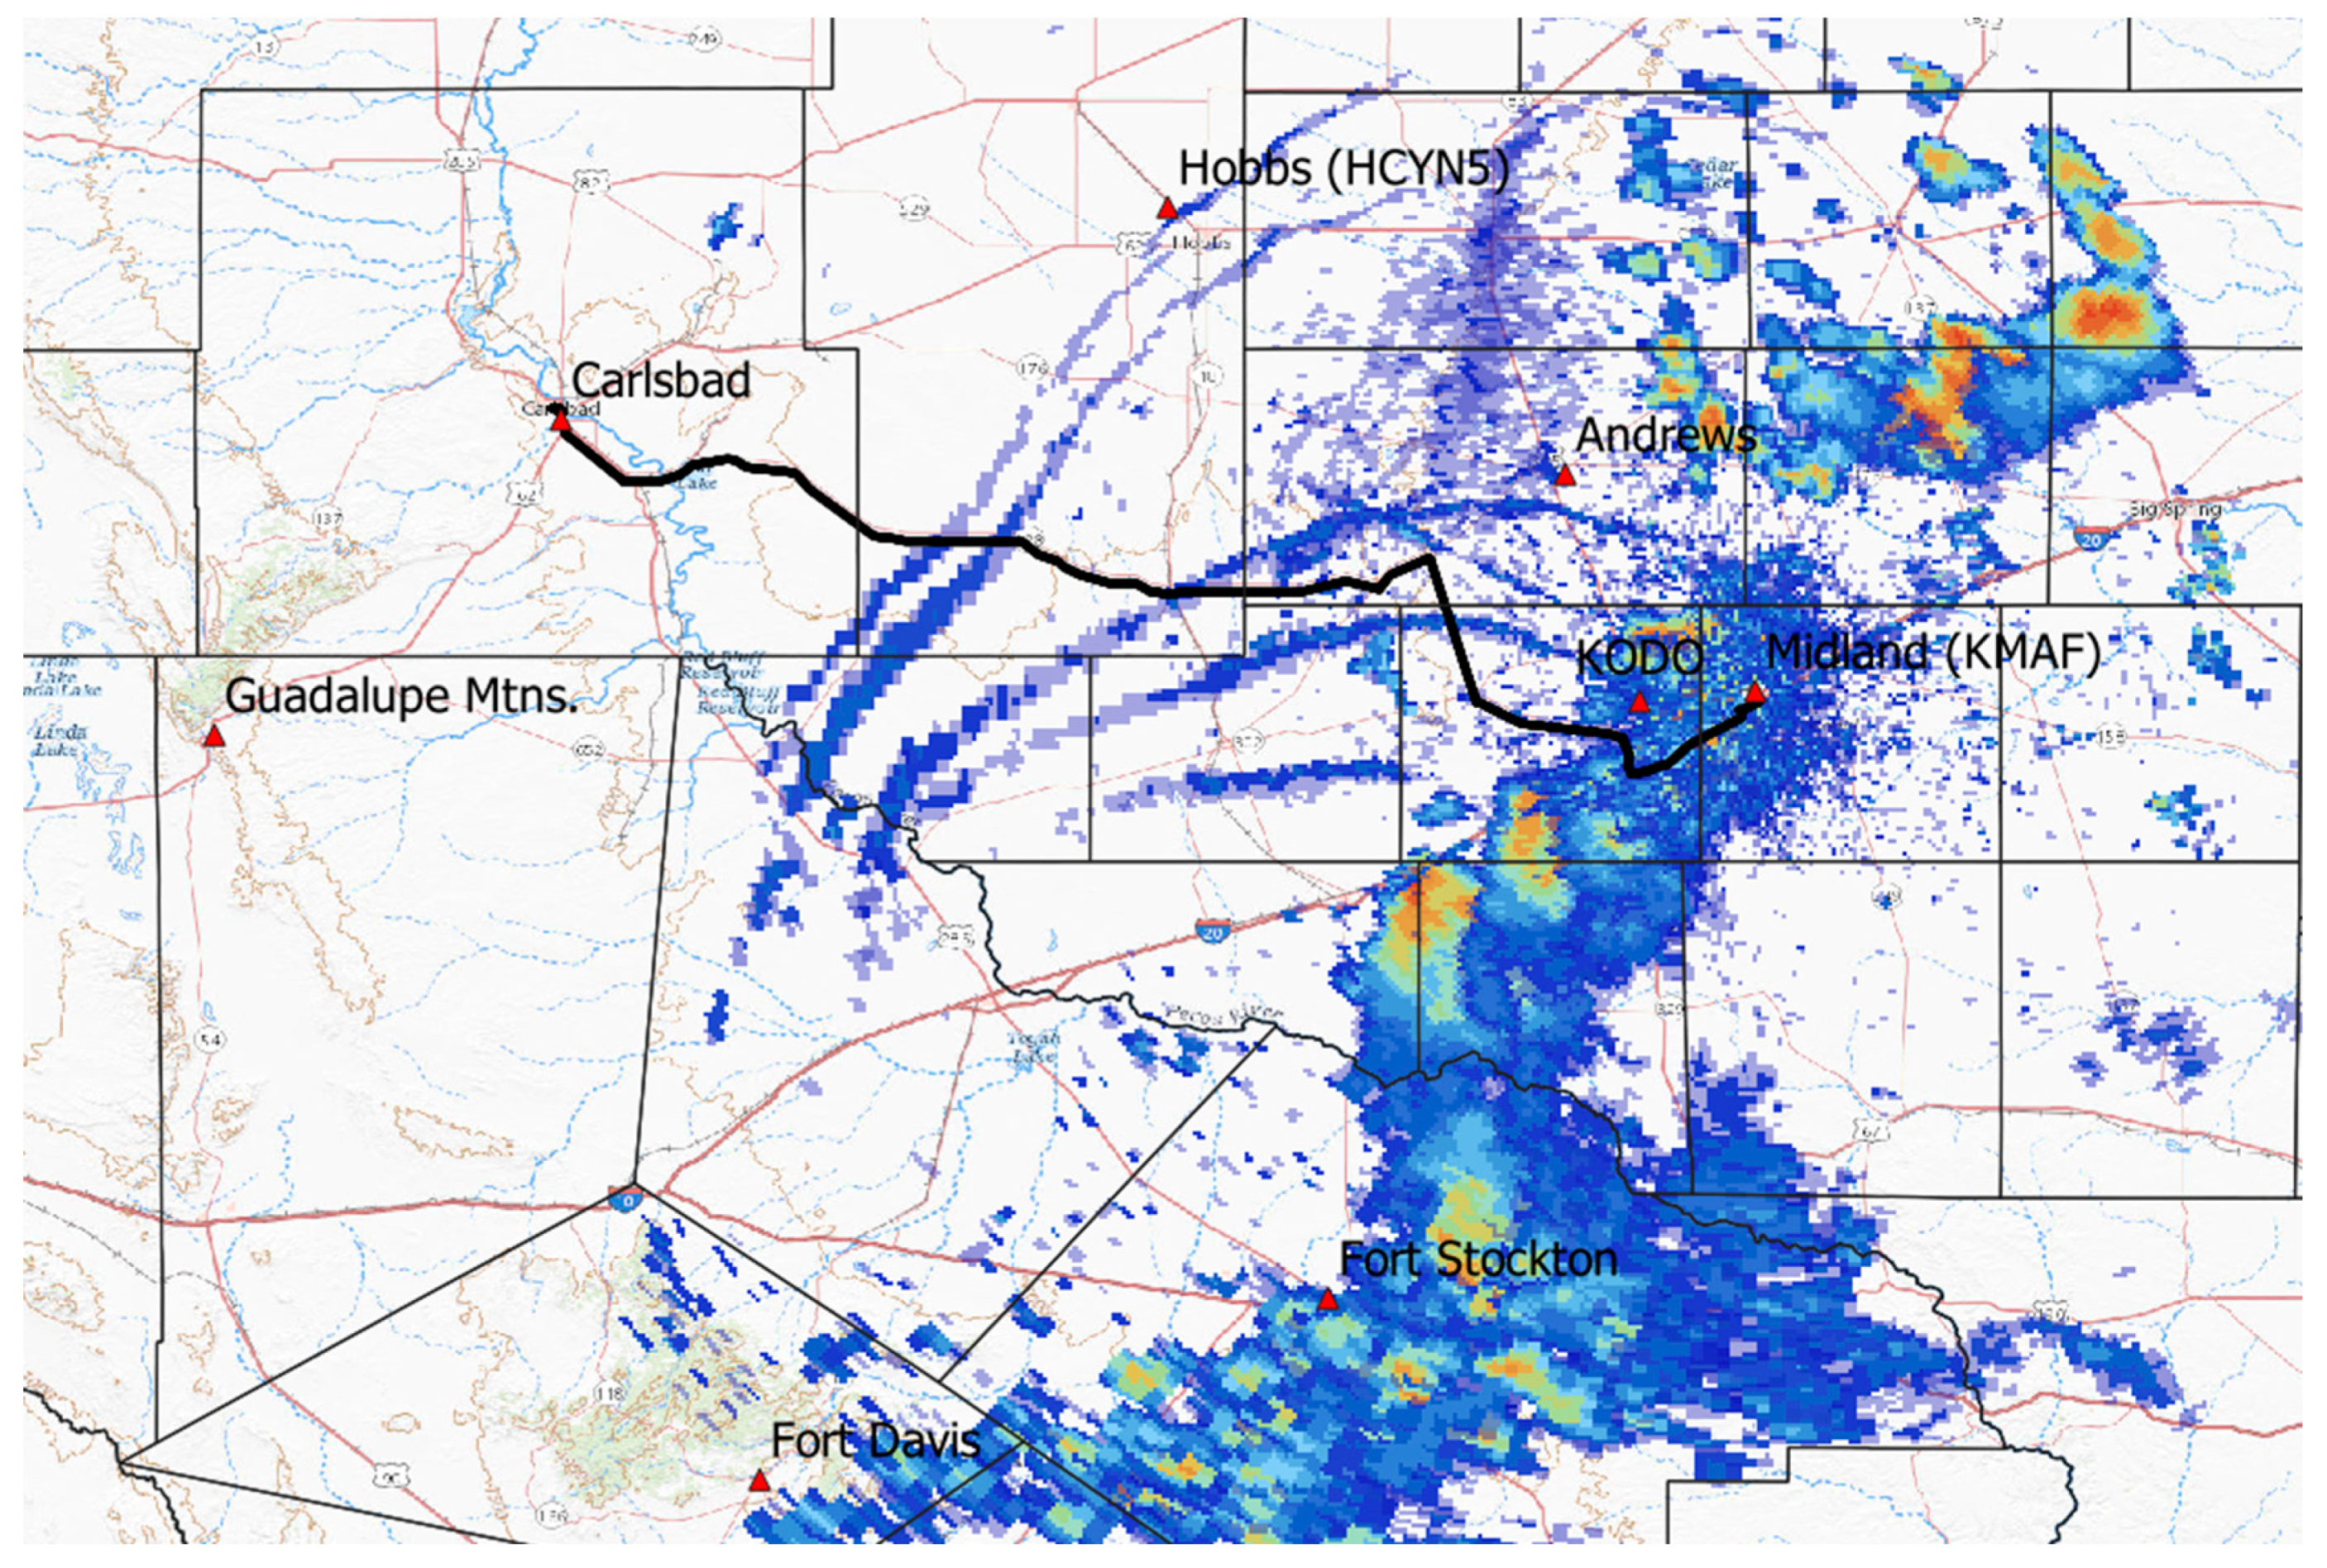
After 1400 UTC, the dryline rapidly advanced eastward from Carlsbad. Subjective analyses of dryline position indicate that the HRRR dryline generally lagged about two hours behind (at 32 N) and up to around 100 km west compared to observations. Both the HRRR and observations showed a broad bulge of dry air between 1600 and 1800 UTC along the Pecos River south of Midland. The progression of HRRR profiles at KMAF between 1700 and 1900 UTC (not shown) suggests that drying was mainly from diabatic heating of the boundary layer until the surface reached the convective temperature so that the capping inversion was removed. A similar progression is noted longitudinally in 1900 UTC HRRR profiles between Midland and Carlsbad. Mid-day convective clouds over high terrain northeast of Fort Davis developed in the vicinity of the dryline and developed a series of thunderstorms toward the northeast that reached the Fort Stockton area by 2100 UTC and KODO at 2303 UTC. The resulting outflow boundary advanced northward into the dry air west of the dryline and was well delineated in KMAF radar products (Figure 16). A peak wind gust of 59 kt was observed at KODO at 2307 UTC, and 58 kt at KMAF at 2333 UTC. Public storm reports in the area indicated hail up to 5 cm and wind gusts up to 72 kt. Although the HRRR showed similar positions of the gust front, it seems to lag about one hour behind observations. The temporal evolution of temperature and dew point over 24 h at Andrews, Texas illustrates the passage of the dryline and outflow boundary (Figure 17). A conceptual framework to consider the interaction of the thunderstorm outflow boundary with the dryline is to recognize the outflow boundary as primarily propagating by near-surface advection and the dryline(s) as primarily propagating by vertical mixing processes. Although dew point quickly rose following the outflow boundary, it remained fairly constant for a while before rising to values similar to those east of the dryline. A reasonable speculation could be that the shallow convective outflow cut underneath and mixed vertically with the deeper dry air behind the dryline. In this way an elevated residual dryline could persist south of the outflow boundary and then gradually mix into a more diffuse moisture gradient [52].
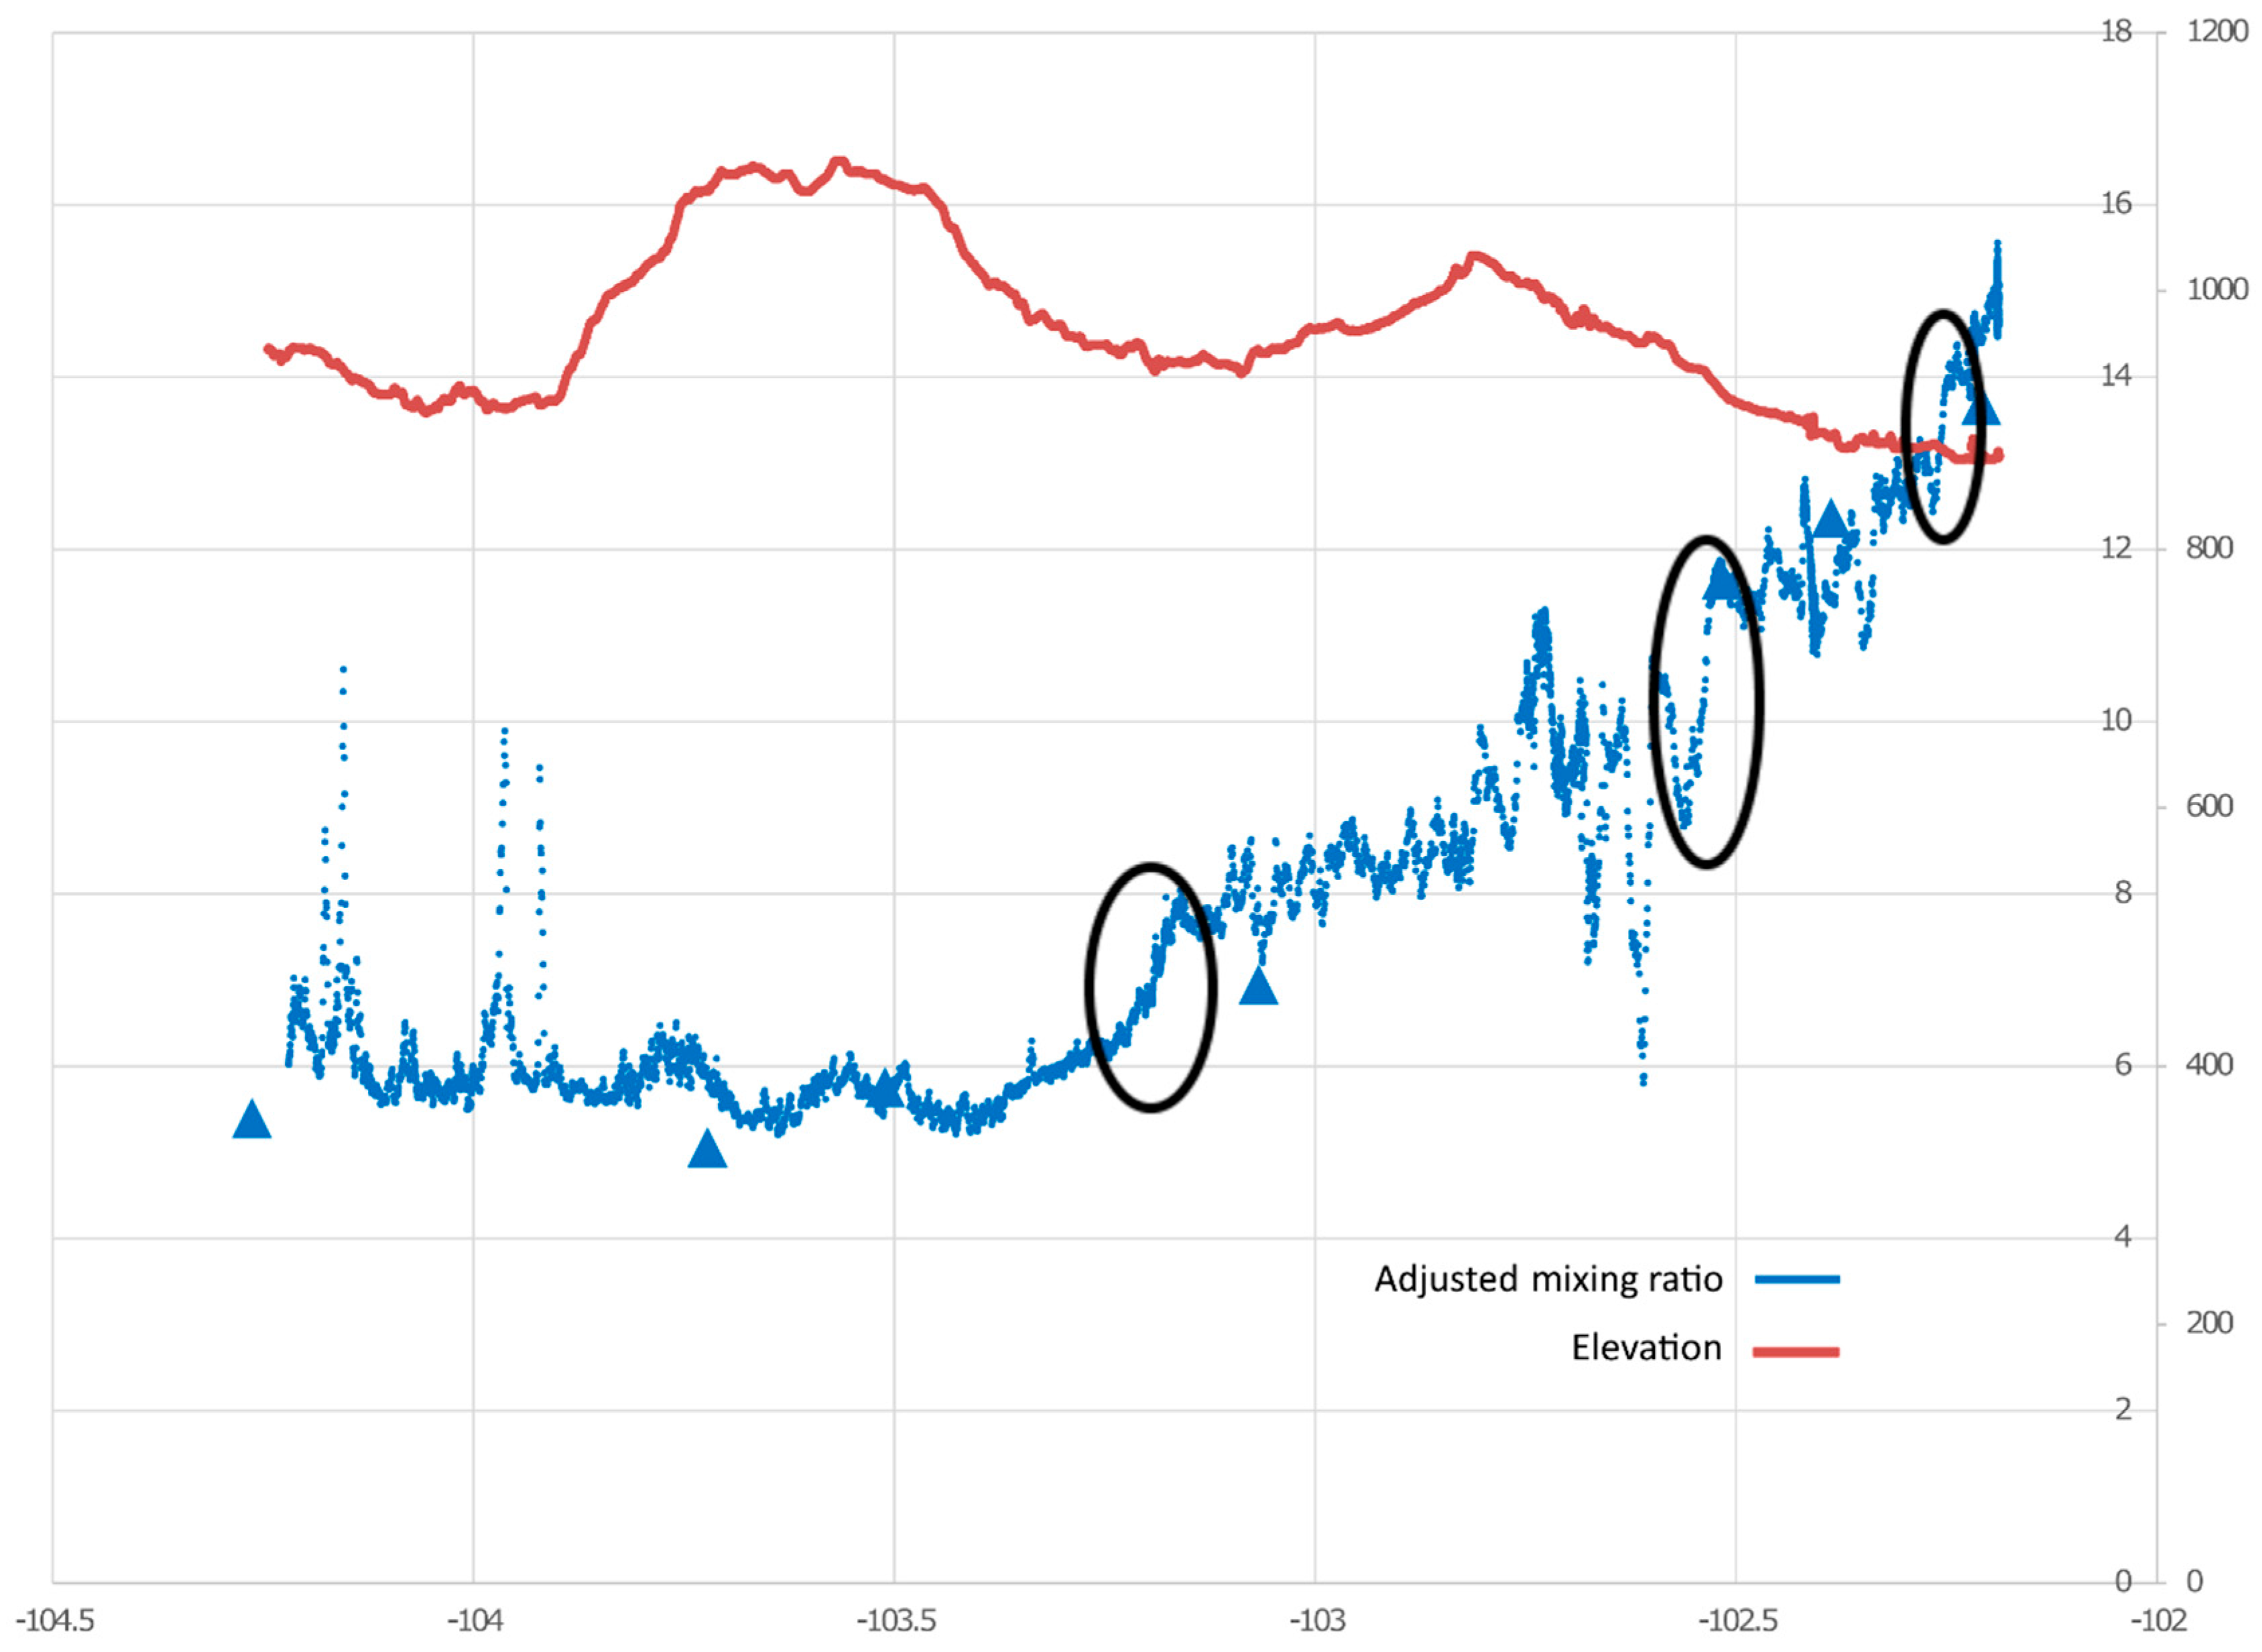
The mobile transect sampled a broad but complex gradient of humidity between about 102.2 and 103.3 W, with temporally adjusted mixing ratio (to 1900 UTC) ranging from 15 down to 5 g/kg (dew point from 19 °C to 2 °C). Spatial analysis determined that some of the complexity is probably due to track orientation with respect to the northern edge of the dry bulge (Figure 18). In any case, a simplification of the transect data suggests that at least three major boundaries were embedded within the mixing ratio gradient (Figure 19), with some microscale oscillations as large as 5 g/kg. A similar three-step structure was noted temporally in the meteograms of Andrews and other stations. Although limited station distribution prevented spatial examination of the multiple steps, the similarity gives credence that they were real features that probably existed for at least a couple of hours. It seems that such broad gradients that are often described as “diffuse drylines” may be better understood to often contain multiple distinct moisture boundaries, with complex and turbulent mixing zones between them [53,54,55]. The variations noted in this case seem to bear characteristics of both the type 2 and type 3 dryline structures of [5]. It may also be noted however that no distinct wind shift was noted across the dryline at this time, again indicative that vertical mixing processes were more important to dryline maintenance and motion than horizontal advection and convergence [56,57]. The dew point gradient within the HRRR was similarly oriented, but much broader than the observations and with no indication of embedded boundaries. It was determined that inconsistencies between the HRRR and observations were too large in the afternoon and evening for a cross-section analysis to be useful.
Once well within the dry air, the MMU observed mixing ratio variations of about 1 g/kg on scales of 5–10 km. It is not known if these may be related to land use or soil moisture patterns. Spikes of mixing ratio to 10 g/kg (12 °C dew point) were noted on scales about 1 km or less in the immediate vicinity of a series of salt lakes southeast of Carlsbad.
4. Discussion and Conclusions
Each of the dryline cases examined includes some aspect that distinguishes from previously published studies. While largely consistent with previously documented cases, the data extend the breadth of features, forcing scenarios, and geographic context.
- The maintenance of intense dryline contrasts in complex terrain near the U.S.–Mexico border was confirmed well after sunset, with a microscale mixing ratio gradient noted of around 5.5 g/kg per km. Not only is this in a previously unsampled region, but it is believed to be the first published account of “fine-scale” dryline details during nighttime.
- Complex multi-step dryline patterns within what seem to be diffuse patterns on the synoptic scale have been documented in the afternoon, leading to further questions about the relationship of dryline evolution and movement to diurnal forcing and surface interactions. While drylines have sometimes been recognized as occurring in association with broader moisture gradients and as multiple steps or jumps [51,56,58,59,60], little is known about relationship to diurnal and other influences.
- In one case, afternoon convective development seemed only weakly influenced by the dryline. In another case severe convection developed, but the observational resources were too limited to adequately describe interactions between multi-step dryline patterns and convection. Consideration of the behavior of the dryline and of deep convective initiation in these cases contributed to the proposition that a conceptual distinction between peripheral and forcing roles of surface air mass boundaries such as drylines could be appropriate and useful.
All non-operational data collected for the cases studied were obtained from a single mobile vehicle platform, with some logistical constraints. While this allowed some degree of flexibility, the spatial coverage of multiple platforms and complimentary data streams of research radar and lidar systems were not available. Future investigation of similar cases would benefit from deployment of at least two mobile mesonet systems, four strategically positioned radiosondes, remote sensing by a Doppler radar or lidar, and supplementary automated surface stations.
The mountainous terrain of southern New Mexico, Trans-Pecos Texas, and Coahuila represents a very different environment from where most dryline field campaigns have taken place. In spite of the logistical challenges of limited road networks, the high frequency of drylines in the region offers significant opportunity for new observational studies. With a greater density of initialization and verification data, modeling efforts at higher resolution than operational forecast models would be able to make greater progress at describing processes over the less accessible areas. Ideally, a serious study of the southern end of the dryline would focus observational and modeling efforts over a broad region from the Permian Basin into Northern Coahuila. Better understanding of the dryline in this region could have implications in the interplay of contributions to the seasonal transition (typically around the end of June) to Pacific monsoonal moisture in the Trans-Pecos. It is also unknown how extension of the dryline into Mexico may influence the development of supercell thunderstorms in the Serrañías del Burro that impact border communities with severe hail and flash flooding.
Over the moderate terrain east of Carlsbad, the direction of slope is opposite the generally monotonic slope (upward to the west) typical of the Western Great Plains that is often noted as contributing to dryline development [2]. It is unknown whether this reversed slope between the Pecos River and Llano Estacado may contribute to “jumps” in the dryline progression in this region.
Most observational and modeling studies of drylines have focused on synoptically active drylines during the late afternoon (2000 to 0000 UTC) when severe convection is most likely. Even within the most intensively studied domain, no comprehensive field campaign has observed the dryline environment over a full 24 h or more of diurnal forcing with mobile, radar/lidar, and supplemental radiosondes. Transitions between diffuse, multi-step, and well-defined dryline patterns relative to diurnal and synoptic forcing have yet to be thoroughly documented. As suggested by [7], advection and differential diabatic heating both contribute to the development and motion of drylines. However their relative roles at different stages of the diurnal cycle and between cases are not well documented or understood.
Author Contributions
Conceptualization: L.D.W.; data collection and curation: L.D.W.; formal analysis: L.D.W.; funding acquisition: L.D.W. and D.L.; methodology: L.D.W.; resources: L.D.W.; supervision: L.D.W.; validation: L.D.W.; visualization: L.D.W. and D.L.; writing—original draft: L.D.W.; writing—review and editing: L.D.W. and D.L. All authors have read and agreed to the published version of the manuscript.
Funding
This study was supported by the NOAA Educational Partnership Program, U.S. Dept. of Commerce (NA11SEC4810003, NA17AE1623) and by the U.S. National Science Foundation (1644888).
Acknowledgments
Mobile data collection took place while Loren D. White was on sabbatical appointment at the University of Missouri—Columbia. Discussions with Chris Weiss and Brian Curran were helpful to planning and interpretation of mobile transects. The helpful comments of three anonymous reviewers are gratefully acknowledged.
Conflicts of Interest
The authors declare no conflicts of interest. The contents are solely the responsibility of the author and do not necessarily represent the official views of the U.S. Department of Commerce/NOAA or the National Science Foundation.
References
- Fujita, T. Structure and Movement of a Dry Front. Bull. Amer. Meteorol. Soc. 1958, 39, 574–582. [Google Scholar] [CrossRef] [Green Version]
- Peckham, S.E.; Wicker, L.J. The Influence of Topography and Lower-Tropospheric Winds on Dryline Morphology. Mon. Weather Rev. 2000, 128, 2165–2189. [Google Scholar] [CrossRef]
- Pietrycha, A.E.; Rasmussen, E.N. Finescale Surface Observations of the Dryline: A Mobile Mesonet Perspective. Weather Forecast. 2004, 19, 1075–1088. [Google Scholar] [CrossRef] [Green Version]
- Atkins, N.T.; Wakimoto, R.M.; Ziegler, C.L. Observations of the Finescale Structure of a Dryline during VORTEX 95. Mon. Weather Rev. 1998, 126, 525–550. [Google Scholar] [CrossRef]
- Buban, M.S.; Ziegler, C.L.; Rasmussen, E.N.; Richardson, Y.P. The Dryline on 22 May 2002 during IHOP_2002: Ground-Radar and In Situ Data Analyses of the Dryline and Boundary Layer Evolution. Mon. Weather Rev. 2007, 135, 2473–2505. [Google Scholar] [CrossRef]
- Geerts, B.; Damiani, R.; Haimov, S. Finescale Vertical Structure of a Cold Front as Revealed by an Airborne Doppler Radar. Mon. Weather Rev. 2006, 134, 251–271. [Google Scholar] [CrossRef] [Green Version]
- Miao, Q.; Geerts, B. Finescale Vertical Structure and Dynamics of Some Dryline Boundaries Observed in IHOP. Mon. Weather Rev. 2007, 135, 4161–4184. [Google Scholar] [CrossRef]
- Weiss, C.C.; Bluestein, H.B.; Pazmany, A.L. Finescale Radar Observations of the 22 May 2002 Dryline during the International H2O Project (IHOP). Mon. Weather Rev. 2006, 134, 273–293. [Google Scholar] [CrossRef]
- Hoch, J.; Markowski, P. A Climatology of Springtime Dryline Position in the U.S. Great Plains Region. J. Clim. 2005, 18, 2132–2137. [Google Scholar] [CrossRef]
- McCaul, E.W., Jr.; Blanchard, D.O. A Low-Precipitation Cumulonimbus along the Dryline in Colorado. Mon. Weather Rev. 1990, 118, 2768–2773. [Google Scholar] [CrossRef] [Green Version]
- Richter, H.; Bosart, L.F. The Suppression of Deep Moist Convection near the Southern Great Plains Dryline. Mon. Weather Rev. 2002, 130, 1665–1691. [Google Scholar] [CrossRef]
- Hane, C.E. Quiescent and Synoptically-Active Drylines: A Comparison Based upon Case Studies. Meteorol. Atmos. Phys. 2004, 86, 195–211. [Google Scholar] [CrossRef]
- Cai, H.; Lee, W.-C.; Weckwerth, T.M.; Flamant, C.; Murphey, H.V. Observations of the 11 June Dryline during IHOP_2002—A Null Case for Convection Initiation. Mon. Weather Rev. 2006, 134, 336–354. [Google Scholar] [CrossRef] [Green Version]
- Bergmaier, P.T.; Geerts, B. Characteristics and Synoptic Environment of Drylines Occurring over the Higher Terrain of Southeastern Wyoming. Weather Forecast. 2015, 30, 1733–1748. [Google Scholar] [CrossRef]
- Geerts, B. Dryline Characteristics near Lubbock, Texas, Based on Radar and West Texas Mesonet Data for May 2005 and May 2006. Weather Forecast. 2008, 23, 392–406. [Google Scholar] [CrossRef] [Green Version]
- Lanicci, J.M.; Warner, T.T. A Synoptic Climatology of the Elevated Mixed-Layer Inversion over the Southern Great Plains in Spring. Part I: Structure, Dynamics, and Seasonal Evolution. Weather Forecast. 1991, 6, 181–197. [Google Scholar] [CrossRef]
- Myoung, B.; Nielsen-Gammon, J.W. The Convective Instability Pathway to Warm Season Drought in Texas. Part I: The Role of Convective Inhibition and Its Modulation by Soil Moisture. J. Clim. 2010, 23, 4461–4473. [Google Scholar] [CrossRef] [Green Version]
- Ribeiro, B.Z.; Bosart, L.F. Elevated Mixed Layers and Associated Severe Thunderstorm Environments in South and North America. Mon. Weather Rev. 2018, 146, 3–28. [Google Scholar] [CrossRef]
- Mitchell, T.; Schultz, D.M. A Synoptic Climatology of Spring Dryline Convection in the Southern Great Plains. Weather Forecast. 2020, 35, 1561–1582. [Google Scholar] [CrossRef]
- White, L. Mobile Observations of a Quasi-Frontal Transient Moisture Boundary in the Deep South. Weather Forecast. 2014, 29, 1356–1373. [Google Scholar] [CrossRef]
- White, L.D.; Koziara, M. Surface Thermodynamic Gradients Associated with Gulf of Mexico Sea Breeze Fronts. Adv. Meteorol. 2018, 2018, 2601346. [Google Scholar] [CrossRef]
- Blair, S.F.; Deroche, D.R.; Pietrycha, A.E. In Situ Observations of the 21 April 2007 Tulia, Texas Tornado. E-J. Sev. Storms Meteorol. 2008, 3, 3. [Google Scholar]
- Waugh, S.M. The “U-Tube”: An Improved Aspirated Temperature System for Mobile Meteorological Observations, Especially in Severe Weather. Master’s Thesis, University of Oklahoma, Norman, OK, USA, 2012. Available online: https://shareok.org/handle/11244/24679 (accessed on 12 August 2020).
- Lowa Environmental Mesonet. Available online: https://mesonet.agron.iastate.edu (accessed on 12 August 2020).
- West Texas Mesonet. Available online: http://www.depts.ttu.edu/nwi/research/facilities/wtm (accessed on 12 August 2020).
- Schroeder, J.L.; Burgett, W.S.; Haynie, K.B.; Sonmez, I.; Skwira, G.D.; Doggett, A.L.; Lipe, J.W. The West Texas Mesonet: A Technical Overview. J. Atmos. Ocean. Techn. 2005, 22, 211–222. [Google Scholar] [CrossRef]
- MesoWest. Available online: http://mesowest.utah.edu (accessed on 12 August 2020).
- Horel, J.; Splitt, M.; Dunn, L.; Pechmann, J.; White, B.; Ciliberti, C.; Lazarus, S.; Slemmer, J.; Zaff, D.; Burks, J. 2002: Mesowest: Cooperative mesonets in the western United States. Bull. Amer. Meteorol. Soc. 2002, 83, 211–226. [Google Scholar] [CrossRef]
- NOAA/ESRL Radiosonde Database. Available online: https://ruc.noaa.gov/raobs (accessed on 12 August 2020).
- Upperair Air Data. Available online: http://weather.uwyo.edu/upperair/ (accessed on 12 August 2020).
- Blumberg, W.G.; Halbert, K.T.; Supinie, T.A.; Marsh, P.T.; Thompson, R.L.; Hart, J.A. SHARPpy: An Open-Source Sounding Analysis Toolkit for the Atmospheric Sciences. Bull. Amer. Meteorol. Soc. 2017, 98, 1625–1636. [Google Scholar] [CrossRef]
- Bessardon, G.E.Q.; Fosu-Amankwah, K.; Petersson, A.; Brooks, B.J. Evaluation of Windsond S1H2 Performance in Kumasi during the 2016 DACCIWA Field Campaign. Atmos. Meas. Tech. 2019, 12, 1311–1324. [Google Scholar] [CrossRef] [Green Version]
- Ikeda, K.; Steiner, M.; Pinto, J.; Alexander, C. Evaluation of Cold-Season Precipitation Forecasts Generated by the Hourly Updating High-Resolution Rapid Refresh Model. Weather Forecast. 2013, 28, 921–939. [Google Scholar] [CrossRef]
- Benjamin, S.G.; Weygandt, S.S.; Brown, J.M.; Hu, M.; Alexander, C.R.; Smirnova, T.G.; Olson, J.B.; James, E.P.; Dowell, D.C.; Grell, G.A.; et al. A North American Hourly Assimilation and Model Forecast Cycle: The Rapid Refresh. Mon. Weather Rev. 2016, 144, 1669–1694. [Google Scholar] [CrossRef]
- Lee, T.R.; Buban, M.; Turner, D.D.; Meyers, T.P.; Baker, C.B. Evaluation of the High-Resolution Rapid Refresh (HRRR) Model Using Near-Surface Meteorological and Flux Observations from Northern Alabama. Weather Forecast. 2019, 34, 635–663. [Google Scholar] [CrossRef]
- Real-time Environmental Applications and Display System. Available online: https://www.ready.noaa.gov (accessed on 12 August 2020).
- Rolph, G.; Stein, A.; Stunder, B. Real-Time Environmental Applications and Display System: READY. Environ. Model. Softw. 2017, 95, 210–228. [Google Scholar] [CrossRef]
- Coffer, B.E.; Maudlin, L.C.; Veals, P.G.; Clark, A.J. Dryline Position Errors in Experimental Convection-Allowing NSSL-WRF Model Forecasts and the Operational NAM. Weather Forecast. 2013, 28, 746–761. [Google Scholar] [CrossRef]
- Campbell, P.C.; Geerts, B.; Bergmaier, P.T. A Dryline in Southeast Wyoming. Part I: Multiscale Analysis Using Observations and Modeling on 22 June 2010. Mon. Weather Rev. 2014, 142, 268–289. [Google Scholar] [CrossRef] [Green Version]
- NOAA Next Generation Radar (NEXRAD) Level 2 Base Data. Available online: http://doi.org/10.7289/V5W9574V (accessed on 12 August 2020).
- Edwards, R. Supercells of the Serrañías del Burro (Mexico). In Proceedings of the 23rd Conference on Severe Local Storms, St. Louis, MO, USA, 6–10 November 2006; American Meteorological Society: Boston, MA, USA, 2006; Available online: https://ams.confex.com/ams/23SLS/techprogram/paper_114980.htm (accessed on 12 August 2020).
- Weiss, J.; Zeitler, J. Supercells of the Serrañías del Burro. In Proceedings of the 24rd Conference on Severe Local Storms, Savannah, GA, USA, 27–31 October 2008; American Meteorological Society: Boston, MA, USA, 2008; Available online: https://ams.confex.com/ams/24SLS/techprogram/paper_141558.htm (accessed on 12 August 2020).
- Barrett, B.S.; Farfán, L.M.; Raga, G.B.; Hernández, D.H. The Unusual Early Morning Tornado in Ciudad Acuña, Coahuila, Mexico, on 25 May 2015. Mon. Weather Rev. 2017, 145, 2049–2069. [Google Scholar] [CrossRef]
- Ziegler, C.L.; Rasmussen, E.N. The Initiation of Moist Convection at the Dryline: Forecasting Issues from a Case Study Perspective. Weather Forecast. 1998, 13, 1106–1131. [Google Scholar] [CrossRef]
- Parsons, D.B.; Shapiro, M.A.; Miller, E. The Mesoscale Structure of a Nocturnal Dryline and of a Frontal-Dryline Merger. Mon. Weather Rev. 2000, 128, 3824–3838. [Google Scholar] [CrossRef]
- Worldview. Available online: https://worldview.earthdata.nasa.gov (accessed on 12 August 2020).
- Demoz, B.; Flamant, C.; Weckwerth, T.; Whiteman, D.; Evans, K.; Fabry, F.; di Girolamo, P.; Miller, D.; Geerts, B.; Brown, W.; et al. The Dryline on 22 May 2002 during IHOP_2002: Convective-Scale Measurements at the Profiling Site. Mon. Weather Rev. 2006, 134, 294–310. [Google Scholar] [CrossRef] [Green Version]
- Sipprell, B.D.; Geerts, B. Finescale Vertical Structure and Evolution of a Preconvective Dryline on 19 June 2002. Mon. Weather Rev. 2007, 135, 2111–2134. [Google Scholar] [CrossRef] [Green Version]
- Crutzen, P.J.; Elansky, N.F.; Hahn, M.; Golitsyn, G.S.; Brenninkmeijer, C.A.M.; Scharffe, D.; Belikov, I.B.; Maiss, M.; Bergamaschi, P.; Rockmann, T.; et al. Trace Gas Measurements between Moscow and Vladivostok Using the Trans-Siberian Railroad. J. Atmos. Chem. 1998, 29, 179–194. [Google Scholar] [CrossRef]
- Farrell, P.; Culling, D.; Leifer, I. Transcontinental Methane Measurements. Part 1. A Mobile Surface Platform for Source Investigations. Atmos. Environ. 2013, 74, 422–431. [Google Scholar] [CrossRef]
- Schaefer, J.T. The Life Cycle of the Dryline. J. Appl. Meteorol. 1974, 13, 444–449. [Google Scholar] [CrossRef]
- Weiss, C.C.; Bluestein, H.B. Airborne Pseudo-Dual Doppler Analysis of a Dryline-Outflow Boundary Intersection. Mon. Weather Rev. 2002, 130, 1207–1226. [Google Scholar] [CrossRef]
- Crawford, T.M.; Bluestein, H.B. Characteristics of Dryline Passage during COPS-91. Mon. Weather Rev. 1997, 125, 463–477. [Google Scholar] [CrossRef]
- Ziegler, C.L.; Hane, C.E. An Observational Study of the Dryline. Mon. Weather Rev. 1993, 121, 1134–1151. [Google Scholar] [CrossRef]
- Hane, C.E.; Baldwin, M.E.; Bluestein, H.B.; Crawford, T.M.; Rabin, R.M. A Case Study of Severe Storm Development along a Dryline within a Synoptically Active Environment. Part I: Dryline Motion and an Eta Model Forecast. Mon. Weather Rev. 2001, 129, 2183–2204. [Google Scholar] [CrossRef]
- Wakimoto, R.M.; Murphey, H.V. Analysis of a Dryline during IHOP: Implications for Convection Initiation. Mon. Weather Rev. 2009, 137, 912–936. [Google Scholar] [CrossRef]
- Hane, C.E.; Bluestein, H.B.; Crawford, T.M.; Baldwin, M.E.; Rabin, R.M. Severe Thunderstorm Development in Relation to Along-Dryline Variability: A Case Study. Mon. Weather Rev. 1997, 125, 231–251. [Google Scholar] [CrossRef]
- Ziegler, C.L.; Lee, T.J.; Pielke, R.A., Sr. Convective Initiation at the Dryline: A Modeling Study. Mon. Weather Rev. 1997, 125, 1001–1026. [Google Scholar] [CrossRef]
- Thompson, R.L.; Edwards, R. An Overview of Environmental Conditions and Forecast Implications of the 3 May 1999 Tornado Outbreak. Weather Forecast. 2000, 15, 682–699. [Google Scholar] [CrossRef]
- Bluestein, H.B. The Formation and Early Evolution of the Greensburg, Kansas, Tornadic Supercell on 4 May 2007. Weather Forecast. 2009, 24, 899–920. [Google Scholar] [CrossRef]
Figure 1.
Operational NAM (North America Mesoscale) model forecast of 2 m dew point (°F) for 0000 UTC 9 April 2017 from 1200 UTC 7 April.
Figure 1.
Operational NAM (North America Mesoscale) model forecast of 2 m dew point (°F) for 0000 UTC 9 April 2017 from 1200 UTC 7 April.

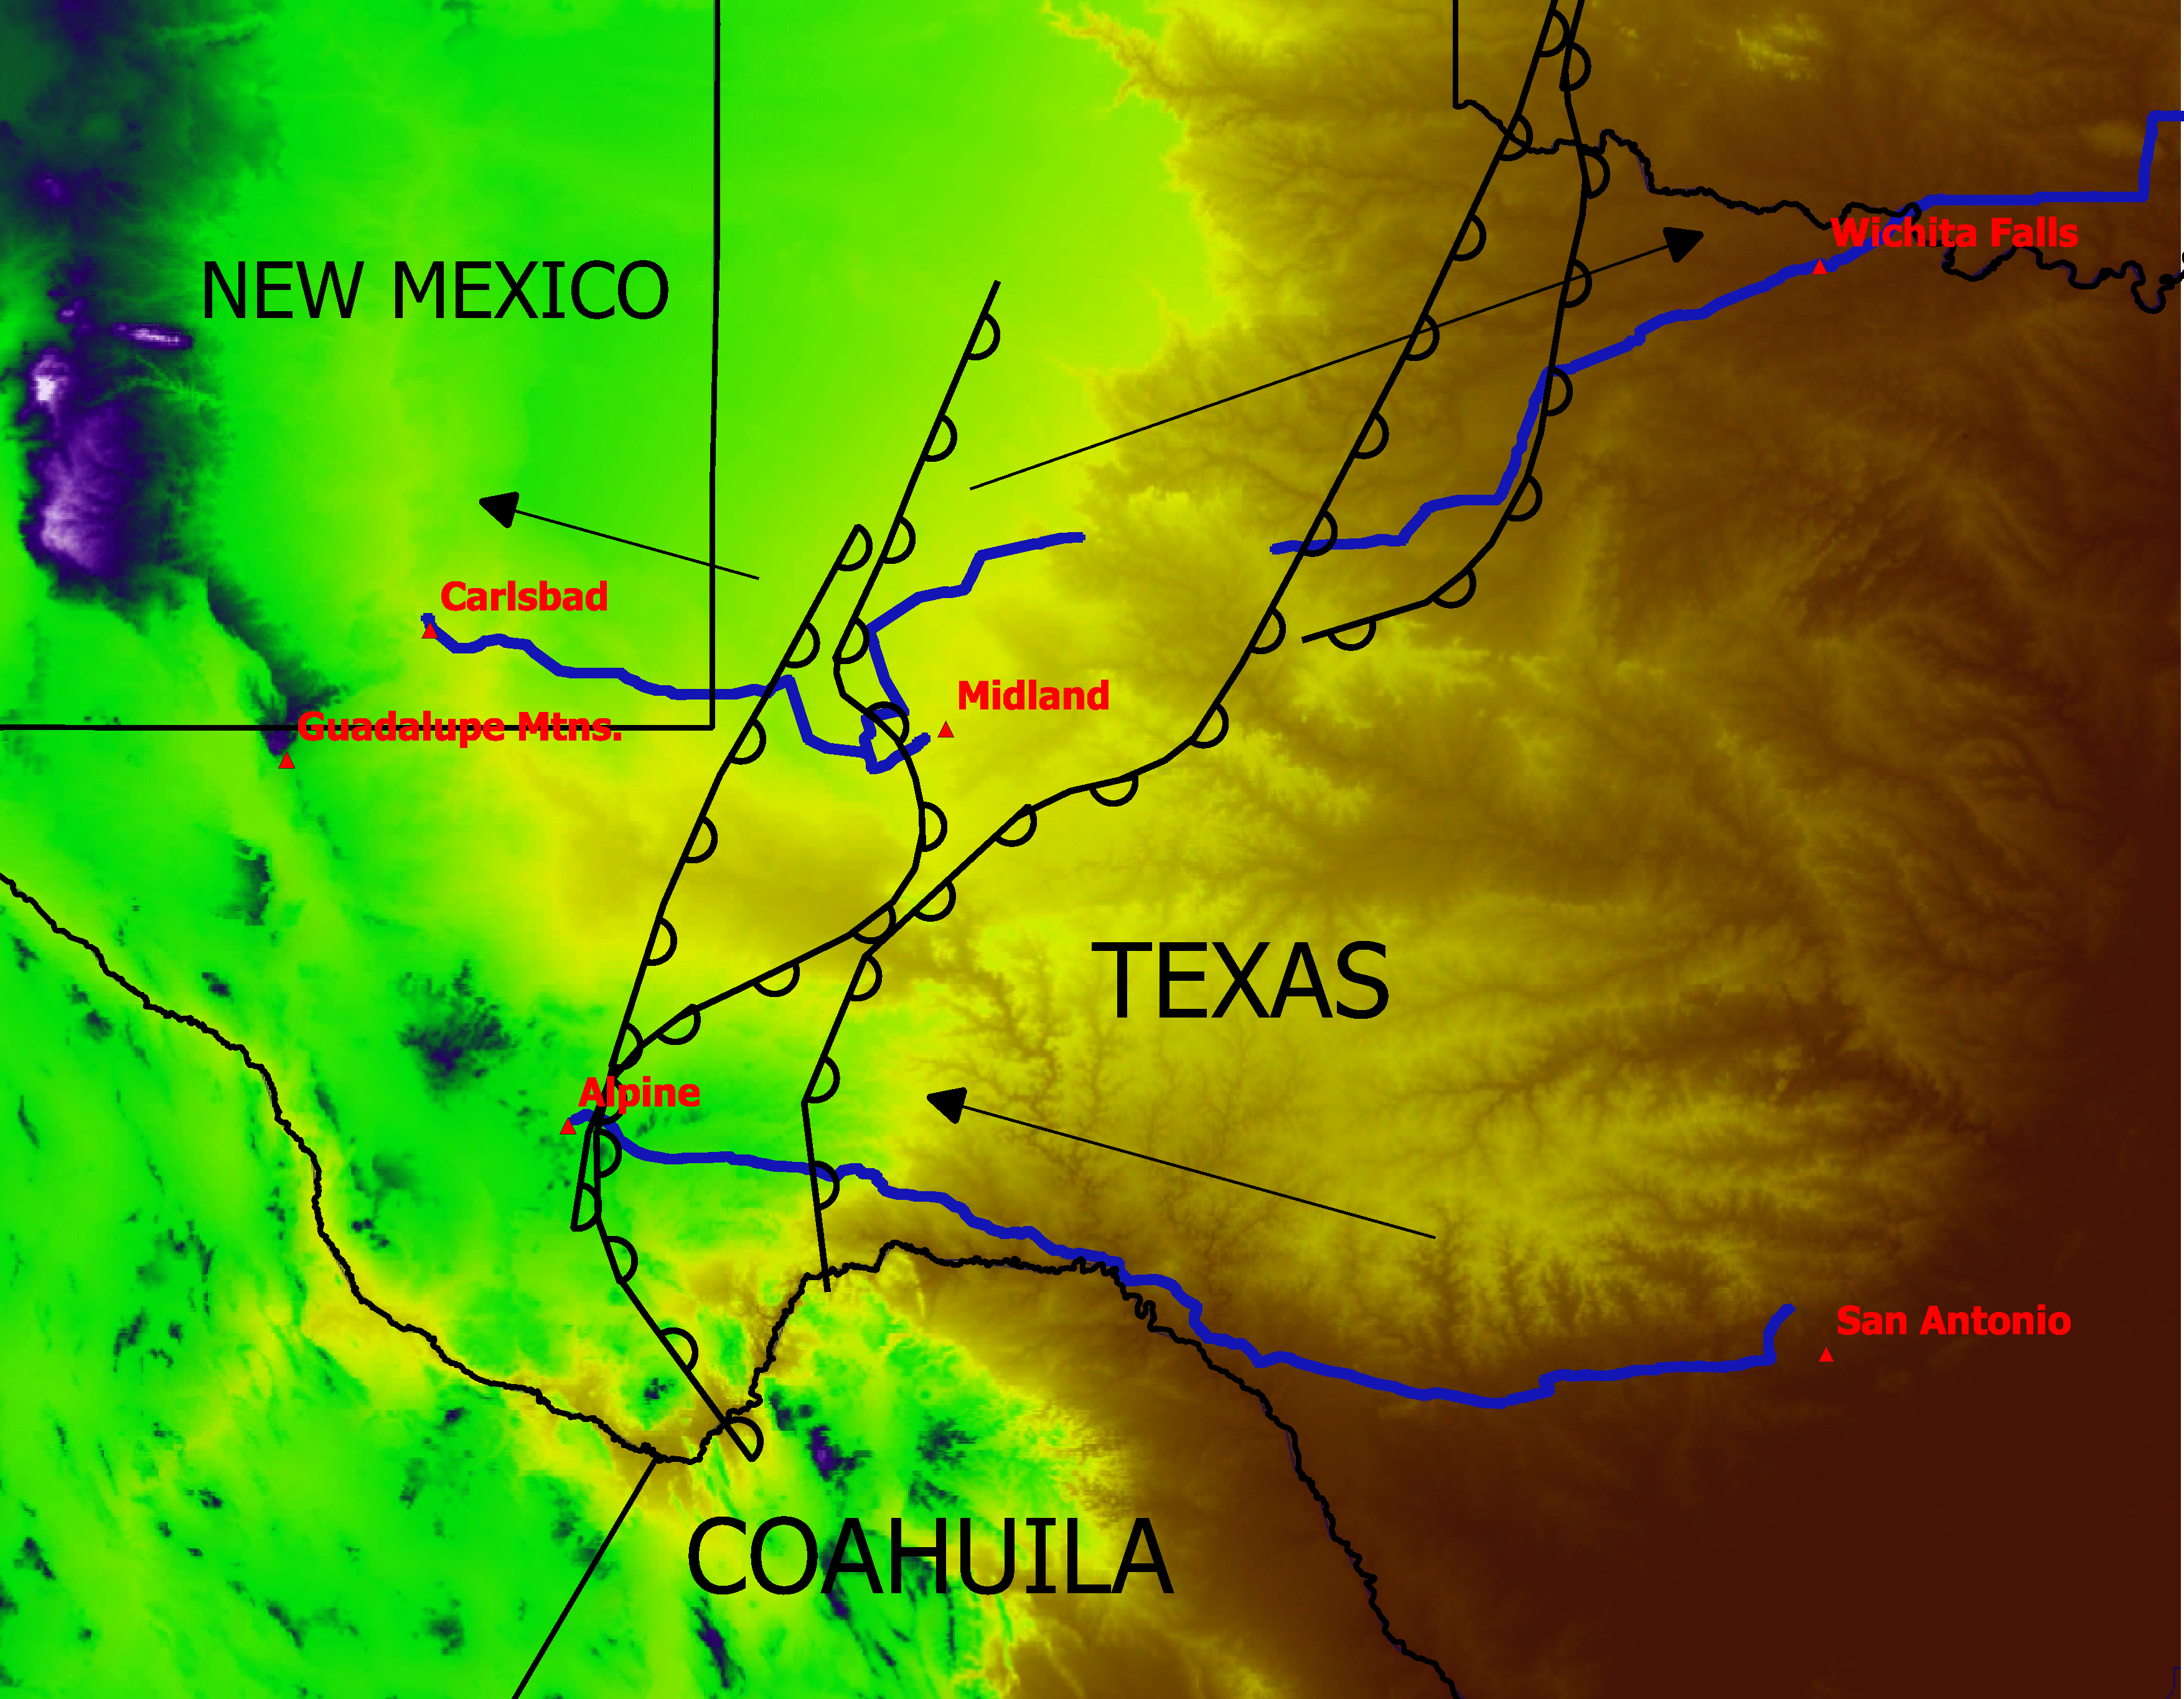
Figure 2.
(a) Dryline positions (dashed brown lines) analyzed at 2-hourly intervals between 2100 UTC 8 April and 0300 UTC 9 April, with geographic locations mentioned in text. Westbound mobile track is highlighted in blue. (b) Surface specific humidity (color; g/kg) and streamlines at 2100 UTC on 8 April 2017 from high-resolution rapid refresh (HRRR).


Figure 3.
(a) Skew-T log-p plot comparing Windsond profile from Amistad Reservoir (101 W) to 2100 UTC HRRR at grid point closest to launch site. Red and green are temperature and dew point from Windsond; blue lines are comparison from HRRR. Windsond winds are in foreground over HRRR winds. Heights are shown AGL, starting from surface elevation of about 350 m MSL. (b) Wind, temperature, and dew point profiles at Amistad Reservoir from Windsond software. Heights are shown MSL.

Figure 4.
(a) Skew-T log-p plot comparing KDRT 0000 UTC sounding to HRRR (background, blue lines). (b) Observed soundings at 0000 UTC from KMAF (top; west of dryline) and KDRT (background; east of dryline).
Figure 4.
(a) Skew-T log-p plot comparing KDRT 0000 UTC sounding to HRRR (background, blue lines). (b) Observed soundings at 0000 UTC from KMAF (top; west of dryline) and KDRT (background; east of dryline).


Figure 5.
HRRR specific humidity (g/kg) and wind streamlines at 0.90 sigma level at 0000 UTC.

Figure 6.
Surface observations at 0300 UTC, with virtual potential temperature (upper left; K) and mixing ratio (bottom left; g/kg). Mobile observations of mixing ratio (blue = low values; red = high values) are shown from Comstock to Alpine.
Figure 6.
Surface observations at 0300 UTC, with virtual potential temperature (upper left; K) and mixing ratio (bottom left; g/kg). Mobile observations of mixing ratio (blue = low values; red = high values) are shown from Comstock to Alpine.

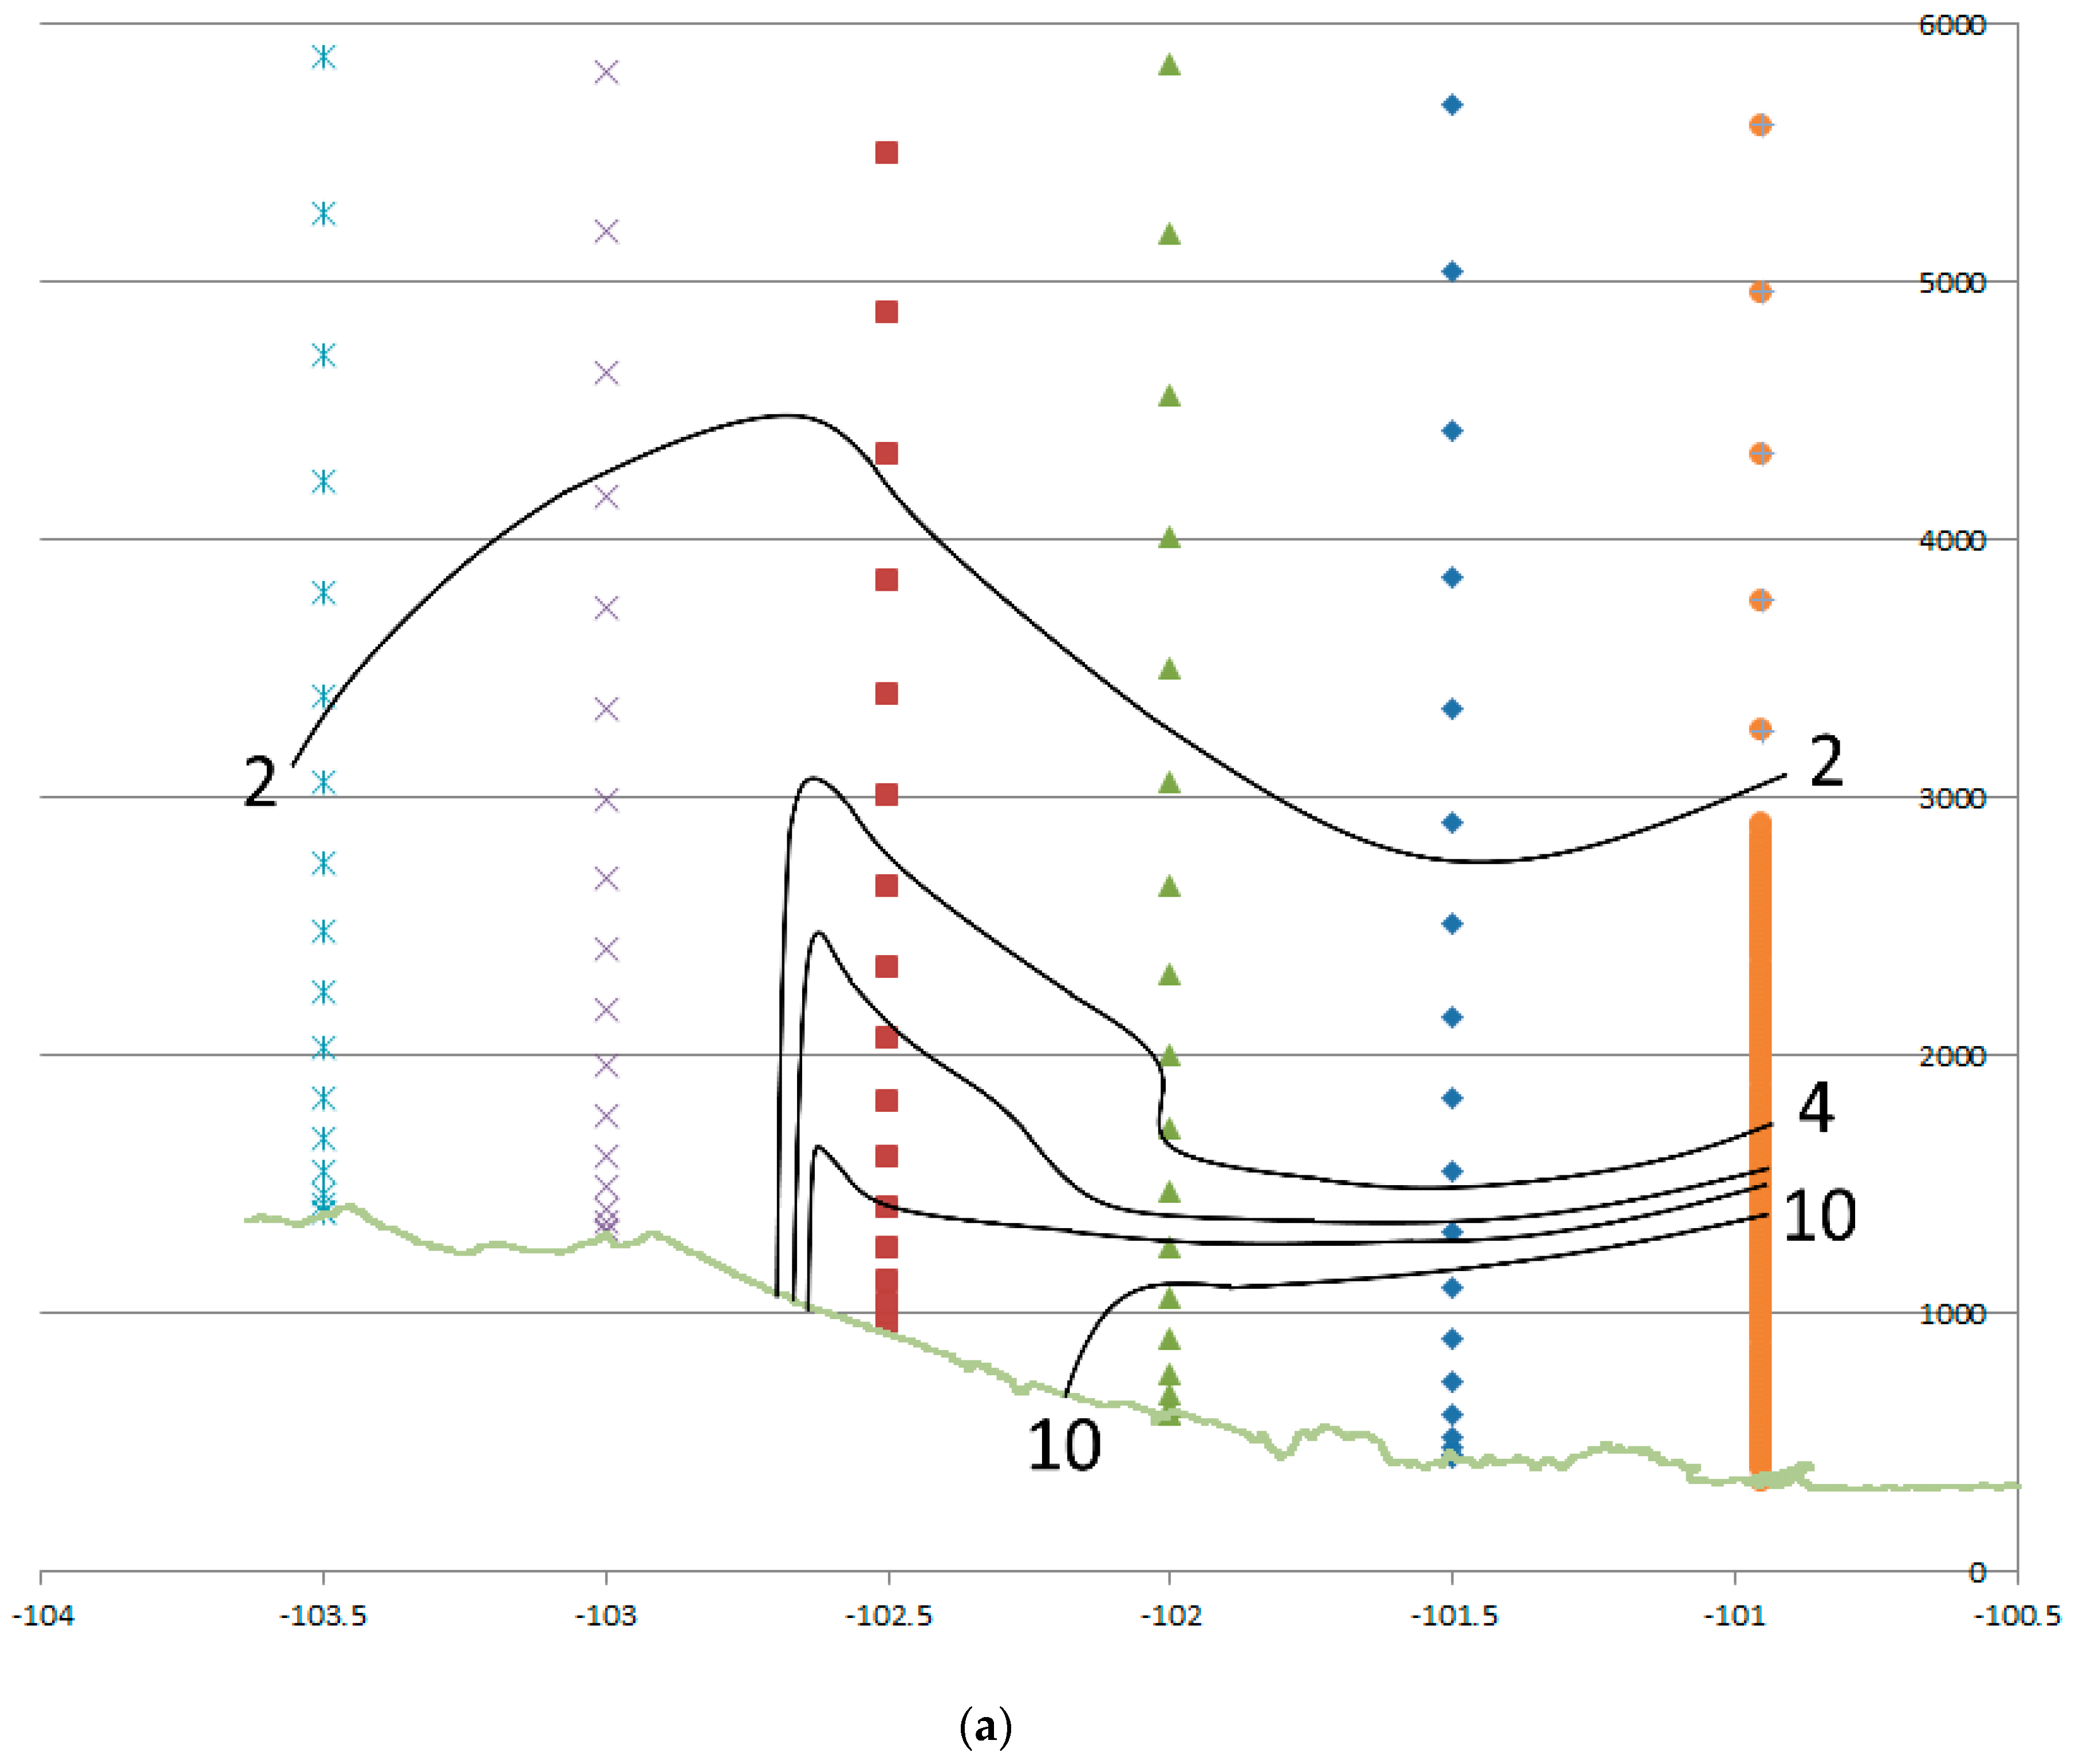
Figure 7.
(a) Mobile observed mixing ratio (blue; g/kg) and 0300 UTC adjusted (red; K) vs. longitude between Comstock and Alpine. Observations from synoptic/mesonet stations used for temporal adjustments are shown by triangles. (b) Mixing ratio (g/kg; blue: westbound; purple: eastbound) and (unadjusted due to narrow time span; K; red: westbound; green: eastbound) from MMU vs. longitude within about 25 km of Alpine during dryline intercepts. Arrow indicates westward displacement of dryline between westbound and eastbound.


Figure 8.
(a) Isopleths of mixing ratio (g/kg) on the westward transect near Alpine in relation to 0300 UTC station observations and topographic features. (b) Relation of the mixing ratio to topographic features on the eastward transect. Windsond launch site is indicated by star.
Figure 8.
(a) Isopleths of mixing ratio (g/kg) on the westward transect near Alpine in relation to 0300 UTC station observations and topographic features. (b) Relation of the mixing ratio to topographic features on the eastward transect. Windsond launch site is indicated by star.


Figure 9.
(a) Wind, temperature, and dew point profiles east of Alpine (103.5 W) from Windsond software. (b) Skew-T log-p plot comparing Windsond (red; green) to the 0400 UTC HRRR profile.
Figure 9.
(a) Wind, temperature, and dew point profiles east of Alpine (103.5 W) from Windsond software. (b) Skew-T log-p plot comparing Windsond (red; green) to the 0400 UTC HRRR profile.


Figure 10.
(a) Longitudinal cross-section of mixing ratio (g/kg) at 2200 UTC between Del Rio and Alpine, using Windsond (101.0 W; up to 3000 m) and HRRR profiles together with surface data. Heights are in m MSL. Markers indicate model and observational levels. (b) Longitudinal cross-section at 0400 UTC of mixing ratio (g/kg). Windsond data are used at 103.5 W.


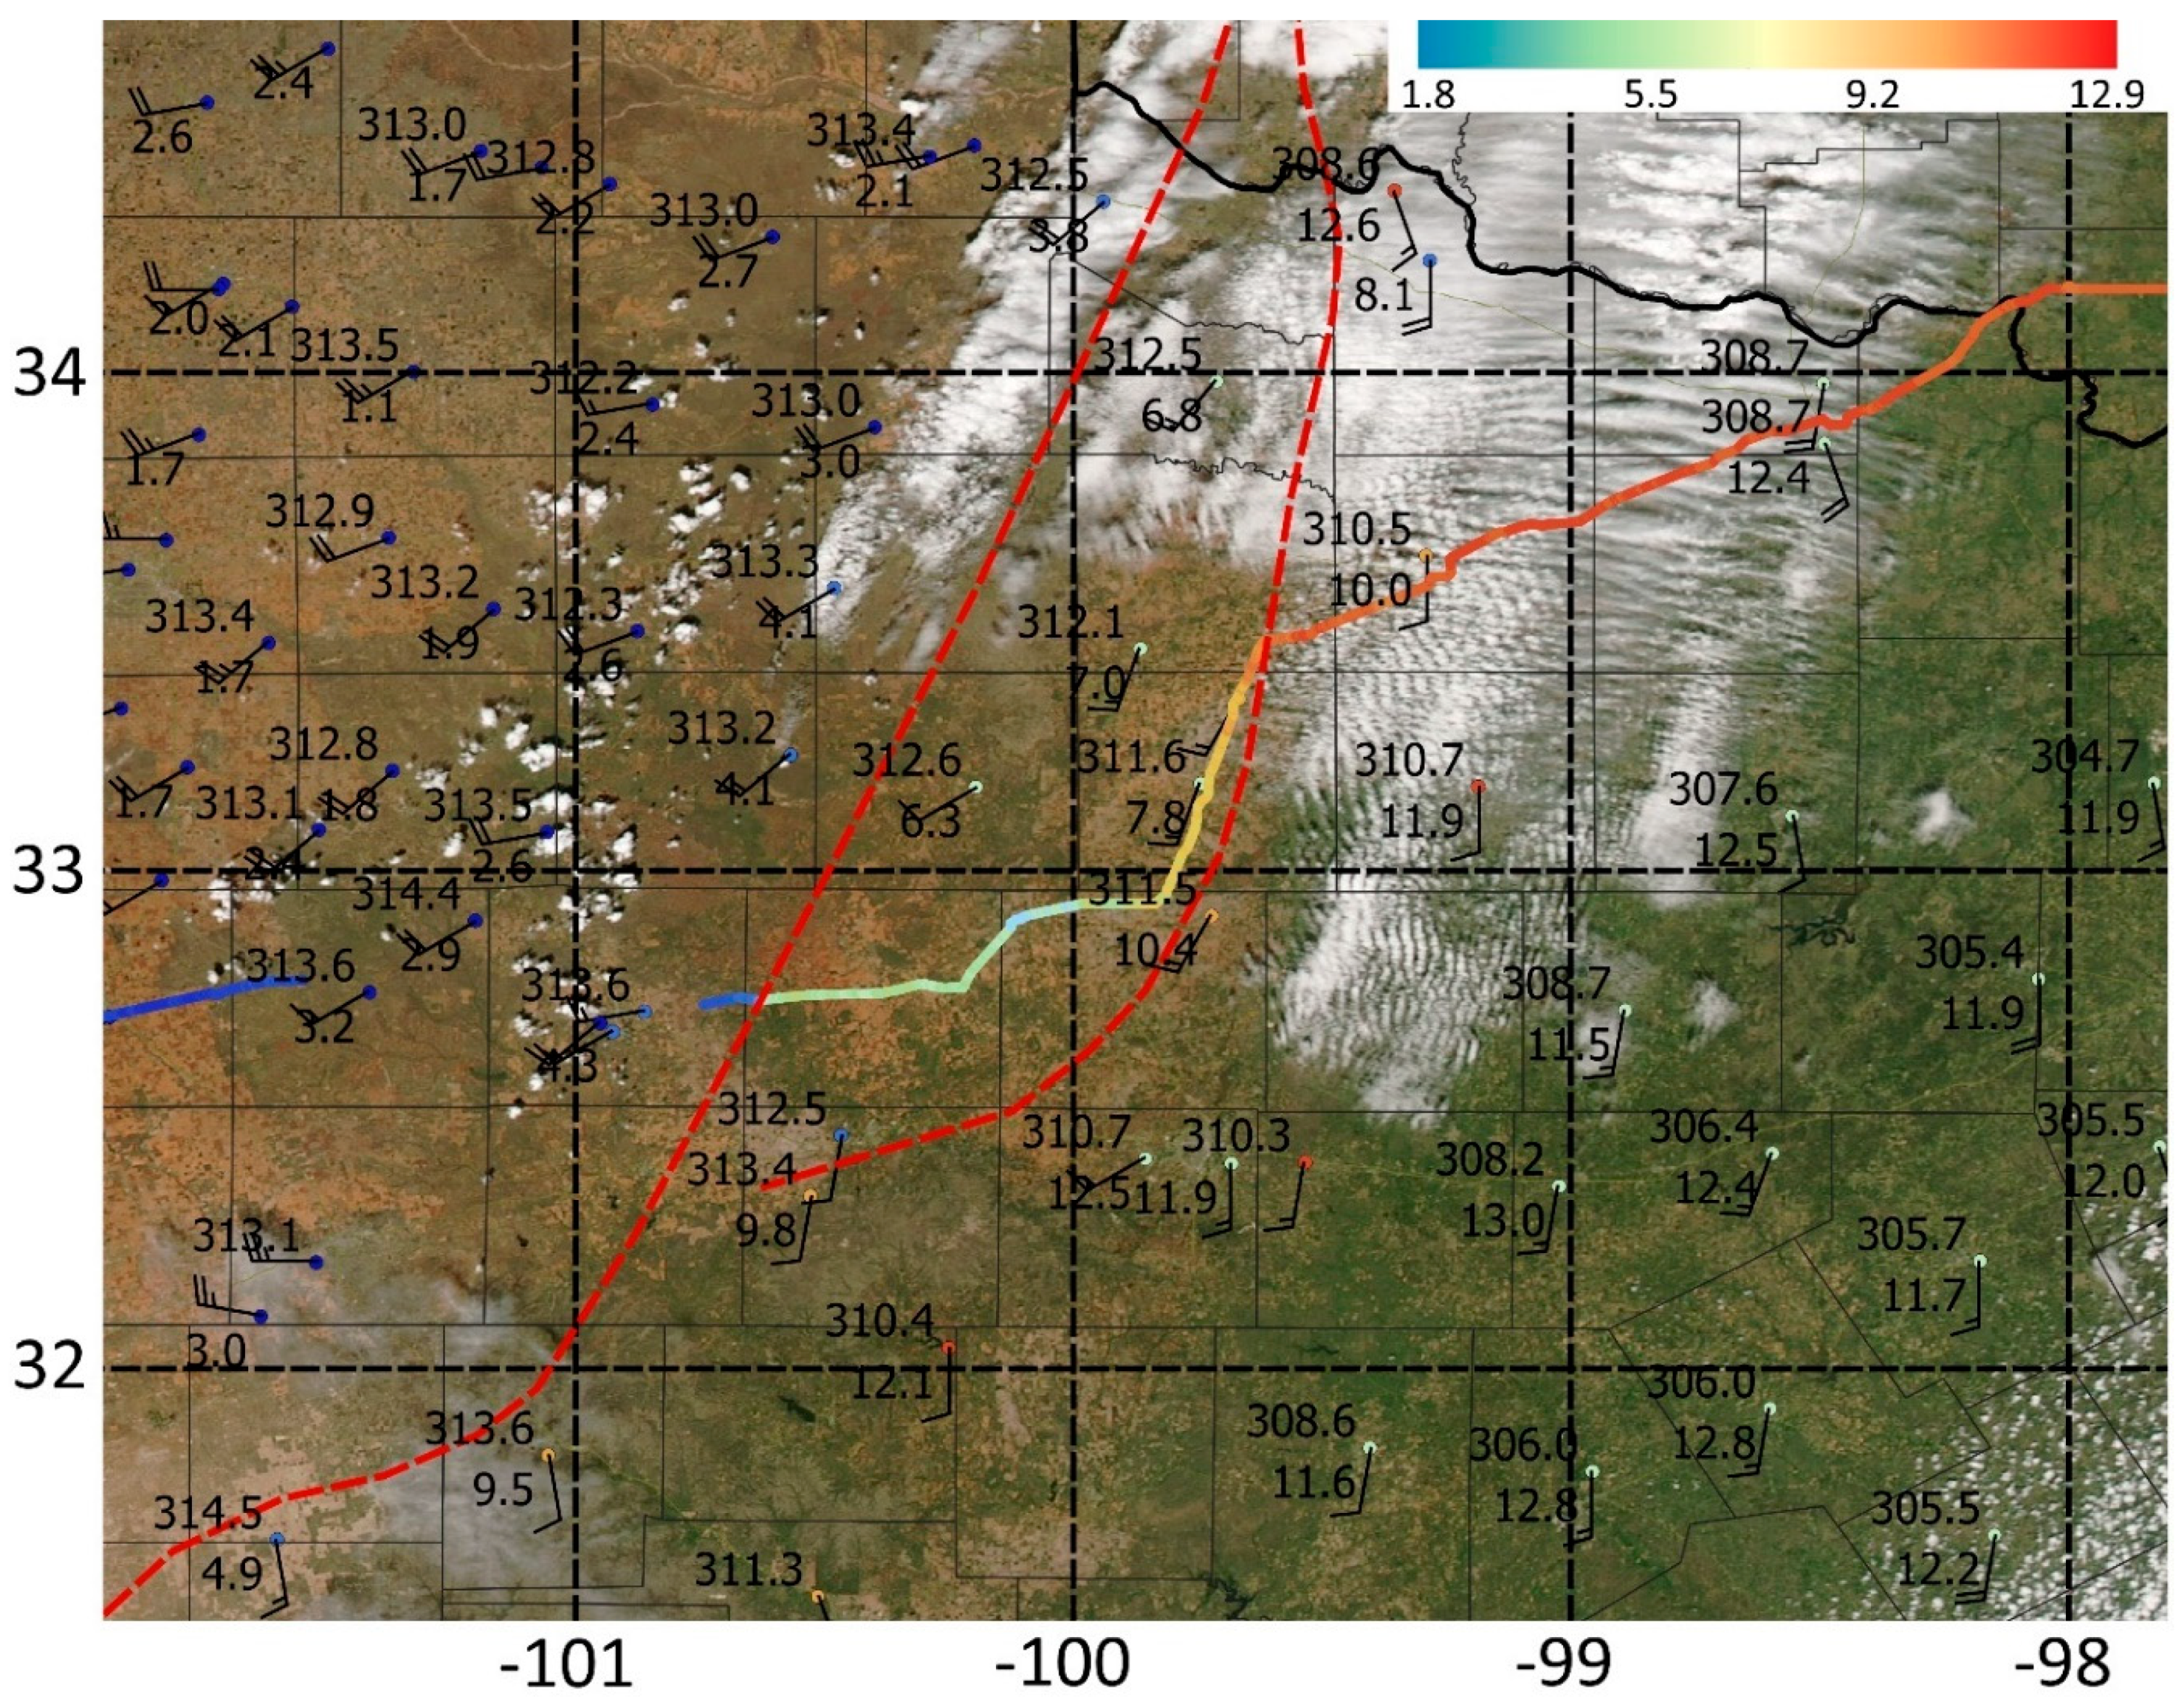
Figure 11.
Mobile track of mixing ratio adjusted to 2135 UTC on 9 April 2017, with overlay of MODIS (moderate resolution imaging spectroradiometer) Aqua 250 m visible imagery at 2005 UTC (from [46]), surface station observations, and analyzed western and eastern dryline positions. Station observations of , mixing ratio, and wind are at 2200 UTC from synoptic stations and 2135 UTC from mesonet stations.

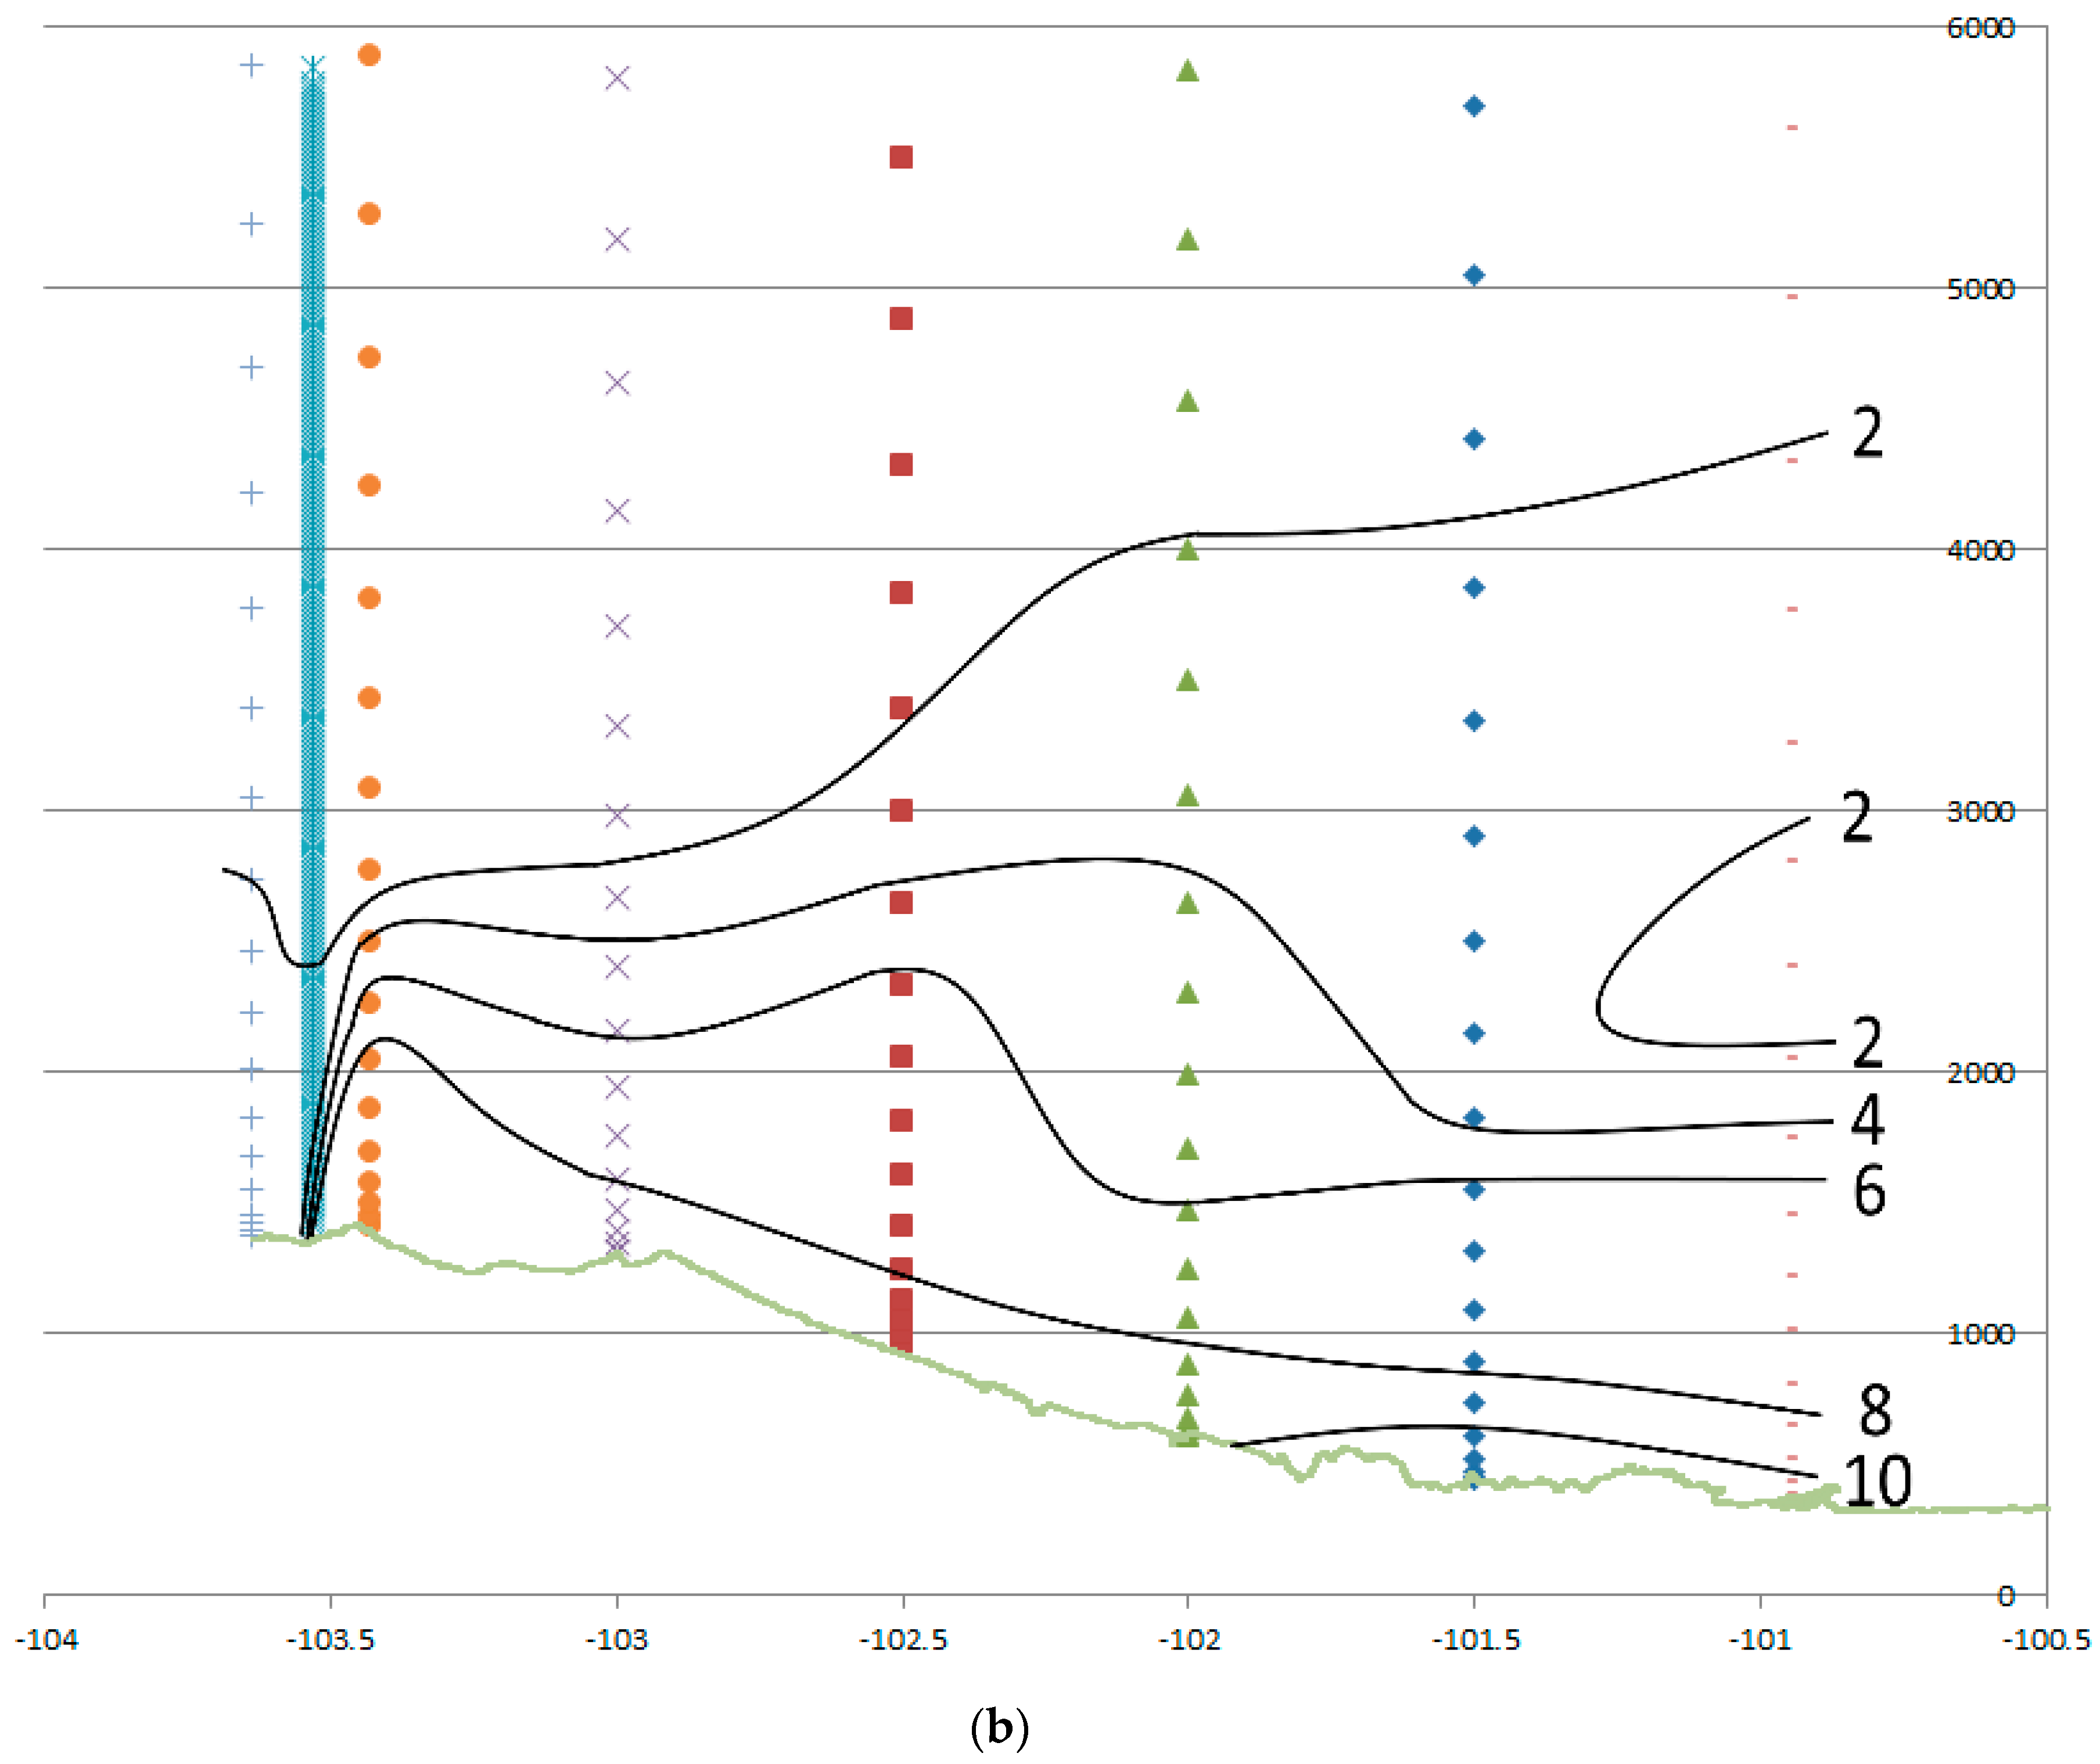
Figure 12.
Mobile mixing ratio (blue; g/kg) and (red; K) vs longitude, temporally adjusted to 2135 UTC on 9 April 2017. Station data used in temporal adjustment are shown by triangles, and in data gap by squares.
Figure 12.
Mobile mixing ratio (blue; g/kg) and (red; K) vs longitude, temporally adjusted to 2135 UTC on 9 April 2017. Station data used in temporal adjustment are shown by triangles, and in data gap by squares.

Figure 13.
Analyzed dryline positions with surface observations ( and mixing ratio) and HRRR dew point (C) at 2200 UTC on 9 April 2017.
Figure 13.
Analyzed dryline positions with surface observations ( and mixing ratio) and HRRR dew point (C) at 2200 UTC on 9 April 2017.

Figure 14.
Comparison of mixing ratio vs. longitude from long-distance mobile transect between Abilene, Texas (98 W) and San Diego, California (117 W) during 11–13 June (dryline; pre-monsoon; red) and 22–25 July (mid-monsoon; blue).
Figure 14.
Comparison of mixing ratio vs. longitude from long-distance mobile transect between Abilene, Texas (98 W) and San Diego, California (117 W) during 11–13 June (dryline; pre-monsoon; red) and 22–25 July (mid-monsoon; blue).

Figure 15.
(a) Vertical cross-section of potential temperature between Midland (KMAF) and El Paso (KEPZ) at 1100 UTC. Colors of elevation profile distinguish transect segments broken by stops. (b) Vertical cross-section of mixing ratio.
Figure 15.
(a) Vertical cross-section of potential temperature between Midland (KMAF) and El Paso (KEPZ) at 1100 UTC. Colors of elevation profile distinguish transect segments broken by stops. (b) Vertical cross-section of mixing ratio.

Figure 16.
Base reflectivity from the KMAF radar overlaid from 2232, 2300, 2324, 0035, and 0102 UTC. Radar data were unavailable from KMAF before 2227 and between 2324 and 0035 UTC. The dryline during this period was oriented north-south in the vicinity of Andrews.
Figure 16.
Base reflectivity from the KMAF radar overlaid from 2232, 2300, 2324, 0035, and 0102 UTC. Radar data were unavailable from KMAF before 2227 and between 2324 and 0035 UTC. The dryline during this period was oriented north-south in the vicinity of Andrews.

Figure 17.
Time series plots of temperature (red) and dew point (blue; C) between 1200 UTC 12 June and 1200 UTC 13 June at Andrews, Texas.
Figure 17.
Time series plots of temperature (red) and dew point (blue; C) between 1200 UTC 12 June and 1200 UTC 13 June at Andrews, Texas.

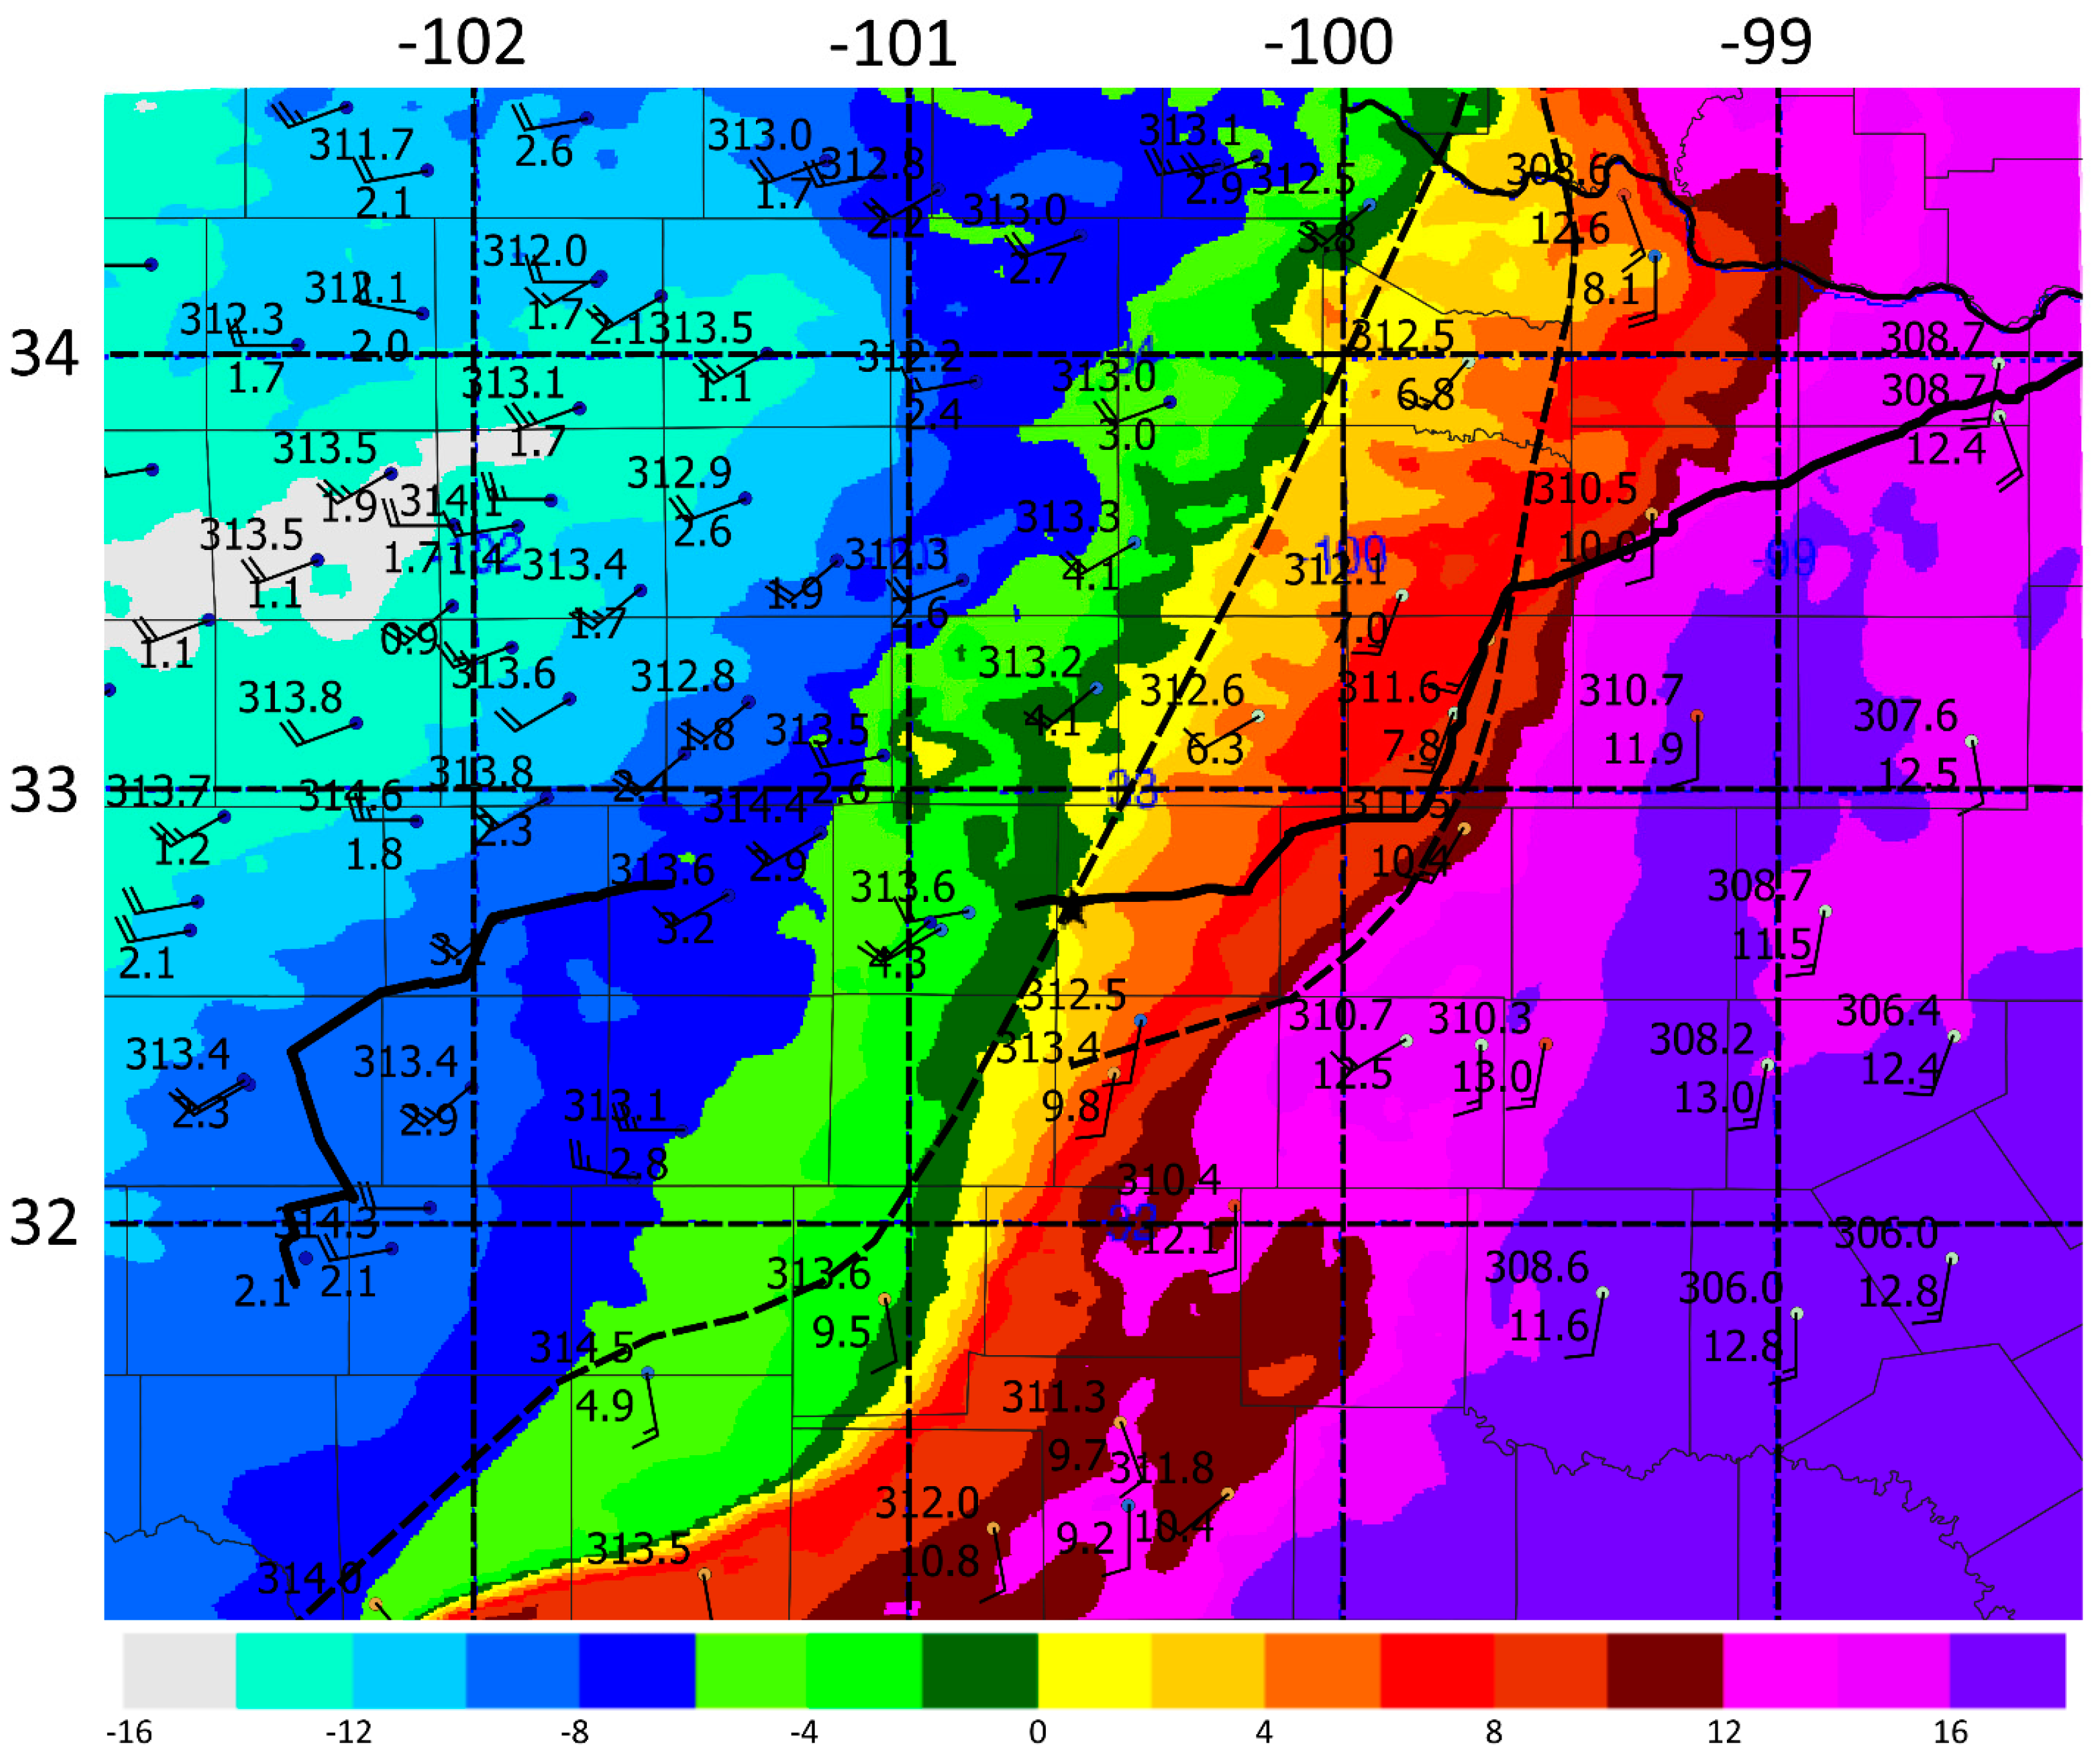
Figure 18.
Surface observations ( and mixing ratio) at 1900 UTC and mobile track mixing ratio (adjusted to 1900 UTC), compared with manual dew point and dryline analyses from (a) observations and (b) HRRR.
Figure 18.
Surface observations ( and mixing ratio) at 1900 UTC and mobile track mixing ratio (adjusted to 1900 UTC), compared with manual dew point and dryline analyses from (a) observations and (b) HRRR.

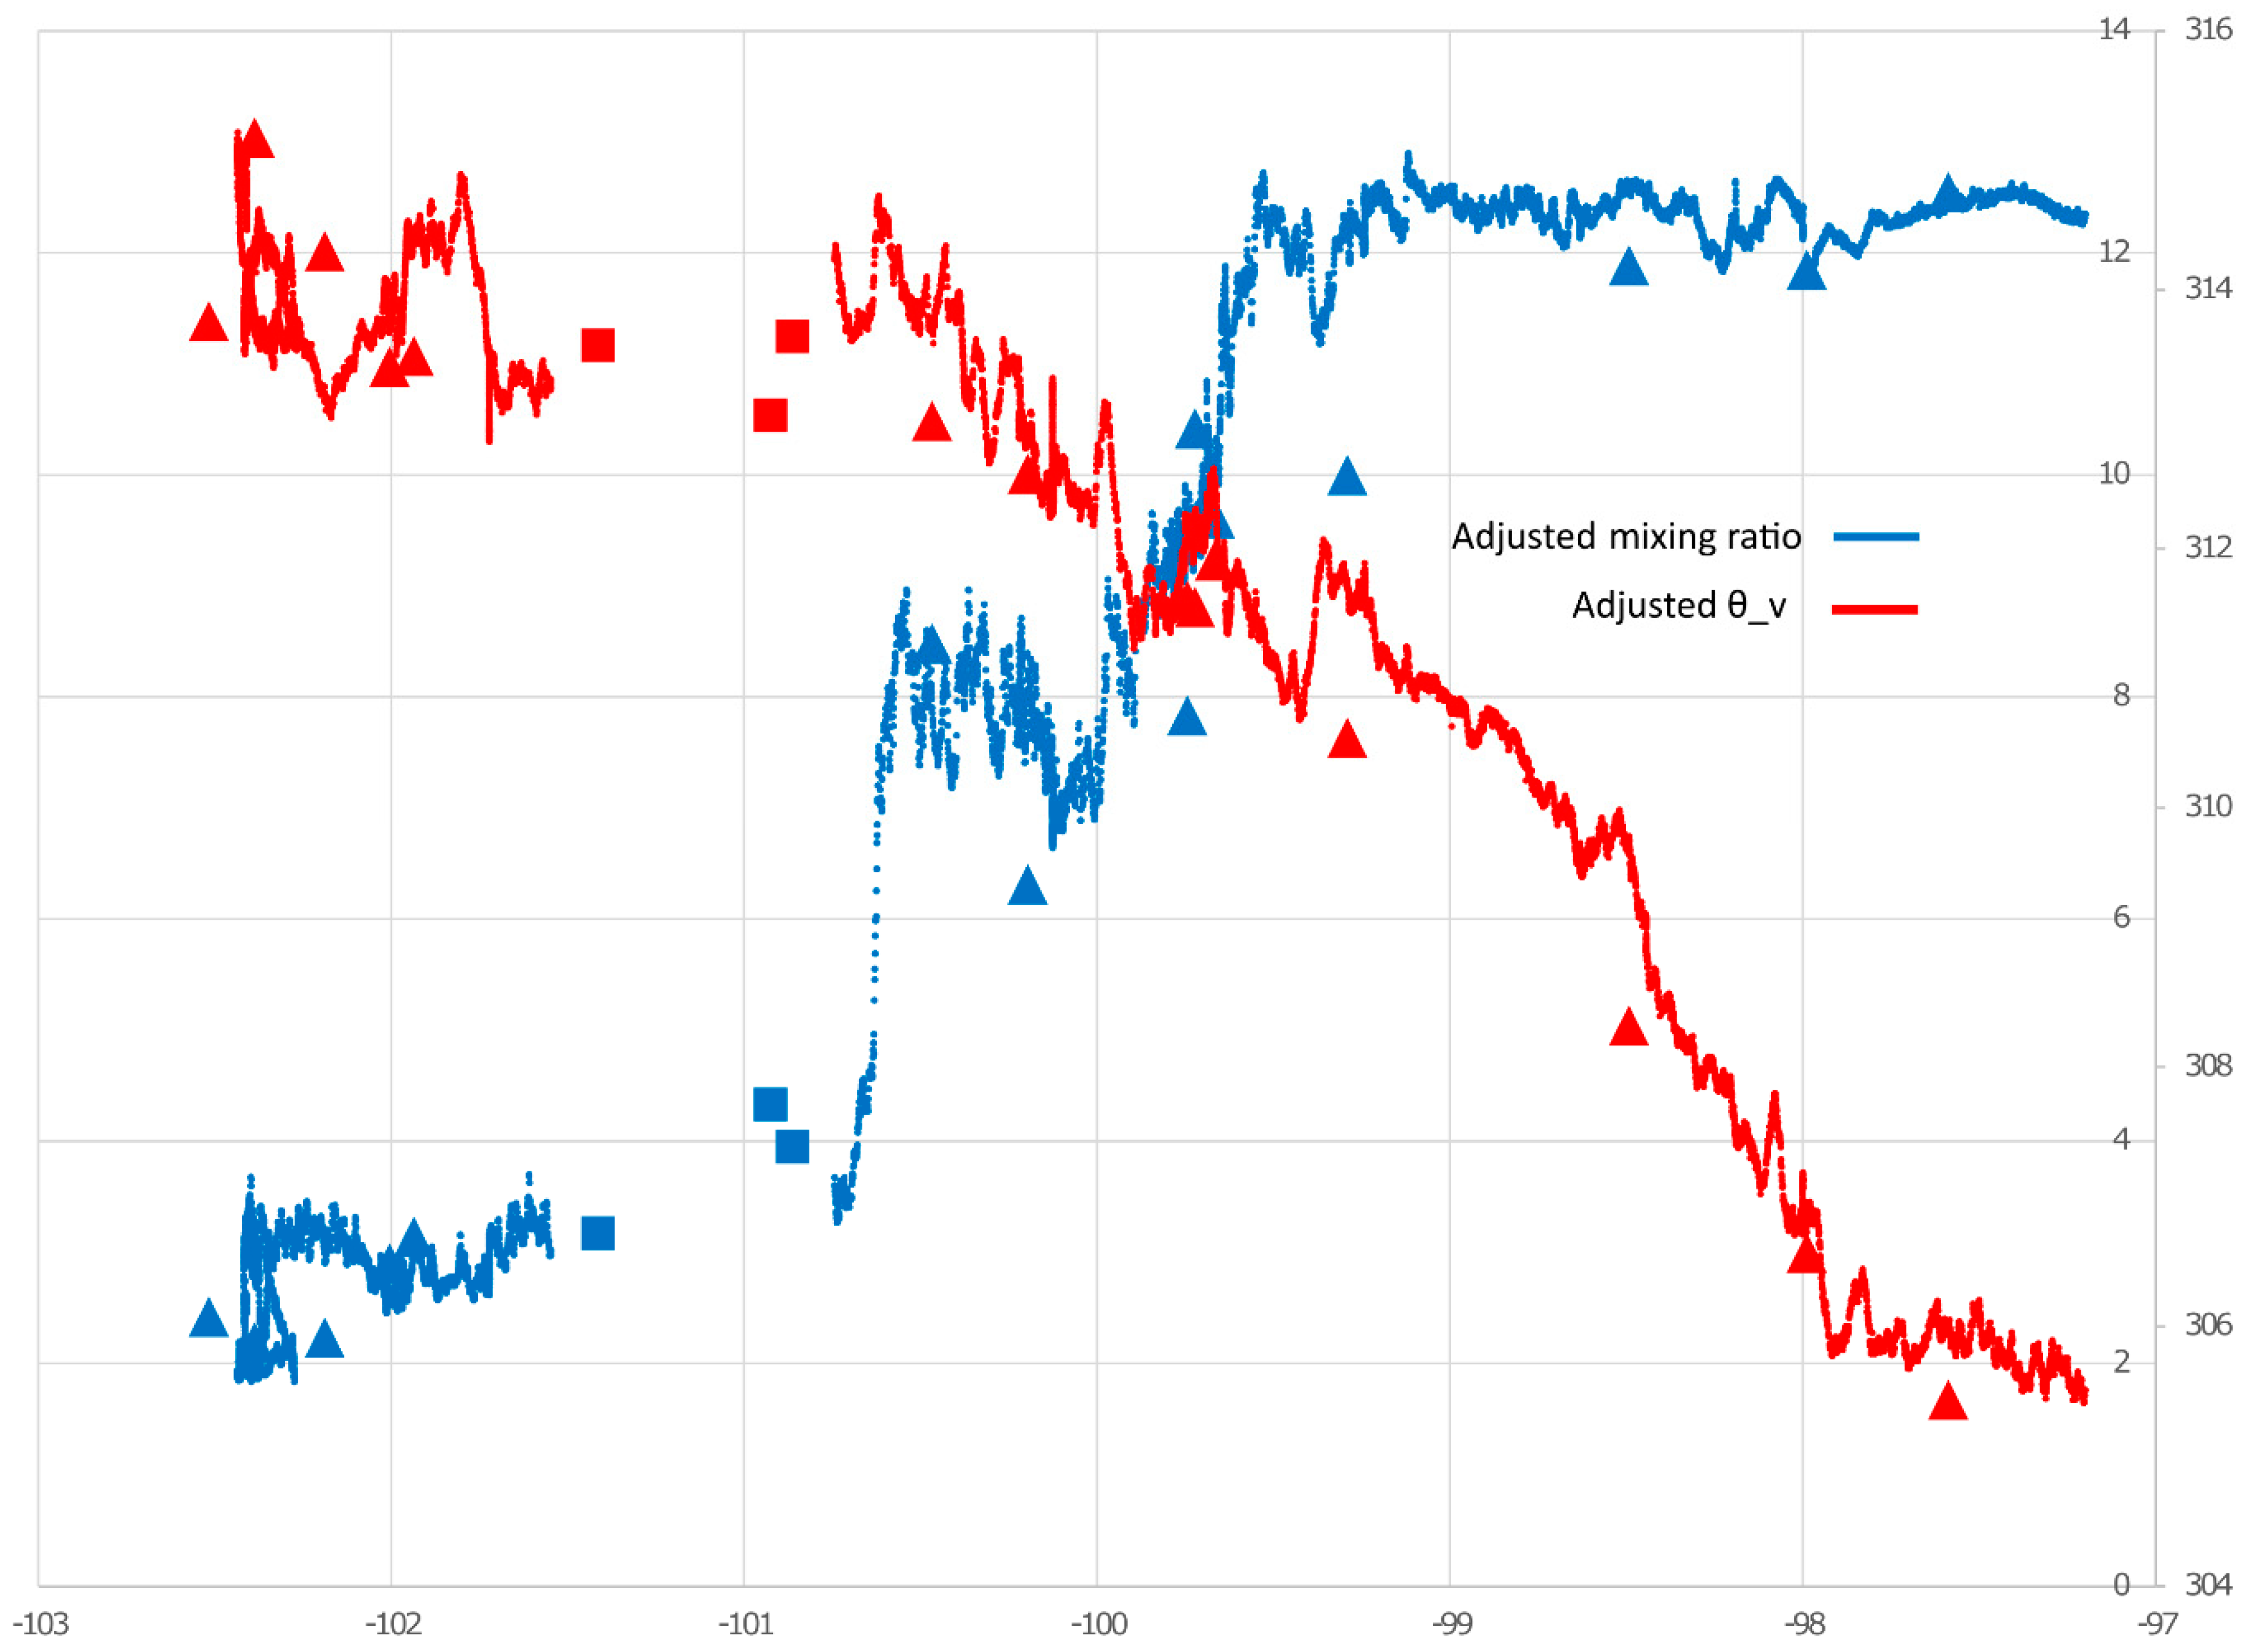
Figure 19.
Mobile observations of mixing ratio (g/kg) vs longitude between Midland (102.2 W) and Carlsbad (104.2 W), adjusted to 1900 UTC. Major “steps” of dryline are circled. Elevation (m) shown in red.
Figure 19.
Mobile observations of mixing ratio (g/kg) vs longitude between Midland (102.2 W) and Carlsbad (104.2 W), adjusted to 1900 UTC. Major “steps” of dryline are circled. Elevation (m) shown in red.

© 2020 by the authors. Licensee MDPI, Basel, Switzerland. This article is an open access article distributed under the terms and conditions of the Creative Commons Attribution (CC BY) license (http://creativecommons.org/licenses/by/4.0/).
Share and Cite
MDPI and ACS Style
White, L.D.; Lu, D. Multi-Scale Transects of Three North American Drylines. Atmosphere 2020, 11, 854. https://doi.org/10.3390/atmos11080854
AMA Style
White LD, Lu D. Multi-Scale Transects of Three North American Drylines. Atmosphere. 2020; 11(8):854. https://doi.org/10.3390/atmos11080854
Chicago/Turabian StyleWhite, Loren D., and Duanjun Lu. 2020. "Multi-Scale Transects of Three North American Drylines" Atmosphere 11, no. 8: 854. https://doi.org/10.3390/atmos11080854
Note that from the first issue of 2016, this journal uses article numbers instead of page numbers. See further details here.