Contribution of Regional PM2.5 Transport to Air Pollution Enhanced by Sub-Basin Topography: A Modeling Case over Central China


Abstract
:
1. Introduction
2. Data and Methods
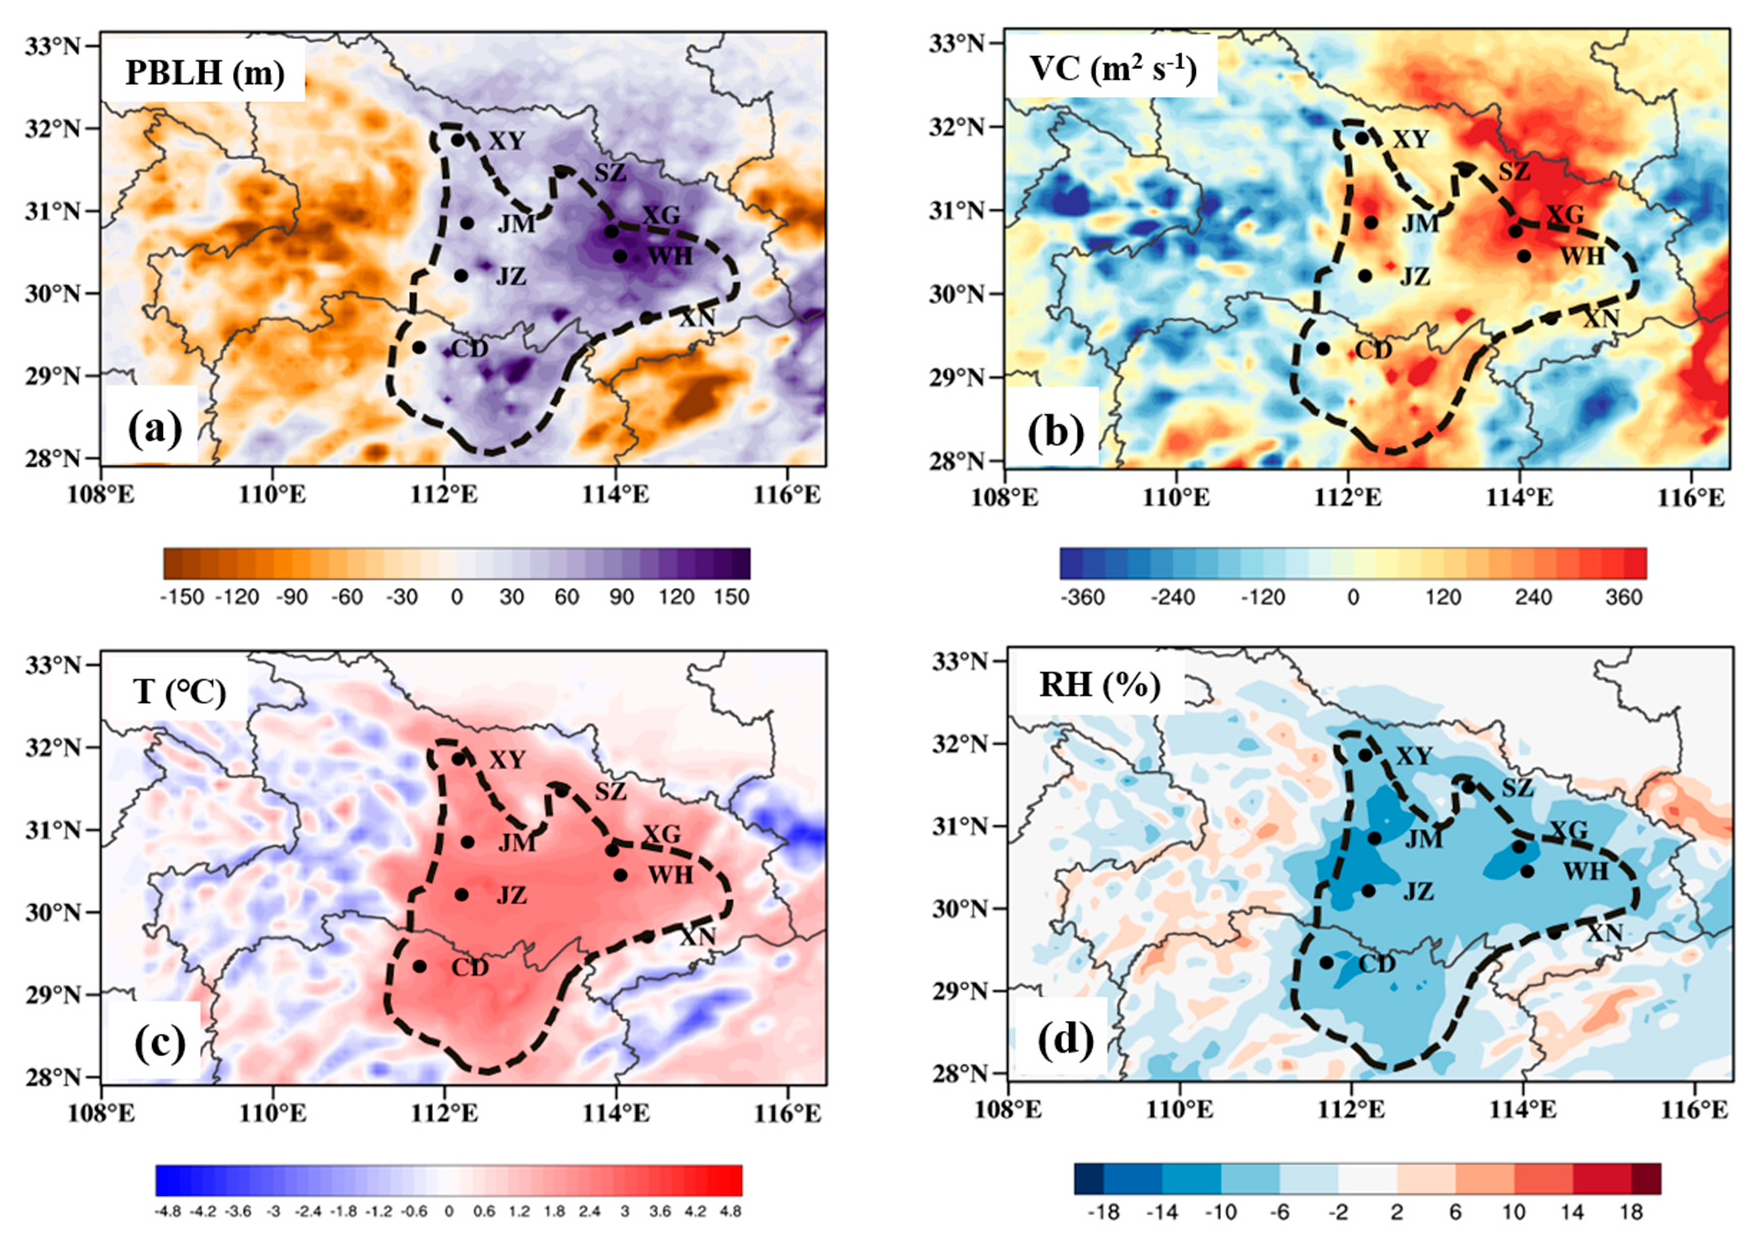
2.1. Data
2.2. Method of Filling the Terrain
2.3. Model Configuration and Validation
2.4. Numerical Experiments
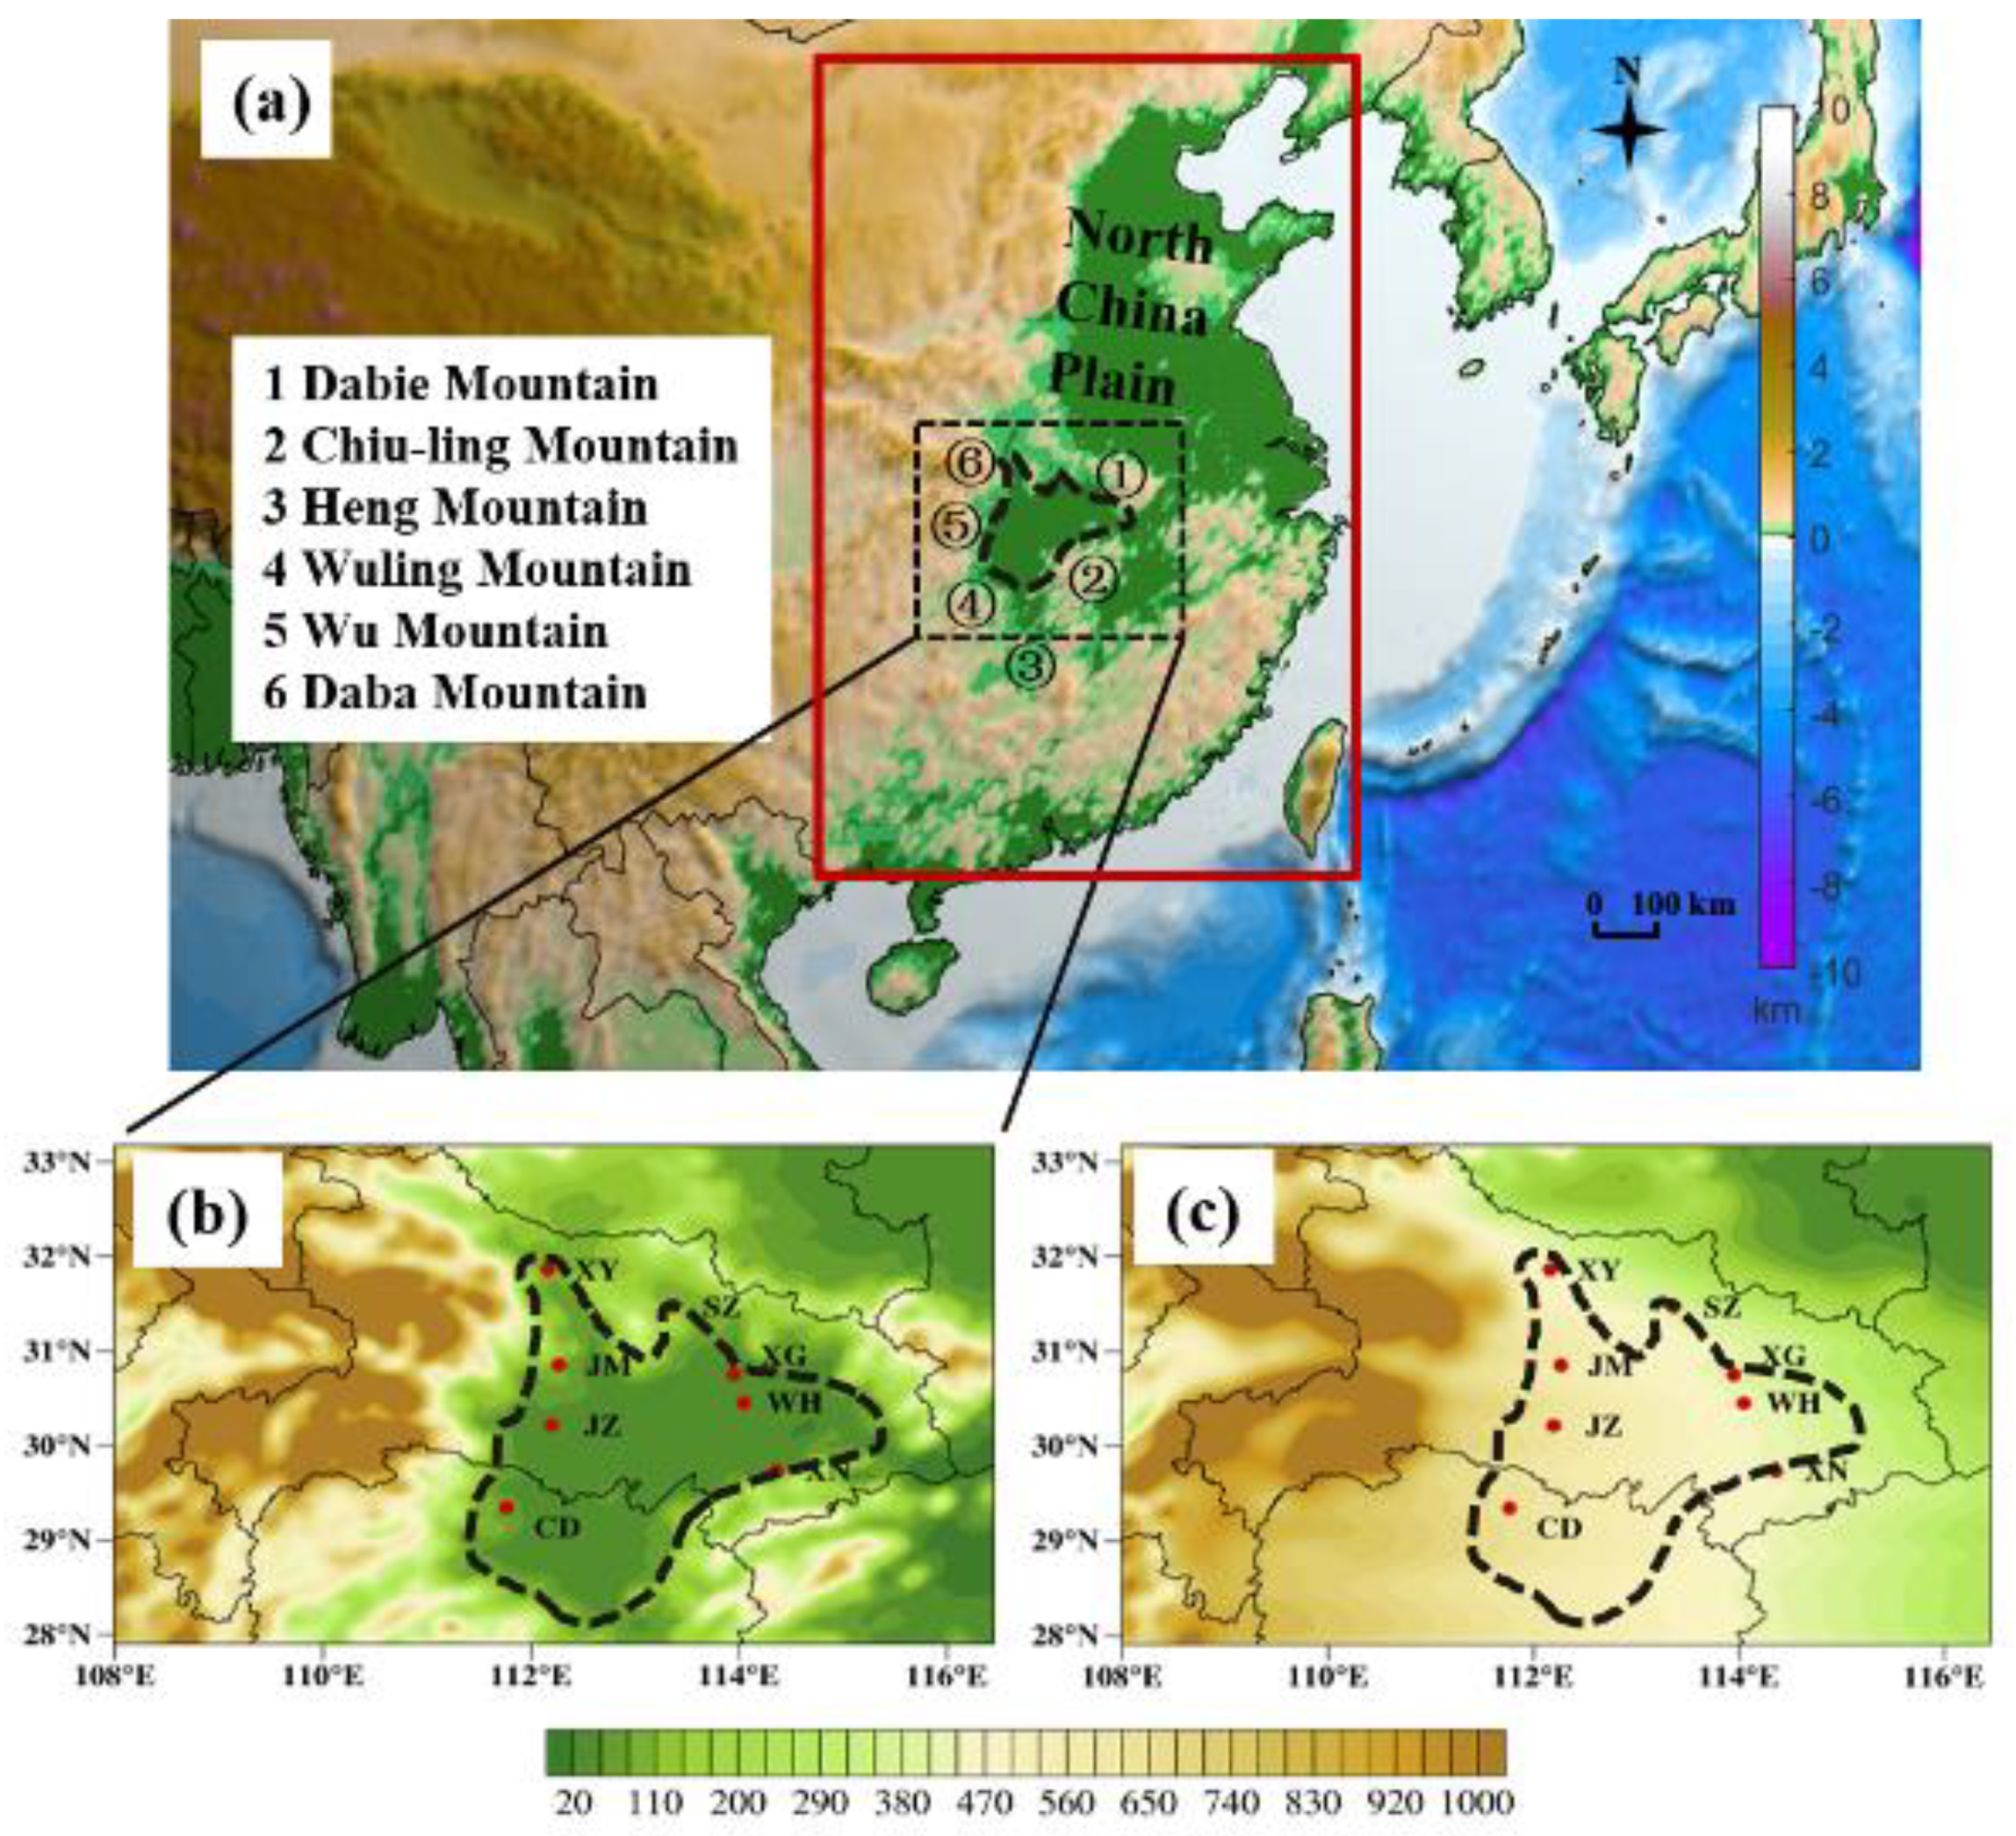
3. Descriptions of a Heavy Air Pollution Episode
4. Results and Discussion
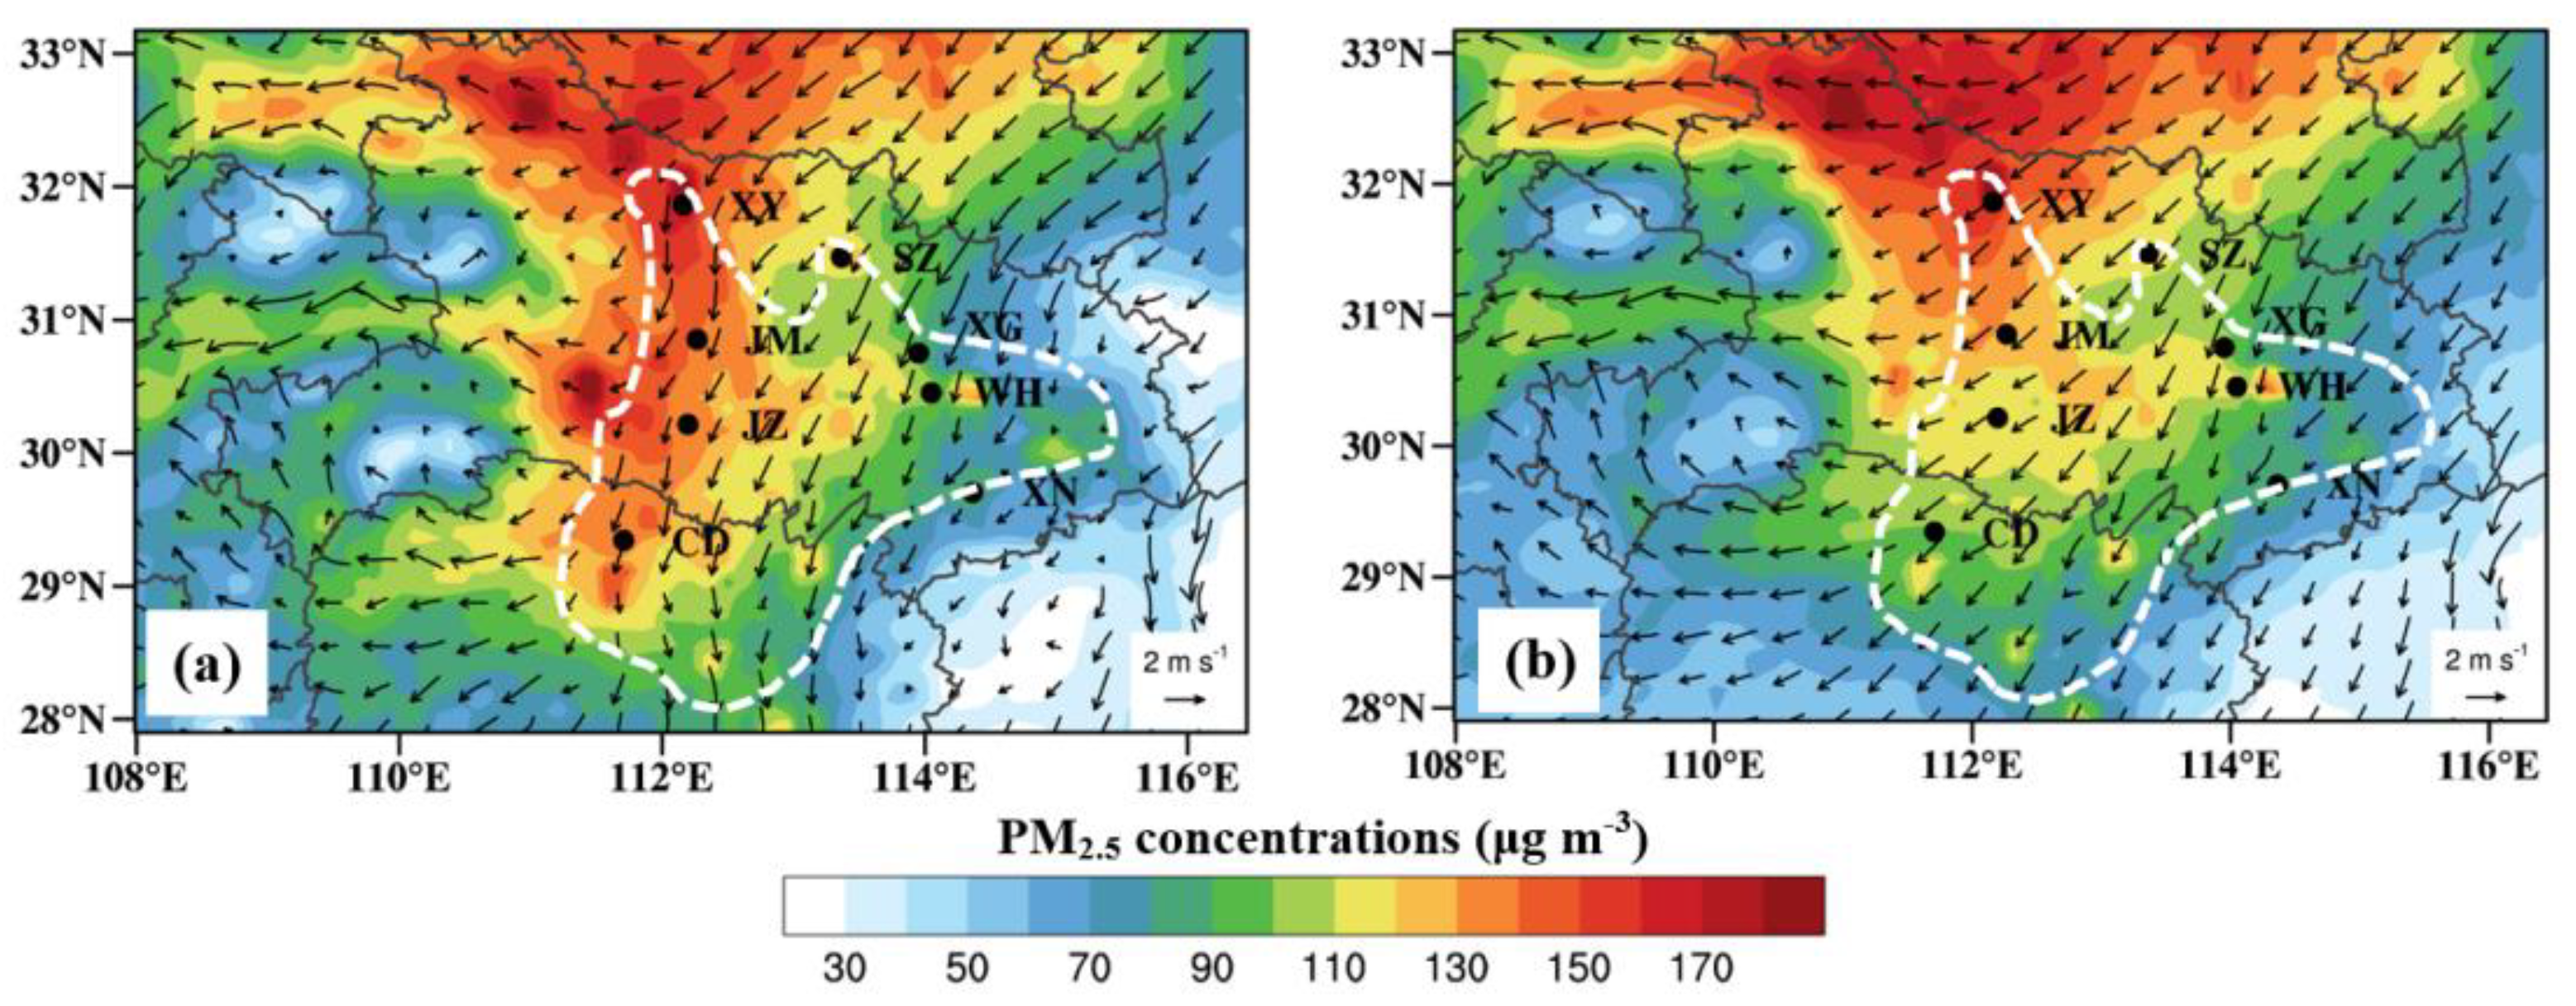
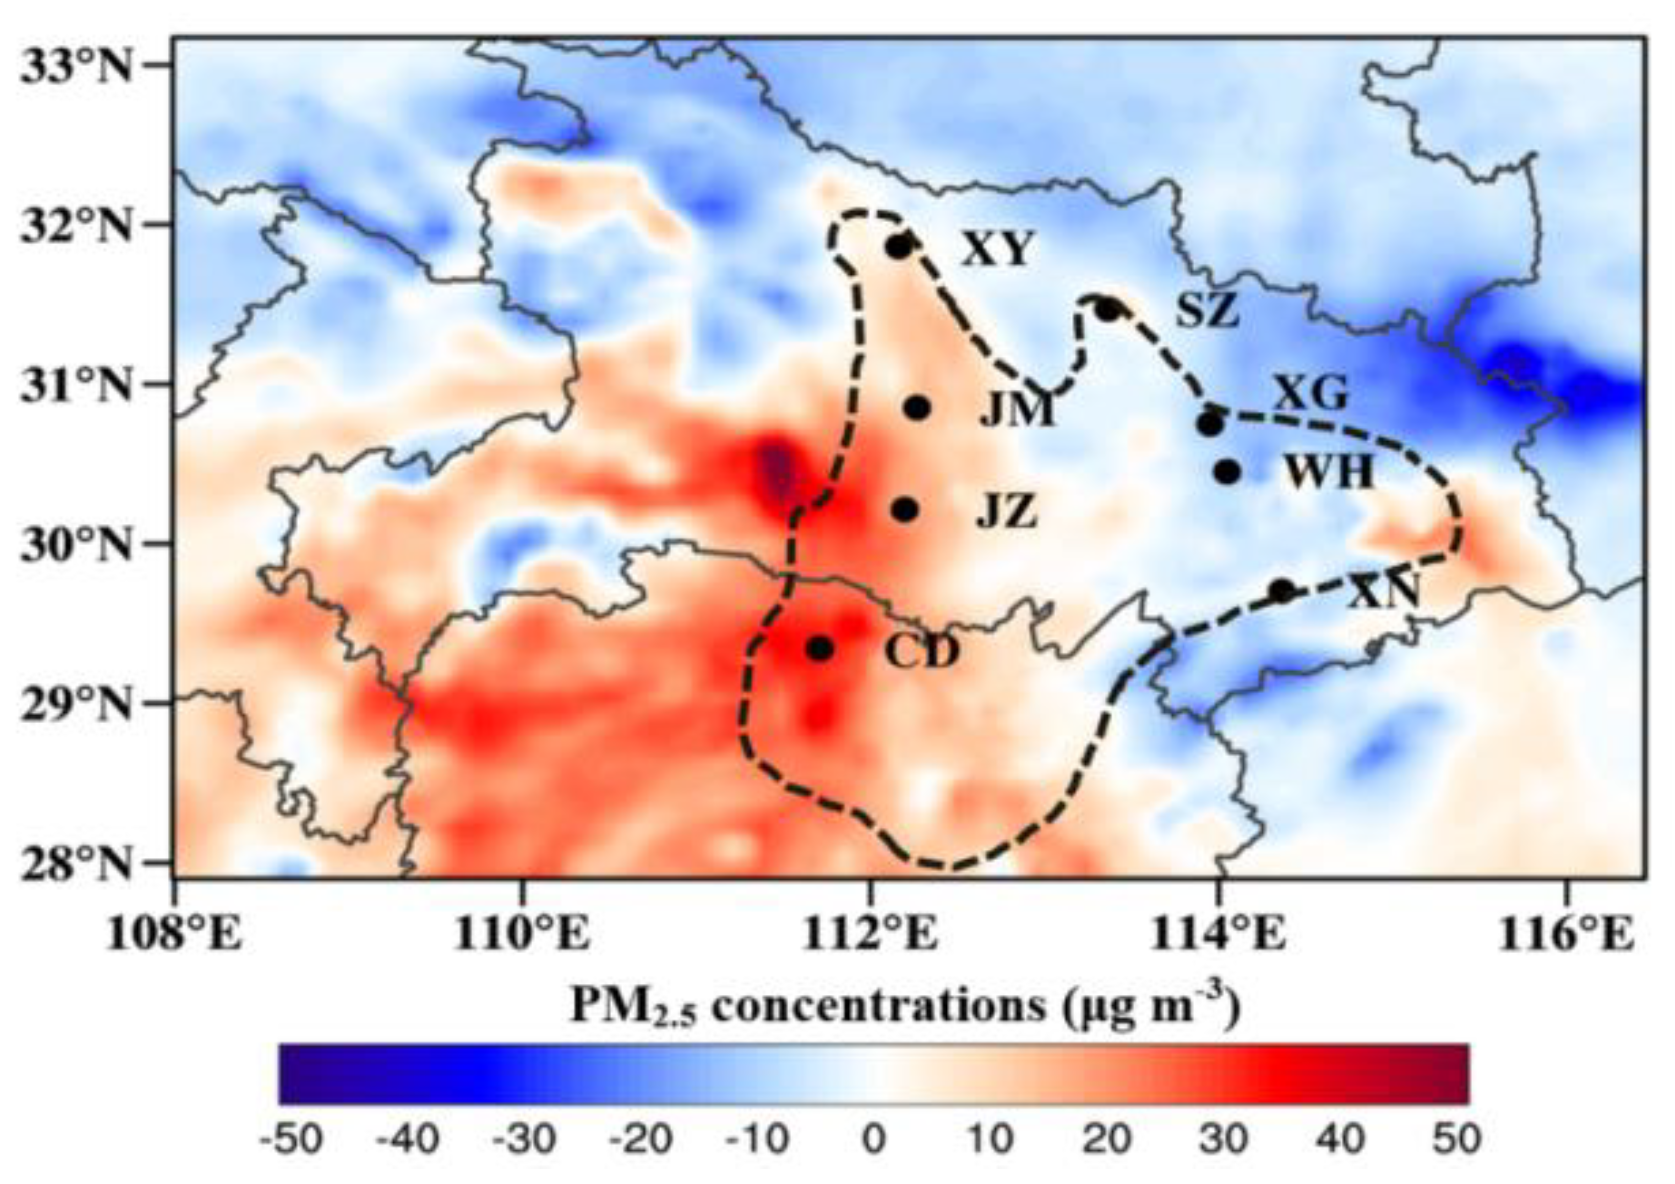
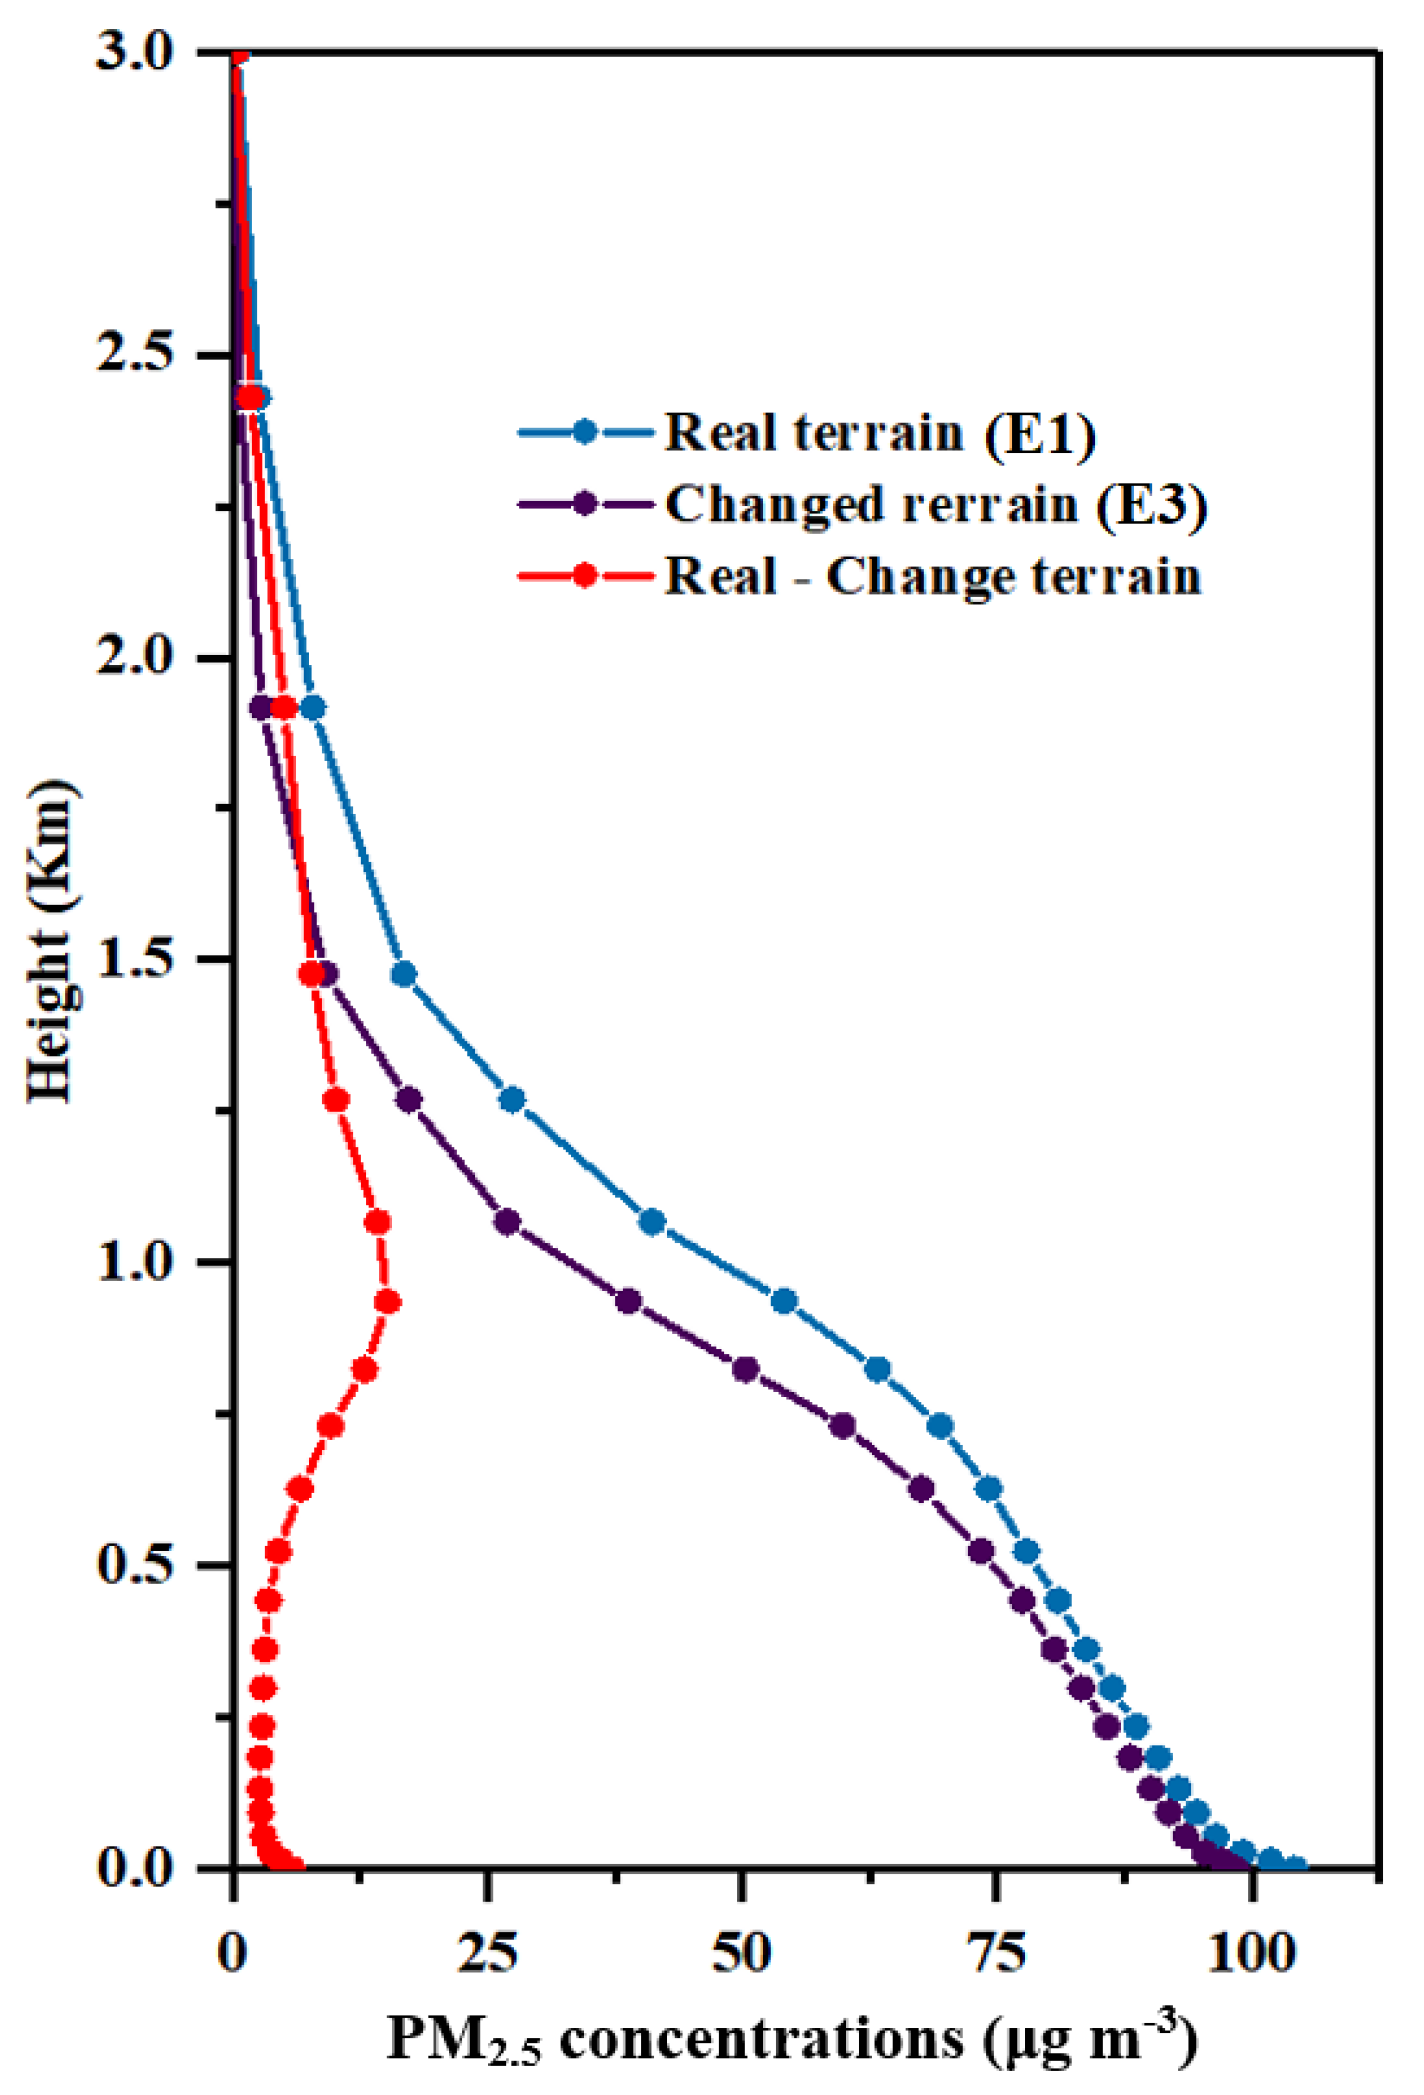
4.1. Topographic Effects on the PM2.5 Change in the THB
4.1.1. Potential Effects on Overall Air Quality to the THB
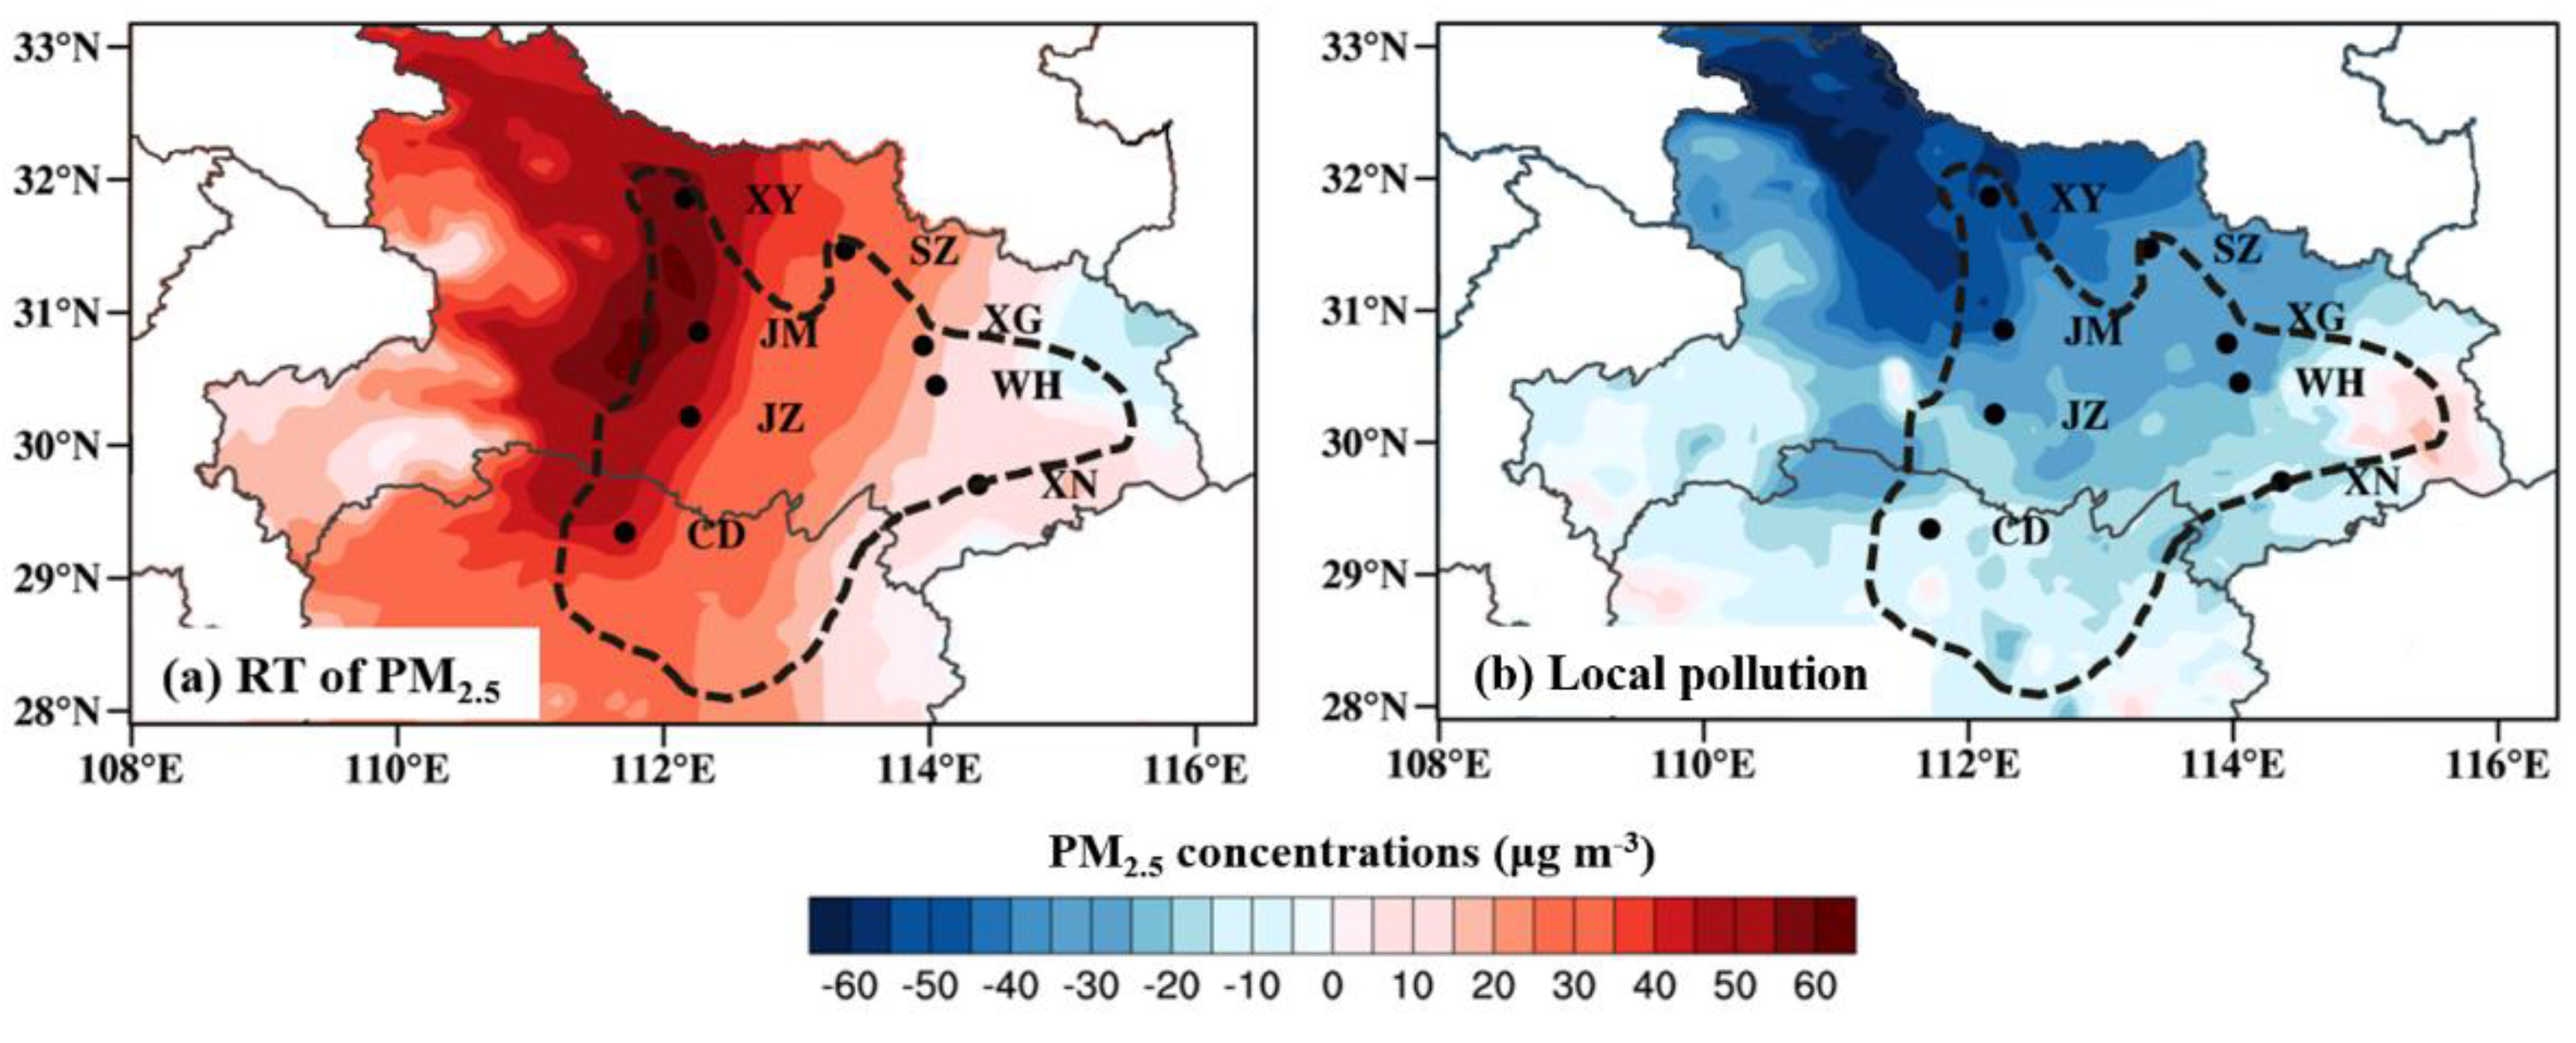
4.1.2. Potential Effects on Regional Transport and Local Pollution of PM2.5 in the THB
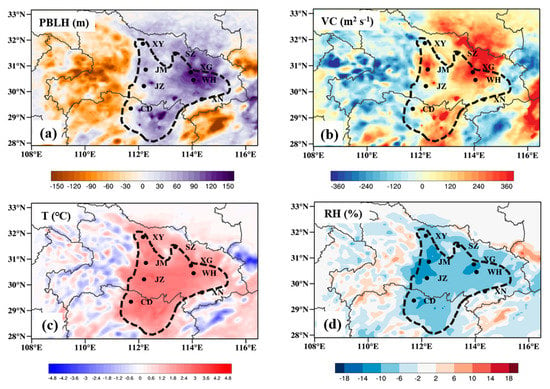
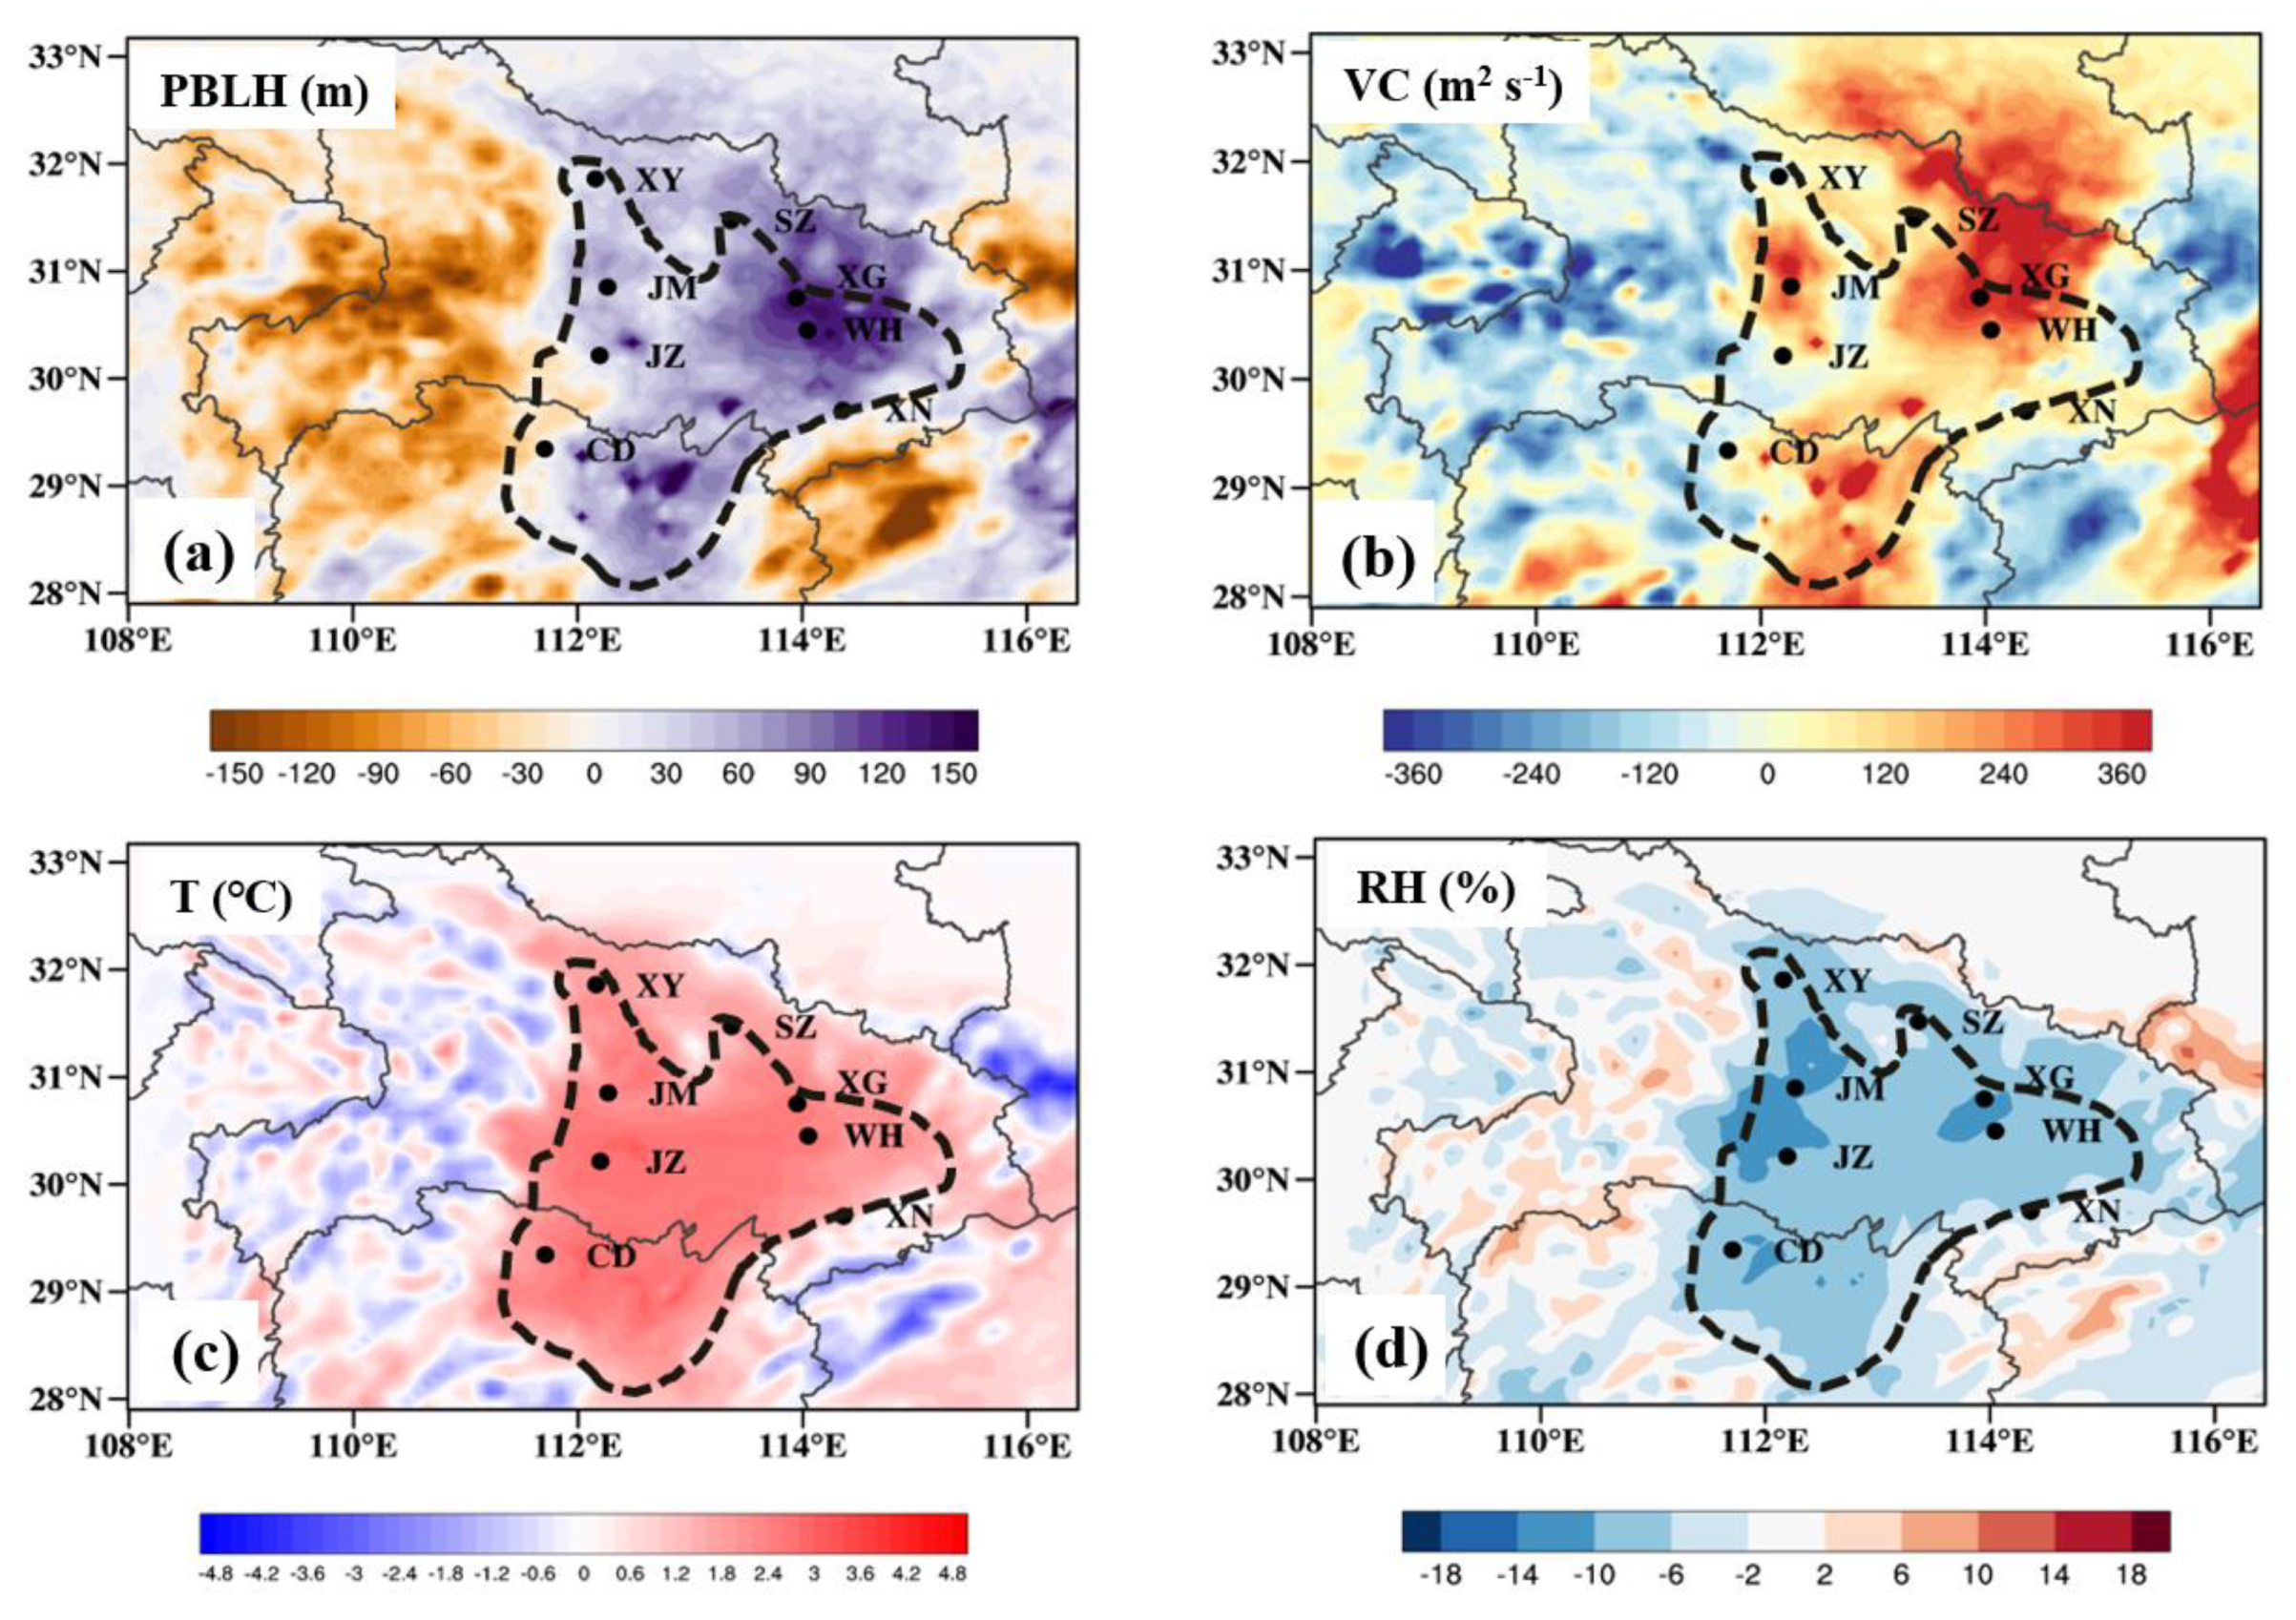
4.2. Underlying Mechanisms of Sub-Basin Terrain Influencing the Air Pollution Event
5. Conclusions
Supplementary Materials
Author Contributions
Funding
Acknowledgments
Conflicts of Interest
Data Availability
References
- Huang, R.J.; Zhang, Y.; Bozzetti, C.; Ho, K.F.; Cao, J.J.; Han, Y.; Daellenbach, K.R.; Slowik, J.G.; Platt, S.M.; Canonaco, F.; et al. High secondary aerosol contribution to particulate pollution during haze events in china. Nature 2014, 514, 218–222. [Google Scholar] [CrossRef] [PubMed] [Green Version]
- Lin, C.Q.; Liu, G.; Lau, A.K.H.; Li, Y.; Li, C.C.; Fung, J.C.H.; Lao, X.Q. High-resolution satellite remote sensing of provincial PM2.5 trends in China from 2001 to 2015. Atmos. Environ. 2018, 180, 110–116. [Google Scholar] [CrossRef]
- Apte, J.S.; Marshall, J.D.; Cohen, A.J.; Brauer, M. Addressing global mortality from ambient PM2.5. Environ. Sci. Technol. 2015, 49, 8057–8066. [Google Scholar] [CrossRef] [PubMed]
- Meng, X.; Zhang, Y.; Yang, K.Q.; Yang, Y.K.; Zhou, X.L. Potential harmful effects of PM2.5 on occurrence and progression of acute coronary syndrome: Epidemiology, mechanisms, and prevention measures. Int. J. Environ. Res. Public Health 2016, 13, 748. [Google Scholar] [CrossRef] [PubMed]
- Zhao, H.; Che, H.; Zhang, X.; Ma, Y.; Wang, Y.; Wang, H.; Wang, Y. Characteristics of visibility and particulate matter (PM) in an urban area of Northeast China. Atmos. Pollut. Res. 2013, 4, 427–434. [Google Scholar] [CrossRef] [Green Version]
- Wang, Y.Q.; Zhang, X.Y.; Sun, J.Y.; Zhang, X.C.; Che, H.Z.; Li, Y. Spatial and temporal variations of the concentrations of PM10, PM2.5 and PM1 in China. Atmos. Chem. Phys. 2015, 15, 13585–13598. [Google Scholar] [CrossRef] [Green Version]
- Huang, Y.; Deng, T.; Li, Z.; Wang, N.; Yin, C.; Wang, S.; Fan, S. Numerical simulations for the sources apportionment and control strategies of PM2.5 over Pearl River Delta, China, part I: Inventory and PM2.5 sources apportionment. Sci. Total Environ. 2018, 634, 1631–1644. [Google Scholar] [CrossRef]
- Liu, B.; Song, N.; Dai, Q.; Mei, R.; Sui, B.; Bi, X.; Feng, Y. Chemical composition and source apportionment of ambient PM2.5 during the non-heating period in Taian, China. Atmos. Res. 2016, 170, 23–33. [Google Scholar] [CrossRef]
- Li, Z.; Lau, W.M.; Ramanathan, V.; Wu, G.; Ding, Y.; Manoj, M.G.; Liu, J.; Qian, Y.; Li, J.; Zhou, T.; et al. Aerosol and monsoon climate interactions over Asia. Rev. Geophys. 2016, 54, 866–929. [Google Scholar] [CrossRef]
- Rosenfeld, D.; Sherwood, S.; Wood, R.; Donner, L. Climate effects of aerosol-cloud interactions. Science 2014, 343, 379–380. [Google Scholar] [CrossRef]
- Gui, K.; Che, H.; Wang, Y.; Wang, H.; Zhang, L.; Zhao, H.; Zheng, Y.; Sun, T.; Zhang, X. Satellite-derived PM2.5 concentration trends over Eastern China from 1998 to 2016: Relationships to emissions and meteorological parameters. Environ. Pollut. 2019, 247, 1125–1133. [Google Scholar] [CrossRef] [PubMed]
- Zhang, L.; Zhao, T.; Gong, S.; Kong, S.; Tang, L.; Liu, D.; Wang, Y.; Jin, L.; Shan, Y.; Tan, C.; et al. Updated emission inventories of power plants in simulating air quality during haze periods over East China. Atmos. Chem. Phys. 2018, 18, 2065–2079. [Google Scholar] [CrossRef] [Green Version]
- Zhang, X.; Zhong, J.; Wang, J.; Wang, Y.; Liu, Y. The interdecadal worsening of weather conditions affecting aerosol pollution in the Beijing area in relation to climate warming. Atmos. Chem. Phys. 2018, 18, 5991–5999. [Google Scholar] [CrossRef] [Green Version]
- Xu, X.; Wang, Y.; Zhao, T.; Cheng, X.; Meng, Y.; Ding, G. “Harbor” effect of large topography on haze distribution in eastern China and its climate modulation on decadal variations in haze. Chin. Sci. Bull. 2015, 60, 1132–1143. [Google Scholar]
- Zhong, J.; Zhang, X.; Dong, Y.; Wang, Y.; Liu, C.; Wang, J.; Zhang, Y.; Che, H. Feedback effects of boundary-layer meteorological factors on cumulative explosive growth of PM2.5 during winter heavy pollution episodes in Beijing from 2013 to 2016. Atmos. Chem. Phys. 2018, 18, 247. [Google Scholar] [CrossRef] [Green Version]
- Cao, Z.; Sheng, L.; Liu, Q.; Yao, X.; Wang, W. Interannual increase of regional haze-fog in North China Plain in summer by intensified easterly winds and orographic forcing. Atmos. Environ. 2015, 122, 154–162. [Google Scholar]
- Zhao, H.; Che, H.; Zhang, L.; Gui, K.; Ma, Y.; Wang, Y.; Wang, H.; Zheng, Y.; Zhang, X. How aerosol transport from the North China plain contributes to air quality in northeast China. Sci. Total Environ. 2020, 738, 139555. [Google Scholar] [CrossRef]
- Hua, Y.; Cheng, Z.; Wang, S.; Jiang, J.; Chen, D.; Cai, S.; Fu, X.; Fu, Q.; Chen, C.; Xu, B.; et al. Characteristics and source apportionment of PM2.5 during a fall heavy haze episode in the Yangtze River Delta of China. Atmos. Environ. 2015, 123, 380–391. [Google Scholar] [CrossRef]
- Wang, M.; Cao, C.; Li, G.; Singh, R.P. Analysis of a severe prolonged regional haze episode in the Yangtze River Delta, China. Atmos. Environ. 2015, 102, 112–121. [Google Scholar] [CrossRef]
- Deng, X.; Tie, X.; Wu, D.; Zhou, X.; Bi, X.; Tan, H.; Li, F.; Jiang, C. Long-term trend of visibility and its characterizations in the Pearl River Delta (PRD) region, China. Atmos. Environ. 2008, 42, 1424–1435. [Google Scholar] [CrossRef]
- Wang, X.; Chen, W.; Chen, D.; Wu, Z.; Fan, Q. Long-term trends of fine particulate matter and chemical composition in the Pearl River Delta Economic Zone (PRDEZ), China. Front. Environ. Sci. Eng. 2016, 10, 53–62. [Google Scholar] [CrossRef]
- Liao, T.; Wang, S.; Ai, J.; Gui, K.; Duan, B.; Zhao, Q.; Zhang, X.; Jiang, W.; Sun, Y. Heavy pollution episodes, transport pathways and potential sources of PM2.5 during the winter of 2013 in Chengdu (China). Sci. Total Environ. 2017, 584–585, 1056–1065. [Google Scholar] [CrossRef] [PubMed]
- Wang, J.; Zhao, B.; Wang, S.; Yang, F.; Xing, J.; Morawska, L.; Ding, A.; Kulmala, M.; Kerminen, V.-M.; Kujansuu, J.; et al. Particulate matter pollution over China and the effects of control policies. Sci. Total Environ. 2017, 584–585, 426447. [Google Scholar]
- Ning, G.; Wang, S.; Ma, M.; Ni, C.; Shang, Z.; Wang, J.; Li, J. Characteristics of air pollution in different zones of Sichuan Basin, China. Sci. Total Environ. 2018, 612, 975–984. [Google Scholar] [CrossRef]
- Chen, Z.; Chen, D.; Zhao, C.; Kwan, M.; Cai, J.; Zhuang, Y.; Zhao, B.; Wang, X.; Chen, B.; Xu, B. Influence of meteorological conditions on PM2.5 concentrations across China: A review of methodology and mechanism. Environ. Int. 2020, 139, 105558. [Google Scholar] [CrossRef]
- Qiu, J. Fight against smog ramps up. Nature 2014, 506, 273–274. [Google Scholar] [CrossRef] [Green Version]
- Zhang, Q.; He, K.; Huo, H. Policy: Cleaning China’s air. Nature 2012, 484, 161–162. [Google Scholar] [CrossRef]
- Ren, C.; Yang, R.; Cheng, C.; Xing, P.; Fang, X.; Zhang, S.; Wang, H.; Shi, Y.; Zhang, X.; Kwok, Y.T.; et al. Creating breathing cities by adopting urban ventilation assessment and wind corridor plan—The implementation in Chinese cities. J. Wind Eng. Ind. Aerod. 2018, 182, 170–188. [Google Scholar] [CrossRef]
- Yuan, C.; Ng, E.; Norford, L.K. Improving air quality in high-density cities by understanding the relationship between air pollutant dispersion and urban morphologies. Build Environ. 2014, 71, 245–258. [Google Scholar] [CrossRef]
- Xu, X.; Zhao, T.; Liu, F.; Gong, S.L.; Kristovich, D.; Lu, C.; Guo, Y.; Cheng, X.; Wang, Y.; Ding, G. Climate modulation of the Tibetan Plateau on haze in China. Atmos. Chem. Phys. 2016, 16, 1365–1375. [Google Scholar] [CrossRef] [Green Version]
- Zhang, L.; Guo, X.; Zhao, T.; Gong, S.; Xu, X.; Li, Y.; Luo, L.; Gui, K.; Wang, H.; Zheng, Y.; et al. A modeling study of the terrain effects on haze pollution in the Sichuan Basin. Atmo. Environ. 2019, 196, 77–85. [Google Scholar] [CrossRef]
- Hu, X.-M.; Ma, Z.; Lin, W.; Zhang, H.; Hu, J.; Wang, Y.; Xu, X.; Fuentes, J.D.; Xue, M. Impact of the Loess Plateau on the atmospheric boundary layer structure and air quality in the North China Plain: A case study. Sci. Total Environ. 2014, 499, 228–237. [Google Scholar] [CrossRef] [PubMed]
- Jazcilevich, A.D.; García, A.R.; Caetano, E. Locally induced surface air confluence by complex terrain and its effects on air pollution in the valley of Mexico. Atmos. Environ. 2005, 39, 5481–5489. [Google Scholar] [CrossRef]
- Shen, L.; Wang, H.; Zhao, T.; Liu, J.; Bai, Y.; Kong, S.; Shu, Z. Characterizing regional aerosol pollution in central China based on 19 years of MODIS data: Spatiotemporal variation and aerosol type discrimination. Environ. Pollut. 2020, 263. [Google Scholar] [CrossRef]
- Ding, Y. Monsoons over China; Springer Science & Business Media: Berlin, Germany, 1994. [Google Scholar]
- Bezděk, A.; Sebera, J. Matlab script for 3D visualizing geodata on a rotating globe. Comput. Geosci. 2013, 56, 127–130. [Google Scholar] [CrossRef]
- Grell, G.A.; Peckham, S.E.; Schmitz, R.; McKeen, S.A.; Frost, G.; Skamarock, W.C.; Eder, B. Fully coupled “online” chemistry within the WRF model. Atmos. Environ. 2005, 39, 6957–6975. [Google Scholar] [CrossRef]
- Lin, Y.-L.; Farley, R.D.; Orville, H.D. Bulk Parameterization of the Snow Field in a Cloud Model. J. Clim. Appl. Meteorol. 1983, 22, 1065–1092. [Google Scholar] [CrossRef] [Green Version]
- Mlawer, E.J.; Taubman, S.J.; Brown, P.D.; Iacono, M.J.; Clough, S.A. Radiative transfer for inhomogeneous atmospheres: RRTM, a validated correlated-k model for the longwave. J. Geophys. Res. Atmos. 1997, 102, 16663–16682. [Google Scholar] [CrossRef] [Green Version]
- Chou, M.D.; Suarez, M.J.; Ho, C.H.; Yan, M.M.H.; Lee, K.T. Parameterizations for Cloud Overlapping and Shortwave Single-Scattering Properties for Use in General Circulation and Cloud Ensemble Models. J. Clim. 1998, 11, 202–214. [Google Scholar] [CrossRef]
- Hong, S.-Y.; Noh, Y.; Dudhia, J. A New Vertical Diffusion Package with an Explicit Treatment of Entrainment Processes. Mon. Weather Rev. 2006, 134, 2318–2341. [Google Scholar] [CrossRef] [Green Version]
- Tewari, M.; Chen, F.; Wang, W.; Dudhia, J.; Lemone, M.A.; Mitchell, K.; Ek, M.; Gayno, G.; Wegiel, J.; Cuenca, R.H. Implementation and verification of the unified NOAH land surface model in the WRF model. In Proceedings of the conference on Weather Analysis and Forecasting/conference on Numerical Weather Prediction, American Meteorological Society, Seattle, WA, USA, 14 January 2014. [Google Scholar]
- Zaveri, R.A.; Peters, L.K. A new lumped structure photochemical mechanism for large-scale applications. J. Geophys. Res. 1999, 104, 30387. [Google Scholar] [CrossRef]
- Zaveri, R.A.; Easter, R.C.; Fast, J.D.; Peters, L.K. Model for Simulating Aerosol Interactions and Chemistry (MOSAIC). J. Geophys. Res. 2008, 113, D13204. [Google Scholar] [CrossRef]
- Hu, W.; Zhao, T.; Bai, Y.; Kong, S.; Xiong, J.; Sun, X.; Yang, Q.; Gu, Y.; Lu, H. Importance of Regional PM2.5 Transport and Precipitation Washout in Heavy Air Pollution in the Twain-Hu Basin over Central China: Observational Analysis and WRF-Chem Simulation. Science of the Total Environment. 2020. Available online: https://doi.org/10.1016/j.scitotenv.2020.143710 (accessed on 20 November 2020).
- Sun, Y.; Wang, Z.; Fu, P.; Jiang, Q.; Yang, T.; Li, J.; Ge, X. The impact of relative humidity on aerosol composition and evolution processes during wintertime in Beijing, China. Atmos. Environ. 2013, 77, 927–934. [Google Scholar] [CrossRef]


| Variables | R | RMSE | MB | NMB (%) |
|---|---|---|---|---|
| T2 (K) | 0.79 | 1.09 | 1.43 | 1.16 |
| RH (%) | 0.85 | 7.62 | −6.71 | −7.51 |
| SLP (hPa) | 0.93 | 1.35 | −1.20 | −0.12 |
| WS10 (m s−1) | 0.68 | 0.27 | 0.06 | 3.18 |
| PM2.5 (μg m−3) | 0.80 | 27.21 | −6.39 | −6.05 |
| Experiments | Description |
|---|---|
| E1 | Base case |
| E2 | CE with closing all anthropogenic emissions over the THB |
| E3 | CE with filling topography of the THB |
| E4 | FHE with closing all anthropogenic emissions over the THB |
Publisher’s Note: MDPI stays neutral with regard to jurisdictional claims in published maps and institutional affiliations. |
© 2020 by the authors. Licensee MDPI, Basel, Switzerland. This article is an open access article distributed under the terms and conditions of the Creative Commons Attribution (CC BY) license (http://creativecommons.org/licenses/by/4.0/).
Share and Cite
Hu, W.; Zhao, T.; Bai, Y.; Shen, L.; Sun, X.; Gu, Y. Contribution of Regional PM2.5 Transport to Air Pollution Enhanced by Sub-Basin Topography: A Modeling Case over Central China. Atmosphere 2020, 11, 1258. https://doi.org/10.3390/atmos11111258
Hu W, Zhao T, Bai Y, Shen L, Sun X, Gu Y. Contribution of Regional PM2.5 Transport to Air Pollution Enhanced by Sub-Basin Topography: A Modeling Case over Central China. Atmosphere. 2020; 11(11):1258. https://doi.org/10.3390/atmos11111258
Chicago/Turabian StyleHu, Weiyang, Tianliang Zhao, Yongqing Bai, Lijuan Shen, Xiaoyun Sun, and Yao Gu. 2020. "Contribution of Regional PM2.5 Transport to Air Pollution Enhanced by Sub-Basin Topography: A Modeling Case over Central China" Atmosphere 11, no. 11: 1258. https://doi.org/10.3390/atmos11111258