Article

Overshooting Subcellular Redox-Responses in Rett-Mouse Hippocampus during Neurotransmitter Stimulation

1
Zentrum Physiologie und Pathophysiologie, Institut für Neuro- und Sinnesphysiologie, Georg-August-Universität Göttingen, Universitätsmedizin Göttingen, Humboldtallee 23, D-37073 Göttingen, Germany
2
Klinik für Neurologie, Georg-August-Universität Göttingen, Universitätsmedizin Göttingen, Robert-Koch Straße 40, D-37075 Göttingen, Germany
*
Author to whom correspondence should be addressed.
These authors contributed equally to this work.
Cells 2020, 9(12), 2539; https://doi.org/10.3390/cells9122539
Submission received: 30 September 2020 / Revised: 16 November 2020 / Accepted: 22 November 2020 / Published: 24 November 2020
(This article belongs to the Special Issue Redox Signaling in Health and Disease)

Abstract

:
Rett syndrome (RTT) is a neurodevelopmental disorder associated with disturbed neuronal responsiveness and impaired neuronal network function. Furthermore, mitochondrial alterations and a weakened cellular redox-homeostasis are considered part of the complex pathogenesis. So far, overshooting redox-responses of MeCP2-deficient neurons were observed during oxidant-mediated stress, hypoxia and mitochondrial inhibition. To further clarify the relevance of the fragile redox-balance for the neuronal (dys)function in RTT, we addressed more physiological stimuli and quantified the subcellular redox responses to neurotransmitter-stimulation. The roGFP redox sensor was expressed in either the cytosol or the mitochondrial matrix of cultured mouse hippocampal neurons, and the responses to transient stimulation by glutamate, serotonin, dopamine and norepinephrine were characterized. Each neurotransmitter evoked more intense oxidizing responses in the cytosol of MeCP2-deficient than in wildtype neurons. In the mitochondrial matrix the neurotransmitter-evoked oxidizing changes were more moderate and more uniform among genotypes. This identifies the cytosol as an important reactive oxygen species (ROS) source and as less stably redox buffered. Fura-2 imaging and extracellular Ca2+ withdrawal confirmed cytosolic Ca2+ transients as a contributing factor of neurotransmitter-induced redox responses and their potentiation in the cytosol of MeCP2-deficient neurons. Chemical uncoupling demonstrated the involvement of mitochondria. Nevertheless, cytosolic NADPH- and xanthine oxidases interact to play the leading role in the neurotransmitter-mediated oxidizing responses. As exaggerated redox-responses were already evident in neonatal MeCP2-deficient neurons, they may contribute remarkably to the altered neuronal network performance and the disturbed neuronal signaling, which are among the hallmarks of RTT.

1. Introduction

Rett syndrome (RTT) is a progressive neurodevelopmental disorder, affecting females with a prevalence of about 1:15,000 live births worldwide [1,2]. Stereotypic hand movements, motor dysfunction, microcephaly, rapid regression, loss of speech, cognitive impairment, epilepsy as well as breathing irregularities, are among the main characteristics of RTT. Due to the delayed postnatal manifestation of these symptoms and the initial apparently normal development for up to 18 months after birth, an immediate diagnosis of RTT is often challenging [3,4,5,6]. Nevertheless, even during the initial development first indications of the disease may be evident [7,8].
The primary genetic origins of RTT are spontaneous mutations in the X-linked methyl-CpG-binding protein 2 (MECP2) gene, which were confirmed for ~95% of the typical RTT cases [9]. Meanwhile, hundreds of different MECP2 mutations were identified, which result in a broad severity range of clinical phenotypes and severities [10,11]. Since MeCP2 acts as a transcriptional regulator, directly controlling the activity of various genes, it plays a crucial role in neuronal development, neuronal differentiation and synaptic plasticity [3,12,13,14,15,16]. Although neither gliosis, demyelization nor an obvious neurodegeneration have ever been reported in RTT, analyses of post mortem brain tissue of Rett patients revealed a decreased size of various brain regions such as hippocampus, cortex, thalamus, basal ganglia and amygdala [17,18]. On the cellular level, a reduced dendritic complexity as well as more intensely packed neurons are evident in the cerebral tissue of Rett patients and mouse models of RTT [19,20].
These alterations are accompanied by dysregulated and imbalanced neurotransmitter systems. RTT involves not only lowered levels of dopamine [21,22,23,24,25] and serotonin [26], but also cholinergic deficiencies as well as reduced norepinephrine levels were reported [27,28,29]. In contrast, increased levels of potentially neurotoxic glutamate have been detected in the cerebrospinal fluid of female Rett patients [30,31]. Furthermore, neuropeptides are affected. In the cerebrospinal fluid of RTT patients, the levels of nerve growth factor and substance P were significantly lower than in control subjects [32,33,34,35], whereas endorphin levels were increased [36]. The reduced substance P and serotonin levels, in concert with impaired neurotrophin signaling, might further disrupt the function of the autonomic nervous system, provoking serious breathing irregularities in RTT [37].
Yet, an altered neurotransmission might also arise from changes in neuronal morphology. RTT is considered a synaptopathy with a reduced degree of cellular interaction and a decreased extent of synaptic connectivity among the excitatory (glutamatergic) cortical pyramidal neurons [18,20]. Studies in RTT mouse models further confirmed that pyramidal neurons exhibit fewer dendritic spines as well as decreased spine sizes, thus receiving less excitatory afferents [20]. The logical consequence of such diminished glutamatergic neurotransmission is an excitatory/inhibitory imbalance and a secondary weakening of neurotransmission, leading to hyperexcitability of the neuronal network and promoting the occurrence of seizures [38,39]. Hippocampal hyperexcitability and synaptic instability have been confirmed for mouse models of RTT [40,41]. In contrast, in cortical circuits, inhibition rather than excitation seems to manifest, giving rise to hypoexcitability [42].
Detailed studies also indicate a pivotal role for mitochondria in plasticity-related mechanisms such as control of neurite outgrowth or neuronal polarity [43,44,45,46]. Since functionally impaired mitochondria may markedly contribute to reactive oxygen species (ROS) formation, they can also be among the causes of altered cellular signaling and disturbed neuronal plasticity [47,48]. Impaired mitochondrial morphology, for example, spherical mitochondria, low-density structure of mitochondrial matrix, rudimentary cristae and abundant ribosomal content, granular matrix inclusions and disorganized membranous material, have been identified in Rett patients [49,50,51]. More importantly, the function and metabolism of mitochondria is also affected in RTT. Data from muscle and frontal cortex biopsies of RTT patients revealed lowered levels of cytochrome c oxidase and succinate cytochrome c reductase together with a proton leak across the inner mitochondrial membrane [52,53,54]. In vitro analyses on MeCP2-deficient hippocampal neurons confirmed a more vulnerable cellular redox balance under baseline control conditions as well as exaggerated redox responses to either acute oxidative challenge, mitochondrial inhibition, or both [55,56]. This redox-imbalance does not only affect neurons but also glial cells [57]. Mechanistically, the redox-imbalance in RTT arises from a combination of increased mitochondrial ROS release, intensified extramitochondrial ROS generation as well as a less efficient cell-endogenous detoxification of oxidants [58,59,60,61].
Among the characteristics of RTT is that it is not associated with a marked neurodegeneration [62], but rather with a miscommunication of neuronal elements, disturbed synaptic functions and alterations in neuronal excitability [3,63]. To determine to what extent neuronal communication and interactions may challenge the fragile cellular redox-balance and redox-homeostasis, we characterized the (sub)cellular redox-responses resulting from specific neurotransmitter stimulation of cultured hippocampal neurons and defined the respective alterations in Mecp2−/y mice as compared to WT mice.

2. Material and Methods

2.1. Mouse Model for RTT

The “Bird strain” mouse model (Mecp2tm1.1Bird) was used, which lacks exons 3 and 4 of the Mecp2 gene and shows a complete loss of function of MeCP2 [64]. MeCP2-deficient male mice (Mecp−/y) develop the characteristic phenotype with hindlimb clasping, growth arrest, breathing irregularities and premature mortality beyond postnatal day 50. The heterozygous female mice of this disease model (Mecp2+/−) exhibit a cellular mosaicism and hence a more variable, less severe phenotype with markedly delayed disease onset [64]. For the sake of controlled and uniform conditions, in other words, the total lack of MeCP2, our cell-based study was therefore performed on male WT and Mecp2−/y mice. Breeding of these mice as well as all in vitro experiments and procedures were in accordance to German national regulations as well as European guidelines for animal welfare, and were approved by the Office of Animal Welfare of the University Medical Center Göttingen as well as by the Lower Saxony State Office for Consumer Protection and Food Safety (file number G16/2177). Foster mice (NMRI strain) were used for maternal care, to improve the stability of our mouse colony.

2.2. Solutions

The majority of chemicals were obtained from Sigma-Aldrich (St. Louis, MO, USA), other vendors are clearly stated. The artificial cerebrospinal fluid (ACSF) served to maintain cellular viability during the optical recordings. It was made of 130 mM NaCl, 3.5 mM KCl, 1.25 mM NaH2PO4, 24 mM NaHCO3, 1.2 mM CaCl2, 1.2 mM MgSO4 as well as 10 mM dextrose, and a pH of 7.4 was maintained by constant aeration with 95% O2 plus 5% CO2 (carbogen). For nominally Ca2+-free solutions, CaCl2 was omitted from the ACSF. Norepinephrine, serotonin, dopamine and allopurinol were added directly to the ACSF in their desired concentrations immediately before use. This is crucial in particular for dopamine and norepinephrine, as these compounds autoxidize easily and may generate extracellular H2O2 [65]. Glutamate (sodium salt) was prepared as aqueous stock solutions of 5 mM, and kept frozen (−20 °C). Carbonyl cyanide-4(trifluoromethoxy) phenylhydrazone (FCCP, Tocris Bioscience, Bristol, UK) and diphenyleneiodonium chloride (DPI, Tocris Bioscience) were dissolved as 10 mM stocks in dimethyl sulfoxide (DMSO) and stored at −20 °C. The Ca2+-sensitive dye Fura-2 AM (ThermoFisher Scientific, Waltham, MA, USA) was dissolved as 1 mM stock solution in DMSO containing 10% Pluronic F-127 and stored at −20 °C.

2.3. Dissociated Cell Cultures

Hippocampal cell cultures were prepared from Mecp2−/y and WT males at postnatal day 2–5 as described in detail earlier [57]. Upon isolation, the brain was submerged in ice-cold Hank’s balanced salt solution (HBSS) containing 20% fetal calf serum (FCS). Hippocampi were isolated and divided into 8–10 pieces, which were then washed repeatedly in HBSS to remove the remaining FCS. After trypsin-digestion in the incubator (10 min, 37 °C, 5% CO2), washing steps first with HBSS and then with HBSS including 20% FCS were conducted. Hippocampi were then triturated in a dissociation solution and centrifuged (1500 rpm, 10 min, 4 °C). The isolated pellet was re-dissolved in plating medium. About 30,000–40,000 cells were plated on each of the Matrigel (BD Biosciences, Franklin Lakes, NJ, USA)-coated glass coverslips (Nunc, 13 mm diameter), and maintained in 4-well plates (Nunc) in the incubator (37 °C, humidified atmosphere, 5% CO2). Depending on brain size, 12–16 coverslips could be prepared from the hippocampi of a single mouse. After 24 h the plating medium was replaced by growth medium, which was then partially (50%) refreshed every 2–3 days during the culturing period. The experiments were performed between 7 and 16 days in vitro (DIV).

2.4. Culturing Media

All culturing media were sterile filtered and then stored at 4 °C. HBSS consisted of Hanks’ balanced salts, 0.35 g/L NaHCO3, and 0.238 g/L HEPES; the pH was adjusted with 1 M NaOH to 7.3–7.4. Digestion solution contained 137 mM NaCl, 5 mM KCl, 7 mM Na2HPO4 and 25 mM HEPES. Right before use, 0.5 g/100 mL trypsin and 0.05 g/100 mL DNAse were added, and the pH was adjusted to 7.2. The dissociation solution was made of Hanks’ balanced salts, 12 mM MgSO4 and 0.05 g/100 mL DNAse. Plating medium consisted of minimum essential medium (MEM) (ThermoFisher Scientific, Waltham, MA, USA), 10% FCS, 5 mg/mL glucose, 0.2 mg/mL NaHCO3, 0.1 mg/mL transferrin (Calbiochem, San Diego, CA, USA), 2 mM L-glutamine, and 25 µg/mL insulin. Growth medium contained MEM, 5 mg/mL glucose, 0.2 mg/mL NaHCO3, 0.1 mg/mL transferrin, 5% FCS, 0.5 mM L-glutamine, 20 µL/mL B27 50× supplement including antioxidants (Invitrogen, Carlsbad, CA, USA), 2 µM cytosine arabinoside, and 100 µg/mL penicillin-streptomycin (Biochrom, Cambridge, UK).

2.5. roGFP Transduction

The genetically-encoded optical redox sensor reduction oxidation-sensitive green fluorescent protein 1 (roGFP1) [66] was expressed under the control of the synapsin-1 promoter in either the mitochondrial matrix (roGFPm) or the cytosol (roGFPc) of neurons, by taking advantage of the earlier developed AAV-6 constructs. Including the mitochondrial targeting sequence of subunit VIII of cytochrome C oxidase ensured the expression of roGFP in the mitochondrial matrix, without any further targeting sequences roGFP was expressed in cytosol [55,67]. Transduction was performed on DIV 2, by adding 2.5 µL of diluted virus constructs (stock dilution 1:50, stored in phosphate buffered saline (PBS) at −80 °C) into 800 µL of growing medium. Obvious differences in the transduction efficiency and the cellular viability/survival could not be observed among WT and Mecp2−/y cultures.

2.6. Immunostaining

MitoTracker RED FM (Life Technologies, Carlsbad, CA, USA) served to label mitochondria. Cultures were incubated for 20 min (1 μM, 37 °C, 5% CO2). To visualize mitochondria in vitro, a 2-photon microscope with a 63× 1.0NA objective (Plan-Apochromat VIS-IR, Zeiss, Oberkochen, Germany), and an excitation wavelength of 860 nm was used [57].
The neuron specific expression of roGFP was confirmed by immunostaining with the neuronal marker anti-microtubule associated protein 2 (MAP2) antibody (cell signaling). After two washing cycles (3 min each) with pre-warmed PBS (37 °C), the neuronal cultures were fixed in PBS with 4% paraformaldehyde (PFA) for ~20 min at room temperature. For permeabilization, cells were exposed twice to 0.2% triton in PBS (3 min each treatment) and incubated overnight with the MAP2 antibody (stock dilution 1:300, 4 °C). Neuronal cultures were washed twice with 0.2% triton in PBS for 3 min and the secondary antibody (anti-rabbit Cy3, Sigma-Aldrich, St. Louis, MO, USA) was added for 1 h at room temperature. After double washing with 0.2% triton in PBS (3 min each) and the final two times washing in PBS, neurons were dried and mounted (DakoCytomation, Glostrup, Denmark) on glass microscope slides. To visualize neurons expressing MAP2, a fluorescence microscope (BX51WI, Olympus, Shinjuku, Japan) with a 60×/0.90NA objective (Olympus LUMPlanFI) and an excitation wavelength of 525 nm were used.

2.7. Optical Recordings and 2-Photon Imaging

Subcellular redox conditions were monitored with the redox sensor roGFP1 [66], following our earlier established calibration routines and CCD-camera based imaging procedures [55,67,68]. The roGFP indicator is ratiometric by excitation, as its two discrete absorption peaks respond oppositely to oxidation and reduction [66]. Therefore, we excited roGFP alternately at 395 and 470 nm (0.1 Hz frame rate, 4 × 4 pixel binning) and calculated the resulting fluorescence ratio R395nm/470nm. Dynamics of subcellular redox changes were visualized using a fast-switchable light source (Polychrome II; Till Photonics, Gräfelfing, Germany) and a sensitive CCD-camera (Imago QE; PCO Imaging, Kelheim, Germany), both of which were controlled by the TILLvisION device-control software package (version 4.0.1; TILL Photonics, Gräfelfing, Germany), and a 60× 0.9NA water immersion objective (LUMPlan FI, Olympus, Shinjuku, Japan).
To image hippocampal cultures expressing roGFPc and roGFPm at higher resolution, a 2-photon laser scanning microscope (TriMScope II with an upright Olympus BX51WI microscope, LaVision BioTec, Bielefeld, Germany) was used [57]. The roGFP sensors were excited at a wavelength of 890 nm and a 63 × 1.0 NA objective (Plan-Apochromat VIS-IR, Zeiss, Oberkochen, Germany) was used.
Cytosolic Ca2+ changes were monitored using the Ca2+-specific dye Fura-2 AM. Dye-loading of the cell-cultures was performed in the incubator (30 min, 37 °C, 5% CO2) by adding 5 µM Fura-2 directly to the growing medium. Real-time imaging of cytosolic Ca2+ transients was performed with the above mentioned Till Photonics CCD-camera imaging system and a 63 × 1.0 NA objective (Plan-Apochromat VIS-IR, Zeiss, Oberkochen, Germany). Fura-2 was excited alternately at 345 nm and 380 nm, the resulting fluorescence emissions recorded at 510 nm, and the fluorescence ratio F345/F380 was calculated. A frame rate of 0.1 Hz together with 4 × 4 pixel binning was applied. All imaging experiments were run in a submersion style chamber (volume 2.5 mL), and to allow for stable optical recordings, the superfusion flow rate was limited to 4 mL/min. To ensure a rapid onset of the transmitter-mediated effects, once the compounds reached the chamber, relatively high transmitter concentrations were chosen.

2.8. Calibration of roGFP

Quantitative redox imaging demands the proper calibration of the roGFP response range in the respective cell compartments. Therefore, roGFP was forced into full oxidation (5 mM H2O2, 5 min) and full reduction (10 mM DTT, 5 min) to obtain the respective ratiometric values (Rox, Rred). The instrument factor F470ox/F470red represents the fluorescence intensities at 470 nm excitation observed during maximum oxidation and reduction [69]. The standard redox potential of the roGFP1 variant of this sensor we used here (E0′ roGFP) is −291 mV [66]. Based on these parameters, the relative degrees of roGFP oxidation (OxDroGFP) and the corresponding roGFP redox potentials (EroGFP) were then calculated for the roGFP fluorescence ratios (R) recorded in the cytosol and the mitochondrial matrix:
OxD roGFP = R R red F   470 ox F   470 red   ( R ox R ) + ( R R red )
E roGFP = E 0 roGFP RT 2 F ln ( 1 OxD roGFP OxD roGFP )

2.9. Calibration of Fura-2

The quantitative Ca2+ imaging also requires proper calibrations. Therefore, the Ca2+-sensitive fluorescent dye Fura-2 was calibrated in vitro [70] to determine the calibration constants Rmin, Rmax and the instrument factor F380max/F380min (Sf2/Sb2). The calibration solutions contained 140 mM KCl, 1 mM MgCl2, 10 mM HEPES as well as 100 μM Fura-2, and they were adjusted to either 0 M Ca2+, 300 nM Ca2+ or 10 mM Ca2+ using BAPTA (1,2-bis(o-aminophenoxy)ethane-N,N,N′,N′-tetraacetic acid) [70]. The determined dissociation constant Kd of 225 nM matches earlier reports [71]. Based on these calibration parameters, the Fura-2 ratios were then converted to cytosolic Ca2+ concentrations:
( Ca 2 + ) = K d × R R min R max R × Sf 2 Sb 2

2.10. Spectrofluorometric Quantification of H2O2

The extracellular formation of H2O2, which may arise as a consequence of either norepinephrine, dopamine autoxidation, or both, was quantified in a cuvette-based assay with horseradish peroxidase and Amplex UltraRed (Life Technologies, Carlsbadl, CA, USA; for details see [72]). Formation of H2O2 is indicated by a stoichiometric accumulation of the oxidized and highly fluorescent Amplex UltroxRed, which was followed in a spectrofluorometer (flx-Xenius, ESV 5.98, SAFAS Monaco, Monaco). Based on parallel calibration experiments with defined H2O2 standards, Amplex UltroxRed fluorescence intensities were then converted into H2O2 concentrations [72].

2.11. Statistics

The current study was performed on 28 WT and 18 Mecp2−/y mice. For the various experiments, we made sure that at least two different mice per genotype (range 2–7 WT mice and 2–4 Mecp2−/y mice) entered each experimental paradigm. For pairwise comparisons, such as genotype-related differences, two-tailed unpaired Student’s t-tests were used, given that the data showed a normal distribution (Kolmogorov–Smirnov test). Otherwise, Mann–Whitney rank sum tests were conducted. Multiple group comparisons were done by one-way ANOVA, followed by Holm–Sidak tests. Statistically significant changes are indicated by asterisks (* p < 0.05; ** p < 0.01; *** p < 0.001). Statistical calculations were performed with SigmaStat 3.5 (Systat Software, Erkrath, Germany). All numerical values are given as mean ± standard deviation (SD), and the number of cells (n) is reported.

3. Results

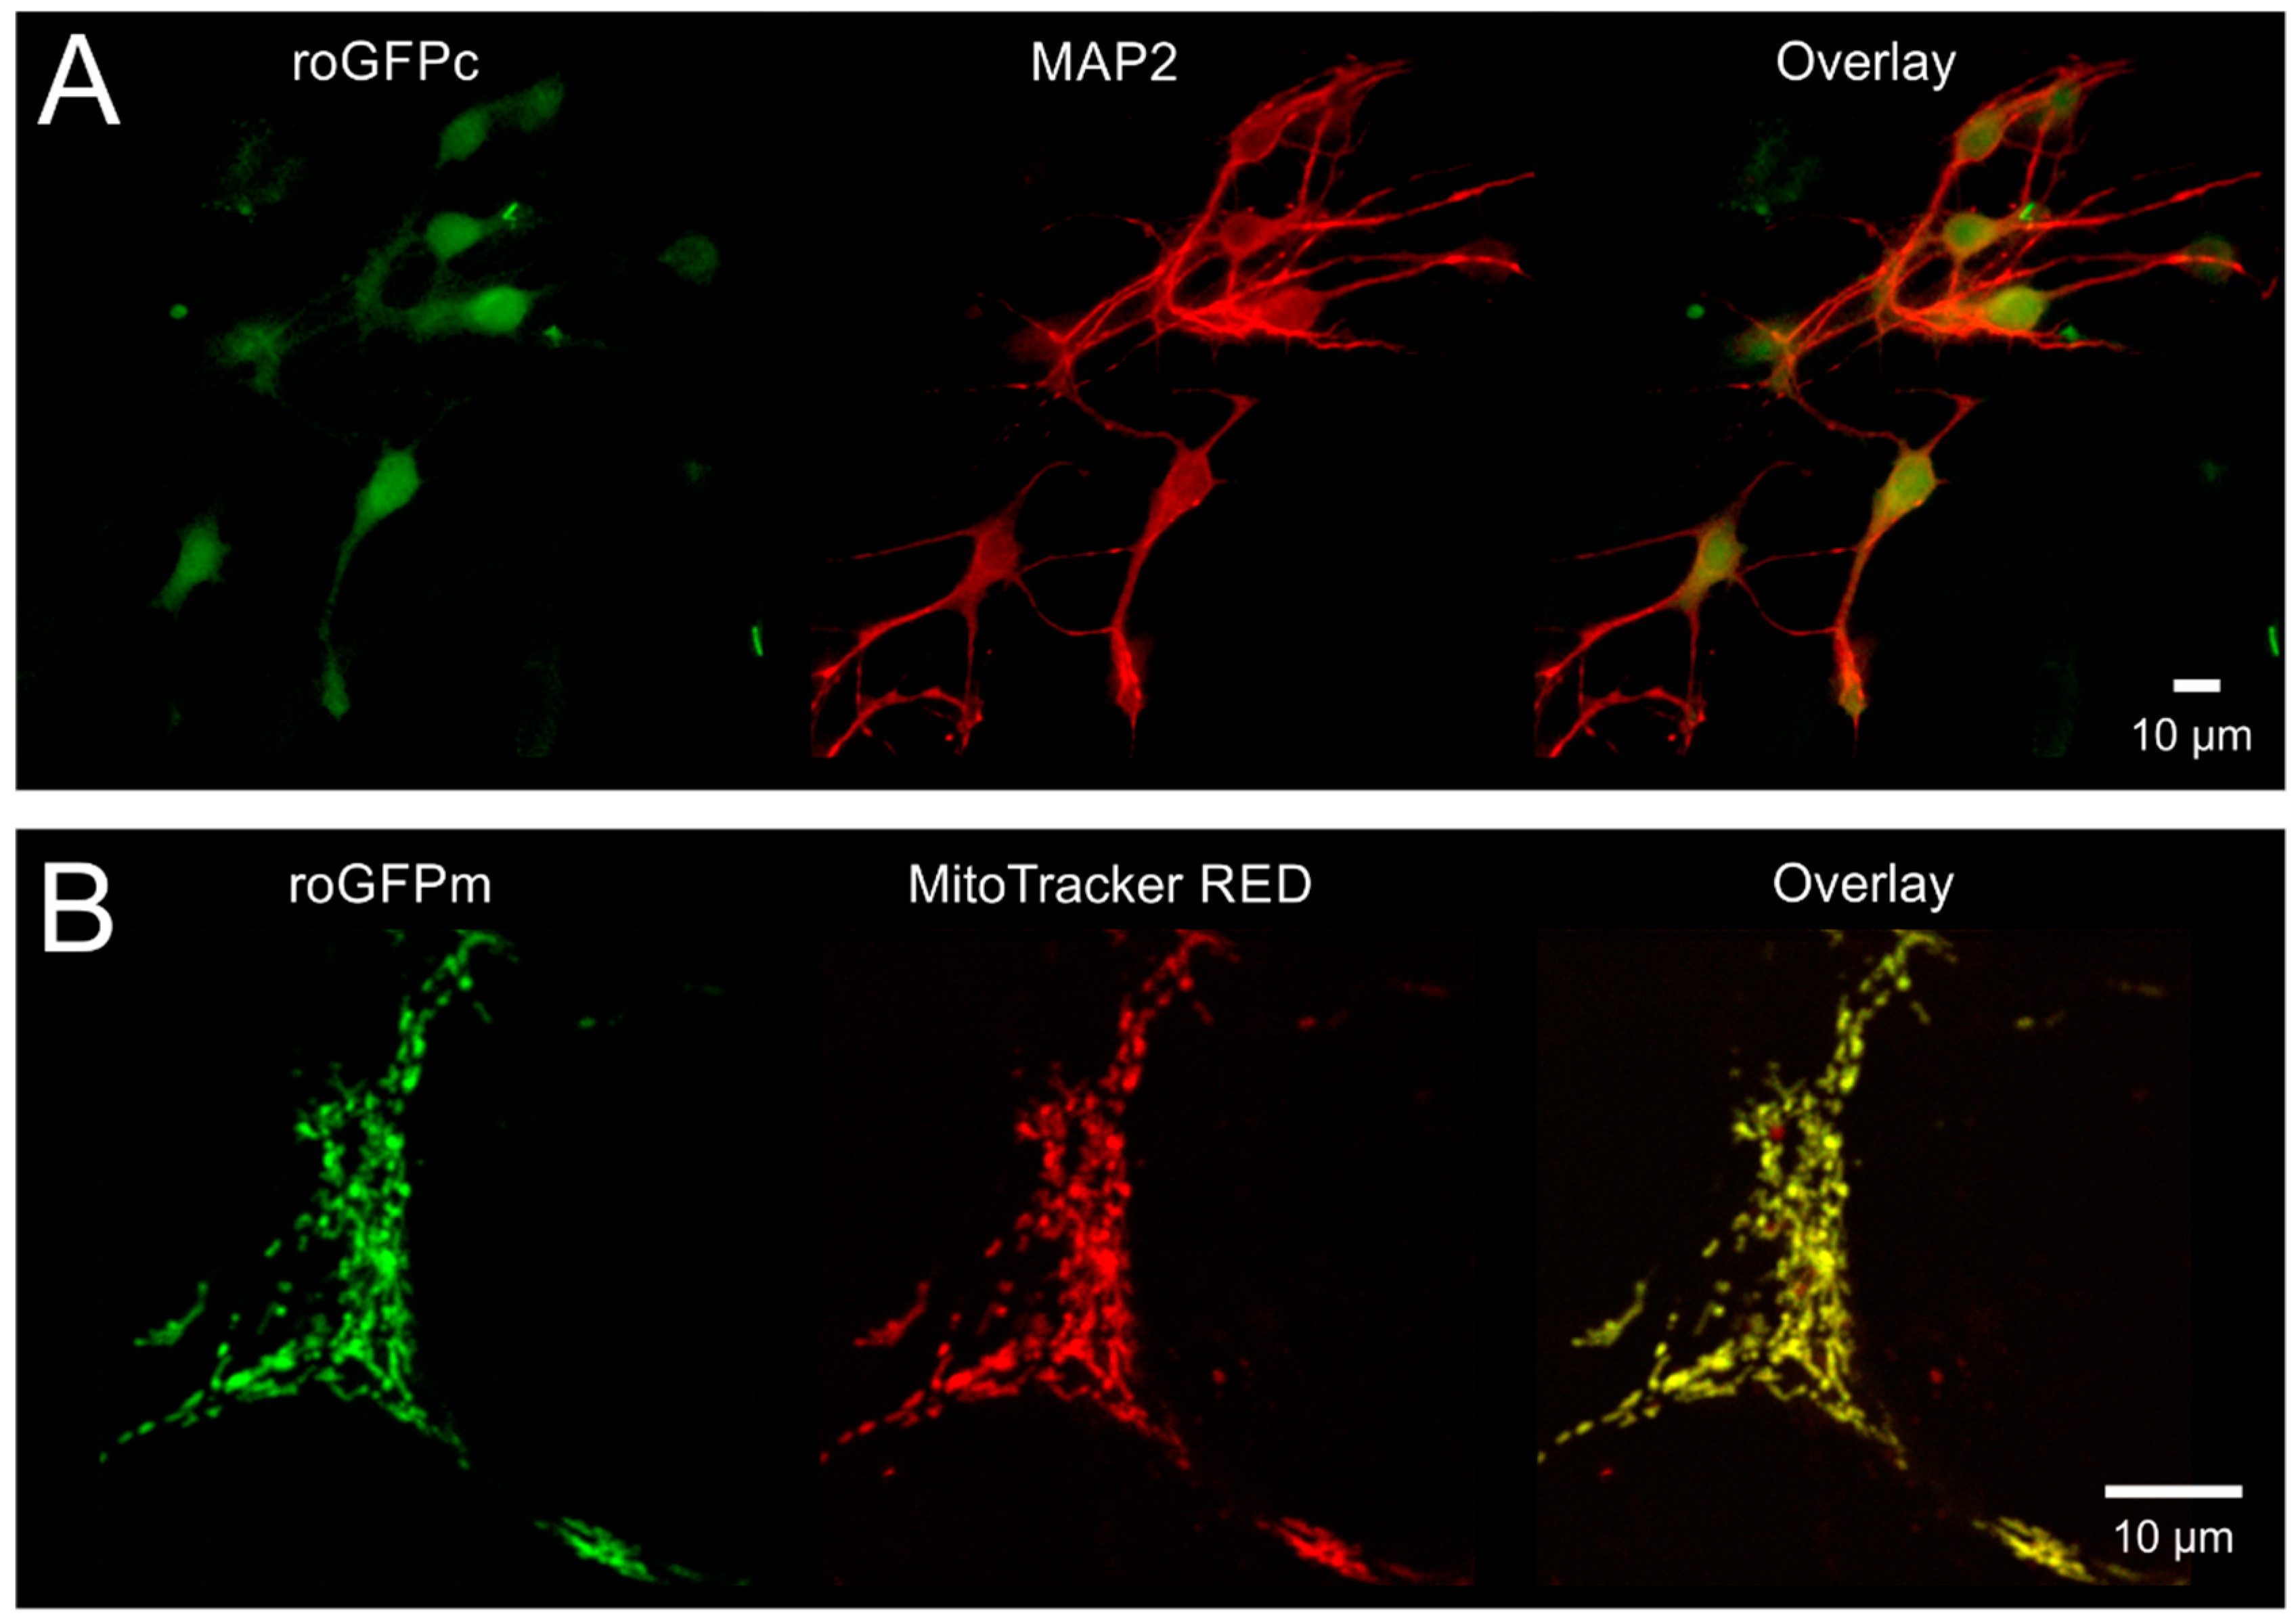
3.1. Cellular Targeting and Subcellular Expression of roGFP

To confirm the neuron-specific expression of roGFP and its proper subcellular targeting, we fixed (4% PFA) and co-labeled hippocampal neuronal cultures with MAP2-directed antibodies. As expected, roGFPc fluorescence fully matched the MAP2-labeling (Figure 1A). The mitochondria-specific expression of roGFPm was verified by co-labeling viable cell cultures with MitoTracker RED FM. Again, a perfect colocalization was confirmed (Figure 1B).

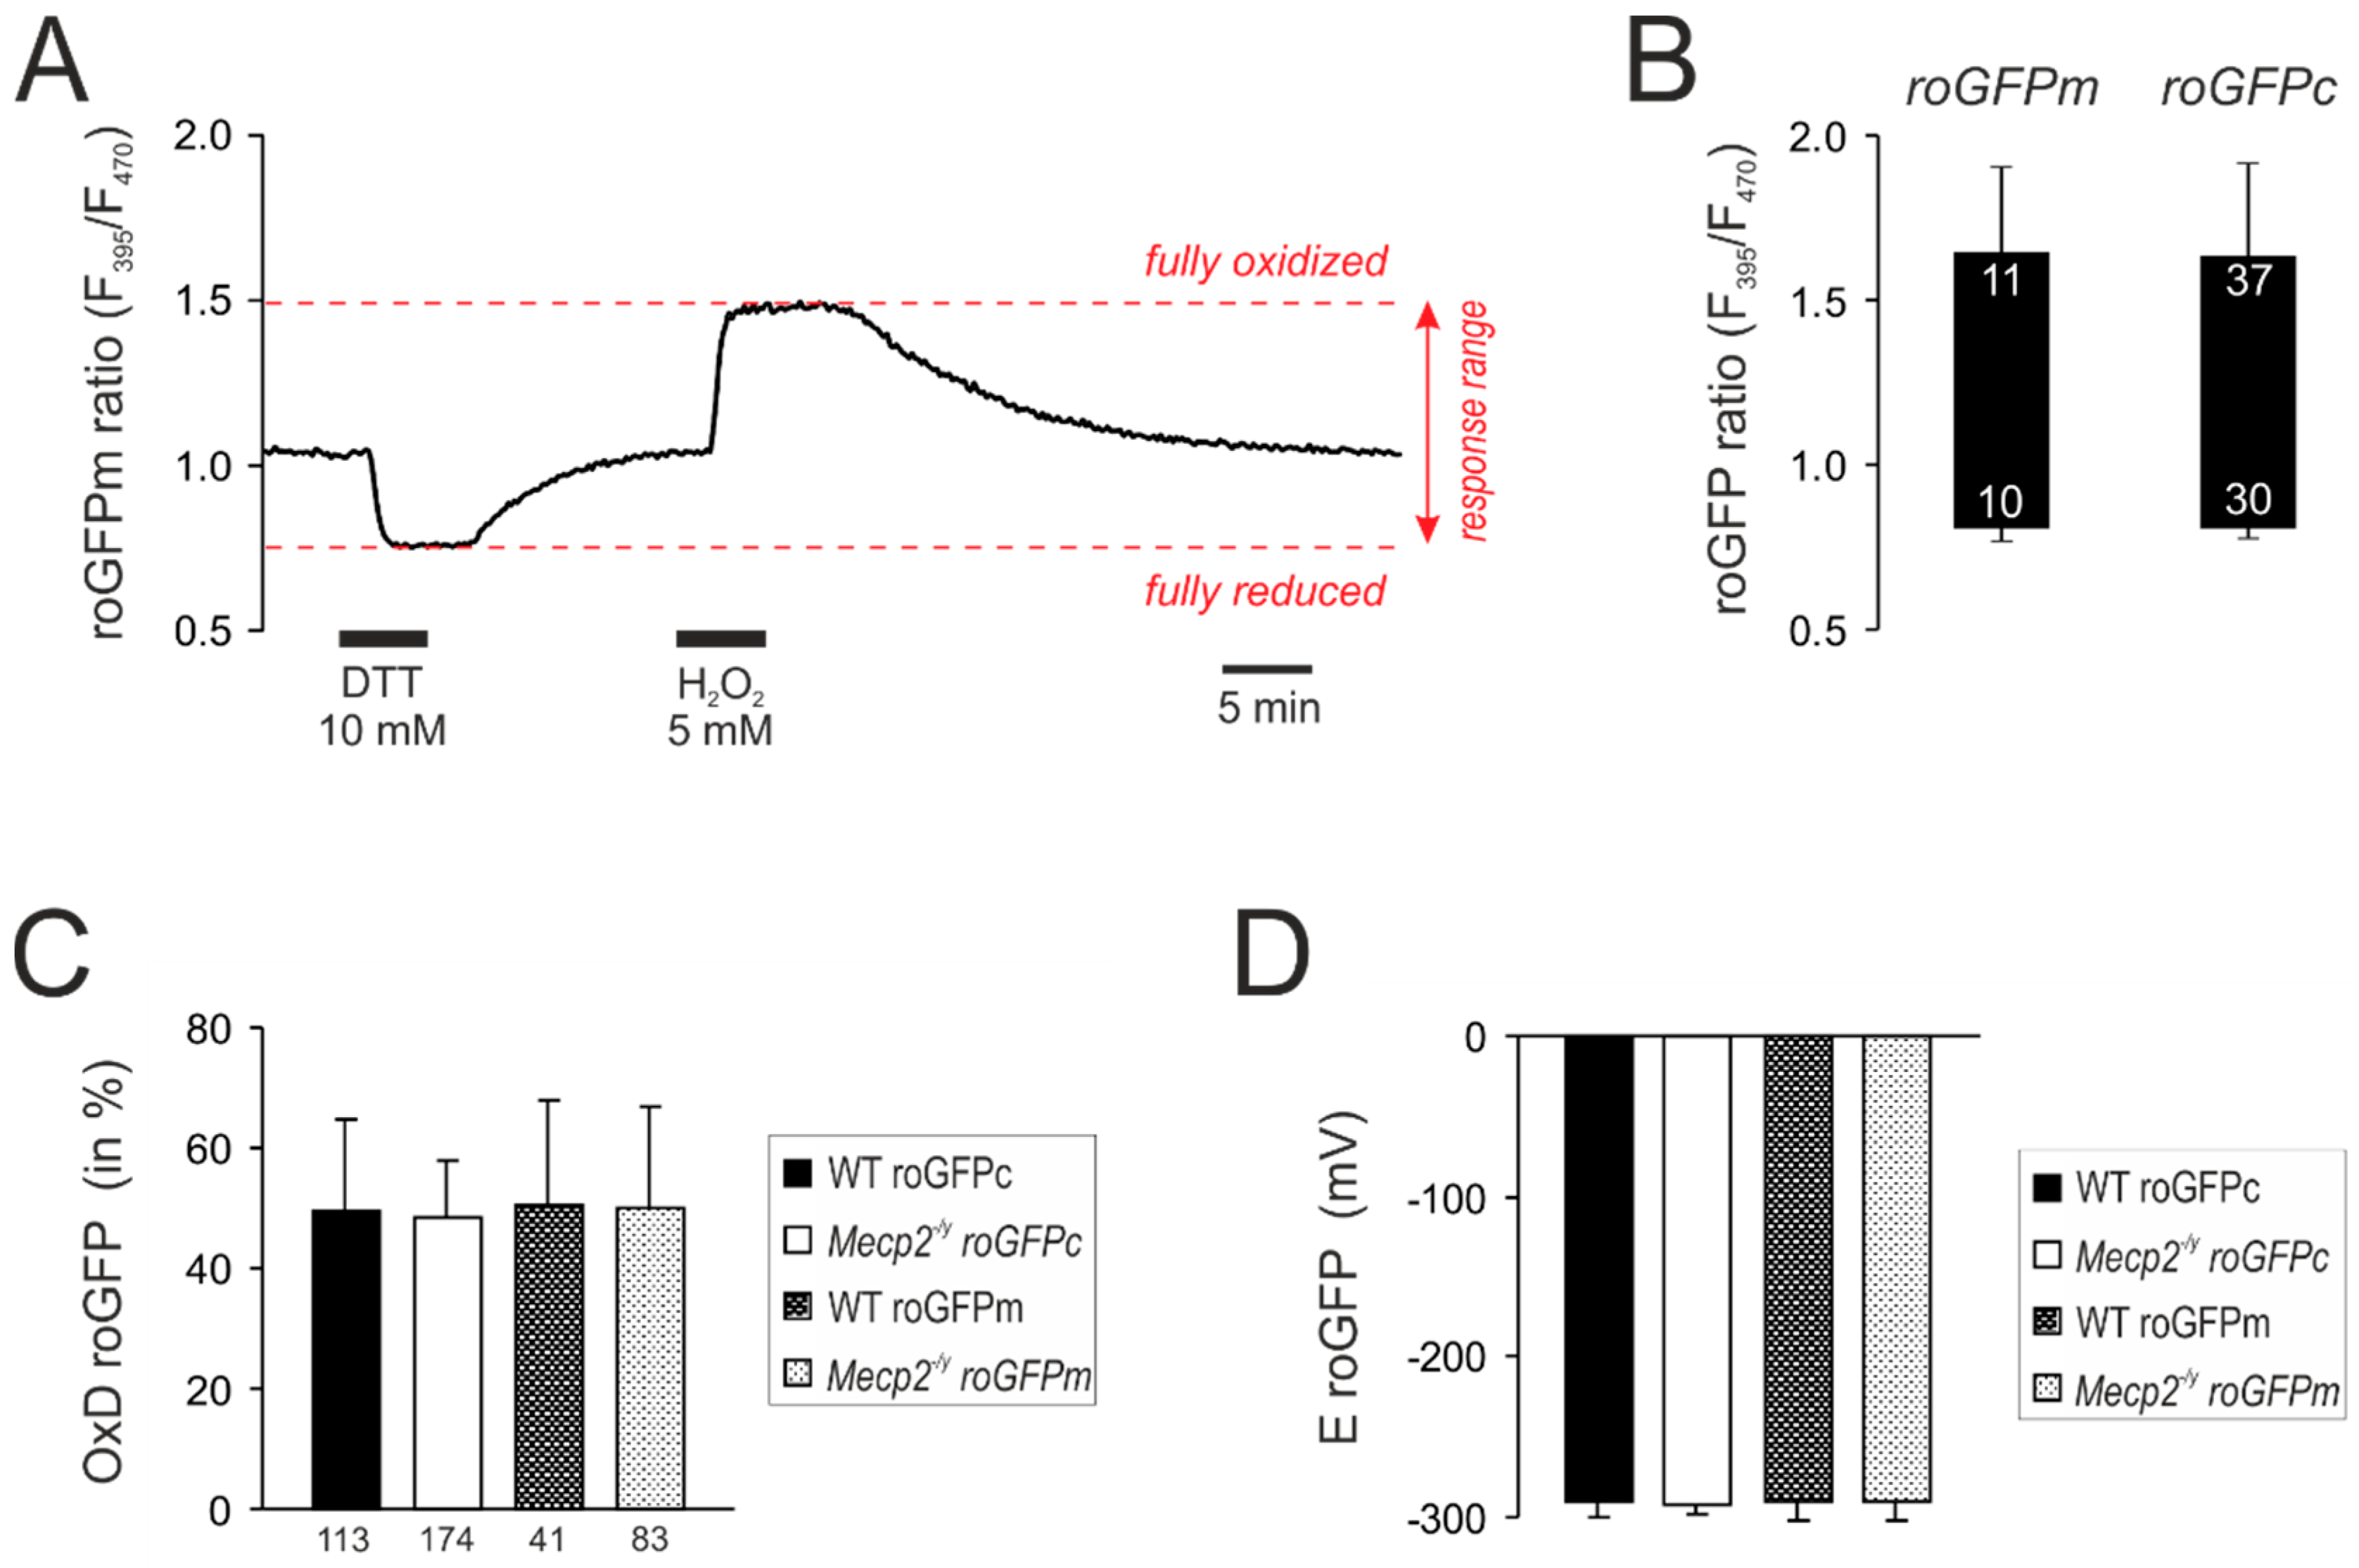
3.2. Response Calibrations of roGFPc and roGFPm

For quantitative redox analyses, the roGFP response ranges were determined in cytosol as well as mitochondrial matrices by treatment with H2O2 (5 M) and DTT (10 mM, 5 min each), which forced roGFPc and roGFPm into the fully oxidized and the fully reduced state, respectively (Figure 2A). As expected, identical roGFP response ranges were obtained for both cell compartments (Figure 2B). Based on these calibrations, the baseline resting redox conditions were quantified. In WT neurons, roGFPc showed a relative degree of oxidation (OxDroGFP) of 49.5 ± 15.2% (n = 113), which corresponds to a cytosolic redox potential (EroGFP) of −291.0 ± 9.6 mV. Very similar values were obtained for mitochondrial matrices as well as the respective cell compartments in Mecp2−/y neurons (Figure 2C,D).

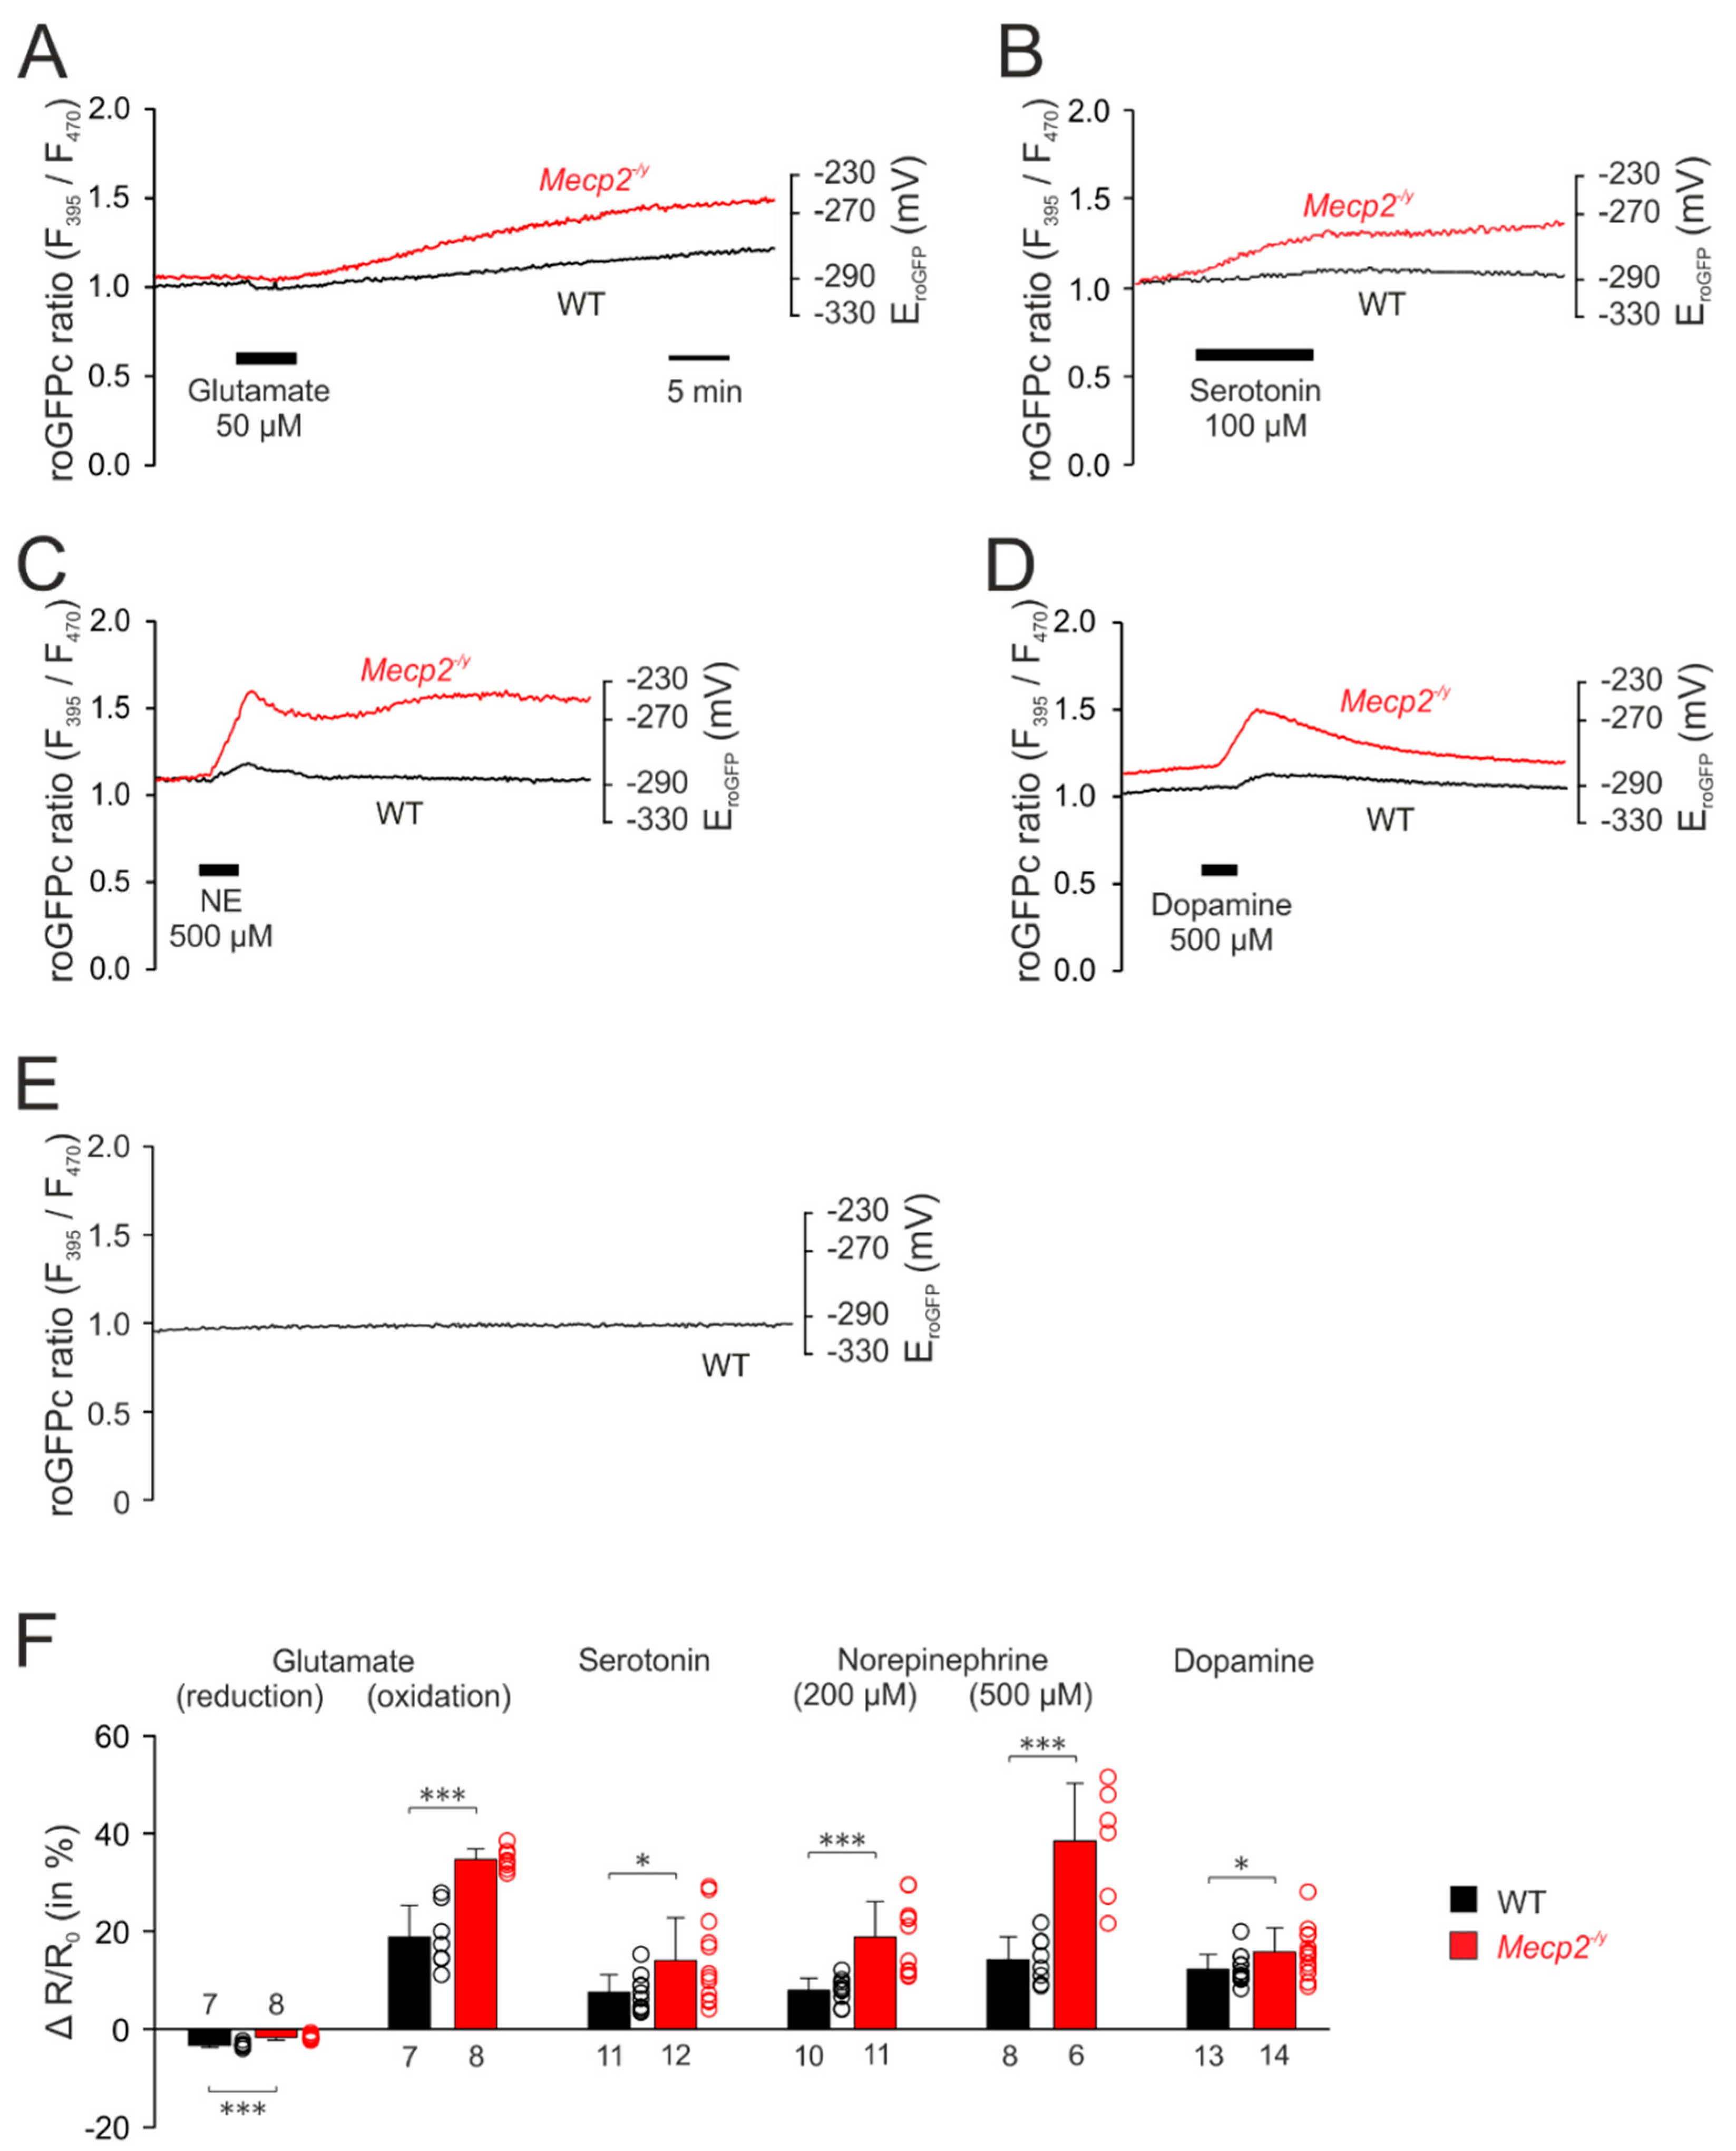
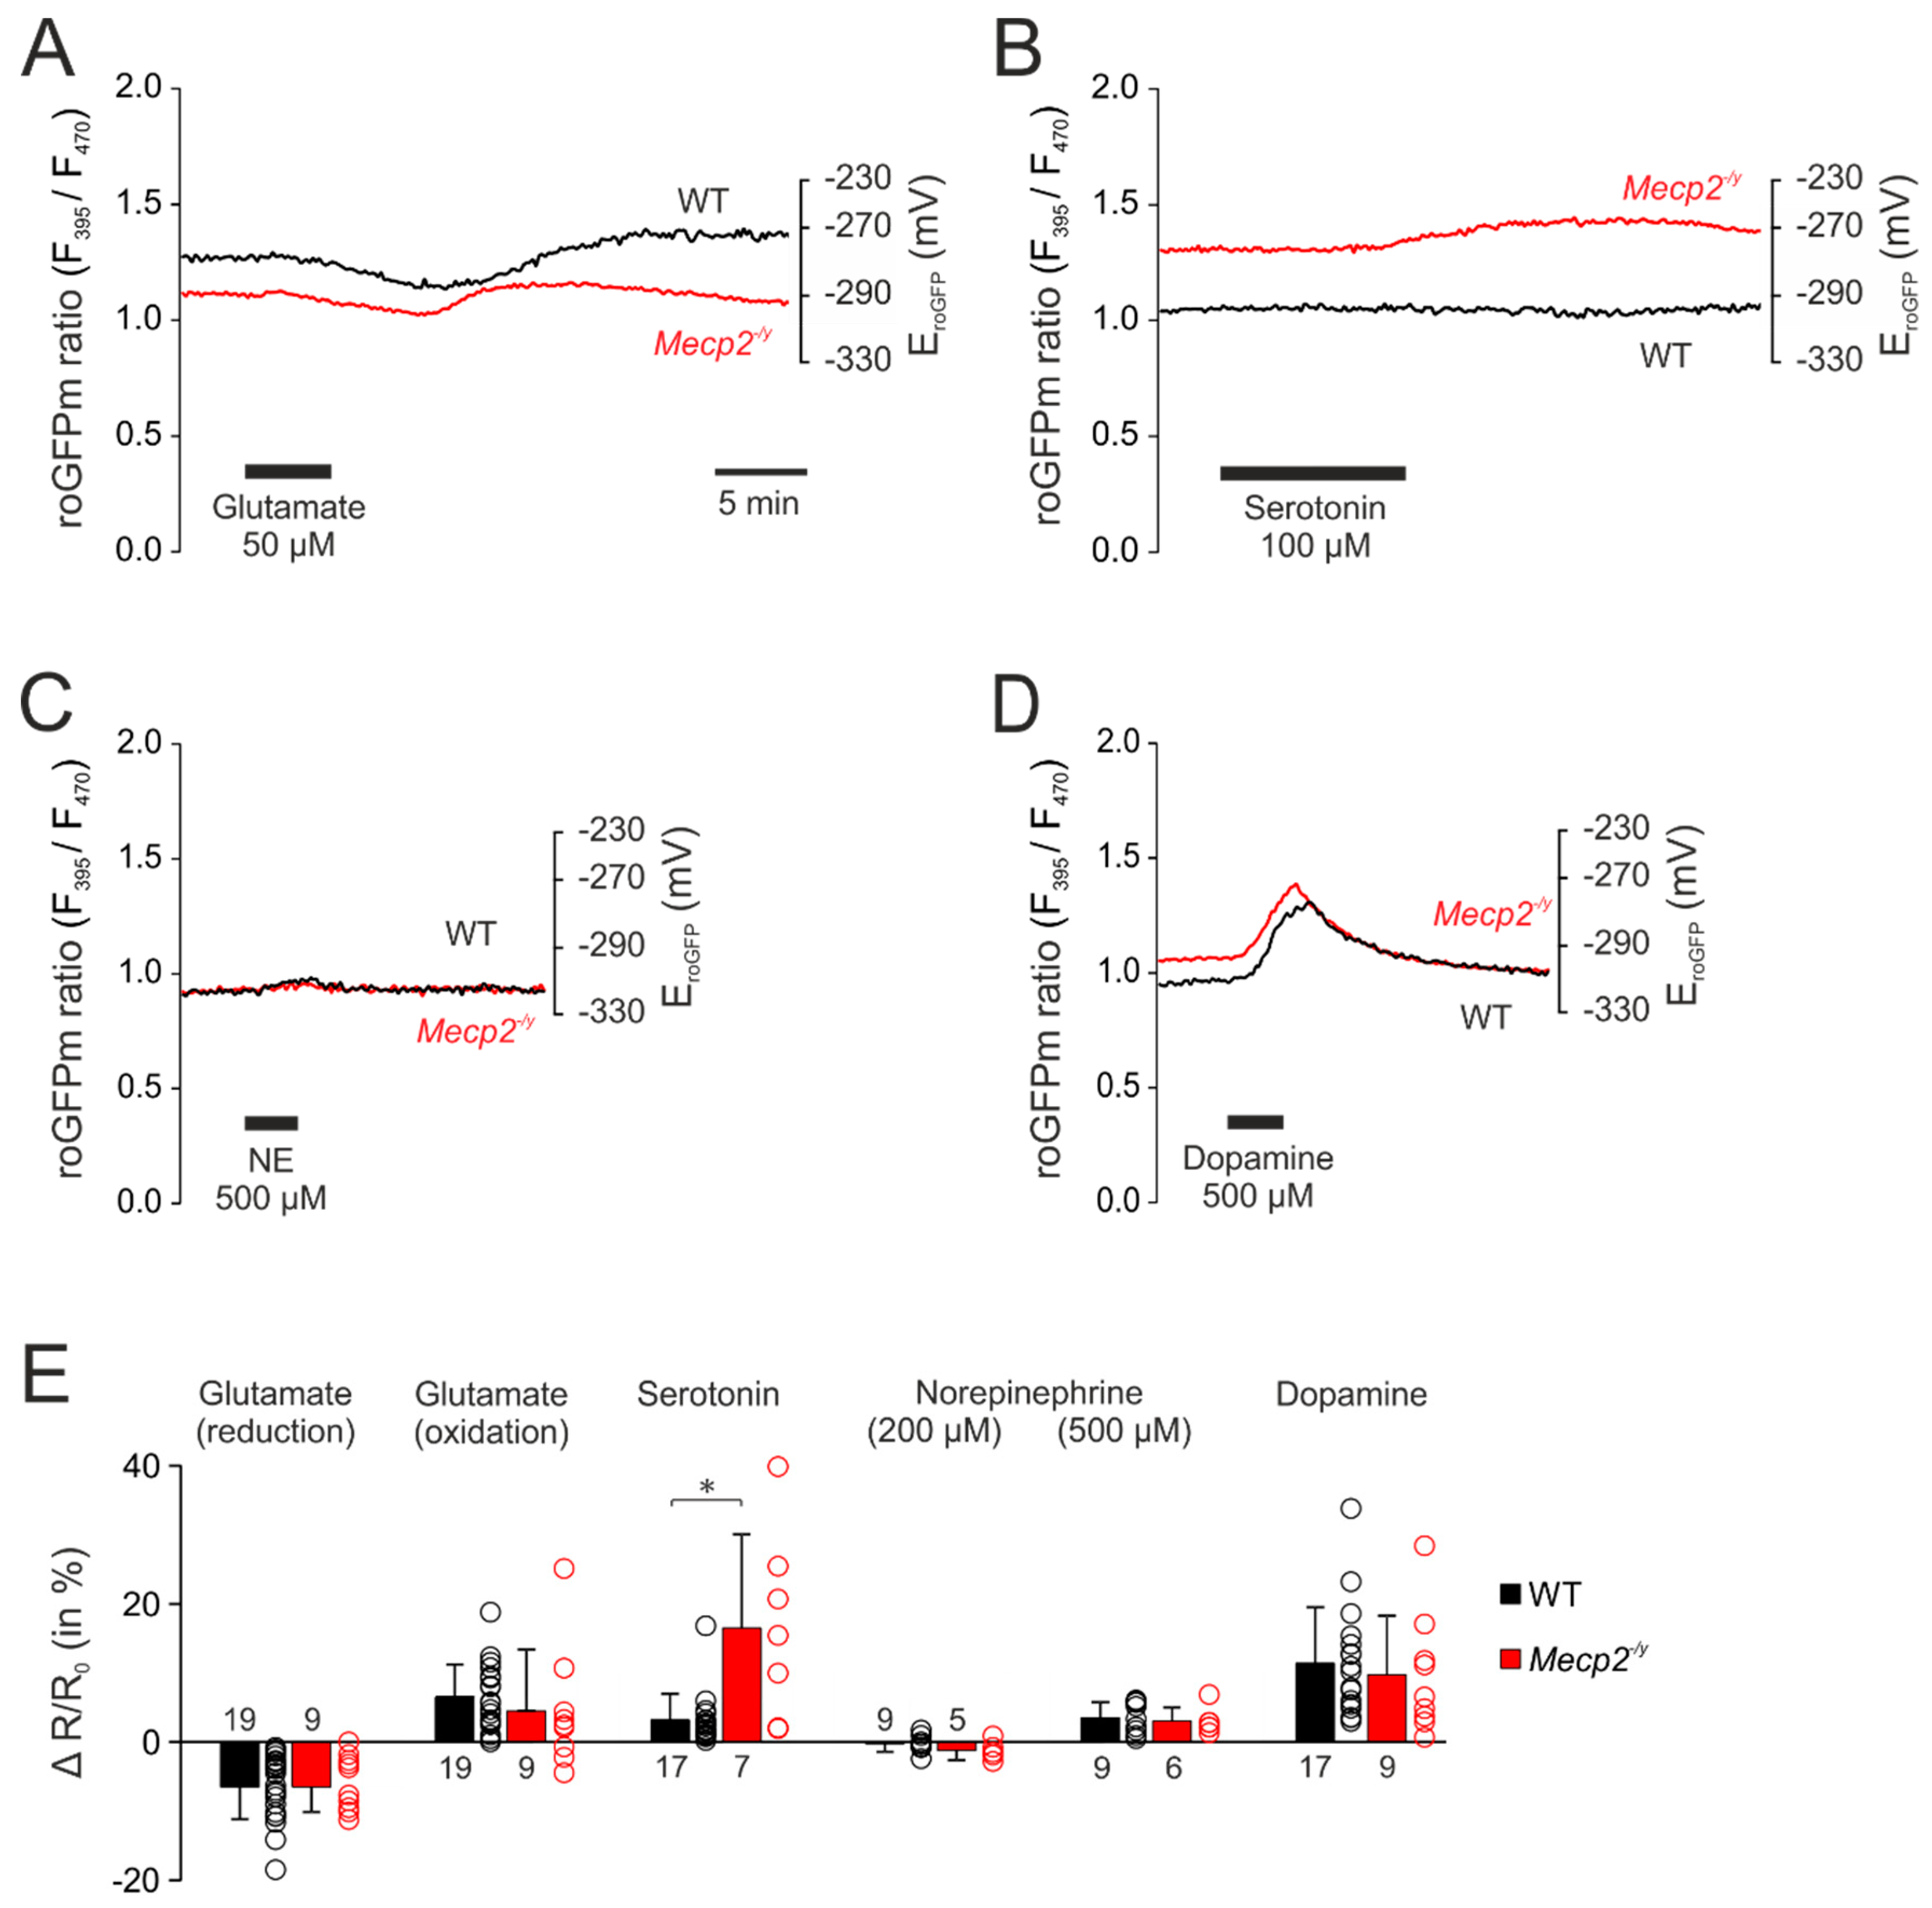
3.3. Neurotransmitter-Mediated Redox Changes

Previously we confirmed an oxidative burden with intensified responses of Mecp2−/y hippocampal neurons and glial cells to acute redox challenges such as mitochondrial inhibition, direct oxidant-challenge and severe hypoxia [55,56,57]. Now we assessed whether such overshooting redox-responses occur in the cytosol or the mitochondrial matrix of Mecp2−/y neurons in response to more physiological events, such as stimulation by the neurotransmitters glutamate, norepinephrine, serotonin and dopamine. Transmitter concentrations were based on earlier reports [73,74,75,76] and if necessary adjusted to levels inducing reproducible redox responses in our specific submersion style chamber (2.5 mL volume, 4 mL/min flow rate).
The first set of experiments addressed the cytosolic redox homeostasis. Application of glutamate (50 µM, 5 min) induced biphasic responses in cytosolic redox balance, consisting of an initial decrease, in other words, a reducing shift in the roGFPc ratio, followed by a secondary continuous increase, in other words, an oxidation (Figure 3A). Since the roGFPc ratio failed to recover to its pre-treatment baseline after wash-out of glutamate, the redox-level reached 30 min after the end of glutamate application was used for quantification and genotypic comparison; for the other neurotransmitters the respective peak values of their redox responses were analyzed. In the case of glutamate stimulation, the initial reduction of the roGFPc ratio was significantly more intense in WT (−3.3 ± 0.5%, n = 7) than in Mecp2−/y neurons (−1.7 ± 0.5%; n = 8). Yet, the secondary oxidation was markedly more intense in Mecp2−/y (34.6 ± 2.2%; n = 8) than in WT neurons (18.8 ± 6.4%, n = 7) (Figure 3F).
Serotonin (100 µM, 10 min) also shifted the roGFPc ratio towards oxidation, which was clearly more pronounced in Mecp2−/y (14.0 ± 8.8%; n = 12) than in WT neurons (7.5 ± 3.6%; n = 11; Figure 3B,F).
Norepinephrine, applied in two different doses (200 µM and 500 µM, 3 min each), evoked an increase in the roGFPc ratio, which was followed by a partial recovery after wash-out and then a maintained longer lasting oxidation of the roGFPc ratio or even a slow secondary further increase (Figure 3C). Similarly, Mecp2−/y neurons showed more intense oxidizing responses of 18.9 ± 7.2% (n = 11) as compared to WT neurons (7.9 ± 2.5%, n = 10). In response to 500 µM norepinephrine the roGFPc ratio rose by 38.5 ± 11.8% (n = 6) in Mecp2−/y and by 14.2 ± 4.7% in WT neurons (n = 8) (Figure 3F).
Dopamine (500 µM, 3 min) induced oxidizing responses in the roGFPc ratio, which—upon washout—fully recovered (Figure 3D). In detail, the roGFPc ratio increased by 15.7 ± 5.0% in Mecp2−/y neurons (n = 14), which again was more intense than in WT neurons (12.3 ± 3.0%; n = 13) (Figure 3F).
To rule out any cell impairment, sensor bleaching or other effects that may arise from the imaging conditions, we performed control recordings, in which cytosolic redox conditions were monitored continuously with the very exposure times and frame rates for 1 h. These tests clearly confirmed no drift, no bleaching and no continuous increases in redox balance, which rules out any artifacts, impairment of cell viability, or both, by the repeated ratiometric excitation (n = 8) (Figure 3E).
Furthermore, as in particular dopamine and norepinephrine become oxidized easily in solutions and give rise to extracellular H2O2 formation—which by itself would be sufficient to induce redox alterations in the cultured cells—we quantified the H2O2 formation in a cuvette assay using Amplex UltraRed (see [72]). In the case of ACSF (n = 3), 50 µM glutamate (n = 6) and 100 µM serotonin (n = 6), the H2O2 content was below the assay’s detection limit of 20 nM. Norepinephrine (500 µM) and dopamine (500 µM) gave rise to only moderate H2O2 generation. After 5 min, in other words, already beyond the application time of both drugs, H2O2 levels of the neurotransmitter-containing solutions measured 85.6 ± 37.9 nM (n = 4) and 105.9 ± 40.6 nM (n = 4), and after 10 min they averaged 422.4 ± 33.8 nM (n = 4) and 431.4 ± 34.2 nM (n = 4), respectively. None of which is sufficient to induce noticeable cytosolic redox alterations in cultured hippocampal neurons [68].
After observing clearly intensified redox responses to neurotransmitter stimulation in the cytosol of Mecp2−/y hippocampal neurons, we assessed whether overshooting oxidizing shifts would also be detectable in the mitochondrial matrix. Exposing roGFPm expressing hippocampal cell cultures to the identical neurotransmitter stimulation paradigms revealed that the redox responses in the roGFPm ratio quantified for WT and Mecp2−/y neurons were more moderate than in the cytosol. Furthermore, the mitochondrial redox changes recovered more readily.
Glutamate (50 µM, 5 min) also induced (in most cases) a biphasic response in the mitochondrial matrix (Figure 4A). The initial reducing shift averaged in WT neurons −6.5 ± 4.7% (n = 19) and was similar in Mecp2−/y neurons (−6.5 ± 3.6%; n = 9). It was followed by a secondary oxidizing shift in WT (6.5 ± 4.7%, n = 19) and Mecp2−/y neurons (4.5 ± 8.9%, n = 9) (Figure 4A,E). Some of the neurons responded—as also seen in cytosol—with a continuous oxidation (WT n = 3; Mecp2−/y n = 3).
Serotonin (100 µM, 10 min) was the only neurotransmitter, which evoked more intense oxidizing responses in Mecp2−/y neurons (Figure 4B). The roGFPm ratio increased by 16.5 ± 13.6% (n = 7) in Mecp2−/y neurons, but only by 3.2 ± 3.8% in WT cells (n = 17, Figure 4E).
In contrast, norepinephrine evoked only very moderate responses. Applied at the lower concentration (200 µM, 3 min) it hardly affected the redox-baseline (Figure 4E). Administration of 500 µM norepinephrine (3 min) slightly increased the roGFPm ratio to a similar degree in WT and Mecp2−/y neurons (3.5 ± 2.3%, n = 9, and 3.1 ± 2.0%, n = 6) (Figure 4C,E).
Dopamine (500 µM, 3 min) also evoked fully reversible responses in the mitochondrial matrix. In both, WT (n = 17) and Mecp2−/y neurons (n = 9), the roGFPm ratio increased by 11.4 ± 8.1% and 10.8 ± 8.6%, respectively (Figure 4D,E).

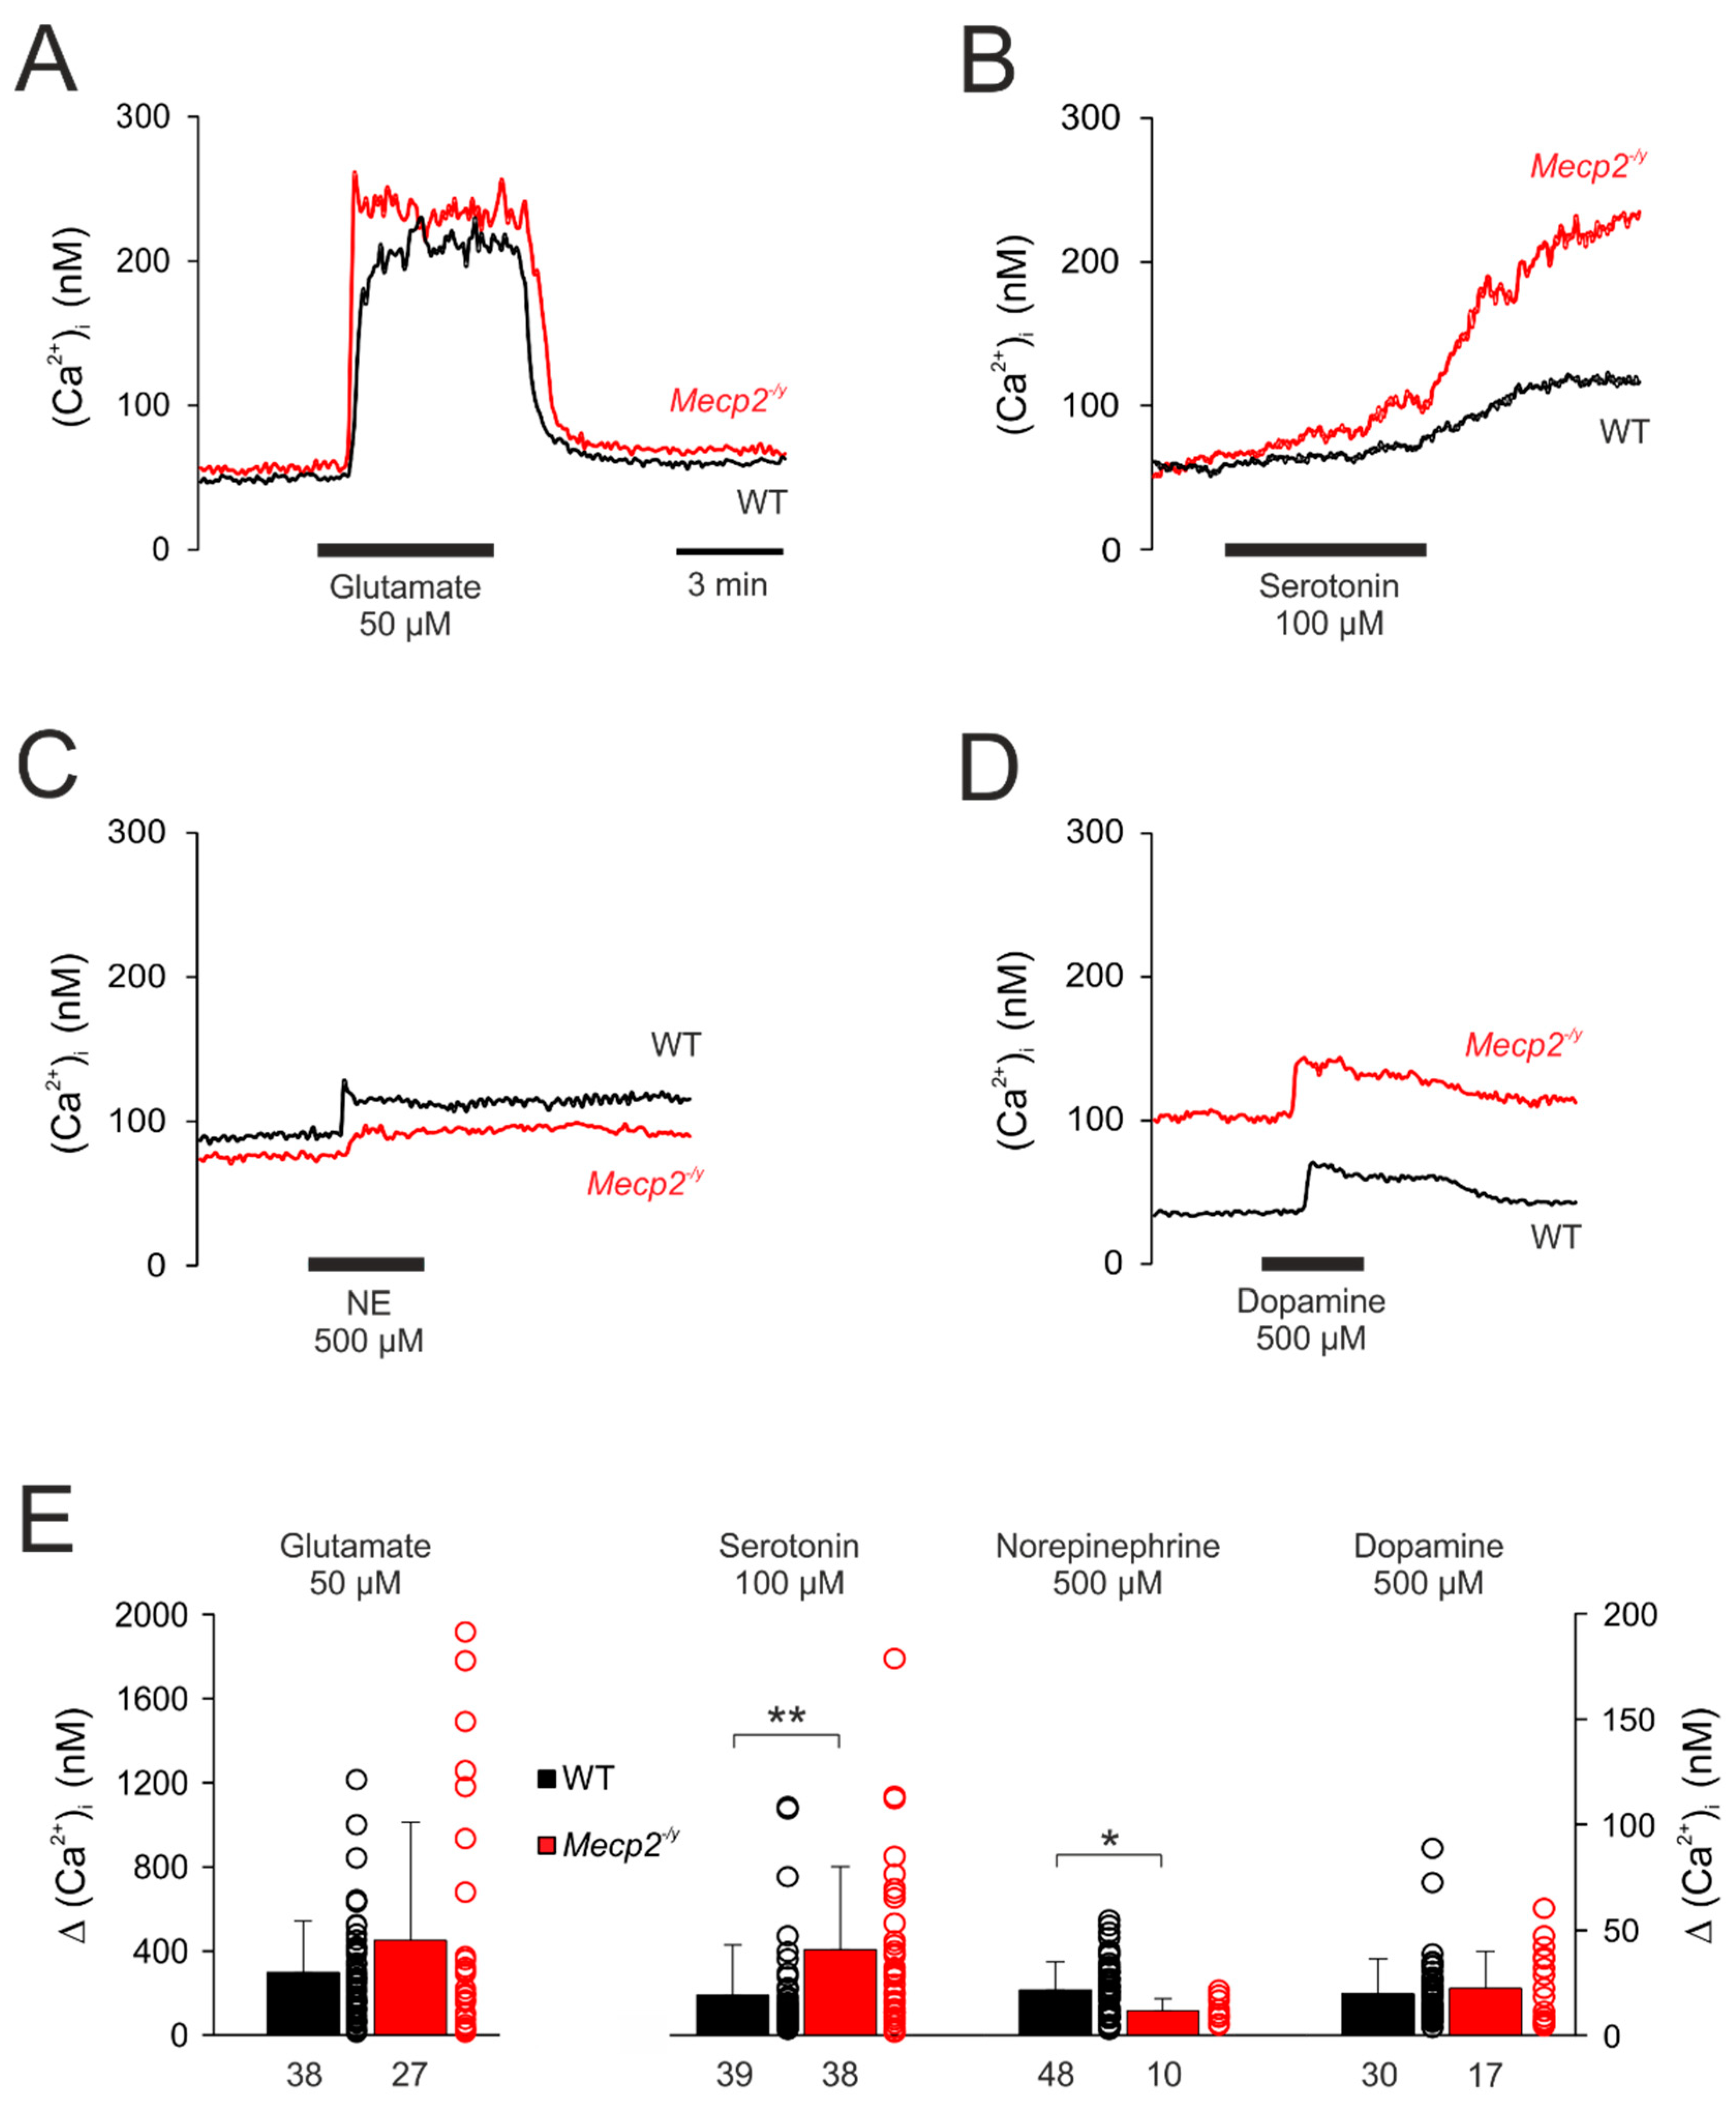
3.4. Effect of Neurotransmitters on Cytosolic Calcium Influx

A pivotal cellular parameter, which is affected by various neurotransmitters and may provoke the generation of ROS, is the intracellular Ca2+ level ((Ca2+)i). Therefore, we quantified the cytosolic Ca2+ transients induced by the different neurotransmitters, using Fura-2 imaging. Due to the spectral overlap of roGFP- and Fura-2-emission, redox- and Ca2+-changes could not be monitored simultaneously. Therefore, to assess a potential correlation of the two variables, identical experimental protocols were applied in the Ca2+ imaging experiments.
Under resting conditions, the (Ca2+)i baseline averaged in WT neurons 67.2 ± 44.9 nM (n = 111) and it was slightly higher in Mecp2−/y neurons (86.2 ± 61.8 nM, n = 50). As expected, glutamate (50 μM, 5 min) evoked a rapid and intense Ca2+ rise, which measured 298.1 ± 245.2 nM (n = 38) in WT and tended to be slightly higher (451.5 ± 560.9 nM; n = 27) in Mecp2−/y neurons (p = 0.08, Figure 5A,E). Upon wash-out, the cytosolic Ca2+ levels readily recovered to their baseline levels.
Serotonin (100 µM, 10 min) only evoked a slow increase in (Ca2+)i, which was slightly more intense in Mecp2−/y (Δ(Ca2+)i (40.8 ± 39.4 nM, n = 38, p <0.01)) than in WT neurons (Δ(Ca2+)i 19.1 ± 23.8 nM; n = 39). After about 10 min the initial moderate rise then accelerated into a secondary and sustained Ca2+ increase (Figure 5B,E).
Norepinephrine (500 µM, 3 min) evoked only moderate rises in (Ca2+)i, which were slightly more intense in WT (21.4 ± 13.5 mM, n = 48) than in Mecp2−/y neurons (11.7 ± 5.7 nM, n = 10) and recovered only slowly (Figure 5C,E).
Dopamine (500 µM, 3 min) also elicited only moderate increases in (Ca2+)i. They fully recovered to baseline conditions and did not differ among genotypes (WT: 19.7 ± 16.5 nM, n = 30; Mecp2−/y: 22.3 ± 17.5 nM, n = 17) (Figure 5D,E).

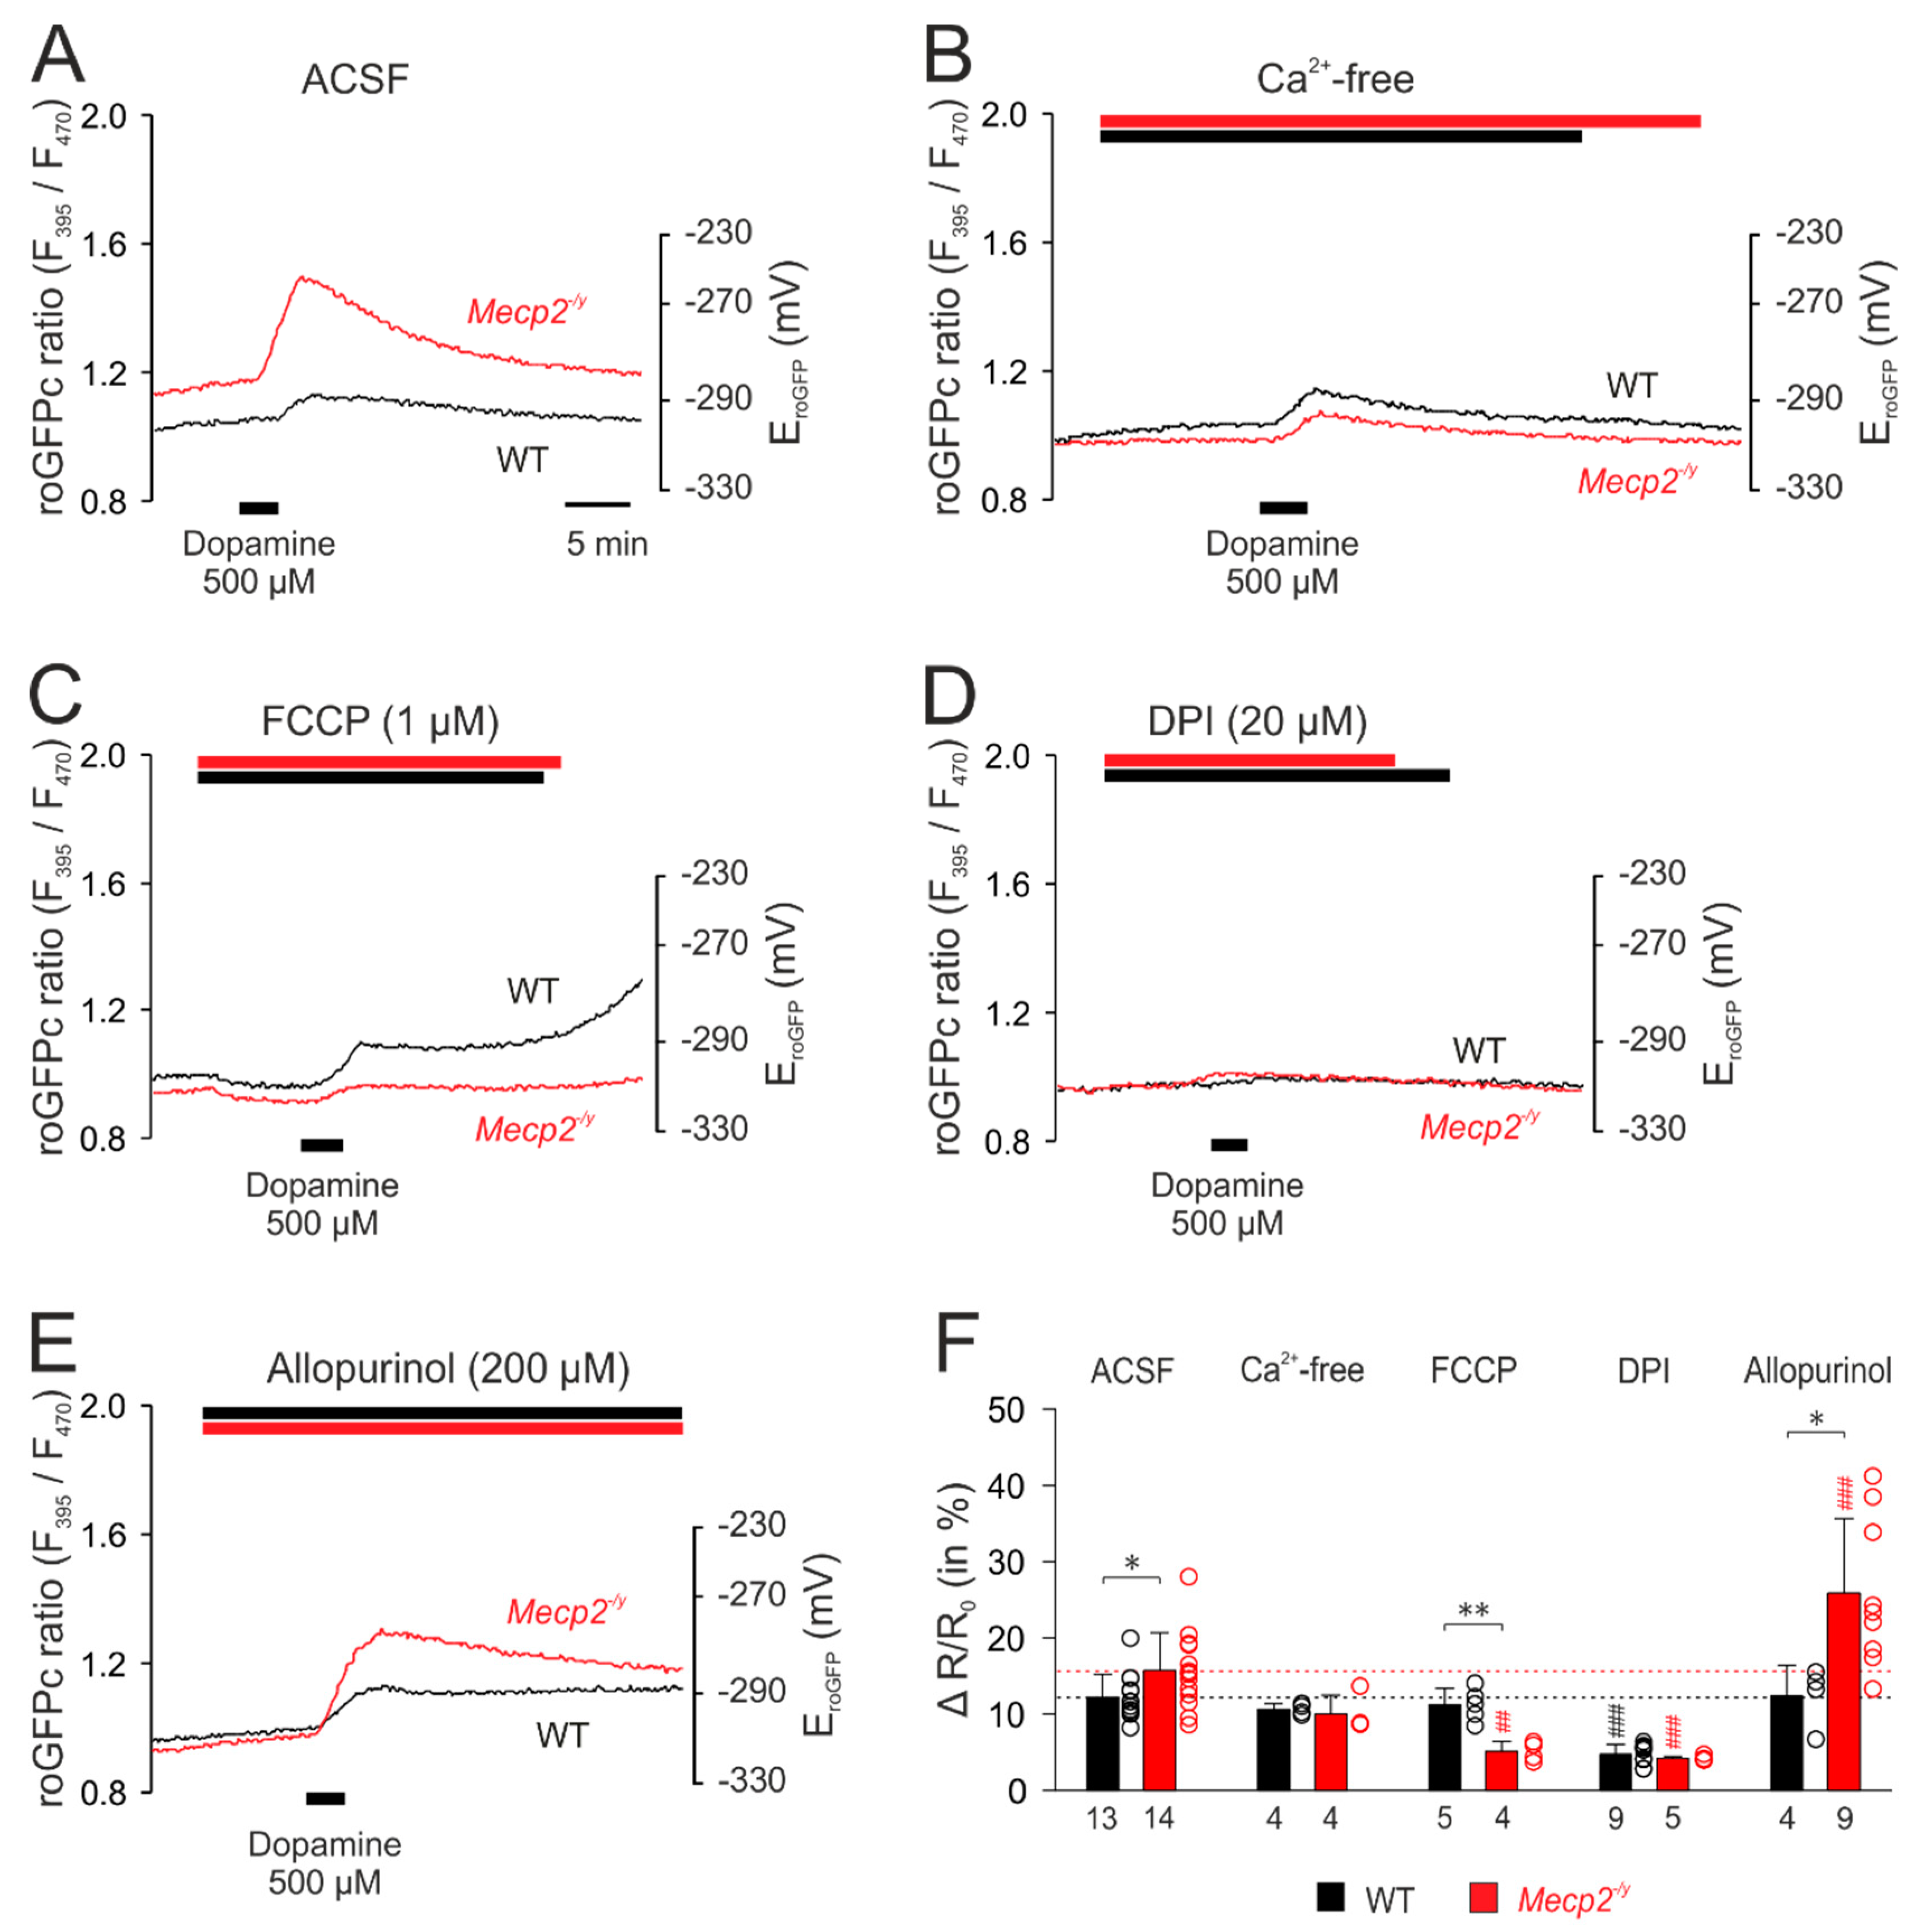
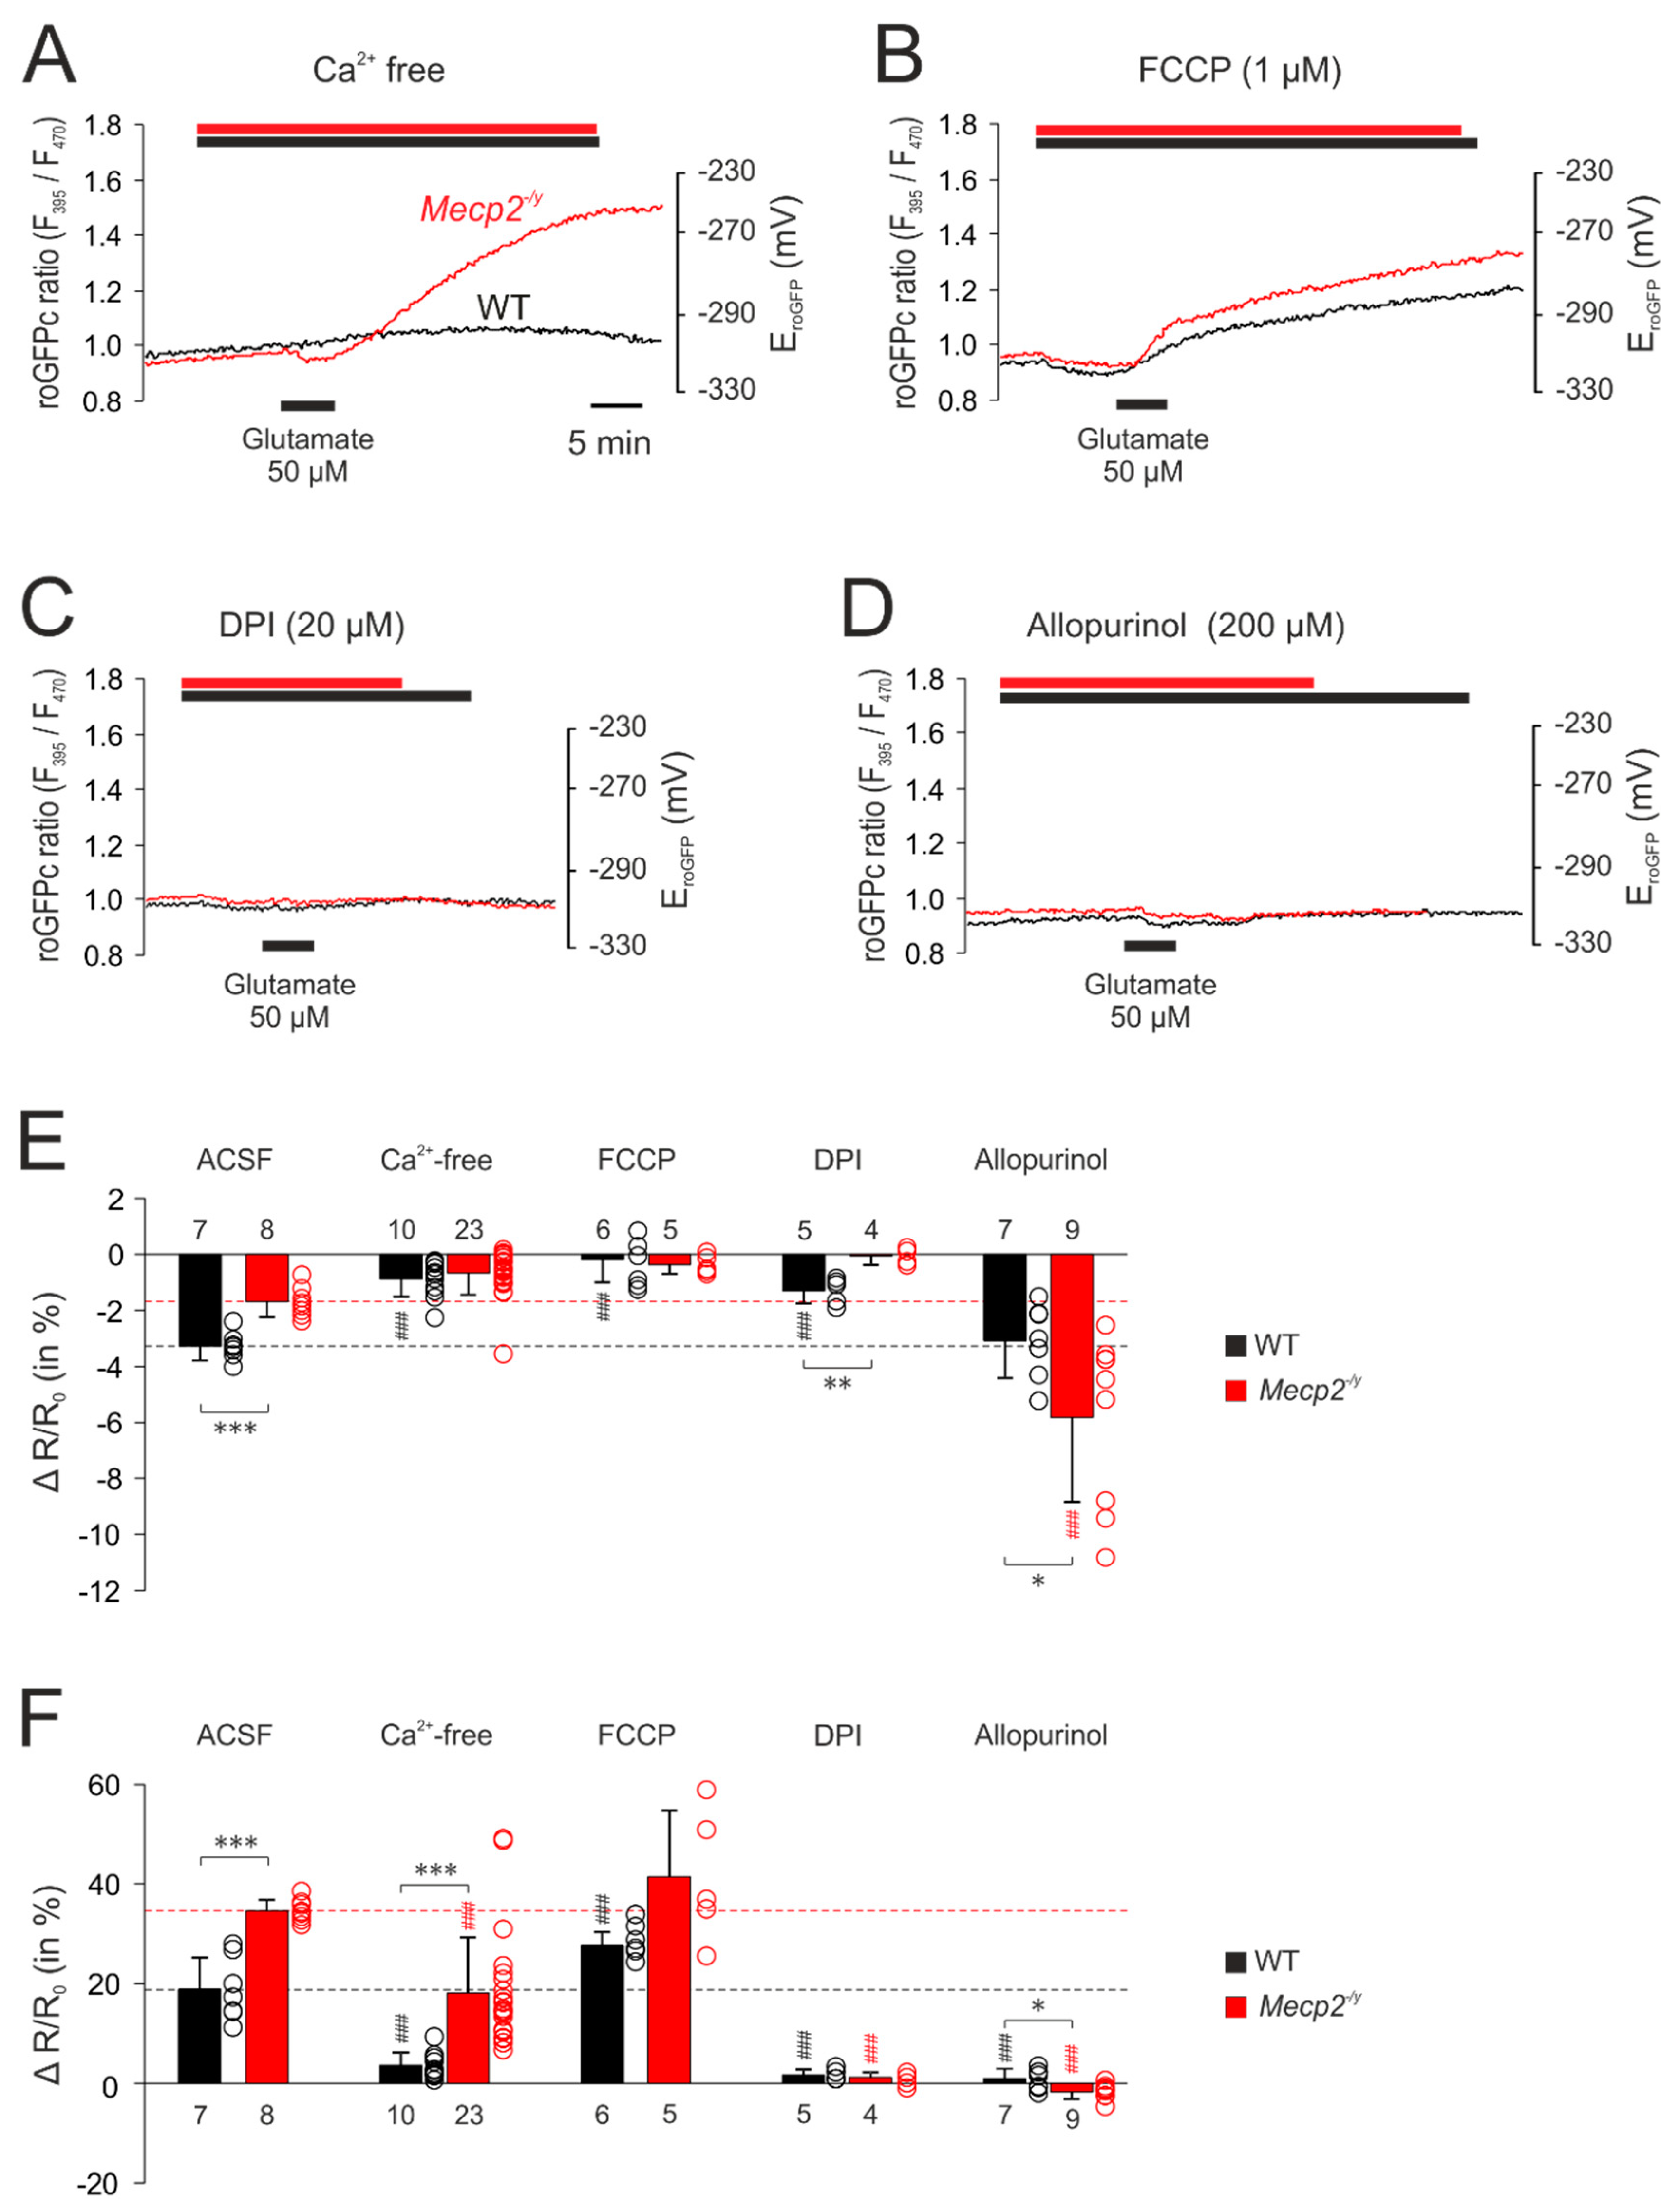
3.5. Uncovering the Redox-Signaling Pathways Involved

Since Mecp2−/y hippocampal neurons showed intensified oxidizing responses to neurotransmitter stimulation, we next elucidated potential cellular mechanisms that may contribute to these exaggerated redox responses. Since the cytosol constitutes the very cellular compartment where most cellular signalling cascades are located and integrated, we monitored cytosolic redox-balance and focused on potential mechanisms such as intracellular Ca2+ signaling, mitochondrial function, as well as cytosolic enzymes like NADPH oxidase (NOX) and xanthine oxidase (XO), which are known to be involved in cell-endogenous ROS production [77]. In these experiments, we focused on glutamate and dopamine, because glutamate evoked the most intense and largely irreversible changes in cellular redox-balance, whereas dopamine mediated clear but fully reversible oxidizing responses in the cytosol and the mitochondrial matrix.
First, the dopamine-evoked (500 µM, 3 min) redox responses were characterized upon modulation of potentially contributing cellular ROS sources and then compared among WT and Mecp2−/y neurons. The respective treatments started 8–10 min prior to neurotransmitter application.
Upon withdrawal of extracellular Ca2+ (nominally Ca2+-free solutions), noticeable changes in the cytosolic redox baselines were not evident. The subsequent application of dopamine evoked an oxidizing response (Figure 6B), as seen in control solutions (Figure 6A), but its magnitude tended to become reduced only in Mecp2−/y neurons to 10.0 ± 2.5% (p = 0.103, n = 4; Figure 6B,F). Mitochondrial uncoupling by FCCP (1 µM) induced a moderate reducing shift in both WT and Mecp2−/y neurons, indicating that functional mitochondria constantly release small amounts of oxidants into the cytosol. Under these conditions, dopamine elicited unaltered roGFPc responses in WT neurons, whereas a markedly diminished oxidizing response was seen in Mecp2−/y neurons (5.1 ± 1.3%, n = 4; Figure 6C,F). Inhibition of NADPH oxidase by DPI (20 µM) did not evoke noticeable cytosolic baseline changes, but it almost abolished the dopamine-mediated oxidation of roGFPc in both genotypes (Figure 6D,F). Blocking xanthine oxidase by allopurinol (200 µM) did not noticeably affect the baseline redox balance of WT and Mecp2−/y neurons either. In WT neurons, the dopamine-mediated oxidizing response remained unchanged, but in Mecp2−/y neurons it was markedly potentiated, now measuring 25.9 ± 9.8% (n = 9; Figure 6E,F).
The corresponding set of treatments was then performed with glutamate-mediated stimulation. Withdrawing extracellular Ca2+ almost completely abolished the glutamate-mediated responses in WT neurons. The initial reducing shift was almost absent, and the secondary oxidizing shift was markedly depressed. In Mecp2−/y neurons, the dampening effects were less pronounced. The initial reducing shift was similar to WT neurons, but the secondary oxidizing response—despite a ~48% depression, was still more intense than in WT neurons (Figure 7A,E,F). Upon mitochondrial uncoupling (1 µM FCCP), glutamate no longer evoked a noticeable initial reducing shift, but immediately elicited a pronounced cytosolic oxidation, which tended to be more intense in Mecp2−/y (41.4 ± 13.3%, n = 5) than in WT neurons (27.7 ± 2.7%; n = 6, p = 0.082). It also tended to be higher than the cytosolic oxidation observed in control solution (Figure 7B,F). Inhibition of NADPH oxidase by DPI (20 µM) almost completely abolished the responses to glutamate in both genotypes (Figure 7C,F). As shown in the summarizing bar plots, only in WT neurons, part of the initial reducing shift persisted (Figure 7E). Blockade of xanthine oxidase by allopurinol (200 µM) also almost completely abolished the glutamate-mediated oxidizing responses in the cytosol of WT and Mecp2−/y neurons. Instead, only the initial moderate reducing shift remained, and it became prolonged and was intensified especially in Mecp2−/y neurons (Figure 7D–F).

4. Discussion

In the present study, we characterized the neurotransmitter-mediated redox-changes in mitochondria and the cytosol of cultured hippocampal Mecp2−/y and WT neurons. Furthermore, by modulatory treatments, we identified the subcellular ROS sources contributing to the respective redox-responses in WT and Mecp2−/y neurons. An artefactual contribution of extracellular H2O2 formation arising from autoxidation of the dissolved neurotransmitters (in particular dopamine and norepinephrine [65]) was ruled out.
The cytosolic and the mitochondrial resting redox baselines did not differ among cultured WT and Mecp2−/y neurons, and a genotype-matched comparison of the two cell compartments did not identify any subcellular differences either (Figure 2C,D). Stimulation of the cultured neurons by neurotransmitters, however, revealed very clear compartment-specific and genotype-related differences. Each of the neurotransmitters provoked more intense oxidizing shifts in cytosol than in mitochondria. Furthermore, each neurotransmitter evoked exaggerated oxidizing responses in the cytosol of Mecp2−/y neurons as compared to WT neurons. This shows that cytosolic redox-homeostasis is markedly weakened in MeCP2-deficient neurons, as seen earlier in response to anoxia, mitochondrial poisoning and direct oxidant-stress [55,56]. Thus, physiological stimuli such as neurotransmitter signaling are also sufficient to provoke exaggerated oxidizing redox shifts in Mecp2−/y hippocampus and thereby to challenge proper cell functioning by mediating an oxidative burden. More oxidized cytosolic resting redox-baselines in Mecp2−/y neurons, as seen earlier in the more mature and structurally more complex organotypic hippocampal slices [55,56], were not evident in the dissociated cell cultures.
In WT neurons, glutamate induced the most pronounced cytosolic oxidation, followed by norepinephrine, dopamine and serotonin. In contrast, the most pronounced cytosolic oxidation of Mecp2−/y neurons was caused by norepinephrine, followed by glutamate, dopamine and serotonin. In general, dopamine-treated cells recovered best, regaining their redox baselines within minutes. The fact that some neurons did not recover from the other neurotransmitters may arise from either the minute-long treatments, the relatively high transmitter concentrations applied, or both. This was seen in particular with glutamate, which—especially when applied at higher concentrations as the 50 µM used here—may mediate potentially irreversible cell damage via NMDA-receptor activation, massive subsequent Ca2+ influx and oxidative stress [78,79]. It should be pointed out though, that this damage occurs on the time scale of several hours or even days. The induction of acute cellular damage in hippocampal cultures requires 10-fold higher glutamate levels (500 µM, 1 min application), which then causes obvious cell swelling, blebbing of dendrites and loss of spines [80]. Yet, in the same hippocampal cultures (DIV 11–18), a 1-min treatment with a slightly lower concentration of 200 µM glutamate was reported to cause only functional disturbances. Despite a near-complete depolarization, the membrane potentials of the hippocampal neurons fully recovered, which was then followed by a long-term depression of evoked excitatory postsynaptic currents for more than 20 min. Just as we observed in our cultured neurons, a sustained cellular Ca2+ increase was absent, and a rather rapid (Ca2+)i clearance occurred. Any obvious changes in dendritic morphology were not detected in this report [80], which clearly shows that even when applied at higher concentrations, glutamate may also just mediate (transient) functional disturbances.
In mitochondrial matrices, the neurotransmitter-mediated redox-changes were more moderate and more reversible. This may indicate that—despite generating ROS themselves—mitochondria are more efficiently redox-buffered than the cytosolic compartment. Of course it also needs to be considered that a significant fraction of the mitochondria derived ROS is directly produced in the intermembrane space [81], from where it may easily affect the cytosol but not necessarily enter the matrix space. Furthermore, the neurotransmitter-mediated mitochondrial redox responses were more uniform among genotypes. Only serotonin evoked intensified oxidizing shifts in the mitochondrial matrix of Mecp2−/y neurons.
By pharmacological intervention, withdrawal of extracellular Ca2+, as well as ratiometric Fura-2 imaging, we identified the mechanisms contributing to the transmitter-mediated cytosolic redox alterations. Moderate Ca2+ rises stimulate mitochondrial metabolism. As the ROS generation of mitochondria correlates with their metabolic rate, this metabolic stimulation may reflect part of the observed cytosolic and mitochondrial oxidizing responses [82]. Excessive cellular Ca2+ loads may, however, provoke mitochondrial dysfunction and the production of high amounts of ROS [82,83]. Glutamate mediated the most intense cytosolic Ca2+ increases, which—based on time-course and magnitude—represent Ca2+-influx from extracellular space. Serotonin, norepinephrine and dopamine evoked markedly less intense cytosolic Ca2+ transients by releasing Ca2+ from intracellular stores. This clearly heterogeneous nature of the recorded Ca2+ transients argues against Ca2+ being the sole cause of the transmitter-evoked oxidizing redox responses, which is confirmed by the experiments in Ca2+ free solutions.
Ca2+ withdrawal efficiently reduced the cytosolic oxidation induced by glutamate in both genotypes, but the genotypic differences persisted. This identifies Ca2+ influx as one crucial component of the redox-alterations in both genotypes, at least for stimulation by glutamate (Figure 8). The dopamine-induced oxidation, was however, diminished upon Ca2+ withdrawal in Mecp2−/y neurons only, which now showed response levels just as with WT neurons. Various reports confirm disturbed intracellular Ca2+ signaling, buffering and homeostasis in Mecp2−/y neurons and glial cells [84,85,86,87]. The only moderate Ca2+ transients induced by dopamine did, however, not differ among Mecp2−/y and WT neurons. Hence, the exaggerated dopamine-mediated redox-responses in Mecp2−/y neurons cannot arise from a cellular Ca2+-overload itself. They rather involve ROS-generating events downstream of Ca2+-signaling, as in Ca2+ free solutions, the genotypic differences in the redox responses to dopamine were abolished.
This is where mitochondria, which are considered a crucial factor in the redox-imbalance in RTT, come into play. An increased O2 consumption and H2O2 release were confirmed earlier for mitochondria isolated from hippocampus and cortex of symptomatic (7 week old) Mecp2−/y mice [55] or from the full brains of symptomatic male [54] and female Mecp2-mutant mice [59]. Our most recent report confirms that the exaggerated H2O2 release by mitochondria represents a life-long burden which affects all brain regions of male as well as female MeCP2-deficient mice [72]. Therefore, we assessed the contribution of mitochondrial ROS generation to the neurotransmitter-mediated oxidizing responses by chemical uncoupling, following the concept that mitochondrial ROS generation depends on a sufficient mitochondrial membrane potential [88,89].
FCCP evoked a noticeable reducing shift in the roGFPc ratio, indicating that mitochondrial ROS release constantly challenges cytosolic redox homeostasis. In the further experiments, FCCP markedly diminished the dopamine-mediated oxidation in Mecp2−/y neurons only, thereby reversing the genotypic differences. This confirms that in Mecp2−/y neurons, mitochondria—possibly stimulated by the moderate (Ca2+)i rise [82]—markedly contribute to the dopamine-mediated cytosolic oxidation. In contrast, the glutamate-mediated oxidation in WT neurons increased upon FCCP treatment and it tended to be higher in Mecp2−/y neurons. This shows that during glutamate-mediated stimulation, mitochondria are protective, possibly by buffering part of the pronounced cellular Ca2+ load and by providing chemical energy for the re-instatement of normal ion distribution (Figure 8). Furthermore, all of the above also indicates that non-mitochondrial cell-endogenous ROS sources contribute to the activity-related subcellular redox changes as well.
Indeed, by far the most pronounced dampening effects occurred with DPI, an inhibitor of NOX, which almost completely blocked the oxidizing responses to dopamine and to glutamate in both genotypes and thereby abolished all genotype-related differences. This identifies the cytosolic ROS production by NOX as the key factor for the redox-alterations during altered neuronal activity. In hippocampal neurons, an active NADPH oxidase was confirmed to not only contribute to intracellular ROS production [90], but to be the main source of NMDA-receptor mediated ROS generation [91]. In anoxia/reoxygenation, NOX seems to be activated by a (Ca2+)i increase [92]. A similar Ca2+-dependence is suggested by the markedly depressed cytosolic oxidation in WT neurons observed in Ca2+-free solutions upon glutamate stimulation. Accordingly, it is NOX, which plays a key role in the transmitter-mediated oxidizing responses in WT and Mecp2−/y neurons (Figure 8). This nicely correlates with findings in Rett-patient fibroblasts, in which an aberrant constitutive NOX-activation was unveiled as a crucial factor for the cellular redox-imbalance and the oxidative stress [58].
Similar to what was seen with DPI, allopurinol, an inhibitor of XO, also almost abolished the glutamate-mediated oxidation of WT and Mecp2−/y neurons. As either drug efficiently blocked the glutamate effects; this identifies NOX as well as XO as central players in the cell endogenous cytosolic ROS production. Furthermore, an interaction or sequential activation of both oxidases has to be assumed (Figure 8). Such interactions have been unveiled in pheochromocytoma PC12 cells, in which intermittent hypoxia activates XO, which—by elevating (Ca2+)i—stimulates the NAPDH oxidase to generate ROS [93]. Furthermore, a strong cellular Ca2+ load via activation of calpain may irreversibly convert XDH into the superoxide producing XO [94,95]. Likewise, mitochondria under the conditions of stress were proposed to release a protease factor that irreversibly converts XDH into XO [82,96].
The dopamine-responses in WT neurons were, however, not affected by allopurinol, and the oxidizing transients in Mecp2−/y neurons even increased under these conditions. Thus, the cooperativity of XO and NOX does not apply to the more moderate cytosolic redox- and Ca2+-responses elicited by dopamine. For this neurotransmitter rather mitochondria and NOX appear as the pivotal mediators underlying the observed cytosolic redox shift.
In conclusion, physiological stimuli such as alterations in neuronal activity mediated by neurotransmitter signaling are capable of inducing overshooting redox-alterations in MeCP2-deficient neurons. Various neurotransmitter receptors and ion-channels are among the potentially redox-regulated proteins [97], and increased levels of oxidants have been confirmed to modulate neuronal excitability and to depress synaptic plasticity [98,99]. In view of the markedly impaired neurotransmitter signaling in RTT and the altered excitatory/inhibitory balance [40,42], these overshooting redox-responses may present a further challenge for neuronal function. In particular, as these exaggerated redox responses are already evident in neonatal neurons. Here, only hippocampal neurons were studied and the question remains to be solved, to what extent such overshooting redox-responses are also present in other brain regions. Furthermore, our study was conducted on male mice only, to ensure a total lack of MeCP2 in each cell studied. In female, heterozygous Mecp2-mutant mice, this would of course apply to only those cells transcribing the mutant Mecp2 allele. Hence, due to the X chromosome mosaicism, on the neuronal-network level each cell might not be directly affected by the neurotransmitter-mediated redox distortions. Nevertheless, the RTT-related oxidative stress, the synaptic alterations and the network dysfunctions have been confirmed to also apply to the heterozygous condition, albeit at a more heterogeneous and often less severe manifestation than in hemizygous males [59,72,100,101]. Therefore, the neuronal activity-related exaggerated redox responses unveiled here have to be considered as clearly relevant for the disturbed network function in RTT, as they constitute a crucial connecting point, where altered neuronal signaling and impaired subcellular redox-homeostasis do converge in the course of RTT pathogenesis.

Author Contributions

K.F. performed and analyzed the experiments, prepared figures, contributed to manuscript writing. K.C. performed and analyzed the experiments, prepared figures, contributed to manuscript writing. S.K. designed and generated the viral constructs, commented on data and manuscript. M.M. planned and supervised the entire study, finalized the manuscript. All authors have read and agreed to the published version of the manuscript.

Funding

This research was funded by the Cluster of Excellence and DFG Research Center Nanoscale Microscopy and Molecular Physiology of the Brain (CNMPB) as well as by the University Medical Center Göttingen and the State of Lower Saxony (large scale equipment grant INST 1525/14-1 FUGG). The publication costs of this article were covered by the Open-Access-Publikationfond of the Georg-August-Universität Göttingen.

Acknowledgments

We are grateful to Belinda Kempkes for her expert technical assistance and to S. James Remington (Institute of Molecular Biology, University of Oregon, Eugene OR USA), for making available to us the plasmids expressing roGFP1 redox-sensitive proteins as well as their sequences.

Conflicts of Interest

The authors declare no conflict of interest.

Abbreviations

ΔR/R0change in fluorescence ratio, normalized to control ratio
ACSFartificial cerebrospinal fluid
DIVdays in vitro
DMSOdimethyl sulfoxide
DTT1,4-dithio-DL-threitol
DPIdiphenyleneiodonium chloride
E0′roGFPstandard redox potential
EroGFProGFP reduction potential
F 380max/F 380minfluorescence ratio at 380 nm excitation, Ca2+-free/Ca2+-saturated
F 395/F 470fluorescence ratio at 395 nm excitation and 470 nm excitation
F 470oxfluorescence intensity at 470 nm excitation, fully oxidized
F 470ox/F 470redfluorescence ratio at 470 nm, fully oxidized/fully reduced
F 470redfluorescence intensity at 470 nm excitation, fully reduced
FCCPcarbonyl cyanide 4-(trifluoromethoxy)phenylhydrazone
FCSfetal calf serum
HBSS Hanks’-balanced salt solution
HEPES4-(2-hydroxyethyl)piperazine-1-ethanesulfonic acid
MAP2microtubule associated protein 2
MeCP2methyl-CpG binding protein 2, protein
MECP2methyl-CpG binding protein 2, encoding gene (human)
Mecp2methyl-CpG binding protein 2, encoding gene (mouse)
Mecp2−/yMeCP2-deficient male mouse (hemizygous)
Mecp2+/−MeCP2-deficient female mouse (heterozygous)
MEMminimal essential medium
NOXNADPH oxidase
OxDroGFPrelative degree of roGFP oxidation
PBSphosphate buffered saline
Rfluorescence ratio
roGFPreduction oxidation-sensitive green fluorescent protein
roGFPcroGFP expressed in cytosol
roGFPmroGFP expressed in mitochondrial matrix
ROSreactive oxygen species
Roxratio corresponding to full oxidation
Rredratio corresponding to full reduction
RTTRett syndrome
SOD1superoxide dismutase 1, Cu/Zn superoxide dismutase
WTwildtype
XOxanthine oxidase
XDHxanthine dehydrogenase

References

  1. Hagberg, B. Rett’s syndrome: Prevalence and impact on progressive severe mental retardation in girls. Acta Paediatr. Scand. 1985, 74, 405–408. [Google Scholar] [CrossRef] [PubMed]
  2. Rett, A. Über ein eigenartiges hirnatrophisches Syndrom bei Hyperammonämie im Kindesalter. Wien. Med. Wochenschr. 1966, 116, 723–726. [Google Scholar] [PubMed]
  3. Chahrour, M.; Zoghbi, H.Y. The story of Rett syndrome: From clinic to neurobiology. Neuron 2007, 56, 422–437. [Google Scholar] [CrossRef] [PubMed] [Green Version]
  4. Schultz, R.J.; Glaze, D.G.; Motil, K.J.; Armstrong, D.D.; del Junco, D.J.; Hubbard, C.R.; Percy, A.K. The pattern of growth failure in Rett syndrome. Am. J. Dis. Child. 1993, 147, 633–637. [Google Scholar] [CrossRef] [PubMed]
  5. Young, D.; Nagarajan, L.; de Klerk, N.; Jacoby, P.; Ellaway, C.; Leonard, H. Sleep problems in Rett syndrome. Brain Dev. 2007, 29, 609–616. [Google Scholar] [CrossRef] [PubMed] [Green Version]
  6. Weng, S.M.; Bailey, M.E.; Cobb, S.R. Rett syndrome: From bed to bench. Pediatr. Neonatol. 2011, 52, 309–316. [Google Scholar] [CrossRef] [PubMed] [Green Version]
  7. Marschik, P.B.; Kaufmann, W.E.; Sigafoos, J.; Wolin, T.; Zhang, D.; Bartl-Pokorny, K.D.; Pini, G.; Zappella, M.; Tager-Flusberg, H.; Einspieler, C.; et al. Changing the perspective on early development of Rett syndrome. Res. Dev. Disabil. 2013, 34, 1236–1239. [Google Scholar] [CrossRef] [Green Version]
  8. Marschik, P.B.; Sigafoos, J.; Kaufmann, W.E.; Wolin, T.; Talisa, V.B.; Bartl-Pokorny, K.D.; Budimirovic, D.B.; Vollmann, R.; Einspieler, C. Peculiarities in the gestural repertoire: An early marker for Rett syndrome? Res. Dev. Disabil. 2012, 33, 1715–1721. [Google Scholar] [CrossRef] [Green Version]
  9. Amir, R.E.; Van den Veyver, I.B.; Wan, M.; Tran, C.Q.; Francke, U.; Zoghbi, H.Y. Rett syndrome is caused by mutations in X-linked MECP2, encoding methyl-CpG-binding protein 2. Nat. Genet. 1999, 23, 185–188. [Google Scholar] [CrossRef]
  10. Amir, R.E.; Zoghbi, H.Y. Rett syndrome: Methyl-CpG-binding protein 2 mutations and phenotype-genotype correlations. Am. J. Med. Genet. 2000, 97, 147–152. [Google Scholar] [CrossRef]
  11. Huppke, P.; Held, M.; Hanefeld, F.; Engel, W.; Laccone, F. Influence of mutation type and location on phenotype in 123 patients with Rett syndrome. Neuropediatrics 2002, 33, 63–68. [Google Scholar] [CrossRef] [PubMed] [Green Version]
  12. Shahbazian, M.D.; Antalffy, B.; Armstrong, D.L.; Zoghbi, H.Y. Insight into Rett syndrome: MeCP2 levels display tissue- and cell-specific differences and correlate with neuronal maturation. Hum. Mol. Genet. 2002, 11, 115–124. [Google Scholar] [CrossRef] [PubMed]
  13. Balmer, D.; Goldstine, J.; Rao, Y.M.; LaSalle, J.M. Elevated methyl-CpG-binding protein 2 expression is acquired during postnatal human brain development and is correlated with alternative polyadenylation. J. Mol. Med. 2003, 81, 61–68. [Google Scholar] [CrossRef] [PubMed]
  14. Cohen, D.R.; Matarazzo, V.; Palmer, A.M.; Tu, Y.; Jeon, O.H.; Pevsner, J.; Ronnett, G.V. Expression of MeCP2 in olfactory receptor neurons is developmentally regulated and occurs before synaptogenesis. Mol. Cell. Neurosci. 2003, 22, 417–429. [Google Scholar] [CrossRef]
  15. Kishi, N.; Macklis, J.D. MECP2 is progressively expressed in post-migratory neurons and is involved in neuronal maturation rather than cell fate decisions. Mol. Cell. Neurosci. 2004, 27, 306–321. [Google Scholar] [CrossRef] [PubMed]
  16. Mullaney, B.C.; Johnston, M.V.; Blue, M.E. Developmental expression of methyl-CpG binding protein 2 is dynamically regulated in the rodent brain. Neuroscience 2004, 123, 939–949. [Google Scholar] [CrossRef]
  17. Bauman, M.L.; Kemper, T.L.; Arin, D.M. Pervasive neuroanatomic abnormalities of the brain in three cases of Rett’s syndrome. Neurology 1995, 45, 1581–1586. [Google Scholar] [CrossRef] [PubMed]
  18. Armstrong, D.D. Neuropathology of Rett syndrome. J. Child Neurol. 2005, 20, 747–753. [Google Scholar] [CrossRef]
  19. Belichenko, P.V.; Oldfors, A.; Hagberg, B.; Dahlstrom, A. Rett syndrome: 3-D confocal microscopy of cortical pyramidal dendrites and afferents. Neuroreport 1994, 5, 1509–1513. [Google Scholar] [CrossRef]
  20. Belichenko, P.V.; Wright, E.E.; Belichenko, N.P.; Masliah, E.; Li, H.H.; Mobley, W.C.; Francke, U. Widespread changes in dendritic and axonal morphology in Mecp2-mutant mouse models of Rett syndrome: Evidence for disruption of neuronal networks. J. Comp. Neurol. 2009, 514, 240–258. [Google Scholar] [CrossRef]
  21. Zoghbi, H.Y.; Percy, A.K.; Glaze, D.G.; Butler, I.J.; Riccardi, V.M. Reduction of biogenic amine levels in the Rett syndrome. N. Engl. J. Med. 1985, 313, 921–924. [Google Scholar] [CrossRef] [PubMed]
  22. Zoghbi, H.Y.; Milstien, S.; Butler, I.J.; Smith, E.O.; Kaufman, S.; Glaze, D.G.; Percy, A.K. Cerebrospinal fluid biogenic amines and biopterin in Rett syndrome. Ann. Neurol. 1989, 25, 56–60. [Google Scholar] [CrossRef] [PubMed]
  23. Brucke, T.; Sofic, E.; Killian, W.; Rett, A.; Riederer, P. Reduced concentrations and increased metabolism of biogenic amines in a single case of Rett-syndrome: A postmortem brain study. J. Neural Transm. 1987, 68, 315–324. [Google Scholar] [CrossRef] [PubMed]
  24. Lekman, A.; Witt-Engerström, I.; Holmberg, B.; Percy, A.; Svennerholm, L.; Hagberg, B. CSF and urine biogenic amine metabolites in Rett syndrome. Clin. Genet. 1990, 37, 173–178. [Google Scholar] [CrossRef] [PubMed]
  25. Percy, A.K. Neurochemistry of the Rett syndrome. Brain Dev. 1992, 14, S57–S62. [Google Scholar] [PubMed]
  26. Segawa, M. Pathophysiology of Rett syndrome from the standpoint of early catecholamine disturbance. Eur. Child Adolesc. Psychiatry 1997, 6 (Suppl. 1), 56–60. [Google Scholar]
  27. Wenk, G.L.; Hauss-Wegrzyniak, B. Altered cholinergic function in the basal forebrain of girls with Rett syndrome. Neuropediatrics 1999, 30, 125–129. [Google Scholar] [CrossRef]
  28. Wenk, G.L. Rett syndrome: Neurobiological changes underlying specific symptoms. Prog. Neurobiol. 1997, 51, 383–391. [Google Scholar] [CrossRef]
  29. Wenk, G.L.; Mobley, S.L. Choline acetyltransferase activity and vesamicol binding in Rett syndrome and in rats with nucleus basalis lesions. Neuroscience 1996, 73, 79–84. [Google Scholar] [CrossRef]
  30. Hamberger, A.; Gillberg, C.; Palm, A.; Hagberg, B. Elevated CSF glutamate in Rett syndrome. Neuropediatrics 1992, 23, 212–213. [Google Scholar] [CrossRef]
  31. Lappalainen, R.; Riikonen, R.S. High levels of cerebrospinal fluid glutamate in Rett syndrome. Pediatr. Neurol. 1996, 15, 213–216. [Google Scholar] [CrossRef]
  32. Lappalainen, R.; Lindholm, D.; Riikonen, R. Low levels of nerve growth factor in cerebrospinal fluid of children with Rett syndrome. J. Child Neurol. 1996, 11, 296–300. [Google Scholar] [CrossRef] [PubMed]
  33. Riikonen, R.; Vanhala, R. Levels of cerebrospinal fluid nerve-growth factor differ in infantile autism and Rett syndrome. Dev. Med. Child Neurol. 1999, 41, 148–152. [Google Scholar] [CrossRef] [PubMed]
  34. Matsuishi, T.; Nagamitsu, S.; Yamashita, Y.; Murakami, Y.; Kimura, A.; Sakai, T.; Shoji, H.; Kato, H.; Percy, A.K. Decreased cerebrospinal fluid levels of substance P in patients with Rett syndrome. Ann. Neurol. 1997, 42, 978–981. [Google Scholar] [CrossRef]
  35. Deguchi, K.; Antalffy, B.A.; Twohill, L.J.; Chakraborty, S.; Glaze, D.G.; Armstrong, D.D. Substance P immunoreactivity in Rett syndrome. Pediatr. Neurol. 2000, 22, 259–266. [Google Scholar] [CrossRef]
  36. Budden, S.S.; Myer, E.C.; Butler, I.J. Cerebrospinal fluid studies in the Rett syndrome: Biogenic amines and beta-endorphins. Brain Dev. 1990, 12, 81–84. [Google Scholar] [CrossRef]
  37. Ogier, M.; Katz, D.M. Breathing dysfunction in Rett syndrome: Understanding epigenetic regulation of the respiratory network. Respir. Physiol. Neurobiol. 2008, 164, 55–63. [Google Scholar] [CrossRef] [Green Version]
  38. Jian, L.; Nagarajan, L.; de Klerk, N.; Ravine, D.; Bower, C.; Anderson, A.; Williamson, S.; Christodoulou, J.; Leonard, H. Predictors of seizure onset in Rett syndrome. J. Pediatr. 2006, 149, 542–547. [Google Scholar] [CrossRef]
  39. Goffin, D.; Zhou, Z.J. The neural circuit basis of Rett syndrome. Front. Biol. (Beijing) 2012, 7, 428–435. [Google Scholar] [CrossRef] [Green Version]
  40. Calfa, G.; Hablitz, J.J.; Pozzo-Miller, L. Network hyperexcitability in hippocampal slices from Mecp2 mutant mice revealed by voltage-sensitive dye imaging. J. Neurophysiol. 2011, 105, 1768–1784. [Google Scholar] [CrossRef] [Green Version]
  41. Fischer, M.; Reuter, J.; Gerich, F.J.; Hildebrandt, B.; Hägele, S.; Katschinski, D.; Müller, M. Enhanced hypoxia susceptibility in hippocampal slices from a mouse model of Rett syndrome. J. Neurophysiol. 2009, 101, 1016–1032. [Google Scholar] [CrossRef] [PubMed]
  42. Dani, V.S.; Chang, Q.; Maffei, A.; Turrigiano, G.G.; Jaenisch, R.; Nelson, S.B. Reduced cortical activity due to a shift in the balance between excitation and inhibition in a mouse model of Rett syndrome. Proc. Natl. Acad. Sci. USA 2005, 102, 12560–12565. [Google Scholar] [CrossRef] [PubMed] [Green Version]
  43. Mattson, M.P.; Partin, J. Evidence for mitochondrial control of neuronal polarity. J. Neurosci. Res. 1999, 56, 8–20. [Google Scholar] [CrossRef]
  44. Vayssiere, J.L.; Cordeau-Lossouarn, L.; Larcher, J.C.; Basseville, M.; Gros, F.; Croizat, B. Participation of the mitochondrial genome in the differentiation of neuroblastoma cells. In Vitro Cell. Dev. Biol. 1992, 28A, 763–772. [Google Scholar] [CrossRef] [PubMed]
  45. Chada, S.R.; Hollenbeck, P.J. Nerve growth factor signaling regulates motility and docking of axonal mitochondria. Curr. Biol. 2004, 14, 1272–1276. [Google Scholar] [CrossRef] [Green Version]
  46. Lee, C.W.; Peng, H.B. Mitochondrial clustering at the vertebrate neuromuscular junction during presynaptic differentiation. J. Neurobiol. 2006, 66, 522–536. [Google Scholar] [CrossRef]
  47. Hongpaisan, J.; Winters, C.A.; Andrews, S.B. Strong calcium entry activates mitochondrial superoxide generation, upregulating kinase signaling in hippocampal neurons. J. Neurosci. 2004, 24, 10878–10887. [Google Scholar] [CrossRef] [Green Version]
  48. Kamsler, A.; Segal, M. Paradoxical actions of hydrogen peroxide on long-term potentiation in transgenic superoxide dismutase-1 mice. J. Neurosci. 2003, 23, 10359–10367. [Google Scholar] [CrossRef] [Green Version]
  49. Cornford, M.E.; Philippart, M.; Jacobs, B.; Scheibel, A.B.; Vinters, H.V. Neuropathology of Rett syndrome: Case report with neuronal and mitochondrial abnormalities in the brain. J. Child Neurol. 1994, 9, 424–431. [Google Scholar] [CrossRef]
  50. Ruch, A.; Kurczynski, T.W.; Velasco, M.E. Mitochondrial alterations in Rett syndrome. Pediatr. Neurol. 1989, 5, 320–323. [Google Scholar] [CrossRef]
  51. Eeg-Olofsson, O.; al-Zuhair, A.G.; Teebi, A.S.; Daoud, A.S.; Zaki, M.; Besisso, M.S.; Al-Essa, M.M. Rett syndrome: A mitochondrial disease? J. Child Neurol. 1990, 5, 210–214. [Google Scholar] [CrossRef] [PubMed]
  52. Coker, S.B.; Melnyk, A.R. Rett syndrome and mitochondrial enzyme deficiencies. J. Child Neurol. 1991, 6, 164–166. [Google Scholar] [CrossRef] [PubMed]
  53. Gibson, J.H.; Slobedman, B.; Harikrishnan, K.N.; Williamson, S.L.; Minchenko, D.; El-Osta, A.; Stern, J.L.; Christodoulou, J. Downstream targets of methyl CpG binding protein 2 and their abnormal expression in the frontal cortex of the human Rett syndrome brain. BMC Neurosci. 2010, 11, 53. [Google Scholar] [CrossRef] [PubMed] [Green Version]
  54. Kriaucionis, S.; Paterson, A.; Curtis, J.; Guy, J.; Macleod, N.; Bird, A. Gene expression analysis exposes mitochondrial abnormalities in a mouse model of Rett syndrome. Mol. Cell. Biol. 2006, 26, 5033–5042. [Google Scholar] [CrossRef] [Green Version]
  55. Can, K.; Menzfeld, C.; Rinne, L.; Rehling, P.; Kügler, S.; Golubiani, G.; Dudek, J.; Müller, M. Neuronal redox-imbalance in Rett syndrome affects mitochondria as well as cytosol, and is accompanied by intensified mitochondrial O2 consumption and ROS release. Front. Physiol. 2019, 10, 479. [Google Scholar] [CrossRef]
  56. Großer, E.; Hirt, U.; Janc, O.A.; Menzfeld, C.; Fischer, M.; Kempkes, B.; Vogelgesang, S.; Manzke, T.U.; Opitz, L.; Salinas-Riester, G.; et al. Oxidative burden and mitochondrial dysfunction in a mouse model of Rett syndrome. Neurobiol. Dis. 2012, 48, 102–114. [Google Scholar] [CrossRef]
  57. Bebensee, D.F.; Can, K.; Müller, M. Increased Mitochondrial Mass and Cytosolic Redox Imbalance in Hippocampal Astrocytes of a Mouse Model of Rett Syndrome: Subcellular Changes Revealed by Ratiometric Imaging of JC-1 and roGFP1 Fluorescence. Oxid. Med. Cell. Longev. 2017, 2017, 3064016. [Google Scholar] [CrossRef] [Green Version]
  58. Cervellati, C.; Sticozzi, C.; Romani, A.; Belmonte, G.; De Rasmo, D.; Signorile, A.; Cervellati, F.; Milanese, C.; Mastroberardino, P.G.; Pecorelli, A.; et al. Impaired enzymatic defensive activity, mitochondrial dysfunction and proteasome activation are involved in RTT cell oxidative damage. Biochim. Biophys. Acta 2015, 1852, 2066–2074. [Google Scholar] [CrossRef] [Green Version]
  59. De Filippis, B.; Valenti, D.; de Bari, L.; De Rasmo, D.; Musto, M.; Fabbri, A.; Ricceri, L.; Fiorentini, C.; Laviola, G.; Vacca, R.A. Mitochondrial free radical overproduction due to respiratory chain impairment in the brain of a mouse model of Rett syndrome: Protective effect of CNF1. Free Radic. Biol. Med. 2015, 83, 167–177. [Google Scholar] [CrossRef]
  60. Müller, M.; Can, K. Aberrant redox homoeostasis and mitochondrial dysfunction in Rett syndrome. Biochem. Soc. Trans. 2014, 42, 959–964. [Google Scholar] [CrossRef]
  61. Shulyakova, N.; Andreazza, A.C.; Mills, L.R.; Eubanks, J.H. Mitochondrial dysfunction in the pathogenesis of Rett syndrome: Implications for mitochondria-targeted therapies. Front. Cell. Neurosci. 2017, 11, 58. [Google Scholar] [CrossRef] [PubMed] [Green Version]
  62. Armstrong, D.; Dunn, J.K.; Antalffy, B.; Trivedi, R. Selective dendritic alterations in the cortex of Rett syndrome. J. Neuropathol. Exp. Neurol. 1995, 54, 195–201. [Google Scholar] [CrossRef] [PubMed]
  63. Boggio, E.M.; Lonetti, G.; Pizzorusso, T.; Giustetto, M. Synaptic determinants of Rett syndrome. Front. Synaptic Neurosci. 2010, 2, 28. [Google Scholar] [CrossRef] [PubMed] [Green Version]
  64. Guy, J.; Hendrich, B.; Holmes, M.; Martin, J.E.; Bird, A. A mouse Mecp2-null mutation causes neurological symptoms that mimic Rett syndrome. Nat. Genet. 2001, 27, 322–326. [Google Scholar] [CrossRef]
  65. Clement, M.V.; Long, L.H.; Ramalingam, J.; Halliwell, B. The cytotoxicity of dopamine may be an artefact of cell culture. J. Neurochem. 2002, 81, 414–421. [Google Scholar] [CrossRef] [Green Version]
  66. Hanson, G.T.; Aggeler, R.; Oglesbee, D.; Cannon, M.; Capaldi, R.A.; Tsien, R.Y.; Remington, S.J. Investigating mitochondrial redox potential with redox-sensitive green fluorescent protein indicators. J. Biol. Chem. 2004, 279, 13044–13053. [Google Scholar] [CrossRef] [Green Version]
  67. Can, K.; Kügler, S.; Müller, M. Live imaging of mitochondrial ROS production and dynamic redox balance in neurons. In Techniques to Investigate Mitochondrial Function in Neurons; Strack, S., Usachev, Y.M., Eds.; Springer Science+Business Media: Berlin, Germany, 2017; Volume 123, pp. 179–197. [Google Scholar]
  68. Funke, F.; Gerich, F.; Müller, M. Dynamic, semi-quantitative imaging of intracellular ROS levels and redox status in rat hippocampal neurons. Neuroimage 2011, 54, 2590–2602. [Google Scholar] [CrossRef]
  69. Meyer, A.J.; Dick, T.P. Fluorescent protein-based redox probes. Antioxid. Redox Signal. 2010, 13, 621–650. [Google Scholar] [CrossRef]
  70. Müller, M.; Ballanyi, K. Dynamic recording of cell death in the in vitro dorsal vagal nucleus of rats in response to metabolic arrest. J. Neurophysiol. 2003, 89, 551–561. [Google Scholar] [CrossRef]
  71. Grynkiewicz, G.; Poenie, M.; Tsien, R.Y. A new generation of Ca2+ indicators with greatly improved fluorescence properties. J. Biol. Chem. 1985, 260, 3440–3450. [Google Scholar]
  72. Adebayo, O.L.; Dewenter, I.; Rinne, L.; Golubiani, G.; Solomonia, R.; Müller, M. Intensified mitochondrial hydrogen peroxide release occurs in all brain regions, affects male as well as female Rett mice, and constitutes a life-long burden. Arch Biochem. Biophys. 2020, 696, 108666. [Google Scholar] [CrossRef] [PubMed]
  73. Smialowski, A.; Bijak, M. Excitatory and inhibitory action of dopamine on hippocampal neurons in vitro. Involvement of D2 and D1 receptors. Neuroscience 1987, 23, 95–101. [Google Scholar] [CrossRef]
  74. Ropert, N. Inhibitory action of serotonin in CA1 hippocampal neurons in vitro. Neuroscience 1988, 26, 69–81. [Google Scholar] [CrossRef]
  75. Madison, D.V.; Nicoll, R.A. Norepinephrine decreases synaptic inhibition in the rat hippocampus. Brain Res. 1988, 442, 131–138. [Google Scholar] [CrossRef]
  76. Brustovetsky, T.; Li, V.; Brustovetsky, N. Stimulation of glutamate receptors in cultured hippocampal neurons causes Ca2+-dependent mitochondrial contraction. Cell Calcium 2009, 46, 18–29. [Google Scholar] [CrossRef] [Green Version]
  77. Dröge, W. Free radicals in the physiological control of cell function. Physiol. Rev. 2002, 82, 47–95. [Google Scholar] [CrossRef]
  78. Choi, D.W.; Koh, J.Y.; Peters, S. Pharmacology of glutamate neurotoxicity in cortical cell culture: Attenuation by NMDA antagonists. J. Neurosci. 1988, 8, 185–196. [Google Scholar] [CrossRef]
  79. Savolainen, K.M.; Loikkanen, J.; Naarala, J. Amplification of glutamate-induced oxidative stress. Toxicol. Lett. 1995, 82–83, 399–405. [Google Scholar] [CrossRef]
  80. Sapoznik, S.; Ivenshitz, M.; Segal, M. Age-dependent glutamate induction of synaptic plasticity in cultured hippocampal neurons. Learn. Mem. 2006, 13, 719–726. [Google Scholar] [CrossRef] [Green Version]
  81. Brand, M.D. The sites and topology of mitochondrial superoxide production. Exp. Gerontol. 2010, 45, 466–472. [Google Scholar] [CrossRef] [Green Version]
  82. Brookes, P.S.; Yoon, Y.; Robotham, J.L.; Anders, M.W.; Sheu, S.S. Calcium, ATP, and ROS: A mitochondrial love-hate triangle. Am. J. Physiol. Cell Physiol. 2004, 287, C817–C833. [Google Scholar] [CrossRef] [PubMed]
  83. Adam-Vizi, V.; Starkov, A.A. Calcium and mitochondrial reactive oxygen species generation: How to read the facts. J. Alzheimer’s Dis. 2010, 20 (Suppl. 2), S413–S426. [Google Scholar] [CrossRef] [PubMed] [Green Version]
  84. Kron, M.; Müller, M. Impaired hippocampal Ca2+ homeostasis and concomitant K+ channel dysfunction in a mouse model of Rett syndrome during anoxia. Neuroscience 2010, 171, 300–315. [Google Scholar] [CrossRef] [PubMed]
  85. Balakrishnan, S.; Mironov, S.L. Regenerative glutamate release in the hippocampus of Rett syndrome model mice. PLoS ONE 2018, 13, e0202802. [Google Scholar] [CrossRef] [Green Version]
  86. Dong, Q.; Liu, Q.; Li, R.; Wang, A.; Bu, Q.; Wang, K.H.; Chang, Q. Mechanism and consequence of abnormal calcium homeostasis in Rett syndrome astrocytes. Elife 2018, 7, e33417. [Google Scholar] [CrossRef]
  87. Mironov, S.L.; Skorova, E.; Hartelt, N.; Mironova, L.A.; Hasan, M.T.; Kügler, S. Remodelling of the respiratory network in a mouse model of Rett syndrome depends on brain-derived neurotrophic factor regulated slow calcium buffering. J. Physiol. 2009, 587, 2473–2485. [Google Scholar] [CrossRef]
  88. Starkov, A.A.; Fiskum, G. Regulation of brain mitochondrial H2O2 production by membrane potential and NAD(P)H redox state. J. Neurochem. 2003, 86, 1101–1107. [Google Scholar] [CrossRef]
  89. Korshunov, S.S.; Skulachev, V.P.; Starkov, A.A. High protonic potential actuates a mechanism of production of reactive oxygen species in mitochondria. FEBS Lett. 1997, 416, 15–18. [Google Scholar] [CrossRef] [Green Version]
  90. Tejada-Simon, M.V.; Serrano, F.; Villasana, L.E.; Kanterewicz, B.I.; Wu, G.Y.; Quinn, M.T.; Klann, E. Synaptic localization of a functional NADPH oxidase in the mouse hippocampus. Mol. Cell. Neurosci. 2005, 29, 97–106. [Google Scholar] [CrossRef] [Green Version]
  91. Brennan, A.M.; Suh, S.W.; Won, S.J.; Narasimhan, P.; Kauppinen, T.M.; Lee, H.; Edling, Y.; Chan, P.H.; Swanson, R.A. NADPH oxidase is the primary source of superoxide induced by NMDA receptor activation. Nat. Neurosci. 2009, 12, 857–863. [Google Scholar] [CrossRef] [Green Version]
  92. Abramov, A.Y.; Scorziello, A.; Duchen, M.R. Three distinct mechanisms generate oxygen free radicals in neurons and contribute to cell death during anoxia and reoxygenation. J. Neurosci. 2007, 27, 1129–1138. [Google Scholar] [CrossRef] [PubMed]
  93. Nanduri, J.; Vaddi, D.R.; Khan, S.A.; Wang, N.; Makarenko, V.; Semenza, G.L.; Prabhakar, N.R. HIF-1alpha activation by intermittent hypoxia requires NADPH oxidase stimulation by xanthine oxidase. PLoS ONE 2015, 10, e0119762. [Google Scholar] [CrossRef] [PubMed] [Green Version]
  94. Cheng, Y.; Sun, A.Y. Oxidative mechanisms involved in kainate-induced cytotoxicity in cortical neurons. Neurochem. Res. 1994, 19, 1557–1564. [Google Scholar] [CrossRef] [PubMed]
  95. Dykens, J.A.; Stern, A.; Trenkner, E. Mechanism of kainate toxicity to cerebellar neurons in vitro is analogous to reperfusion tissue injury. J. Neurochem. 1987, 49, 1222–1228. [Google Scholar] [CrossRef] [PubMed]
  96. Saksela, M.; Lapatto, R.; Raivio, K.O. Irreversible conversion of xanthine dehydrogenase into xanthine oxidase by a mitochondrial protease. FEBS Lett. 1999, 443, 117–120. [Google Scholar] [CrossRef] [Green Version]
  97. Weerapana, E.; Wang, C.; Simon, G.M.; Richter, F.; Khare, S.; Dillon, M.B.; Bachovchin, D.A.; Mowen, K.; Baker, D.; Cravatt, B.F. Quantitative reactivity profiling predicts functional cysteines in proteomes. Nature 2010, 468, 790–795. [Google Scholar] [CrossRef] [Green Version]
  98. Kamsler, A.; Segal, M. Hydrogen peroxide modulation of synaptic plasticity. J. Neurosci. 2003, 23, 269–276. [Google Scholar] [CrossRef]
  99. Pellmar, T.C. Peroxide alters neuronal excitability in the CA1 region of guinea-pig hippocampus in vitro. Neuroscience 1987, 23, 447–456. [Google Scholar] [CrossRef]
  100. Calfa, G.; Percy, A.K.; Pozzo-Miller, L. Experimental models of Rett syndrome based on Mecp2 dysfunction. Exp. Biol. Med. 2011, 236, 3–19. [Google Scholar] [CrossRef] [Green Version]
  101. De Felice, C.; Della Ragione, F.; Signorini, C.; Leoncini, S.; Pecorelli, A.; Ciccoli, L.; Scalabri, F.; Marracino, F.; Madonna, M.; Belmonte, G.; et al. Oxidative brain damage in Mecp2-mutant murine models of Rett syndrome. Neurobiol. Dis. 2014, 68, 66–77. [Google Scholar] [CrossRef]
Figure 1. Confirming cellular specificity and proper subcellular targeting of roGFP. (A) As proven by MAP2 immunolabeling, roGFPc was expressed homogenously in the cultured hippocampal neurons. Displayed cells were PFA-fixed, immunolabeled and viewed with an epifluorescence microscope. MAP2 and roGFP fluorescence are displayed in pseudo-colors. (B) MitoTracker RED FM counterlabeling verified that roGFPm is specifically expressed in the mitochondrial matrix of neurons. MitoTracker-labeling was performed in viable cultures and neuronal mitochondria were visualized with a 2-photon microscope. MitoTracker and roGFP fluorescence are shown in pseudo-colors.
Cells 09 02539 g001
Figure 2. Calibration of the response ranges of roGFPc and roGFPm. (A) Calibration experiment performed for roGFPm. Reduction of roGFPm decreases the fluorescence ratio (F395/F470), whereas oxidation corresponds to an increased ratio. Maximum reduction and oxidation of roGFPm was evoked by DTT and H2O2, respectively. Ideally, both treatments are to be recorded in the same cell, also alternating the order of treatments among cells. (B) Box plot of the determined responses ranges. The ceiling of each box identifies the maximally oxidized roGFP ratio; the floor indicates the maximally reduced state. Error bars represent standard deviations of the ratiometric values. Response ranges were identical for cytosol-expressed (roGFPc) and mitochondria-targeted roGFP (roGFPm). Numerical figures in the box indicate how many calibrations were performed. They slightly differ for full oxidation and reduction, as not each cell undergoing maximum oxidation as a first treatment fully recovered and therefore did not undergo the following reducing treatment. (C) Steady state resting baseline conditions determined in cytosol and mitochondrial matrix of WT and Mecp2−/y neurons. Plotted is the relative degree of roGFP oxidation, as calculated from the calibration parameters (see Equation (1)). The number of cells analyzed is indicated below each bar. (D) Summary of the roGFP reduction potentials calculated for the different cell compartments and genotypes (see Equation (2)).
Cells 09 02539 g002
Figure 3. Mecp2−/y neurons show intensified cytosolic redox-responses to neurotransmitter stimulation. (A) Glutamate induced an initial reducing shift. It then turned into a clear oxidation of roGFPc, which was markedly more intense in Mecp2−/y neurons. Plotted are the roGFP ratios and on the right-hand ordinate the corresponding redox potentials are indicated. Time scaling also applies to all other panels. (B) Serotonin also mediated a more intense oxidation of roGFPc in Mecp2−/y neurons. (C) Norepinephrine shifted roGFPc fluorescence to a more oxidized level in Mecp2−/y neurons. (D) Dopamine induced fully reversible oxidizing shifts in both genotypes, which again were more pronounced in Mecp2−/y than in WT neurons. (E) No changes in roGFPc fluorescence were evident, when neurons were just imaged for ~60 min without any additional treatment (n = 6). (F) Statistical summary of the neurotransmitter-mediated redox-alterations in WT and Mecp2−/y neurons. Plotted are the normalized transmitter-induced changes in the roGFPc fluorescence ratio (ΔR/Ro). On the right-hand of each bar, the scatter of the respective data is indicated as a dot plot. Genotype-related differences are indicated by asterisks (* p < 0.05, *** p < 0.001; unpaired t-test/Mann–Whitney rank sum test). The number of cells tested for a given treatment is reported for each bar.
Cells 09 02539 g003
Figure 4. Neurotransmitter stimulation mediated only moderate redox-responses in mitochondrial matrices. (A) Glutamate also induced biphasic redox-responses in the mitochondria. The initial reducing shift and the secondary oxidation of roGFPm did, however, not differ among genotypes. (B) Serotonin mediated a moderate oxidation of roGFPm, which was clearly more intense in Mecp2−/y than in WT neurons. (C) Norepinephrine evoked only a very moderate oxidation of roGFPm, which was identical in both genotypes. (D) Dopamine mediated comparable oxidizing shifts in the mitochondrial matrix of WT and Mecp2−/y neurons. (E) Summarizing bar plot of neurotransmitter-evoked changes in mitochondrial redox balance. (* p < 0.05; Mann–Whitney rank sum test). Plotted are the normalized changes in the roGFP ratio (ΔR/Ro), and the dot-plots signify the scatter of the underlying data.
Cells 09 02539 g004
Figure 5. Neurotransmitter-induced cytosolic Ca2+ transients. (A) Glutamate mediated a sudden, marked increase in (Ca2+)i suggesting influx from extracellular space. (B) In response to serotonin, the (Ca2+)i only increased slowly and then showed a secondary increase, which did not recover within the observation time of ~15 min. (C) Norepinephrine induced only moderate changes in (Ca2+)i, which were slightly more intense in WT neurons and recovered only slowly to baseline conditions. (D) Dopamine mediated moderate increases in (Ca2+)i, which fully recovered and did not differ among genotypes. (E) Summary of cytosolic Ca2+ transients evoked by neurotransmitter stimulation in WT and Mecp2−/y neurons. Plotted are the averaged changes in (Ca2+)i as well as the scatter range of the underlying data. The number of neurons that underwent a respective treatment is indicated below each bar. Asterisks mark significant differences among WT and Mecp2−/y neurons (* p < 0.05, ** p< 0.01; Mann–Whitney rank sum test).
Cells 09 02539 g005
Figure 6. Mitochondria as well as extra-mitochondrial reactive oxygen species (ROS) sources contribute to the dopamine-mediated cytosolic oxidation. (A) Dopamine-mediated roGFPc responses observed in WT and Mecp2−/y neurons under artificial cerebrospinal fluid (ACSF) control conditions. (B) Withdrawal of extracellular Ca2+ dampened the dopamine-mediated oxidation in Mecp2−/y neurons only. (C) Mitochondrial uncoupling by carbonyl cyanide 4-(trifluoromethoxy)phenylhydrazone (FCCP) moderately reduced roGFPc. Subsequent addition of dopamine evoked a less intense roGFPc oxidation in Mecp2−/y neurons, whereas the WT responses remained unchanged. (D) Inhibition of NADPH oxidase by diphenyleneiodonium chloride (DPI) markedly depressed the dopamine-induced cytosolic oxidation in both, WT and Mecp2−/y neurons. (E) Blocking xanthine oxidase by allopurinol did not modify the responses of WT neurons to dopamine, but it markedly increased the responses of Mecp2−/y neurons. (F) Summary of dopamine-mediated oxidizing responses, in other words, normalized increases in the roGFP ratio (ΔR/Ro), recorded upon modulation of various cellular ROS sources. The dotted horizontal lines refer to the magnitude of the dopamine responses in WT and Mecp2−/y neurons under control conditions. Asterisks indicate genotype-related differences (* p < 0.05, ** p < 0.01; unpaired t-test). Significant differences as compared to the control response of each genotype (ACSF) are identified by cross-hatches (## p < 0.01, ### p < 0.001; ANOVA, Holm–Sidak test). The dot plots indicate the scatter of the respective data.
Cells 09 02539 g006
Figure 7. Mitochondrial and extra-mitochondrial sources contribute to the glutamate-mediated oxidation of roGFPc. (A) Withdrawal of extracellular Ca2+ markedly depressed the glutamate-mediated oxidation of roGFPc in WT neurons and partly reduced it in Mecp2−/y neurons. (B) The uncoupling agent FCCP by itself mediated a slight reduction of roGFPc. Subsequent glutamate application induced a more intense oxidation of roGFPc in WT neurons; in Mecp2−/y neurons, the glutamate-mediated oxidation tended to increase. (C) Blockade of NADPH oxidase by DPI almost abolished the glutamate-mediated oxidizing responses in both genotypes. (D) Inhibition of xanthine oxidase by allopurinol severely depressed the glutamate-mediated roGFPc oxidation in both, WT and Mecp2−/y neurons. (E) Modulation of the glutamate-mediated initial reducing shift by the various treatments assessed. Plotted are the normalized changes in the roGFP ratio (ΔR/Ro), and significant differences among genotypes in this and the following panel are indicated by asterisks (* p < 0.05, ** p < 0.01, *** p < 0.001; unpaired t-test/Mann–Whitney rank sum test). Significant differences as compared to the control responses of the given genotype (ACSF) are indicated by cross-hatches (### p < 0.001; ANOVA, Holm–Sidak test). Dot plots indicate the scatter of the respective data. (F) Modulation of the glutamate-induced oxidization of roGFPc. Note that most intense antagonistic effects were observed upon inhibition of NADPH-oxidase and xanthine oxidase.
Cells 09 02539 g007
Figure 8. Summarizing schematic showing that mitochondria as well as xanthine oxidase (XO) and NAHPH oxidase (NOX) differently contribute to the neurotransmitter-mediated oxidizing responses. In the case of glutamate, massive Ca2+ influx mediates a downstream activation of XO and NOX. In contrast, in the case of dopamine stimulation, which only mediates moderate Ca2+ transients, mitochondria as well as NOX were identified as the main mediators of the oxidizing cellular responses.
Cells 09 02539 g008
Publisher’s Note: MDPI stays neutral with regard to jurisdictional claims in published maps and institutional affiliations.

