Article

Different Resistance Exercise Loading Paradigms Similarly Affect Skeletal Muscle Gene Expression Patterns of Myostatin-Related Targets and mTORC1 Signaling Markers

1
School of Kinesiology, Auburn University, Auburn, AL 36849, USA
2
Center for Applied Health Sciences, Canfield, OH 44406, USA
3
TruDiagnotic, Lexington, KY 40511, USA
4
Institute for Physical Performance, Norwegian School of Sport Sciences, 0164 Oslo, Norway
5
School of Health, Medical and Applied Sciences, Central Queensland University, Rockhampton 4700, Australia
6
Duke Molecular Physiology Institute, Duke University School of Medicine, Durham, NC 03824, USA
*
Authors to whom correspondence should be addressed.
Cells 2023, 12(6), 898; https://doi.org/10.3390/cells12060898
Submission received: 17 February 2023 / Revised: 10 March 2023 / Accepted: 14 March 2023 / Published: 15 March 2023
(This article belongs to the Special Issue Cellular Plasticity of the Neuromuscular System)

Abstract

:
Although transcriptome profiling has been used in several resistance training studies, the associated analytical approaches seldom provide in-depth information on individual genes linked to skeletal muscle hypertrophy. Therefore, a secondary analysis was performed herein on a muscle transcriptomic dataset we previously published involving trained college-aged men (n = 11) performing two resistance exercise bouts in a randomized and crossover fashion. The lower-load bout (30 Fail) consisted of 8 sets of lower body exercises to volitional fatigue using 30% one-repetition maximum (1 RM) loads, whereas the higher-load bout (80 Fail) consisted of the same exercises using 80% 1 RM loads. Vastus lateralis muscle biopsies were collected prior to (PRE), 3 h, and 6 h after each exercise bout, and 58 genes associated with skeletal muscle hypertrophy were manually interrogated from our prior microarray data. Select targets were further interrogated for associated protein expression and phosphorylation induced-signaling events. Although none of the 58 gene targets demonstrated significant bout x time interactions, ~57% (32 genes) showed a significant main effect of time from PRE to 3 h (15↑ and 17↓, p < 0.01), and ~26% (17 genes) showed a significant main effect of time from PRE to 6 h (8↑ and 9↓, p < 0.01). Notably, genes associated with the myostatin (9 genes) and mammalian target of rapamycin complex 1 (mTORC1) (9 genes) signaling pathways were most represented. Compared to mTORC1 signaling mRNAs, more MSTN signaling-related mRNAs (7 of 9) were altered post-exercise, regardless of the bout, and RHEB was the only mTORC1-associated mRNA that was upregulated following exercise. Phosphorylated (phospho-) p70S6K (Thr389) (p = 0.001; PRE to 3 h) and follistatin protein levels (p = 0.021; PRE to 6 h) increased post-exercise, regardless of the bout, whereas phospho-AKT (Thr389), phospho-mTOR (Ser2448), and myostatin protein levels remained unaltered. These data continue to suggest that performing resistance exercise to volitional fatigue, regardless of load selection, elicits similar transient mRNA and signaling responses in skeletal muscle. Moreover, these data provide further evidence that the transcriptional regulation of myostatin signaling is an involved mechanism in response to resistance exercise.

1. Introduction

Resistance training promotes increases in strength and skeletal muscle hypertrophy [1]. Increasing interest has surrounded how implementing different volume loads affects the cellular responses in the skeletal muscle [2,3,4,5]. Although results from studies examining differences between low and high load resistance training have varied and are difficult to generalize, a relatively consistent theme has emerged suggesting that lower load/higher volume training and higher load/lower volume training promote similar increases in skeletal muscle hypertrophy [4,6]. However, there are unique muscle-molecular differences that have been reported to occur from both forms of training [7]. For instance, evidence exists suggesting lower load/higher volume training elicits more robust mitochondrial adaptations and a greater enhancement in the expression of metabolism-related proteins compared to higher load/lower volume training [8,9,10].
Skeletal muscle molecular responses to resistance exercise are often determined by examining changes in DNA methylation [11,12,13,14], mRNA expression [15,16,17,18,19], and protein expression [8,9,20]. DNA methylation is a mechanism that alters mRNA expression, whereby increased methylation can suppress mRNA expression and suppressed mRNA expression can lead to suppressed protein expression [21]. Our laboratory recently published a report in this special issue investigating how an acute bout of resistance exercise utilizing different volume-load paradigms affected the muscle-molecular milieu [22], specifically mRNA expression and DNA methylation. As we previously reported, the study involved previously trained college-aged males (n = 11; age = 23 ± 4 years old; body mass = 86 ± 12 kg; training experience = 4 ± 3 years) performing two resistance exercise bouts (back squats and leg extensions) at either 30% (30 Fail) of their estimated 1 RM or 80% (80 Fail) of their estimated 1 RM separated by one week. Vastus lateralis muscle biopsies were collected before (PRE), 3 h, and 6 h after each exercise bout, and DNA, along with RNA, were batch-isolated from muscle tissue and analyzed for genome-wide DNA methylation and mRNA expression using the 850 k Illumina MethylationEPIC array and Clariom S mRNA array, respectively. Considerable alterations in both the methylome and transcriptome occurred in the 3 h and 6 h post-exercise period following both the bouts, and bioinformatics analyses indicated that both bouts affected similar pathways (“focal adhesion”, “MAPK signaling”, and “P13K-Akt signaling”). However, the responses between bouts (as determined through bioinformatics) were largely similar. While insights provided through differential expression pipelines are generally useful, it is important to recognize that these applications are more suitable for discovery-based analyses versus mechanistic-based analyses [23,24].
As it relates to the interrogation of genes mechanistically associated with skeletal muscle hypertrophy, existing differential expression pipelines and subsequent pathway analysis tools are limited in their ability to predict a gene’s role in this process. Likewise, gene lists for skeletal muscle hypertrophy (Gene Ontology Consortium; 2021) are perhaps misleading given that genetic manipulation models and other mechanistic preclinical models (e.g., gene therapy and electroporation) have indicated that the knockout, knockdown, or overexpression of dozens of genes alter skeletal muscle mass in adult rodents [23,25,26,27,28,29,30,31,32]. In stark contrast to the underrepresentation of skeletal muscle hypertrophy-associated genes, expansive GOC gene lists of Biological Processes, such as “Cell Adhesion” (1500 genes; GO:0098602), “Cell Cycle” (1809 genes; GO:0007049), “Cell Death” (2237 genes; GO:0008219), and “Inflammation” (784 genes; GO:0006954). Accordingly, human resistance exercise research utilizing bioinformatics to interpret acute or longer-term skeletal muscle transcriptomic datasets have generally garnered ambiguous information to the detriment of “drowning out” genes or gene pathways that may be critical to skeletal muscle hypertrophy. This is evident with our own findings suggesting that 30 Fail and 80 Fail exercise bouts acutely altered muscle mRNAs predicted to affect “inflammatory signaling”, “apoptosis signaling”, and “gonadotropin-releasing hormone signaling” [22], while not gaining insight as to whether genes associated with skeletal muscle hypertrophy were affected. Similarly, others have reported that resistance exercise alters genes involved in “macrophage anti-inflammatory polarization” [18] or “stress and cellular compromise, inflammation and immune responses, and necrosis” [33]. It has been recognized that bioinformatics platforms yield limited information on muscle biology and, alternatively, provide pathway and biological process terms that are more relatable to basic cellular biology, cancers, and diseases [34,35,36]. The bias towards alternate biological processes in research conducted using bioinformatics platforms is likely due to the foundational establishment of bioinformatics pipelines and methods being performed by geneticists [37] and cancer biologists [38]. As a result, the information pertaining specifically to skeletal muscle hypertrophy pathways on bioinformatics platforms is underwhelming.
Herein, we sought to fulfill multiple aims in the current study. First, we examined how 30 Fail versus 80 Fail training affected skeletal muscle mRNAs identified from a literature search that have been linked to skeletal muscle mass regulation using preclinical models [23,25,26]. Further, we interrogated protein and phosphorylated-protein markers of select targets to examine the downstream implications of our transcriptomic analysis. Due to the exploratory nature of this study, we adopted a null hypothesis for all aims herein.

2. Methods

2.1. Participants and Ethical Approval

This study was conducted with prior review and approval from the Auburn University Institutional Review Board and in accordance with the most recent revisions of the Declaration of Helsinki (IRB approval #: 20-081 MR 2003). Raw DNA methylation data and mRNA data can be found in the Gene Expression Omnibus (www.ncbi.nlm.nih.gov/geo/; GEO accession numbers: GSE220928 for DNA methylation data (public on 14 December 2022), and GSE220899 for mRNA array data (scheduled for release on 1 June 2023)).
College-aged males (n = 11) were recruited from the local community, and all were required to have participated in lower-body training at least once per week over the last 6 months. Other details regarding inclusion and exclusion criteria can be found in the parent publication by Sexton et al. [22].

2.2. Study Design

A more comprehensive description of the study design and methodology can be found in Sexton et al. [22]. Briefly, a crossover study design was implemented that included a total of five laboratory visits. Informed consent and screening forms were completed at visit 1, and following these procedures, participants performed maximal strength testing on the barbell-back and knee extension exercises. Visit 2 consisted of vastus lateralis (VL) muscle biopsies being collected from participants prior to completion of an exercise bout consisting of four sets of back squats to failure and four sets of leg extensions to volitional failure using a randomly assigned experimental load (30% or 80% estimated 1 RM). VL muscle biopsies were collected at both 3 h and 6 h, respectively following exercise during visit 2. Participants returned 7 days following visit 2 and performed the same training bout with the load that was not allocated during visit 2, and VL biopsies were collected at the PRE, 3 h, and 6 h timepoints as well. Visits 3 and 5 were biopsy checks to ensure that wounds were healing properly. It is finally worth noting that participants completed training bouts following an overnight fast between the hours of 0700 and 1000 and that exercise bouts were completed at similarly scheduled times by each participant.

2.3. Wet Laboratory Analyses

Muscle tissue processing for simultaneous DNA, RNA, and protein isolation. In-depth details regarding tissue processing can be found by Sexton et al. [22]. Briefly, skeletal muscle samples (15–20 mg) were homogenized using Trizol and bromochloropropane (BCP) (instead of chloroform). Centrifugation divided the sample into an aqueous phase containing RNA, DNA interphase, and a bottom protein phase. A portion of the aqueous phase was removed and processed to yield RNA, which was sent to a commercial laboratory for gene expression analysis. The remaining DNA and protein were then separated by biochemical and centrifugation procedures. This produced a DNA pellet and a protein supernatant, and the protein-Trizol-ethanol supernatant was removed for protein isolation. Following various biochemical steps described by Sexton et al., the resultant protein pellet was resuspended in 2× sodium dodecyl sulfate (SDS) sample loading buffer + 5M Urea (1:2 dilution of 10 M Urea, 2:5 dilution of 5× SDS sample loading buffer, 1:10 deionized water, and 1:100 50× protease inhibitor). A commercial assay (RC DC Protein Assay, catalog #5000122; Bio-Rad; Hercules, CA, USA) was used to quantify protein content, and samples were diluted to a standardized concentration using deionized water and stored at −80 °C until Western blotting.
mRNA and DNA methylation arrays. Isolated RNA was shipped to a commercial laboratory for transcriptomic analysis (North American Genomics, Decatur, GA, USA). Following the quantification of gene expression using the Clariom S Assay_Human mRNA array. Raw.CEL files were uploaded into the Transcriptome Analysis Console v4.0.2 (TAC) (Thermo Fisher Scientific, Waltham, MA, USA) and subsequently annotated via the h. sapiens genome (Hg 38 build). Data were then normalized using the robust multiarray average (RMA) normalization method and are presented as log2-signal intensity.
Isolated DNA was shipped to a commercial laboratory (TruDiagnostic, Lexington, KY, USA), and methylation analysis was performed using the Infinium MethylationEpic BeadChip Array (Illumina; San Diego, CA, USA) per the manufacturer’s instructions. Additional details regarding data analysis can be found in Sexton et al. [22]. These data were manually interrogated for DNA methylation results regarding hypertrophy-related genes.
Western blotting. Protein samples that were prepared as discussed above were loaded onto 4–15% SDS-polyacrylamide gels (Bio-Rad) and subjected to 50 min of electrophoresis (180 V) using SDS-PAGE running buffer (VWR). Proteins were transferred to polyvinylidene difluoride (PVDF) membranes (Bio-Rad) using a wet blotting apparatus at 200 mA for 2 h. Following transfers, PVDF membranes were Ponceau stained and imaged in a gel documentation system (ChemiDoc Touch, Bio-Rad, Hercules, CA, USA) to ensure equal protein loading between lanes. Following 1 h blocking at room temperature with 5% nonfat milk powder in Tris-buffered saline with 0.1% Tween-20 (TBST; VWR), membranes were incubated overnight (pan proteins) or for ~48 h (phospho-proteins) with the following antibodies at a 1:1000 dilution in TBST: (i) rabbit anti-human phospho-mTOR (Ser2448; Cell Signaling, Cat #: 5536), (ii) rabbit anti-human pan mTOR (Cell Signaling, cat #: 2983), (iii) rabbit anti-human p-p70S6K (Thr389; Cell Signaling, cat #: 2983), (iv) rabbit anti-human pan p70S6K (Cell Signaling, cat #: 9202), (v) rabbit anti-human phospho-AKT (Ser473; Cell Signaling, cat #: 4060), (vi) rabbit anti-human pan AKT (Cell Signaling, catalog #: 4691), (vii) mouse anti-human follistatin (FST; Life Technologies Corporation, Carlsbad, CA, USA, cat #: 60060-1), and (viii) mouse anti-human myostatin (MSTN; Life Technologies Corporation, catalog #: MA531804). Following primary antibody incubation periods, membranes were incubated with horseradish peroxidase-conjugated anti-rabbit or anti-mouse antibodies (1:2000; Cell Signaling) in TBST with 5% BSA at room temperature for 1 h. An enhanced chemiluminescent reagent (Luminata Forte HRP substrate; Millipore Sigma, Burlington, MA, USA) was used to develop membranes in a dark gel documentation station (ChemiDoc Touch, Bio-Rad), and band densitometry was performed using associated software. Densitometry values of FST and MSTN were normalized to Ponceau densities that corresponded to ~25–75 kD. Phosphorylated target band densities were divided by the pan densities of respective targets to obtain a ratio. All data are expressed as relative expression units.
Literature review to identify candidate genes mechanistically associated with skeletal muscle hypertrophy. Our strategy for identifying candidate genes mechanistically associated with skeletal muscle hypertrophy was three-fold. First, the five genes provided by GOC (GO: 0014734) were included in our gene target list (AR, IGFBP5, MTOR, MYMK, and MYOC). Next, a systematic literature review published in 2018 by Verbrugge and colleagues provided a list of 47 additional genes from mechanistic preclinical studies in which the knockout, knockdown, or overexpression of these genes were found to increase skeletal muscle weight or myofiber cross-sectional area [23]. Finally, we performed a literature review from May 2018 to August 2022 using the search terms “muscle hypertrophy” and “knockout”, “knockdown”, or “overexpression” to identify another seven genes, including UBR5 [26], RPTOR [27], TRIM28 [28], MAPK8/JNK1 [29], PSMC4 [30], ATG7 [31], and YAP1 [32]. The final 58 genes selected for interrogation were TPT1, GNAS, PPARGC1A, CAST, ASB15, MCU, BMPR1A, NR3C1, THRA, SMAD4, KLF10, DGAT1, RHEB, NR4A1, IGF1, NCOR1, MSTN, MAPK8, PSMC4, YAP1, IKBKB, UBR5, NOL3, GRB10, TRIM28, EIF2B5, PPARD, XIAP, ATG7, AKT1, AGTR1, DGKZ, LTBP4, PLD1, ACVR2B, RPTOR, ESR1, TP53INP2, CRTC2, ADRB2, JUNB, INHBB, SKI, INHBA, FST, GPRASP1, FSTL3, MMP9, CAMKK1, PAPPA, CRYM, BDKRB2, UCN3, AR, IGFBP5, MTOR, MYMK, and MYOC.

2.4. Statistics

As described by Sexton et al. [22] Transcriptome Analysis Console v4.0.2 (TAC) (Thermo Fisher Scientific) was used to analyze all mRNA data. Specifically, two-way repeated measure (2 × 2) ANOVAs were used to identify potential interactions between bouts for each of the 58 candidate mRNAs. Main time effects or interactions were considered significant if p < 0.01 and if the expression at PRE did not differ between conditions (using a p-value threshold of less than 0.05). All Western blot data were analyzed with SPSS (v29.0; IBM Statistics, Chicago, IL, USA) using two-way within-within repeated measures ANOVAs, and LSD post hoc tests were used to decompose the main effects of time. All data in tables and figures are presented as mean ± standard deviation (SD) values, and, in all cases except methylation data, individual respondent data are also presented.

3. Results

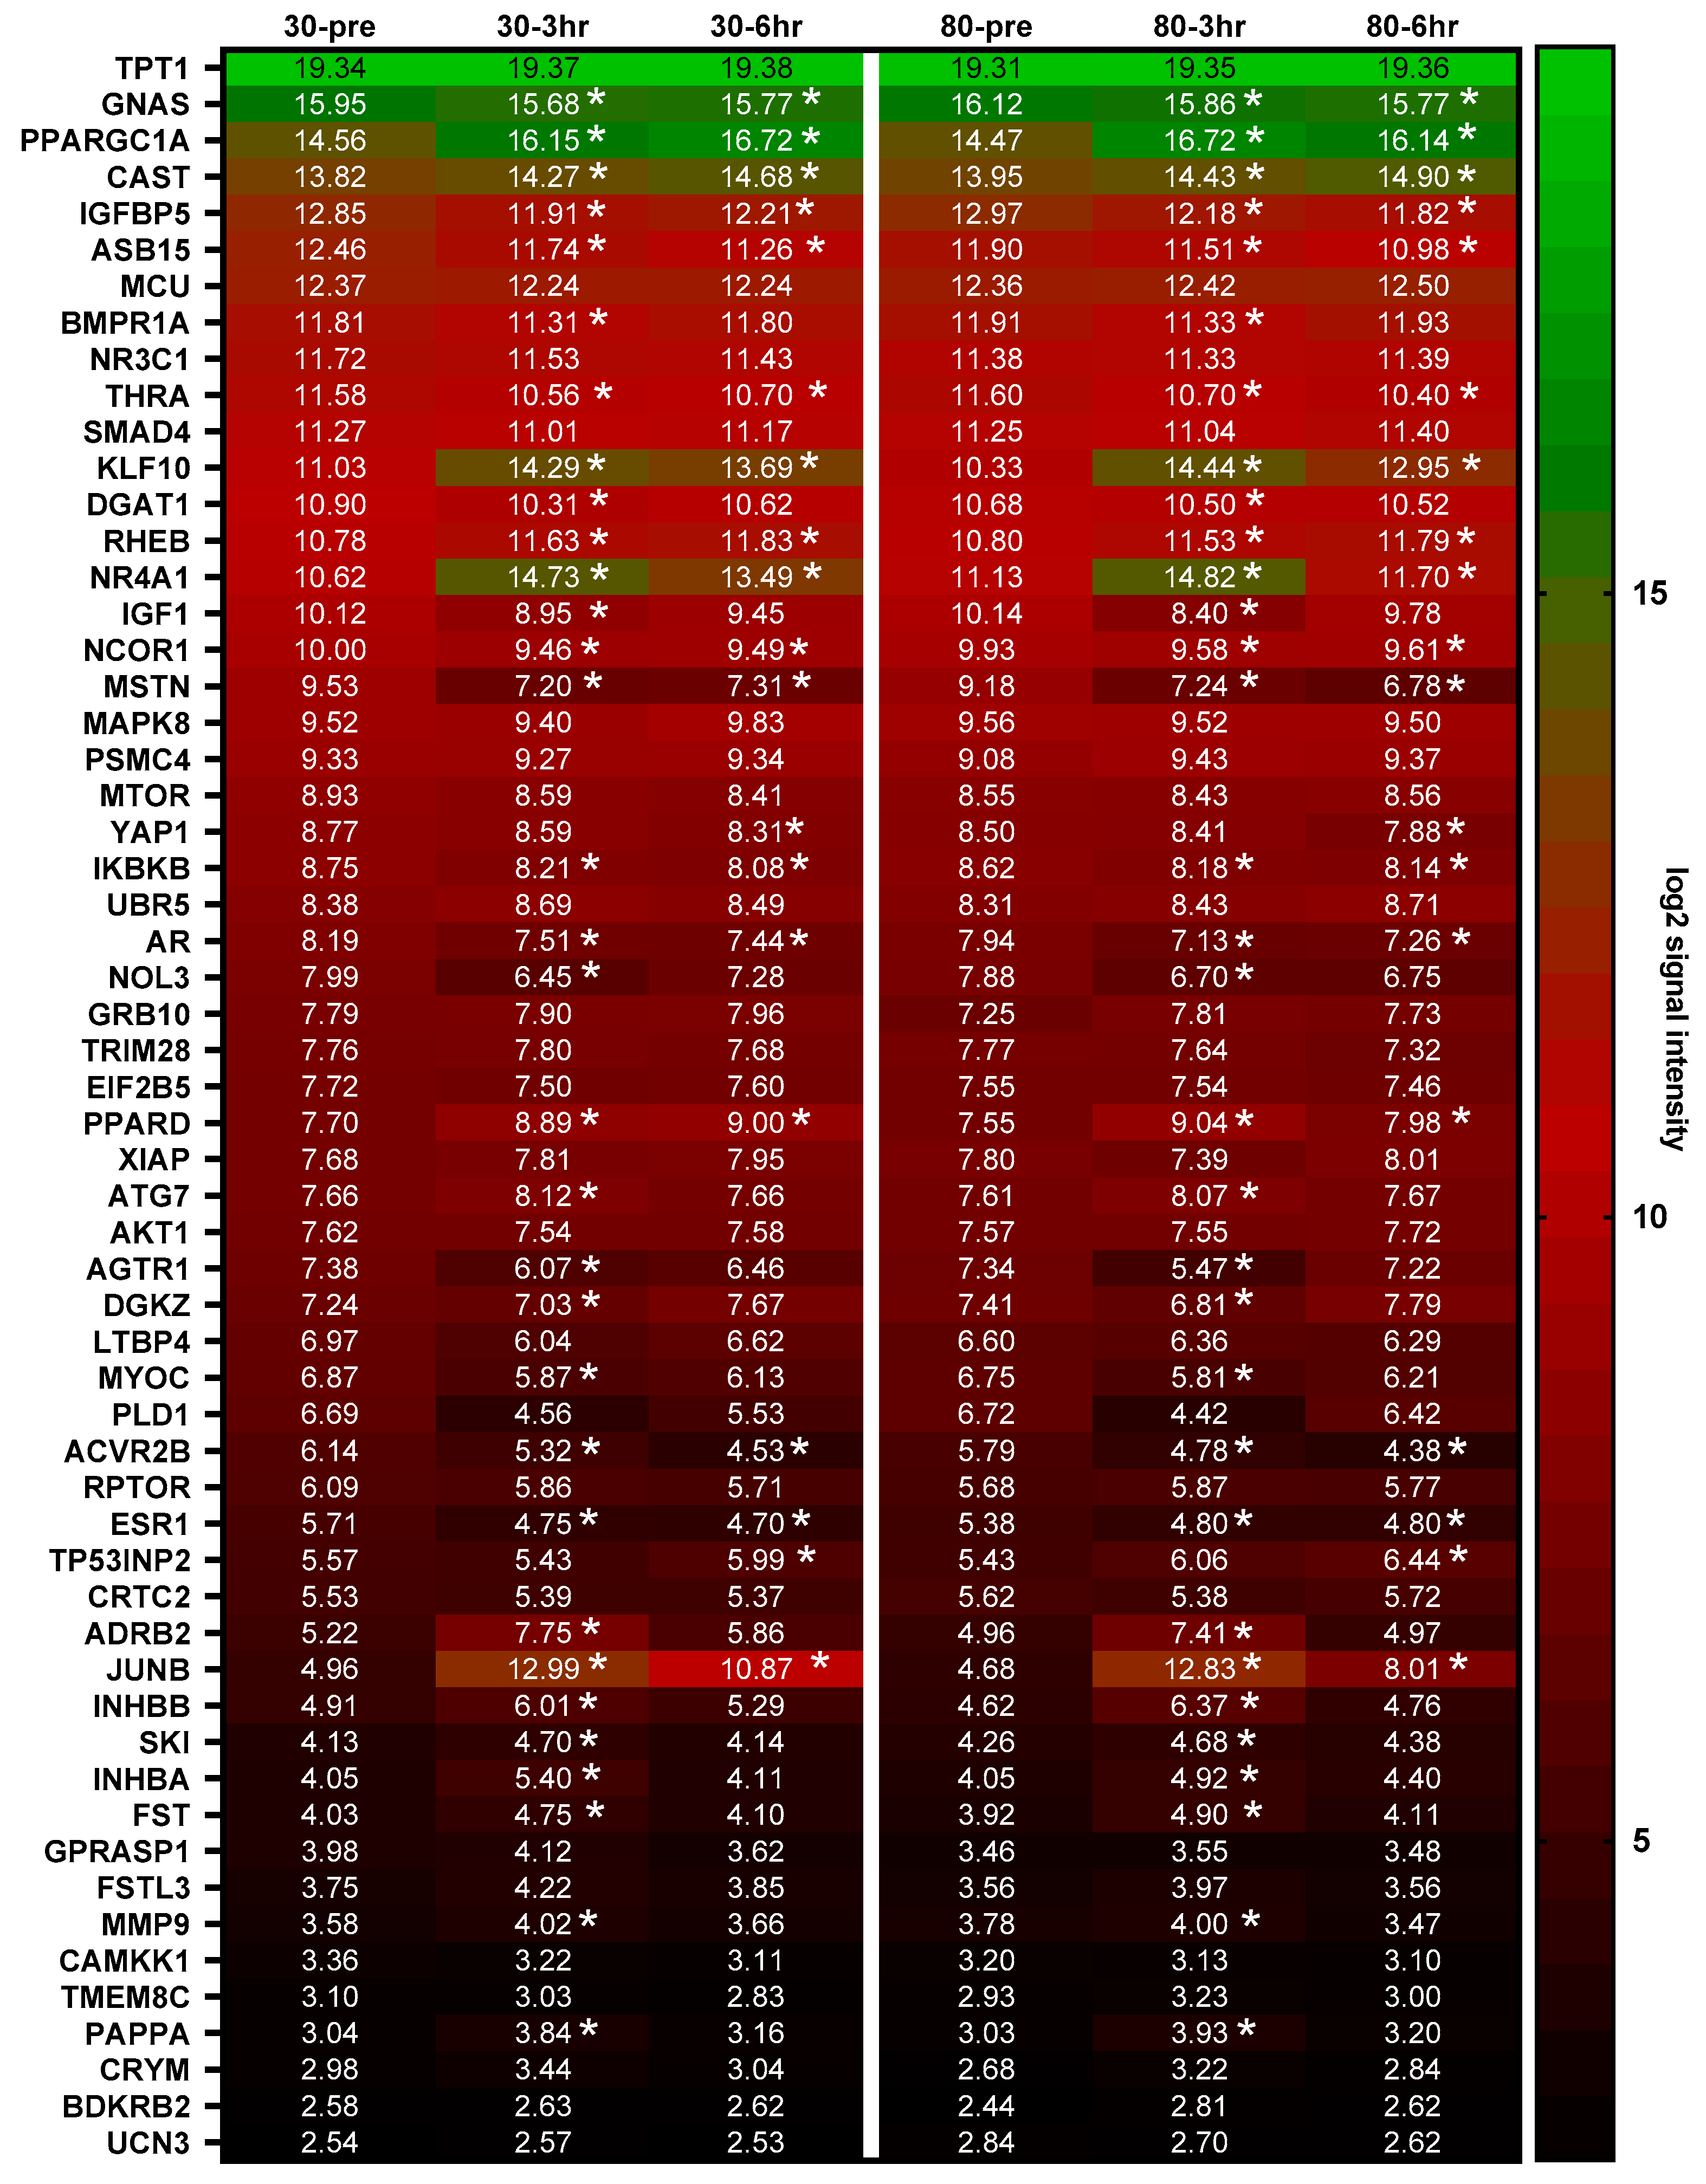
3.1. mRNA Expression following Acute Bouts of Resistance Exercise

Figure 1 depicts all mRNAs of candidate genes identified to be mechanistically associated with skeletal muscle hypertrophy. There were no significant interactions; however, ~57% of these mRNAs showed a main effect of time from PRE to 3 h (15↑ and 17↓, p < 0.01), and ~26% showed a main effect of time from PRE to 6 h (8↑ and 9↓, p < 0.01).

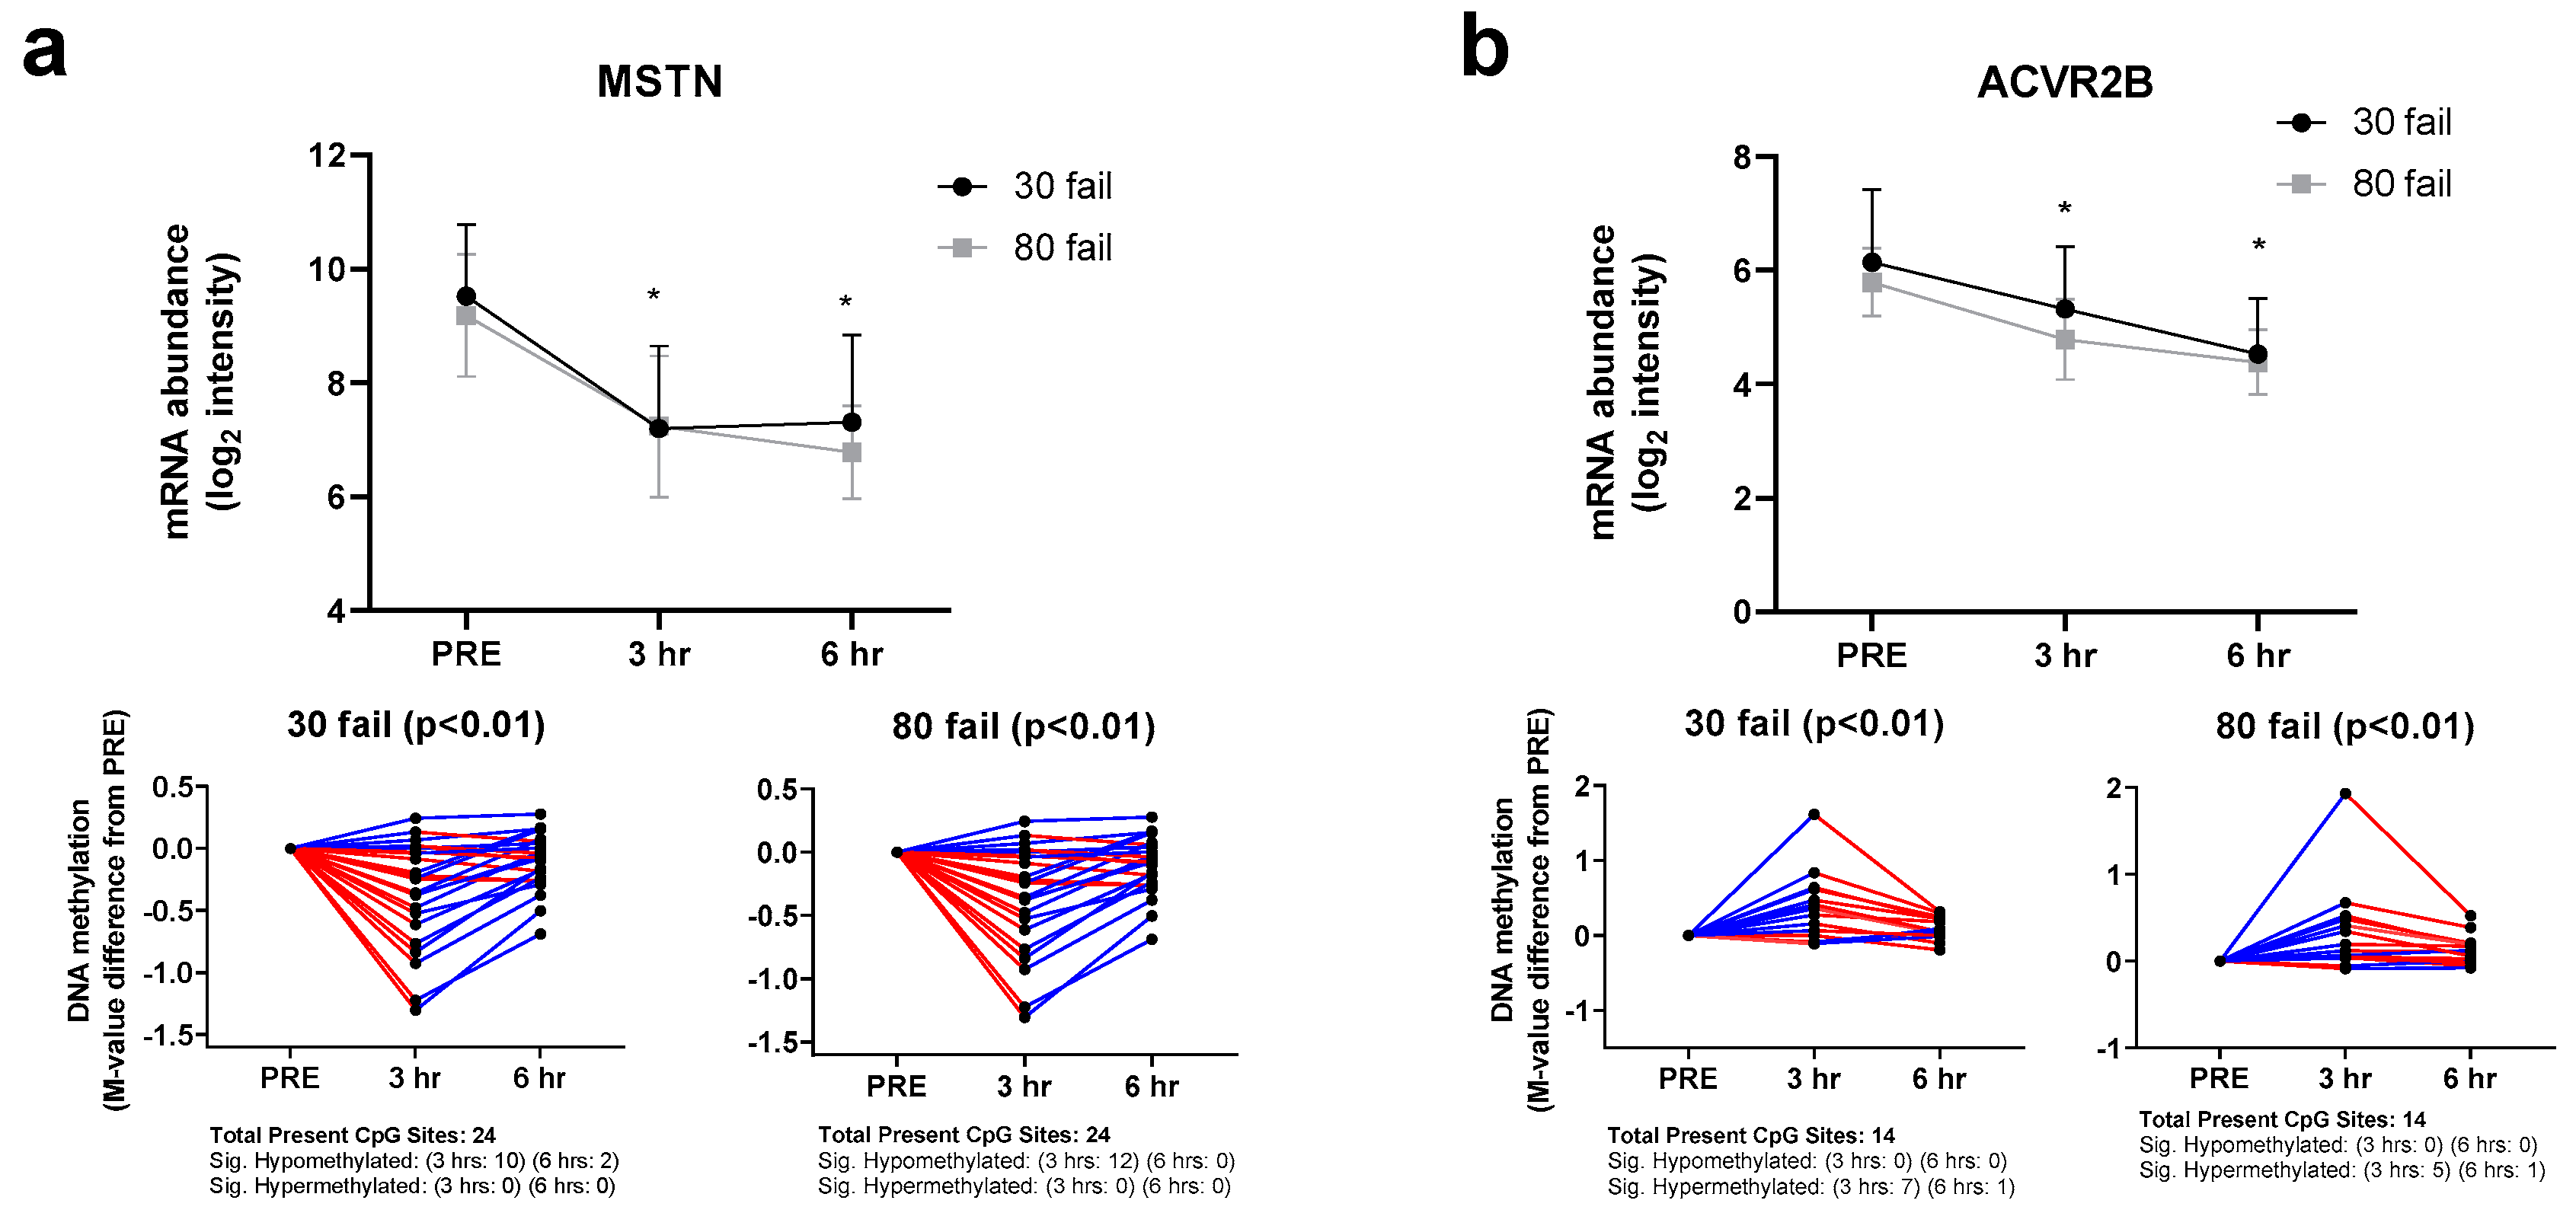
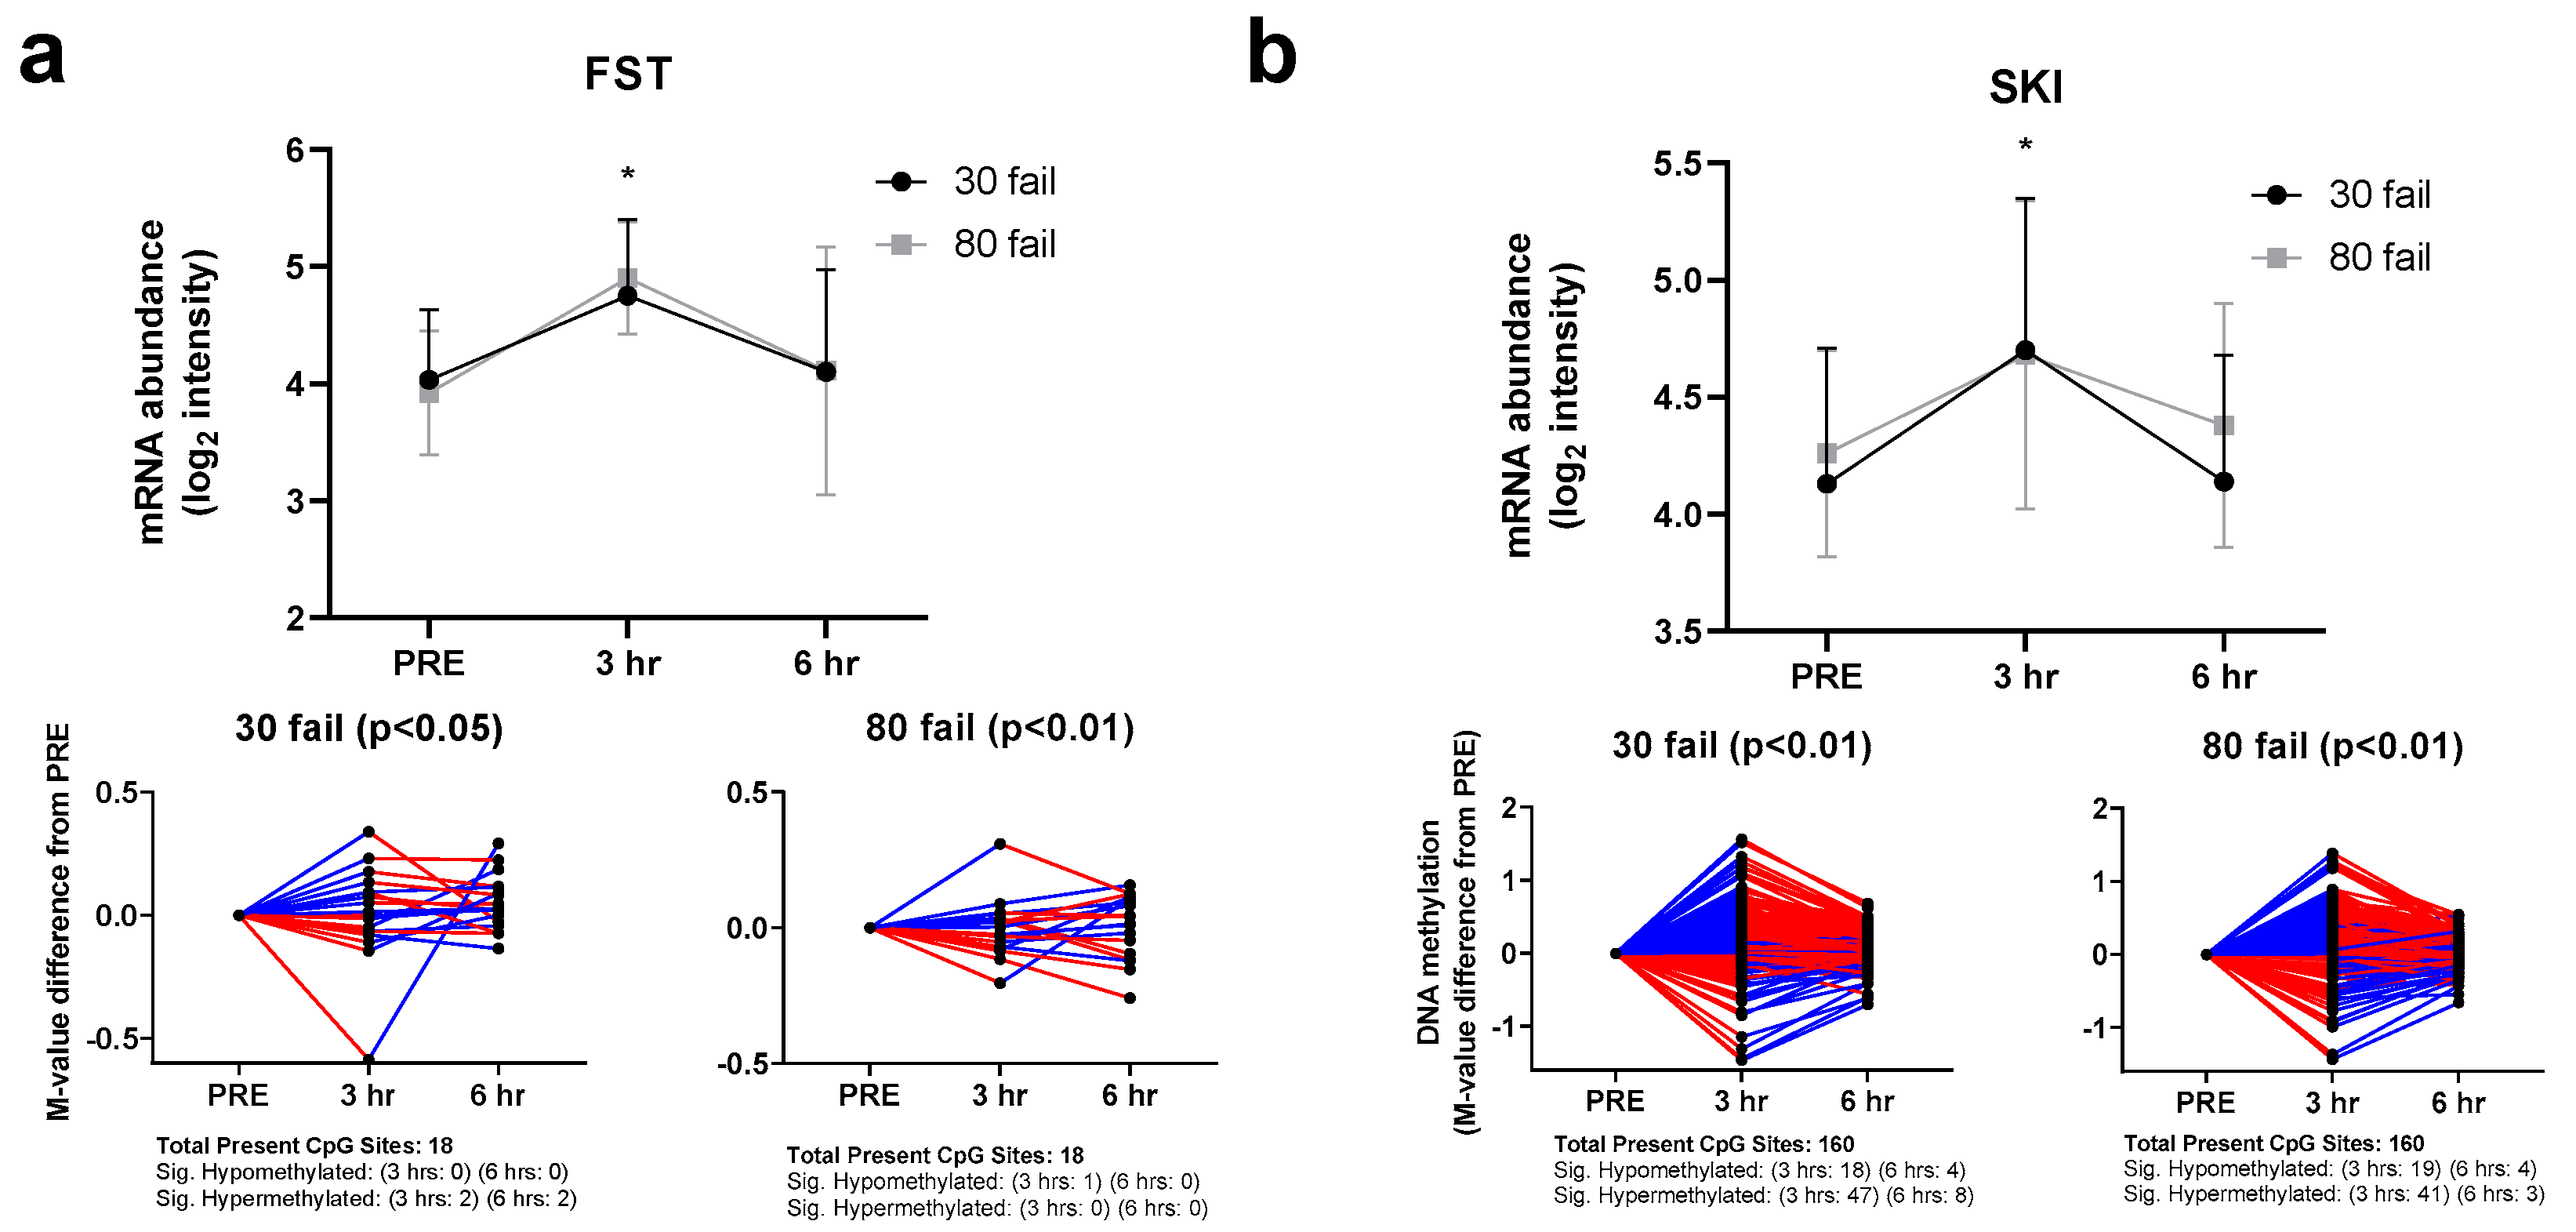
3.2. Myostatin-Associated Gene Responses

Genes involved with MSTN signaling (9 genes: ACVR2B, BMPR1A, FST, FSTL3, INHBA, INHBB, MSTN, SKI, SMAD4) made up a large portion of the 58 genes interrogated. Notably, 7 of these 9 genes (all except SMAD4 and FSTL3) displayed a main effect of time. Given that several of these mRNAs were dynamically altered, we had access to the methylation data of these genes from Sexton et al. [22], we also examined how various CpG sites were affected in tandem with mRNA expression patterns.
MSTN and ACVR2B regulation at the DNA methylation and mRNA expression level is illustrated in Figure 2a,b. Notably, both were downregulated at the mRNA level following 30 Fail and 80 Fail resistance exercise bouts. The respective subpanels illustrate how CpG sites associated with these genes responded to each form of resistance exercise. For MSTN, of the 24 associated CpG sites investigated, none showed significant hypermethylation at 3 h or 6 h, indicating that the downregulation in MSTN was likely unrelated to DNA methylation events. Conversely, of the 14 ACVR2B-associated CpG sites investigated, several showed significant hypermethylation at 3 h, indicating that the downregulation in ACVR2B may have been related to DNA methylation events.
FST and SKI regulation at the DNA methylation and mRNA expression level is illustrated in Figure 3a,b. Both genes were upregulated at the mRNA level following 30 Fail and 80 Fail resistance exercise bouts. The respective subpanels illustrate how CpG sites associated with these genes reacted to each form of resistance exercise. For FST, most of the 18 FST-associated CpG sites investigated (16 during 30 Fail and 17 during 80 Fail) did not show significant alterations in methylation status at 3 h or 6 h, indicating that the upregulation in FST was likely unrelated to DNA methylation events. Alternatively, of the 160 SKI-associated CpG sites investigated, several (77 during 30 Fail and 67 during 80 Fail) showed significant paradoxical methylation at 3 h, indicating that the upregulation in SKI was also unlikely unrelated to DNA methylation events.

3.3. mTORC1-Associated Gene Responses

Nine genes that are part of the mTORC1 signaling cascade (AKT1, DGKΖ, EIF2B5, IGF1, IGFBP5, MTOR, PLD1, RHEB, RAPTOR) also made up a large portion of the 58 genes interrogated. Of these genes, RHEB (up at 3 h and 6 h, p < 0.001 and p < 0.001) was the only one that was upregulated. Genes involved with mTORC1 signaling that were downregulated included IGFBP5 (down at 3 h and 6 h, p < 0.001 and p < 0.001) and DGKZ (down at 3 h, p = 0.004).

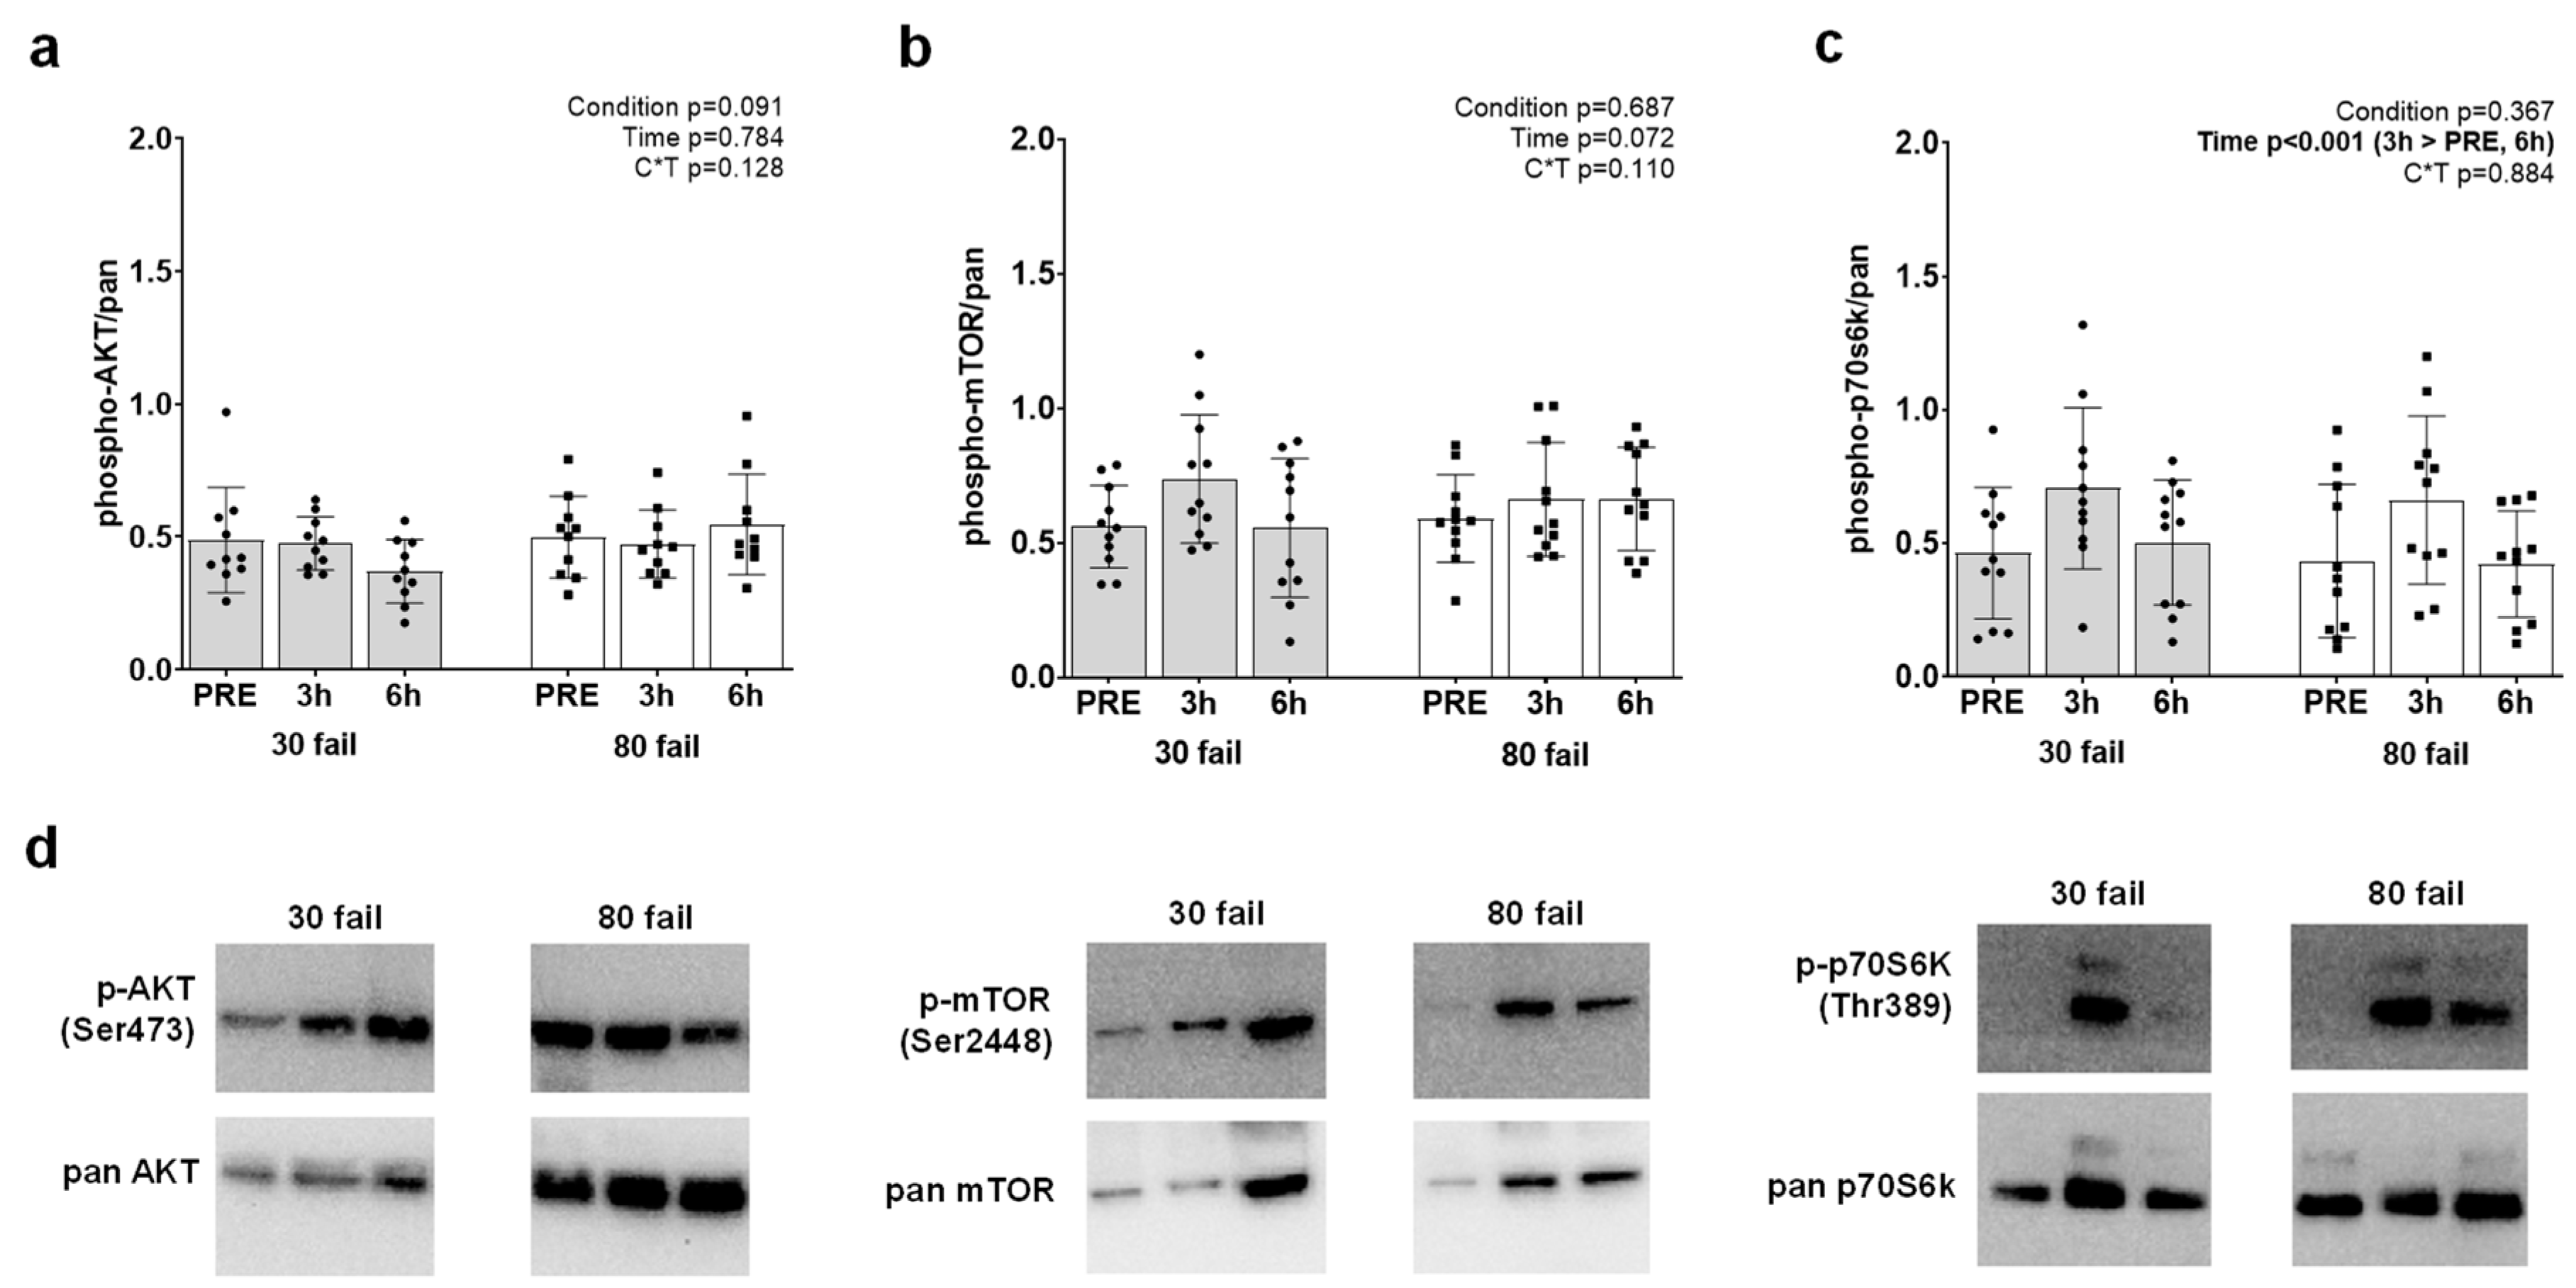
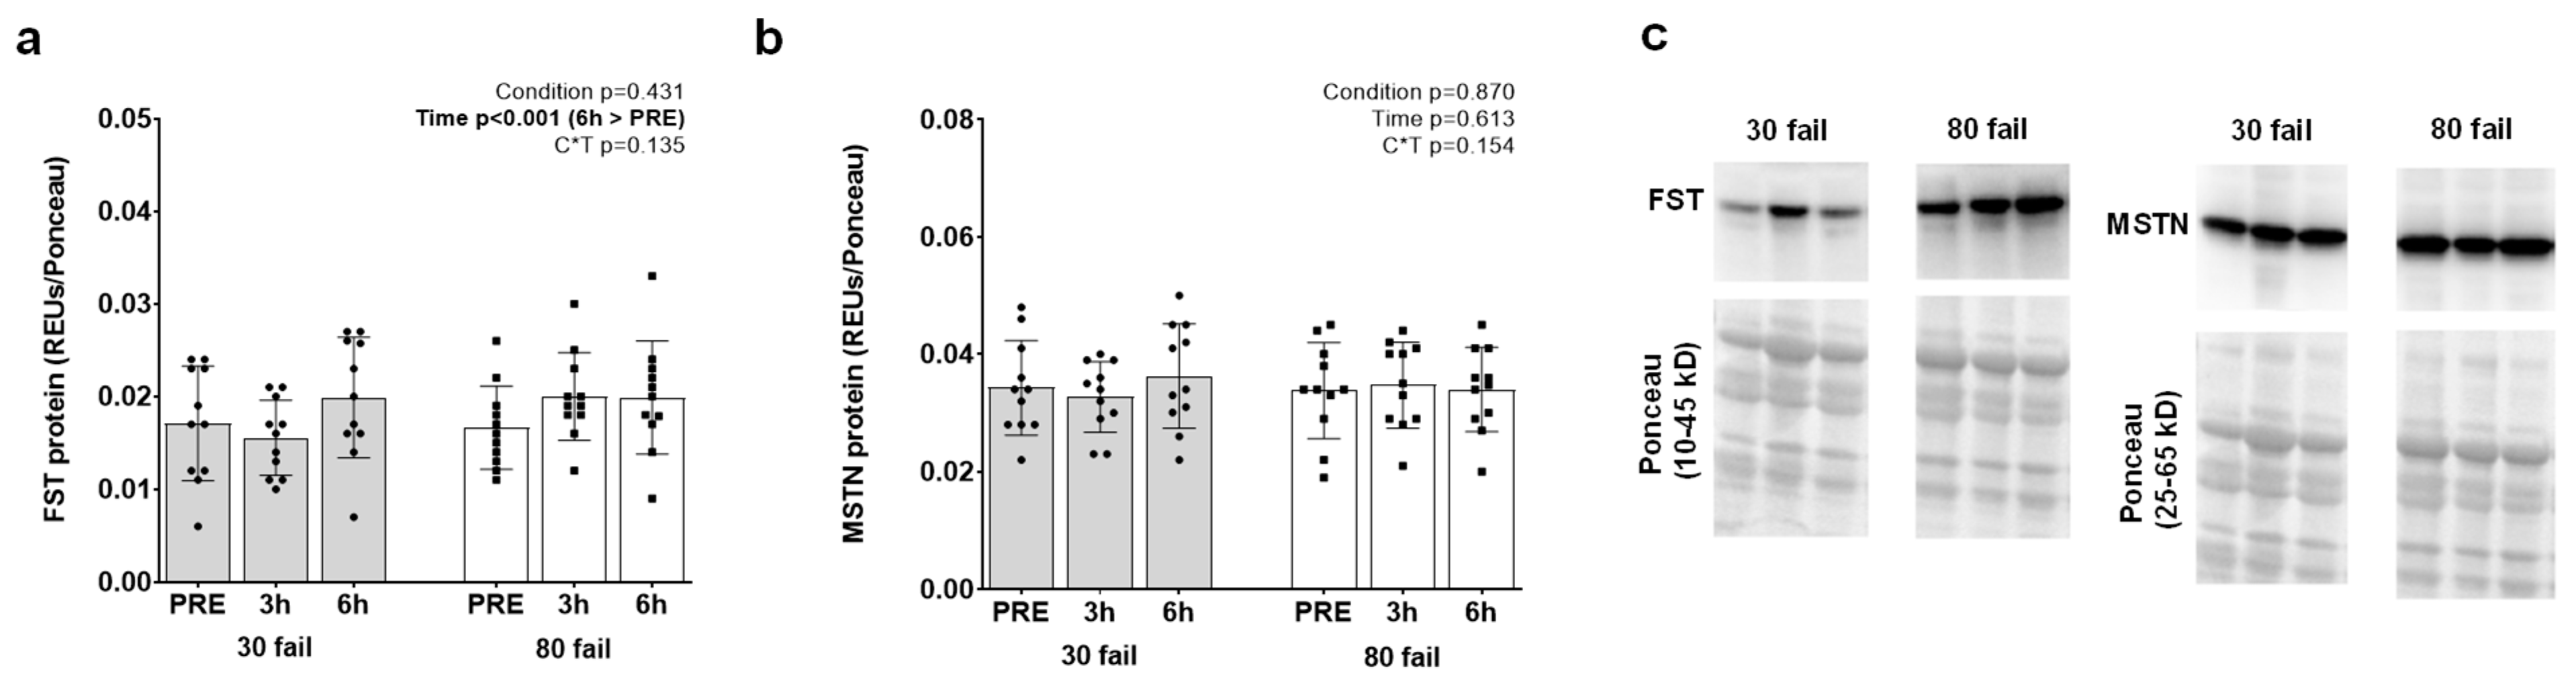
3.4. Western Blot Results for AKT-mTOR, Myostatin and Follistatin Protein Targets

Given that gene targets involved with MSTN and mTORC1 signaling were highly prevalent on our list of 58 genes, we opted to perform Western blotting on these targets. AKT-mTORC1 pathway proteins are presented in Figure 4. While no significant interactions were identified, and no significant group or time effects were evident for phospho- (Ser473)/pan AKT (Figure 4a) or phospho- (Ser2448)/pan mTOR (Figure 4b). There were, however, increases in phospho- (Thr389)/pan p70S6K (PRE to 3 h, p = 0.001; Figure 4c).
Protein abundance data for follistatin and myostatin proteins are presented in Figure 5. A significant main effect of time was evident for follistatin protein abundance (PRE to 6 h, p < 0.001; Figure 5a), albeit a significant interaction was not evident. No significant interaction or main effects were evident for MSTN protein levels (Figure 5b).

4. Discussion

This investigation aimed to extend the findings reported by Sexton et al. [22] by determining differences in the mRNA expression of 58 genes associated with skeletal muscle hypertrophy following acute bouts of 30 Fail and 80 Fail resistance exercise. Although our data suggest both modes of exercise elicited similar mRNA expression profiles, several MSTN-related mRNAs were dynamically altered regardless of load. Both bouts also similarly affected mTORC1 signaling mRNAs and upregulated p70S6K phosphorylation following exercise. Finally, both bouts transiently elevated follistatin protein levels while not affecting myostatin protein levels. Our findings provide additional insight into the molecular responses to lower versus higher load resistance exercise to failure.
Among the genes identified during our literature review, as well as those identified by Verbrugge et al. [23], nine of them belonged to the myostatin signaling pathway (ACVR2B, BMPR1A, FST, FSTL3, INHBA, INHBB, MSTN, SKI, SMAD4) [23]. MSTN has been demonstrated as having a role in the suppression of the skeletal muscle growth [39], possibly through inhibition of the mTORC1 [40]. The ACVR2B gene encodes for a receptor that mediates MSTN signaling through phosphorylation (i.e., activation) of SMAD transcription factors [41]. FST is essential for muscle fiber formation and growth by inhibiting the myostatin binding [42]. FSTL3 similarly inhibits myostatin and activin A, which suppresses their functionality and promotes muscle growth [43,44]. INHBA is a muscle growth inhibitor and encodes for activins which are a part of the TGF-β superfamily and have roles in the development regulation [45,46]. INHBB is also a part of the TGF-β superfamily and is a muscle growth inhibitor [47,48]. SKI also impairs MSTN signaling due to its ability to inhibit the activity of the SMADs [49,50], and SMAD4 acts as an intracellular mediator of TGF-β signaling [51]. Seven of these MSTN-related genes exhibited significant mRNA expression responses along with dynamic changes in methylation statuses. Moreover, there was generally a downregulation in mRNA targets that potentiate MSTN signaling (e.g., MSTN and ACVR2B), whereas there was an up-regulation in mRNA targets that inhibit MSTN pathway activation (e.g., FST and SKI). These findings exhibit similarities and differences with past reports in the literature. For instance, multiple studies have reported that skeletal muscle MSTN mRNA is downregulated in response to acute and longer-term resistance training periods [52,53,54,55]. Others have reported skeletal muscle ACVR2B mRNA expression in older adults (age = 68 ± 6 years) is not altered, while another study has reported increased ACVR2B mRNA expression in younger recreational athletes (age = 27 ± 5 years) rehabilitating from ACL surgery [56,57], and FST mRNA expression has been shown not to be affected in skeletal muscle following one and multiple sessions of resistance exercise [58,59]. Indeed, differences in participant demographics and study designs (e.g., exercises and load prescriptions) are likely responsible for the observed differences between studies. Notwithstanding, our data suggest multiple targets of the MSTN pathway, regardless of load selection, appear to be transiently regulated at the mRNA level in response to resistance exercise. A notable finding herein was that, while several MSTN inhibitor mRNAs and follistatin protein levels were up-regulated and MSTN mRNA was downregulated in the post-exercise period, MSTN protein levels remained unaltered. In attempting to reconcile these findings, potential explanations exist. First, the upregulation in MSTN inhibitors likely reduced MSTN signaling itself (i.e., SMAD2/3 phosphorylation) rather than acted upon MSTN protein levels. Indeed, we attempted to blot for SMAD2/3 phosphorylation but did not obtain a sufficient signal across membranes to quantify results. Hence, while some evidence exists in this area [56], more research examining SMAD2/3 phosphorylation (and nuclear localization) following acute resistance exercise bouts is needed. Regarding MSTN protein levels remaining unaltered in the post-exercise period in lieu of down-regulated MSTN mRNA levels, this was likely due to biopsy sampling being too early to detect a downregulation in protein levels. In this regard, others have shown that immediate post-exercise alterations in PGC1-α mRNA levels lead to protein expression changes that are measurable ~24 h following the exercise bout [60]. Thus, again, more research is needed to time course MSTN mRNA and protein-level changes following exercise, given that this gene is highly responsive to resistance exercise.
Nine genes involved with mTORC1 signaling (AKT1, DGKΖ, EIF2B5, IGF1, IGFBP5, MTOR, PLD1, RHEB, RPTOR) were also included in the current analysis. Briefly, the mTORC1 pathway is considered an anabolic signaling hub, and its activation in skeletal muscle involves an upregulation of several signaling proteins by way of phosphorylation which leads to increased translation initiation resulting in increased muscle protein synthesis [61,62]. AKT1 encodes a kinase that acts to activate the mTORC1 protein kinase [63]. DGKΖ encodes for an enzyme that acts to increase cellular phosphatidic acid levels in response to mechanical overload, and phosphatidic acid binds to mTOR, resulting in mTOR activation [64]. IGFBP5 is a binding protein that transports insulin-like growth factor variants in circulation and modulates ligand effectiveness [65]. EIF2B5 encodes for a translation initiation factor which acts to increase rates of translation initiation and, subsequently, protein synthesis [66,67]. IGF1 encodes for a growth factor that supports muscle growth by activating the tyrosine kinase IGF1 receptor, thus stimulating PI3K-AKT signaling [68,69]. RPTOR encodes a protein that binds to and upregulates the mTORC1 signaling [27,70], and RHEB encodes for a GTPase that stimulates the mTORC1 activity [71]. While many of the myostatin pathway-related genes displayed dynamic alterations to the acute bouts of training, the mTORC1 signaling-related mRNAs were not as responsive or were paradoxically affected following exercise. Specifically, RHEB mRNA increased during the post-exercise period, DGKZ, IGF1, and IGFBP5 mRNAs were downregulated, and no changes were observed for AKT1, EIF2B5, MTOR, PLD1, or RPTOR. These findings both agree and disagree with prior findings in the literature. For instance, resistance exercise has been reported to transiently up-regulate IGF1 mRNA in the post-exercise period [72], which counters our findings. Although reasons for this discrepancy are difficult to posit, it likely has to do with these prior studies examining untrained participants versus the trained participants who were examined herein. However, our RHEB findings agree with Wang et al. [73] reported an increase in this mRNA 1 h following acute resistance exercise in recreationally trained participants (age = 26 ± 1.2 years). Similarly, our IGFBP5 mRNA data agree with a report by Dennis et al. [74], who demonstrated that this mRNA is downregulated 72 h following an acute bout of resistance exercise in younger adults. Our MTOR mRNA findings also align with data published by Drummond et al. [75] showed MTOR mRNA was not affected 3 h following resistance exercise. When considering the collective evidence, it appears that certain genes critical to mTORC1 signaling (e.g., MTOR and RPTOR) may not be transcriptionally responsive to resistance exercise, whereas RHEB is upregulated, and this may be a transcriptional mechanism involved with the hypertrophic response to resistance exercise.
Given that our gene list (Figure 1) contained several mTORC1 gene targets, we opted to perform Western blotting on associated phosphorylated proteins [76,77,78,79,80,81,82]. Three mTORC1 signaling proteins were selected for immunoblotting analysis (phosphorylated [Thr389]/pan AKT, phosphorylated [Thr389]/pan p70S6K, phosphorylated/pan mTOR [phosphorylated at Ser2448]). Notably, Mitchell et al. [4] and Haun et al. [83] are the only two prior studies that have examined mTORC1 signaling markers following a lower-load and higher-load resistance exercise bout. Phosphorylated AKT was not affected between time points, which agrees with the findings of Mitchell and colleagues, who reported that the post-exercise phosphorylation status of this protein did not differ when participants performed three sets of leg extensors to failure using 30% or 80% 1-RM loads. Phosphorylated p70S6K was upregulated 3 h following an acute bout of resistance exercise, which agrees with prior data from our laboratory [83] demonstrating that p70S6k phosphorylation is increased 15 and 90 min following higher (80% 1 RM) and lower load (30% 1 RM) leg extensor resistance exercise to volitional fatigue. We observed no changes in phosphorylated mTOR protein levels following exercise, which again agrees with the findings reported by Haun et al. [83], albeit, disagrees with the findings of Mitchell et al. [4]. Despite the minor discrepancies between the current study and the two prior investigations, the collective data continue to suggest that post-exercise mTORC1 signaling differences do not seemingly exist between lower-load and higher-load bouts of resistance exercise so long as each set is executed to volitional fatigue.
In addition to the AKT-mTOR pathway protein targets, two myostatin pathway protein targets (myostatin and follistatin) were interrogated, given the robust changes we observed in MSTN-related mRNAs in response to both modes of resistance exercise. The interrogation of these targets with the current study design is novel given that they were not investigated in the 30 Fail versus 80 Fail Mitchell et al. [4] or Haun et al. [83] studies. Notably, we observed no changes in myostatin protein expression, and this agrees, in part, with a report by Snijders et al. [84], who demonstrated that myostatin protein levels remain unaltered in skeletal muscle at early post-exercise time points and become down-regulated 72-h following resistance exercise. We also observed an increase in follistatin protein 6-h following exercise, regardless of load. Although resistance exercise literature examining this muscle protein is sparse, this finding agrees, in principle, with other studies reporting that circulating follistatin concentrations increase during resistance training interventions [85,86]. Hence, in lieu of the mRNA data discussed above, these data suggest that a downregulation in MSTN mRNA in response to resistance exercise may eventually matriculate into a decrease in muscle protein levels days following the bout, as discussed above. Conversely, the rapid post-exercise increase in FST mRNA levels may result in protein levels increasing soon thereafter.

5. Conclusions

Pathway coverage of genes mechanistically associated with skeletal muscle hypertrophy is underrepresented in traditional pipelines used to elucidate differential gene expression. When considering the collected data, it is apparent that a bout of lower and higher load training to failure similarly affects the 58 interrogated mRNAs mechanistically associated with skeletal muscle hypertrophy. Further, select mTORC1 signaling markers are similarly affected between bouts, as is the protein expression of follistatin. Critically, our secondary analysis provides in-depth information regarding how the mRNA expression of genes mechanistically associated with skeletal muscle hypertrophy was affected following two unique resistance exercise bouts to failure. Regarding investigations seeking to elucidate underlying mechanisms of muscle growth, we recommend that researchers adopt a targeted approach with directed attention to gene expression analysis.

Author Contributions

Conceptualization, M.C.M. and M.D.R.; methodology, M.C.M., C.L.S., J.S.G., B.A.R., J.M.M., D.L.P., C.B.M., R.S., V.J.D., A.P.S., C.G.V. and M.D.R.; software, R.S., V.B.D., A.P.S., C.G.V. and M.D.R.; validation, R.S., V.B.D., A.P.S., C.G.V. and M.D.R.; formal analysis, M.C.M., A.P.S., C.G.V. and M.D.R.; investigation, all co-authors; resources, R.S., V.B.D., A.P.S., C.G.V., C.B.M. and M.D.R.; data curation, M.C.M., A.P.S., C.G.V. and M.D.R.; writing—original draft preparation, M.C.M. and M.D.R.; writing—review and editing, all co-authors; visualization, all co-authors; supervision, M.C.M., C.L.S., J.S.G., B.A.R. and M.D.R.; project administration, M.C.M. and M.D.R.; funding acquisition, T.N.Z., H.L.L. and M.D.R. All authors have read and agreed to the published version of the manuscript.

Funding

M.C.M. was fully supported through a T32 NIH grant (T32GM141739). C.G.V.’s effort was funded through the National Institutes of Health grant (R01AG054840). M.D.R. discretionary laboratory funds (unrestricted donations, indirect cost recoveries from non-related grants) were used to fund assay and participant compensation costs.

Institutional Review Board Statement

This study was conducted with prior review and approval from the Auburn University Institutional Review Board (IRB approval #: 20-081 MR 2003).

Informed Consent Statement

Verbal and written informed consent was obtained from all subjects involved in the study.

Data Availability Statement

Queries related to these data can be addressed by C.G.C. (christopher.vann@duke.edu) and M.D.R. (mdr0024@auburn.edu), and raw data will be provided by M.D.R. upon reasonable request.

Acknowledgments

The authors would like to thank the participants for devoting their time and willingness to engage in this study.

Conflicts of Interest

None of the authors declare financial or other potential conflict of interest in relation to the data presented in this manuscript.

References

  1. Deschenes, M.R.; Kraemer, W.J. Performance and physiologic adaptations to resistance training. Am. J. Phys. Med. Rehabil. 2002, 81, S3–S16. [Google Scholar] [CrossRef] [PubMed]
  2. Jenkins, N.D.; Housh, T.J.; Buckner, S.L.; Bergstrom, H.C.; Cochrane, K.C.; Hill, E.C.; Smith, C.M.; Schmidt, R.J.; Johnson, G.O.; Cramer, J.T. Neuromuscular Adaptations After 2 and 4 Weeks of 80% Versus 30% 1 Repetition Maximum Resistance Training to Failure. J. Strength Cond. Res. 2016, 30, 2174–2185. [Google Scholar] [CrossRef] [PubMed]
  3. Morton, R.W.; Oikawa, S.Y.; Wavell, C.G.; Mazara, N.; McGlory, C.; Quadrilatero, J.; Baechler, B.L.; Baker, S.K.; Phillips, S.M. Neither load nor systemic hormones determine resistance training-mediated hypertrophy or strength gains in resistance-trained young men. J. Appl. Physiol. 2016, 121, 129–138. [Google Scholar] [CrossRef] [PubMed]
  4. Mitchell, C.J.; Churchward-Venne, T.A.; West, D.W.; Burd, N.A.; Breen, L.; Baker, S.K.; Phillips, S.M. Resistance exercise load does not determine training-mediated hypertrophic gains in young men. J. Appl. Physiol. 2012, 113, 71–77. [Google Scholar] [CrossRef]
  5. Morton, R.W.; Sonne, M.W.; Farias Zuniga, A.; Mohammad, I.Y.Z.; Jones, A.; McGlory, C.; Keir, P.J.; Potvin, J.R.; Phillips, S.M. Muscle fibre activation is unaffected by load and repetition duration when resistance exercise is performed to task failure. J. Physiol. 2019, 597, 4601–4613. [Google Scholar] [CrossRef]
  6. Holloway, T.M.; Morton, R.W.; Oikawa, S.Y.; McKellar, S.; Baker, S.K.; Phillips, S.M. Microvascular adaptations to resistance training are independent of load in resistance-trained young men. Am. J. Physiol. Regul. Integr. Comp. Physiol. 2018, 315, R267–R273. [Google Scholar] [CrossRef]
  7. Burd, N.A.; Moore, D.R.; Mitchell, C.J.; Phillips, S.M. Big claims for big weights but with little evidence. Eur. J. Appl. Physiol. 2013, 113, 267–268. [Google Scholar] [CrossRef]
  8. Haun, C.T.; Vann, C.G.; Osburn, S.C.; Mumford, P.W.; Roberson, P.A.; Romero, M.A.; Fox, C.D.; Johnson, C.A.; Parry, H.A.; Kavazis, A.N.; et al. Muscle fiber hypertrophy in response to 6 weeks of high-volume resistance training in trained young men is largely attributed to sarcoplasmic hypertrophy. PLoS ONE 2019, 14, e0215267. [Google Scholar] [CrossRef]
  9. Vann, C.G.; Osburn, S.C.; Mumford, P.W.; Roberson, P.A.; Fox, C.D.; Sexton, C.L.; Johnson, M.R.; Johnson, J.S.; Shake, J.; Moore, J.H.; et al. Skeletal Muscle Protein Composition Adaptations to 10 Weeks of High-Load Resistance Training in Previously-Trained Males. Front. Physiol. 2020, 11, 259. [Google Scholar] [CrossRef]
  10. Vann, C.G.; Sexton, C.L.; Osburn, S.C.; Smith, M.A.; Haun, C.T.; Rumbley, M.N.; Mumford, P.W.; Montgomery, N.T.; Ruple, B.A.; McKendry, J.; et al. Effects of High-Volume Versus High-Load Resistance Training on Skeletal Muscle Growth and Molecular Adaptations. Front. Physiol. 2022, 13, 857555. [Google Scholar] [CrossRef]
  11. Seaborne, R.A.; Strauss, J.; Cocks, M.; Shepherd, S.; O’Brien, T.D.; van Someren, K.A.; Bell, P.G.; Murgatroyd, C.; Morton, J.P.; Stewart, C.E.; et al. Human Skeletal Muscle Possesses an Epigenetic Memory of Hypertrophy. Sci. Rep. 2018, 8, 1898. [Google Scholar] [CrossRef]
  12. Seaborne, R.A.; Strauss, J.; Cocks, M.; Shepherd, S.; O’Brien, T.D.; Someren, K.A.V.; Bell, P.G.; Murgatroyd, C.; Morton, J.P.; Stewart, C.E.; et al. Methylome of human skeletal muscle after acute & chronic resistance exercise training, detraining & retraining. Sci. Data 2018, 5, 180213. [Google Scholar] [CrossRef]
  13. Turner, D.C.; Seaborne, R.A.; Sharples, A.P. Comparative Transcriptome and Methylome Analysis in Human Skeletal Muscle Anabolism, Hypertrophy and Epigenetic Memory. Sci. Rep. 2019, 9, 4251. [Google Scholar] [CrossRef]
  14. Bagley, J.R.; Burghardt, K.J.; McManus, R.; Howlett, B.; Costa, P.B.; Coburn, J.W.; Arevalo, J.A.; Malek, M.H.; Galpin, A.J. Epigenetic Responses to Acute Resistance Exercise in Trained vs. Sedentary Men. J. Strength Cond. Res. 2020, 34, 1574–1580. [Google Scholar] [CrossRef]
  15. Kulkarni, A.S.; Peck, B.D.; Walton, R.G.; Kern, P.A.; Mar, J.C.; Windham, S.T.; Bamman, M.M.; Barzilai, N.; Peterson, C.A. Metformin alters skeletal muscle transcriptome adaptations to resistance training in older adults. Aging 2020, 12, 19852–19866. [Google Scholar] [CrossRef]
  16. Raue, U.; Trappe, T.A.; Estrem, S.T.; Qian, H.R.; Helvering, L.M.; Smith, R.C.; Trappe, S. Transcriptome signature of resistance exercise adaptations: Mixed muscle and fiber type specific profiles in young and old adults. J. Appl. Physiol. 2012, 112, 1625–1636. [Google Scholar] [CrossRef]
  17. Thalacker-Mercer, A.; Stec, M.; Cui, X.; Cross, J.; Windham, S.; Bamman, M. Cluster analysis reveals differential transcript profiles associated with resistance training-induced human skeletal muscle hypertrophy. Physiol. Genom. 2013, 45, 499–507. [Google Scholar] [CrossRef]
  18. Gordon, P.M.; Liu, D.; Sartor, M.A.; IglayReger, H.B.; Pistilli, E.E.; Gutmann, L.; Nader, G.A.; Hoffman, E.P. Resistance exercise training influences skeletal muscle immune activation: A microarray analysis. J. Appl. Physiol. 2012, 112, 443–453. [Google Scholar] [CrossRef]
  19. Vechin, F.C.; Libardi, C.A.; Conceicao, M.S.; Damas, F.; Cavaglieri, C.R.; Chacon-Mikahil, M.P.T.; Coutinho, L.L.; Andrade, S.C.S.; Neves, M.T., Jr.; Roschel, H.; et al. Low-intensity resistance training with partial blood flow restriction and high-intensity resistance training induce similar changes in skeletal muscle transcriptome in elderly humans. Appl. Physiol. Nutr. Metab. 2019, 44, 216–220. [Google Scholar] [CrossRef]
  20. Deane, C.S.; Phillips, B.E.; Willis, C.R.G.; Wilkinson, D.J.; Smith, K.; Higashitani, N.; Williams, J.P.; Szewczyk, N.J.; Atherton, P.J.; Higashitani, A.; et al. Proteomic features of skeletal muscle adaptation to resistance exercise training as a function of age. Geroscience 2022. [Google Scholar] [CrossRef]
  21. Moore, L.D.; Le, T.; Fan, G. DNA methylation and its basic function. Neuropsychopharmacology 2013, 38, 23–38. [Google Scholar] [CrossRef] [PubMed]
  22. Sexton, C.L.; Godwin, J.S.; McIntosh, M.C.; Ruple, B.A.; Osburn, S.C.; Hollingsworth, B.R.; Kontos, N.J.; Agostinelli, P.J.; Kavazis, A.N.; Ziegenfuss, T.N.; et al. Skeletal Muscle DNA Methylation and mRNA Responses to a Bout of Higher versus Lower Load Resistance Exercise in Previously Trained Men. Cells 2023, 12, 263. [Google Scholar] [CrossRef] [PubMed]
  23. Verbrugge, S.A.J.; Schonfelder, M.; Becker, L.; Yaghoob Nezhad, F.; Hrabe de Angelis, M.; Wackerhage, H. Genes Whose Gain or Loss-Of-Function Increases Skeletal Muscle Mass in Mice: A Systematic Literature Review. Front. Physiol. 2018, 9, 553. [Google Scholar] [CrossRef] [PubMed]
  24. Li, J.; Chen, H.; Wang, Y.; Chen, M.M.; Liang, H. Next-Generation Analytics for Omics Data. Cancer Cell 2021, 39, 3–6. [Google Scholar] [CrossRef]
  25. Murach, K.A.; McCarthy, J.J.; Peterson, C.A.; Dungan, C.M. Making Mice Mighty: Recent advances in translational models of load-induced muscle hypertrophy. J. Appl. Physiol. 2020, 129, 516–521. [Google Scholar] [CrossRef] [PubMed]
  26. Hughes, D.C.; Turner, D.C.; Baehr, L.M.; Seaborne, R.A.; Viggars, M.; Jarvis, J.C.; Gorski, P.P.; Stewart, C.E.; Owens, D.J.; Bodine, S.C.; et al. Knockdown of the E3 ubiquitin ligase UBR5 and its role in skeletal muscle anabolism. Am. J. Physiol. Cell Physiol. 2021, 320, C45–C56. [Google Scholar] [CrossRef] [PubMed]
  27. You, J.S.; McNally, R.M.; Jacobs, B.L.; Privett, R.E.; Gundermann, D.M.; Lin, K.H.; Steinert, N.D.; Goodman, C.A.; Hornberger, T.A. The role of raptor in the mechanical load-induced regulation of mTOR signaling, protein synthesis, and skeletal muscle hypertrophy. FASEB J. 2019, 33, 4021–4034. [Google Scholar] [CrossRef]
  28. Steinert, N.D.; Potts, G.K.; Wilson, G.M.; Klamen, A.M.; Lin, K.H.; Hermanson, J.B.; McNally, R.M.; Coon, J.J.; Hornberger, T.A. Mapping of the contraction-induced phosphoproteome identifies TRIM28 as a significant regulator of skeletal muscle size and function. Cell Rep. 2021, 34, 108796. [Google Scholar] [CrossRef]
  29. Lessard, S.J.; MacDonald, T.L.; Pathak, P.; Han, M.S.; Coffey, V.G.; Edge, J.; Rivas, D.A.; Hirshman, M.F.; Davis, R.J.; Goodyear, L.J. JNK regulates muscle remodeling via myostatin/SMAD inhibition. Nat. Commun. 2018, 9, 3030. [Google Scholar] [CrossRef]
  30. Kitajima, Y.; Tashiro, Y.; Suzuki, N.; Warita, H.; Kato, M.; Tateyama, M.; Ando, R.; Izumi, R.; Yamazaki, M.; Abe, M.; et al. Proteasome dysfunction induces muscle growth defects and protein aggregation. J. Cell Sci. 2014, 127, 5204–5217. [Google Scholar] [CrossRef]
  31. Masiero, E.; Sandri, M. Autophagy inhibition induces atrophy and myopathy in adult skeletal muscles. Autophagy 2010, 6, 307–309. [Google Scholar] [CrossRef]
  32. Judson, R.N.; Gray, S.R.; Walker, C.; Carroll, A.M.; Itzstein, C.; Lionikas, A.; Zammit, P.S.; De Bari, C.; Wackerhage, H. Constitutive expression of Yes-associated protein (Yap) in adult skeletal muscle fibres induces muscle atrophy and myopathy. PLoS ONE 2013, 8, e59622. [Google Scholar] [CrossRef] [PubMed]
  33. Thalacker-Mercer, A.E.; Dell’Italia, L.J.; Cui, X.; Cross, J.M.; Bamman, M.M. Differential genomic responses in old vs. young humans despite similar levels of modest muscle damage after resistance loading. Physiol. Genom. 2010, 40, 141–149. [Google Scholar] [CrossRef] [PubMed]
  34. Brown, W.M. Exercise-associated DNA methylation change in skeletal muscle and the importance of imprinted genes: A bioinformatics meta-analysis. Br. J. Sport. Med. 2015, 49, 1567–1578. [Google Scholar] [CrossRef]
  35. Drummond, M.J.; McCarthy, J.J.; Sinha, M.; Spratt, H.M.; Volpi, E.; Esser, K.A.; Rasmussen, B.B. Aging and microRNA expression in human skeletal muscle: A microarray and bioinformatics analysis. Physiol. Genom. 2011, 43, 595–603. [Google Scholar] [CrossRef]
  36. Feng, M.; Ji, J.; Li, X.; Ye, X. Identification of the Exercise and Time Effects on Human Skeletal Muscle through Bioinformatics Methods. Genet. Res. 2022, 2022, 9582363. [Google Scholar] [CrossRef]
  37. Ashburner, M.; Ball, C.A.; Blake, J.A.; Botstein, D.; Butler, H.; Cherry, J.M.; Davis, A.P.; Dolinski, K.; Dwight, S.S.; Eppig, J.T.; et al. Gene ontology: Tool for the unification of biology. The Gene Ontology Consortium. Nat. Genet. 2000, 25, 25–29. [Google Scholar] [CrossRef]
  38. Subramanian, A.; Tamayo, P.; Mootha, V.K.; Mukherjee, S.; Ebert, B.L.; Gillette, M.A.; Paulovich, A.; Pomeroy, S.L.; Golub, T.R.; Lander, E.S.; et al. Gene set enrichment analysis: A knowledge-based approach for interpreting genome-wide expression profiles. Proc. Natl. Acad. Sci. USA 2005, 102, 15545–15550. [Google Scholar] [CrossRef]
  39. Kollias, H.D.; McDermott, J.C. Transforming growth factor-beta and myostatin signaling in skeletal muscle. J. Appl. Physiol. 2008, 104, 579–587. [Google Scholar] [CrossRef]
  40. Trendelenburg, A.U.; Meyer, A.; Rohner, D.; Boyle, J.; Hatakeyama, S.; Glass, D.J. Myostatin reduces Akt/TORC1/p70S6K signaling, inhibiting myoblast differentiation and myotube size. Am. J. Physiol. Cell Physiol. 2009, 296, C1258–C1270. [Google Scholar] [CrossRef]
  41. Lee, S.J.; Lehar, A.; Liu, Y.; Ly, C.H.; Pham, Q.M.; Michaud, M.; Rydzik, R.; Youngstrom, D.W.; Shen, M.M.; Kaartinen, V.; et al. Functional redundancy of type I and type II receptors in the regulation of skeletal muscle growth by myostatin and activin A. Proc. Natl. Acad. Sci. USA 2020, 117, 30907–30917. [Google Scholar] [CrossRef] [PubMed]
  42. Winbanks, C.E.; Weeks, K.L.; Thomson, R.E.; Sepulveda, P.V.; Beyer, C.; Qian, H.; Chen, J.L.; Allen, J.M.; Lancaster, G.I.; Febbraio, M.A.; et al. Follistatin-mediated skeletal muscle hypertrophy is regulated by Smad3 and mTOR independently of myostatin. J. Cell Biol. 2012, 197, 997–1008. [Google Scholar] [CrossRef] [PubMed]
  43. Brandt, C.; Hansen, R.H.; Hansen, J.B.; Olsen, C.H.; Galle, P.; Mandrup-Poulsen, T.; Gehl, J.; Pedersen, B.K.; Hojman, P. Over-expression of Follistatin-like 3 attenuates fat accumulation and improves insulin sensitivity in mice. Metabolism 2015, 64, 283–295. [Google Scholar] [CrossRef] [PubMed]
  44. Lee, S.J.; Lee, Y.S.; Zimmers, T.A.; Soleimani, A.; Matzuk, M.M.; Tsuchida, K.; Cohn, R.D.; Barton, E.R. Regulation of muscle mass by follistatin and activins. Mol. Endocrinol. 2010, 24, 1998–2008. [Google Scholar] [CrossRef]
  45. Brown, C.W.; Houston-Hawkins, D.E.; Woodruff, T.K.; Matzuk, M.M. Insertion of Inhbb into the Inhba locus rescues the Inhba-null phenotype and reveals new activin functions. Nat. Genet. 2000, 25, 453–457. [Google Scholar] [CrossRef]
  46. Lee, S.J.; Lehar, A.; Meir, J.U.; Koch, C.; Morgan, A.; Warren, L.E.; Rydzik, R.; Youngstrom, D.W.; Chandok, H.; George, J.; et al. Targeting myostatin/activin A protects against skeletal muscle and bone loss during spaceflight. Proc. Natl. Acad. Sci. USA 2020, 117, 23942–23951. [Google Scholar] [CrossRef]
  47. Pourteymour, S.; Eckardt, K.; Holen, T.; Langleite, T.; Lee, S.; Jensen, J.; Birkeland, K.I.; Drevon, C.A.; Hjorth, M. Global mRNA sequencing of human skeletal muscle: Search for novel exercise-regulated myokines. Mol. Metab. 2017, 6, 352–365. [Google Scholar] [CrossRef]
  48. Goh, B.C.; Singhal, V.; Herrera, A.J.; Tomlinson, R.E.; Kim, S.; Faugere, M.C.; Germain-Lee, E.L.; Clemens, T.L.; Lee, S.J.; DiGirolamo, D.J. Activin receptor type 2A (ACVR2A) functions directly in osteoblasts as a negative regulator of bone mass. J. Biol. Chem. 2017, 292, 13809–13822. [Google Scholar] [CrossRef]
  49. MacKenzie, M.G.; Hamilton, D.L.; Pepin, M.; Patton, A.; Baar, K. Inhibition of myostatin signaling through Notch activation following acute resistance exercise. PLoS ONE 2013, 8, e68743. [Google Scholar] [CrossRef]
  50. Lee, S.J.; McPherron, A.C. Regulation of myostatin activity and muscle growth. Proc. Natl. Acad. Sci. USA 2001, 98, 9306–9311. [Google Scholar] [CrossRef]
  51. Yang, J.; Wang, J.; Zeng, Z.; Qiao, L.; Zhuang, L.; Jiang, L.; Wei, J.; Ma, Q.; Wu, M.; Ye, S.; et al. Smad4 is required for the development of cardiac and skeletal muscle in zebrafish. Differentiation 2016, 92, 161–168. [Google Scholar] [CrossRef] [PubMed]
  52. Kim, J.S.; Cross, J.M.; Bamman, M.M. Impact of resistance loading on myostatin expression and cell cycle regulation in young and older men and women. Am. J. Physiol. Endocrinol. Metab. 2005, 288, E1110–E1119. [Google Scholar] [CrossRef] [PubMed]
  53. Hulmi, J.J.; Ahtiainen, J.P.; Kaasalainen, T.; Pollanen, E.; Hakkinen, K.; Alen, M.; Selanne, H.; Kovanen, V.; Mero, A.A. Postexercise myostatin and activin IIb mRNA levels: Effects of strength training. Med. Sci. Sport. Exerc. 2007, 39, 289–297. [Google Scholar] [CrossRef] [PubMed]
  54. Drummond, M.J.; Fujita, S.; Abe, T.; Dreyer, H.C.; Volpi, E.; Rasmussen, B.B. Human muscle gene expression following resistance exercise and blood flow restriction. Med. Sci. Sport. Exerc. 2008, 40, 691–698. [Google Scholar] [CrossRef]
  55. Dalbo, V.J.; Roberts, M.D.; Hassell, S.; Kerksick, C.M. Effects of pre-exercise feeding on serum hormone concentrations and biomarkers of myostatin and ubiquitin proteasome pathway activity. Eur. J. Nutr. 2013, 52, 477–487. [Google Scholar] [CrossRef]
  56. Dalbo, V.J.; Roberts, M.D.; Sunderland, K.L.; Poole, C.N.; Stout, J.R.; Beck, T.W.; Bemben, M.; Kerksick, C.M. Acute loading and aging effects on myostatin pathway biomarkers in human skeletal muscle after three sequential bouts of resistance exercise. J. Gerontol. A Biol. Sci. Med. Sci. 2011, 66, 855–865. [Google Scholar] [CrossRef]
  57. Friedmann-Bette, B.; Lornsen, H.; Parstorfer, M.; Gwechenberger, T.; Profit, F.; Weber, M.A.; Barie, A. Gene expression changes in vastus lateralis muscle after different strength training regimes during rehabilitation following anterior cruciate ligament reconstruction. PLoS ONE 2021, 16, e0258635. [Google Scholar] [CrossRef]
  58. Hansen, J.; Brandt, C.; Nielsen, A.R.; Hojman, P.; Whitham, M.; Febbraio, M.A.; Pedersen, B.K.; Plomgaard, P. Exercise induces a marked increase in plasma follistatin: Evidence that follistatin is a contraction-induced hepatokine. Endocrinology 2011, 152, 164–171. [Google Scholar] [CrossRef]
  59. Jensky, N.E.; Sims, J.K.; Dieli-Conwright, C.M.; Sattler, F.R.; Rice, J.C.; Schroeder, E.T. Exercise does not influence myostatin and follistatin messenger RNA expression in young women. J. Strength Cond. Res. 2010, 24, 522–530. [Google Scholar] [CrossRef]
  60. Mathai, A.S.; Bonen, A.; Benton, C.R.; Robinson, D.L.; Graham, T.E. Rapid exercise-induced changes in PGC-1alpha mRNA and protein in human skeletal muscle. J. Appl. Physiol. 2008, 105, 1098–1105. [Google Scholar] [CrossRef]
  61. Goodman, C.A.; Frey, J.W.; Mabrey, D.M.; Jacobs, B.L.; Lincoln, H.C.; You, J.S.; Hornberger, T.A. The role of skeletal muscle mTOR in the regulation of mechanical load-induced growth. J. Physiol. 2011, 589, 5485–5501. [Google Scholar] [CrossRef] [PubMed]
  62. Yoon, M.S. mTOR as a Key Regulator in Maintaining Skeletal Muscle Mass. Front. Physiol. 2017, 8, 788. [Google Scholar] [CrossRef] [PubMed]
  63. Wilson, E.M.; Rotwein, P. Selective control of skeletal muscle differentiation by Akt1. J. Biol. Chem. 2007, 282, 5106–5110. [Google Scholar] [CrossRef] [PubMed]
  64. You, J.S.; Lincoln, H.C.; Kim, C.R.; Frey, J.W.; Goodman, C.A.; Zhong, X.P.; Hornberger, T.A. The role of diacylglycerol kinase zeta and phosphatidic acid in the mechanical activation of mammalian target of rapamycin (mTOR) signaling and skeletal muscle hypertrophy. J. Biol. Chem. 2014, 289, 1551–1563. [Google Scholar] [CrossRef] [PubMed]
  65. Spangenburg, E.E.; Abraha, T.; Childs, T.E.; Pattison, J.S.; Booth, F.W. Skeletal muscle IGF-binding protein-3 and -5 expressions are age, muscle, and load dependent. Am. J. Physiol. Endocrinol. Metab. 2003, 284, E340–E350. [Google Scholar] [CrossRef]
  66. Batt, J.; Bain, J.; Goncalves, J.; Michalski, B.; Plant, P.; Fahnestock, M.; Woodgett, J. Differential gene expression profiling of short and long term denervated muscle. FASEB J. 2006, 20, 115–117. [Google Scholar] [CrossRef]
  67. Schmidt, S.; Gay, D.; Uthe, F.W.; Denk, S.; Paauwe, M.; Matthes, N.; Diefenbacher, M.E.; Bryson, S.; Warrander, F.C.; Erhard, F.; et al. A MYC-GCN2-eIF2alpha negative feedback loop limits protein synthesis to prevent MYC-dependent apoptosis in colorectal cancer. Nat. Cell Biol. 2019, 21, 1413–1424. [Google Scholar] [CrossRef]
  68. Schiaffino, S.; Mammucari, C. Regulation of skeletal muscle growth by the IGF1-Akt/PKB pathway: Insights from genetic models. Skelet. Muscle 2011, 1, 4. [Google Scholar] [CrossRef]
  69. Timmer, L.T.; Hoogaars, W.M.H.; Jaspers, R.T. The Role of IGF-1 Signaling in Skeletal Muscle Atrophy. Adv. Exp. Med. Biol. 2018, 1088, 109–137. [Google Scholar] [CrossRef]
  70. Frey, J.W.; Jacobs, B.L.; Goodman, C.A.; Hornberger, T.A. A role for Raptor phosphorylation in the mechanical activation of mTOR signaling. Cell. Signal. 2014, 26, 313–322. [Google Scholar] [CrossRef]
  71. Hsieh, C.T.; Chuang, J.H.; Yang, W.C.; Yin, Y.; Lin, Y. Ceramide inhibits insulin-stimulated Akt phosphorylation through activation of Rheb/mTORC1/S6K signaling in skeletal muscle. Cell. Signal. 2014, 26, 1400–1408. [Google Scholar] [CrossRef] [PubMed]
  72. Wilborn, C.D.; Taylor, L.W.; Greenwood, M.; Kreider, R.B.; Willoughby, D.S. Effects of different intensities of resistance exercise on regulators of myogenesis. J. Strength Cond. Res. 2009, 23, 2179–2187. [Google Scholar] [CrossRef] [PubMed]
  73. Wang, L.; Mascher, H.; Psilander, N.; Blomstrand, E.; Sahlin, K. Resistance exercise enhances the molecular signaling of mitochondrial biogenesis induced by endurance exercise in human skeletal muscle. J. Appl. Physiol. 2011, 111, 1335–1344. [Google Scholar] [CrossRef]
  74. Dennis, R.A.; Przybyla, B.; Gurley, C.; Kortebein, P.M.; Simpson, P.; Sullivan, D.H.; Peterson, C.A. Aging alters gene expression of growth and remodeling factors in human skeletal muscle both at rest and in response to acute resistance exercise. Physiol. Genom. 2008, 32, 393–400. [Google Scholar] [CrossRef]
  75. Drummond, M.J.; Dreyer, H.C.; Fry, C.S.; Glynn, E.L.; Rasmussen, B.B. Nutritional and contractile regulation of human skeletal muscle protein synthesis and mTORC1 signaling. J. Appl. Physiol. 2009, 106, 1374–1384. [Google Scholar] [CrossRef] [PubMed]
  76. Apro, W.; Wang, L.; Ponten, M.; Blomstrand, E.; Sahlin, K. Resistance exercise induced mTORC1 signaling is not impaired by subsequent endurance exercise in human skeletal muscle. Am. J. Physiol. Endocrinol. Metab. 2013, 305, E22–E32. [Google Scholar] [CrossRef] [PubMed]
  77. Blomstrand, E.; Eliasson, J.; Karlsson, H.K.; Kohnke, R. Branched-chain amino acids activate key enzymes in protein synthesis after physical exercise. J. Nutr. 2006, 136, 269S–273S. [Google Scholar] [CrossRef]
  78. Dreyer, H.C.; Fujita, S.; Glynn, E.L.; Drummond, M.J.; Volpi, E.; Rasmussen, B.B. Resistance exercise increases leg muscle protein synthesis and mTOR signalling independent of sex. Acta Physiol. 2010, 199, 71–81. [Google Scholar] [CrossRef]
  79. Hodson, N.; Mazzulla, M.; Holowaty, M.N.H.; Kumbhare, D.; Moore, D.R. RPS6 phosphorylation occurs to a greater extent in the periphery of human skeletal muscle fibers, near focal adhesions, after anabolic stimuli. Am. J. Physiol. Cell Physiol. 2022, 322, C94–C110. [Google Scholar] [CrossRef]
  80. Hulmi, J.J.; Tannerstedt, J.; Selanne, H.; Kainulainen, H.; Kovanen, V.; Mero, A.A. Resistance exercise with whey protein ingestion affects mTOR signaling pathway and myostatin in men. J. Appl. Physiol. 2009, 106, 1720–1729. [Google Scholar] [CrossRef]
  81. Moore, D.R.; Atherton, P.J.; Rennie, M.J.; Tarnopolsky, M.A.; Phillips, S.M. Resistance exercise enhances mTOR and MAPK signalling in human muscle over that seen at rest after bolus protein ingestion. Acta Physiol. 2011, 201, 365–372. [Google Scholar] [CrossRef] [PubMed]
  82. Song, Z.; Moore, D.R.; Hodson, N.; Ward, C.; Dent, J.R.; O’Leary, M.F.; Shaw, A.M.; Hamilton, D.L.; Sarkar, S.; Gangloff, Y.G.; et al. Resistance exercise initiates mechanistic target of rapamycin (mTOR) translocation and protein complex co-localisation in human skeletal muscle. Sci. Rep. 2017, 7, 5028. [Google Scholar] [CrossRef] [PubMed]
  83. Haun, C.T.; Mumford, P.W.; Roberson, P.A.; Romero, M.A.; Mobley, C.B.; Kephart, W.C.; Anderson, R.G.; Colquhoun, R.J.; Muddle, T.W.D.; Luera, M.J.; et al. Molecular, neuromuscular, and recovery responses to light versus heavy resistance exercise in young men. Physiol. Rep. 2017, 5, e13457. [Google Scholar] [CrossRef]
  84. Snijders, T.; Verdijk, L.B.; McKay, B.R.; Smeets, J.S.; van Kranenburg, J.; Groen, B.B.; Parise, G.; Greenhaff, P.; van Loon, L.J. Acute dietary protein intake restriction is associated with changes in myostatin expression after a single bout of resistance exercise in healthy young men. J. Nutr. 2014, 144, 137–145. [Google Scholar] [CrossRef] [PubMed]
  85. Bagheri, R.; Rashidlamir, A.; Motevalli, M.S.; Elliott, B.T.; Mehrabani, J.; Wong, A. Effects of upper-body, lower-body, or combined resistance training on the ratio of follistatin and myostatin in middle-aged men. Eur. J. Appl. Physiol. 2019, 119, 1921–1931. [Google Scholar] [CrossRef]
  86. Mafi, F.; Biglari, S.; Ghardashi Afousi, A.; Gaeini, A.A. Improvement in Skeletal Muscle Strength and Plasma Levels of Follistatin and Myostatin Induced by an 8-Week Resistance Training and Epicatechin Supplementation in Sarcopenic Older Adults. J. Aging Phys. Act. 2019, 27, 384–391. [Google Scholar] [CrossRef] [PubMed]
Figure 1. Heat map of mRNAs related to hypertrophy and their acute responses to the 30 Fail or 80 Fail bouts. These data show the log2 expression of the 58 mRNAs related to skeletal muscle hypertrophy. Genes are sorted (top to bottom) based on basal expression at the 30 Fail PRE condition. Notably, only significant time effects (not interaction effects) were evident (denoted by *, p < 0.01).
Cells 12 00898 g001
Figure 2. MSTN and ACVR2B mRNA and DNA methylation responses. mRNA and methylation responses of myostatin (MSTN, panel (a)) and Activin A Receptor Type 2B (ACVR2B, panel (b)), which is the cognate receptor for myostatin. Notably, resistance exercise (regardless of load) downregulated these mRNAs, whereas only ACVR2B showed several CpG sites being significantly hypermethylated by resistance exercise. Symbol: *, indicates mRNA at 3 h or 6 h post-exercise was significantly downregulated. Other note: CpG sites are depicted as M-value changes from PRE, where red coloration indicates a directional change downward, and blue indicates a directional change upward.
Cells 12 00898 g002
Figure 3. FST and SKI mRNA and DNA methylation responses. mRNA and methylation responses of follistatin (FST, panel (a)) and SKI Proto-Oncogene (SKI, panel (b)), both of which are inhibitors of myostatin signaling. Notably, resistance exercise (regardless of load) upregulated these mRNAs, and neither mRNA response was seemingly associated with CpG site methylation patterns. Symbol: *, indicates mRNA at 3 h or 6 h post-exercise was significantly downregulated. Other note: CpG sites are depicted as M-value changes from PRE, where red coloration indicates a directional change downward, and blue indicates a directional change upward.
Cells 12 00898 g003
Figure 4. Phospho-signaling responses of select AKT-mTORC1 targets. Phosphorylation responses of AKT (panel (a)), mTOR (panel (b)), and p70S6K (panel (c)), both of which are inhibitors of myostatin signaling. Notably, resistance exercise (regardless of load) increased the phosphorylation status of p70S6K. Panel (d) contains representative Western blots of the assayed targets.
Cells 12 00898 g004
Figure 5. FST and MSTN protein responses. The effects of each bout on the protein expression of follistatin (FST) (Panel (a)) and myostatin (MSTN) (Panel (b)) are presented. Resistance exercise (re-gardless of load) increased FST levels 6 h following exercise. Panel (c) contains representative blots of the assayed targets; note these targets came from the same participant, which is why the Ponceau stains are similar.
Cells 12 00898 g005
Disclaimer/Publisher’s Note: The statements, opinions and data contained in all publications are solely those of the individual author(s) and contributor(s) and not of MDPI and/or the editor(s). MDPI and/or the editor(s) disclaim responsibility for any injury to people or property resulting from any ideas, methods, instructions or products referred to in the content.

