
Cerebellar Transcriptomic Analysis in a Chronic plus Binge Mouse Model of Alcohol Use Disorder Demonstrates Ethanol-Induced Neuroinflammation and Altered Glial Gene Expression
 ,
,
Abstract
:
1. Introduction
2. Materials and Methods
2.1. Animals
2.2. Isolation of RNA, RNA-Seq Library Preparation, and Sequencing
2.3. Bioinformatic Analysis
3. Results
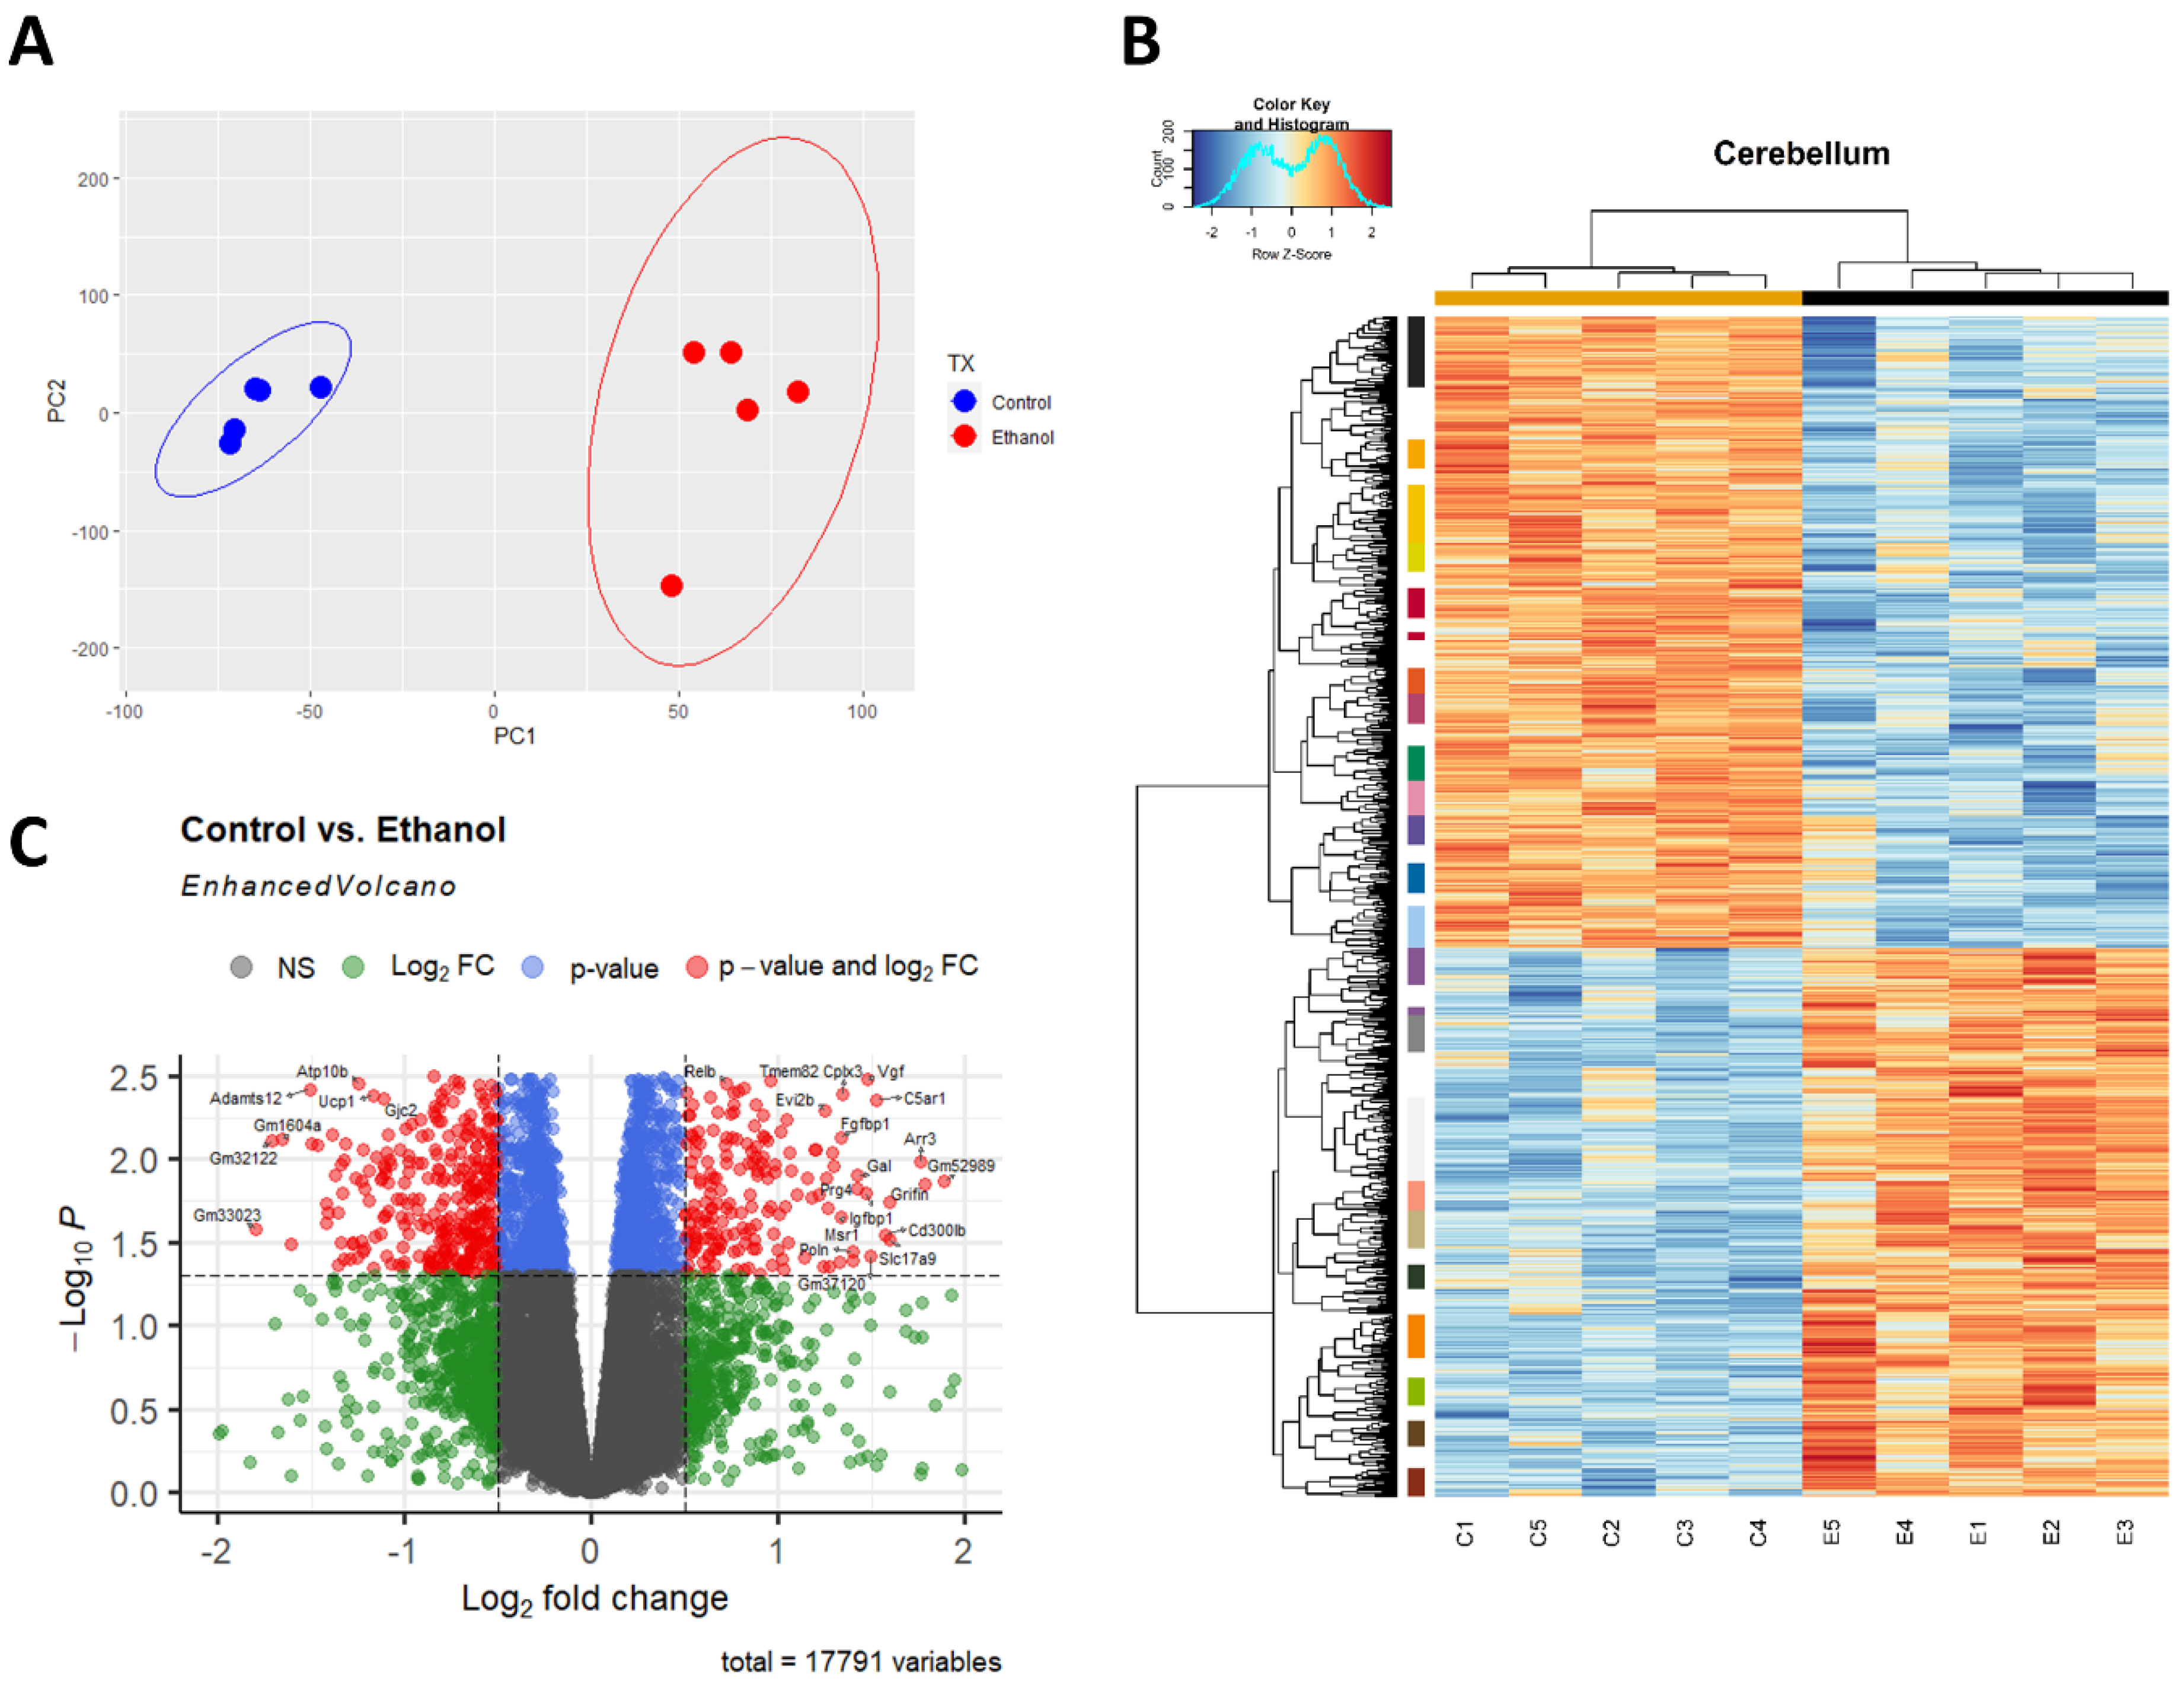
3.1. Alcohol-Induced Differential Gene Expression in the Cerebellum
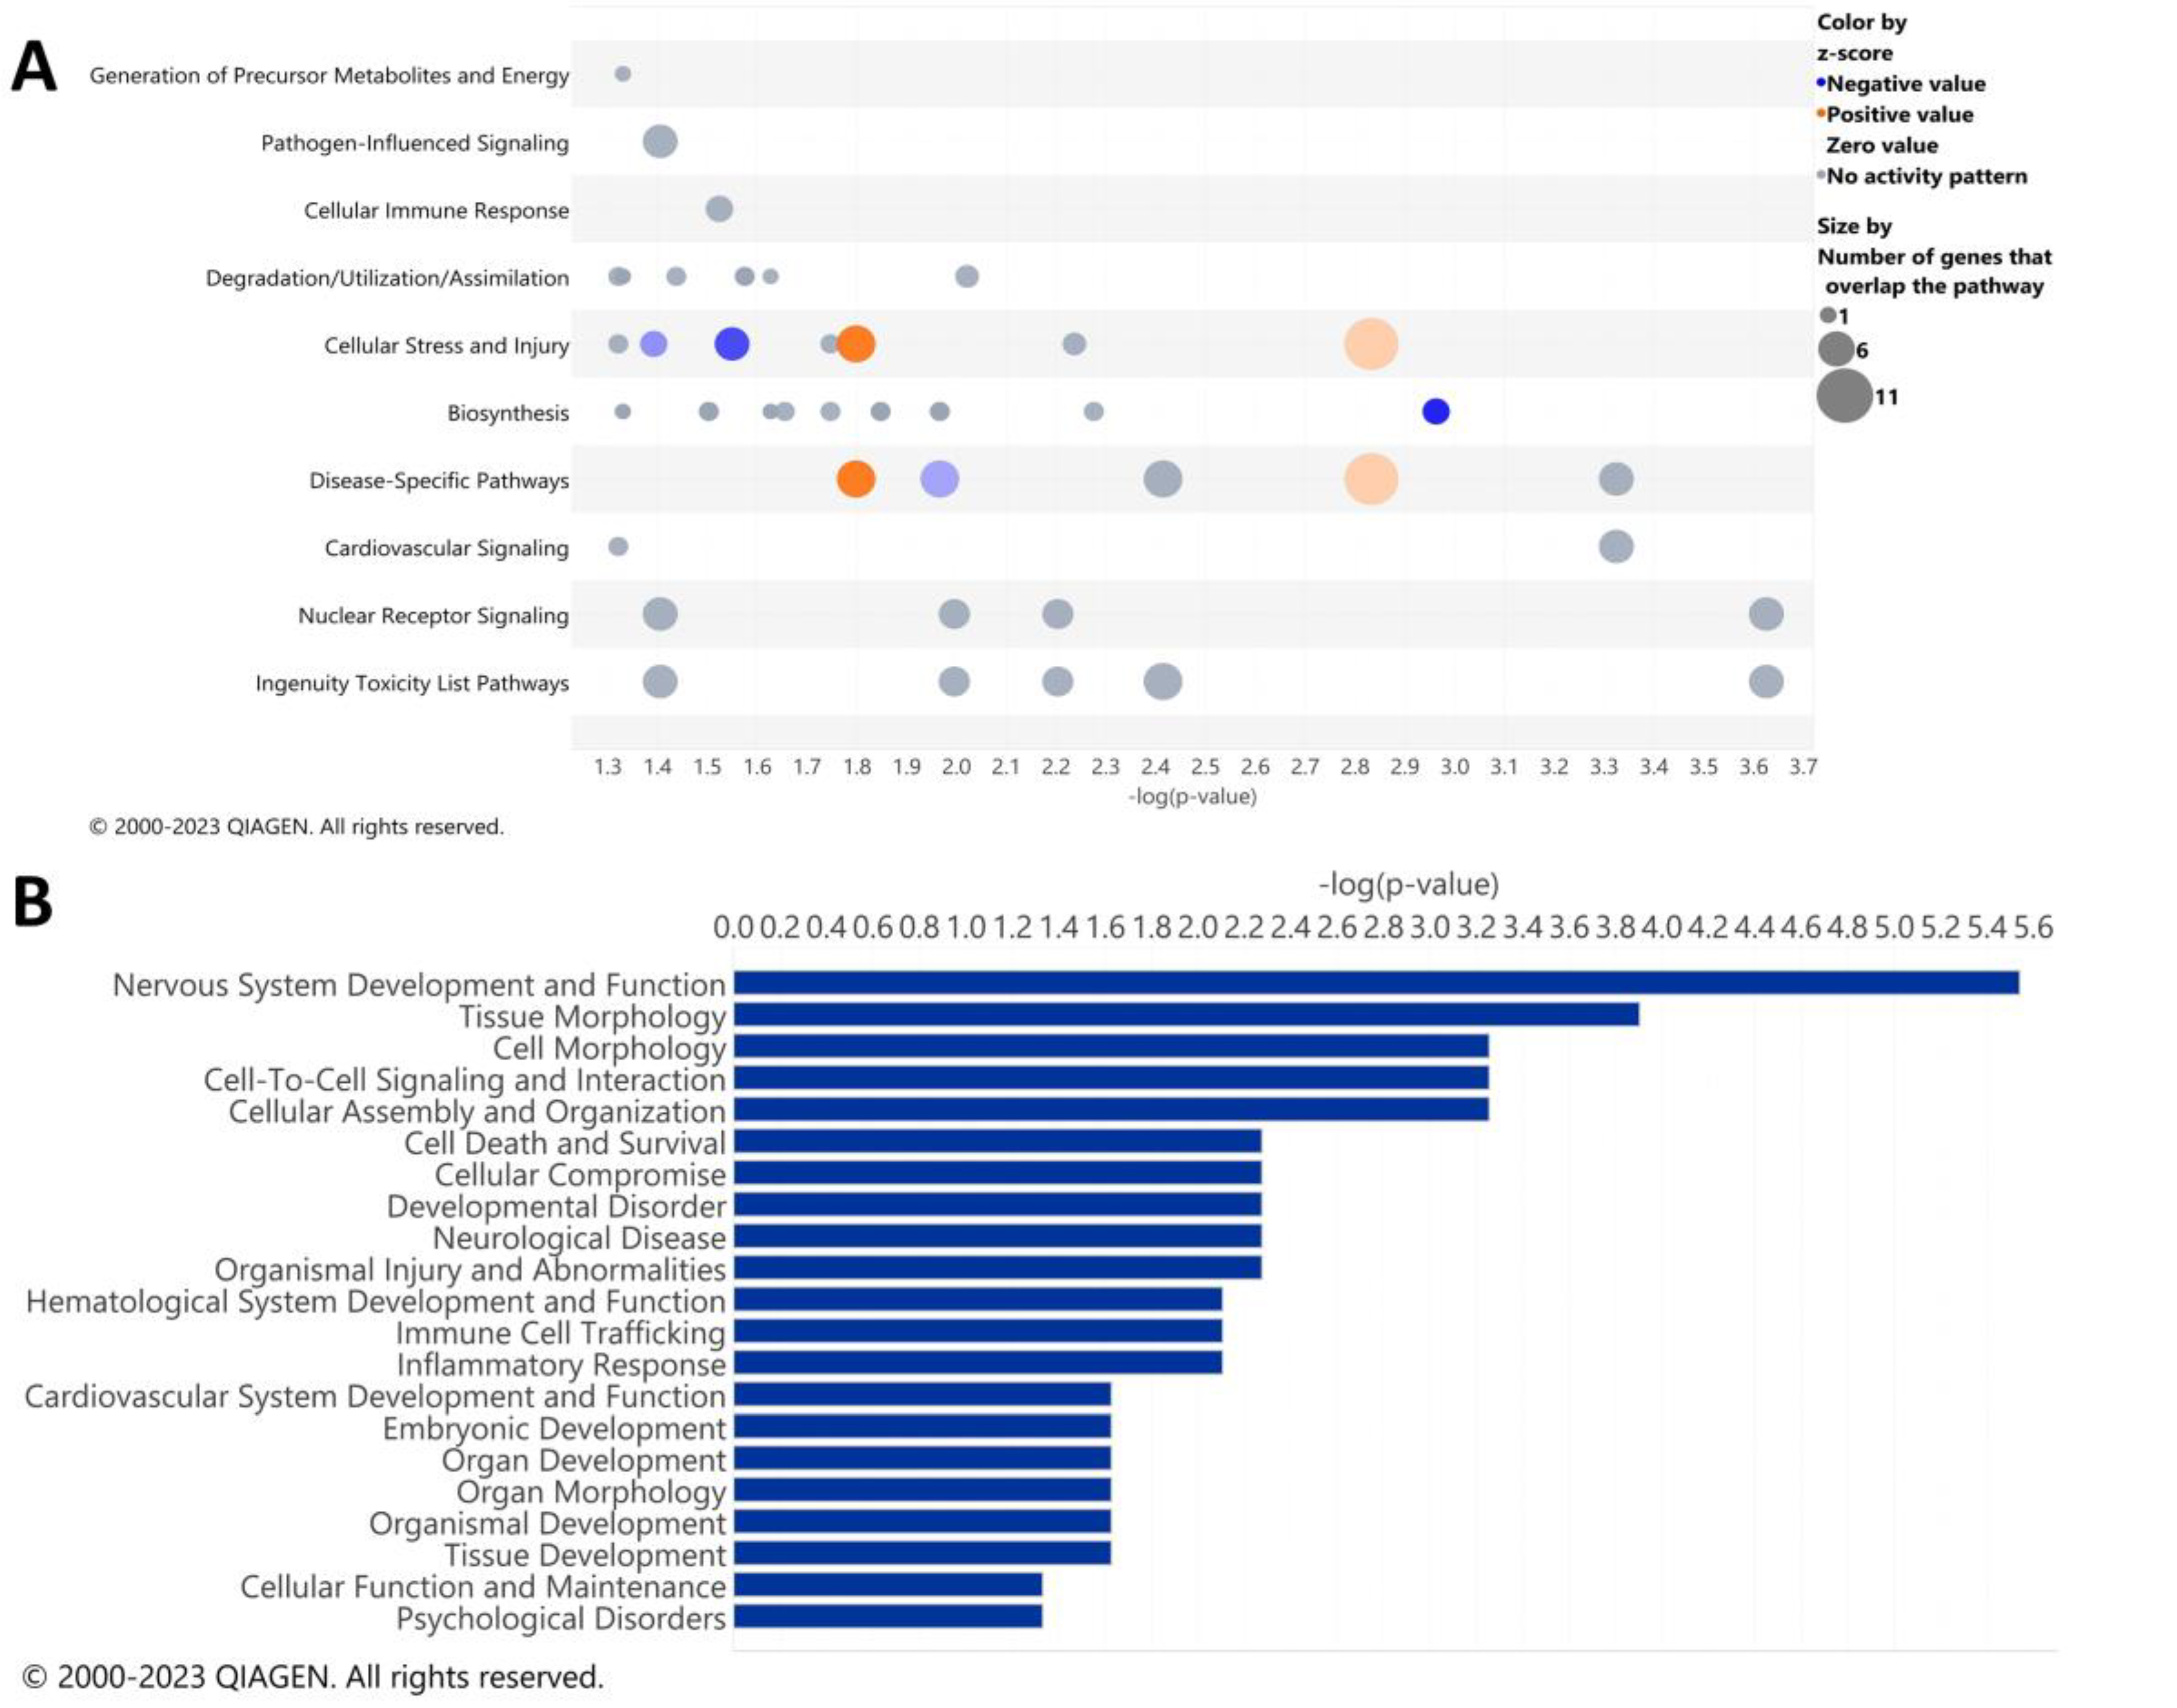
3.2. Pathway Analysis of the Alcohol-Induced Differentially Regulated Genes
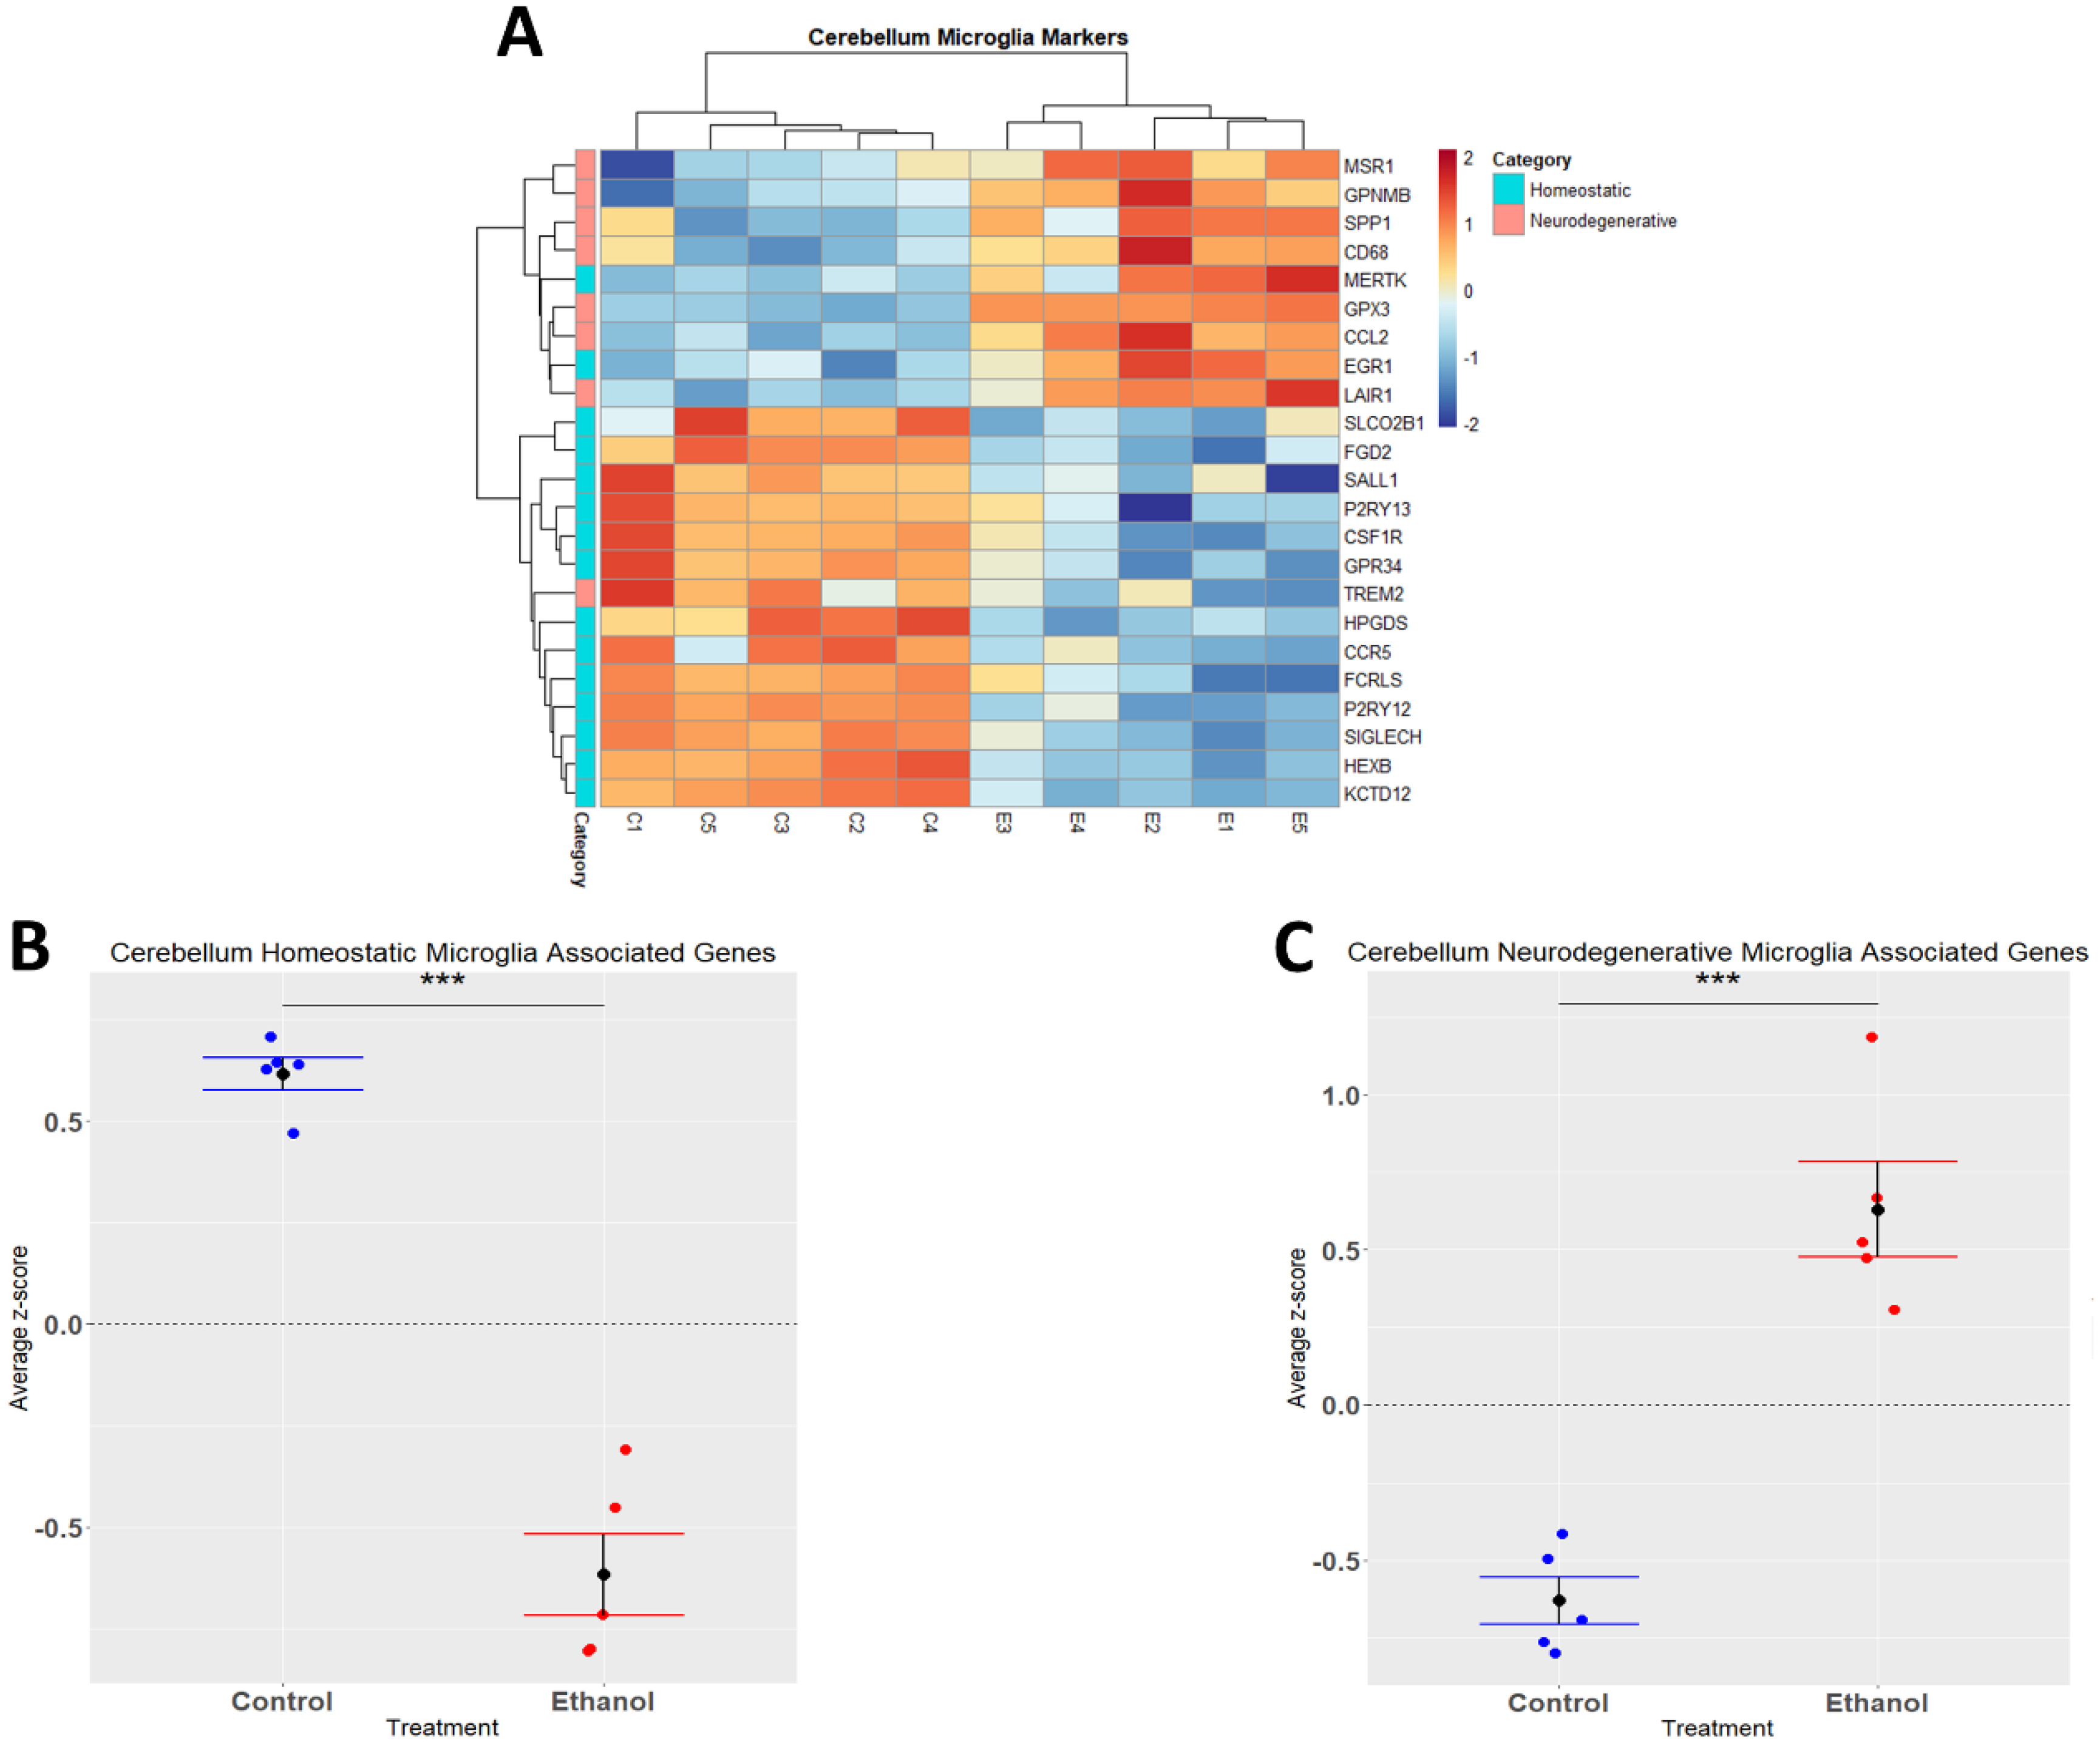
3.3. Alcohol Suppresses Microglia Homeostatic Genes while Increasing the Expression of Microglia Neurodegenerative-Associated Genes
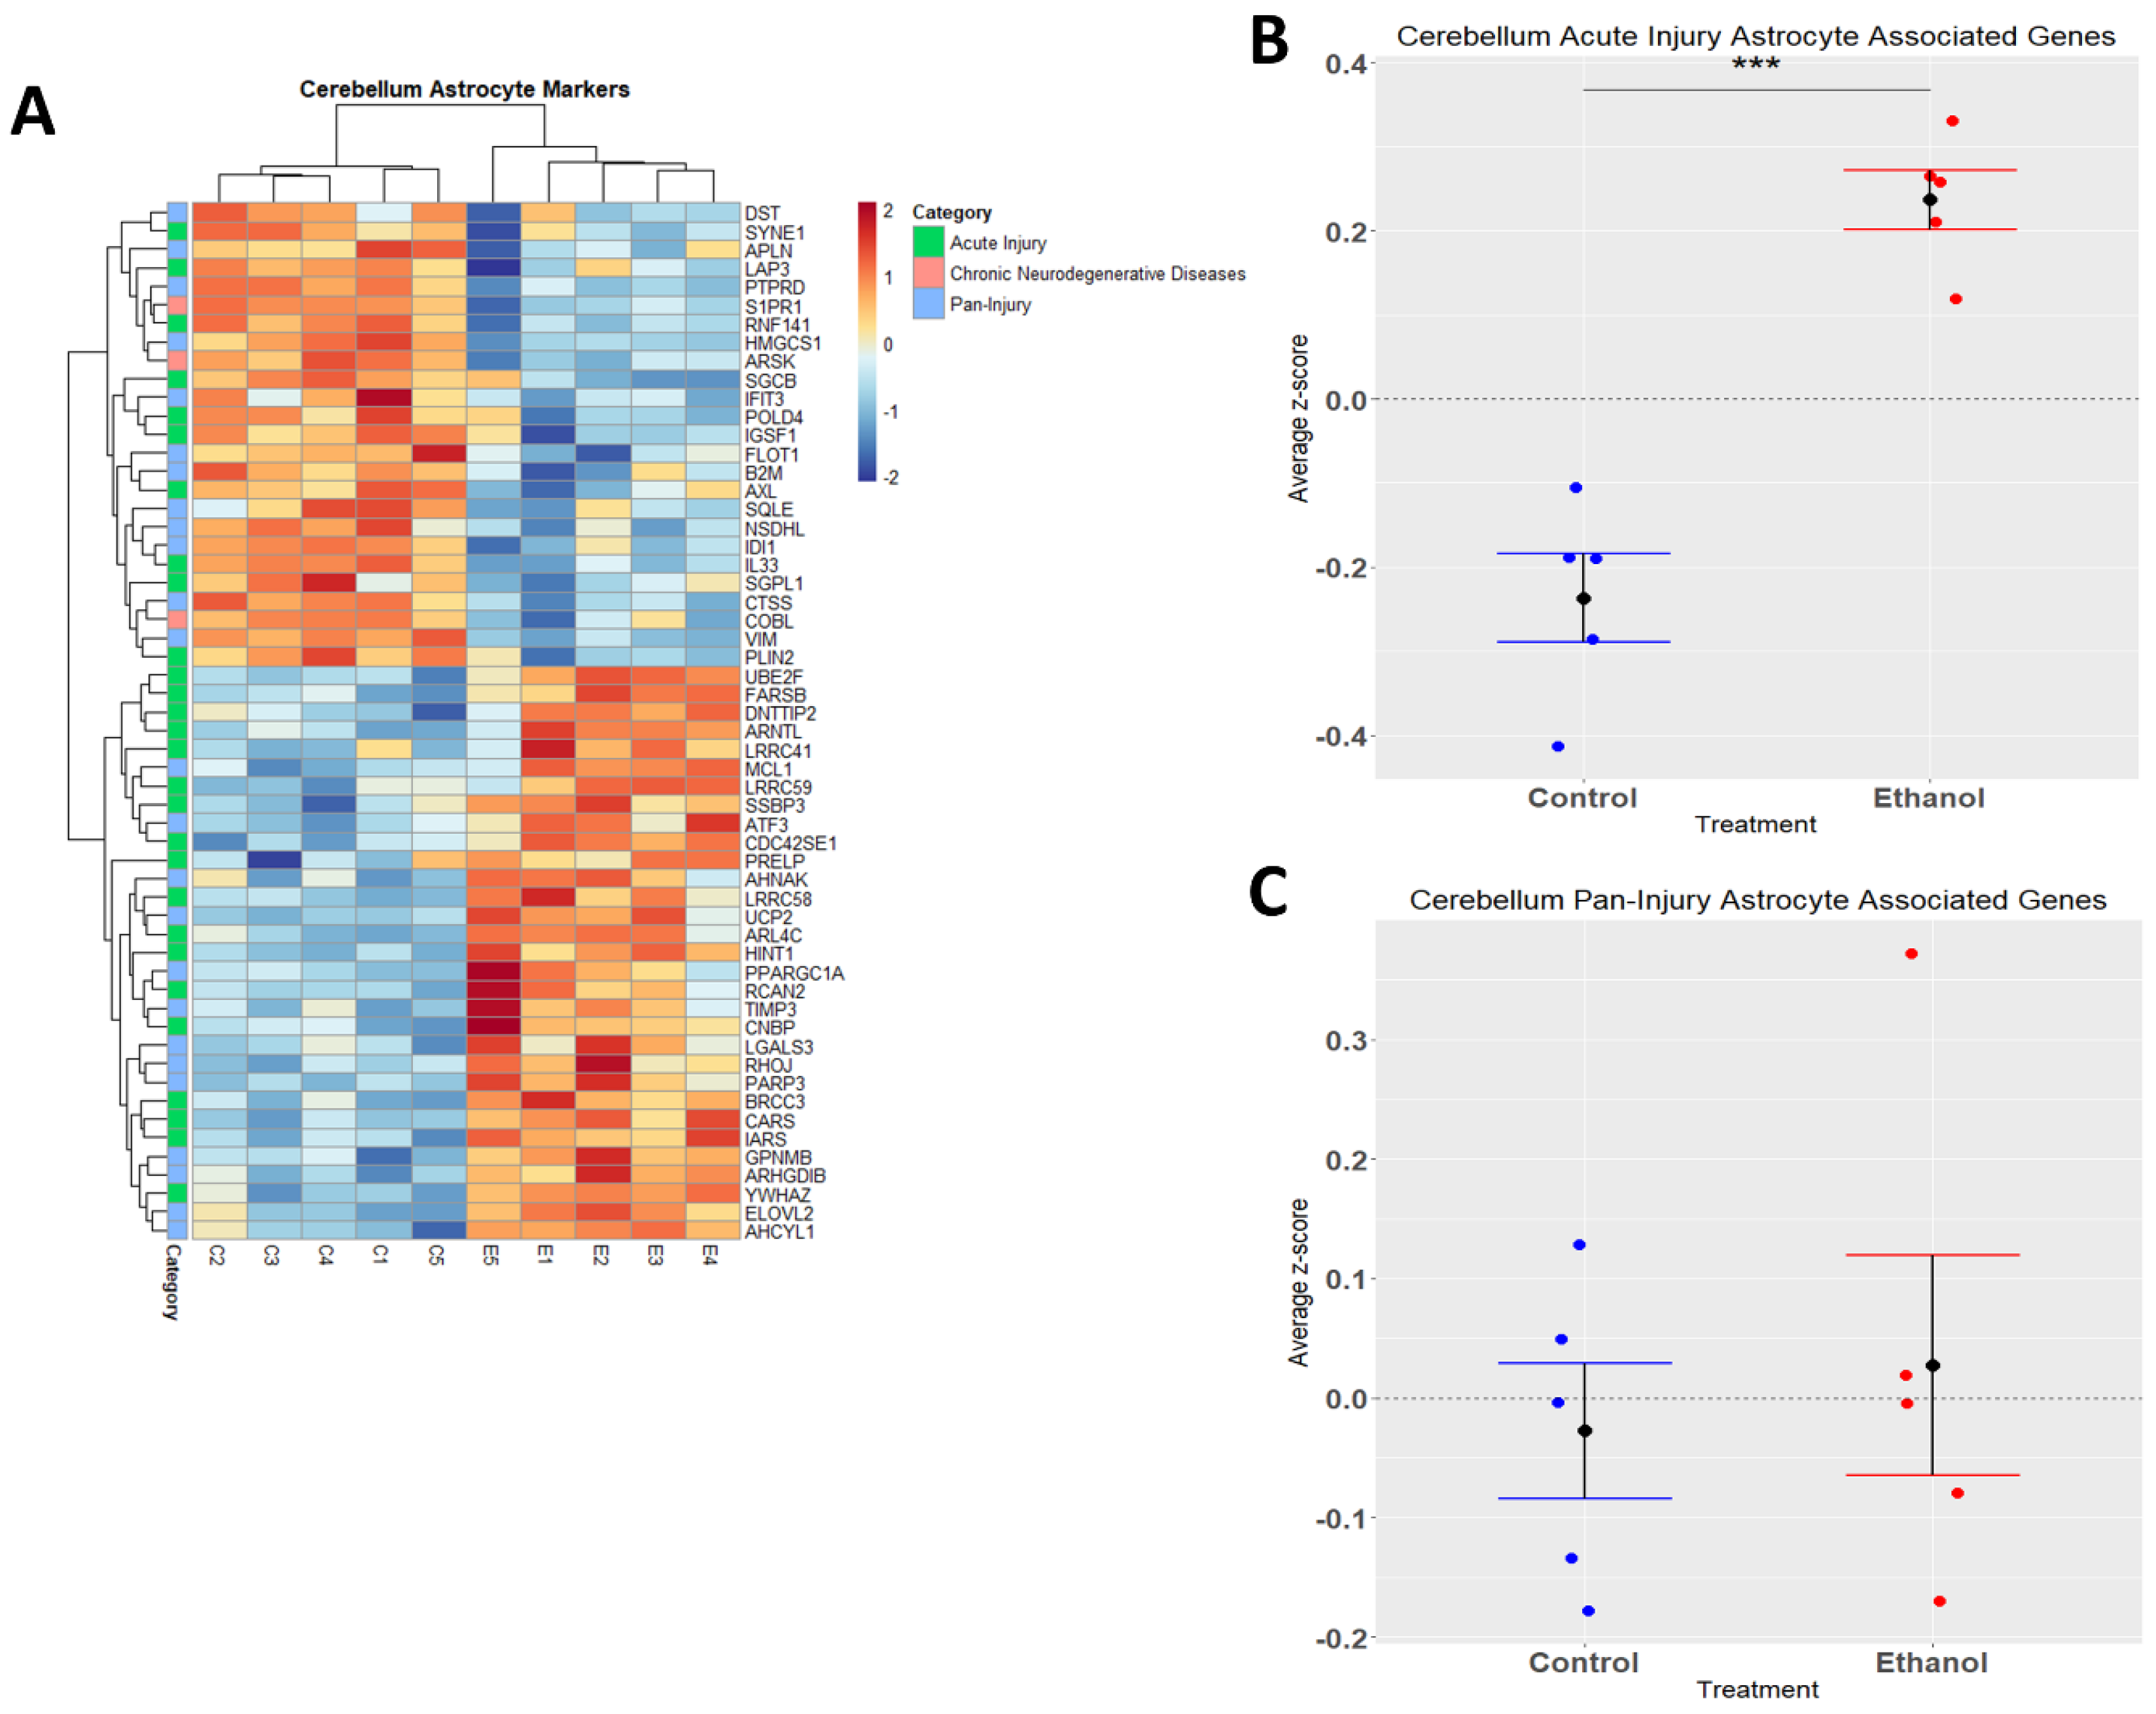
3.4. Astrocytes Undergo a Phenotypic Switch following Chronic plus Binge-like Alcohol Exposure
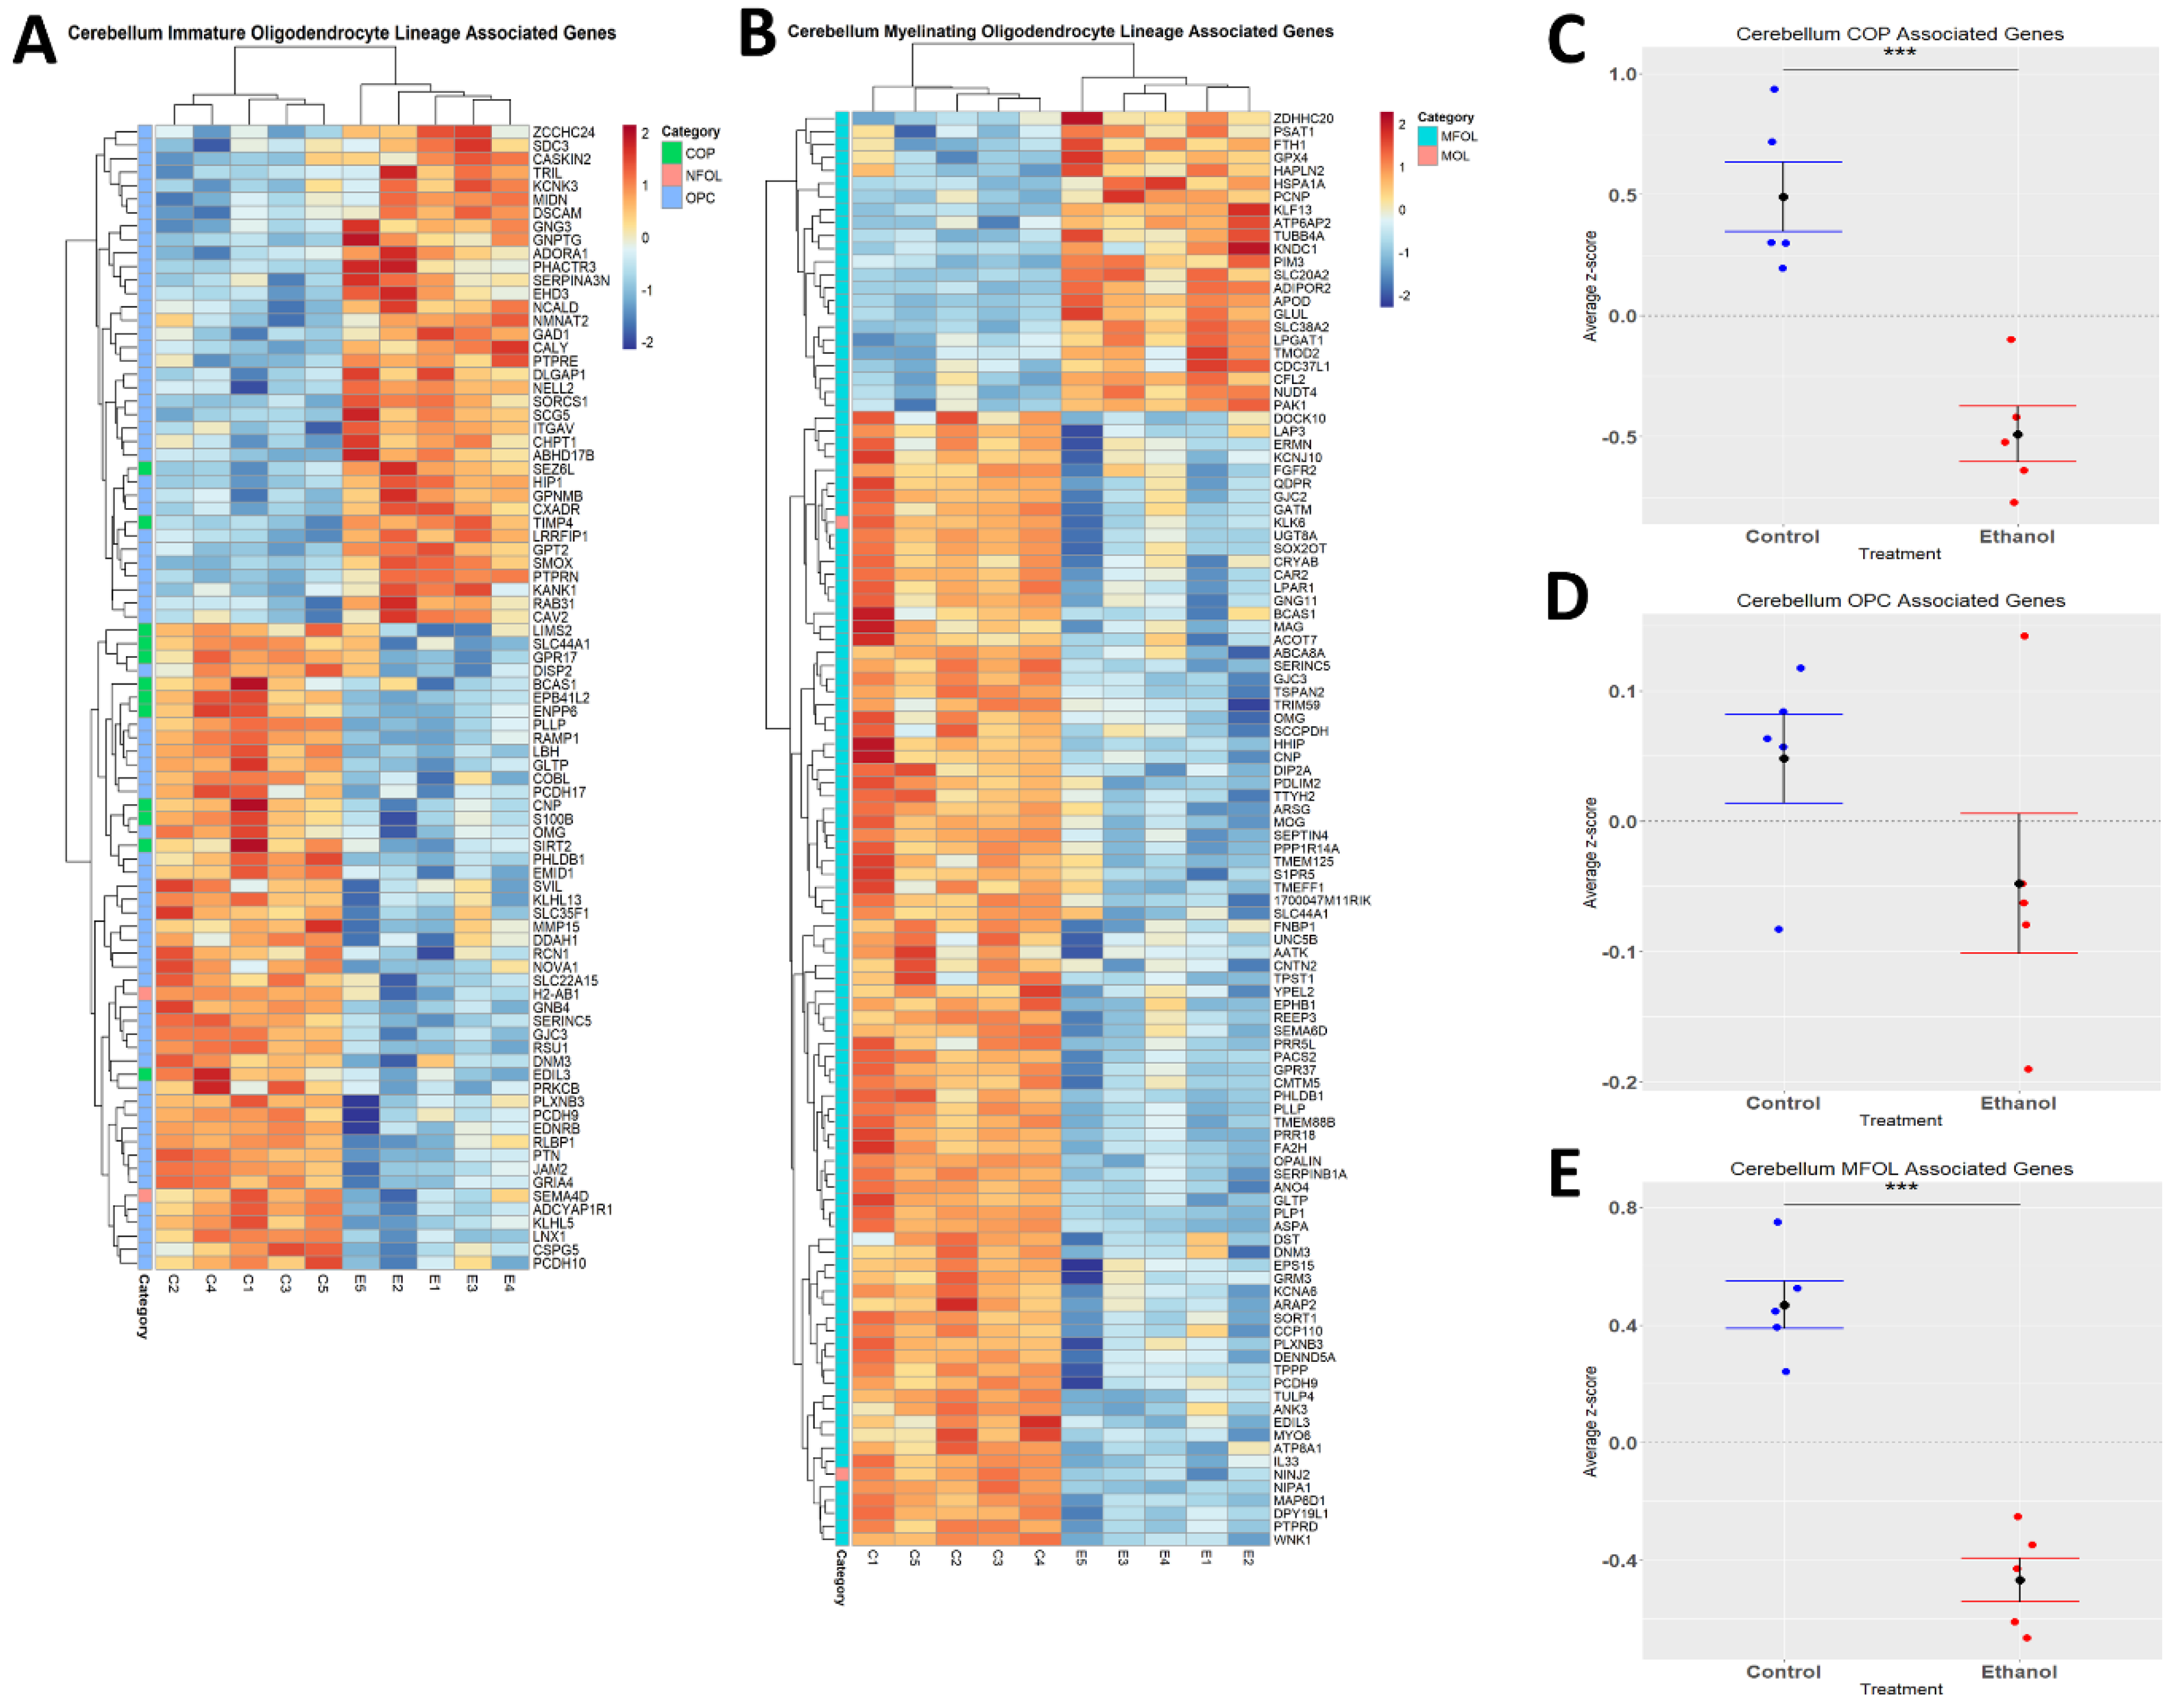
3.5. Oligodendrocyte Lineage Cells Are Depleted upon Chronic plus Binge-like Alcohol Exposure
4. Discussion
5. Conclusions
Supplementary Materials
Author Contributions
Funding
Institutional Review Board Statement
Informed Consent Statement
Data Availability Statement
Acknowledgments
Conflicts of Interest
References
- Sacks, J.J.; Gonzales, K.R.; Bouchery, E.E.; Tomedi, L.E.; Brewer, R.D. 2010 National and State Costs of Excessive Alcohol Consumption. Am. J. Prev. Med. 2015, 49, e73–e79. [Google Scholar] [CrossRef] [PubMed]
- Marshall, E.J. Adolescent alcohol use: Risks and consequences. Alcohol Alcohol. 2014, 49, 160–164. [Google Scholar] [CrossRef]
- Center for Behavioral Health Statistics and Quality. 2016 National Survey on Drug Use and Health: Detailed Tables; Substance Abuse and Mental Health Services Administration: Rockville, MD, USA, 2017. [Google Scholar]
- White, A.; Hingson, R. The burden of alcohol use: Excessive alcohol consumption and related consequences among college students. Alcohol Res. 2013, 35, 201–218. [Google Scholar] [PubMed]
- Grant, B.F.; Stinson, F.S.; Dawson, D.A.; Chou, S.P.; Dufour, M.C.; Compton, W.; Roger, P. Pickering, Kenneth Kaplan. Prevalence and co-occurrence of substance use disorders and independent mood and anxiety disorders: Results from the National Epidemiologic Survey on Alcohol and Related Conditions. Arch. Gen. Psychiatry 2004, 61, 807–816. [Google Scholar] [CrossRef] [PubMed]
- Nehring, S.M.; Freeman, A.M. Alcohol Use Disorder; StatPearls/StatPearls Publishing/StatPearls Publishing LLC.: Treasure Island, FL, USA, 2022. [Google Scholar]
- Hasin, D.S.; Stinson, F.S.; Ogburn, E.; Grant, B.F. Prevalence, correlates, disability, and comorbidity of DSM-IV alcohol abuse and dependence in the United States: Results from the National Epidemiologic Survey on Alcohol and Related Conditions. Arch. Gen. Psychiatry 2007, 64, 830–842. [Google Scholar] [CrossRef]
- Rehm, J. The risks associated with alcohol use and alcoholism. Alcohol Res. Health 2011, 34, 135–143. [Google Scholar] [PubMed]
- SAMHSA, Center for Behavioral Health Statistics and Quality. 2019 National Survey on Drug Use and Health. Table 2.20B—Binge Alcohol Use in Past Month among Persons Aged 12 or Older, by Age Group and Demographic Characteristics: Percentages, 2018 and 2019; Center for Behavioral Health Statistics and Quality: Rockville, MD, USA, 2019. [Google Scholar]
- Alfonso-Loeches, S.; Guerri, C. Molecular and behavioral aspects of the actions of alcohol on the adult and developing brain. Crit. Rev. Clin. Lab. Sci. 2011, 48, 19–47. [Google Scholar] [CrossRef]
- Sullivan, E.V.; Desmond, J.E.; Lim, K.O.; Pfefferbaum, A. Speed and Efficiency but Not Accuracy or Timing Deficits of Limb Movements in Alcoholic Men and Women. Alcohol. Clin. Exp. Res. 2002, 26, 705–713. [Google Scholar] [CrossRef]
- Sullivan, E.V.; Pfefferbaum, A. Neurocircuitry in alcoholism: A substrate of disruption and repair. Psychopharmacology 2005, 180, 583–594. [Google Scholar] [CrossRef]
- Kane, C.J.; Drew, P.D. Inflammatory responses to alcohol in the CNS: Nuclear receptors as potential therapeutics for alcohol-induced neuropathologies. J. Leukoc. Biol. 2016, 100, 951–959. [Google Scholar] [CrossRef] [PubMed]
- Deak, T.; Kelliher, K.T.; Wojcik, H.J.; Gano, A. Prenatal and adolescent alcohol exposure programs immunity across the lifespan: CNS-mediated regulation. Pharmacol. Biochem. Behav. 2022, 216, 173390. [Google Scholar] [CrossRef] [PubMed]
- Alfonso-Loeches, S.; Pascual-Lucas, M.; Blanco, A.M.; Sanchez-Vera, I.; Guerri, C. Pivotal role of TLR4 receptors in alcohol-induced neuroinflammation and brain damage. J. Neurosci. 2010, 30, 8285–8295. [Google Scholar] [CrossRef] [PubMed]
- Crews, F.T.; Qin, L.; Sheedy, D.; Vetreno, R.P.; Zou, J. High mobility group box 1/Toll-like receptor danger signaling increases brain neuroimmune activation in alcohol dependence. Biol. Psychiatry 2013, 73, 602–612. [Google Scholar] [CrossRef]
- Marshall, S.A.; McClain, J.A.; Kelso, M.L.; Hopkins, D.M.; Pauly, J.R.; Nixon, K. Microglial activation is not equivalent to neuroinflammation in alcohol-induced neurodegeneration: The importance of microglia phenotype. Neurobiol. Dis. 2013, 54, 239–251. [Google Scholar] [CrossRef] [PubMed]
- Qin, L.; He, J.; Hanes, R.N.; Pluzarev, O.; Hong, J.S.; Crews, F.T. Increased systemic and brain cytokine production and neuroinflammation by endotoxin following ethanol treatment. J. Neuroinflamm. 2008, 5, 10. [Google Scholar] [CrossRef]
- Kane, C.J.M.; Phelan, K.D.; Douglas, J.C.; Wagoner, G.; Johnson, J.W.; Xu, J.; Phelan, P.S.; Drew, P.D. Effects of Ethanol on Immune Response in the Brain: Region-Specific Changes in Adolescent Versus Adult Mice. Alcohol. Clin. Exp. Res. 2014, 38, 384–391. [Google Scholar] [CrossRef]
- Ki, S.H.; Park, O.; Zheng, M.; Morales-Ibanez, O.; Kolls, J.K.; Bataller, R.; Gao, B. Interleukin-22 treatment ameliorates alcoholic liver injury in a murine model of chronic-binge ethanol feeding: Role of signal transducer and activator of transcription 3. Hepatology 2010, 52, 1291–1300. [Google Scholar] [CrossRef]
- Bertola, A.; Mathews, S.; Ki, S.H.; Wang, H.; Gao, B. Mouse model of chronic and binge ethanol feeding (the NIAAA model). Nat. Protoc. 2013, 8, 627–637. [Google Scholar] [CrossRef] [PubMed]
- Niedzwiedz-Massey, V.M.; Douglas, J.C.; Rafferty, T.; Johnson, J.W.; Holloway, K.N.; Berquist, M.D.; Kane, C.J.; Drew, P.D. Effects of chronic and binge ethanol administration on mouse cerebellar and hippocampal neuroinflammation. Am. J. Drug Alcohol Abus. 2022, 1–14. [Google Scholar] [CrossRef]
- Pinson, M.R.; Holloway, K.N.; Douglas, J.C.; Kane, C.J.M.; Miranda, R.C.; Drew, P.D. Divergent and overlapping hippocampal and cerebellar transcriptome responses following developmental ethanol exposure during the secondary neurogenic period. Alcohol. Clin. Exp. Res. 2021, 45, 1408–1423. [Google Scholar] [CrossRef]
- Liao, Y.; Smyth, G.K.; Shi, W. Feature counts: An efficient general purpose program for assigning sequence reads to genomic features. Bioinformatics 2014, 30, 923–930. [Google Scholar] [CrossRef]
- Robinson, M.D.; Oshlack, A. A scaling normalization method for differential expression analysis of RNA-seq data. Genome Biol. 2010, 11, R25. [Google Scholar] [CrossRef]
- Ritchie, M.E.; Phipson, B.; Wu, D.; Hu, Y.; Law, C.W.; Shi, W.; Smyth, G.K. limma powers differential expression analyses for RNA-sequencing and microarray studies. Nucleic Acids Res. 2015, 43, e47. [Google Scholar] [CrossRef]
- Blighe, K.; Rana, S.; Lewis, M. EnhancedVolcano: Publication-Ready Volcano Plots with Enhanced Colouring and Labeling. 2022. [Google Scholar]
- Jew, B.; Alvarez, M.; Rahmani, E.; Miao, Z.; Ko, A.; Garske, K.M.; Sul, J.H.; Pietiläinen, K.H.; Pajukanta, P.; Halperin, E. Accurate estimation of cell composition in bulk expression through robust integration of single-cell information. Nat. Commun. 2020, 11, 1971. [Google Scholar] [CrossRef] [PubMed]
- Zeisel, A.; Muñoz-Manchado, A.B.; Codeluppi, S.; Lönnerberg, P.; La Manno, G.; Juréus, A.; Marques, S.; Munguba, H.; He, L.; Betsholtz, C.; et al. Brain structure. Cell types in the mouse cortex and hippocampus revealed by single-cell RNA-seq. Science 2015, 347, 1138–1142. [Google Scholar] [CrossRef]
- Artegiani, B.; Lyubimova, A.; Muraro, M.; van Es, J.H.; van Oudenaarden, A.; Clevers, H. A Single-Cell RNA Sequencing Study Reveals Cellular and Molecular Dynamics of the Hippocampal Neurogenic Niche. Cell Rep. 2017, 21, 3271–3284. [Google Scholar] [CrossRef]
- Ochocka, N.; Kaminska, B. Microglia Diversity in Healthy and Diseased Brain: Insights from Single-Cell Omics. Int. J. Mol. Sci. 2021, 22, 3027. [Google Scholar] [CrossRef]
- Jurga, A.M.; Paleczna, M.; Kuter, K.Z. Overview of General and Discriminating Markers of Differential Microglia Phenotypes. Front. Cell. Neurosci. 2020, 14, 198. [Google Scholar] [CrossRef]
- Sousa, C.; Golebiewska, A.; Poovathingal, S.K.; Kaoma, T.; Pires-Afonso, Y.; Martina, S.; Coowar, D.; Azuaje, F.; Skupin, A.; Balling, R.; et al. Single-cell transcriptomics reveals distinct inflammation-induced microglia signatures. EMBO Rep. 2018, 19, e46171. [Google Scholar] [CrossRef] [PubMed]
- Keren-Shaul, H.; Spinrad, A.; Weiner, A.; Matcovitch-Natan, O.; Dvir-Szternfeld, R.; Ulland, T.K.; David, E.; Baruch, K.; Lara-Astaiso, D.; Toth, B.; et al. A Unique Microglia Type Associated with Restricting Development of Alzheimer’s Disease. Cell 2017, 169, 1276–1290.e17. [Google Scholar] [CrossRef] [PubMed]
- Krasemann, S.; Madore, C.; Cialic, R.; Baufeld, C.; Calcagno, N.; El Fatimy, R.; Beckers, L.; O’Loughlin, E.; Xu, Y.; Fanek, Z.; et al. The TREM2-APOE Pathway Drives the Transcriptional Phenotype of Dysfunctional Microglia in Neurodegenerative Diseases. Immunity 2017, 47, 566–581.e9. [Google Scholar] [CrossRef]
- Matsudaira, T.; Prinz, M. Life and death of microglia: Mechanisms governing microglial states and fates. Immunol. Lett. 2022, 245, 51–60. [Google Scholar] [CrossRef] [PubMed]
- Butovsky, O.; Weiner, H.L. Microglial signatures and their role in health and disease. Nat. Rev. Neurosci. 2018, 19, 622–635. [Google Scholar] [CrossRef] [PubMed]
- Das, S.; Li, Z.; Noori, A.; Hyman, B.T.; Serrano-Pozo, A. Meta-analysis of mouse transcriptomic studies supports a context-dependent astrocyte reaction in acute CNS injury versus neurodegeneration. J. Neuroinflamm. 2020, 17, 227. [Google Scholar] [CrossRef] [PubMed]
- Zeisel, A.; Hochgerner, H.; Lönnerberg, P.; Johnsson, A.; Memic, F.; van der Zwan, J.; Häring, M.; Braun, E.; Borm, L.E.; La Manno, G.; et al. Molecular Architecture of the Mouse Nervous System. Cell 2018, 174, 999–1014.e22. [Google Scholar] [CrossRef] [PubMed]
- McClain, J.A.; Morris, S.A.; Deeny, M.A.; Marshall, S.A.; Hayes, D.M.; Kiser, Z.M.; Nixon, K. Adolescent binge alcohol exposure induces long-lasting partial activation of microglia. Brain Behav. Immun. 2011, 25, S120–S128. [Google Scholar] [CrossRef]
- He, J.; Crews, F.T. Increased MCP-1 and microglia in various regions of the human alcoholic brain. Exp. Neurol. 2008, 210, 349–358. [Google Scholar] [CrossRef]
- Sofroniew, M.V.; Vinters, H.V. Astrocytes: Biology and pathology. Acta Neuropathol. 2010, 119, 7–35. [Google Scholar] [CrossRef]
- Verkhratsky, A.; Nedergaard, M. Physiology of Astroglia. Physiol. Rev. 2018, 98, 239–389. [Google Scholar] [CrossRef] [PubMed]
- Magistretti, P.J.; Allaman, I. Lactate in the brain: From metabolic end-product to signalling molecule. Nat. Rev. Neurosci. 2018, 19, 235–249. [Google Scholar] [CrossRef]
- Nicola, J.; Allen, C.E. Cell Biology of Astrocyte-Synapse Interactions. Neuron 2017, 96, 697–708. [Google Scholar]
- Khakh, B.S. Astrocyte–Neuron Interactions in the Striatum: Insights on Identity, Form, and Function. Trends Neurosci. 2019, 42, 617–630. [Google Scholar] [CrossRef] [PubMed]
- Dong, Y.; Benveniste, E.N. Immune function of astrocytes. Glia 2001, 36, 180–190. [Google Scholar] [CrossRef]
- Sofroniew, M.V. Astrocyte barriers to neurotoxic inflammation. Nat. Rev. Neurosci. 2015, 16, 249–263. [Google Scholar] [CrossRef]
- Vallés, S.L.; Blanco, A.M.; Pascual, M.; Guerri, C. Chronic ethanol treatment enhances inflammatory mediators and cell death in the brain and in astrocytes. Brain Pathol. 2004, 14, 365–371. [Google Scholar] [CrossRef]
- Blanco, A.M.; Pascual, M.; Valles, S.L.; Guerri, C. Ethanol-induced iNOS and COX-2 expression in cultured astrocytes via NF-κB. NeuroReport 2004, 15, 681–685. [Google Scholar] [CrossRef] [PubMed]
- Alfonso-Loeches, S.; Pascual, M.; Gómez-Pinedo, U.; Pascual-Lucas, M.; Renau-Piqueras, J.; Guerri, C. Toll-like receptor 4 participates in the myelin disruptions associated with chronic alcohol abuse. Glia 2012, 60, 948–964. [Google Scholar] [CrossRef]
- Vargas, W.M.; Bengston, L.; Gilpin, N.W.; Whitcomb, B.W.; Richardson, H.N. Alcohol Binge Drinking during Adolescence or Dependence during Adulthood Reduces Prefrontal Myelin in Male Rats. J. Neurosci. 2014, 34, 14777–14782. [Google Scholar] [CrossRef]
- Zahr, N.M.; Luong, R.; Sullivan, E.V.; Pfefferbaum, A. Measurement of serum, liver, and brain cytokine induction, thiamine levels, and hepatopathology in rats exposed to a 4-day alcohol binge protocol. Alcohol. Clin. Exp. Res. 2010, 34, 1858–1870. [Google Scholar] [CrossRef] [PubMed]
- Pascual, M.; Baliño, P.; Alfonso-Loeches, S.; Aragón, C.M.; Guerri, C. Impact of TLR4 on behavioral and cognitive dysfunctions associated with alcohol-induced neuroinflammatory damage. Brain Behav Immun. 2011, 25 (Suppl. 1), S80–S91. [Google Scholar] [CrossRef] [PubMed]
- Pascual, M.; Baliño, P.; Aragón, C.M.; Guerri, C. Cytokines and chemokines as biomarkers of ethanol-induced neuroinflammation and anxiety-related behavior: Role of TLR4 and TLR2. Neuropharmacology 2015, 89, 352–359. [Google Scholar] [CrossRef] [PubMed]
- Ruffle, J.K. Molecular neurobiology of addiction: What’s all the (Δ)FosB about? Am. J. Drug Alcohol Abus. 2014, 40, 428–437. [Google Scholar] [CrossRef] [PubMed]
- Wille-Bille, A.; de Olmos, S.; Marengo, L.; Chiner, F.; Pautassi, R.M. Long-term ethanol self-administration induces ΔFosB in male and female adolescent, but not in adult, Wistar rats. Prog. Neuro-Psychopharmacol. Biol. Psychiatry 2017, 74, 15–30. [Google Scholar] [CrossRef]
- Wille-Bille, A.; Marengo, L.; Godino, A.; Pautassi, R.M. Effects of escalating versus fixed ethanol exposure on ∆FosB expression in the mesocorticolimbic pathway in adolescent and adult rats. Am. J. Drug Alcohol Abus. 2021, 47, 569–580. [Google Scholar] [CrossRef] [PubMed]
- Montesinos, J.; Pascual, M.; Rodríguez-Arias, M.; Miñarro, J.; Guerri, C. Involvement of TLR4 in the long-term epigenetic changes, rewarding and anxiety effects induced by intermittent ethanol treatment in adolescence. Brain Behav. Immun. 2016, 53, 159–171. [Google Scholar] [CrossRef] [PubMed]
- Nomaru, H.; Sakumi, K.; Katogi, A.; Ohnishi, Y.N.; Kajitani, K.; Tsuchimoto, D.; Nestler, E.J.; Nakabeppu, Y. Fosb gene products contribute to excitotoxic microglial activation by regulating the expression of complement C5a receptors in microglia. Glia 2014, 62, 1284–1298. [Google Scholar] [CrossRef] [PubMed]
- Shen, H.; French, B.A.; Liu, H.; Tillman, B.C.; French, S.W. Increased activity of the complement system in the liver of patients with alcoholic hepatitis. Exp. Mol. Pathol. 2014, 97, 338–344. [Google Scholar] [CrossRef]
- McCullough, R.L.; McMullen, M.R.; Das, D.; Roychowdhury, S.; Strainic, M.G.; Medof, M.E.; Nagy, L.E. Differential contribution of complement receptor C5aR in myeloid and non-myeloid cells in chronic ethanol-induced liver injury in mice. Mol. Immunol. 2016, 75, 122–132. [Google Scholar] [CrossRef]
- McCullough, R.L.; McMullen, M.R.; Poulsen, K.L.; Kim, A.; Medof, M.E.; Nagy, L.E. Anaphylatoxin Receptors C3aR and C5aR1 Are Important Factors That Influence the Impact of Ethanol on the Adipose Secretome. Front. Immunol. 2018, 9, 2133. [Google Scholar] [CrossRef]
- Kalinin, S.; González-Prieto, M.; Scheiblich, H.; Lisi, L.; Kusumo, H.; Heneka, M.T.; Madrigal, J.L.M.; Pandey, S.C.; Feinstein, D.L. Transcriptome analysis of alcohol-treated microglia reveals downregulation of beta amyloid phagocytosis. J. Neuroinflamm. 2018, 15, 141. [Google Scholar] [CrossRef]
- Kane, C.J.M.; Douglas, J.C.; Rafferty, T.; Johnson, J.W.; Niedzwiedz-Massey, V.M.; Phelan, K.D.; Majewska, A.K.; Drew, P.D. Ethanol modulation of cerebellar neuroinflammation in a postnatal mouse model of fetal alcohol spectrum disorders. J. Neurosci. Res. 2021, 99, 1986–2007. [Google Scholar] [CrossRef]
- Drew, P.D.; Johnson, J.W.; Douglas, J.C.; Phelan, K.D.; Kane, C.J.M. Pioglitazone Blocks Ethanol Induction of Microglial Activation and Immune Responses in the Hippocampus, Cerebellum, and Cerebral Cortex in a Mouse Model of Fetal Alcohol Spectrum Disorders. Alcohol. Clin. Exp. Res. 2015, 39, 445–454. [Google Scholar] [CrossRef]
- Tang, Y.; Le, W. Differential Roles of M1 and M2 Microglia in Neurodegenerative Diseases. Mol. Neurobiol. 2016, 53, 1181–1194. [Google Scholar] [CrossRef] [PubMed]
- Franco, R.; Fernández-Suárez, D. Alternatively activated microglia and macrophages in the central nervous system. Prog. Neurobiol. 2015, 131, 65–86. [Google Scholar] [CrossRef] [PubMed]
- Paolicelli, R.C.; Sierra, A.; Stevens, B.; Tremblay, M.-E.; Aguzzi, A.; Ajami, B.; Amit, I.; Audinat, E.; Bechmann, I.; Bennett, M.; et al. Microglia states and nomenclature: A field at its crossroads. Neuron 2022, 110, 3458–3483. [Google Scholar] [CrossRef]
- Moore, C.S.; Ase, A.R.; Kinsara, A.; Rao, V.T.; Michell-Robinson, M.; Leong, S.Y.; Butovsky, O.; Ludwin, S.K.; Séguéla, P.; Bar-Or, A.; et al. P2Y12 expression and function in alternatively activated human microglia. Neurol.-Neuroimmunol. Neuroinflamm. 2015, 2, e80. [Google Scholar] [CrossRef] [PubMed]
- Holtman, I.R.; Raj, D.D.; Miller, J.A.; Schaafsma, W.; Yin, Z.; Brouwer, N.; Wes, P.D.; Möller, T.; Orre, M.; Kamphuis, W.; et al. Induction of a common microglia gene expression signature by aging and neurodegenerative conditions: A co-expression meta-analysis. Acta Neuropathol. Commun. 2015, 3, 31. [Google Scholar] [CrossRef]
- Naj, A.C.; Jun, G.; Reitz, C.; Kunkle, B.W.; Perry, W.; Park, Y.S.; Beecham, G.W.; Rajbhandary, R.A.; Hamilton-Nelson, K.L.; Wang, L.-S.; et al. Effects of multiple genetic loci on age at onset in late-onset Alzheimer disease: A genome-wide association study. JAMA Neurol. 2014, 71, 1394–1404. [Google Scholar] [CrossRef]
- Hickman, S.E.; Kingery, N.D.; Ohsumi, T.K.; Borowsky, M.L.; Wang, L.-C.; Means, T.K.; El Khoury, J. The microglial sensome revealed by direct RNA sequencing. Nat. Neurosci. 2013, 16, 1896–1905. [Google Scholar] [CrossRef]
- Ransohoff, R.M.; Brown, M.A. Innate immunity in the central nervous system. J. Clin. Investig. 2012, 122, 1164–1171. [Google Scholar] [CrossRef]
- Zamanian, J.L.; Xu, L.; Foo, L.C.; Nouri, N.; Zhou, L.; Giffard, R.G.; Barres, B.A. Genomic Analysis of Reactive Astrogliosis. J. Neurosci. 2012, 32, 6391–6410. [Google Scholar] [CrossRef] [PubMed]
- Liddelow, S.A.; Guttenplan, K.A.; Clarke, L.E.; Bennett, F.C.; Bohlen, C.J.; Schirmer, L.; Bennett, M.L.; Münch, A.E.; Chung, W.-S.; Peterson, T.C.; et al. Neurotoxic reactive astrocytes are induced by activated microglia. Nature 2017, 541, 481–487. [Google Scholar] [CrossRef]
- Blanco, A.M.; Vallés, S.L.; Pascual, M.; Guerri, C. Involvement of TLR4/type I IL-1 receptor signaling in the induction of inflammatory mediators and cell death induced by ethanol in cultured astrocytes. J. Immunol. 2005, 175, 6893–6899. [Google Scholar] [CrossRef]
- Floreani, N.A.; Rump, T.J.; Muneer, P.M.A.; Alikunju, S.; Morsey, B.M.; Brodie, M.R.; Persidsky, Y.; Haorah, J. Alcohol-induced interactive phosphorylation of Src and toll-like receptor regulates the secretion of inflammatory mediators by human astrocytes. J. Neuroimmune Pharmacol. 2010, 5, 533–545. [Google Scholar] [CrossRef]
- Alfonso-Loeches, S.; Ureña-Peralta, J.R.; Morillo-Bargues, M.J.; Oliver-De La Cruz, J.; Guerri, C. Role of mitochondria ROS generation in ethanol-induced NLRP3 inflammasome activation and cell death in astroglial cells. Front. Cell. Neurosci. 2014, 8, 216. [Google Scholar] [CrossRef] [PubMed]
- Baumann, N.; Pham-Dinh, D. Biology of Oligodendrocyte and Myelin in the Mammalian Central Nervous System. Physiol. Rev. 2001, 81, 871–927. [Google Scholar] [CrossRef]
- El Waly, B.; Macchi, M.; Cayre, M.; Durbec, P. Oligodendrogenesis in the normal and pathological central nervous system. Front. Neurosci. 2014, 8, 145. [Google Scholar] [CrossRef]
- Wozniak, J.R.; Riley, E.P.; Charness, M.E. Clinical presentation, diagnosis, and management of fetal alcohol spectrum disorder. Lancet Neurol. 2019, 18, 760–770. [Google Scholar] [CrossRef] [PubMed]
- Harper, C. The neuropathology of alcohol-related brain damage. Alcohol Alcohol. 2009, 44, 136–140. [Google Scholar] [CrossRef]
- Monnig, M.A.; Yeo, R.A.; Tonigan, J.S.; McCrady, B.S.; Thoma, R.J.; Sabbineni, A.; Hutchison, K.E. Associations of White Matter Microstructure with Clinical and Demographic Characteristics in Heavy Drinkers. PLoS ONE 2015, 10, e0142042. [Google Scholar] [CrossRef] [PubMed]
- Back, S.A.; Gan, X.; Li, Y.; Rosenberg, P.A.; Volpe, J.J. Maturation-Dependent Vulnerability of Oligodendrocytes to Oxidative Stress-Induced Death Caused by Glutathione Depletion. J. Neurosci. 1998, 18, 6241–6253. [Google Scholar] [CrossRef] [PubMed]
- Rice, J.; Gu, C. Function and Mechanism of Myelin Regulation in Alcohol Abuse and Alcoholism. BioEssays 2019, 41, 1800255. [Google Scholar] [CrossRef] [PubMed]
- Luo, J.; Miller, M.W. Growth factor-mediated neural proliferation: Target of ethanol toxicity. Brain Res. Rev. 1998, 27, 157–167. [Google Scholar] [CrossRef] [PubMed]
- Edgar, R.; Domrachev, M.; Lash, A.E. Gene Expression Omnibus: NCBI gene expression and hybridization array data repository. Nucleic Acids Res. 2002, 30, 207–210. [Google Scholar] [CrossRef] [PubMed]


| Symbol | LogFC | Adj. p | Symbol | LogFC | Adj. p | Symbol | LogFC | Adj. p | Symbol | LogFC | Adj. p | Symbol | LogFC | Adj. p |
|---|---|---|---|---|---|---|---|---|---|---|---|---|---|---|
| FOSB | 2.81 | 0.0081 | IFRD1 | 0.65 | 0.0001 | SLC25A5 | 0.27 | 0.0010 | CMTM6 | −0.21 | 0.0438 | PIK3CD | −0.50 | 0.0057 |
| GPX3 | 2.68 | 1.77 × 10⁻⁹ | ZFP36 | 0.62 | 0.0027 | CCNL1 | 0.27 | 0.0035 | MKNK1 | −0.22 | 0.0422 | CTSS | −0.51 | 0.0005 |
| CCL2 | 2.44 | 0.0015 | KLF4 | 0.60 | 0.0238 | FTL1 | 0.26 | 0.0021 | EDEM2 | −0.23 | 0.0235 | PLD4 | −0.52 | 0.0208 |
| CDKN1A | 2.31 | 0.0007 | ANXA3 | 0.58 | 0.0021 | TMSB4X | 0.26 | 0.0037 | DOCK10 | −0.23 | 0.0350 | KCTD12 | −0.53 | 1.79 × 10⁻⁵ |
| FCNA | 2.06 | 0.0028 | ARHGDIB | 0.54 | 0.0103 | PTBP1 | 0.23 | 0.0289 | RGS3 | −0.23 | 0.0465 | IFI203 | −0.54 | 0.0313 |
| MAFF | 1.94 | 0.0002 | IER3 | 0.50 | 0.0012 | MYLIP | 0.23 | 0.0321 | TLN2 | −0.24 | 0.0188 | COL27A1 | −0.54 | 0.0433 |
| CCL7 | 1.81 | 0.0025 | IER2 | 0.50 | 0.0318 | BRD2 | 0.23 | 0.0038 | SLC38A6 | −0.24 | 0.0467 | HPGDS | −0.60 | 0.0100 |
| C5AR1 | 1.53 | 0.0044 | PROS1 | 0.48 | 0.0116 | KLF6 | 0.23 | 0.0368 | PLXDC2 | −0.24 | 0.0134 | UNC93B1 | −0.60 | 0.0014 |
| GM3002 | 1.40 | 0.0405 | ICAM1 | 0.46 | 0.0449 | MCL1 | 0.21 | 0.0160 | RGL2 | −0.25 | 0.0089 | TREM2 | −0.62 | 0.0170 |
| MSR1 | 1.34 | 0.0221 | CFH | 0.45 | 0.0092 | PCF11 | 0.21 | 0.0071 | PPCDC | −0.25 | 0.0401 | ITGAM | −0.65 | 0.0010 |
| EVI2B | 1.25 | 0.0051 | LAIR1 | 0.45 | 0.0055 | CLTC | 0.21 | 0.0070 | SLC29A3 | −0.25 | 0.0314 | CCR5 | −0.67 | 0.0274 |
| LYVE1 | 1.22 | 0.0164 | DUSP6 | 0.44 | 0.0070 | CYFIP1 | 0.20 | 0.0136 | ZFP90 | −0.25 | 0.0257 | SELPLG | −0.67 | 0.0003 |
| UCP2 | 1.20 | 0.0088 | REL | 0.44 | 0.0343 | ZCCHC2 | 0.20 | 0.0245 | SLCO2B1 | −0.28 | 0.0484 | DSN1 | −0.68 | 0.0116 |
| CSRNP1 | 1.10 | 8.39 × 10⁻⁶ | RGS2 | 0.43 | 0.0281 | FMNL1 | 0.19 | 0.0425 | CAMK1 | −0.28 | 0.0040 | IRF7 | −0.70 | 0.0273 |
| APOC1 | 1.05 | 0.0009 | TSPO | 0.42 | 0.0433 | SERINC3 | 0.19 | 0.0467 | GPR155 | −0.28 | 0.0130 | APOBEC1 | −0.70 | 0.0296 |
| SPP1 | 1.05 | 0.0315 | ZFP36L2 | 0.41 | 0.0021 | IL16 | 0.18 | 0.0149 | TLR3 | −0.30 | 0.0436 | HK2 | −0.77 | 0.0023 |
| MERTK | 1.00 | 0.0348 | CD300A | 0.41 | 0.0117 | ARPC2 | 0.17 | 0.0203 | AKR1B10 | −0.30 | 0.0100 | IFI27L2A | −0.77 | 0.0403 |
| F13A1 | 0.98 | 0.0109 | SAT1 | 0.41 | 0.0007 | PCNA | 0.17 | 0.0350 | UBC | −0.31 | 0.0056 | FGD2 | −0.83 | 0.0048 |
| SERPINB8 | 0.97 | 0.0282 | 1700017B05RIK | 0.40 | 0.0163 | UBE2J1 | 0.17 | 0.0384 | AGO4 | −0.32 | 0.0367 | LY86 | −0.84 | 0.0002 |
| KLF10 | 0.95 | 0.0022 | COTL1 | 0.39 | 0.0018 | ELMO1 | 0.16 | 0.0220 | APH1C | −0.35 | 0.0282 | FCRLS | −0.85 | 0.0032 |
| ATF3 | 0.94 | 0.0077 | ATF4 | 0.39 | 0.0003 | SEMA4D | −0.16 | 0.0484 | EPB41L2 | −0.35 | 0.0016 | HPGD | −0.87 | 0.0004 |
| HSPA1A | 0.92 | 0.0054 | SRGN | 0.37 | 0.0237 | ASAH1 | −0.17 | 0.0333 | LPCAT2 | −0.35 | 0.0344 | KLHL6 | −0.95 | 0.0173 |
| ARHGAP27 | 0.83 | 0.0001 | ISYNA1 | 0.35 | 0.0247 | B2M | −0.17 | 0.0416 | ARHGAP11A | −0.37 | 0.0465 | SIGLECH | −0.98 | 0.0005 |
| SOCS3 | 0.81 | 0.0258 | H3F3B | 0.33 | 0.0072 | LY6E | −0.19 | 0.0276 | HEXB | −0.38 | 0.0003 | OAS2 | −0.98 | 0.0095 |
| GPNMB | 0.79 | 0.0039 | PPP1R15A | 0.31 | 0.0263 | TPP1 | −0.19 | 0.0097 | CSF1R | −0.42 | 0.0020 | P2RY12 | −1.10 | 0.0001 |
| PHYHD1 | 0.78 | 1.08 × 10⁻⁵ | ARL4C | 0.30 | 0.0029 | SGPL1 | −0.20 | 0.0388 | MPEG1 | −0.42 | 0.0088 | CD74 | −1.18 | 0.0001 |
| CD68 | 0.73 | 0.0096 | CCDC9 | 0.29 | 0.0047 | IL6ST | −0.20 | 0.0219 | GPR34 | −0.43 | 0.0433 | H2-AA | −1.55 | 0.0029 |
| EGR1 | 0.72 | 0.0028 | HERPUD1 | 0.28 | 0.0076 | PMP22 | −0.20 | 0.0479 | CRYL1 | −0.44 | 0.0130 | |||
| SPARC | 0.71 | 2.21 × 10⁻⁸ | SKI | 0.28 | 0.0104 | RRBP1 | −0.20 | 0.0274 | SALL1 | −0.45 | 0.0173 | |||
| C3AR1 | 0.69 | 0.0154 | SERPINF1 | 0.28 | 0.0375 | AXL | −0.21 | 0.0334 | RENBP | −0.46 | 0.0219 | |||
| SH2B2 | 0.68 | 0.0052 | PTPRJ | 0.27 | 0.0060 | COMMD8 | −0.21 | 0.0440 | P2RY13 | −0.48 | 0.0356 | |||
| Homeostatic | LogFC | Adj. p | Neurodegenerative | LogFC | Adj. p |
|---|---|---|---|---|---|
| MERTK | 1.00 | 0.0348 | GPX3 | 2.68 | 1.77 × 10⁻⁹ |
| EGR1 | 0.72 | 0.0028 | CCL2 | 2.44 | 0.0015 |
| SLCO2B1 | −0.28 | 0.0484 | MSR1 | 1.34 | 0.0221 |
| HEXB | −0.38 | 0.0003 | SPP1 | 1.05 | 0.0315 |
| CSF1R | −0.42 | 0.0020 | GPNMB | 0.79 | 0.0039 |
| GPR34 | −0.43 | 0.0433 | CD68 | 0.73 | 0.0096 |
| SALL1 | −0.45 | 0.0173 | LAIR1 | 0.45 | 0.0055 |
| P2RY13 | −0.48 | 0.0356 | TREM2 | −0.62 | 0.0170 |
| KCTD12 | −0.53 | 1.79 × 10⁻⁵ | |||
| Hpgds | −0.60 | 0.0100 | |||
| CCR5 | −0.67 | 0.0274 | |||
| FGD2 | −0.83 | 0.0048 | |||
| FCRLS | −0.85 | 0.0032 | |||
| Siglech | −0.98 | 0.0005 | |||
| P2RY12 | −1.10 | 0.0001 |
| Acute Injury | LogFC | Adj. p | Pan Astrocytic | LogFC | Adj. p | Chronic Neurodegenerative Diseases | LogFC | Adj. p | |
|---|---|---|---|---|---|---|---|---|---|
| RCAN2 | 0.40 | 0.0091 | UCP2 | 1.20 | 0.0088 | S1PR1 | −0.33 | 0.0006 | |
| Lrrc58 | 0.31 | 0.0036 | ATF3 | 0.94 | 0.0077 | ARSK | −0.33 | 0.0089 | |
| ARL4C | 0.30 | 0.0029 | GPNMB | 0.79 | 0.0039 | COBL | −0.47 | 0.0172 | |
| PRELP | 0.27 | 0.0368 | LGALS3 | 0.67 | 0.0282 | ||||
| YWHAZ | 0.26 | 0.0014 | ARHGDIB | 0.54 | 0.0103 | ||||
| DNTTIP2 | 0.24 | 0.0244 | RHOJ | 0.46 | 0.0117 | ||||
| CDC42SE1 | 0.23 | 0.0082 | PARP3 | 0.45 | 0.0065 | ||||
| HINT1 | 0.22 | 0.0040 | TIMP3 | 0.38 | 0.0216 | ||||
| CARS | 0.22 | 0.0079 | AHNAK | 0.33 | 0.0173 | ||||
| IARS | 0.21 | 0.0097 | PPARGC1A | 0.26 | 0.0276 | ||||
| ARNTL | 0.19 | 0.0240 | ELOVL2 | 0.25 | 0.0113 | ||||
| LRRC41 | 0.19 | 0.0461 | MCL1 | 0.21 | 0.0160 | ||||
| SSBP3 | 0.19 | 0.0202 | AHCYL1 | 0.16 | 0.0148 | ||||
| BRCC3 | 0.19 | 0.0288 | B2M | −0.17 | 0.0416 | ||||
| LRRC59 | 0.18 | 0.0391 | DST | −0.21 | 0.0280 | ||||
| UBE2F | 0.18 | 0.0219 | SQLE | −0.27 | 0.0246 | ||||
| FARSB | 0.16 | 0.0366 | APLN | −0.28 | 0.0433 | ||||
| CNBP | 0.14 | 0.0482 | PTPRD | −0.33 | 0.0006 | ||||
| SGPL1 | −0.20 | 0.0388 | FLOT1 | −0.33 | 0.0116 | ||||
| AXL | −0.21 | 0.0334 | NSDHL | −0.35 | 0.0137 | ||||
| LAP3 | −0.21 | 0.0321 | HMGCS1 | −0.43 | 0.0002 | ||||
| SGCB | −0.21 | 0.0213 | CTSS | −0.51 | 0.0005 | ||||
| RNF141 | −0.27 | 0.0039 | VIM | −0.51 | 1.91 × 10⁻⁵ | ||||
| SYNE1 | −0.30 | 0.0102 | IDI1 | −0.55 | 0.0009 | ||||
| POLD4 | −0.34 | 0.0375 | IFIT3 | −0.75 | 0.0360 | ||||
| PLIN2 | −0.38 | 0.0084 | |||||||
| IL33 | −0.91 | 0.0001 | |||||||
| IGSF1 | −0.92 | 0.0057 | |||||||
| OPC | LogFC | Adj. p | OPC | LogFC | Adj. p | OPC | LogFC | Adj. p | OPC | LogFC | Adj. p | |||||||
|---|---|---|---|---|---|---|---|---|---|---|---|---|---|---|---|---|---|---|
| PTPRN | 1.03 | 0.0011 | GNG3 | 0.27 | 0.0053 | PRKCB | −0.17 | 0.0390 | LNX1 | −0.37 | 0.0017 | |||||||
| SERPINA3N | 0.98 | 0.0120 | DSCAM | 0.27 | 0.0173 | DNM3 | −0.18 | 0.0334 | RSU1 | −0.40 | 0.0007 | |||||||
| SMOX | 0.90 | 0.0001 | NMNAT2 | 0.26 | 0.0130 | DISP2 | −0.18 | 0.0349 | JAM2 | −0.41 | 0.0006 | |||||||
| GPNMB | 0.79 | 0.0039 | CXADR | 0.25 | 0.0102 | DDAH1 | −0.20 | 0.0476 | PHLDB1 | −0.42 | 0.0004 | |||||||
| SORCS1 | 0.60 | 0.0003 | ABHD17B | 0.25 | 0.0113 | PCDH9 | −0.22 | 0.0174 | LBH | −0.44 | 0.0002 | |||||||
| MIDN | 0.42 | 0.0088 | SCG5 | 0.25 | 0.0033 | PCDH10 | −0.23 | 0.0301 | RAMP1 | −0.45 | 0.0003 | |||||||
| TRIL | 0.39 | 0.0116 | CHPT1 | 0.24 | 0.0110 | OMG | −0.23 | 0.0191 | EDNRB | −0.47 | 0.0027 | |||||||
| HIP1 | 0.35 | 0.0003 | PHACTR3 | 0.24 | 0.0278 | SLC35F1 | −0.24 | 0.0275 | COBL | −0.47 | 0.0172 | |||||||
| KANK1 | 0.33 | 0.0160 | EHD3 | 0.23 | 0.0139 | SLC22A15 | −0.24 | 0.0188 | GLTP | −0.48 | 0.0006 | |||||||
| ITGAV | 0.33 | 0.0034 | DLGAP1 | 0.20 | 0.0124 | PCDH17 | −0.25 | 0.0235 | GJC3 | −0.48 | 0.0001 | |||||||
| CALY | 0.32 | 0.0021 | ADORA1 | 0.20 | 0.0151 | ADCYAP1R1 | −0.25 | 0.0029 | PTN | −0.52 | 0.0002 | |||||||
| GPT2 | 0.31 | 0.0014 | ZCCHC24 | 0.20 | 0.0245 | SVIL | −0.26 | 0.0391 | PLXNB3 | −0.52 | 0.0105 | |||||||
| CASKIN2 | 0.31 | 0.0163 | PTPRE | 0.20 | 0.0168 | KLHL5 | −0.27 | 0.0075 | MMP15 | −0.56 | 0.0239 | |||||||
| KCNK3 | 0.30 | 0.0130 | RAB31 | 0.19 | 0.0231 | GRIA4 | −0.29 | 0.0018 | RCN1 | −0.65 | 0.0103 | |||||||
| NCALD | 0.30 | 0.0041 | NELL2 | 0.19 | 0.0125 | SERINC5 | −0.30 | 0.0016 | RLBP1 | −0.78 | 0.0021 | |||||||
| LRRFIP1 | 0.29 | 0.0024 | GNPTG | 0.18 | 0.0202 | KLHL13 | −0.31 | 0.0113 | EMID1 | −0.84 | 0.0013 | |||||||
| CAV2 | 0.28 | 0.0473 | GAD1 | 0.15 | 0.0246 | CSPG5 | −0.34 | 0.0086 | PLLP | −1.11 | 0.0001 | |||||||
| SDC3 | 0.28 | 0.0411 | NOVA1 | −0.16 | 0.0402 | GNB4 | −0.35 | 0.0008 | ||||||||||
| COP | LogFC | Adj. p | NFOL | LogFC | Adj. p | |||||||||||||
| TIMP4 | 0.42 | 0.0001 | H2-AB1 | −1.38 | 0.0007 | |||||||||||||
| SEZ6L | 0.40 | 0.0005 | SEMA4D | −0.16 | 0.0484 | |||||||||||||
| SIRT2 | −0.16 | 0.0479 | ||||||||||||||||
| SLC44A1 | −0.18 | 0.0460 | ||||||||||||||||
| EDIL3 | −0.20 | 0.0247 | ||||||||||||||||
| S100B | −0.24 | 0.0080 | ||||||||||||||||
| BCAS1 | −0.28 | 0.0412 | ||||||||||||||||
| CNP | −0.30 | 0.0066 | ||||||||||||||||
| GPR17 | −0.33 | 0.0116 | ||||||||||||||||
| EPB41L2 | −0.35 | 0.0016 | ||||||||||||||||
| LIMS2 | −0.38 | 0.0468 | ||||||||||||||||
| ENPP6 | −0.53 | 0.0036 | ||||||||||||||||
| MFOL | LogFC | Adj. p | MFOL | LogFC | Adj. p | MFOL | LogFC | Adj. p | MFOL | LogFC | Adj. p | MOL | LogFC | Adj. p | ||||
| APOD | 1.66 | 0.0001 | LAP3 | −0.21 | 0.0321 | SEPTIN4 | −0.35 | 0.0005 | UGT8A | −1.16 | 0.0020 | NINJ2 | −1.88 | 0.0005 | ||||
| HSPA1A | 0.92 | 0.0054 | ATP8A1 | −0.21 | 0.0091 | ERMN | −0.37 | 0.0346 | SERPINB1A | −1.28 | 3.22 × 10⁻⁵ | KLK6 | −1.04 | 0.0016 | ||||
| ADIPOR2 | 0.90 | 0.0018 | SCCPDH | −0.21 | 0.0377 | MAG | −0.39 | 0.0346 | OPALIN | −2.33 | 6.07 × 10⁻⁷ | |||||||
| GLUL | 0.79 | 0.0010 | FGFR2 | −0.21 | 0.0362 | QDPR | −0.41 | 0.0029 | ||||||||||
| PIM3 | 0.64 | 0.0005 | FNBP1 | −0.21 | 0.0116 | PHLDB1 | −0.42 | 0.0004 | ||||||||||
| KLF13 | 0.53 | 0.0001 | CCP110 | −0.22 | 0.0142 | MAP6D1 | −0.43 | 0.0002 | ||||||||||
| HAPLN2 | 0.42 | 0.0267 | DIP2A | −0.22 | 0.0113 | CRYAB | −0.43 | 0.0445 | ||||||||||
| TUBB4A | 0.41 | 0.0036 | PCDH9 | −0.22 | 0.0174 | ABCA8A | −0.46 | 0.0122 | ||||||||||
| FTH1 | 0.39 | 0.0054 | TPST1 | −0.23 | 0.0279 | GNG11 | −0.46 | 0.0049 | ||||||||||
| KNDC1 | 0.39 | 0.0335 | DOCK10 | −0.23 | 0.0350 | NIPA1 | −0.47 | 0.0001 | ||||||||||
| SLC38A2 | 0.34 | 0.0003 | CNTN2 | −0.23 | 0.0218 | GLTP | −0.48 | 0.0006 | ||||||||||
| SLC20A2 | 0.30 | 0.0013 | TULP4 | −0.23 | 0.0022 | GPR37 | −0.48 | 0.0005 | ||||||||||
| CFL2 | 0.28 | 0.0040 | OMG | −0.23 | 0.0191 | GJC3 | −0.48 | 0.0001 | ||||||||||
| ZDHHC20 | 0.24 | 0.0249 | EPS15 | −0.24 | 0.0189 | CAR2 | −0.50 | 0.0010 | ||||||||||
| NUDT4 | 0.24 | 0.0047 | ARAP2 | −0.24 | 0.0130 | PRR5L | −0.50 | 0.0043 | ||||||||||
| LPGAT1 | 0.21 | 0.0097 | AATK | −0.25 | 0.0321 | ANO4 | −0.50 | 0.0010 | ||||||||||
| PAK1 | 0.21 | 0.0071 | SEMA6D | −0.25 | 0.0062 | ARSG | −0.52 | 0.0029 | ||||||||||
| TMOD2 | 0.20 | 0.0160 | KCNA6 | −0.27 | 0.0047 | PLXNB3 | −0.52 | 0.0105 | ||||||||||
| GPX4 | 0.20 | 0.0175 | GATM | −0.27 | 0.0091 | 1700047M11RIK | −0.53 | 0.0012 | ||||||||||
| PSAT1 | 0.19 | 0.0409 | BCAS1 | −0.28 | 0.0412 | LPAR1 | −0.54 | 0.0012 | ||||||||||
| PCNP | 0.18 | 0.0231 | S1PR5 | −0.29 | 0.0214 | TMEM88B | −0.56 | 0.0002 | ||||||||||
| CDC37L1 | 0.16 | 0.0424 | GRM3 | −0.29 | 0.0346 | CMTM5 | −0.59 | 0.0017 | ||||||||||
| ATP6AP2 | 0.16 | 0.0309 | EPHB1 | −0.29 | 0.0059 | FA2H | −0.67 | 0.0004 | ||||||||||
| DENND5A | −0.16 | 0.0239 | UNC5B | −0.29 | 0.0226 | ASPA | −0.67 | 0.0001 | ||||||||||
| ACOT7 | −0.17 | 0.0496 | TMEFF1 | −0.30 | 0.0304 | HHIP | −0.73 | 0.0033 | ||||||||||
| MYO6 | −0.17 | 0.0271 | SERINC5 | −0.30 | 0.0016 | TMEM125 | −0.75 | 0.0102 | ||||||||||
| SLC44A1 | −0.18 | 0.0460 | CNP | −0.30 | 0.0066 | SOX2OT | −0.85 | 0.0052 | ||||||||||
| SORT1 | −0.18 | 0.0127 | TTYH2 | −0.31 | 0.0053 | PPP1R14A | −0.86 | 0.0011 | ||||||||||
| DNM3 | −0.18 | 0.0334 | TPPP | −0.32 | 0.0026 | MOG | −0.86 | 0.0010 | ||||||||||
| ANK3 | −0.19 | 0.0130 | TRIM59 | −0.33 | 0.0334 | PDLIM2 | −0.87 | 0.0014 | ||||||||||
| YPEL2 | −0.20 | 0.0410 | REEP3 | −0.33 | 0.0022 | IL33 | −0.91 | 0.0001 | ||||||||||
| EDIL3 | −0.20 | 0.0247 | PTPRD | −0.33 | 0.0006 | PRR18 | −0.91 | 0.0003 | ||||||||||
| KCNJ10 | −0.20 | 0.0348 | PACS2 | −0.34 | 0.0008 | PLP1 | −1.07 | 5.01 × 10⁻⁷ | ||||||||||
| WNK1 | −0.20 | 0.0039 | DPY19L1 | −0.34 | 0.0012 | PLLP | −1.11 | 0.0001 | ||||||||||
| DST | −0.21 | 0.0280 | TSPAN2 | −0.35 | 0.0008 | GJC2 | −1.11 | 0.0043 | ||||||||||
| Pathway Category | Pathway Name | p-Value | Molecules |
|---|---|---|---|
| Generation of precursor metabolites and energy | Glycerol-3-phosphate shuttle | 0.0469 | GPD1 |
| Pathogen-influenced signaling | LPS/IL-1 mediated inhibition of RXR function | 0.0400 | CHST7, GSTM5, IL33, RARA, SMOX, SREBF1 |
| Cellular immune response | Granulocyte adhesion and diapedesis | 0.0303 | C5AR1, IL33, SDC4, SELPLG |
| Degradation/utilization/assimilation | Tryptophan degradation X | 0.0481 | AKR1B10, SMOX |
| Glycerol degradation I | 0.0469 | GPD1 | |
| Dopamine degradation | 0.0368 | SMOX, Sult1a1 | |
| Acetone degradation I (to Methylglyoxal) | 0.0268 | AKR1B10, CYP51A1 | |
| Spermine and spermidine degradation I | 0.0237 | SMOX | |
| Cellular stress and injury | Intrinsic prothrombin activation pathway | 0.0481 | COL5A3, KLK6 |
| GP6 signaling pathway | 0.0388 | COL16A1, COL27A1, COL5A1, COL5A3 | |
| Wound-healing signaling pathway | 0.0288 | COL16A1, COL27A1, COL5A1, COL5A3, IL33, VIM | |
| Coagulation system | 0.0181 | F3, VWF | |
| Osteoarthritis pathway | 0.0163 | ANXA2, FGFR3, GREM1, HES1, HTRA1, SDC4, SPP1 | |
| Apelin liver signaling pathway | 0.0059 | AGT, COL5A3, EDN1 | |
| Pulomary fibrosis idiopathic signaling pathway | 0.0015 | CCN2, COL16A1, COL27A1, COL5A1, COL5A3, EDN1, EGR1, FGFR3, HES1, LPAR1, VIM | |
| Biosynthesis | Trans, trans-faresyl diphosphate biosynthesis | 0.0469 | IDI1 |
| Cholesterol biosynthesis III (via desmosterol) | 0.0316 | CYP51A1, MSMO1 | |
| Glutamine biosynthesis I | 0.0237 | GLUL | |
| Superpathway of citrulline metabolism | 0.0223 | ASL, PRODH | |
| Γ-linolenate biosynthesis II | 0.0181 | FADS1, FADS2 | |
| Superpathway of geranylgeranyldiphosphate biosynthesis I (via mevalonate) | 0.0143 | ACAT2, IDI1 | |
| Mevalonate pathway I | 0.0109 | ACAT2, IDI1 | |
| Zymosterol biosynthesis | 0.0054 | CYP51A1, MSMO1 | |
| Superpathway of cholesterol biosynthesis | 0.0011 | ACAT2, CYP51A1, IDI1, MSMO1 | |
| Disease-specific pathway | Osteoarthritis pathway | 0.0163 | ANXA2, FGFR3, GREM1, HES1, HTRA1, SDC4, SPP1 |
| Pathogen-induced cytokine storm signaling pathway | 0.0111 | COL16A1, COL27A1, COL5A1, COL5A3, DHX58, IL33, SOCS3 | |
| Hepatic fibrosis/hepatic stellate cell activation | 0.0040 | AGT, CCN2, COL16A1, COL27A1, COL5A1, COL5A3, EDN1 | |
| Pulomary fibrosis idiopathic signaling pathway | 0.0015 | CCN2, COL16A1, COL27A1, COL5A1, COL5A3, EDN1, EGR1, FGFR3, HES1, LPAR1, VIM | |
| Atherosclerosis signaling | 0.0005 | APOD, COL5A3, F3, IL33, SELPLG, TNFRSF12A | |
| Cardiovascular signaling | Intrinsic prothrombin activation pathway | 0.0481 | COL5A3, KLK6 |
| Atherosclerosis signaling | 0.0005 | APOD, COL5A3, F3, IL33, SELPLG, TNFRSF12A | |
| Nuclear receptor signaling | LPS/IL-1 mediated inhibition of RXR function | 0.0400 | CHST7, GSTM5, IL33, RARA, SMOX, SREBF1 |
| LXR/RXR activation | 0.0103 | AGT, APOD, CYP51A1, IL33, SREBF1 | |
| FXR/RXR activation | 0.0064 | AGT, APOD, IL33, RARA, SREBF1 | |
| VDR/RXR activation | 0.0002 | CDKN1A, HES1, IGFBP1, KLF4, KLK6, SPP1 | |
| Ingenuity toxicity list pathways | LPS/IL-1 mediated inhibition of RXR function | 0.0400 | CHST7, GSTM5, IL33, RARA, SMOX, SREBF1 |
| LXR/RXR activation | 0.0103 | AGT, APOD, CYP51A1, IL33, SREBF1 | |
| FXR/RXR activation | 0.0064 | AGT, APOD, IL33, RARA, SREBF1 | |
| Hepatic fibrosis/hepatic stellate cell activation | 0.0040 | AGT, CCN2, COL16A1, COL27A1, COL5A1, COL5A3, EDN1 | |
| VDR/RXR activation | 0.0002 | CDKN1A, HES1, IGFBP1, KLF4, KLK6, SPP1 |
| Categories | Disease or Function Annotation | p-Value | Molecules |
|---|---|---|---|
| Nervous system development and function | Myelination | 2.88 × 10⁻⁶ | ASPA, FGFR3, GJB6, GJC2, HPGDS |
| Nervous system development and function, tissue Morphology | Quantity of oligodendrocytes | 0.000125 | FGFR3, GJB6, GJC2 |
| Cell-to-cell signaling and interaction | Coupling of oligodendrocytes | 0.000556 | GJB6, GJC2 |
| Cell morphology, cellular assembly and organization, nervous system development and function, tissue morphology | Thickness of myelin sheath | 0.000556 | GJB6, GJC2 |
| Cell-to-cell signaling and interaction | Coupling of astrocytes | 0.000556 | GJB6, GJC2 |
| Cellular assembly and organization | Formation of vacuole | 0.00164 | GJB6, GJC2 |
| Developmental disorder, nervous system development and function, neurological disease, organismal injury and abnormalities | Demyelination of cerebellum | 0.0053 | ASPA, HPGDS |
| Cell death and survival, cellular compromise, neurological disease, organismal injury and abnormalities, tissue morphology | Neurodegeneration of axons | 0.0053 | ASPA, SPTSSB |
| Tissue morphology | Quantity of cells | 0.00738 | ARSG, ASPA, FGFR3, GJB6, GJC2, NRN1 |
| Cell-to-cell signaling and interaction, hematological system development and function, immune cell trafficking, inflammatory response, nervous system development and function | Activation of microglia | 0.00783 | GJB6, GJC2 |
| Nervous system development and function | Morphology of nervous system | 0.011 | ARSG, FA2H, GJB6, GJC2, MERTK, PLP1, RARA, TBATA, UGT8, ZIC4 |
| Nervous system development and function, tissue morphology | Morphology of nervous tissue | 0.0126 | ARSG, FA2H, GJB6, GJC2, PLP1, TBATA, UGT8 |
| Cellular compromise, neurological disease, organismal injury and abnormalities | Damage of axons | 0.0236 | SOCS3 |
| Cell-to-cell signaling and interaction, nervous system development and function | Synaptic transmission of Bergmann glia | 0.0236 | SLC1A6 |
| Embryonic development, nervous system development and function, organ development, organismal development, tissue development | Delay in myelination of cerebellum | 0.0236 | FGFR3 |
| Cardiovascular system development and function, nervous system development and function, organ morphology, tissue morphology | Permeability of blood–brain barrier | 0.0236 | MOG |
| Nervous system development and function, neurological disease, organismal injury and abnormalities | Abnormal morphology of nervous system | 0.0314 | ARSG, FA2H, MERTK, PLP1, RARA, TBATA, UGT8, ZIC4 |
| Cellular assembly and organization, cellular function and maintenance, nervous system development and function, tissue morphology | Quantity of dendrites | 0.0467 | NRN1 |
| Neurological disease, organismal injury and abnormalities, psychological disorders | Spongy degeneration of central nervous system of white matter | 0.0467 | ASPA |
| Neurological disease, organismal injury and abnormalities | Astrocytosis of cerebellum | 0.0467 | HPGDS |
Disclaimer/Publisher’s Note: The statements, opinions and data contained in all publications are solely those of the individual author(s) and contributor(s) and not of MDPI and/or the editor(s). MDPI and/or the editor(s) disclaim responsibility for any injury to people or property resulting from any ideas, methods, instructions or products referred to in the content. |
© 2023 by the authors. Licensee MDPI, Basel, Switzerland. This article is an open access article distributed under the terms and conditions of the Creative Commons Attribution (CC BY) license (https://creativecommons.org/licenses/by/4.0/).
Share and Cite
Holloway, K.N.; Pinson, M.R.; Douglas, J.C.; Rafferty, T.M.; Kane, C.J.M.; Miranda, R.C.; Drew, P.D. Cerebellar Transcriptomic Analysis in a Chronic plus Binge Mouse Model of Alcohol Use Disorder Demonstrates Ethanol-Induced Neuroinflammation and Altered Glial Gene Expression. Cells 2023, 12, 745. https://doi.org/10.3390/cells12050745
Holloway KN, Pinson MR, Douglas JC, Rafferty TM, Kane CJM, Miranda RC, Drew PD. Cerebellar Transcriptomic Analysis in a Chronic plus Binge Mouse Model of Alcohol Use Disorder Demonstrates Ethanol-Induced Neuroinflammation and Altered Glial Gene Expression. Cells. 2023; 12(5):745. https://doi.org/10.3390/cells12050745
Chicago/Turabian StyleHolloway, Kalee N., Marisa R. Pinson, James C. Douglas, Tonya M. Rafferty, Cynthia J. M. Kane, Rajesh C. Miranda, and Paul D. Drew. 2023. "Cerebellar Transcriptomic Analysis in a Chronic plus Binge Mouse Model of Alcohol Use Disorder Demonstrates Ethanol-Induced Neuroinflammation and Altered Glial Gene Expression" Cells 12, no. 5: 745. https://doi.org/10.3390/cells12050745