
Twenty Novel MicroRNAs in the Aqueous Humor of Pseudoexfoliation Glaucoma Patients

 , , , and
Abstract
:1. Introduction
2. Materials and Methods
2.1. Study Groups
- (1)
- Incipient senile cataract: cloudy area in the lens that causes decreased vision.
- (2)
- PEX syndrome: typical deposits of white powdery material observed along the pupillary margin and on the peripheral lens capsule.
- (3)
- Glaucomatous optic neuropathy: elevated IOP of greater than 21 mmHg, documented in medical history; open-angle grade III/IV according to Schaffer’s classification; glaucomatous optic nerve head damage (excavation, neuroretinal rim thinning or notching, and localized or diffuse retinal nerve fiber layer [RNFL] defect); and glaucomatous defect in SAP in at least two consecutive tests, with three reliability indices better than 15% (results were considered abnormal if the Glaucoma Hemifield Test result was outside normal limits and at least three contiguous points were present within the same hemifield on the pattern deviation [PD] plot at p < 1%, with at least 1 point at p < 0.5%).
- (4)
- Advanced stages of PEXG: severe visual field loss with MD in visual field test > −18.0 dB.
- (1)
- Incipient senile cataract: cloudy area in the lens that causes decreased vision.
- (2)
- No clinical signs of glaucoma, nor PEX.
- (3)
- Normal IOP: from 10 mmHg to 21 mmHg.
2.2. Aqueous Humor
2.3. RNA Isolation
2.4. The miRNA Profiling
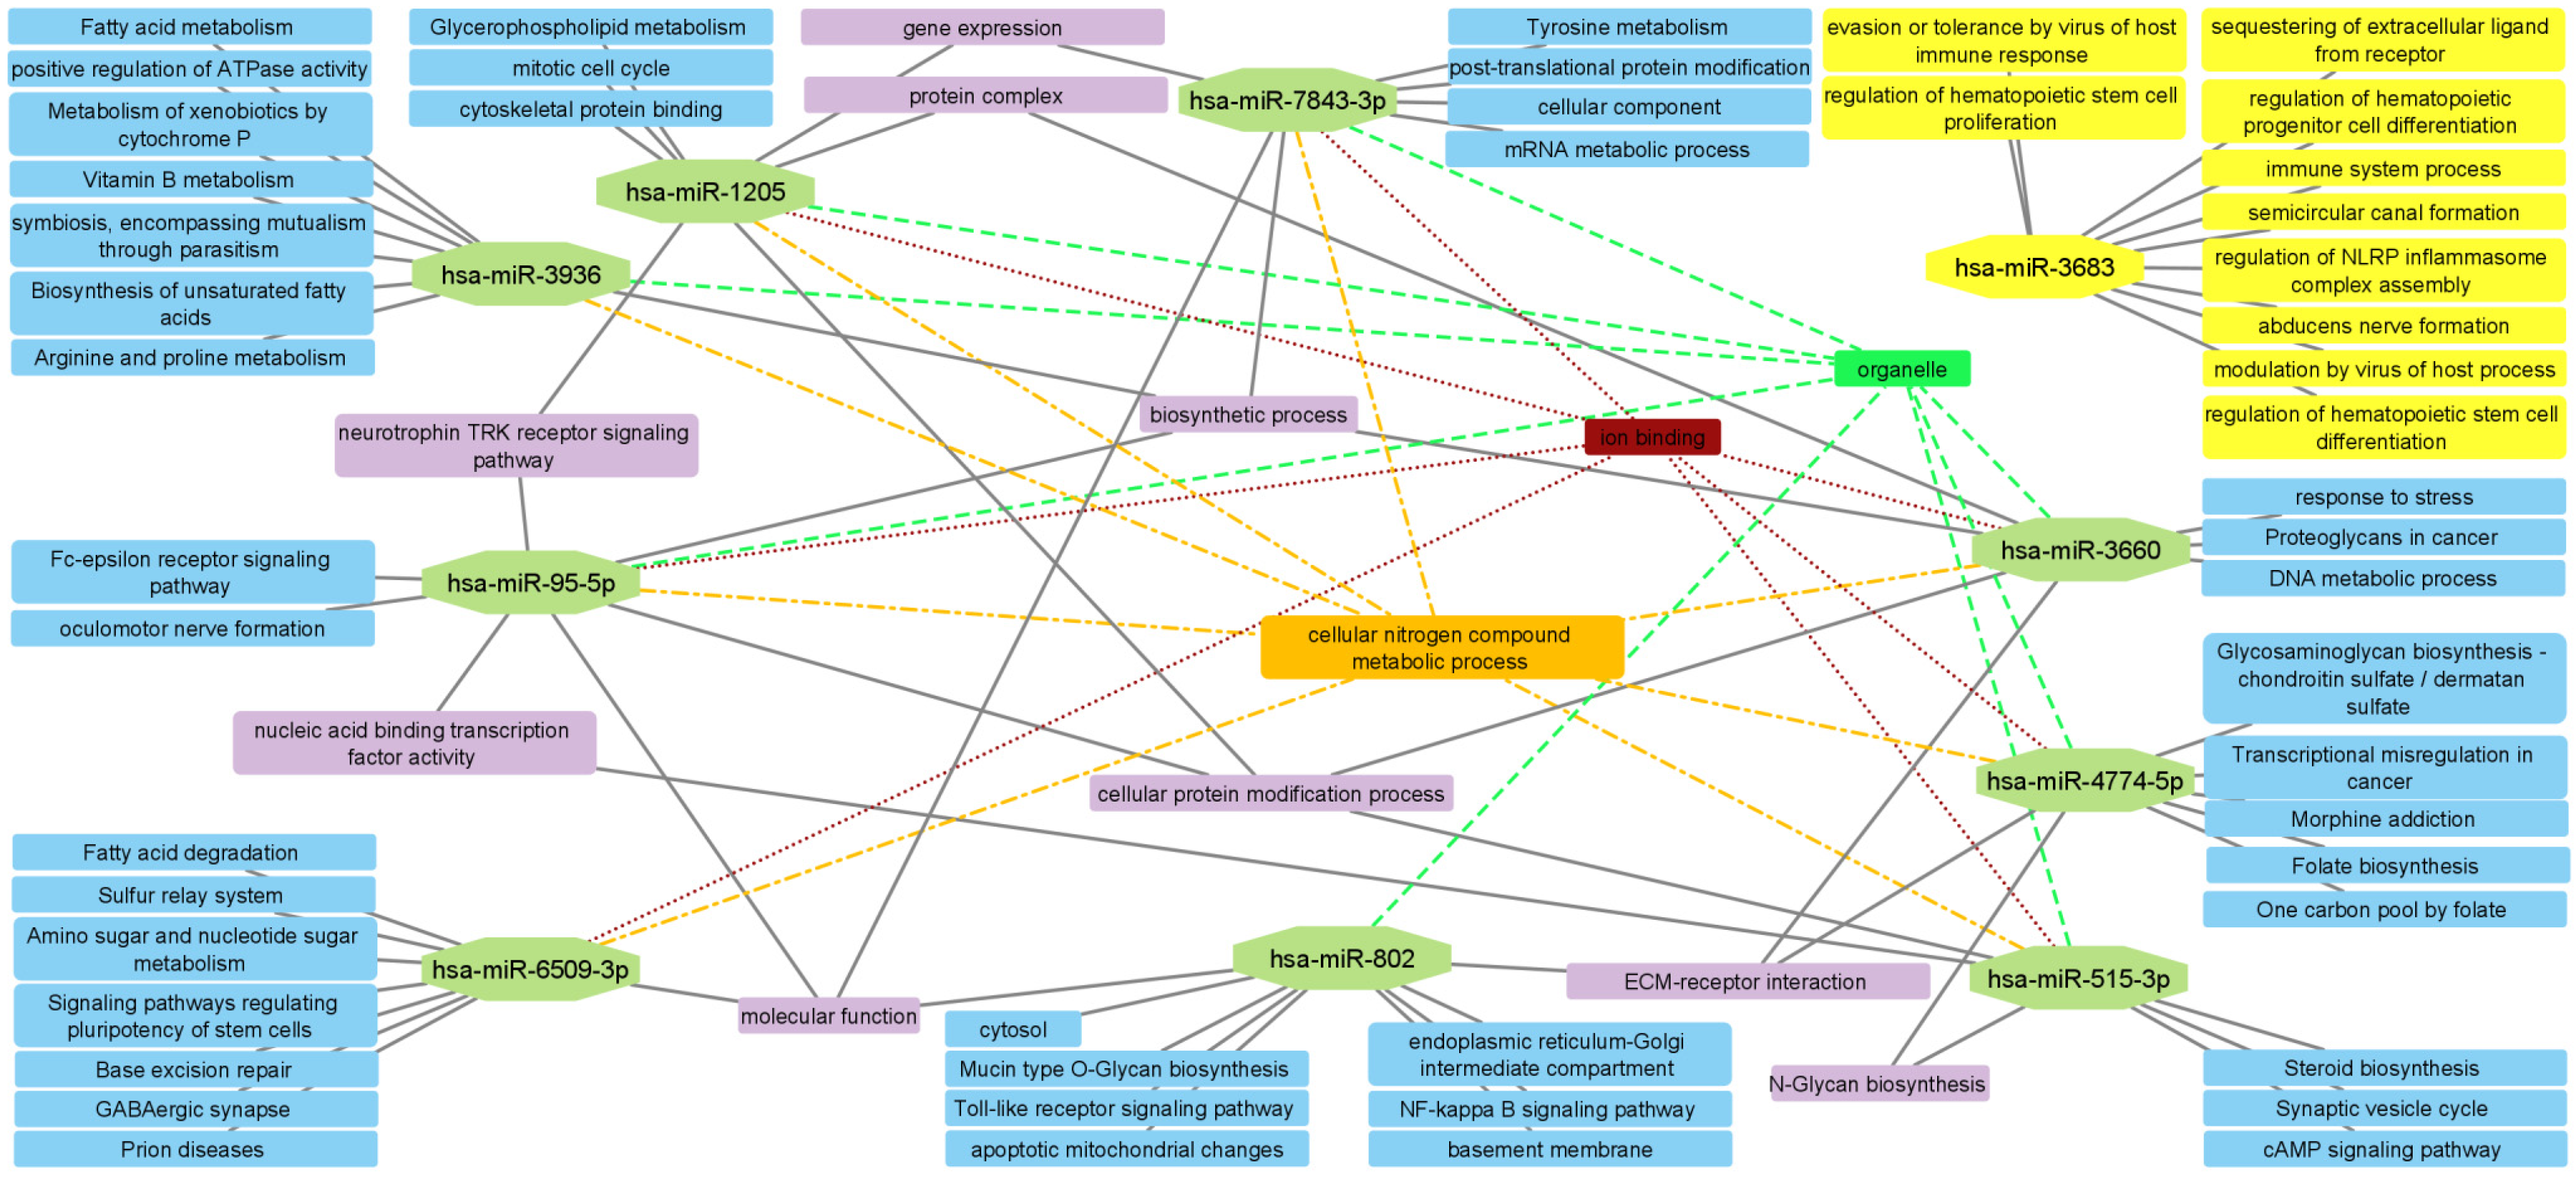
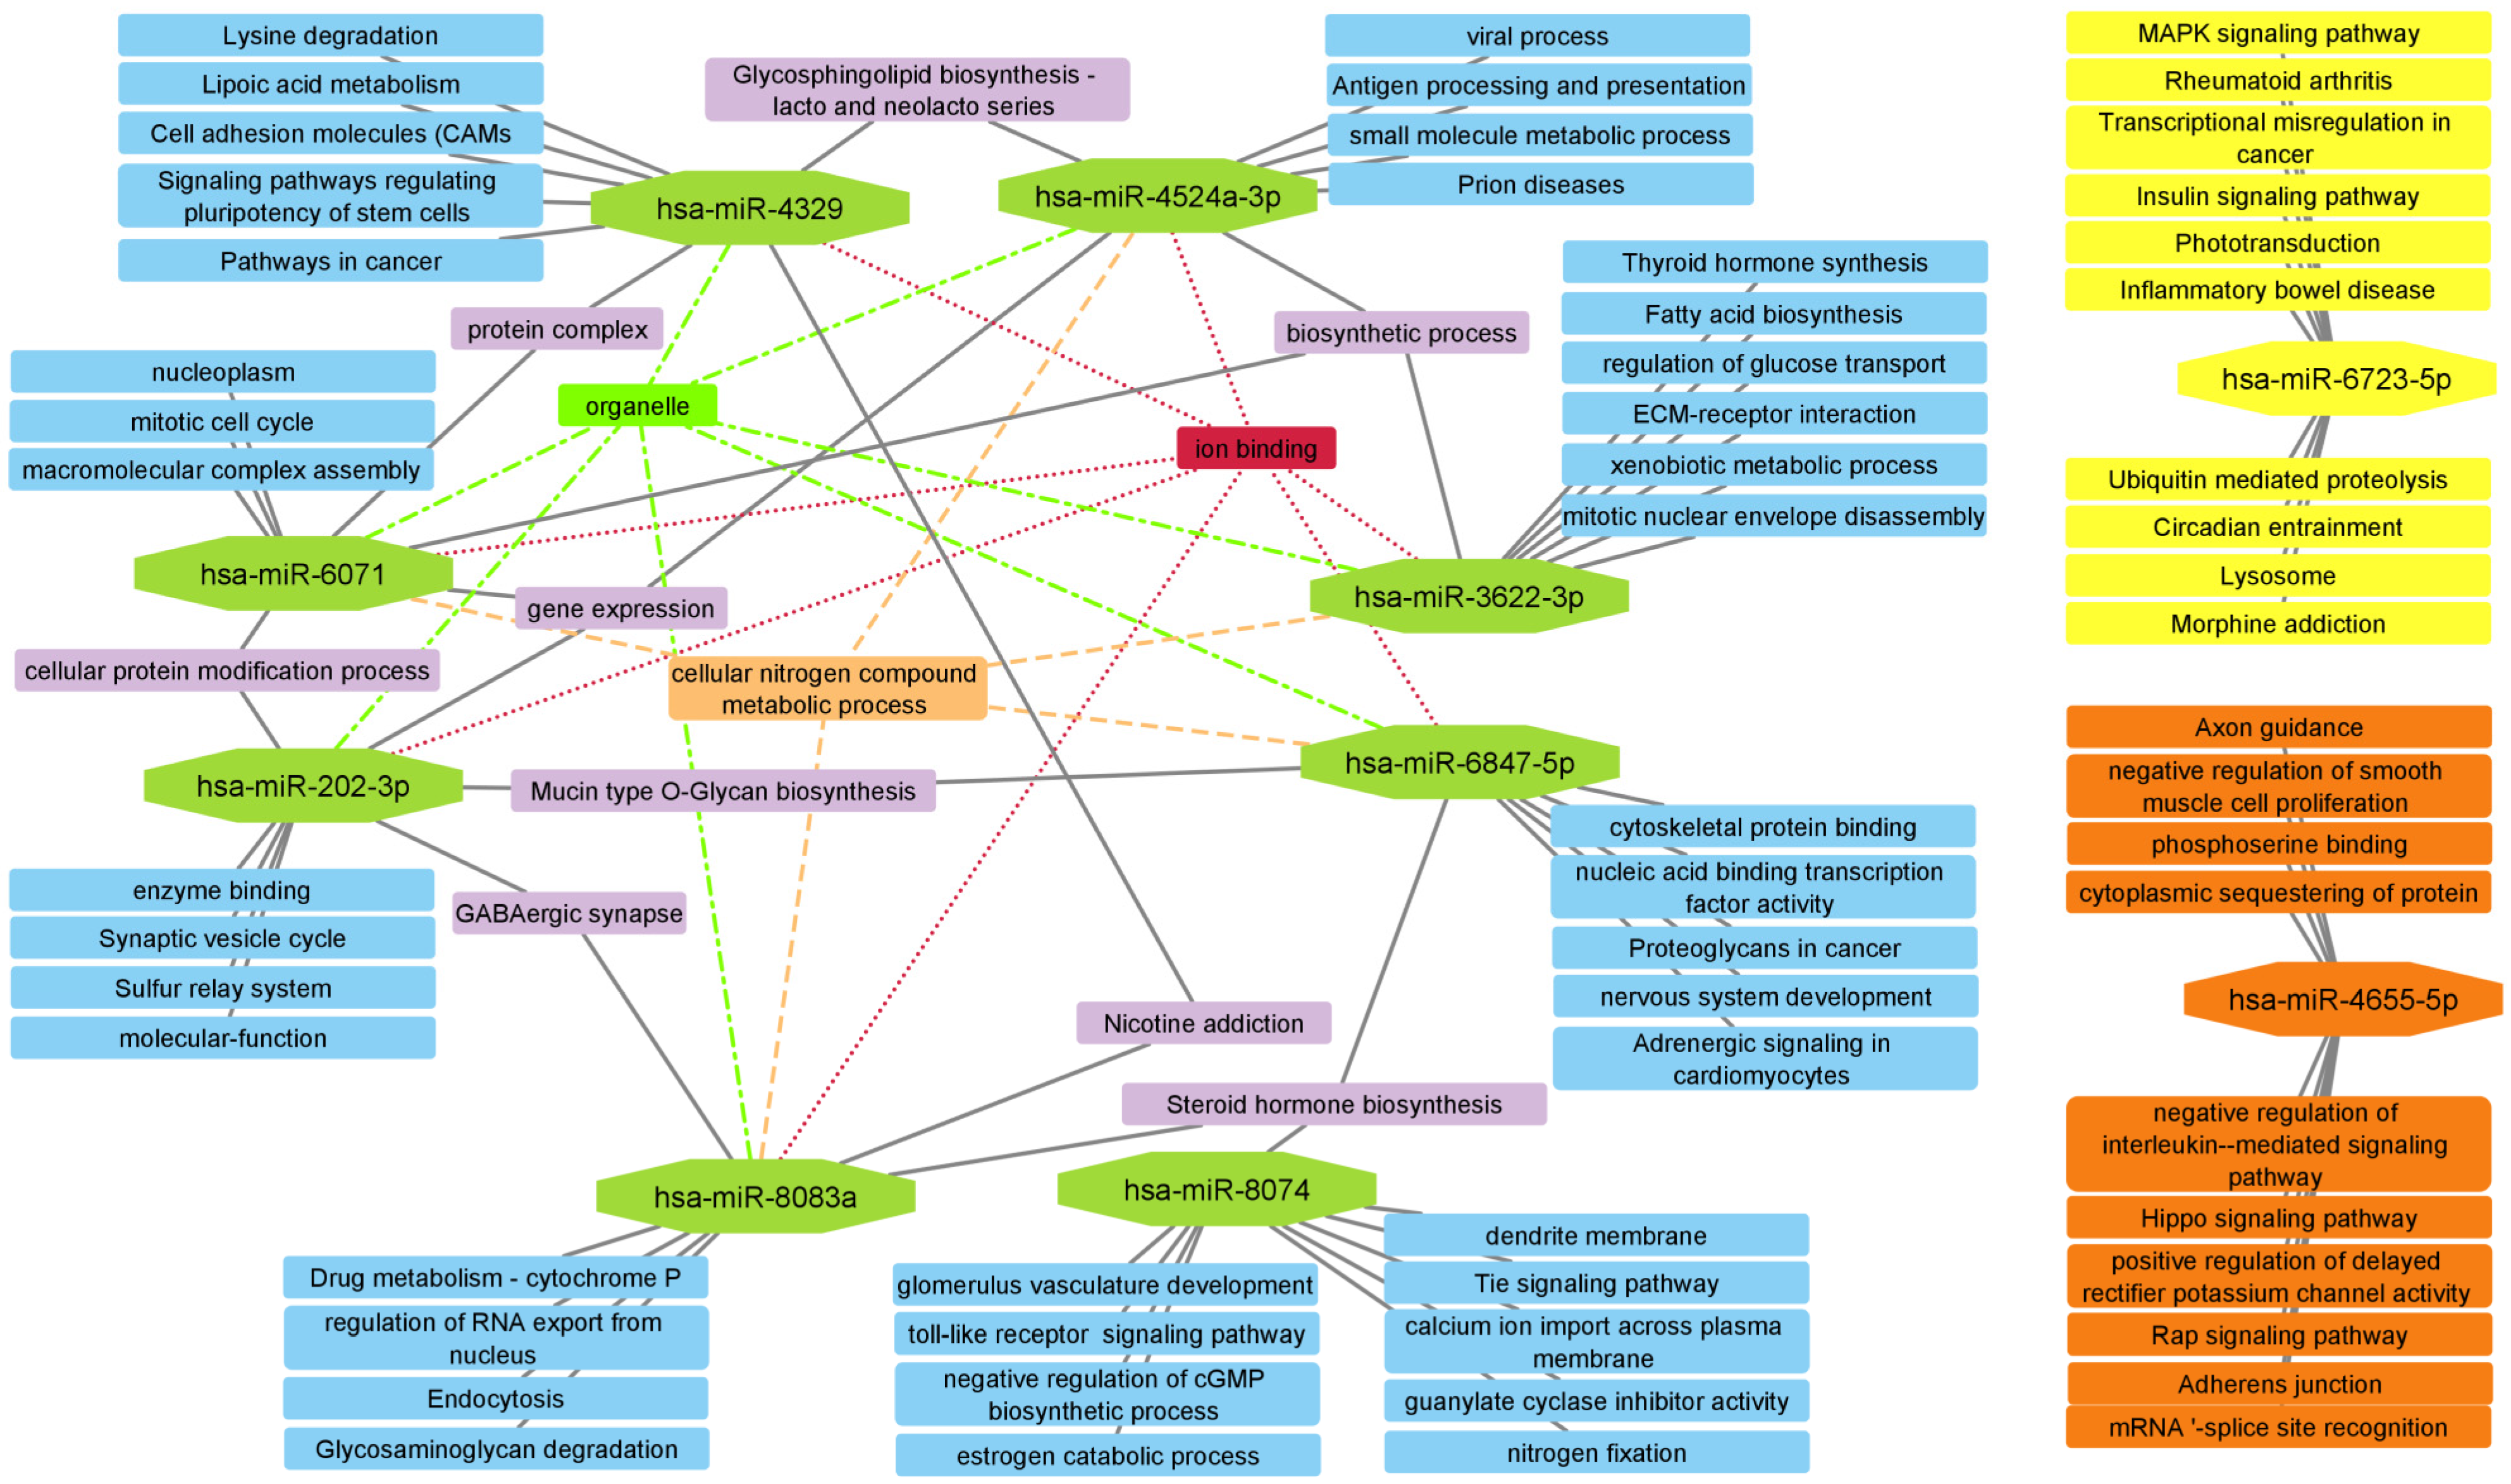
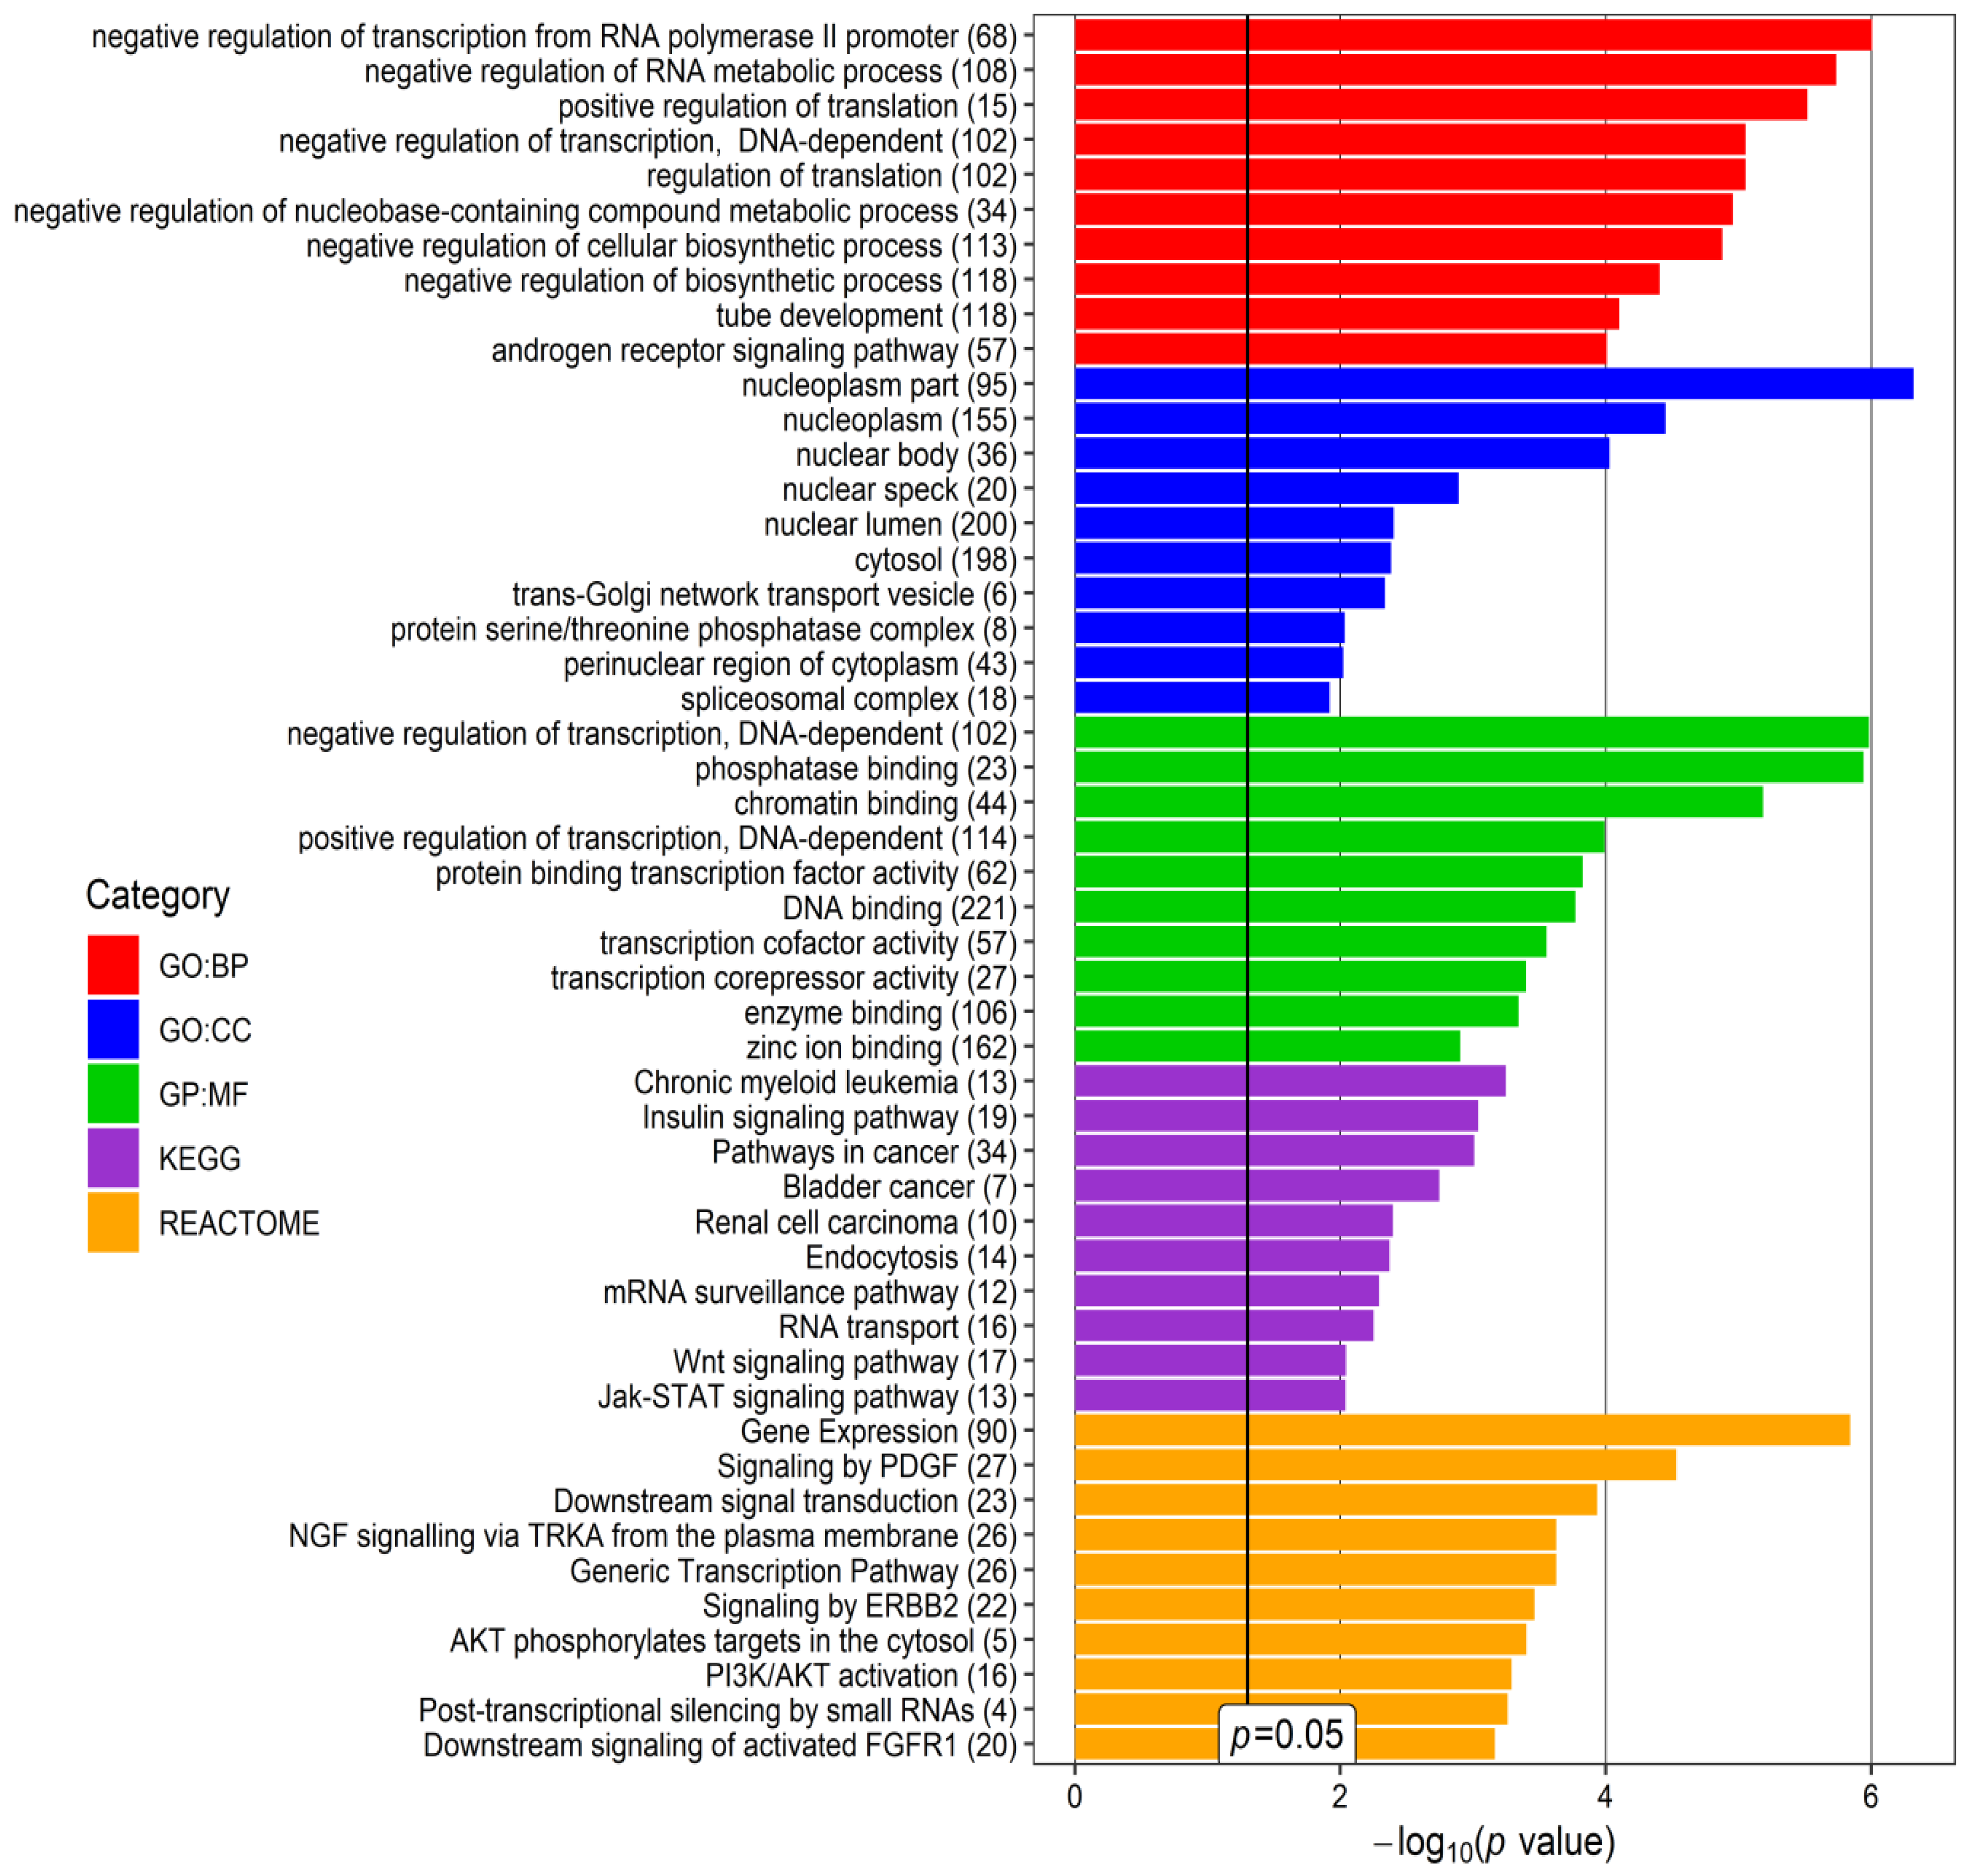
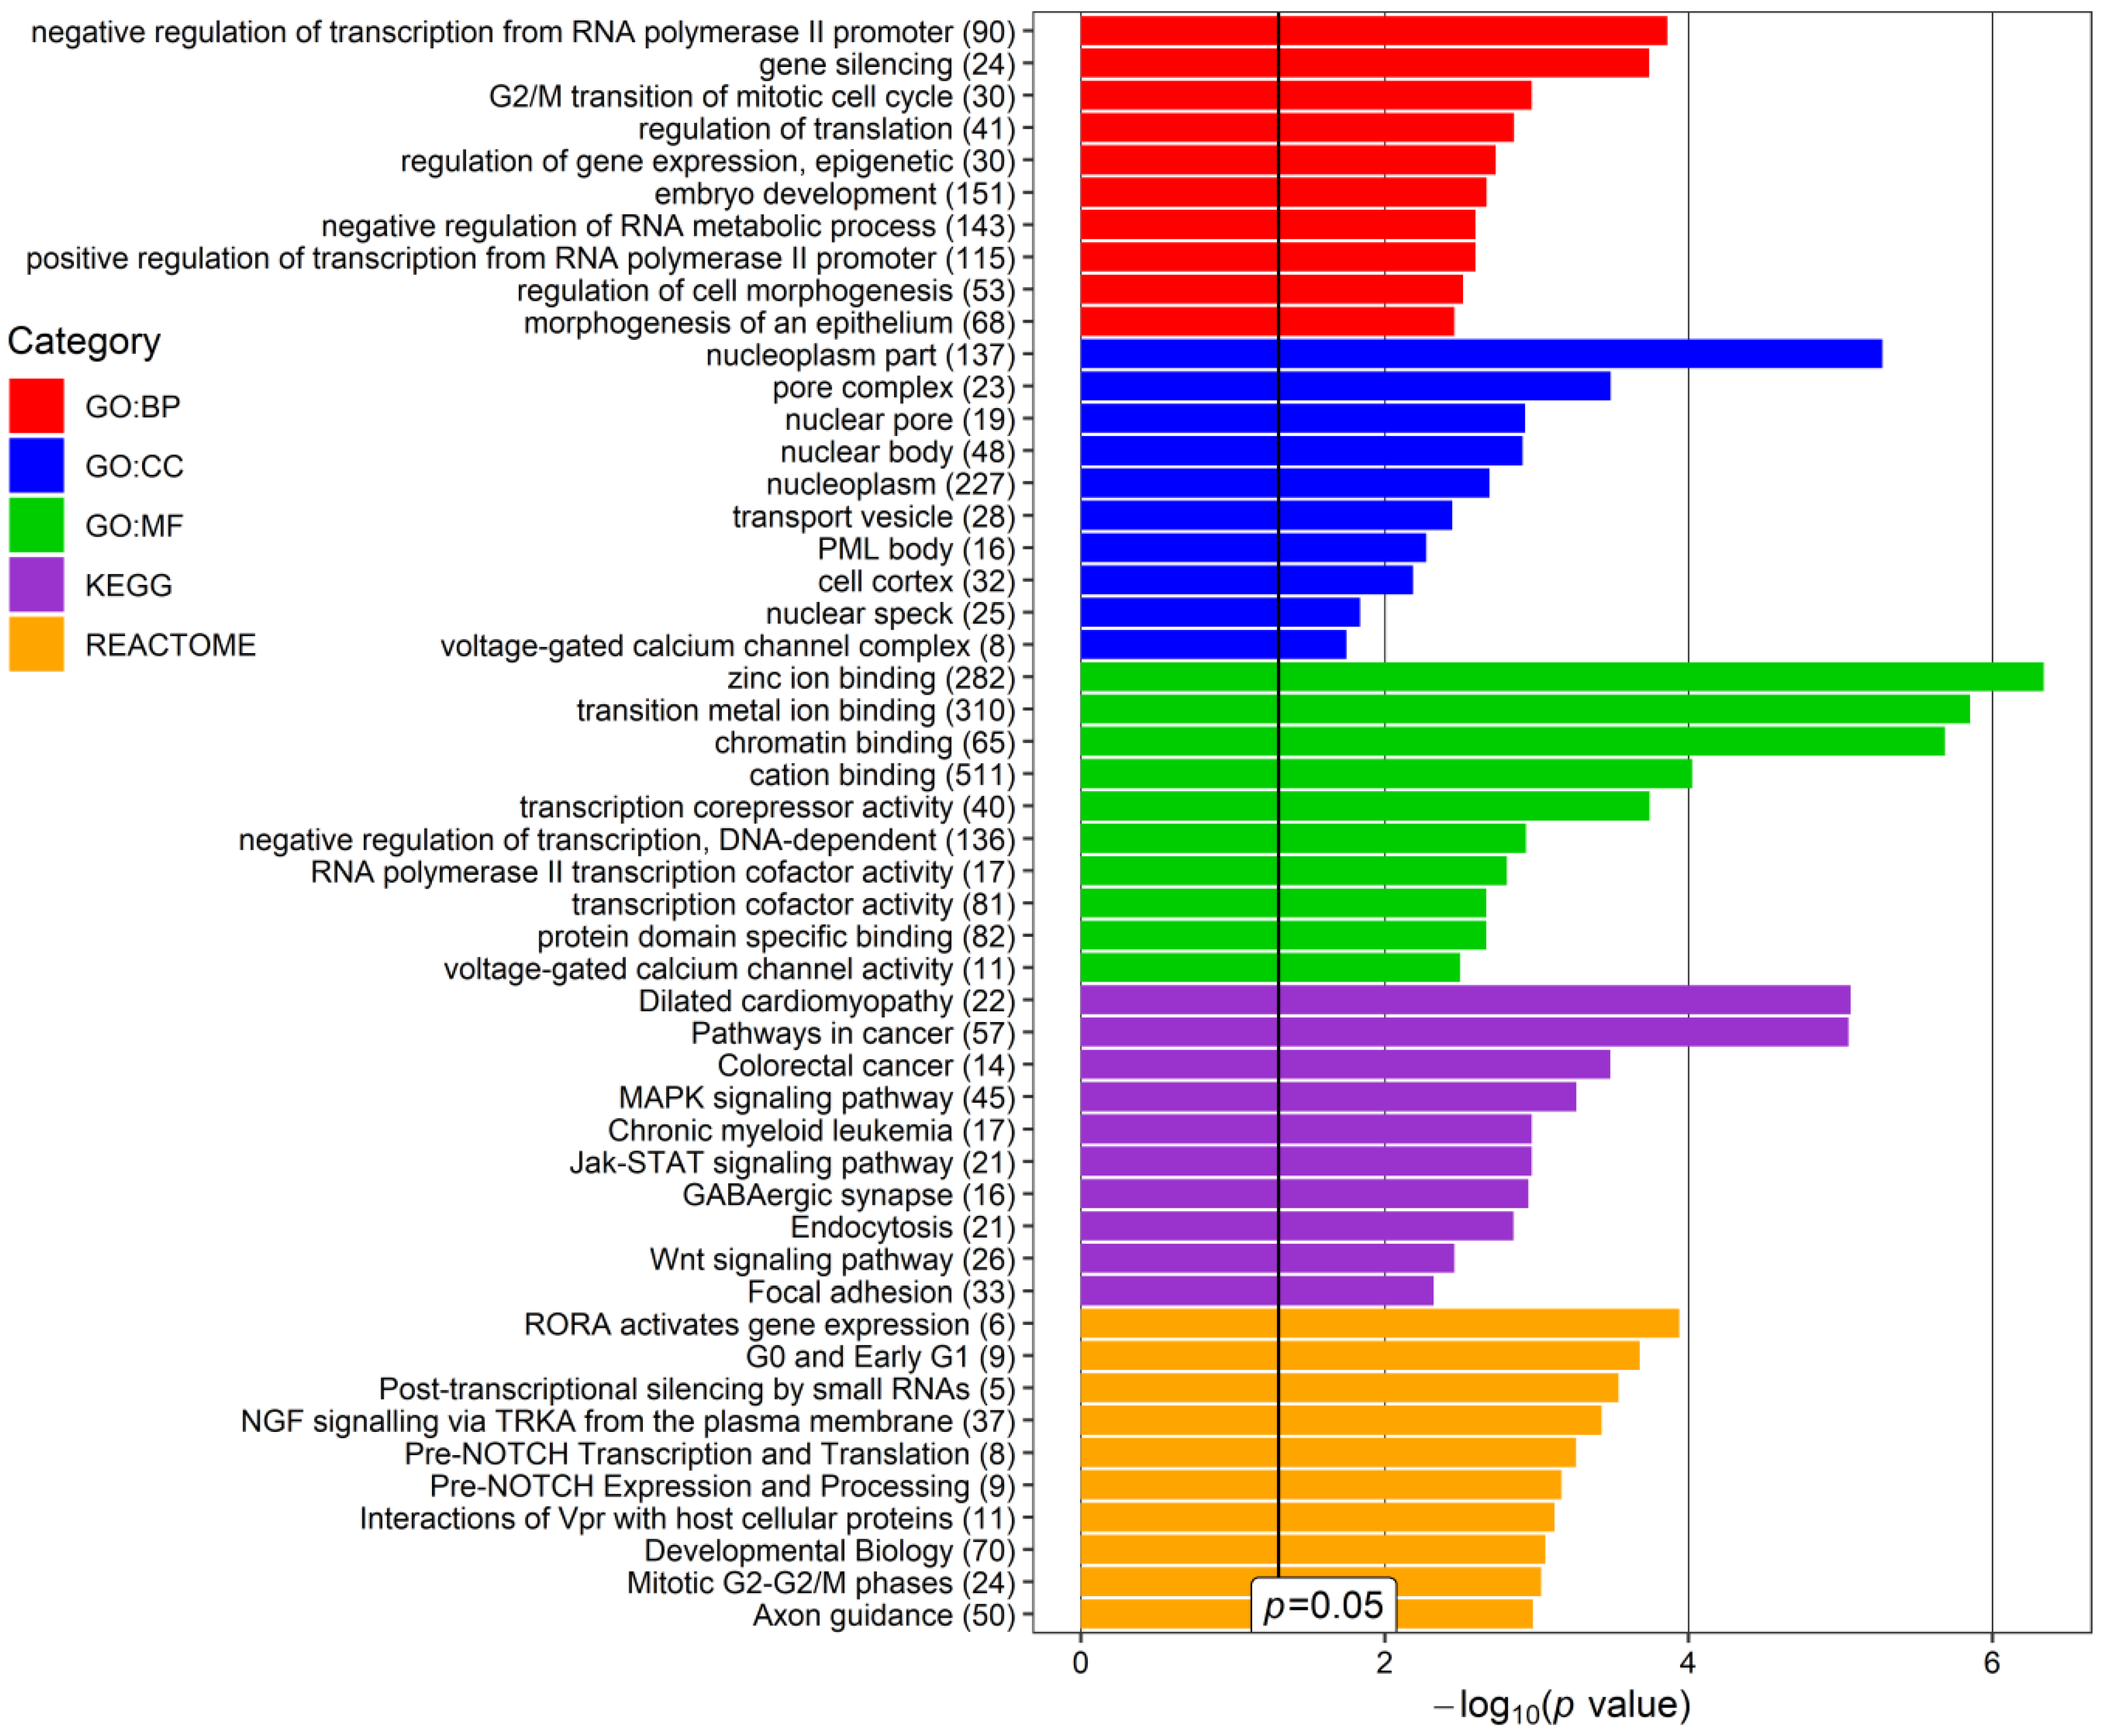
2.5. Enrichment Analysis
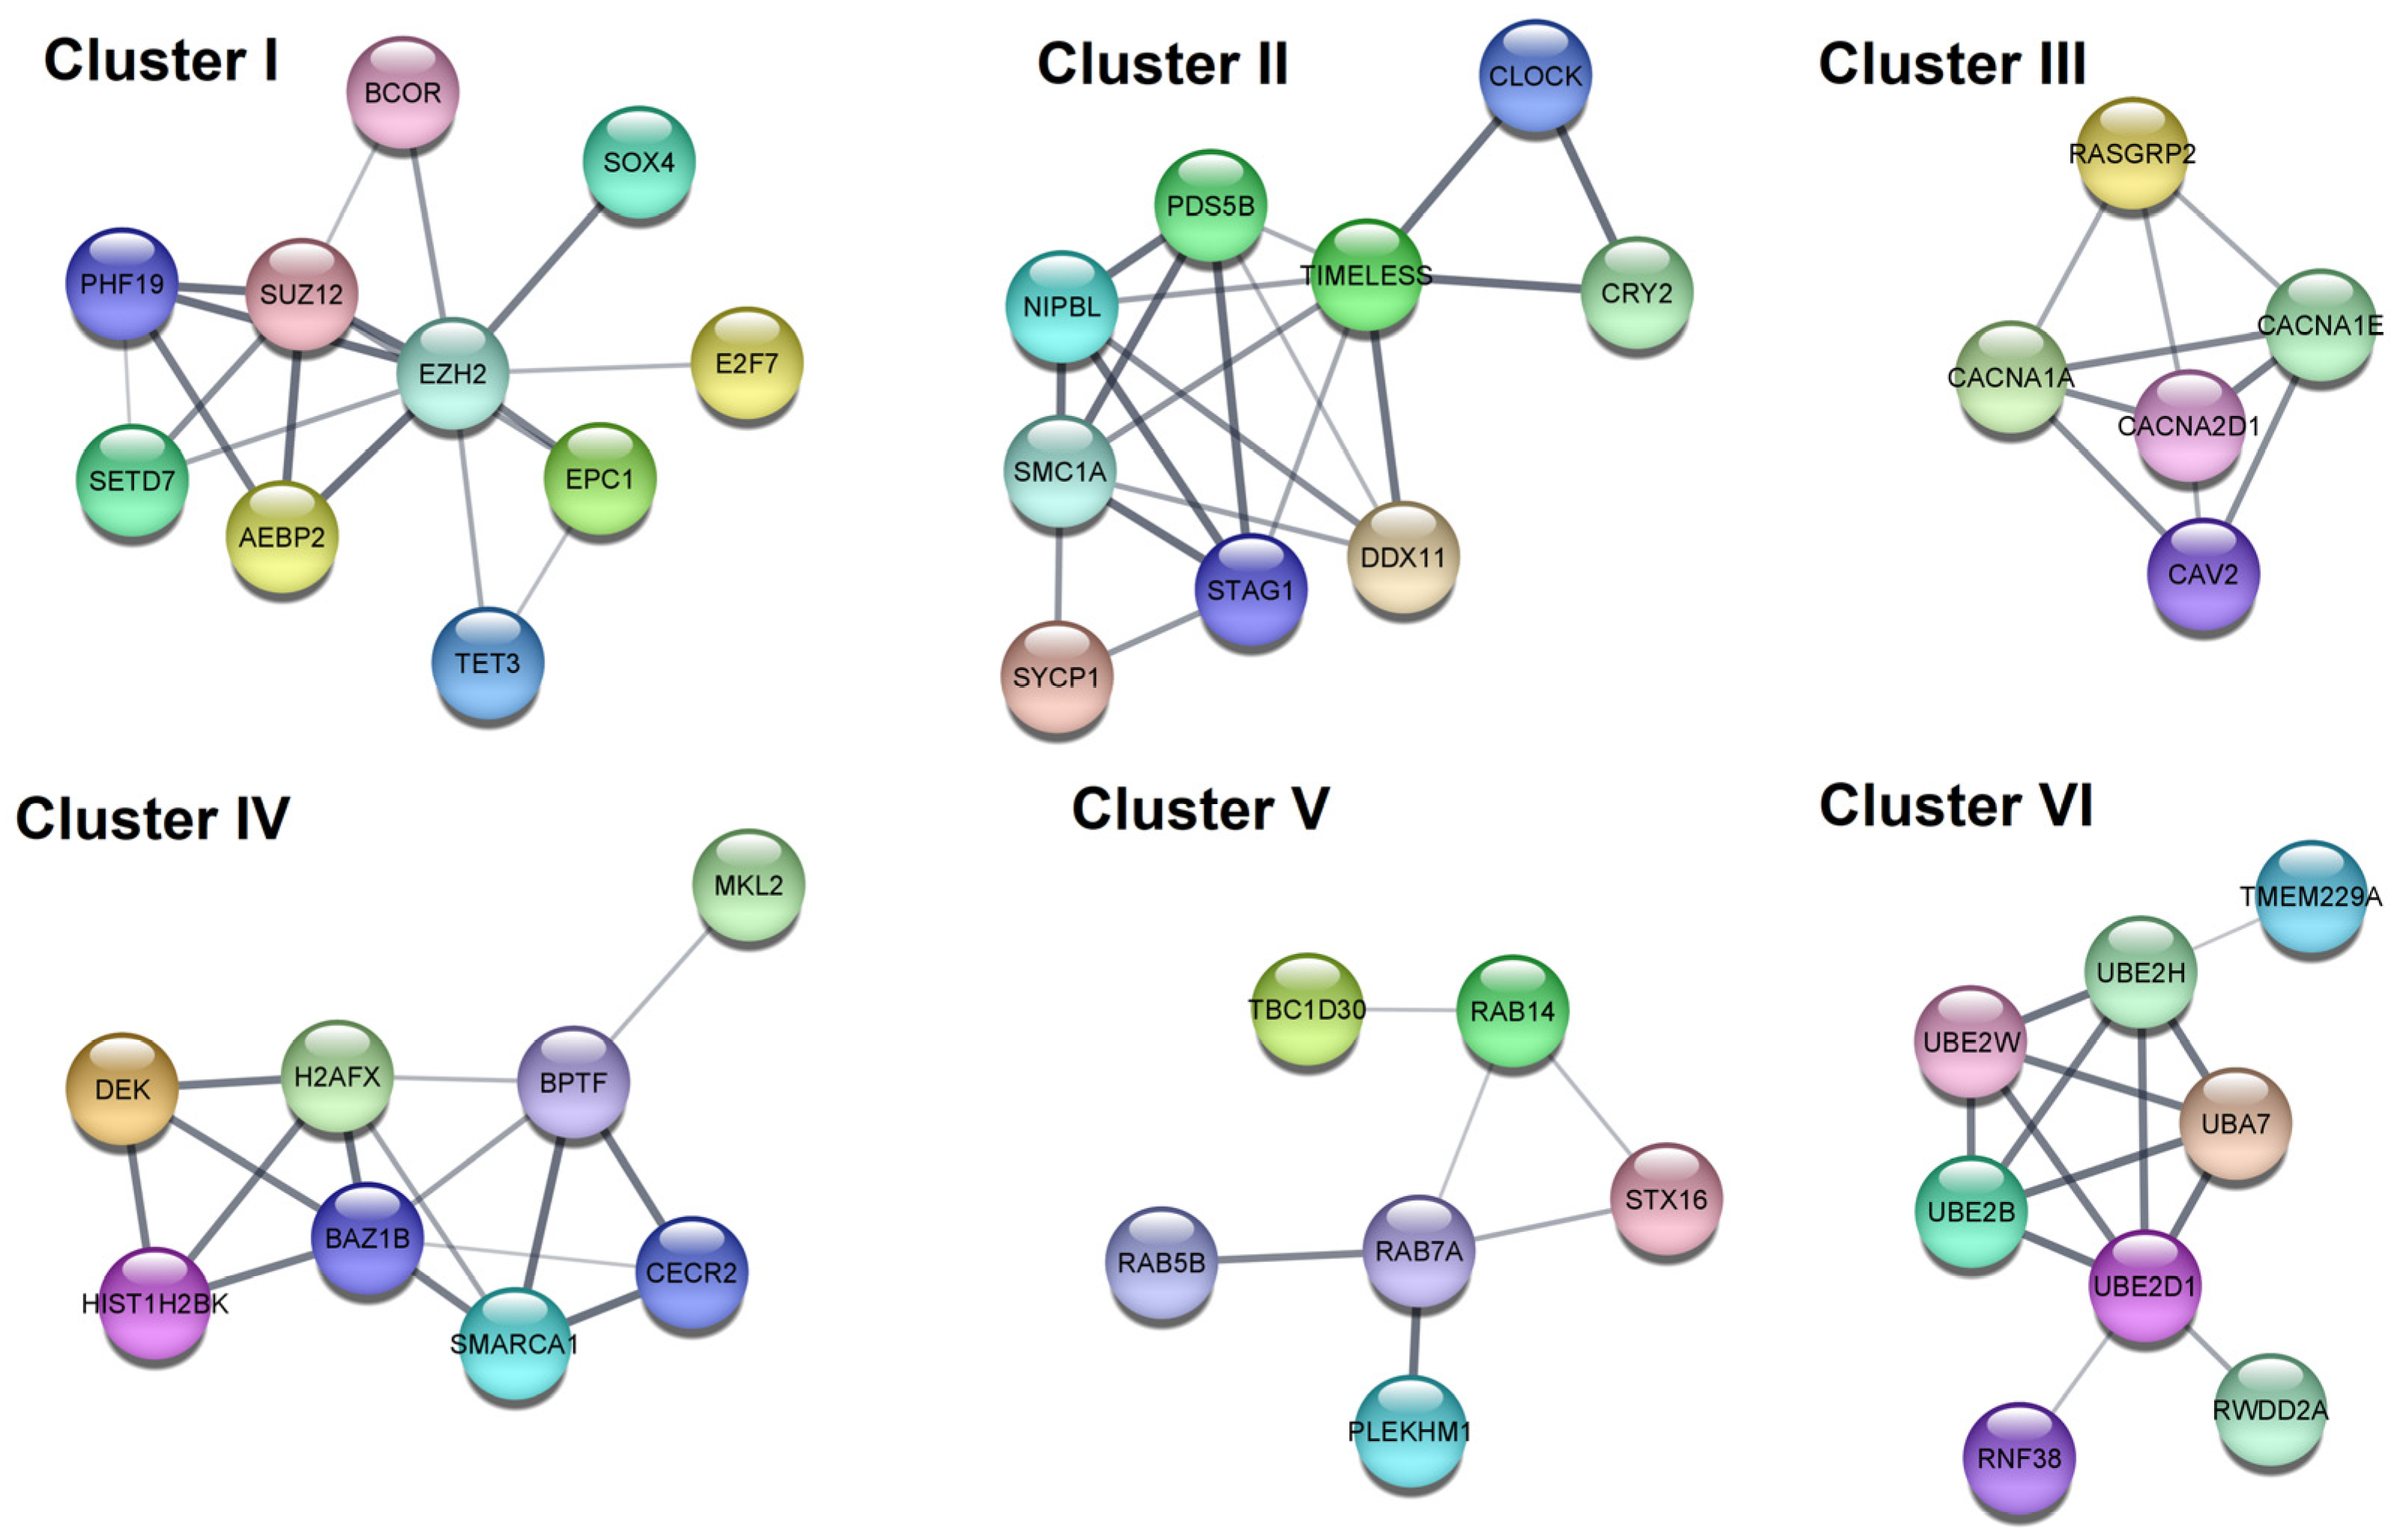
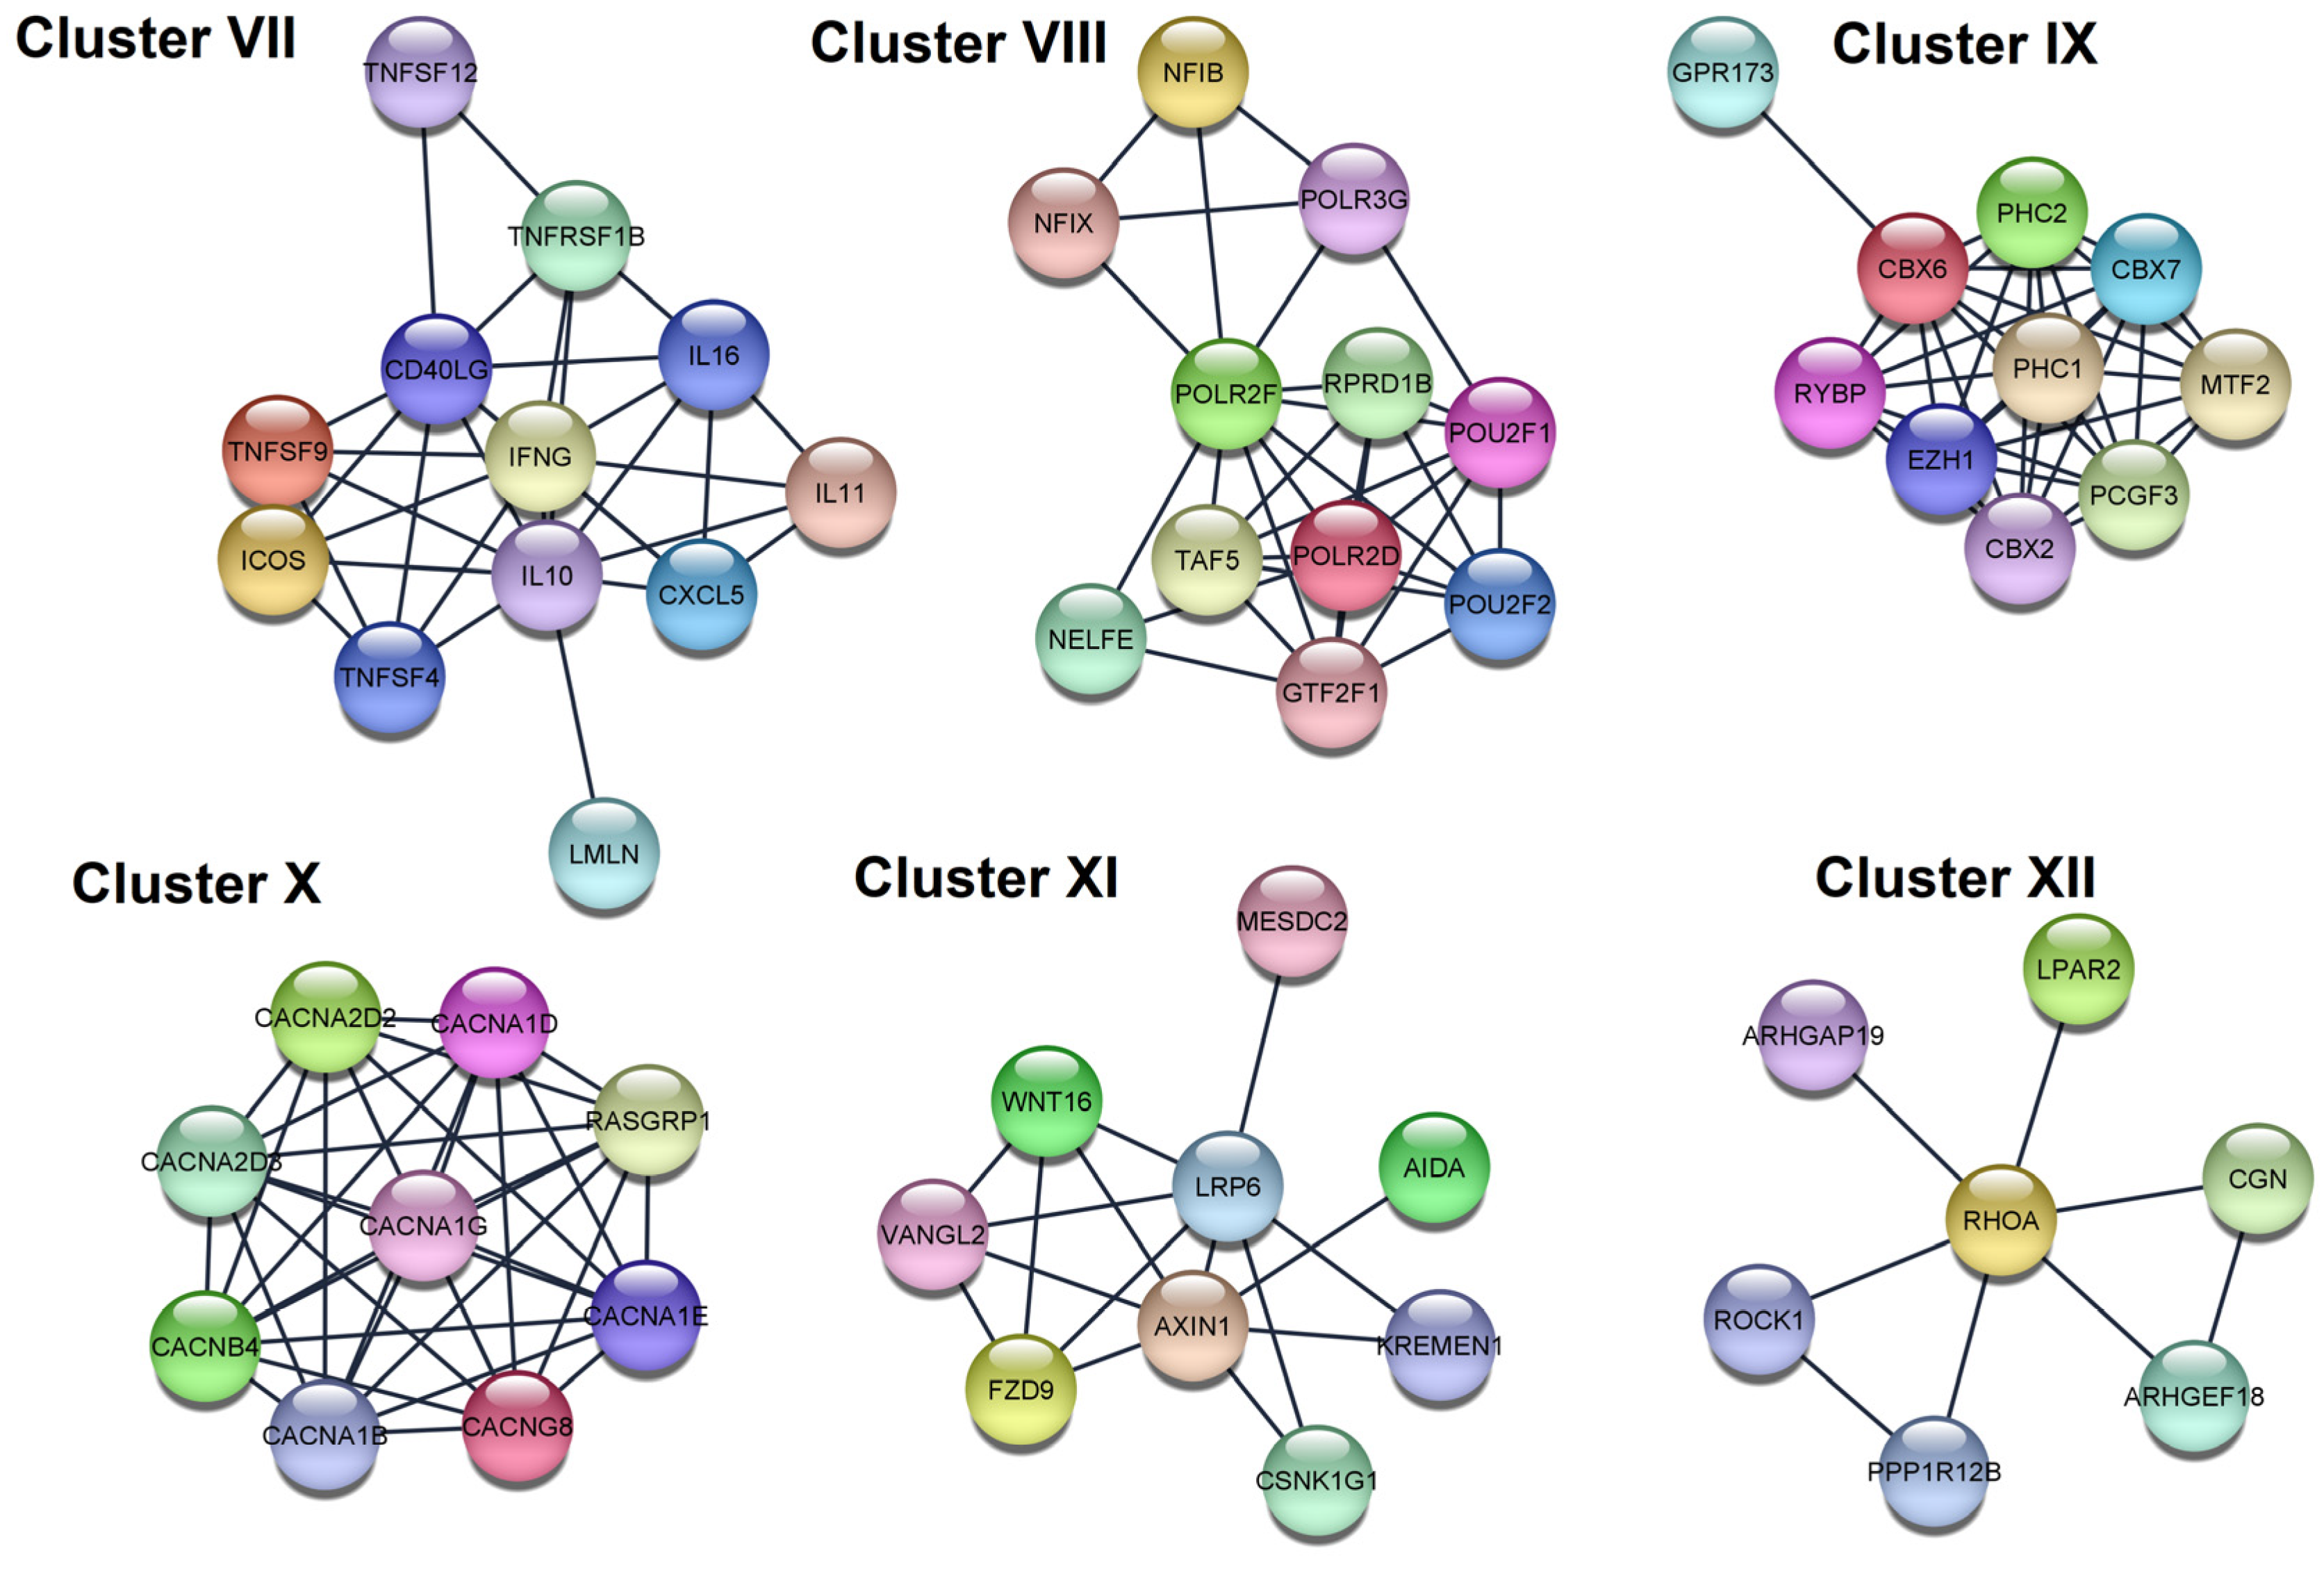
2.6. PPI Network and Subnetwork Construction
2.7. Statistical Analysis
3. Results
4. Discussion
5. Conclusions
Author Contributions
Funding
Institutional Review Board Statement
Informed Consent Statement
Data Availability Statement
Conflicts of Interest
References
- Allison, K.; Patel, D.; Alabi, O. Epidemiology of Glaucoma: The Past, Present, and Predictions for the Future. Cureus 2020, 12, e11686. [Google Scholar] [CrossRef] [PubMed]
- Cela, D.; Brignole-Baudouin, F.; Labbé, A.; Baudouin, C. The trabecular meshwork in glaucoma: An inflammatory trabeculopathy? J. Fr. Ophtalmol. 2021, 44, e497–e517. [Google Scholar] [CrossRef] [PubMed]
- Keller, K.E.; Peters, D.M. Pathogenesis of glaucoma: Extracellular matrix dysfunction in the trabecular meshwork—A review. Clin. Experiment. Ophthalmol. 2022, 50, 163–182. [Google Scholar] [CrossRef] [PubMed]
- Jayaram, H. Intraocular pressure reduction in glaucoma: Does every mmHg count? Taiwan J. Ophthalmol. 2020, 10, 255. [Google Scholar] [CrossRef]
- Rao, R.Q.; Arain, T.M.; Ahad, M.A. The prevalence of pseudoexfoliation syndrome in Pakistan. Hospital based study. BMC Ophthalmol. 2006, 6, 27. [Google Scholar] [CrossRef] [Green Version]
- Plateroti, P.; Plateroti, A.M.; Abdolrahimzadeh, S.; Scuderi, G. Pseudoexfoliation Syndrome and Pseudoexfoliation Glaucoma: A Review of the Literature with Updates on Surgical Management. J. Ophthalmol. 2015, 2015, 370371. [Google Scholar] [CrossRef] [Green Version]
- Al-Bdour, M.D.; Al-Till, M.I.; Idrees, G.M.; Abu Samra, K.M. Pseudoexfoliation syndrome at Jordan University Hospital. Acta Ophthalmol. 2008, 86, 755–757. [Google Scholar] [CrossRef]
- Krishnadas, R.; Nirmalan, P.K.; Ramakrishnan, R.; Thulasiraj, R.D.; Katz, J.; Tielsch, J.M.; Friedman, D.S.; Robin, A.L. Pseudoexfoliation in a rural population of southern India: The Aravind Comprehensive Eye Survey. Am. J. Ophthalmol. 2003, 135, 830–837. [Google Scholar] [CrossRef]
- Idakwo, U.; Olawoye, O.; Ajayi, B.G.K.; Ritch, R. Exfoliation syndrome in Northern Nigeria. Clin. Ophthalmol. 2018, 12, 271. [Google Scholar] [CrossRef] [Green Version]
- Åström, S.; Lindén, C. Incidence and prevalence of pseudoexfoliation and open-angle glaucoma in northern Sweden: I. Baseline report. Acta Ophthalmol. Scand. 2007, 85, 828–831. [Google Scholar] [CrossRef]
- Arnarsson, Á.M. Epidemiology of exfoliation syndrome in the Reykjavik Eye Study. Acta Ophthalmol. 2009, 87, 1–17. [Google Scholar] [CrossRef]
- Rumelaitiene, U.; Speckauskas, M.; Tamosiunas, A.; Radisauskas, R.; Peto, T.; Larsen, M.B.; Zaliūniene, D. Exploring association between pseudoexfoliation syndrome and ocular aging. Int. Ophthalmol. 2022, 1–11. [Google Scholar] [CrossRef]
- Palko, J.; Qi, O.; Sheybani, A. Corneal Alterations Associated with Pseudoexfoliation Syndrome and Glaucoma: A Literature Review. J. Ophthalmic Vis. Res. 2017, 12, 312. [Google Scholar] [CrossRef]
- Hammer, T.; Schlötzer-Schrehardt, U.; Naumann, G.O.H. Unilateral or Asymmetric Pseudoexfoliation Syndrome?: An Ultrastructural Study. Arch. Ophthalmol. 2001, 119, 1023–1031. [Google Scholar] [CrossRef] [Green Version]
- Eroglu, F.C.; Sekeroglu, M.A.; Ceran, T.H.; Simsek, M.; Hondur, G. Evaluation of lacrimal drainage system in Pseudoexfoliation syndrome. Eye 2021, 36, 2094–2098. [Google Scholar] [CrossRef]
- Mastronikolis, S.; Pagkalou, M.; Plotas, P.; Kagkelaris, K.; Georgakopoulos, C.D. Emerging roles of oxidative stress in the pathogenesis of pseudoexfoliation syndrome (Review). Exp. Ther. Med. 2022, 24, 602. [Google Scholar] [CrossRef]
- Padhy, B.; Alone, D.P. Is pseudoexfoliation glaucoma a neurodegenerative disorder? J. Biosci. 2021, 46, 97. [Google Scholar] [CrossRef]
- Elhawy, E.; Kamthan, G.; Dong, C.Q.; Danias, J. Pseudoexfoliation syndrome, a systemic disorder with ocular manifestations. Hum. Genom. 2012, 6, 22. [Google Scholar] [CrossRef] [Green Version]
- Ariga, M.; Nivean, M.; Utkarsha, P. Pseudoexfoliation Syndrome. J. Curr. Glaucoma Pract. 2022, 7, 118–120. [Google Scholar] [CrossRef]
- Yilmaz, A.; Tamer, L.; Ateş, N.A.; Çamdeviren, H.; Deǧirmenci, U. Effects of apolipoprotein E genotypes on the development of exfoliation syndrome. Exp. Eye Res. 2005, 80, 871–875. [Google Scholar] [CrossRef]
- Aung, T.; Ozaki, M.; Mizoguchi, T.; Allingham, R.R.; Li, Z.; Haripriya, A.; Nakano, S.; Uebe, S.; Harder, J.M.; Chan, A.S.Y.; et al. A common variant mapping to CACNA1A is associated with susceptibility to exfoliation syndrome. Nat. Genet. 2015, 47, 387–392. [Google Scholar] [CrossRef] [PubMed] [Green Version]
- Padhy, B.; Kapuganti, R.S.; Hayat, B.; Mohanty, P.P.; Alone, D.P. De novo variants in an extracellular matrix protein coding gene, fibulin-5 (FBLN5) are associated with pseudoexfoliation. Eur. J. Hum. Genet. 2019, 27, 1858–1866. [Google Scholar] [CrossRef] [PubMed]
- Aung, T.; Ozaki, M.; Lee, M.C.; Schlötzer-Schrehardt, U.; Thorleifsson, G.; Mizoguchi, T.; Igo, R.P.; Haripriya, A.; Williams, S.E.; Astakhov, Y.S.; et al. Genetic association study of exfoliation syndrome identifies a protective rare variant at LOXL1 and five new susceptibility loci. Nat. Genet. 2017, 49, 993. [Google Scholar] [CrossRef] [PubMed] [Green Version]
- Guo, Z.; Maki, M.; Ding, R.; Yang, Y.; Zhang, B.; Xiong, L. Genome-wide survey of tissue-specific microRNA and transcription factor regulatory networks in 12 tissues. Sci. Rep. 2014, 4, 5150. [Google Scholar] [CrossRef] [Green Version]
- Greene, K.M.; Stamer, W.D.; Liu, Y. The role of microRNAs in glaucoma. Exp. Eye Res. 2022, 215, 108909. [Google Scholar] [CrossRef]
- Cho, H.-K.; Seong, H.; Kee, C.; Song, D.H.; Kim, S.J.; Seo, S.W.; Kang, S.S. MicroRNA profiles in aqueous humor between pseudoexfoliation glaucoma and normal tension glaucoma patients in a Korean population. Sci. Rep. 2022, 12, 6217. [Google Scholar] [CrossRef]
- Etheridge, A.; Lee, I.; Hood, L.; Galas, D.; Wang, K. Extracellular microRNA: A new source of biomarkers. Mutat. Res. Fundam. Mol. Mech. Mutagen. 2011, 717, 85–90. [Google Scholar] [CrossRef] [Green Version]
- Weber, J.A.; Baxter, D.H.; Zhang, S.; Huang, D.Y.; Huang, K.H.; Lee, M.J.; Galas, D.J.; Wang, K. The microRNA spectrum in 12 body fluids. Clin. Chem. 2010, 56, 1733–1741. [Google Scholar] [CrossRef] [Green Version]
- Weiland, M.; Gao, X.H.; Zhou, L.; Mi, Q.S. Small RNAs have a large impact: Circulating microRNAs as biomarkers for human diseases. RNA Biol. 2012, 9, 850–859. [Google Scholar] [CrossRef] [Green Version]
- Zeng, L.; Cui, J.; Wu, H.; Lu, Q. The emerging role of circulating microRNAs as biomarkers in autoimmune diseases. Autoimmunity 2014, 47, 419–429. [Google Scholar] [CrossRef]
- Bartel, D.P. MicroRNAs: Genomics, Biogenesis, Mechanism, and Function. Cell 2004, 116, 281–297. [Google Scholar] [CrossRef] [Green Version]
- Ha, M.; Kim, V.N. Regulation of microRNA biogenesis. Nat. Rev. Mol. Cell Biol. 2014, 15, 509–524. [Google Scholar] [CrossRef]
- Naylor, S. Biomarkers: Current perspectives and future prospects. Expert Rev. Mol. Diagn. 2003, 3, 525–529. [Google Scholar] [CrossRef]
- Mayeux, R. Biomarkers: Potential Uses and Limitations. NeuroRx 2004, 1, 182–188. [Google Scholar] [CrossRef]
- Lei, B.; Tian, Z.; Fan, W.; Ni, B. Circular RNA: A novel biomarker and therapeutic target for human cancers. Int. J. Med. Sci. 2019, 16, 292. [Google Scholar] [CrossRef] [Green Version]
- Califf, R.M. Biomarker definitions and their applications. Exp. Biol. Med. 2018, 243, 213. [Google Scholar] [CrossRef]
- Vlachos, I.S.; Zagganas, K.; Paraskevopoulou, M.D.; Georgakilas, G.; Karagkouni, D.; Vergoulis, T.; Dalamagas, T.; Hatzigeorgiou, A.G. DIANA-miRPath v3.0: Deciphering microRNA function with experimental support. Nucleic Acids Res. 2015, 43, W460. [Google Scholar] [CrossRef]
- Shannon, P.; Markiel, A.; Ozier, O.; Baliga, N.S.; Wang, J.T.; Ramage, D.; Amin, N.; Schwikowski, B.; Ideker, T. Cytoscape: A software environment for integrated models of biomolecular interaction networks. Genome Res. 2003, 13, 2498–2504. [Google Scholar] [CrossRef]
- Ru, Y.; Kechris, K.J.; Tabakoff, B.; Hoffman, P.; Radcliffe, R.A.; Bowler, R.; Mahaffey, S.; Rossi, S.; Calin, G.A.; Bemis, L.; et al. The multiMiR R package and database: Integration of microRNA–Target interactions along with their disease and drug associations. Nucleic Acids Res. 2014, 42, e133. [Google Scholar] [CrossRef]
- Fan, Y.; Xia, J. miRNet-Functional Analysis and Visual Exploration of miRNA-Target Interactions in a Network Context. Methods Mol. Biol. 2018, 1819, 215–233. [Google Scholar]
- Doncheva, N.T.; Morris, J.H.; Gorodkin, J.; Jensen, L.J. Cytoscape StringApp: Network Analysis and Visualization of Proteomics Data. J. Proteome Res. 2019, 18, 623–632. [Google Scholar] [CrossRef] [PubMed]
- Bader, G.D.; Hogue, C.W.V. An automated method for finding molecular complexes in large protein interaction networks. BMC Bioinform. 2003, 4, 2. [Google Scholar] [CrossRef] [PubMed] [Green Version]
- Chin, C.H.; Chen, S.H.; Wu, H.H.; Ho, C.W.; Ko, M.T.; Lin, C.Y. cytoHubba: Identifying hub objects and sub-networks from complex interactome. BMC Syst. Biol. 2014, 8, S11. [Google Scholar] [CrossRef] [Green Version]
- Liu, Y.; Chen, Y.; Wang, Y.; Zhang, X.; Gao, K.; Chen, S.; Zhang, X. microRNA Profiling in Glaucoma Eyes With Varying Degrees of Optic Neuropathy by Using Next-Generation Sequencing. Invest. Ophthalmol. Vis. Sci. 2018, 59, 2955–2966. [Google Scholar] [CrossRef] [PubMed] [Green Version]
- Freddo, T.F. A Contemporary Concept of the Blood-Aqueous Barrier. Prog. Retin. Eye Res. 2013, 32, 181. [Google Scholar] [CrossRef] [Green Version]
- Bavamian, S.; Mellios, N.; Lalonde, J.; Fass, D.M.; Wang, J.; Sheridan, S.D.; Madison, J.M.; Zhou, F.; Rueckert, E.H.; Barker, D.; et al. Dysregulation of miR-34a links neuronal development to genetic risk factors for bipolar disorder. Mol. Psychiatry 2015, 20, 573–584. [Google Scholar] [CrossRef] [Green Version]
- Kosior-Jarecka, E.; Czop, M.; Gasińska, K.; Wróbel-Dudzińska, D.; Zalewski, D.P.; Bogucka-Kocka, A.; Kocki, J.; Żarnowski, T. MicroRNAs in the aqueous humor of patients with different types of glaucoma. Graefe’s Arch. Clin. Exp. Ophthalmol. 2021, 259, 2337–2349. [Google Scholar] [CrossRef]
- Tomczyk-Socha, M.; Kręcicka, J.; Misiuk-Hojło, M.; Turno-Kręcicka, A. MicroRNA Expression in Pseudoexfoliation Syndrome with the Use of Next-Generation Sequencing. Genes. 2022, 13, 582. [Google Scholar] [CrossRef]
- Gasińska, K.; Czop, M.; Kosior-Jarecka, E.; Wróbel-Dudzińska, D.; Kocki, J.; Żarnowski, T. Small Nucleolar RNAs in Pseudoexfoliation Glaucoma. Cells 2022, 11, 2738. [Google Scholar] [CrossRef]
- Jin, K.; Mao, X.O.; Eshoo, M.W.; Nagayama, T.; Minami, M.; Simon, R.P.; Greenberg, D.A. Microarray analysis of hippocampal gene expression in global cerebral ischemia. Ann. Neurol. 2001, 50, 93–103. [Google Scholar] [CrossRef]
- Catterall, W.A. Voltage-Gated Calcium Channels. Cold Spring Harb. Perspect. Biol. 2011, 3, a003947. [Google Scholar] [CrossRef]
- Christel, C.; Lee, A. Ca2 +-dependent modulation of voltage-gated Ca2 + channels. Biochim. Biophys. Acta Gen. Subj. 2012, 1820, 1243–1252. [Google Scholar] [CrossRef] [Green Version]
- Vranka, J.A.; Kelley, M.J.; Acott, T.S.; Keller, K.E. Extracellular matrix in the trabecular meshwork: Intraocular pressure regulation and dysregulation in glaucoma. Exp. Eye Res. 2015, 133, 112–125. [Google Scholar] [CrossRef] [Green Version]
- Rao, A.; Chakraborty, M.; Roy, A.; Sahay, P.; Pradhan, A.; Raj, N. Differential miRNA Expression: Signature for Glaucoma in Pseudoexfoliation. Clin. Ophthalmol. 2020, 14, 3025. [Google Scholar] [CrossRef]
- Hayat, B.; Padhy, B.; Mohanty, P.P.; Alone, D.P. Altered unfolded protein response and proteasome impairment in pseudoexfoliation pathogenesis. Exp. Eye Res. 2019, 181, 197–207. [Google Scholar] [CrossRef]
- Eivers, S.B.; Greene, A.G.; Dervan, E.; O’Brien, C.; Wallace, D. Prevalence of Pseudoexfoliation Glaucoma Risk-associated Variants within Lysyl Oxidase-like 1 in an Irish Population. J. Glaucoma 2020, 29, 417–422. [Google Scholar] [CrossRef]
- Hohberger, B.; Schlötzer-Schrehard, U.; Mardin, C.; Lämmer, R.; Munoz, L.; Kunze, R.; Herrmann, M.; Wallukat, G. Inhibitory and Agonistic Autoantibodies Directed Against the β2-Adrenergic Receptor in Pseudoexfoliation Syndrome and Glaucoma. Front. Neurosci. 2021, 15, 778. [Google Scholar] [CrossRef]
- Liu, Y.; Allingham, R.R. Molecular genetics in glaucoma. Exp. Eye Res. 2011, 93, 331–339. [Google Scholar] [CrossRef] [Green Version]
- Izzotti, A.; Bagnis, A.; Saccà, S.C. The role of oxidative stress in glaucoma. Mutat. Res. Mutat. Res. 2006, 612, 105–114. [Google Scholar] [CrossRef]
- Xu, K.; Li, S.; Yang, Q.; Zhou, Z.; Fu, M.; Yang, X.; Hao, K.; Liu, Y.; Ji, H. MicroRNA-145-5p targeting of TRIM2 mediates the apoptosis of retinal ganglion cells via the PI3K/AKT signaling pathway in glaucoma. J. Gene Med. 2021, 23, e3378. [Google Scholar] [CrossRef]
- Rong, R.; Wang, M.; You, M.; Li, H.; Xia, X.; Ji, D. Pathogenesis and prospects for therapeutic clinical application of noncoding RNAs in glaucoma: Systematic perspectives. J. Cell. Physiol. 2021, 236, 7097–7116. [Google Scholar] [CrossRef] [PubMed]
- Liu, H.; Xiu, Y.; Zhang, Q.; Xu, Y.; Wan, Q.; Tao, L. Silencing microRNA-29b-3p expression protects human trabecular meshwork cells against oxidative injury via upregulation of RNF138 to activate the ERK pathway. Int. J. Mol. Med. 2021, 47, 101. [Google Scholar] [CrossRef] [PubMed]
- Xi, X.; Chen, Q.; Ma, J.; Wang, X.; Xia, Y.; Wen, X.; Cai, B.; Li, Y. Acteoside protects retinal ganglion cells from experimental glaucoma by activating the PI3K/AKT signaling pathway via caveolin 1 upregulation. Ann. Transl. Med. 2022, 10, 312. [Google Scholar] [CrossRef] [PubMed]
- Irnaten, M.; Duff, A.; Clark, A.; O’brien, C. Intra-Cellular Calcium Signaling Pathways (PKC, RAS/RAF/MAPK, PI3K) in Lamina Cribrosa Cells in Glaucoma. J. Clin. Med. 2020, 10, 62. [Google Scholar] [CrossRef]
- Zhao, N.; Shi, J.; Xu, H.; Luo, Q.; Li, Q.; Liu, M. Baicalin suppresses glaucoma pathogenesis by regulating the PI3K/AKT signaling in vitro and in vivo. Bioengineered 2021, 12, 10187–10198. [Google Scholar] [CrossRef]
- Husain, S.; Ahmad, A.; Singh, S.; Peterseim, C.; Abdul, Y.; Nutaitis, M.J. PI3K/Akt Pathway: A Role in δ-Opioid Receptor–Mediated RGC Neuroprotection. Investig. Ophthalmol. Vis. Sci. 2017, 58, 6489. [Google Scholar] [CrossRef] [Green Version]
- Janaszak-Jasiecka, A.; Siekierzycka, A.; Bartoszewska, S.; Serocki, M.; Dobrucki, L.W.; Collawn, J.F.; Kalinowski, L.; Bartoszewski, R. eNOS expression and NO release during hypoxia is inhibited by miR-200b in human endothelial cells. Angiogenesis 2018, 21, 711. [Google Scholar] [CrossRef]
- Geng, Y.; Deng, L.; Su, D.; Xiao, J.; Ge, D.; Bao, Y.; Jing, H. Identification of crucial microRNAs and genes in hypoxia-induced human lung adenocarcinoma cells. Onco. Targets. Ther. 2016, 9, 4605. [Google Scholar]
- Pang, R.; Feng, S.; Cao, K.; Sun, Y.; Guo, Y.; Ma, D.; Pang, C.P.; Liu, X.; Qian, J.; Xie, Y.; et al. Association of serum retinol concentration with normal-tension glaucoma. Eye 2021, 36, 1820–1825. [Google Scholar] [CrossRef]
- Piccolella, M.; Cristofani, R.; Tedesco, B.; Chierichetti, M.; Ferrari, V.; Casarotto, E.; Cozzi, M.; Crippa, V.; Rusmini, P.; Galbiati, M.; et al. Retinoic Acid Downregulates HSPB8 Gene Expression in Human Breast Cancer Cells MCF-7. Front. Oncol. 2021, 11, 652085. [Google Scholar] [CrossRef]
- Cristofani, R.; Piccolella, M.; Crippa, V.; Tedesco, B.; Marelli, M.M.; Poletti, A.; Moretti, R.M. The Role of HSPB8, a Component of the Chaperone-Assisted Selective Autophagy Machinery, in Cancer. Cells 2021, 10, 335. [Google Scholar] [CrossRef]


| PEXG N = 9 | Cataract N = 9 | p-Value | ||
|---|---|---|---|---|
| Age (mean ± SD) | 77.56 ± 6.54 | 76.00 ± 6.95 | 0.6314 ^ | |
| Gender (N, %) | Male | 8 (88, 89%) | 8 (88, 89%) | 0.7647 # |
| Female | 1 (11, 11%) | 1 (11, 11%) | ||
| BCVA | 0.19 ± 0.17 | 0.42 ± 0.12 | 0.0047 ^ | |
| MAX IOP | 30.44 ± 13.1 | 15.67 ± 2.12 | 0.0042 ^ | |
| C/D | 0.91 ± 0.07 | 0.29 ± 0.15 | <0.0001 ^ | |
| RNFL | 61.22 ± 5.12 | 93.8 ± 5.61 | 0.0005 ^ | |
| MD | −22.55 ± 4.77 | −0.03 ± 0.98 | <0.0001 ^ | |
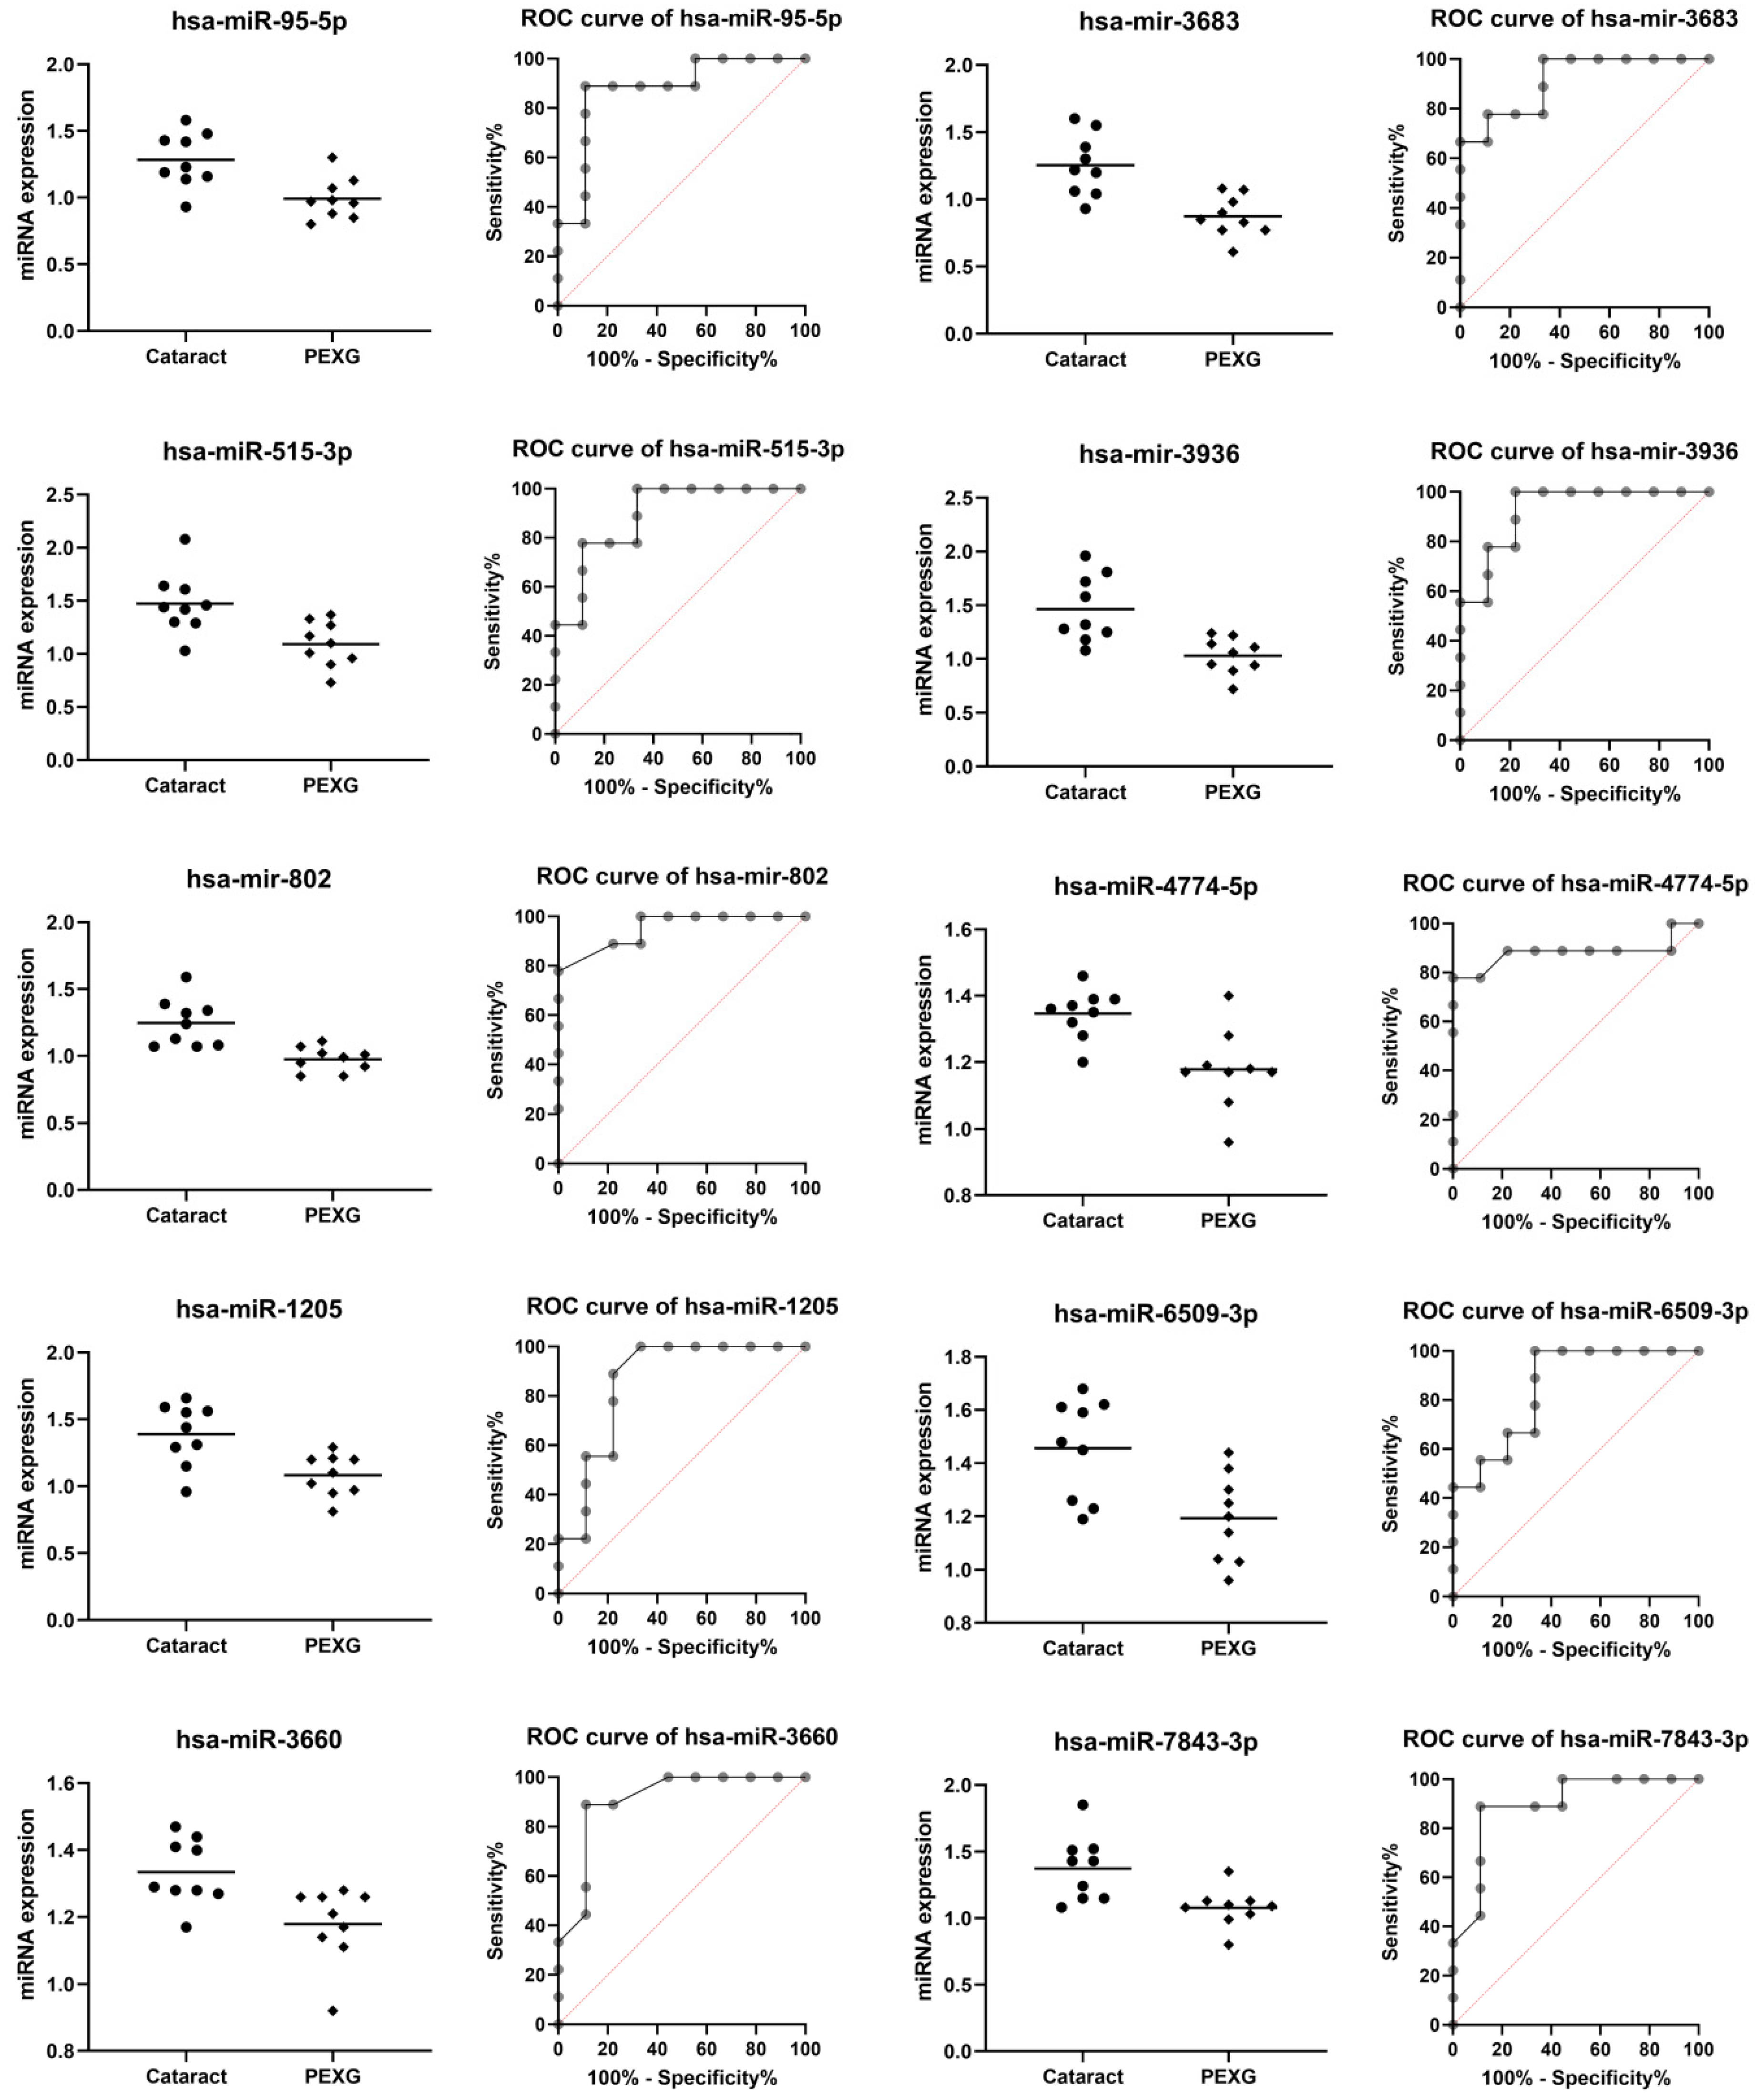
| miRNA | Group | n | Mean | SD | Fold Change | p Value | AUC | AUC p Value |
|---|---|---|---|---|---|---|---|---|
| hsa-miR-95-5p | Cataract | 9 | 1.284 | 0.206 | −1.25 | 0.0037 | 0.877 | 0.0071 |
| PEXG | 9 | 0.993 | 0.155 | |||||
| hsa-miR-515-3p | Cataract | 9 | 1.474 | 0.291 | −1.25 | 0.0060 | 0.889 | 0.0054 |
| PEXG | 9 | 1.093 | 0.213 | |||||
| hsa-mir-802 | Cataract | 9 | 1.248 | 0.179 | −1.20 | 0.0009 | 0.951 | 0.0013 |
| PEXG | 9 | 0.974 | 0.091 | |||||
| hsa-miR-1205 | Cataract | 9 | 1.390 | 0.232 | −1.26 | 0.0046 | 0.858 | 0.0104 |
| PEXG | 9 | 1.083 | 0.156 | |||||
| hsa-miR-3660 | Cataract | 9 | 1.334 | 0.099 | −1.08 | 0.0071 | 0.907 | 0.0036 |
| PEXG | 9 | 1.179 | 0.114 | |||||
| hsa-mir-3683 | Cataract | 9 | 1.254 | 0.229 | −1.30 | 0.0008 | 0.914 | 0.0031 |
| PEXG | 9 | 0.873 | 0.153 | |||||
| hsa-mir-3936 | Cataract | 9 | 1.464 | 0.311 | −1.29 | 0.0020 | 0.926 | 0.0023 |
| PEXG | 9 | 1.030 | 0.169 | |||||
| hsa-miR-4774-5p | Cataract | 9 | 1.347 | 0.074 | −1.13 | 0.0026 | 0.883 | 0.0062 |
| PEXG | 9 | 1.178 | 0.121 | |||||
| hsa-miR-6509-3p | Cataract | 9 | 1.457 | 0.187 | −1.21 | 0.0060 | 0.852 | 0.0118 |
| PEXG | 9 | 1.193 | 0.165 | |||||
| hsa-miR-7843-3p | Cataract | 9 | 1.373 | 0.244 | −1.22 | 0.0066 | 0.895 | 0.0047 |
| PEXG | 9 | 1.078 | 0.145 |
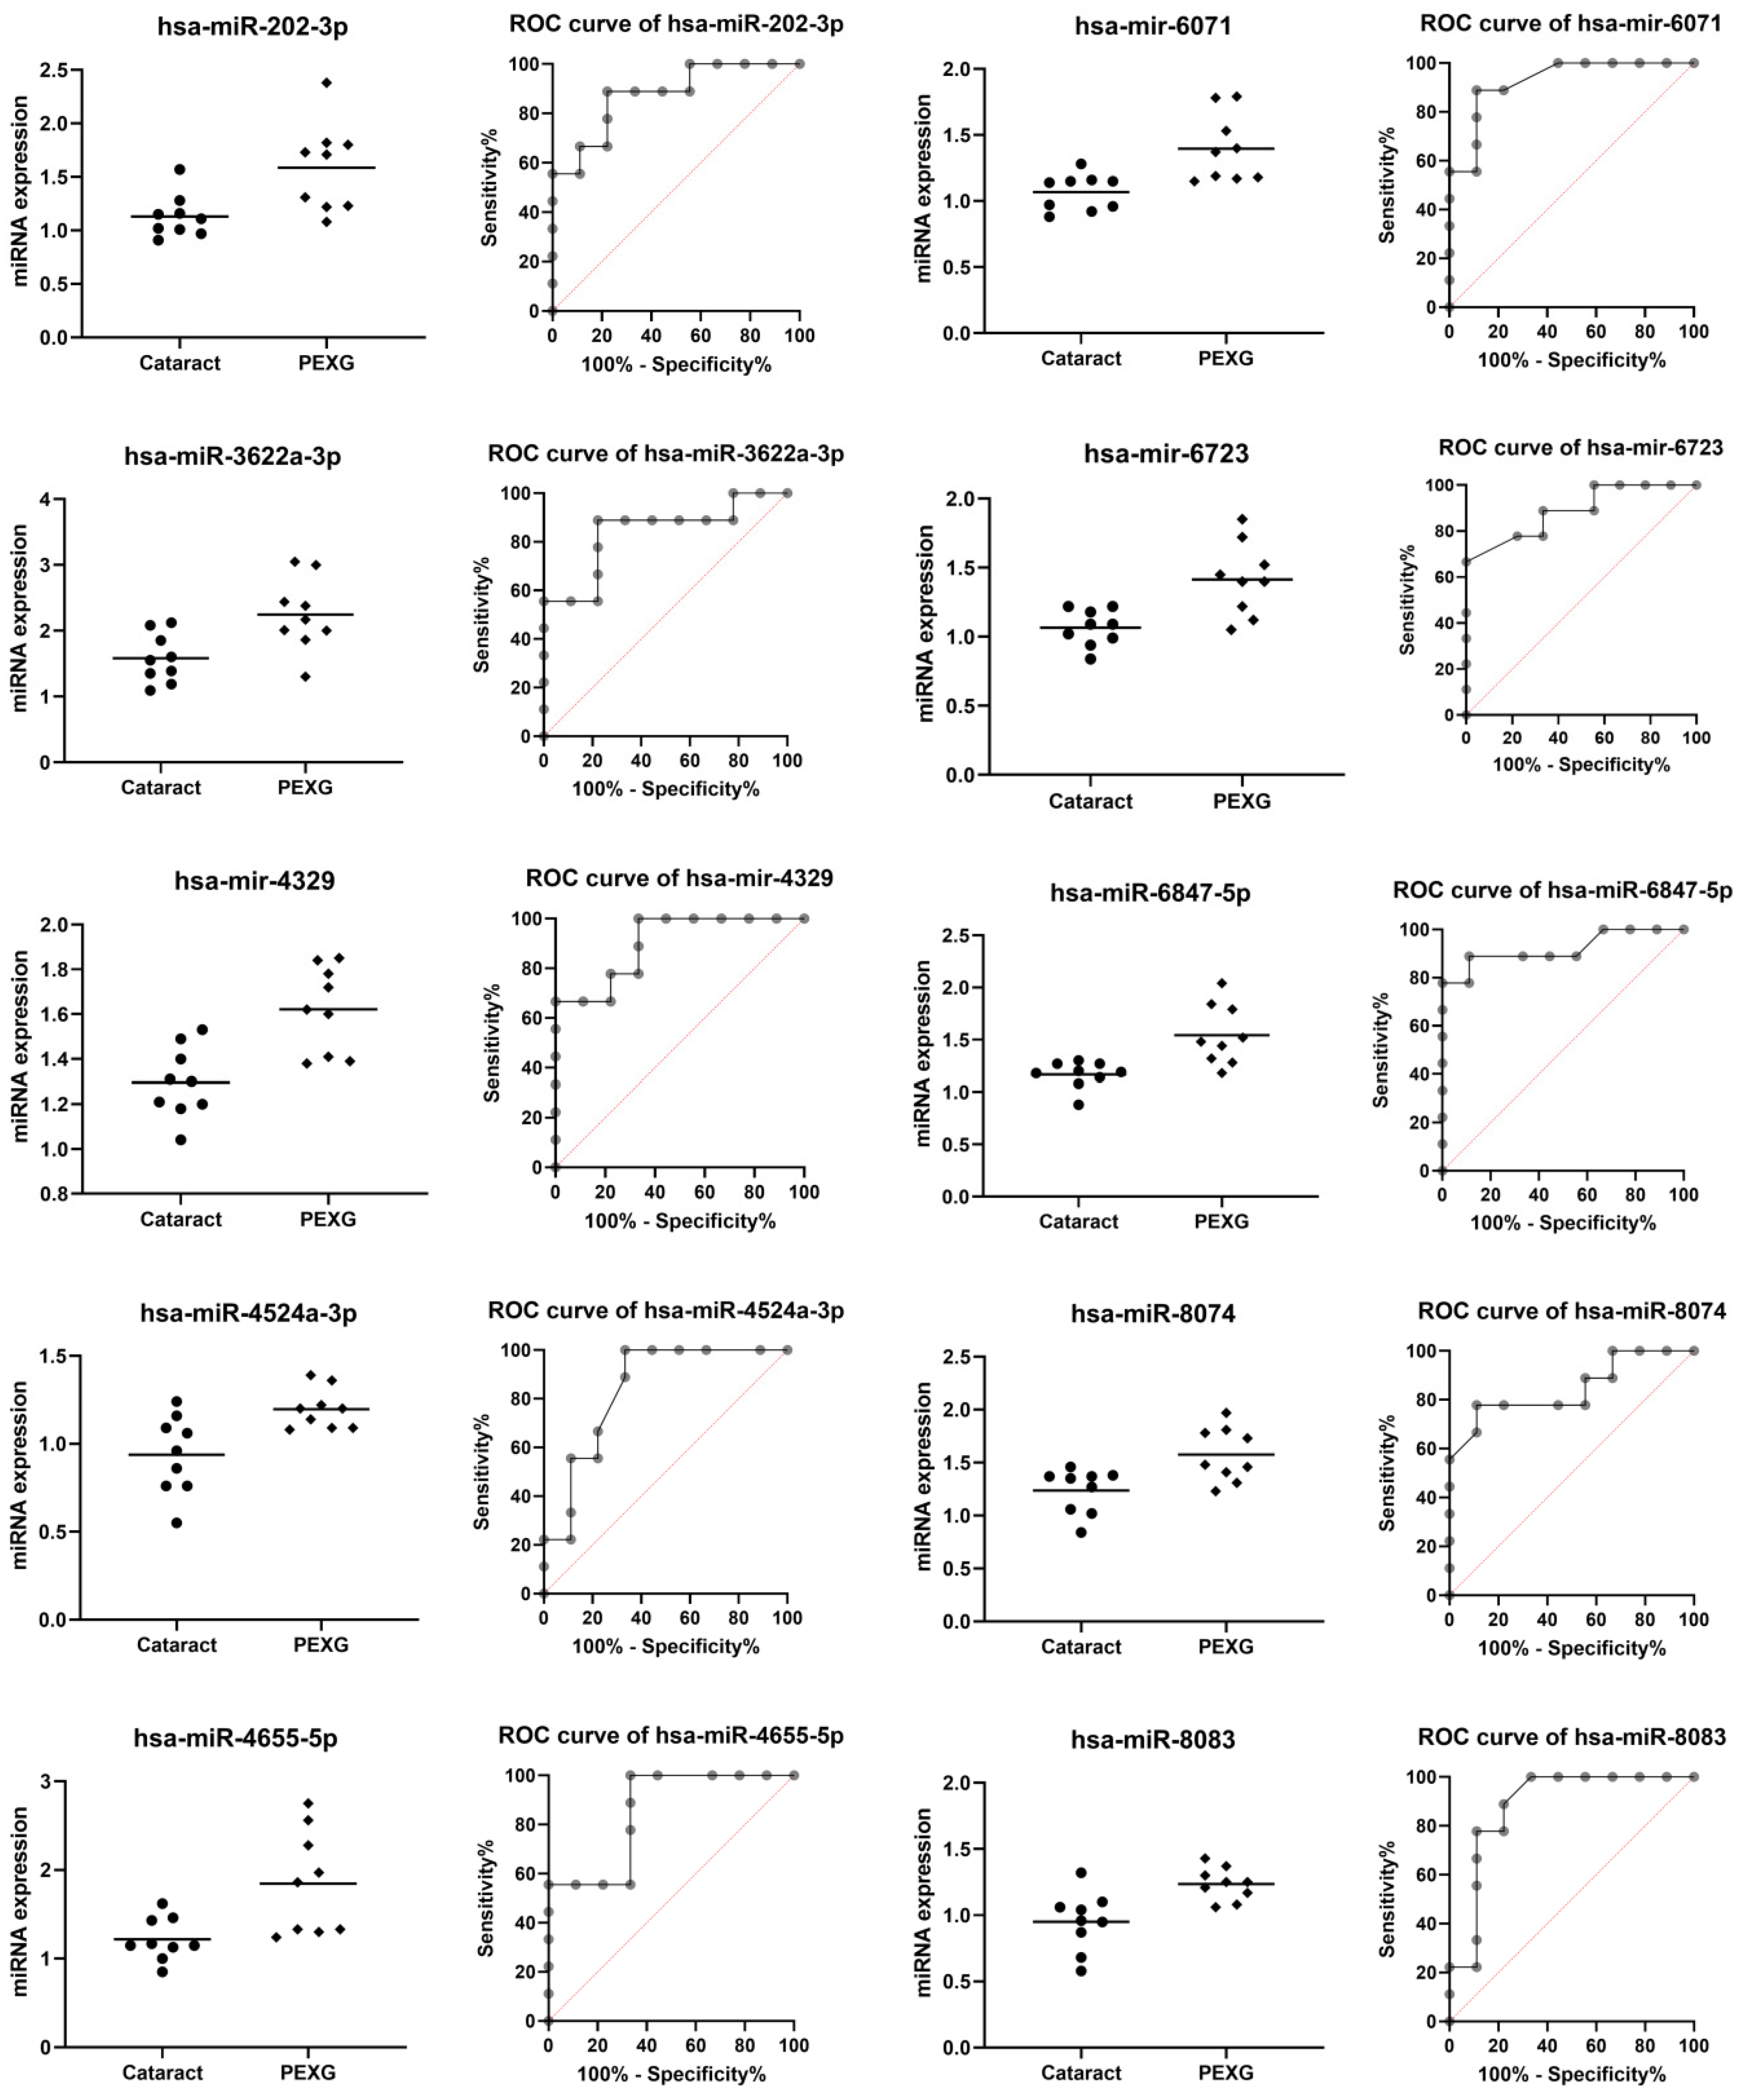
| miRNA | Group | N | Mean | SD | Fold Change | p Value | AUC | AUC p Value |
|---|---|---|---|---|---|---|---|---|
| hsa-miR-202-3p | Cataract | 9 | 1.131 | 0.199 | 1.43 | 0.0088 | 0.877 | 0.0071 |
| PEXG | 9 | 1.587 | 0.412 | |||||
| hsa-miR-3622a-3p | Cataract | 9 | 1.580 | 0.370 | 1.55 | 0.0084 | 0.840 | 0.0152 |
| PEXG | 9 | 2.246 | 0.552 | |||||
| hsa-mir-4329 | Cataract | 9 | 1.296 | 0.158 | 1.25 | 0.0012 | 0.901 | 0.0041 |
| PEXG | 9 | 1.621 | 0.191 | |||||
| hsa-miR-4524a-3p | Cataract | 9 | 0.938 | 0.223 | 1.18 | 0.0069 | 0.840 | 0.0152 |
| PEXG | 9 | 1.197 | 0.114 | |||||
| hsa-miR-4655-5p | Cataract | 9 | 1.218 | 0.242 | 2.17 | 0.0088 | 0.852 | 0.0118 |
| PEXG | 9 | 1.847 | 0.584 | |||||
| hsa-mir-6071 | Cataract | 9 | 1.068 | 0.137 | 1.23 | 0.0037 | 0.926 | 0.0023 |
| PEXG | 9 | 1.396 | 0.255 | |||||
| hsa-mir-6723-5p | Cataract | 9 | 1.066 | 0.131 | 1.25 | 0.0026 | 0.889 | 0.0054 |
| PEXG | 9 | 1.414 | 0.263 | |||||
| hsa-miR-6847-5p | Cataract | 9 | 1.168 | 0.128 | 1.24 | 0.0025 | 0.920 | 0.0027 |
| PEXG | 9 | 1.543 | 0.288 | |||||
| hsa-miR-8074 | Cataract | 9 | 1.236 | 0.211 | 1.16 | 0.0070 | 0.846 | 0.0134 |
| PEXG | 9 | 1.576 | 0.254 | |||||
| hsa-miR-8083 | Cataract | 9 | 0.951 | 0.222 | 1.20 | 0.0040 | 0.883 | 0.0062 |
| PEXG | 9 | 1.236 | 0.123 |
| Cluster | Category | Term | p Value | Genes |
|---|---|---|---|---|
| I | GO BP | Chromatin organization | 5.00 × 10⁻⁴ | EPC1, SETD7, SUZ12, EZH2, BCOR, AEBP2, TET3, PHF19 |
| GO BP | Negative regulation of gene expression, epigenetic | 0.0012 | EPC1, SUZ12, EZH2, AEBP2, PHF19 | |
| II | GO BP | Nuclear chromosome segregation | 2.70 × 10⁻⁴ | NIPBL, PDS5B, SMC1A, SYCP1, STAG1, DDX11 |
| GO BP | Cellular response to DNA damage stimulus | 0.0023 | NIPBL, CLOCK, PDS5B, SMC1A, SYCP1, DDX11, TIMELESS | |
| III | KEGG | MAPK signaling pathway | 5.60 × 10⁻⁴ | RASGRP2, CACNA2D1, CACNA1A, CACNA1E |
| GO:CC | Voltage-gated calcium channel complex | 0.0053 | CACNA2D1, CACNA1A, CACNA1E | |
| IV | GO:BP | Chromatin organization | 0.0012 | BPTF, CECR2, BAZ1B, HIST1H2BK, SMARCA1, DEK, H2AFX |
| Reactome | B-WICH complex positively regulates rRNA expression | 0.0042 | BAZ1B, HIST1H2BK, DEK, H2AFX | |
| V | Reactome | RAB GEFs exchange GTP for GDP on RABs | 0.0135 | RAB7A, RAB5B, RAB14 |
| GO:BP | Protein transport | 0.0260 | RAB7A, RAB5B, STX16, RAB14, PLEKHM1, TBC1D30 | |
| VI | GO:MF | Ubiquitin-protein transferase activity | 5.60 × 10⁻⁴ | RNF38, UBE2B, UBA7, UBE2H, UBE2D1, UBE2W |
| Reactome | Antigen processing: Ubiquitination & Proteasome degradation | 0.0013 | UBE2B, UBA7, UBE2H, UBE2D1, UBE2W |
| Cluster | Category | Term | p Value | Genes |
|---|---|---|---|---|
| VII | KEGG | Cytokine-cytokine receptor interaction | 4.03 × 10⁻¹⁴ | IFNG, TNFSF9, IL11, TNFSF4, TNFSF12, CXCL5, IL16, CD40LG, TNFRSF1B, IL10 |
| GO:BP | Positive regulation of cell–cell adhesion | 8.60 × 10⁻⁵ | IFNG, TNFSF9, TNFSF4, ICOS, CD40LG, IL10 | |
| VIII | GO:CC | RNA polymerase II, holoenzyme | 2.90 × 10⁻⁶ | POLR2D, TAF5, RPRD1B, GTF2F1, POLR2F |
| Reactome | RNA Polymerase III Abortive Additionally, Retractive Initiation | 4.94 × 10⁻⁶ | POU2F1, NFIB, NFIX, POLR3G, POLR2F | |
| IX | Reactome | Regulation of PTEN gene transcription | 8.30 × 10⁻⁴ | PHC2, CBX2, CBX6, PHC1 |
| GO:BP | Histone ubiquitination | 0.021 | PCGF3, RYBP, PHC1 | |
| X | GO:CC | Voltage-gated calcium channel complex | 1.29 × 10⁻¹⁷ | CACNG8, CACNA1D, CACNA1G, CACNA1E, CACNA1B, CACNA2D2, CACNA2D3, CACNB4 |
| GO:CC | L-type voltage-gated calcium channel complex | 0.0021 | CACNG8, CACNA1D | |
| XI | KEGG | Basal cell carcinoma | 7.70 × 10⁻⁴ | WNT16, AXIN1, FZD9 |
| GO:BP | Regulation of jnk cascade | 0.0119 | WNT16, AXIN1, AIDA, VANGL2 | |
| XII | Reactome | RHO GTPases Activate ROCKs | 5.88 × 10⁻⁵ | ROCK1, RHOA, PPP1R12B |
| KEGG | Phospholipase D signaling pathway | 0.0283 | RHOA, LPAR2 |
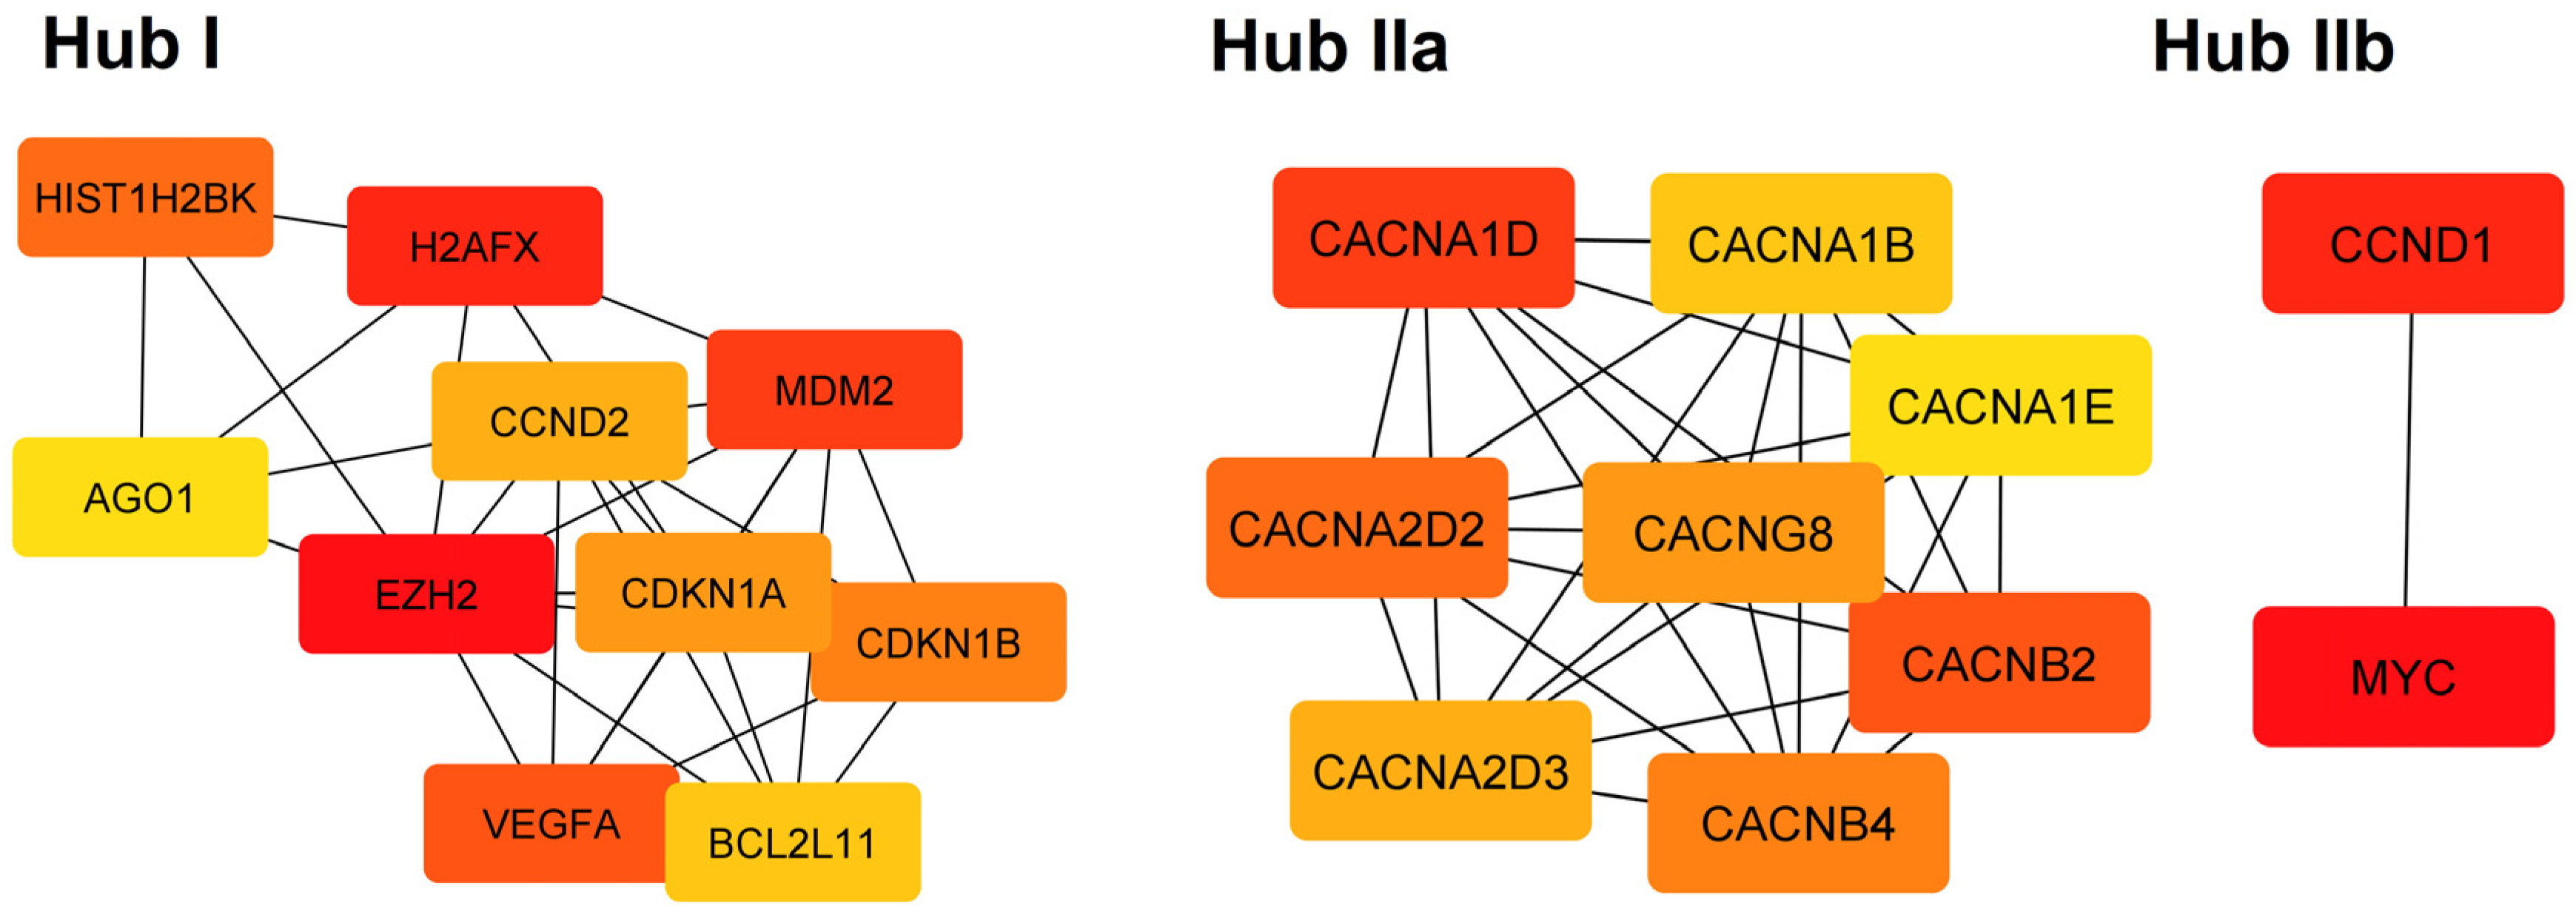
| Hub | Category | Term | p Value | Genes |
|---|---|---|---|---|
| I | Reactome | Generic Transcription Pathway | 9.79 × 10⁻⁷ | CDKN1B, MDM2, CCND2, EZH2, HIST1H2BK, AGO1, BCL2L11, CDKN1A, H2AFX, VEGFA |
| I | Reactome | Cellular responses to stress | 9.79 × 10⁻⁷ | CDKN1B, MDM2, EZH2, HIST1H2BK, AGO1, CDKN1A, H2AFX, VEGFA |
| I | Reactome | Cellular Senescence | 9.79 × 10⁻⁷ | CDKN1B, MDM2, EZH2, HIST1H2BK, AGO1, CDKN1A, H2AFX |
| I | KEGG | MicroRNAs in cancer | 1.55 × 10⁻⁶ | CDKN1B, MDM2, CCND2, EZH2, BCL2L11, CDKN1A, VEGFA |
| IIa | GO:CC | Voltage-gated calcium channel complex | 9.03 × 10⁻¹⁴ | CACNG8, CACNA1D, CACNB2, CACNA1E, CACNA1B, CACNA2D2, CACNA2D3, CACNB4 |
| IIa | GO:MF | Voltage-gated calcium channel activity | 3.10 × 10⁻¹³ | CACNG8, CACNA1D, CACNB2, CACNA1E, CACNA1B, CACNA2D2, CACNA2D3, CACNB4 |
| IIa | KEGG | MAPK signaling pathway | 1.92 × 10⁻¹⁰ | CACNG8, CACNA1D, CACNB2, CACNA1E, CACNA1B, CACNA2D2, CACNA2D3, CACNB4 |
| IIa | Reactome | Presynaptic depolarization and calcium channel opening | 4.50 × 10⁻⁹ | CACNB2, CACNA1E, CACNA1B, CACNA2D2, CACNA2D3, CACNB4 |
| IIb | KEGG | Cellular senescence | 0.0091 | CCND1, MYC |
| IIb | KEGG | Wnt signaling pathway | 0.0091 | |
| IIb | KEGG | Hippo signaling pathway | 0.0091 | |
| IIb | KEGG | JAK-STAT signaling pathway | 0.0091 |
Disclaimer/Publisher’s Note: The statements, opinions and data contained in all publications are solely those of the individual author(s) and contributor(s) and not of MDPI and/or the editor(s). MDPI and/or the editor(s) disclaim responsibility for any injury to people or property resulting from any ideas, methods, instructions or products referred to in the content. |
© 2023 by the authors. Licensee MDPI, Basel, Switzerland. This article is an open access article distributed under the terms and conditions of the Creative Commons Attribution (CC BY) license (https://creativecommons.org/licenses/by/4.0/).
Share and Cite
Czop, M.; Gasińska, K.; Kosior-Jarecka, E.; Wróbel-Dudzińska, D.; Kocki, J.; Żarnowski, T. Twenty Novel MicroRNAs in the Aqueous Humor of Pseudoexfoliation Glaucoma Patients. Cells 2023, 12, 737. https://doi.org/10.3390/cells12050737
Czop M, Gasińska K, Kosior-Jarecka E, Wróbel-Dudzińska D, Kocki J, Żarnowski T. Twenty Novel MicroRNAs in the Aqueous Humor of Pseudoexfoliation Glaucoma Patients. Cells. 2023; 12(5):737. https://doi.org/10.3390/cells12050737
Chicago/Turabian StyleCzop, Marcin, Karolina Gasińska, Ewa Kosior-Jarecka, Dominika Wróbel-Dudzińska, Janusz Kocki, and Tomasz Żarnowski. 2023. "Twenty Novel MicroRNAs in the Aqueous Humor of Pseudoexfoliation Glaucoma Patients" Cells 12, no. 5: 737. https://doi.org/10.3390/cells12050737