
Raman Spectroscopy Spectral Fingerprints of Biomarkers of Traumatic Brain Injury


Abstract
:1. Introduction
2. Materials and Methods
2.1. TBI Biomarkers
2.2. Reference Chemicals

2.3. Raman Spectroscopy
2.4. Data Analysis
3. Results and Discussion

| Biomarker | Source | Physiological Function | TBI Role | TBI Response | Reference |
|---|---|---|---|---|---|
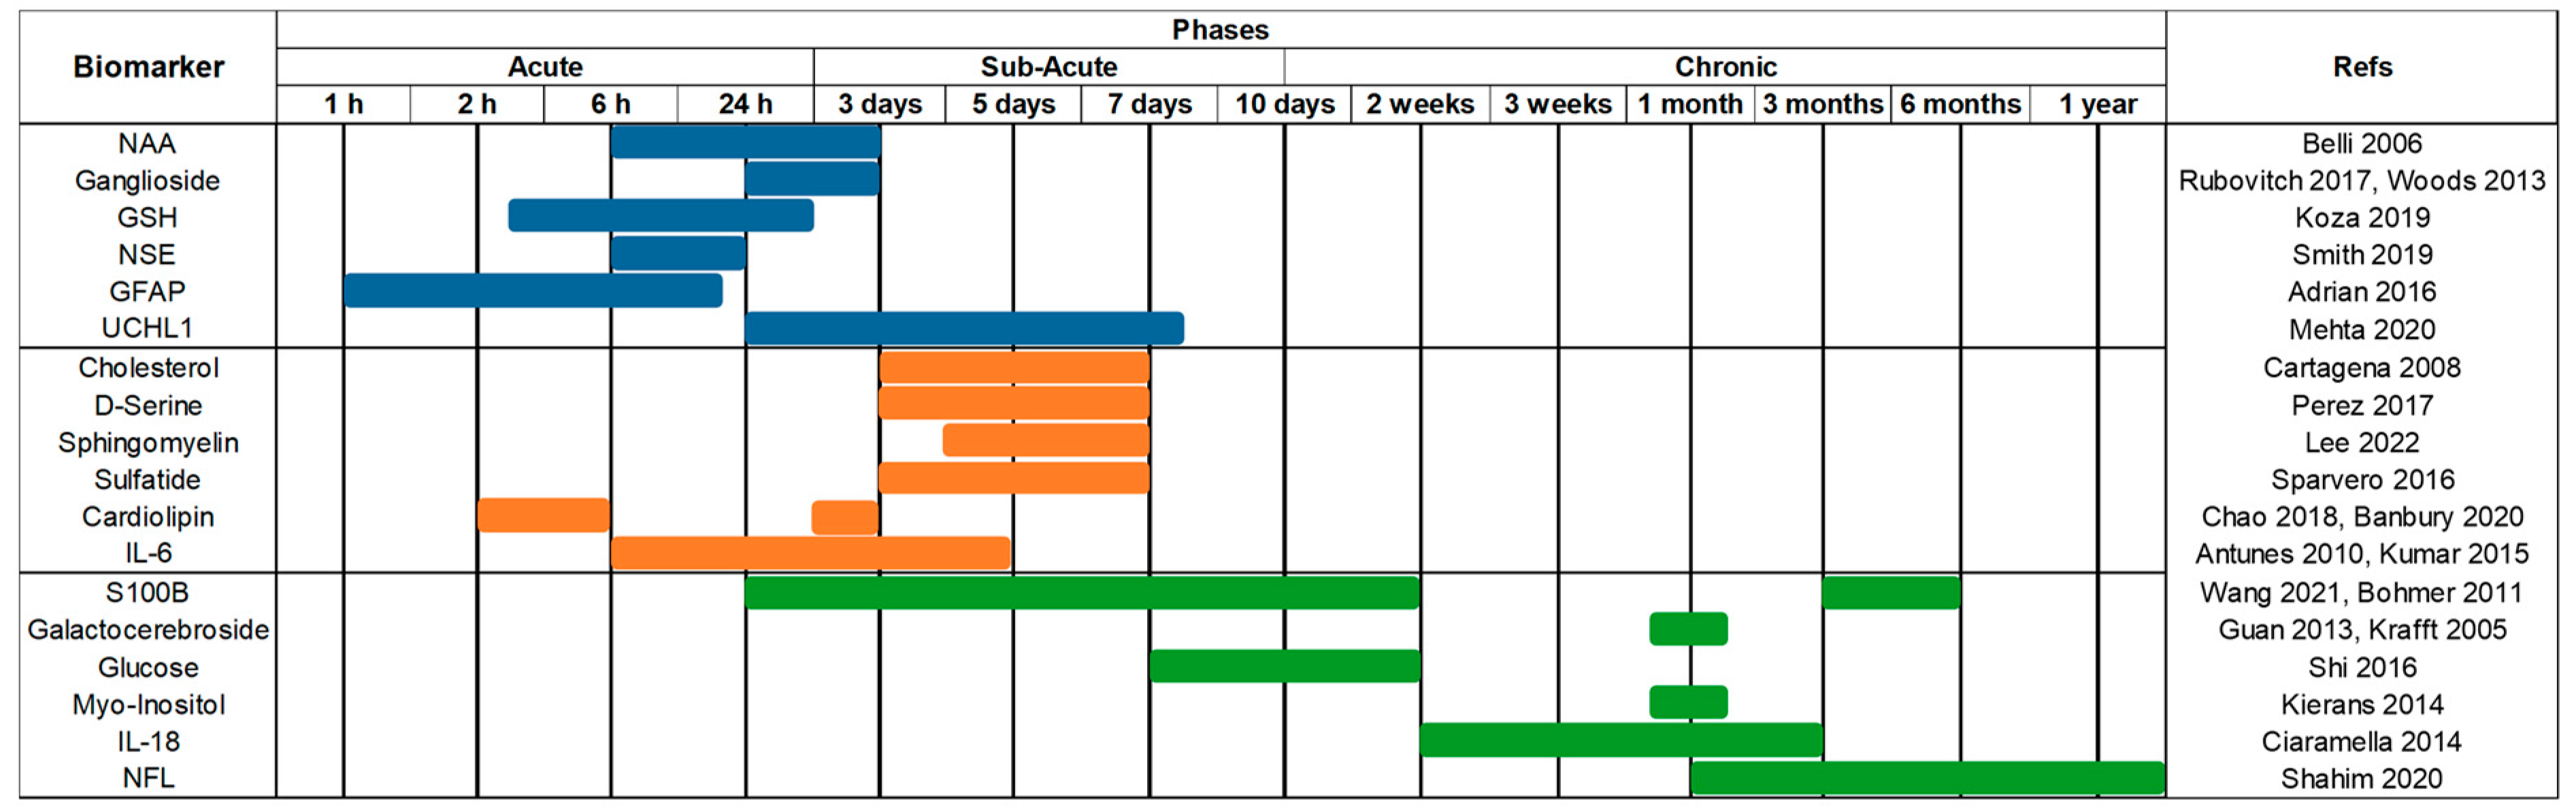
| NAA | Blood CSF | Synthesised in neurons, specific to the nervous system. Has roles in maintaining myelin lipid synthesis and in promoting neuronal mitochondria ATP production. | Marks injury type. Depletion in grey matter and white matter represent neuronal loss and axonal damage, respectively. Rate of replenishment is inversely proportional to injury severity. | ↓ | [33,67,68] |
| Ganglioside | Serum CSF Brain | Cellular signalling, protein, and ion channel modulator. Main carrier of sialic acid in the nervous system, improving intercellular communications. | Functional disruption causes neurodegeneration, cellular dysfunctions and promotes disease pathogenesis. | ↑ | [69] |
| GSH | Blood CSF | Essential antioxidant, converted from its reduced state (GSH) to its oxidised form to regulate free radicals from the brain. | GSH depletion coupled with neuroinflammation leads to build-up of free radicals, further damaging the brain and neurons. | ↓ | [61,70] |
| NSE | CSF | Tissue-specific cytosol-based enzymes, upon stimulation they translocate to the cell surface to act as a plasminogen receptors. | The degree of damage is directly correlated to the amount of NSE expressed. | ↑ | [71] |
| GFAP | Blood CSF | Intermediate filament III protein. Maintains glial cytoskeleton structure, neighbouring neurons, and blood-brain barrier (BBB). | Post-trauma, astroglial cells undergo astrogliosis, causing cellular hypertrophy and increased GFAP expression. Excess GFAP can cause glial scars in brain tissue which delays axon regeneration. | ↑ | [72,73,74] |
| UCHL1 | Blood CSF | A brain-specific enzyme features in the ubiquitin-proteasome pathway to maintain axonal protein integrity. Regulates axonal transport, structure, and synapsis. | Selectively increases upon axonal damage, utilised to remove damaged and defective proteins from axons. | ↑ | [75,76] |
| Cholesterol | CSF Brain Serum | Key component of the cellular membrane, maintaining structure and fluidity. Cholesterol and phospholipids are transported to nerve cells for repair, upkeep and to promote neurite proliferation. | Increased cholesterol is in proportion to cellular damage. Removing excess cholesterol has an anti-inflammatory effect. Dysregulation of brain cholesterol negatively affects neuronal and glial function. Cholesterol builds up from dysregulation causes cellular toxicity. | ↑ | [64,77,78,79,80] |
| D-Serine | Brain CSF Blood | α-amino acid, abundant in the brain. Binds to N-methyl-d-aspartate (NMDA) and δ2 glutamate receptors to contribute to learning and memory function. | Reactive glial cells become D-Serine synthesisers under inflammatory conditions, causing NMDA receptor hyperactivation, and leading to hippocampal synaptic damage. | ↑ | [81] |
| Sphingomyelin | CSF Blood | Vital in regulation of cellular growth rate, differentiation, and death in the central nervous system. Supports myelination in the brain, and aids in cognitive maturation and regulation of inflammatory responses. | Increased levels are reported in the hippocampus over 12 months after TBI, contributing to neurological disease pathogenesis. Breakdown products regulate the sphingomyelin cycle which inhibits protein kinase c, regulating neuronal signal transduction and function. | ↑ | [82,83,84,85,86] |
| Sulfatides | Brain CSF Serum | Abundant in myelin sheath and myelinating cells. Negatively regulates and improves oligodendrocyte differentiation and survival. Maintains myelin and axonal-glial signalling. | Effects functional properties of the membrane, and dysregulation of sulfatides can lead to seizures. | ↓ | [87] |
| Cardiolipin | Inner Mitochondrial Membrane | Involved in regulating mitochondrial metabolism. The structural component of mitochondrial membranes regulates protein and enzyme activity central to mitochondrial function. | Damaged mitochondria trigger neuronal death when oxidised. Cardiolipin acts as an elimination signal for damaged mitochondria, thus limiting neuronal damage and preserving cognitive functions. | ↑ | [88,89,90] |
| IL-6 | CSF Serum Blood | Pleiotropic cytokine with operations in immunity regulation, regeneration processes, neural functions, and cardiovascular protective mechanisms. | Usually undetectable in healthy brain parenchyma but present within an hour following TBI. Upregulated production following trauma from inflammatory cascades to salvage neurons. Sustained inflammation is ultimately damaging. | ↑ | [52,91,92,93] |
| S100B | Blood CSF Brain | Calcium-binding protein involved in long-term synaptic plasticity modulation, cellular growth and structure, calcium concentration maintenance, and energy metabolism. Mitigates mitochondrial failure through calcium modulation. | Overexpression leads to disrupted calcium homeostasis. Increased levels indicate structural damage and cellular death. | ↑ | [94,95] |
| Galactocerebroside | CSF Brain | Major lipid component in the brain, which maintains myelin sheath structure and stability. Important for development of normal myelin in the central nervous system. | Galactosylcerimidase dysfunction prevents Galactocerebroside from degrading, instead it accumulates in globoid cells in the brain, leading to white matter diseases. | ↑ | [55,96,97] |
| Glucose | Blood | Main energy source to the brain, used for action potential and postsynaptic potential generation. Synthesises BBB-regulated neuroactive compounds and sustains brain homeostasis. | Early low glucose levels and low lactate/glucose ratio post-TBI are associated with poor outcomes. Not associated with ischemia. | ↓ | [98,99,100] |
| Myo-Inositol | CSF Blood | Regulates glial and neuronal activity and participates in intracellular signalling pathways. Regulates intracellular [Ca2+] and membrane permeability. | Increased levels are correlated to glial proliferation, increased rate of membrane turnover, and myelin sheath damage. Correlated to astrogliosis and dysregulation of cellular osmotic functions. | ↑ | [101,102,103,104] |
| IL-18 | CSF | Inducer of inflammatory cytokines; synthesised as an inactive precursor in microglia and activated by caspase-1 in a forward loop. | Has roles in neuroinflammation and neurodegeneration. Induces respiratory burst and degranulation of polymorphonuclear leukocytes resulting in a release of neurotoxic enzymes. | ↑ | [105,106] |
| NFL | CSF Blood | Integral in maintaining axonal cytoskeleton through radial growth. Larger myelinated axons result in more NFL, leading to faster conduction speed. | NFL levels rapidly increase following trauma to account for damaged axons and NFL is released into the interstitial space and integrated into CSF. Indicates significant axonal damage and progression rate of disease. | ↑ | [107,108,109] |
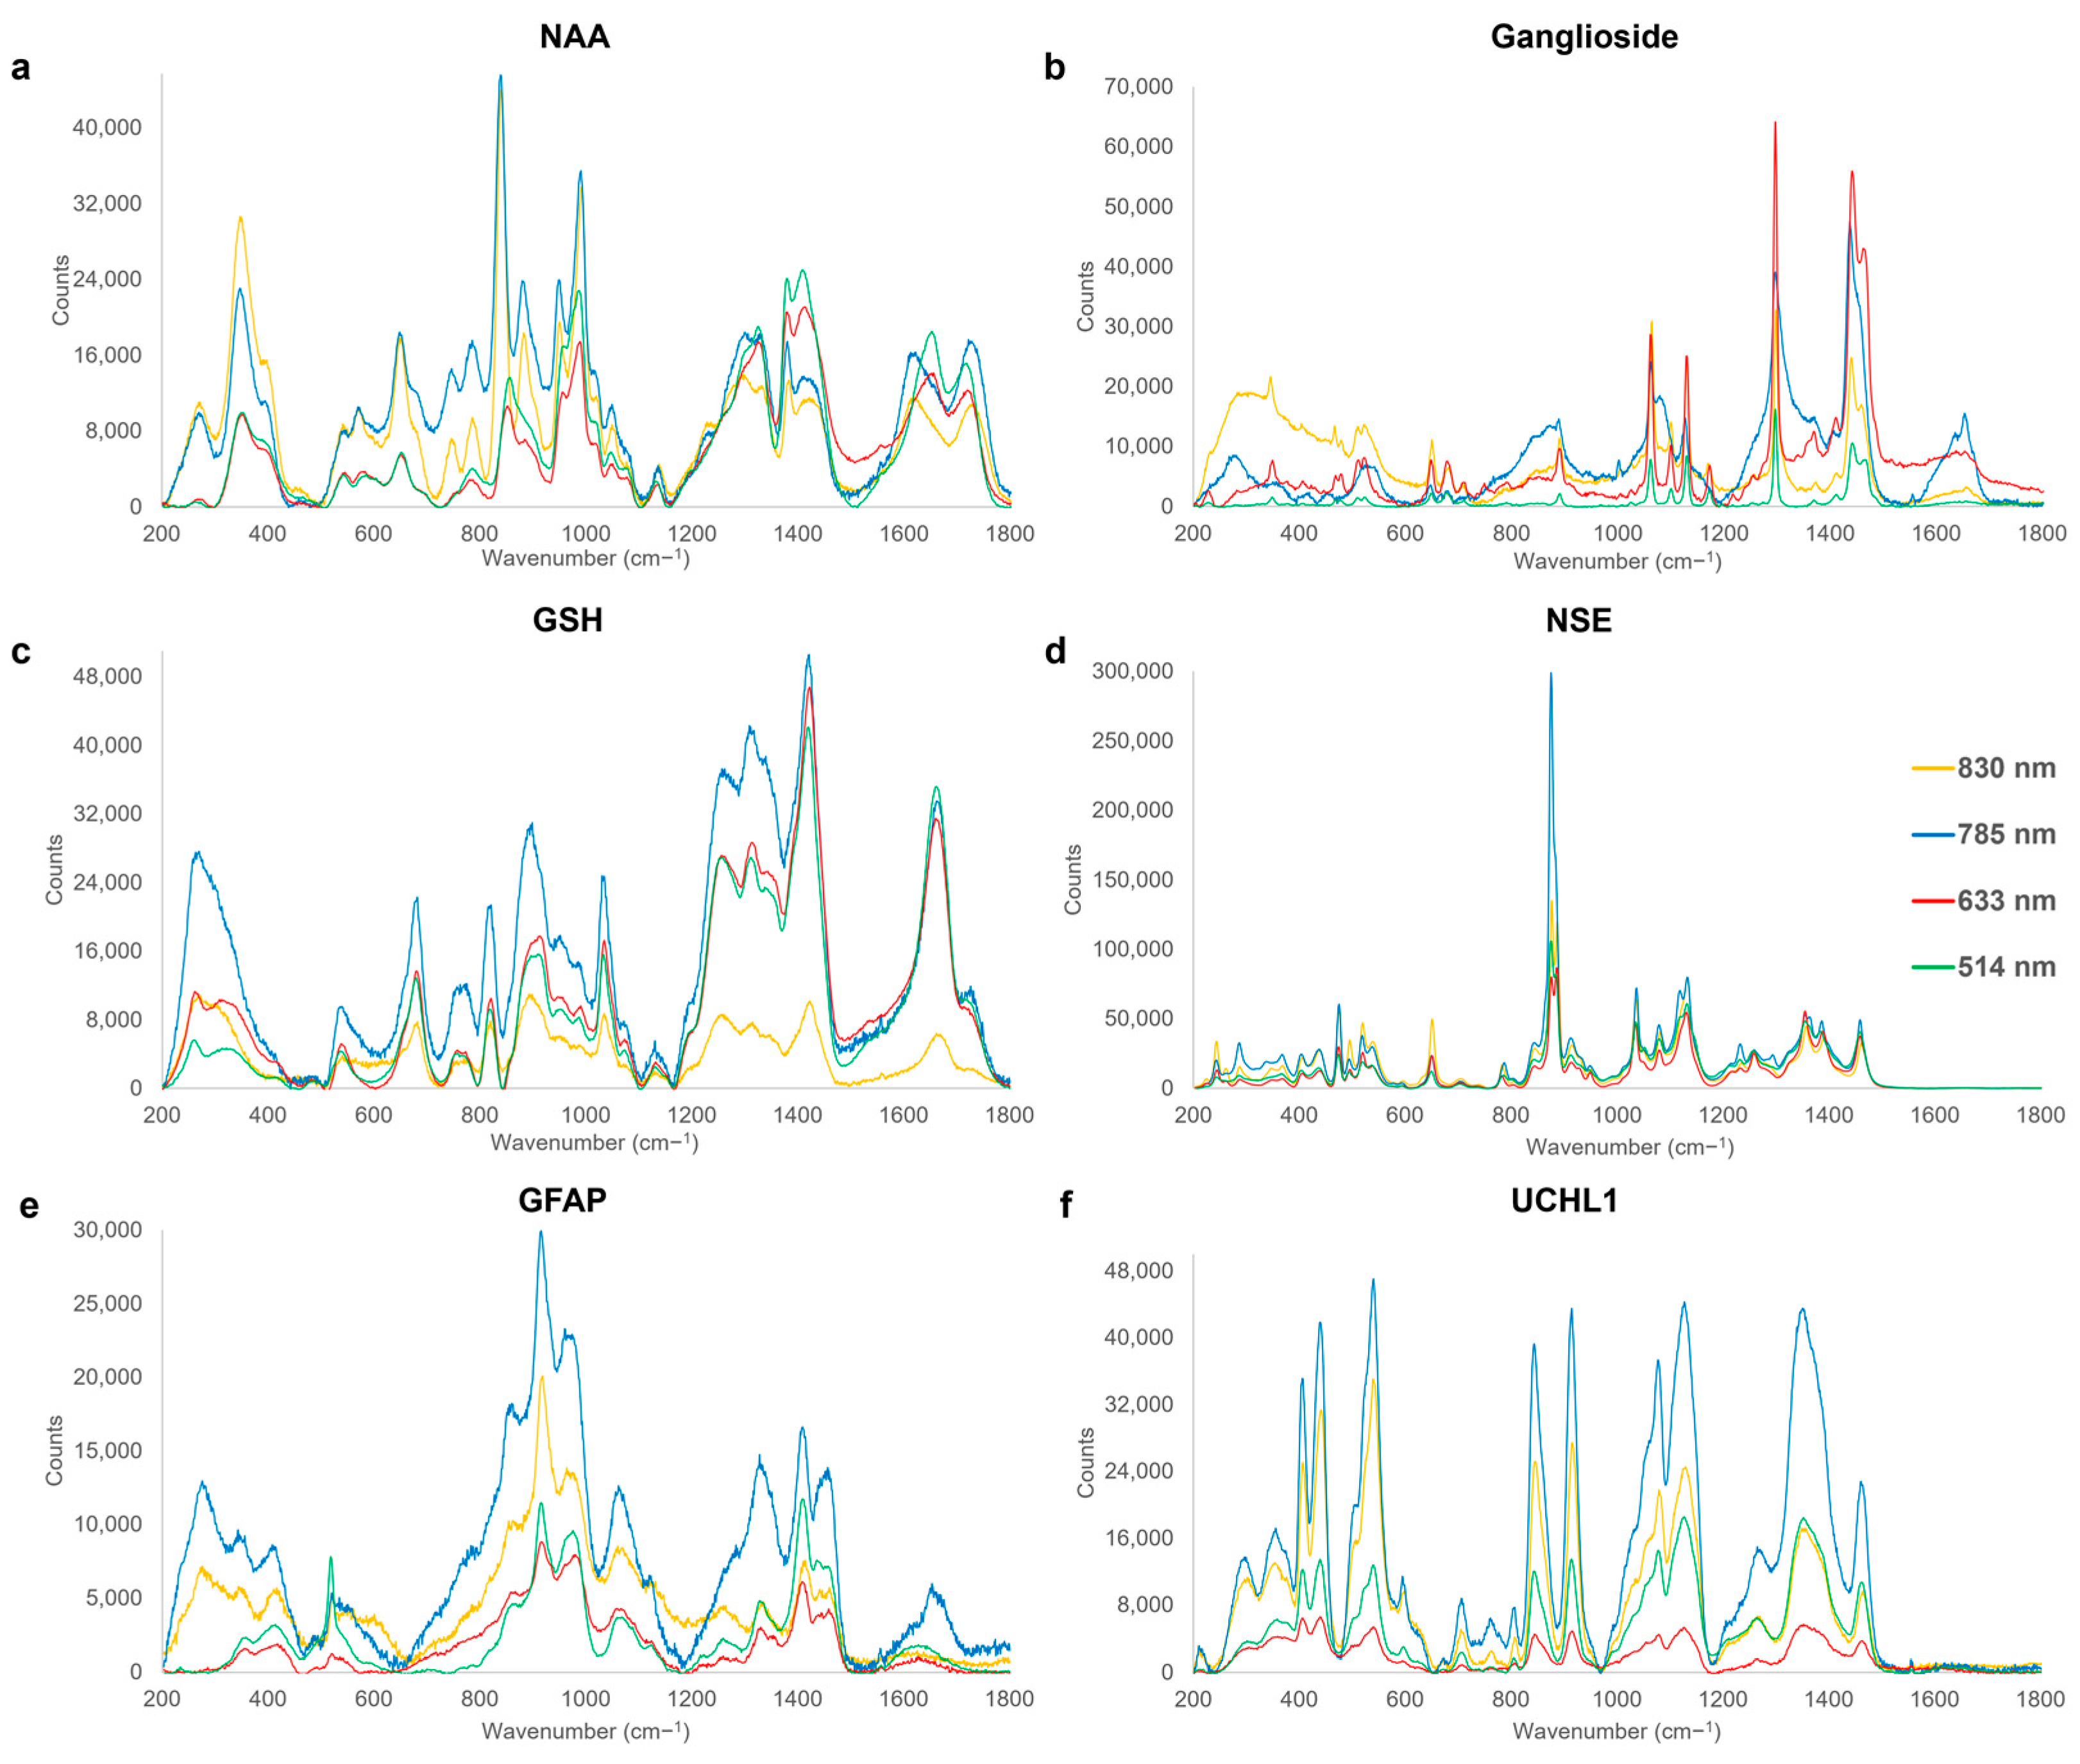
3.1. Acute Phase

| Wavenumber (cm−1) | Assignment | Origin | Reference |
|---|---|---|---|
| 347–353 | vskel(C-C) | NAA | [112] |
| 473–475 | v(S-S) | NSE | [125] |
| 518–521 | C(OH), Ring deformation | GFAP | [112,119] |
| 647–651 | v(C-S), τ(C-C), Ring breathing mode | NAA, NSE, Ganglioside | [119,126,127] |
| 679–682 | v(C-S) | GSH | [119] |
| 705–708 | Ring deformation | UCHL1 | [119] |
| 806 | vs(C-N-C) | UCHL1 | [112] |
| 819–821 | CH deformation | GSH | [112] |
| 843–845 | δ(H(C-O-H)), ρ(H(C-O-H)) | UCHL1 | [119] |
| 875–877 | v(C-C), va(C-N) | NSE | [55,119] |
| 889–891 | varom(C-O), v(C-C), ω(CH2) | Ganglioside | [128,129,130] |
| 914–918 | v(C-N), Pyranose ring asymmetric vibration | GFAP, UCHL1 | [112,119] |
| 949–957 | v(C-N) | NAA | [112] |
| 974–980 | va(C-C), ρ(CH2) | GFAP | [119,131] |
| 987–992 | v(C-N), ω(CH2- CH) | NAA | [112] |
| 1031–1037 | δ(C-H), v(C-C), va(C-C-N+) | GSH, NSE | [132,133] |
| 1060–1068 | v(C-O), vskel(C-C), τ(NH2) | Ganglioside, GFAP | [119,124,134] |
| 1077–1082 | v(C-O), v(C-C), τ(CH2) | NSE, UCHL1 | [120,121] |
| 1127–1130 | v(C-N), v(C-C) | Ganglioside, UCHL1 | [135,136] |
| 1131–1138 | v(C-C) | NAA | [137] |
| 1297–1298 | τ(CH2) | Ganglioside | [114] |
| 1311–1315 | δ(C-H) | GSH | [138] |
| 1328–1336 | ω(CH2), τ(CH2) | GFAP | [119] |
| 1352–1354 | τ(CH2) | UCHL1 | [121] |
| 1378–1383 | vs(COO−) | NAA | [139] |
| 1408–1410 | δ(C-H), vs(COO−) | GFAP | [119,123] |
| 1420–1424 | δ(CH2), vs(COO−), vs(CO2) | GSH | [116,117,138] |
| 1437–1442 | δ(CH2), τ(CH2) | Ganglioside | [113] |
| 1458–1460 | δ(CH2) | NSE | [140] |
| 1660–1662 | v(C-N(H)-C=O), v(C=C) | GSH | [112] |
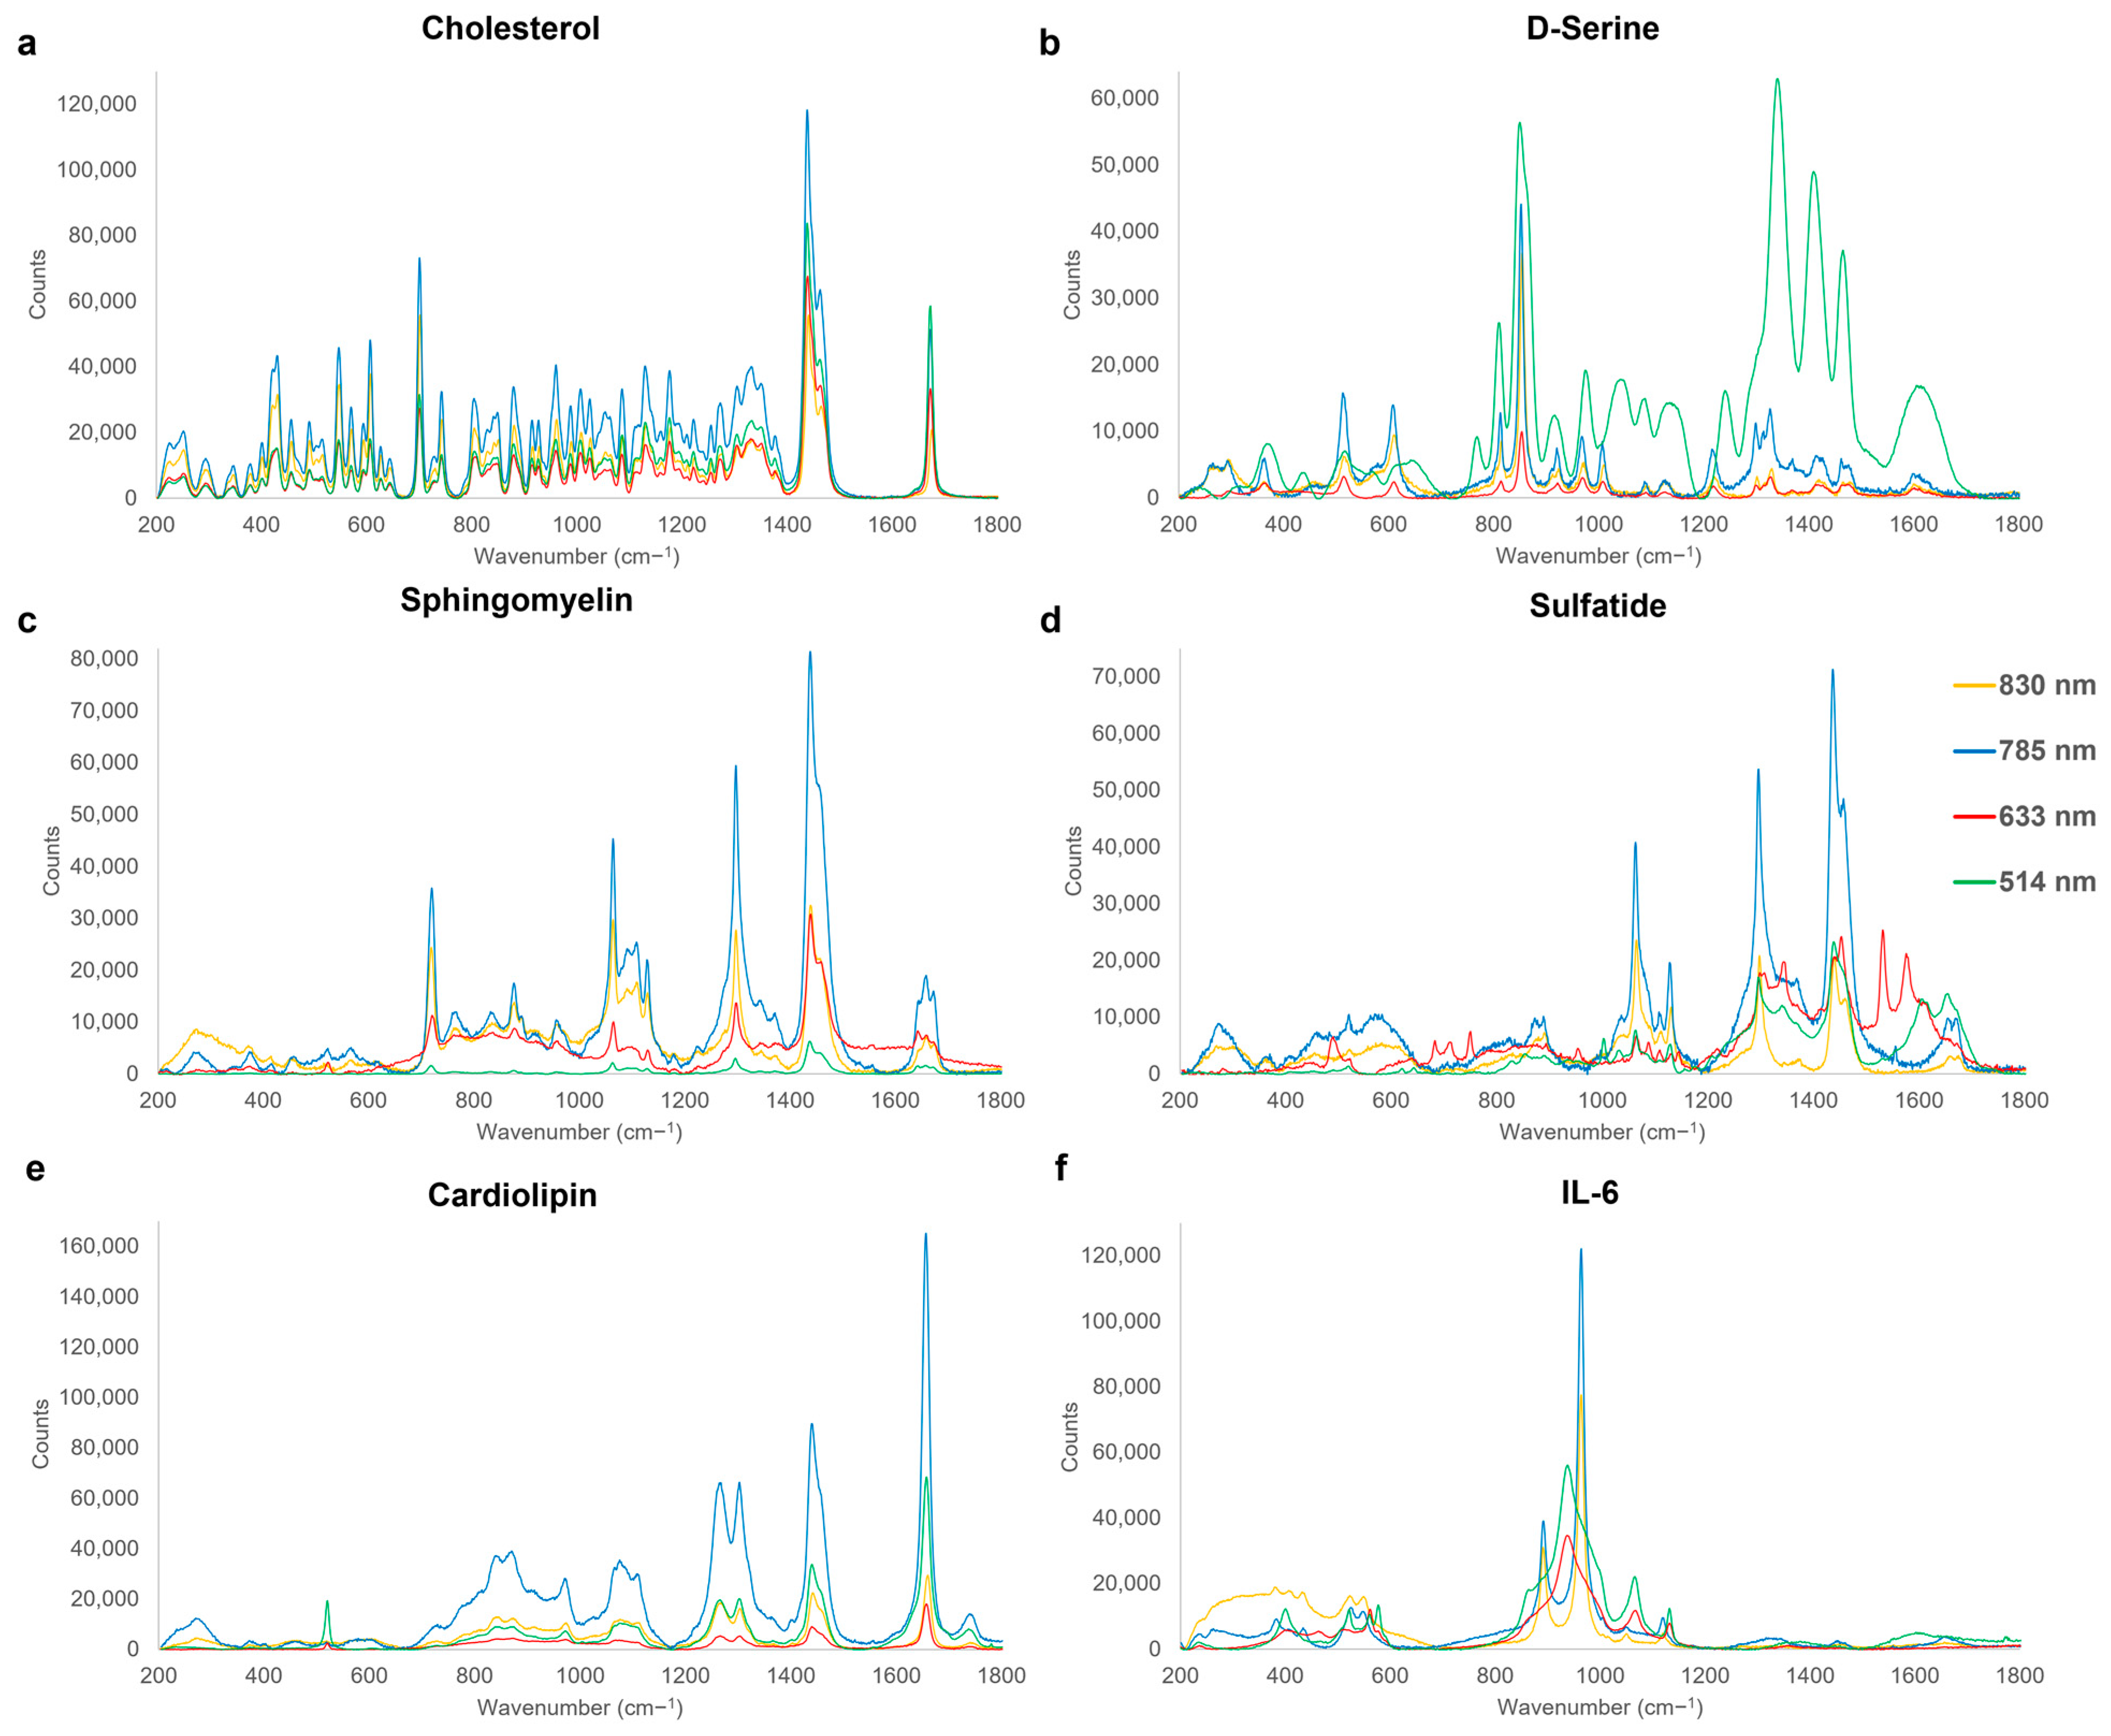
3.2. Sub-Acute Phase

| Wavenumber (cm−1) | Assignment | Origin | References |
|---|---|---|---|
| 512–516 | ρ(COO−) | D-Serine | [140] |
| 520–525 | δ(N-C=O) | IL-6 | [112] |
| 549 | δ(N-C-S) | IL-6 | [112] |
| 561 | -OH out of plane deformation | IL-6 | [112] |
| 700–702 | In-plane deformation of B ring | Cholesterol | [143] |
| 717–720 | vs(C-N) | Sphingomyelin | [119] |
| 809–815 | v(C-C) | D-Serine | [112] |
| 850–854 | ρ(CH2) | D-Serine | [140] |
| 888–893 | varom(C-O)4, v(C-C), ω(CH2) | Sulfatide | [128,129,130] |
| 917–923 | v(C-C) | D-Serine | [140] |
| 959–964 | PO4 vibration, vs(C-N-C), δ(C-H) | Cholesterol, IL-6, Cardiolipin | [112,152] |
| 970–974 | v(C-N) | D-Serine | [140] |
| 1062–1067 | v(C-O), v(C-C), τ(NH2) | Sphingomyelin, Sulfatide, IL-6 | [119,124,134] |
| 1107–1111 | va(SO4), v(C-N), v(C-C), v(C-OH), | Sulfatide, Cardiolipin | [23,150] |
| 1127–1130 | v(C-N), v(C-C), vskel(C-C) | Sphingomyelin, Sulfatide, IL-6 | [135,136] |
| 1176–1179 | vskel(C-C) | Cholesterol | [144] |
| 1266–1268 | v(C –O) | Cardiolipin | [153] |
| 1295–1299 | τ(CH2) | Sphingomyelin, Sulfatide | [114] |
| 1302–1304 | τ(CH2) | Cardiolipin | [143] |
| 1327–1336 | ω(CH2), τ(CH2) | Cholesterol, D-Serine | [119] |
| 1436–1441 | δ(CH2), τ(CH2), v(CH2/CH3) | Cholesterol, Sphingomyelin, Sulfatide, Cardiolipin | [113,154] |
| 1656–1660 | v(C=O), v(C=C) | Sphingomyelin, Cardiolipin | [118,155] |
| 1672–1674 | v(C=C) | Cholesterol | [144] |
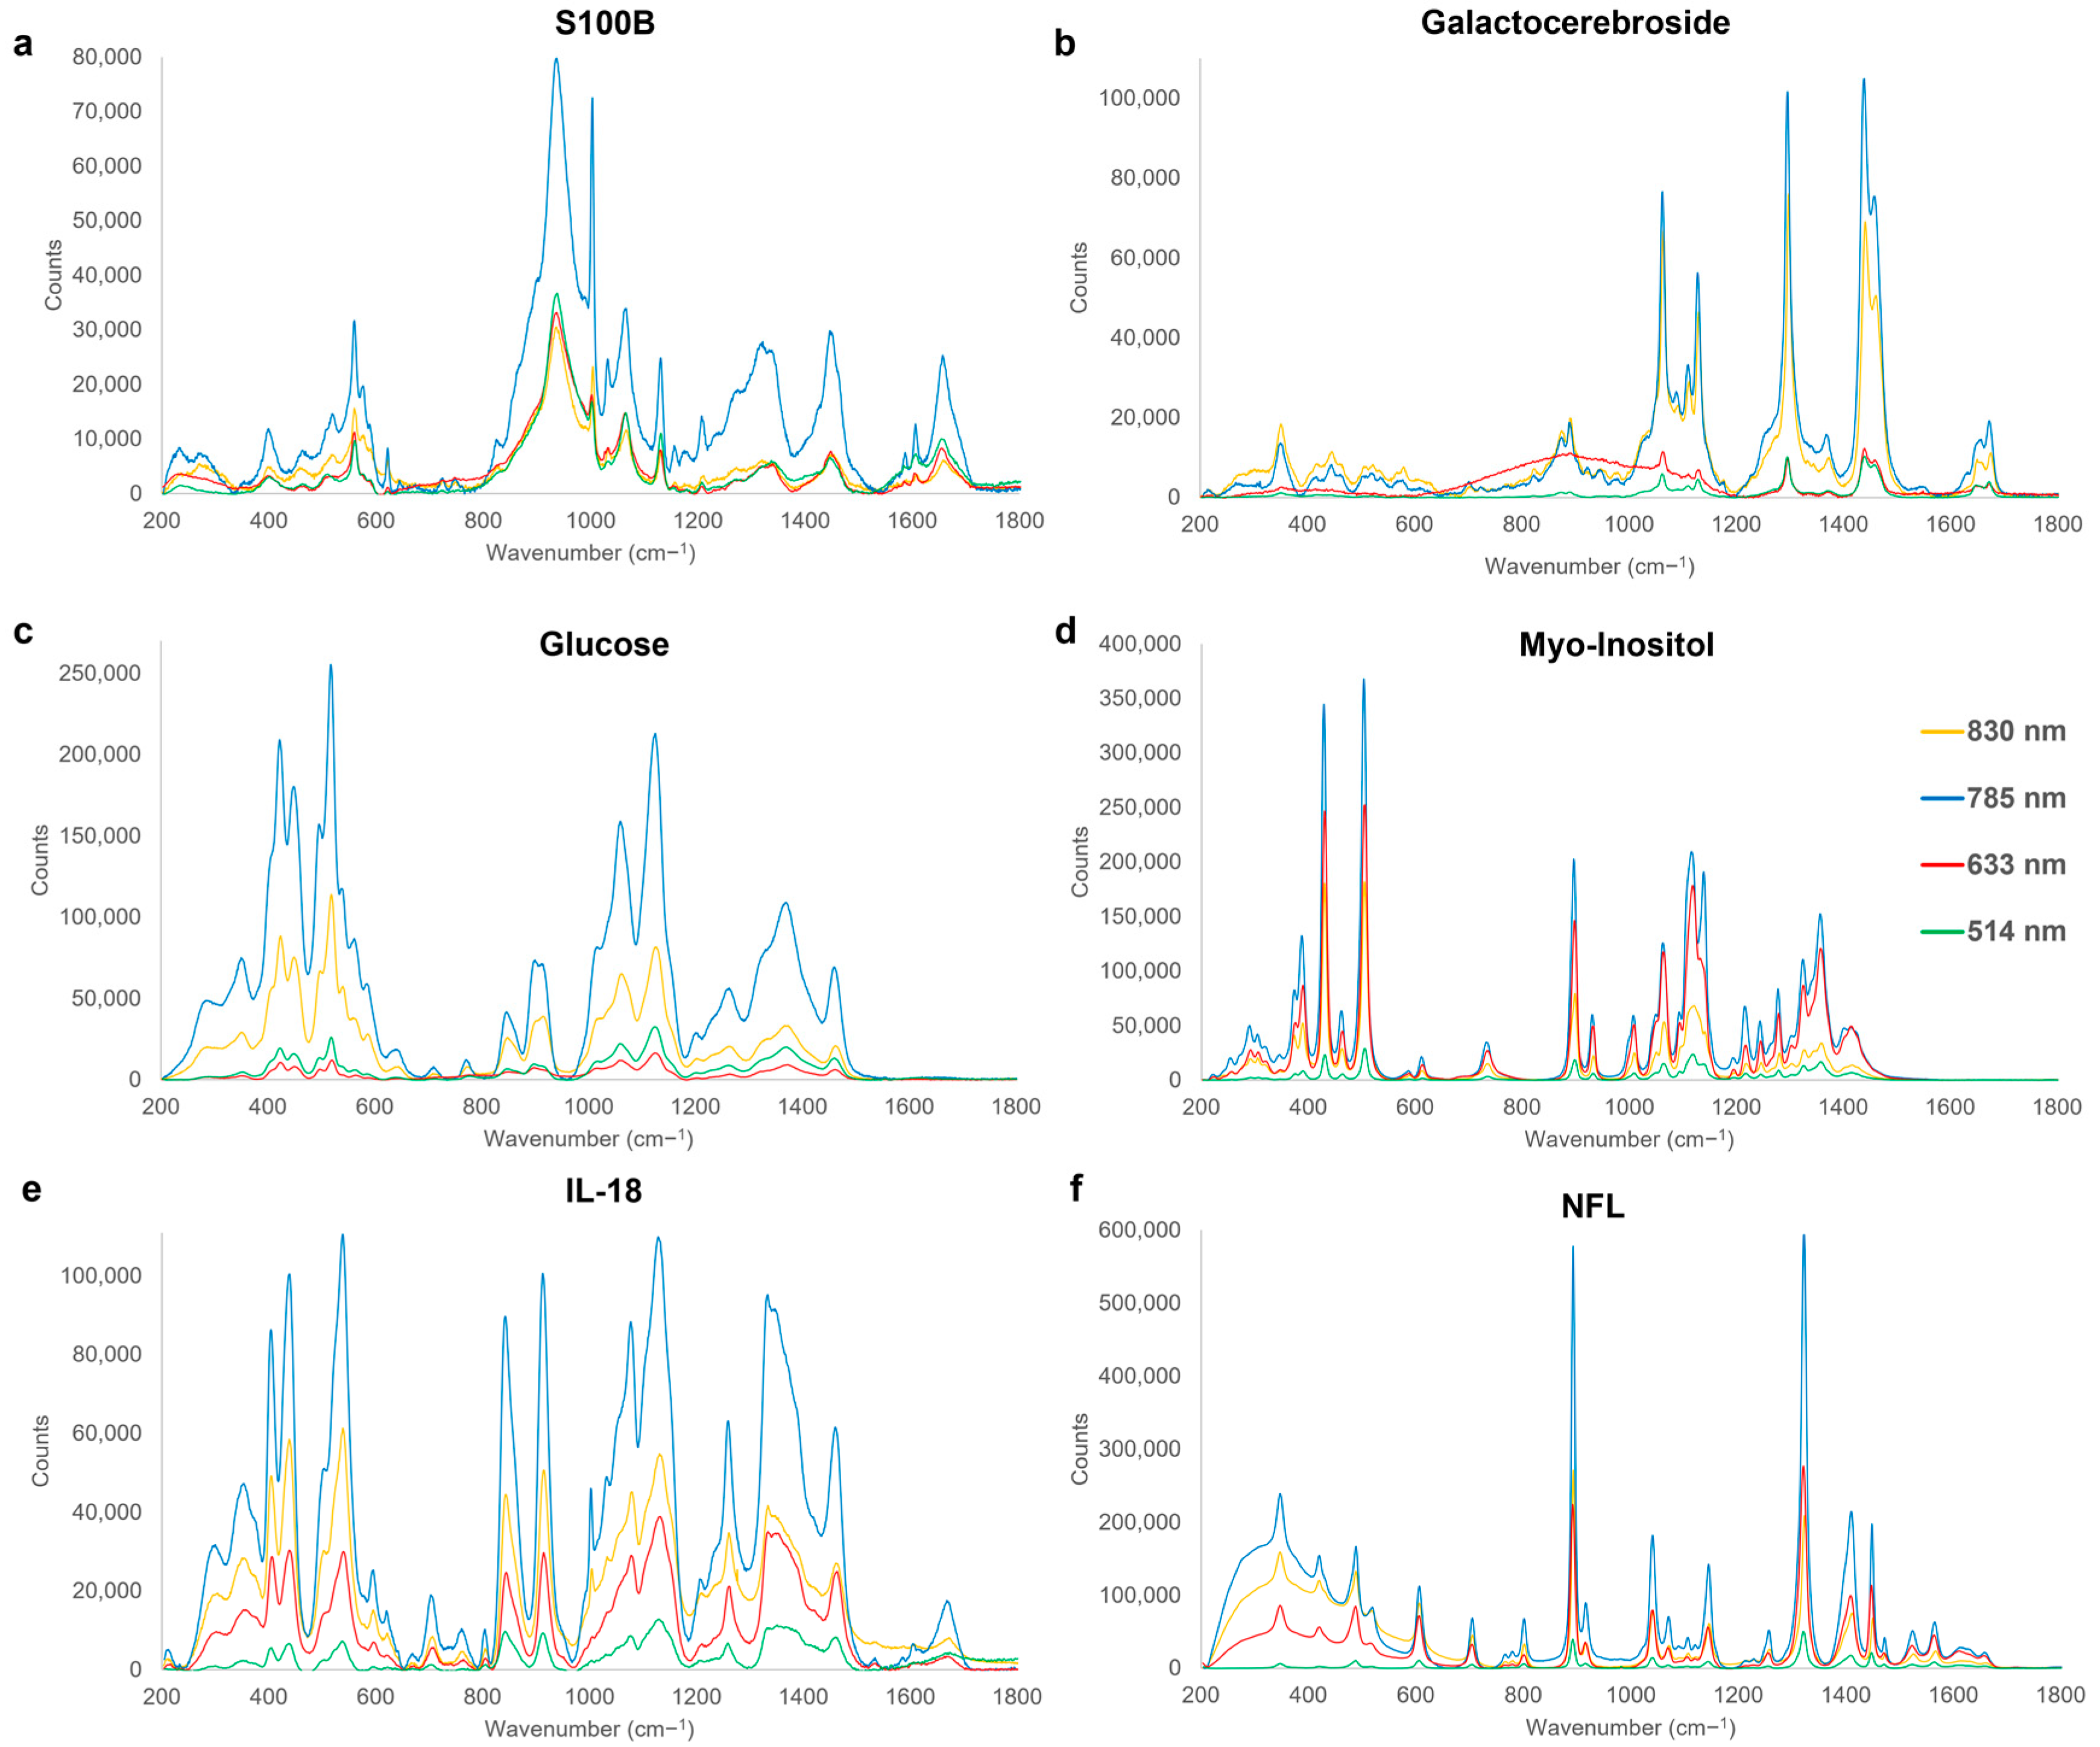
3.3. Chronic Phase

| Wavenumber (cm−1) | Assignment | Origin | Reference |
|---|---|---|---|
| 422–424 | In-plane δarom(C-OH) | Glucose | [112] |
| 504–506 | OH out-of-plane deformation | Myo-Inositol | [112] |
| 517–520 | C-OH deformation | Glucose | [112] |
| 559–560 | OH out-of-plane deformation | S100B | [165] |
| 606–607 | CCC in-plane deformation | NFL | [166] |
| 804–807 | vs (C-N-C) | IL-18 | [112] |
| 842–844 | Out-of-plane δarom(CH), ρ (H(C-O-H)) | IL-18 | [119,142] |
| 891–893 | vs(COO−), v(C-C) | NFL | [167,168] |
| 896–899 | valiphatic(C-H) | Myo-Inositol | [112] |
| 912–914 | v(C-CH3) | IL-18 | [169] |
| 936–937 | v(C-C) | S100B | [157,170] |
| 1002–1004 | Δarom(C-C) | S100B | [119,171] |
| 1008–1010 | Δarom(C-C) | Myo-Inositol | [172] |
| 1040–1041 | v(C-CH3), v(C-C), δ(CH) | NFL | [158,173] |
| 1058–1066 | v(C-O), vskel(C-C), τ(NH2) | S100B, Galactocerebroside, Glucose | [124,134] |
| 1077–1080 | v(C-C), v(C-O) | IL-18 | [119,120] |
| 1116–1121 | δ(CH), v(C-C), | Myo-Inositol | [162,174] |
| 1124–1127 | v(C-C) | Glucose | [135] |
| 1128–1133 | vskel(C-C), v(C-N) | S100B, Galactocerebroside, IL-18 | [119,135,136] |
| 1143–1146 | v(C-N), δ(CH) | NFL | [138,175,176] |
| 1217–1218 | v(C-C) | Myo-Inositol | [163] |
| 1259–1261 | Amide III (v(CN) δ(NH) | IL-18 | [177,178] |
| 1295–1298 | τ(CH2) | Galactocerebroside | [114] |
| 1321–1323 | δ(CH), τ(CH2), | NFL (glycine) | [179,180] |
| 1357–1359 | valiphatic(CH) | Myo-Inositol | [112] |
| 1368–1371 | δ(CH2) | Glucose | [181] |
| 1409–1411 | v(C-C), δ(C-H) | NFL | [119] |
| 1439–1441 | v(CH2/CH3) | Galactocerebroside | [154] |
| 1458–1464 | ω(C-H), δ(CH3), v(C=O), varom(C=C) | Galactocerebroside, Glucose, IL-18 | [182,183,184] |
| 1603–1608 | va(COO−), v(C=C), v(C=O) | S100B | [119,138,185] |
| 1672–1676 | v(C=C) | Galactocerebroside | [144] |

4. Current Challenges and Future Outlook
5. Conclusions
Supplementary Materials
Author Contributions
Funding
Data Availability Statement
Conflicts of Interest
References
- Khellaf, A.; Khan, D.Z.; Helmy, A. Recent advances in traumatic brain injury. J. Neurol. 2019, 266, 2878–2889. [Google Scholar] [CrossRef] [PubMed]
- Capizzi, A.; Woo, J.; Verduzco-Gutierrez, M. Traumatic Brain Injury: An Overview of Epidemiology, Pathophysiology, and Medical Management. Med. Clin. N. Am. 2020, 104, 213–238. [Google Scholar] [CrossRef] [PubMed]
- Wang, K.K.; Yang, Z.; Zhu, T.; Shi, Y.; Rubenstein, R.; Tyndall, J.A.; Manley, G.T. An update on diagnostic and prognostic biomarkers for traumatic brain injury. Expert Rev. Mol. Diagn. 2018, 18, 165–180. [Google Scholar] [CrossRef]
- Adrian, H.; Mårten, K.; Salla, N.; Lasse, V. Biomarkers of traumatic brain injury: Temporal changes in body fluids. eNeuro 2016, 3, e0294-16. [Google Scholar] [CrossRef]
- Ercole, A.; Thelin, E.P.; Holst, A.; Bellander, B.M.; Nelson, D.W. Kinetic modelling of serum S100b after traumatic brain injury. BMC Neurol. 2016, 16, 93. [Google Scholar] [CrossRef]
- Lippa, S.M.; Werner, J.K.; Miller, M.C.; Gill, J.M.; Diaz-Arrastia, R.; Kenney, K. Recent Advances in Blood-Based Biomarkers of Remote Combat-Related Traumatic Brain Injury. Curr. Neurol. Neurosci. Rep. 2020, 20, 54. [Google Scholar] [CrossRef] [PubMed]
- Kobeissy, F.H.; Sadasivan, S.; Oli, M.W.; Robinson, G.; Larner, S.F.; Zhang, Z.; Hayes, R.L.; Wang, K.K.W. Neuroproteomics and systems biology-based discovery of protein biomarkers for traumatic brain injury and clinical validation. Proteom.—Clin. Appl. 2008, 2, 1467–1483. [Google Scholar] [CrossRef] [PubMed]
- Agoston, D.V.; Shutes-David, A.; Peskind, E.R. Biofluid biomarkers of traumatic brain injury. Brain Inj. 2017, 31, 1195–1203. [Google Scholar] [CrossRef]
- Shahim, P.; Politis, A.; van der Merwe, A.; Moore, B.; Ekanayake, V.; Lippa, S.M.; Chou, Y.Y.; Pham, D.L.; Butman, J.A.; Diaz-Arrastia, R.; et al. Time course and diagnostic utility of NfL, tau, GFAP, and UCH-L1 in subacute and chronic TBI. Neurology 2020, 95, e623–e636. [Google Scholar] [CrossRef]
- Rubenstein, R.; Chang, B.; Yue, J.K.; Chiu, A.; Winkler, E.A.; Puccio, A.M.; Diaz-Arrastia, R.; Yuh, E.L.; Mukherjee, P.; Valadka, A.B.; et al. Comparing plasma phospho tau, total tau, and phospho tau–total tau ratio as acute and chronic traumatic brain injury biomarkers. JAMA Neurol. 2017, 74, 1063–1072. [Google Scholar] [CrossRef]
- Chitturi, J.; Li, Y.; Santhakumar, V.; Kannurpatti, S.S. Consolidated biochemical profile of subacute stage traumatic brain injury in early development. Front. Neurosci. 2019, 13, 431. [Google Scholar] [CrossRef]
- Dewan, M.C.; Rattani, A.; Gupta, S.; Baticulon, R.E.; Hung, Y.C.; Punchak, M.; Agrawal, A.; Adeleye, A.O.; Shrime, M.G.; Rubiano, A.M.; et al. Estimating the global incidence of traumatic brain injury. J. Neurosurg. 2019, 130, 1080–1097. [Google Scholar] [CrossRef]
- Teasdale, G.; Maas, A.; Lecky, F.; Manley, G.; Stocchetti, N.; Murray, G. The Glasgow Coma Scale at 40 years: Standing the test of time. Lancet Neurol. 2014, 13, 844–854. [Google Scholar] [CrossRef] [PubMed]
- Bazarian, J.J.; Veazie, P.; Mookerjee, S.; Lerner, E.B. Accuracy of mild traumatic brain injury case ascertainment using ICD-9 codes. Acad. Emerg. Med. 2006, 13, 31–38. [Google Scholar] [CrossRef]
- Huie, J.R.; Mondello, S.; Lindsell, C.J.; Antiga, L.; Yuh, E.L.; Zanier, E.R.; Masson, S.; Rosario, B.L.; Ferguson, A.R.; Adeoye, O.; et al. Biomarkers for Traumatic Brain Injury: Data Standards and Statistical Considerations. J. Neurotrauma 2021, 38, 2514–2529. [Google Scholar] [CrossRef]
- McBride, W.R.; Eltman, N.R.; Swanson, R.L. Blood-Based Biomarkers in Traumatic Brain Injury: A Narrative Review with Implications for the Legal System. Cureus 2023, 15, e40417. [Google Scholar] [CrossRef]
- Mavroudis, I.; Petridis, F.; Balmus, I.M.; Ciobica, A.; Gorgan, D.L.; Luca, A.C. Review on the Role of Salivary Biomarkers in the Diagnosis of Mild Traumatic Brain Injury and Post-Concussion Syndrome. Diagnostics 2023, 13, 1367. [Google Scholar] [CrossRef]
- Mozafari, J.; Fahimi, M.A.; Mohammadi, K.; Barzegari, H.; Hanafi, M.G.; Saki-Malehi, A. The diagnostic accuracy of serum and urinary S100B protein in children and adolescents with mild traumatic brain injury. N. Z. J. Med. Lab. Sci. 2019, 73, 88–91. [Google Scholar]
- Zetterberg, H.; Blennow, K. Fluid markers of traumatic brain injury. Mol. Cell. Neurosci. 2015, 66, 99–102. [Google Scholar] [CrossRef] [PubMed]
- Cordero, E.; Latka, I.; Matthäus, C.; Schie, I.; Popp, J. In-vivo Raman spectroscopy: From basics to applications. J. Biomed. Opt. 2018, 23, 071210. [Google Scholar] [CrossRef]
- Hanlon, E.B.; Manoharan, R.; Koo, T.W.; Shafer, K.E.; Motz, J.T.; Fitzmaurice, M.; Kramer, J.R.; Itzkan, I.; Dasari, R.R.; Feld, M.S. Prospects for in vivo Raman spectroscopy. Phys. Med. Biol. 2000, 45, R1. [Google Scholar] [CrossRef]
- Guo, S.; Bocklitz, T.; Popp, J. Optimization of Raman-spectrum baseline correction in biological application. Analyst 2016, 141, 2396–2404. [Google Scholar] [CrossRef]
- Birech, Z.; Mwangi, P.W.; Bukachi, F.; Mandela, K.M. Application of Raman spectroscopy in type 2 diabetes screening in blood using leucine and isoleucine amino-acids as biomarkers and in comparative anti-diabetic drugs efficacy studies. PLoS ONE 2017, 12, e0185130. [Google Scholar] [CrossRef]
- Koster, H.J.; Guillen-Perez, A.; Gomez-Diaz, J.S.; Navas-Moreno, M.; Birkeland, A.C.; Carney, R.P. Fused Raman spectroscopic analysis of blood and saliva delivers high accuracy for head and neck cancer diagnostics. Sci. Rep. 2022, 12, 18464. [Google Scholar] [CrossRef] [PubMed]
- Ryzhikova, E.; Ralbovsky, N.M.; Sikirzhytski, V.; Kazakov, O.; Halamkova, L.; Quinn, J.; Zimmerman, E.A.; Lednev, I.K. Raman spectroscopy and machine learning for biomedical applications: Alzheimer’s disease diagnosis based on the analysis of cerebrospinal fluid. Spectrochim. Acta A Mol. Biomol. Spectrosc. 2021, 248, 119188. [Google Scholar] [CrossRef]
- Sathyavathi, R.; Dingari, N.C.; Barman, I.; Prasad, P.S.R.; Prabhakar, S.; Narayana Rao, D.; Dasari, R.R.; Undamatla, J. Raman spectroscopy provides a powerful, rapid diagnostic tool for the detection of tuberculous meningitis in ex vivo cerebrospinal fluid samples. J. Biophotonics 2013, 6, 567. [Google Scholar] [CrossRef] [PubMed]
- Chen, C.; Yang, L.; Zhao, J.; Yuan, Y.; Chen, C.; Tang, J.; Yang, H.; Yan, Z.; Wang, H.; Lv, X. Urine Raman spectroscopy for rapid and inexpensive diagnosis of chronic renal failure (CRF) using multiple classification algorithms. Optik 2020, 203, 164043. [Google Scholar] [CrossRef]
- Kavuru, V.; Senger, R.S.; Robertson, J.L.; Choudhury, D. Analysis of urine Raman spectra differences from patients with diabetes mellitus and renal pathologies. PeerJ 2023, 11, e14879. [Google Scholar] [CrossRef]
- Buchan, E.; Hardy, M.; de Carvalho Gomes, P.; Kelleher, L.; Chu, H.O.M.; Oppenheimer, P.G. Emerging Raman spectroscopy and saliva-based diagnostics: From challenges to applications. Appl. Spectrosc. Rev. 2022. [Google Scholar] [CrossRef]
- Kim, S.; Kim, T.G.; Lee, S.H.; Kim, W.; Bang, A.; Moon, S.W.; Song, J.; Shin, J.H.; Yu, J.S.; Choi, S. Label-Free Surface-Enhanced Raman Spectroscopy Biosensor for On-Site Breast Cancer Detection Using Human Tears. ACS Appl. Mater. Interfaces 2020, 12, 7897–7904. [Google Scholar] [CrossRef]
- Camerlingo, C.; Lisitskiy, M.; Lepore, M.; Portaccio, M.; Montorio, D.; Del Prete, S.; Cennamo, G. Characterization of human tear fluid by means of surface-enhanced raman spectroscopy. Sensors 2019, 19, 1177. [Google Scholar] [CrossRef] [PubMed]
- Cennamo, G.; Montorio, D.; Morra, V.B.; Criscuolo, C.; Lanzillo, R.; Salvatore, E.; Camerlingo, C.; Lisitskiy, M.; Delfino, I.; Portaccio, M.; et al. Surface-enhanced Raman spectroscopy of tears: Toward a diagnostic tool for neurodegenerative disease identification. J. Biomed. Opt. 2020, 25, 1. [Google Scholar] [CrossRef] [PubMed]
- Rickard, J.J.S.; Di-Pietro, V.; Smith, D.J.; Davies, D.J.; Belli, A.; Oppenheimer, P.G. Rapid optofluidic detection of biomarkers for traumatic brain injury via surface-enhanced Raman spectroscopy. Nat. Biomed. Eng. 2020, 4, 610–623. [Google Scholar] [CrossRef] [PubMed]
- Li, C.; Shah, K.A.; Narayan, R.K. Rapid detection of traumatic brain injury. Nat. Biomed. Eng. 2020, 4, 579–580. [Google Scholar] [CrossRef]
- Mowbray, M.; Banbury, C.; Rickard, J.J.S.; Davies, D.J.; Goldberg Oppenheimer, P. Development and Characterization of a Probe Device toward Intracranial Spectroscopy of Traumatic Brain Injury. ACS Biomater. Sci. Eng. 2021, 7, 1252–1262. [Google Scholar] [CrossRef]
- Stevens, A.R.; Stickland, C.A.; Harris, G.; Ahmed, Z.; Oppenheimer, P.G.; Belli, A.; Davies, D.J. Raman Spectroscopy as a Neuromonitoring Tool in Traumatic Brain Injury: A Systematic Review and Clinical Perspectives. Cells 2022, 11, 1227. [Google Scholar] [CrossRef]
- Feinberg, C.; Carr, C.; Zemek, R.; Yeates, K.O.; Master, C.; Schneider, K.; Bell, M.J.; Wisniewski, S.; Mannix, R. Association of Pharmacological Interventions With Symptom Burden Reduction in Patients With Mild Traumatic Brain Injury: A Systematic Review. JAMA Neurol. 2021, 78, 596–608. [Google Scholar] [CrossRef]
- Marro, M.; Taubes, A.; Abernathy, A.; Balint, S.; Moreno, B.; Sanchez-Dalmau, B.; Martínez-Lapiscina, E.H.; Amat-Roldan, I.; Petrov, D.; Villoslada, P. Dynamic molecular monitoring of retina inflammation by in vivo Raman spectroscopy coupled with multivariate analysis. J. Biophotonics 2014, 7, 724–734. [Google Scholar] [CrossRef]
- Harris, G.; Rickard, J.J.S.; Butt, G.; Kelleher, L.; Blanch, R.J.; Cooper, J.; Oppenheimer, P.G. Review: Emerging Eye-Based Diagnostic Technologies for Traumatic Brain Injury. IEEE Rev. Biomed. Eng. 2023, 16, 530–559. [Google Scholar] [CrossRef]
- Böhmer, A.E.; Oses, J.P.; Schmidt, A.P.; Perón, C.S.; Krebs, C.L.; Oppitz, P.P.; D’Avila, T.T.; Souza, D.O.; Portela, L.V.; Stefani, M.A. Neuron-specific enolase, S100B, and glial fibrillary acidic protein levels as outcome predictors in patients with severe traumatic brain injury. Neurosurgery 2011, 68, 1624–1630. [Google Scholar] [CrossRef]
- Gutierre, M.U.; Telles, J.P.M.; Welling, L.C.; Rabelo, N.N.; Teixeira, M.J.; Figueiredo, E.G. Biomarkers for traumatic brain injury: A short review. Neurosurg. Rev. 2021, 44, 2091–2097. [Google Scholar] [CrossRef] [PubMed]
- Zetterberg, H.; Smith, D.H.; Blennow, K. Biomarkers of mild traumatic brain injury in cerebrospinal fluid and blood. Nat. Rev. Neurol. 2013, 9, 201. [Google Scholar] [CrossRef] [PubMed]
- Damien, B.; Charlotte, O.; Marina, B.; Julie, D.; Vincent, S. Interest of blood biomarkers to predict lesions in medical imaging in the context of mild traumatic brain injury. Clin. Biochem. 2020, 85, 5–11. [Google Scholar] [CrossRef]
- Woods, A.S.; Colsch, B.; Jackson, S.N.; Post, J.; Baldwin, K.; Roux, A.; Hoffer, B.; Cox, B.M.; Hoffer, M.; Rubovitch, V.; et al. Gangliosides and CeramidesChange in a Mouse Model of Blast Induced Traumatic Brain Injury. ACS Chem. Neurosci. 2013, 4, 594. [Google Scholar] [CrossRef]
- Kim, H.J.; Tsao, J.W.; Stanfill, A.G. The current state of biomarkers of mild traumatic brain injury. JCI Insight 2018, 3, e97105. [Google Scholar] [CrossRef]
- Perez, E.J.; Tapanes, S.A.; Loris, Z.B.; Balu, D.T.; Sick, T.J.; Coyle, J.T.; Liebl, D.J. Enhanced astrocytic d-serine underlies synaptic damage after traumatic brain injury. J. Clin. Investig. 2017, 127, 3114–3125. [Google Scholar] [CrossRef]
- Lee, S.H.; Kho, A.R.; Lee, S.H.; Hong, D.K.; Kang, B.S.; Park, M.K.; Lee, C.J.; Yang, H.W.; Woo, S.Y.; Park, S.W.; et al. Acid Sphingomyelinase Inhibitor, Imipramine, Reduces Hippocampal Neuronal Death after Traumatic Brain Injury. Int. J. Mol. Sci. 2022, 23, 14749. [Google Scholar] [CrossRef]
- Sparvero, L.J.; Amoscato, A.A.; Fink, A.B.; Anthonymuthu, T.; New, L.A.; Kochanek, P.M.; Watkins, S.; Kagan, V.E.; Bayır, H. Imaging mass spectrometry reveals loss of polyunsaturated cardiolipins in the cortical contusion, hippocampus, and thalamus after traumatic brain injury. J. Neurochem. 2016, 139, 659–675. [Google Scholar] [CrossRef]
- Chao, H.; Anthonymuthu, T.S.; Kenny, E.M.; Amoscato, A.A.; Cole, L.K.; Hatch, G.M.; Ji, J.; Kagan, V.E.; Bayır, H. Disentangling oxidation/hydrolysis reactions of brain mitochondrial cardiolipins in pathogenesis of traumatic injury. JCI Insight 2018, 3, e97677. [Google Scholar] [CrossRef]
- Banbury, C.; Styles, I.; Eisenstein, N.; Zanier, E.R.; Vegliante, G.; Belli, A.; Logan, A.; Goldberg Oppenheimer, P. Spectroscopic detection of traumatic brain injury severity and biochemistry from the retina. Biomed. Opt. Express 2020, 11, 6249–6261. [Google Scholar] [CrossRef]
- Antunes, A.A.; Sotomaior, V.S.; Sakamoto, K.S.; de Camargo Neto, C.P.; Martins, C.; Aguiar, L.R. Interleukin-6 Plasmatic Levels in Patients with Head Trauma and Intracerebral Hemorrhage. Asian J. Neurosurg. 2010, 5, 68–77. [Google Scholar]
- Kumar, R.G.; Diamond, M.L.; Boles, J.A.; Berger, R.P.; Tisherman, S.A.; Kochanek, P.M.; Wagner, A.K. Acute CSF interleukin-6 trajectories after TBI: Associations with neuroinflammation, polytrauma, and outcome. Brain. Behav. Immun. 2015, 45, 253–262. [Google Scholar] [CrossRef] [PubMed]
- Wang, K.K.W.; Kobeissy, F.H.; Shakkour, Z.; Tyndall, J.A. Thorough overview of ubiquitin C-terminal hydrolase-L1 and glial fibrillary acidic protein as tandem biomarkers recently cleared by US Food and Drug Administration for the evaluation of intracranial injuries among patients with traumatic brain injury. Acute Med. Surg. 2021, 8, e622. [Google Scholar] [CrossRef] [PubMed]
- Guan, J.; Zhu, Z.; Zhao, R.C.; Xiao, Z.; Wu, C.; Han, Q.; Chen, L.; Tong, W.; Zhang, J.; Han, Q.; et al. Transplantation of human mesenchymal stem cells loaded on collagen scaffolds for the treatment of traumatic brain injury in rats. Biomaterials 2013, 34, 5937–5946. [Google Scholar] [CrossRef]
- Krafft, C.; Neudert, L.; Simat, T.; Salzer, R. Near infrared Raman spectra of human brain lipids. Spectrochim. Acta—Part A Mol. Biomol. Spectrosc. 2005, 61, 1529–1535. [Google Scholar] [CrossRef] [PubMed]
- Shi, J.; Dong, B.; Mao, Y.; Guan, W.; Cao, J.; Zhu, R.; Wang, S. Review: Traumatic brain injury and hyperglycemia, a potentially modifiable risk factor. Oncotarget 2016, 7, 71052. [Google Scholar] [CrossRef]
- Kierans, A.S.; Kirov, I.I.; Gonen, O.; Haemer, G.; Nisenbaum, E.; Babb, J.S.; Grossman, R.I.; Lui, Y.W. Myoinositol and glutamate complex neurometabolite abnormality after mild traumatic brain injury. Neurology 2014, 82, 521. [Google Scholar] [CrossRef]
- Ciaramella, A.; Della Vedova, C.; Salani, F.; Viganotti, M.; D’Ippolito, M.; Caltagirone, C.; Formisano, R.; Sabatini, U.; Bossù, P. Increased Levels of Serum IL-18 Are Associated with the Long-Term Outcome of Severe Traumatic Brain Injury. Neuroimmunomodulation 2014, 21, 8–12. [Google Scholar] [CrossRef]
- Belli, A.; Sen, J.; Petzold, A.; Russo, S.; Kitchen, N.; Smith, M.; Tavazzi, B.; Vagnozzi, R.; Signoretti, S.; Amorini, A.M.; et al. Extracellular N-acetylaspartate depletion in traumatic brain injury. J. Neurochem. 2006, 96, 861–869. [Google Scholar] [CrossRef]
- Rubovitch, V.; Zilberstein, Y.; Chapman, J.; Schreiber, S.; Pick, C.G. Restoring GM1 ganglioside expression ameliorates axonal outgrowth inhibition and cognitive impairments induced by blast traumatic brain injury. Sci. Rep. 2017, 7, 41269. [Google Scholar] [CrossRef]
- Koza, L.; Linseman, D. Glutathione precursors shield the brain from trauma. Neural Regen. Res. 2019, 14, 1701. [Google Scholar] [CrossRef]
- Smith, R.; Chepisheva, M.; Cronin, T.; Seemungal, B.M. Diagnostic Approaches Techniques in Concussion/Mild Traumatic Brain Injury: Where are we? In Neurosensory Disorders in Mild Traumatic Brain Injury; Academic Press: Cambridge, MA, USA, 2019; pp. 247–277. [Google Scholar] [CrossRef]
- Mehta, T.; Fayyaz, M.; Giler, G.E.; Kaur, H.; Raikwar, S.P.; Kempuraj, D.; Selvakumar, G.P.; Ahmed, M.E.; Thangavel, R.; Zaheer, S.; et al. Current Trends in Biomarkers for Traumatic Brain Injury. Open Access J. Neurol. Neurosurg. 2020, 12, 86–94. [Google Scholar] [CrossRef]
- Cartagena, C.M.; Ahmed, F.; Burns, M.P.; Pajoohesh-Ganji, A.; Pak, D.T.; Faden, A.I.; Rebeck, G.W. Cortical Injury Increases Cholesterol 24S Hydroxylase (Cyp46) Levels in the Rat Brain. J. Neurotrauma 2008, 25, 1087. [Google Scholar] [CrossRef]
- Bergholt, M.S.; Serio, A.; Albro, M.B. Raman Spectroscopy: Guiding Light for the Extracellular Matrix. Front. Bioeng. Biotechnol. 2019, 7, 491962. [Google Scholar] [CrossRef] [PubMed]
- Chau, A.H.; Motz, J.T.; Gardecki, J.A.; Waxman, S.; Bouma, B.E.; Tearney, G.J. Fingerprint and high-wavenumber Raman spectroscopy in a human-swine coronary xenograft in vivo. J. Biomed. Opt. 2008, 13, 040501. [Google Scholar] [CrossRef] [PubMed]
- Moffett, J.R.; Arun, P.; Ariyannur, P.S.; Namboodiri, A.M.A. N-Acetylaspartate reductions in brain injury: Impact on post-injury neuroenergetics, lipid synthesis, and protein acetylation. Front. Neuroenergetics 2013, 5, 69505. [Google Scholar] [CrossRef]
- Shannon, R.J.; van der Heide, S.; Carter, E.L.; Jalloh, I.; Menon, D.K.; Hutchinson, P.J.; Carpenter, K.L.H. Extracellular N-Acetylaspartate in Human Traumatic Brain Injury. J. Neurotrauma 2016, 33, 319–329. [Google Scholar] [CrossRef]
- Sipione, S.; Monyror, J.; Galleguillos, D.; Steinberg, N.; Kadam, V. Gangliosides in the Brain: Physiology, Pathophysiology and Therapeutic Applications. Front. Neurosci. 2020, 14, 1004. [Google Scholar] [CrossRef]
- Khatri, N.; Thakur, M.; Pareek, V.; Kumar, S.; Sharma, S.; Datusalia, A.K. Oxidative Stress: Major Threat in Traumatic Brain Injury. CNS Neurol. Disord. Drug Targets 2018, 17, 689–695. [Google Scholar] [CrossRef]
- Haque, A.; Ray, S.K.; Cox, A.; Banik, N.L. Neuron specific enolase: A promising therapeutic target in acute spinal cord injury. Metab. Brain Dis. 2016, 31, 487–495. [Google Scholar] [CrossRef] [PubMed]
- Yang, Z.; Wang, K.K.W. Glial fibrillary acidic protein: From intermediate filament assembly and gliosis to neurobiomarker. Trends Neurosci. 2015, 38, 364–374. [Google Scholar] [CrossRef] [PubMed]
- Sofroniew, M.V. Molecular dissection of reactive astrogliosis and glial scar formation. Trends Neurosci. 2009, 32, 638–647. [Google Scholar] [CrossRef]
- Tzeng, S.F.; Hsiao, H.Y.; Mak, O.T. Prostaglandins and cyclooxygenases in glial cells during brain inflammation. Curr. Drug Targets Inflamm. Allergy 2005, 4, 335–340. [Google Scholar] [CrossRef] [PubMed]
- Liu, H.; Povysheva, N.; Rose, M.E.; Mi, Z.; Banton, J.S.; Li, W.; Chen, F.; Reay, D.P.; Barrionuevo, G.; Zhang, F.; et al. Role of UCHL1 in axonal injury and functional recovery after cerebral ischemia. Proc. Natl. Acad. Sci. USA 2019, 116, 4643–4650. [Google Scholar] [CrossRef]
- Shahjouei, S.; Sadeghi-Naini, M.; Yang, Z.; Kobeissy, F.; Rathore, D.; Shokraneh, F.; Blackburn, S.; Manley, G.T.; Wang, K.K.W. The diagnostic values of UCH-L1 in traumatic brain injury: A meta-analysis. Brain Inj. 2017, 32, 1–17. [Google Scholar] [CrossRef] [PubMed]
- Nathoo, N.; Chetty, R.; Van Dellen, J.R.; Barnett, G.H. Genetic vulnerability following traumatic brain injury: The role of apolipoprotein E. Mol. Pathol. 2003, 56, 132–136. [Google Scholar] [CrossRef]
- Surmacki, J.M.; Ansel-Bollepalli, L.; Pischiutta, F.; Zanier, E.R.; Ercole, A.; Bohndiek, S.E. Label-free monitoring of tissue biochemistry following traumatic brain injury using Raman spectroscopy. Analyst 2017, 142, 132–139. [Google Scholar] [CrossRef]
- Kay, A.D.; Day, S.P.; Kerr, M.; Nicoll, J.A.R.; Packard, C.J.; Caslake, M.J. Remodeling of Cerebrospinal Fluid Lipoprotein Particles after Human Traumatic Brain Injury. J. Neurotrauma 2004, 20, 717–723. [Google Scholar] [CrossRef]
- Xu, H.; Zheng, L.X.; Chen, X.S.; Pang, Q.Y.; Yan, Y.N.; Liu, R.; Guo, H.M.; Ren, Z.Y.; Yang, Y.; Gu, Z.Y.; et al. Brain-specific loss of Abcg1 disturbs cholesterol metabolism and aggravates pyroptosis and neurological deficits after traumatic brain injury. Brain Pathol. 2023, 33, e13126. [Google Scholar] [CrossRef]
- Tapanes, S.A.; Arizanovska, D.; Díaz, M.M.; Folorunso, O.O.; Harvey, T.; Brown, S.E.; Radzishevsky, I.; Close, L.N.; Jagid, J.R.; Graciolli Cordeiro, J.; et al. Inhibition of glial D-serine release rescues synaptic damage after brain injury. Glia 2022, 70, 1133. [Google Scholar] [CrossRef]
- Alessenko, A.V.; Albi, E. Exploring Sphingolipid Implications in Neurodegeneration. Front. Neurol. 2020, 11, 513554. [Google Scholar] [CrossRef] [PubMed]
- Schneider, N.; Hauser, J.; Oliveira, M.; Cazaubon, E.; Mottaz, S.C.; O’Neill, B.V.; Steiner, P.; Deoni, S.C.L. Sphingomyelin in Brain and Cognitive Development: Preliminary Data. eNeuro 2019, 6, e0421-18. [Google Scholar] [CrossRef] [PubMed]
- Ojo, J.O.; Algamal, M.; Leary, P.; Abdullah, L.; Mouzon, B.; Evans, J.E.; Mullan, M.; Crawford, F. Converging and differential brain phospholipid dysregulation in the pathogenesis of repetitive mild traumatic brain injury and Alzheimer’s disease. Front. Neurosci. 2019, 13, 416109. [Google Scholar] [CrossRef]
- Wang, G.; Bieberich, E. Sphingolipids in neurodegeneration (with focus on ceramide and S1P). Adv. Biol. Regul. 2018, 70, 51–64. [Google Scholar] [CrossRef]
- Yang, K.; Taft, W.C.; Dixon, C.E.; Todaro, C.A.; Yu, R.K.; Hayes, R.L. Alterations of protein kinase C in rat hippocampus following traumatic brain injury. J. Neurotrauma 1993, 10, 287–295. [Google Scholar] [CrossRef] [PubMed]
- Takahashi, T.; Suzuki, T. Role of sulfatide in normal and pathological cells and tissues. J. Lipid Res. 2012, 53, 1437–1450. [Google Scholar] [CrossRef]
- Paradies, G.; Paradies, V.; Ruggiero, F.M.; Petrosillo, G. Role of Cardiolipin in Mitochondrial Function and Dynamics in Health and Disease: Molecular and Pharmacological Aspects. Cells 2019, 8, 728. [Google Scholar] [CrossRef]
- Chu, C.T.; Ji, J.; Dagda, R.K.; Jiang, J.F.; Tyurina, Y.Y.; Kapralov, A.A.; Tyurin, V.A.; Yanamala, N.; Shrivastava, I.H.; Mohammadyani, D.; et al. Cardiolipin externalization to the outer mitochondrial membrane acts as an elimination signal for mitophagy in neuronal cells. Nat. Cell Biol. 2013, 15, 1197–1205. [Google Scholar] [CrossRef]
- Chao, H.; Lin, C.; Zuo, Q.; Liu, Y.; Xiao, M.; Xu, X.; Li, Z.; Bao, Z.; Chen, H.; You, Y.; et al. Cardiolipin-Dependent Mitophagy Guides Outcome after Traumatic Brain Injury. J. Neurosci. 2019, 39, 1930–1943. [Google Scholar] [CrossRef]
- Williams, A.J.; Wei, H.H.; Dave, J.R.; Tortella, F.C. Acute and delayed neuroinflammatory response following experimental penetrating ballistic brain injury in the rat. J. Neuroinflamm. 2007, 4, 17. [Google Scholar] [CrossRef]
- Ooi, S.Z.Y.; Spencer, R.J.; Hodgson, M.; Mehta, S.; Phillips, N.L.; Preest, G.; Manivannan, S.; Wise, M.P.; Galea, J.; Zaben, M. Interleukin-6 as a prognostic biomarker of clinical outcomes after traumatic brain injury: A systematic review. Neurosurg. Rev. 2022, 45, 3035–3054. [Google Scholar] [CrossRef]
- Schett, G. Physiological effects of modulating the interleukin-6 axis. Rheumatology 2018, 57, ii43–ii50. [Google Scholar] [CrossRef]
- Nishiyama, H.; Knöpfel, T.; Endo, S.; Itohara, S. Glial protein S100B modulates long-term neuronal synaptic plasticity. Proc. Natl. Acad. Sci. USA 2002, 99, 4037–4042. [Google Scholar] [CrossRef]
- Goyal, A.; Failla, M.D.; Niyonkuru, C.; Amin, K.; Fabio, A.; Berger, R.P.; Wagner, A.K. S100b as a Prognostic Biomarker in Outcome Prediction for Patients with Severe Traumatic Brain Injury. J. Neurotrauma 2013, 30, 946. [Google Scholar] [CrossRef]
- Boustany, R.M.N. Lysosomal storage diseases—The horizon expands. Nat. Rev. Neurol. 2013, 9, 583–598. [Google Scholar] [CrossRef] [PubMed]
- Marcus, J.; Popko, B. Galactolipids are molecular determinants of myelin development and axo–glial organization. Biochim. Biophys. Acta—Gen. Subj. 2002, 1573, 406–413. [Google Scholar] [CrossRef] [PubMed]
- Mergenthaler, P.; Lindauer, U.; Dienel, G.A.; Meisel, A. Sugar for the brain: The role of glucose in physiological and pathological brain function. Trends Neurosci. 2013, 36, 587. [Google Scholar] [CrossRef]
- Vespa, P.M.; McArthur, D.; O’Phelan, K.; Glenn, T.; Etchepare, M.; Kelly, D.; Bergsneider, M.; Martin, N.A.; Hovda, D.A. Persistently low extracellular glucose correlates with poor outcome 6 months after human traumatic brain injury despite a lack of increased lactate: A microdialysis study. J. Cereb. Blood Flow Metab. 2003, 23, 865–877. [Google Scholar] [CrossRef] [PubMed]
- Jalloh, I.; Carpenter, K.L.H.; Helmy, A.; Carpenter, T.A.; Menon, D.K.; Hutchinson, P.J. Glucose metabolism following human traumatic brain injury: Methods of assessment and pathophysiological findings. Metab. Brain Dis. 2015, 30, 615–632. [Google Scholar] [CrossRef] [PubMed]
- López-Gambero, A.J.; Sanjuan, C.; Serrano-Castro, P.J.; Suárez, J.; Fonseca, F.R. De The Biomedical Uses of Inositols: A Nutraceutical Approach to Metabolic Dysfunction in Aging and Neurodegenerative Diseases. Biomedicines 2020, 8, 295. [Google Scholar] [CrossRef]
- Brand, A.; Richter-Landsberg, C.; Leibfritz, D. Multinuclear NMR studies on the energy metabolism of glial and neuronal cells. Dev. Neurosci. 1993, 15, 289–298. [Google Scholar] [CrossRef] [PubMed]
- Haris, M.; Cai, K.; Singh, A.; Hariharan, H.; Reddy, R. In vivo mapping of brain myo-inositol. Neuroimage 2011, 54, 2079–2085. [Google Scholar] [CrossRef]
- Ashwal, S.; Holshouser, B.; Tong, K.; Serna, T.; Osterdock, R.; Gross, M.; Kido, D. Proton Spectroscopy Detected Myoinositol in Children with Traumatic Brain Injury. Pediatr. Res. 2004, 56, 630–638. [Google Scholar] [CrossRef]
- Alboni, S.; Cervia, D.; Sugama, S.; Conti, B. Interleukin 18 in the CNS. J. Neuroinflamm. 2010, 7, 9. [Google Scholar] [CrossRef]
- Felderhoff-Mueser, U.; Schmidt, O.I.; Oberholzer, A.; Bührer, C.; Stahel, P.F. IL-18: A key player in neuroinflammation and neurodegeneration? Trends Neurosci. 2005, 28, 487–493. [Google Scholar] [CrossRef]
- Narayanan, S.; Shanker, A.; Khera, T.; Subramaniam, B. Neurofilament light: A narrative review on biomarker utility. Fac. Rev. 2021, 10, 46. [Google Scholar] [CrossRef]
- Khalil, M.; Teunissen, C.E.; Otto, M.; Piehl, F.; Sormani, M.P.; Gattringer, T.; Barro, C.; Kappos, L.; Comabella, M.; Fazekas, F.; et al. Neurofilaments as biomarkers in neurological disorders. Nat. Rev. Neurol. 2018, 14, 577–589. [Google Scholar] [CrossRef] [PubMed]
- Gaetani, L.; Blennow, K.; Calabresi, P.; Di Filippo, M.; Parnetti, L.; Zetterberg, H. Neurofilament light chain as a biomarker in neurological disorders. J. Neurol. Neurosurg. Psychiatry 2019, 90, 870–881. [Google Scholar] [CrossRef]
- Maas, A.I.R.; Menon, D.K.; Adelson, P.D.; Andelic, N.; Bell, M.J.; Belli, A.; Bragge, P.; Brazinova, A.; Büki, A.; Chesnut, R.M.; et al. Traumatic brain injury: Integrated approaches to improve prevention, clinical care, and research. Lancet Neurol. 2017, 16, 987–1048. [Google Scholar] [CrossRef]
- Zhang, J.; Puvenna, V.; Janigro, D. Biomarkers of Traumatic Brain Injury and Their Relationship to Pathology. In Translational Research in Traumatic Brain Injury; CRC Press/Taylor and Francis Group: Boca Raton, FL, USA, 2016; pp. 263–276. ISBN 9781466584921. [Google Scholar]
- Socrates, G. Infrared and Raman Characteristic Group Frequencies: Tables and Charts, 3rd ed.; John Wiley & Sons, Ltd.: Hoboken, NJ, USA, 2004. [Google Scholar]
- Staniszewska-Slezak, E.; Malek, K.; Baranska, M. Complementary analysis of tissue homogenates composition obtained by Vis and NIR laser excitations and Raman spectroscopy. Spectrochim. Acta—Part A Mol. Biomol. Spectrosc. 2015, 147, 245–256. [Google Scholar] [CrossRef] [PubMed]
- Qiu, S.; Weng, Y.; Li, Y.; Chen, Y.; Pan, Y.; Liu, J.; Lin, W.; Chen, X.; Li, M.; Lin, T.; et al. Raman profile alterations of irradiated human nasopharyngeal cancer cells detected with laser tweezer Raman spectroscopy. RSC Adv. 2020, 10, 14368–14373. [Google Scholar] [CrossRef] [PubMed]
- Pastore, A.; Federici, G.; Bertini, E.; Piemonte, F. Analysis of glutathione: Implication in redox and detoxification. Clin. Chim. Acta 2003, 333, 19–39. [Google Scholar] [CrossRef] [PubMed]
- Shin, H.J.; Lee, J.H.; Kim, Y.D.; Shin, I.; Sim, T.; Lim, D.K. Raman-Based in Situ Monitoring of Changes in Molecular Signatures during Mitochondrially Mediated Apoptosis. ACS Omega 2019, 4, 8188–8195. [Google Scholar] [CrossRef]
- Rolfe, S.M.; Patel, M.R.; Gilmour, I.; Olsson-Francis, K.; Ringrose, T.J. Defining Multiple Characteristic Raman Bands of α-Amino Acids as Biomarkers for Planetary Missions Using a Statistical Method. Orig. Life Evol. Biosph. 2016, 46, 323–346. [Google Scholar] [CrossRef]
- Galli, R.; Meinhardt, M.; Koch, E.; Schackert, G.; Steiner, G.; Kirsch, M.; Uckermann, O. Rapid Label-Free Analysis of Brain Tumor Biopsies by Near Infrared Raman and Fluorescence Spectroscopy—A Study of 209 Patients. Front. Oncol. 2019, 9, 1165. [Google Scholar] [CrossRef] [PubMed]
- Pezzotti, G. Raman spectroscopy in cell biology and microbiology. J. Raman Spectrosc. 2021, 52, 2348–2443. [Google Scholar] [CrossRef]
- Huang, Z.; McWilliams, A.; Lui, H.; McLean, D.I.; Lam, S.; Zeng, H. Near-infrared Raman spectroscopy for optical diagnosis of lung cancer. Int. J. Cancer 2003, 107, 1047–1052. [Google Scholar] [CrossRef]
- Mudalige, A.; Pemberton, J.E. Raman spectroscopy of glycerol/D2O solutions. Vib. Spectrosc. 2007, 45, 27–35. [Google Scholar] [CrossRef]
- Thelin, E.P.; Jeppsson, E.; Frostell, A.; Svensson, M.; Mondello, S.; Bellander, B.M.; Nelson, D.W. Utility of neuron-specific enolase in traumatic brain injury; relations to S100B levels, outcome, and extracranial injury severity. Crit. Care 2016, 20, 285. [Google Scholar] [CrossRef]
- Movasaghi, Z.; Rehman, S.; Rehman, I.U. Raman Spectroscopy of Biological Tissues. Appl. Spectrosc. Rev. 2007, 42, 493–541. [Google Scholar] [CrossRef]
- Tfaili, S.; Gobinet, C.; Josse, G.; Angiboust, J.F.; Manfait, M.; Piot, O. Confocal Raman microspectroscopy for skin characterization: A comparative study between human skin and pig skin. Analyst 2012, 137, 3673–3682. [Google Scholar] [CrossRef] [PubMed]
- Nims, C.; Cron, B.; Wetherington, M.; Macalady, J.; Cosmidis, J. Low frequency Raman Spectroscopy for micron-scale and in vivo characterization of elemental sulfur in microbial samples. Sci. Rep. 2019, 9, 7971. [Google Scholar] [CrossRef]
- Kourkoumelis, N.; Gaitanis, G.; Velegraki, A.; Bassukas, I.D. Nail Raman spectroscopy: A promising method for the diagnosis of onychomycosis. An ex vivo pilot study. Med. Mycol. 2018, 56, 551–558. [Google Scholar] [CrossRef] [PubMed]
- Koglin, E.; Séquaris, J.M.; Valenta, P. Surface enhanced raman spectroscopy of nucleic acid bases on Ag electrodes. J. Mol. Struct. 1982, 79, 185–189. [Google Scholar] [CrossRef]
- Luan, Z.; Qin, Y.; Dai, J.; Wu, H.; Chen, Y.; Feng, X.; Peng, G. Identification of lesional tissues and nonlesional tissues in early gastric cancer endoscopic submucosal dissection specimens using a fiber optic raman system. Gastroenterol. Res. Pract. 2020, 2020, 8015024. [Google Scholar] [CrossRef]
- Depciuch, J.; Barnaś, E.; Skręt-Magierło, J.; Skręt, A.; Kaznowska, E.; Łach, K.; Jakubczyk, P.; Cebulski, J. Spectroscopic evaluation of carcinogenesis in endometrial cancer. Sci. Rep. 2021, 11, 9079. [Google Scholar] [CrossRef]
- Farber, C.; Li, J.; Hager, E.; Chemelewski, R.; Mullet, J.; Rogachev, A.Y.; Kurouski, D. Complementarity of Raman and Infrared Spectroscopy for Structural Characterization of Plant Epicuticular Waxes. ACS Omega 2019, 4, 3700–3707. [Google Scholar] [CrossRef]
- Zhou, Y.; Liu, C.; Sun, Y.; Pu, Y.; Boydston-White, S.; Liu, Y.; Alfano, R.R. Human brain cancer studied by resonance Raman spectroscopy. J. Biomed. Opt. 2012, 17, 116021. [Google Scholar] [CrossRef]
- Sacharz, J.; Wesełucha-Birczyńska, A.; Zięba-Palus, J.; Lewandowski, M.H.; Kowalski, R.; Palus, K.; Chrobok, Ł.; Moskal, P.; Birczyńska, M.; Sozańska, A. Epileptic rat brain tissue analyzed by 2D correlation Raman spectroscopy. Spectrochim. Acta—Part A Mol. Biomol. Spectrosc. 2018, 188, 581–588. [Google Scholar] [CrossRef]
- Zhu, J.; Zhou, J.; Guo, J.; Cai, W.; Liu, B.; Wang, Z.; Sun, Z. Surface-enhanced Raman spectroscopy investigation on human breast cancer cells. Chem. Cent. J. 2013, 7, 37. [Google Scholar] [CrossRef]
- Jahmani, M.Y.; Hammadeh, M.E.; Al Smadi, M.A.; Baller, M.K. Label-Free Evaluation of Chromatin Condensation in Human Normal Morphology Sperm Using Raman Spectroscopy. Reprod. Sci. 2021, 28, 2527–2539. [Google Scholar] [CrossRef] [PubMed]
- Synytsya, A.; Judexova, M.; Hoskovec, D.; Miskovicova, M.; Petruzelka, L. Raman spectroscopy at different excitation wavelengths (1064, 785 and 532 nm) as a tool for diagnosis of colon cancer. J. Raman Spectrosc. 2014, 45, 903–911. [Google Scholar] [CrossRef]
- Katsara, K.; Psatha, K.; Kenanakis, G.; Aivaliotis, M.; Papadakis, V.M. Subtyping on Live Lymphoma Cell Lines by Raman Spectroscopy. Materials 2022, 15, 546. [Google Scholar] [CrossRef]
- Tay, L.L.; Tremblay, R.G.; Hulse, J.; Zurakowski, B.; Thompson, M.; Bani-Yaghoub, M. Detection of acute brain injury by Raman spectral signature. Analyst 2011, 136, 1620–1626. [Google Scholar] [CrossRef] [PubMed]
- Hadjiivanov, K.I.; Panayotov, D.A.; Mihaylov, M.Y.; Ivanova, E.Z.; Chakarova, K.K.; Andonova, S.M.; Drenchev, N.L. Power of Infrared and Raman Spectroscopies to Characterize Metal-Organic Frameworks and Investigate Their Interaction with Guest Molecules. Chem. Rev. 2021, 121, 1286–1424. [Google Scholar] [CrossRef]
- Marekha, B.A.; Bria, M.; Moreau, M.; De Waele, I.; Miannay, F.A.; Smortsova, Y.; Takamuku, T.; Kalugin, O.N.; Kiselev, M.; Idrissi, A. Intermolecular interactions in mixtures of 1-n-butyl-3-methylimidazolium acetate and water: Insights from IR, Raman, NMR spectroscopy and quantum chemistry calculations. J. Mol. Liq. 2015, 210, 227–237. [Google Scholar] [CrossRef]
- Freire, P.T.C.; Barboza, F.M.; Lima, J.A.; Melo, F.E.A.; Filho, J.M. Raman Spectroscopy of Amino Acid Crystals. Raman Spectrosc. Appl. 2017, 201, 171. [Google Scholar] [CrossRef]
- Papa, L.; Lewis, L.M.; Silvestri, S.; Falk, J.L.; Giordano, P.; Brophy, G.M.; Demery, J.A.; Liu, M.C.; Mo, J.; Akinyi, L.; et al. Serum levels of ubiquitin C-terminal hydrolase distinguish mild traumatic brain injury from trauma controls and are elevated in mild and moderate traumatic brain injury patients with intracranial lesions and neurosurgical intervention. J. Trauma Acute Care Surg. 2012, 72, 1335–1344. [Google Scholar] [CrossRef]
- Bik, E.; Dorosz, A.; Mateuszuk, L.; Baranska, M.; Majzner, K. Fixed versus live endothelial cells: The effect of glutaraldehyde fixation manifested by characteristic bands on the Raman spectra of cells. Spectrochim. Acta Part A Mol. Biomol. Spectrosc. 2020, 240, 118460. [Google Scholar] [CrossRef]
- Ricciardi, A.; Piuri, G.; Della Porta, M.; Mazzucchelli, S.; Bonizzi, A.; Truffi, M.; Sevieri, M.; Allevi, R.; Corsi, F.; Cazzola, R.; et al. Raman spectroscopy characterization of the major classes of plasma lipoproteins. Vib. Spectrosc. 2020, 109, 103073. [Google Scholar] [CrossRef]
- Czamara, K.; Majzner, K.; Pacia, M.Z.; Kochan, K.; Kaczor, A.; Baranska, M. Raman spectroscopy of lipids: A review. J. Raman Spectrosc. 2015, 46, 4–20. [Google Scholar] [CrossRef]
- Huff, T.; Boyd, B.; Jialal, I. Physiology, Cholesterol. In StatPearls; StatPearls Publishing: Treasure Island, FL, USA, 2017. [Google Scholar]
- Ito, T.; Hamauchi, N.; Hagi, T.; Morohashi, N.; Hemmi, H.; Sato, Y.G.; Saito, T.; Yoshimura, T. D-serine metabolism and its importance in development of Dictyostelium discoideum. Front. Microbiol. 2018, 9, 334767. [Google Scholar] [CrossRef]
- Slotte, J.P. Biological functions of sphingomyelins. Prog. Lipid Res. 2013, 52, 424–437. [Google Scholar] [CrossRef]
- Kurek, K.; Łukaszuk, B.; Piotrowska, D.M.; Wiesiołek, P.; Chabowska, A.M.; Zendzian-Piotrowska, M. Metabolism, physiological role, and clinical implications of sphingolipids in gastrointestinal tract. BioMed Res. Int. 2013, 2013, 908907. [Google Scholar] [CrossRef] [PubMed]
- Novgorodov, S.A.; Riley, C.L.; Yu, J.; Borg, K.T.; Hannun, Y.A.; Proia, R.L.; Kindy, M.S.; Gudz, T.I. Essential roles of neutral ceramidase and sphingosine in mitochondrial dysfunction due to traumatic brain injury. J. Biol. Chem. 2014, 289, 13142–13154. [Google Scholar] [CrossRef] [PubMed]
- Buzgar, N.; Buzatu, A.; Sanislav, I. The Raman study on certain sulfates. Analele Stiintifice Univ. Al. I. Cuza 2009, 55, 5–23. [Google Scholar]
- Uphoff, A.; Hermansson, M.; Haimi, P.; Somerharju, P. Analysis of complex lipidomes. In Medical Applications of Mass Spectrometry; Elsevier: Amsterdam, The Netherlands, 2008; pp. 223–249. [Google Scholar] [CrossRef]
- Freeman, J.J.; Wopenka, B.; Silva, M.J.; Pasteris, J.D. Raman spectroscopic detection of changes in bioapatite in mouse femora as a function of age and in vitro fluoride treatment. Calcif. Tissue Int. 2001, 68, 156–162. [Google Scholar] [CrossRef] [PubMed]
- Cao, Y.; Shen, D.; Lu, Y.; Huang, Y. A Raman-scattering Study on the Net Orientation of Biomacromolecules in the Outer Epidermal Walls of Mature Wheat Stems (Triticum aestivum). Ann. Bot. 2006, 97, 1091–1094. [Google Scholar] [CrossRef]
- Farber, C.; Shires, M.; Ong, K.; Byrne, D.; Kurouski, D. Raman spectroscopy as an early detection tool for rose rosette infection. Planta 2019, 250, 1247–1254. [Google Scholar] [CrossRef] [PubMed]
- Timchenko, E.V.; Zherdeva, L.A.; Timchenko, P.E.; Volova, L.T.; Ponomareva, U.V. Detailed Analysis of the Structural Changes of Bone Matrix during the Demineralization Process Using Raman Spectroscopy. Phys. Procedia 2015, 73, 221–227. [Google Scholar] [CrossRef]
- Calcagnile, O.; Anell, A.; Undén, J. The addition of S100B to guidelines for management of mild head injury is potentially cost saving. BMC Neurol. 2016, 16, 200. [Google Scholar] [CrossRef] [PubMed]
- Li, Y.; Pan, J.; Chen, G.; Li, C.; Lin, S.; Shao, Y.; Feng, S.; Huang, Z.; Xie, S.; Zeng, H.; et al. Micro-Raman spectroscopy study of cancerous and normal nasopharyngeal tissues. J. Biomed. Opt. 2013, 18, 027003. [Google Scholar] [CrossRef] [PubMed]
- Girard, A.; Cooper, A.; Mabbott, S.; Bradley, B.; Asiala, S.; Jamieson, L.; Clucas, C.; Capewell, P.; Marchesi, F.; Gibbins, M.P.; et al. Raman spectroscopic analysis of skin as a diagnostic tool for Human African Trypanosomiasis. PLoS Pathog. 2021, 17, e1010060. [Google Scholar] [CrossRef]
- Menge, T.; Lalive, P.H.; Von Büdingen, H.C.; Cree, B.; Hauser, S.L.; Genain, C.P. Antibody responses against galactocerebroside are potential stage-specific biomarkers in multiple sclerosis. J. Allergy Clin. Immunol. 2005, 116, 453–459. [Google Scholar] [CrossRef]
- Podbielska, M.; Levery, S.B.; Hogan, E.L. The structural and functional role of myelin fast-migrating cerebrosides: Pathological importance in multiple sclerosis. Clin. Lipidol. 2011, 6, 159. [Google Scholar] [CrossRef] [PubMed]
- Thomas, I.; Dickens, A.M.; Posti, J.P.; Czeiter, E.; Duberg, D.; Sinioja, T.; Kråkström, M.; Retel Helmrich, I.R.A.; Wang, K.K.W.; Maas, A.I.R.; et al. Serum metabolome associated with severity of acute traumatic brain injury. Nat. Commun. 2022, 13, 2545. [Google Scholar] [CrossRef] [PubMed]
- Ayala, O.D.; Doster, R.S.; Manning, S.D.; O’Brien, C.M.; Aronoff, D.M.; Gaddy, J.A.; Mahadevan-Jansen, A. Raman microspectroscopy differentiates perinatal pathogens on ex vivo infected human fetal membrane tissues. J. Biophotonics 2019, 12, e201800449. [Google Scholar] [CrossRef] [PubMed]
- Palings, I.; Van den Berg, E.; Mathies, R.A.; Pardoen, J.A.; Winkel, C.; Lugtenburg, J. Assignment of Fingerprint Vibrations in the Resonance Raman Spectra of Rhodopsin, Isorhodopsin, and Bathorhodopsin: Implications for Chromophore Structure and Environment. Biochemistry 1987, 26, 2544–2556. [Google Scholar] [CrossRef]
- Dhanani, T.; Dou, T.; Biradar, K.; Jifon, J.; Kurouski, D.; Patil, B.S. Raman Spectroscopy Detects Changes in Carotenoids on the Surface of Watermelon Fruits during Maturation. Front. Plant Sci. 2022, 13, 832522. [Google Scholar] [CrossRef]
- Liu, F.; Gu, H.; Yuan, X.; Lin, Y.; Dong, X. Chloride ion-dependent surface-enhanced Raman scattering study of biotin on the silver surface. J. Phys. Conf. Ser. 2011, 277, 012025. [Google Scholar] [CrossRef]
- Zhang, X.; Zhou, Q.; Huang, Y.; Li, Z.; Zhang, Z. Contrastive Analysis of the Raman Spectra of Polychlorinated Benzene: Hexachlorobenzene and Benzene. Sensors 2011, 11, 11510–11515. [Google Scholar] [CrossRef] [PubMed]
- Khnykina, K.A.; Kireev, V.V.; Krunina, N.V.; Kundikova, N.D.; Verina, E.V. Influence of Environment on Raman Spectra of Glycine and Prospect of Their Use for Functional Diagnostics of Human Beings. In Proceedings of the 2018 Global Smart Industry Conference (GloSIC), Chelyabinsk, Russia, 13–15 November 2018. [Google Scholar] [CrossRef]
- Quilès, F.; Burneau, A. Infrared and Raman spectra of alkaline-earth and copper(II) acetates in aqueous solutions. Vib. Spectrosc. 1998, 16, 105–117. [Google Scholar] [CrossRef]
- Asher, I.M.; Rothschild, K.J.; Anastassakis, E.; Stanley, H.E. Raman Spectroscopy of Uncomplexed Valinomycin. 1. The Solid State. J. Am. Chem. Soc. 1977, 99, 2024–2032. [Google Scholar] [CrossRef] [PubMed]
- Duraipandian, S.; Traynor, D.; Kearney, P.; Martin, C.; O’Leary, J.J.; Lyng, F.M. Raman spectroscopic detection of high-grade cervical cytology: Using morphologically normal appearing cells. Sci. Rep. 2018, 8, 15048. [Google Scholar] [CrossRef]
- Guimarães, A.E.; Pacheco, M.T.T.; Silveira, L.; Barsottini, D.; Duarte, J.; Villaverde, A.B.; Zângaro, R.A. Near Infrared Raman Spectroscopy (NIRS): A technique for doping control. J. Spectrosc. 2006, 20, 185–194. [Google Scholar] [CrossRef]
- Liu, H.-H.; Lin, S.-H.; Yu, N.-T. Resonance Raman enhancement of phenyl ring vibrational modes in phenyl iron complex of myoglobin. Biophys. J. 1990, 57, 851–856. [Google Scholar] [CrossRef]
- Nava, V.; Frezzotti, M.L.; Leoni, B. Raman Spectroscopy for the Analysis of Microplastics in Aquatic Systems. Appl. Spectrosc. 2021, 75, 1341–1357. [Google Scholar] [CrossRef]
- Bock, P.; Gierlinger, N. Infrared and Raman spectra of lignin substructures: Coniferyl alcohol, abietin, and coniferyl aldehyde. J. Raman Spectrosc. 2019, 50, 778–792. [Google Scholar] [CrossRef]
- Ramirez-Perez, J.C.; Durigo, D. Surface-Enhanced Raman Spectroscopy (SERS) for characterization SARS-CoV-2. J. Saudi Chem. Soc. 2022, 26, 101531. [Google Scholar] [CrossRef]
- Maia, L.F.; Fernandes, R.F.; Almeida, M.R.; de Oliveira, L.F.C. Rapid assessment of chemical compounds from Phyllogorgia dilatata using Raman spectroscopy. Rev. Bras. Farmacogn. 2015, 25, 619–626. [Google Scholar] [CrossRef]
- Tong, D.; Chen, C.; Zhang, J.J.; Lv, G.D.; Zheng, X.; Zhang, Z.; Lv, X. Application of Raman spectroscopy in the detection of hepatitis B virus infection. Photodiagnosis Photodyn. Ther. 2019, 28, 248–252. [Google Scholar] [CrossRef]
- Rygula, A.; Majzner, K.; Marzec, K.M.; Kaczor, A.; Pilarczyk, M.; Baranska, M. Raman spectroscopy of proteins: A review. J. Raman Spectrosc. 2013, 44, 1061–1076. [Google Scholar] [CrossRef]
- Bankapur, A.; Zachariah, E.; Chidangil, S.; Valiathan, M.; Mathur, D. Raman Tweezers Spectroscopy of Live, Single Red and White Blood Cells. PLoS ONE 2010, 5, e10427. [Google Scholar] [CrossRef] [PubMed]
- Cañamares, M.V.; Pozzi, F.; Lombardi, J.R. Raman, SERS, and DFT Analysis of the Main Alkaloids Contained in Syrian Rue. J. Phys. Chem. C 2019, 123, 9262–9271. [Google Scholar] [CrossRef]
- Anjos, O.; Guiné, R.P.F.; Santos, A.J.A.; Paula, V.B.; Pereira, H.; Estevinho, L.M. Evaluation of FT-Raman and FTIR-ATR spectroscopy for the quality evaluation of Lavandula spp. Honey. Open Agric. 2021, 6, 47–56. [Google Scholar] [CrossRef]
- Moosavinejad, S.M.; Madhoushi, M.; Vakili, M.; Rasouli, D.; Moosavinejad, S.M.; Madhoushi, M.; Vakili, M.; Rasouli, D. Evaluation of degradation in chemical compounds of wood in historical buildings using FT-IR and FT-Raman vibrational spectroscopy. Maderas. Cienc. Tecnol. 2019, 21, 381–392. [Google Scholar] [CrossRef]
- Fiedler, A.; Baranska, M.; Schulz, H. FT-Raman spectroscopy—A rapid and reliable quantification protocol for the determination of natural indigo dye in Polygonum tinctorium. J. Raman Spectrosc. 2011, 42, 551–557. [Google Scholar] [CrossRef]
- Gao, J.; Gu, H.; Dong, X.; Liu, F. The determination of captopril in Solution by Raman spectroscopy. J. Phys. Conf. Ser. 2011, 277, 012009. [Google Scholar] [CrossRef]
- Zheng, L.Q.; Servalli, M.; Schlüter, A.D.; Zenobi, R. Tip-enhanced Raman spectroscopy for structural analysis of two-dimensional covalent monolayers synthesized on water and on Au (111). Chem. Sci. 2019, 10, 9673–9678. [Google Scholar] [CrossRef]
- Tsutsumi, N.; Kimura, T.; Arita, K.; Ariyoshi, M.; Ohnishi, H.; Yamamoto, T.; Zuo, X.; Maenaka, K.; Park, E.Y.; Kondo, N.; et al. The structural basis for receptor recognition of human interleukin-18. Nat. Commun. 2014, 5, 5340. [Google Scholar] [CrossRef] [PubMed]
- Choquette, S.J.; Etz, E.S.; Hurst, W.S.; Blackburn, D.H.; Leigh, S.D. Relative Intensity Correction of Raman Spectrometers: NIST SRMs 2241 Through 2243 for 785 nm, 532 nm, and 488 nm. Appl. Spectrosc. 2007, 61, 117–129. [Google Scholar] [CrossRef] [PubMed]
- Jones, R.R.; Hooper, D.C.; Zhang, L.; Wolverson, D.; Valev, V.K. Raman Techniques: Fundamentals and Frontiers. Nanoscale Res. Lett. 2019, 14, 231. [Google Scholar] [CrossRef] [PubMed]
- Iannaccone, P.M.; Jacob, H.J. Rats! Dis. Model. Mech. 2009, 2, 206–210. [Google Scholar] [CrossRef]
- Weber, B.; Lackner, I.; Haffner-Luntzer, M.; Palmer, A.; Pressmar, J.; Scharffetter-Kochanek, K.; Knöll, B.; Schrezenemeier, H.; Relja, B.; Kalbitz, M. Modeling trauma in rats: Similarities to humans and potential pitfalls to consider. J. Transl. Med. 2019, 17, 305. [Google Scholar] [CrossRef] [PubMed]
- Basu, S.; Schtjltz, A.M.; Manju, B.; Roseman, S. Enzymatic Synthesis of Galactocerebroside by a Galactosyltransferase from Embryonic Chicken Brain. J. Biol. Chem. 1971, 246, 4272–4279. [Google Scholar] [CrossRef] [PubMed]
- Kaabia, Z.; Poirier, J.; Moughaizel, M.; Aguesse, A.; Billon-Crossouard, S.; Fall, F.; Durand, M.; Dagher, E.; Krempf, M.; Croyal, M. Plasma lipidomic analysis reveals strong similarities between lipid fingerprints in human, hamster and mouse compared to other animal species. Sci. Rep. 2018, 8, 15893. [Google Scholar] [CrossRef]
- Huang, F.; Bailey, L.S.; Gao, T.; Jiang, W.; Yu, L.; Bennett, D.A.; Zhao, J.; Basso, K.B.; Guo, Z. Analysis and Comparison of Mouse and Human Brain Gangliosides via Two-Stage Matching of MS/MS Spectra. ACS Omega 2022, 7, 6403–6411. [Google Scholar] [CrossRef]
- Jiang, Z.; Shen, T.; Huynh, H.; Fang, X.; Han, Z.; Ouyang, K. Cardiolipin Regulates Mitochondrial Ultrastructure and Function in Mammalian Cells. Genes 2022, 13, 1889. [Google Scholar] [CrossRef]
- Sabbagh, J.J.; Kinney, J.W.; Cummings, J.L. Alzheimer’s disease biomarkers in animal models: Closing the translational gap. Am. J. Neurodegener. Dis. 2013, 2, 108. [Google Scholar]
- Banbury, C.; Mason, R.; Styles, I.; Eisenstein, N.; Clancy, M.; Belli, A.; Logan, A.; Goldberg Oppenheimer, P. Development of the Self Optimising Kohonen Index Network (SKiNET) for Raman Spectroscopy Based Detection of Anatomical Eye Tissue. Sci. Rep. 2019, 9, 10812. [Google Scholar] [CrossRef]
- Lussier, F.; Thibault, V.; Charron, B.; Wallace, G.Q.; Masson, J.F. Deep learning and artificial intelligence methods for Raman and surface-enhanced Raman scattering. TrAC Trends Anal. Chem. 2020, 124, 115796. [Google Scholar] [CrossRef]
- Ward, M.D.; Weber, A.; Merrill, V.D.; Welch, R.D.; Bazarian, J.J.; Christenson, R.H. Predictive Performance of Traumatic Brain Injury Biomarkers in High-Risk Elderly Patients. J. Appl. Lab. Med. 2020, 5, 91–100. [Google Scholar] [CrossRef]
- Terrones, O.; Olazar-Intxausti, J.; Anso, I.; Lorizate, M.; Nieto-Garai, J.A.; Contreras, F.X. Raman Spectroscopy as a Tool to Study the Pathophysiology of Brain Diseases. Int. J. Mol. Sci. 2023, 24, 2384. [Google Scholar] [CrossRef] [PubMed]
- Ge, M.; Ge, M.; Wang, Y.; Wang, Y.; Wu, T.; Li, H.; Li, H.; Yang, C.; Chen, T.; Feng, H.; et al. Serum-based Raman spectroscopic diagnosis of blast-induced brain injury in a rat model. Biomed. Opt. Express 2023, 14, 3622–3634. [Google Scholar] [CrossRef] [PubMed]
Disclaimer/Publisher’s Note: The statements, opinions and data contained in all publications are solely those of the individual author(s) and contributor(s) and not of MDPI and/or the editor(s). MDPI and/or the editor(s) disclaim responsibility for any injury to people or property resulting from any ideas, methods, instructions or products referred to in the content. |
© 2023 by the authors. Licensee MDPI, Basel, Switzerland. This article is an open access article distributed under the terms and conditions of the Creative Commons Attribution (CC BY) license (https://creativecommons.org/licenses/by/4.0/).
Share and Cite
Harris, G.; Stickland, C.A.; Lim, M.; Goldberg Oppenheimer, P. Raman Spectroscopy Spectral Fingerprints of Biomarkers of Traumatic Brain Injury. Cells 2023, 12, 2589. https://doi.org/10.3390/cells12222589
Harris G, Stickland CA, Lim M, Goldberg Oppenheimer P. Raman Spectroscopy Spectral Fingerprints of Biomarkers of Traumatic Brain Injury. Cells. 2023; 12(22):2589. https://doi.org/10.3390/cells12222589
Chicago/Turabian StyleHarris, Georgia, Clarissa A. Stickland, Matthias Lim, and Pola Goldberg Oppenheimer. 2023. "Raman Spectroscopy Spectral Fingerprints of Biomarkers of Traumatic Brain Injury" Cells 12, no. 22: 2589. https://doi.org/10.3390/cells12222589