
Sphingolipid-Based Synergistic Interactions to Enhance Chemosensitivity in Lung Cancer Cells
 , , , , and
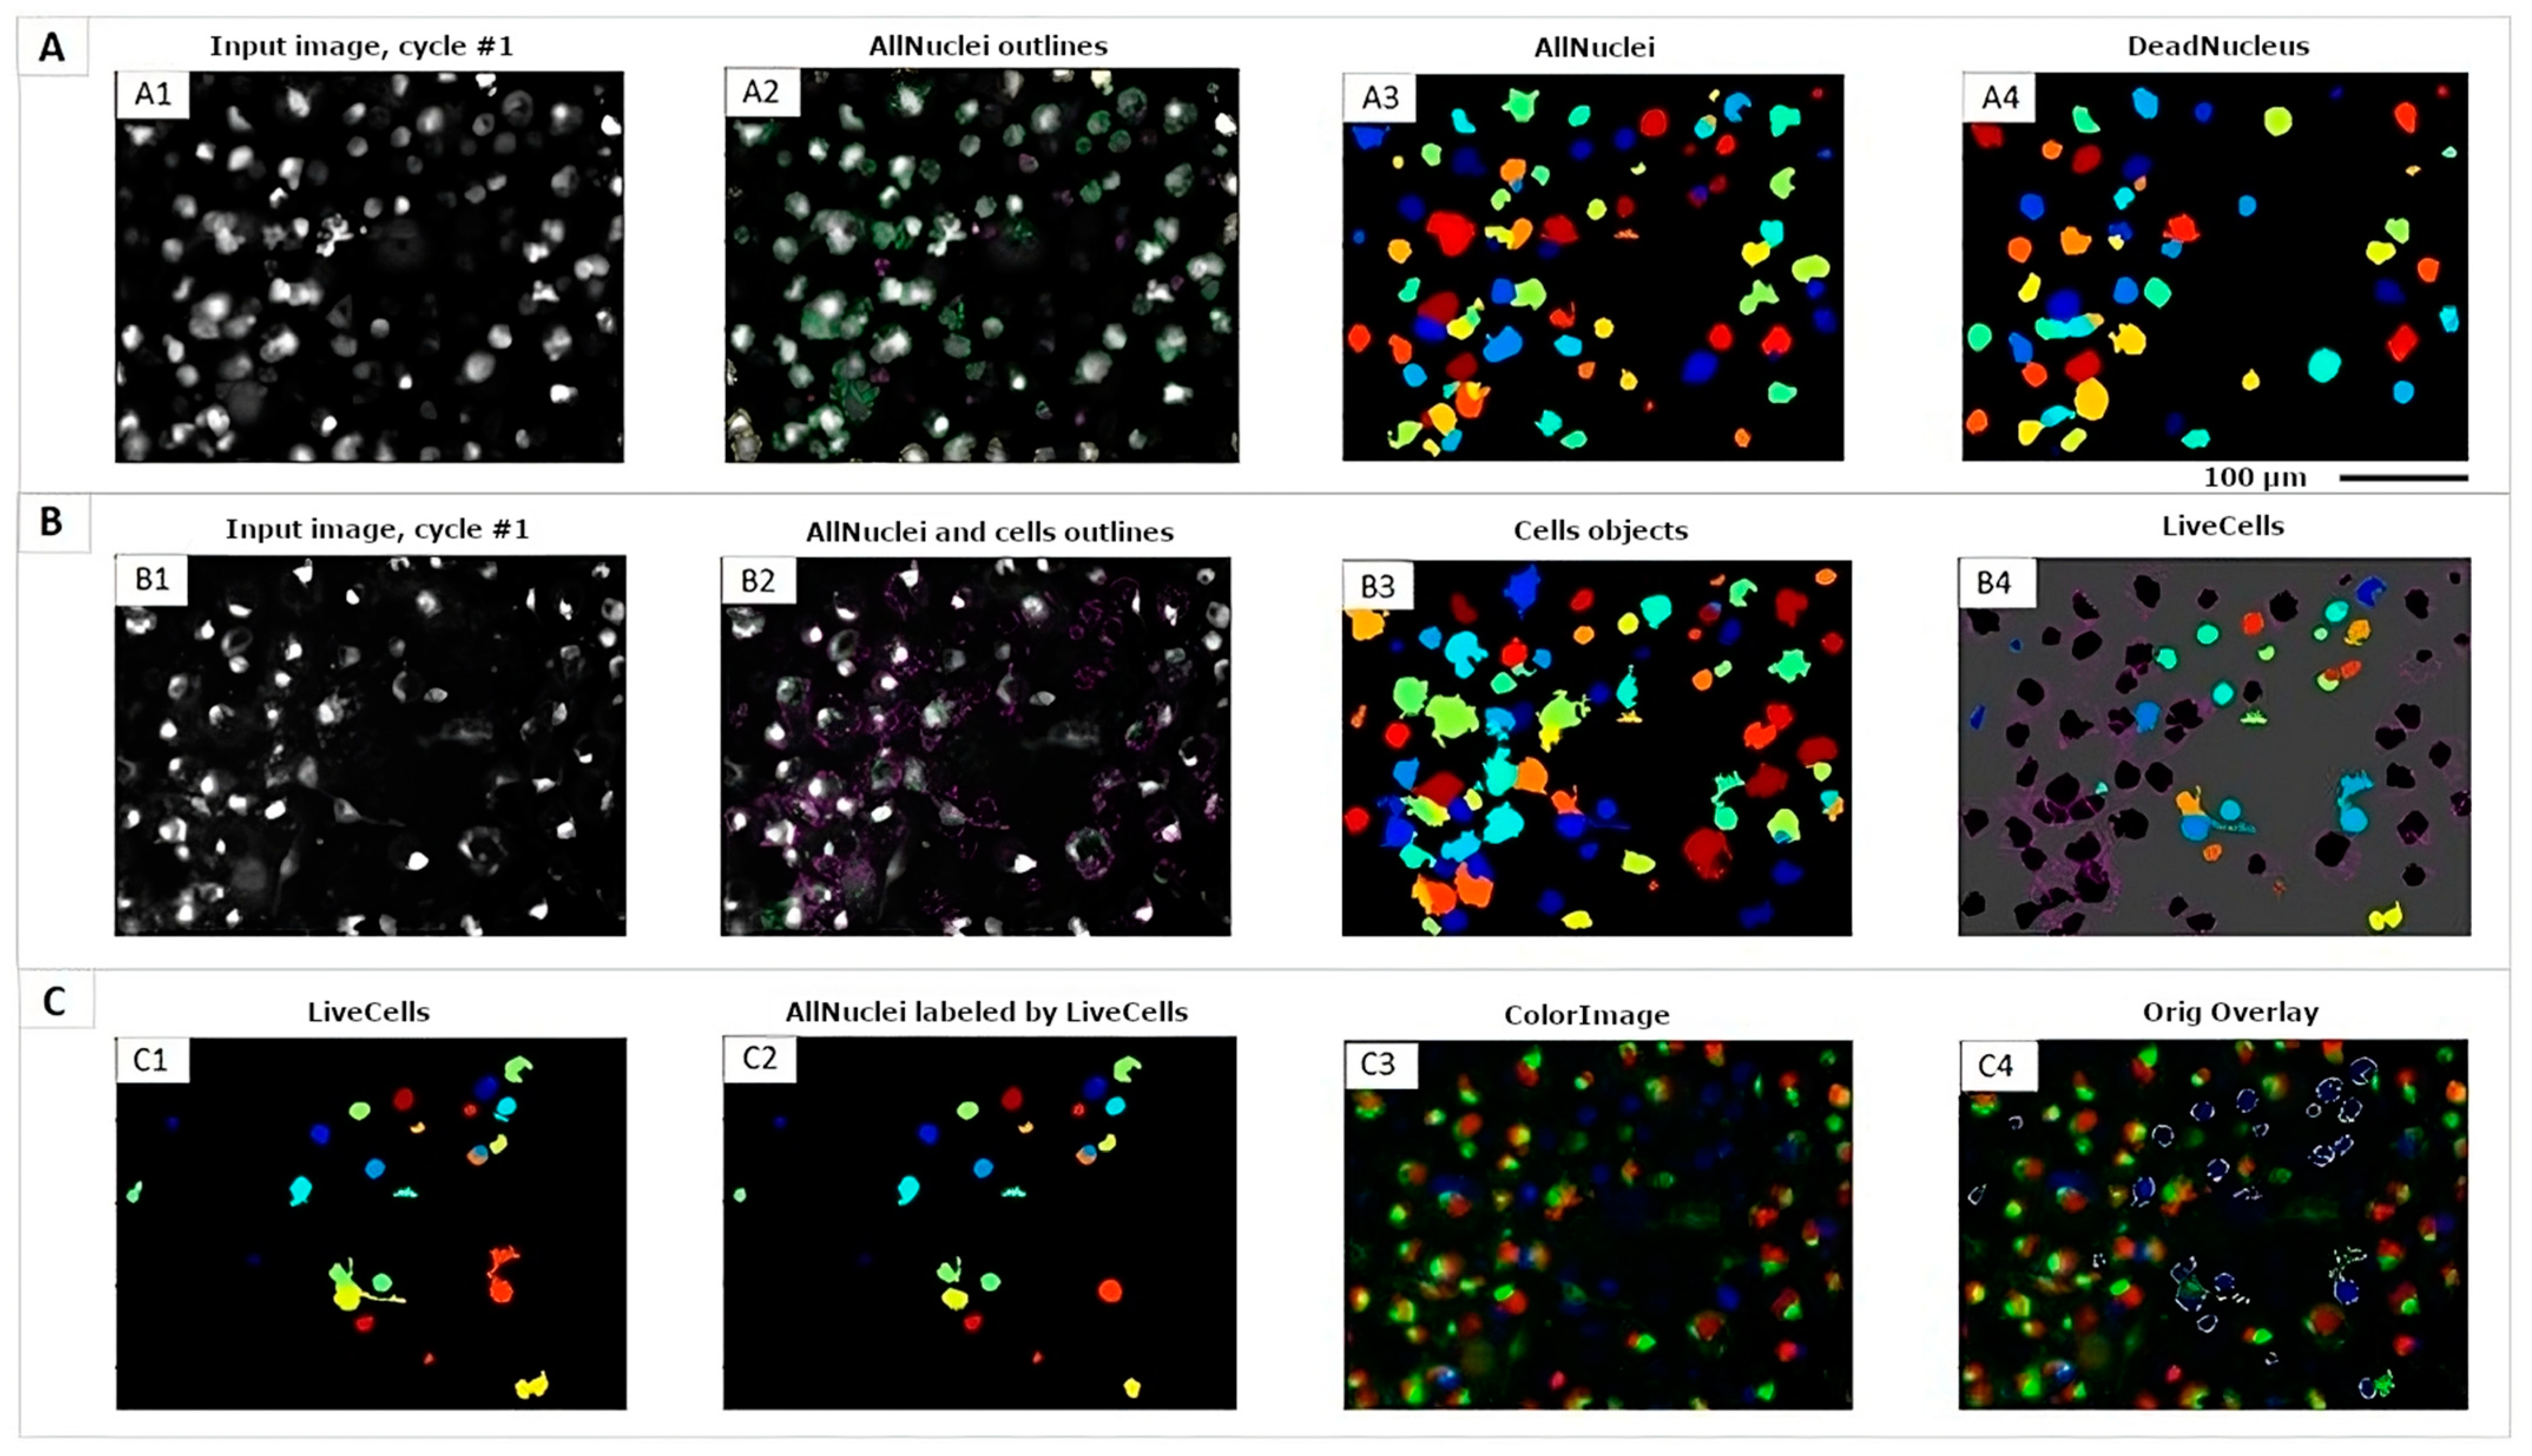
Abstract
:1. Introduction
2. Materials and Methods
2.1. Cell Culture for A549 Wild Type (WT)
2.2. mCherry-EGFP-LC3B Retroviral Vectors Assembly
2.3. Generation and Sorting of Stable A549 mCherry-EGFP-LC3B Cell Line
2.4. Evaluation of the SM-BOD Metabolism
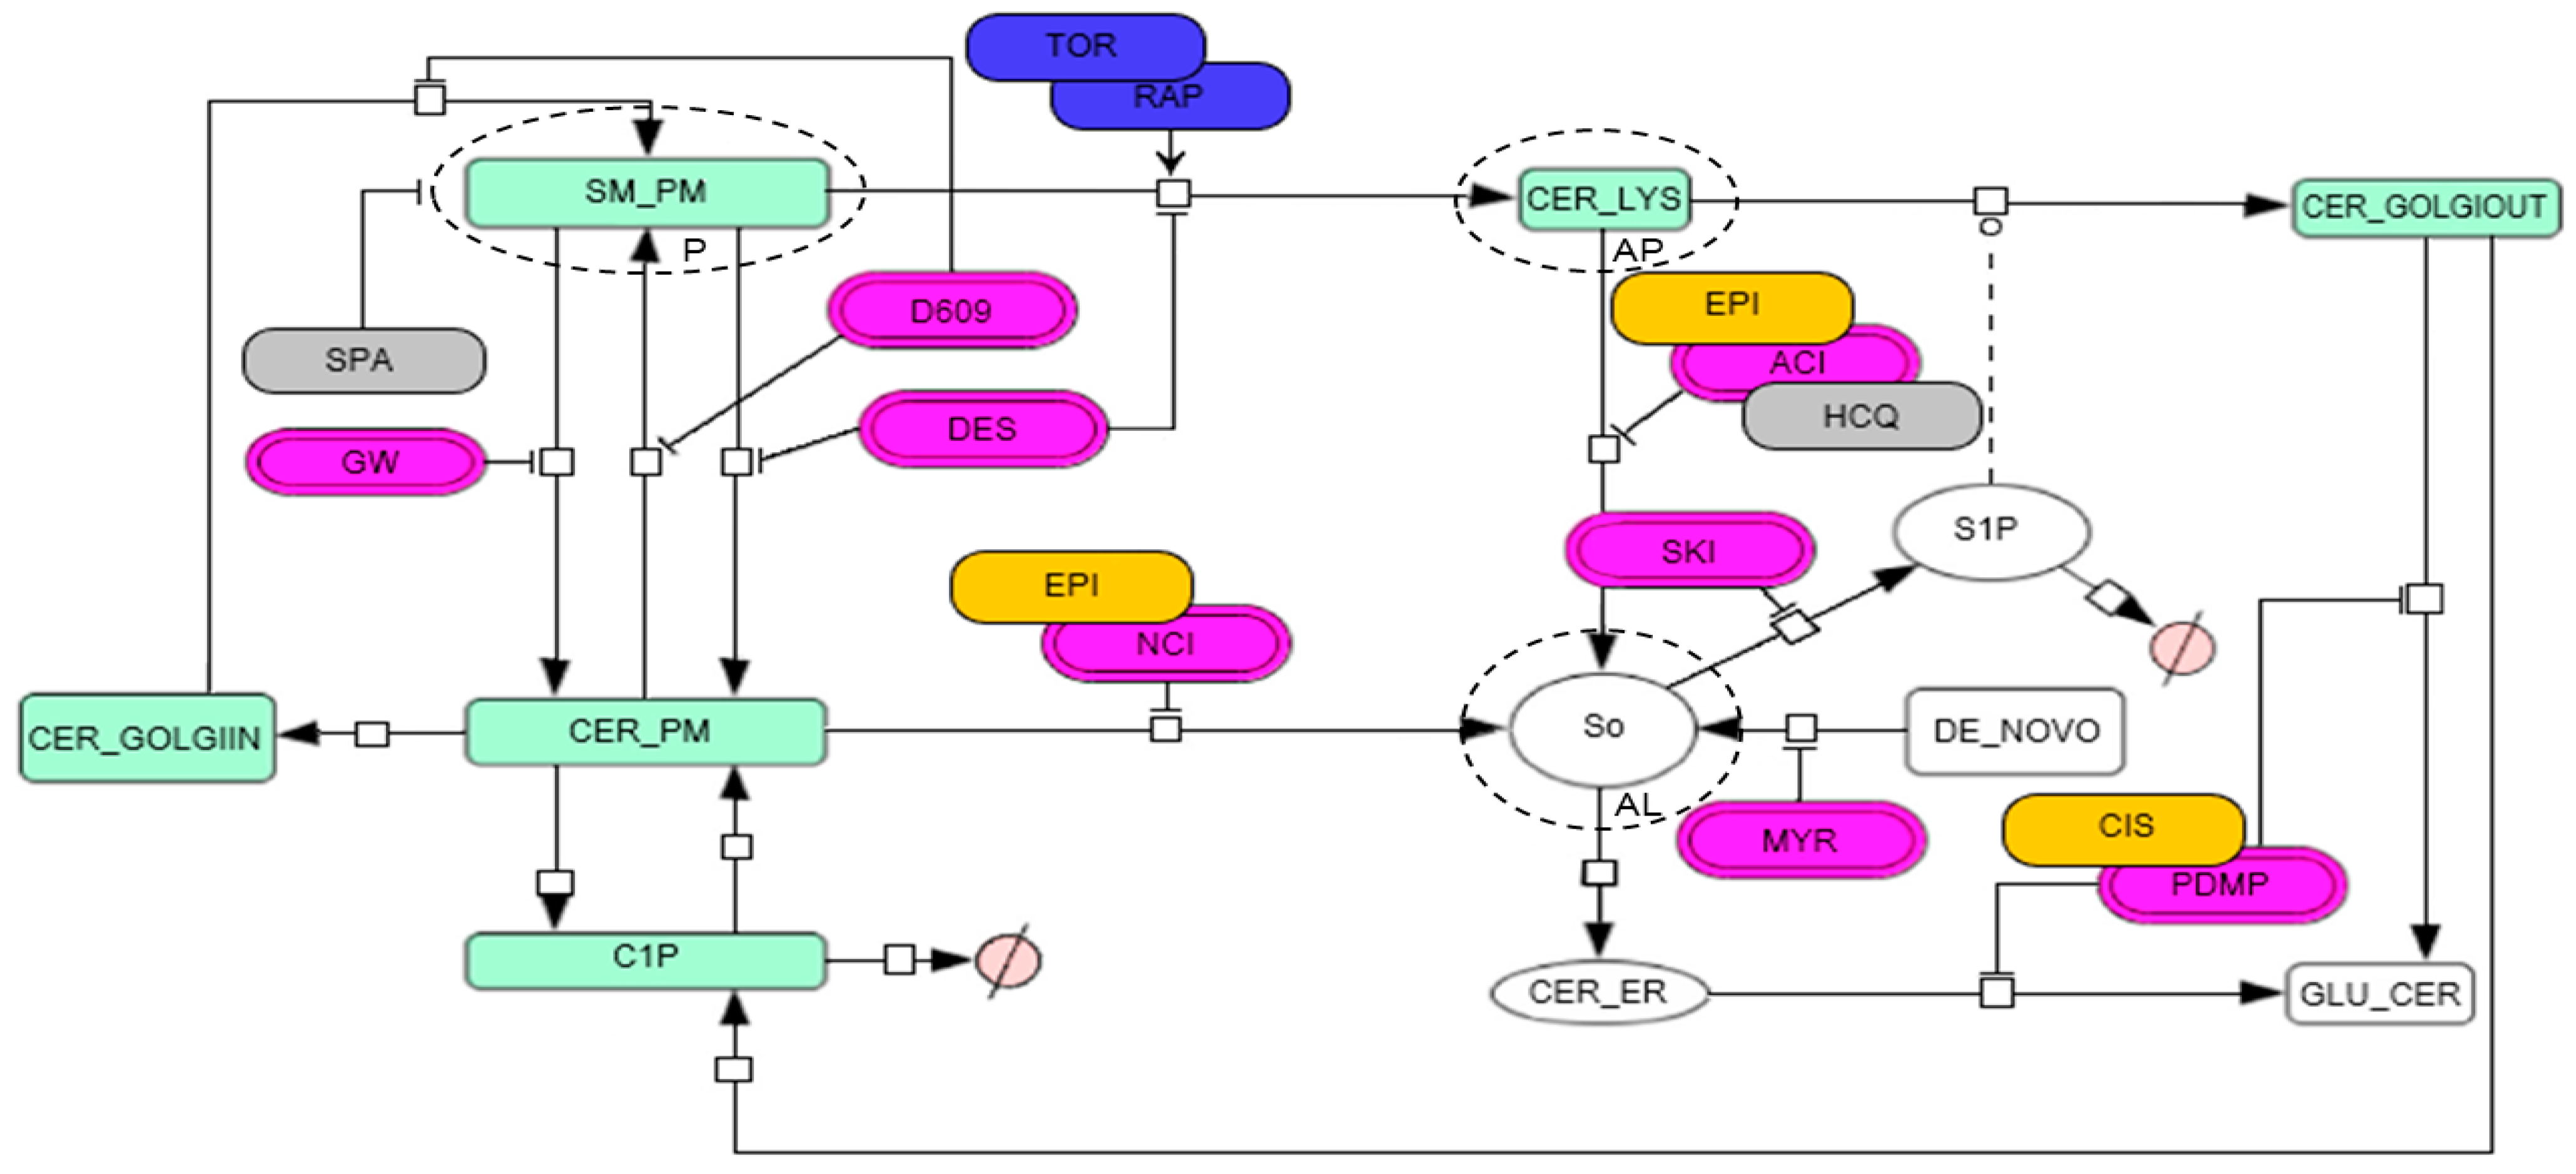
2.5. Model Topology for the Metabolic Fate of SM-BOD
3. Results
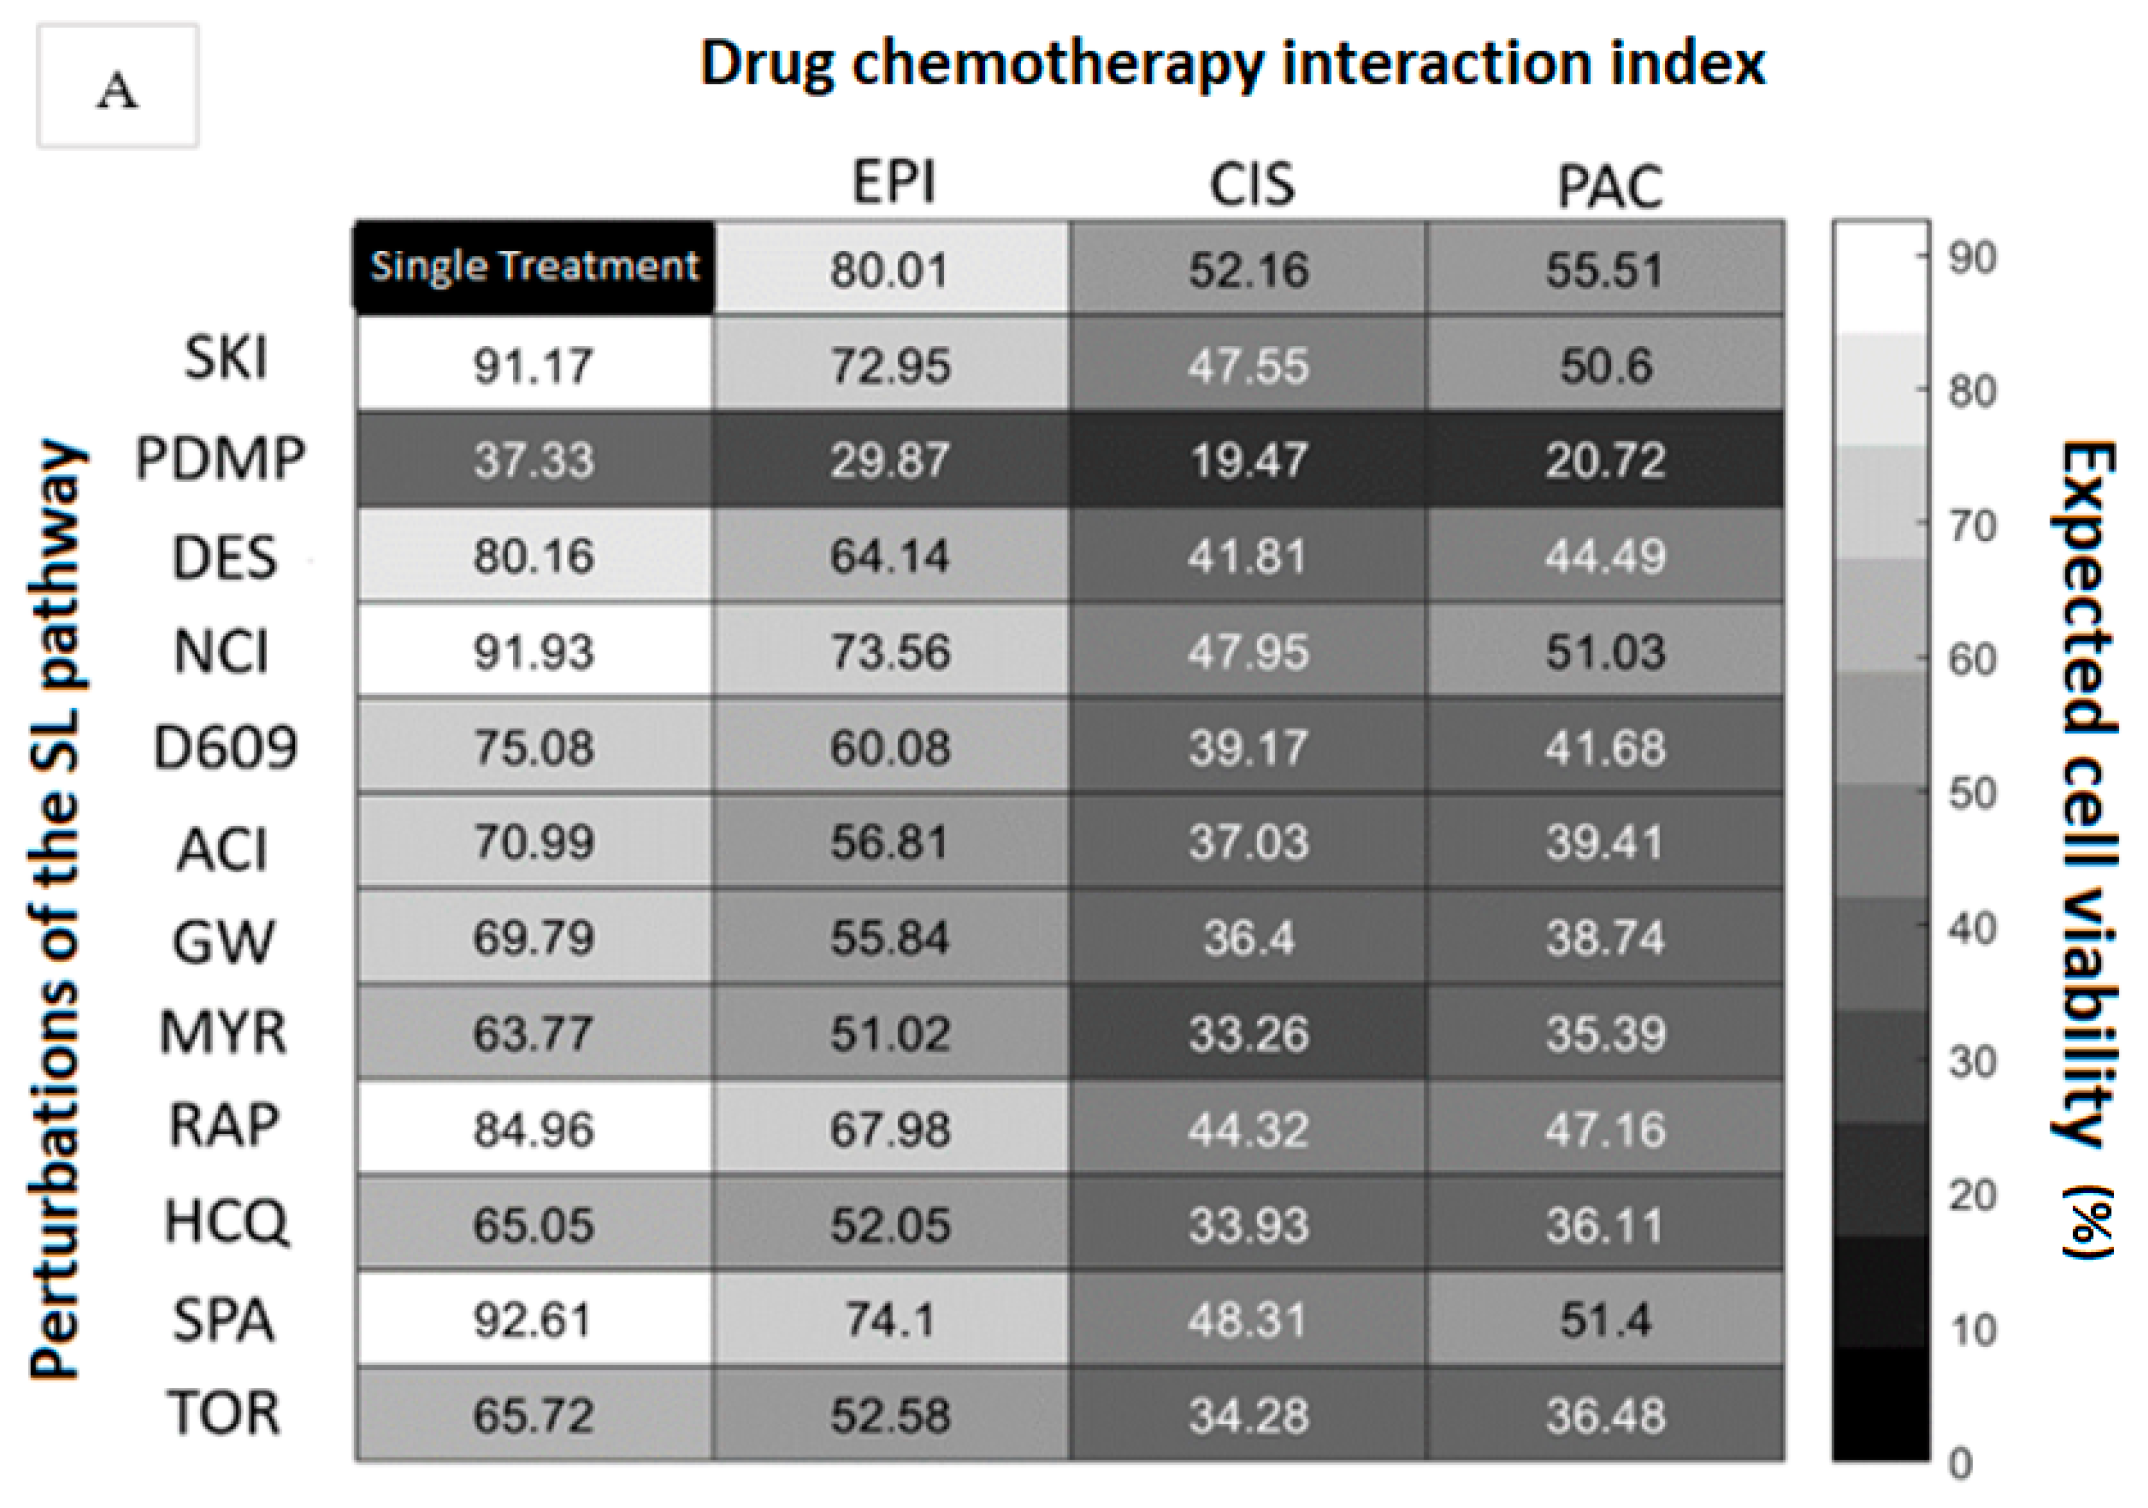
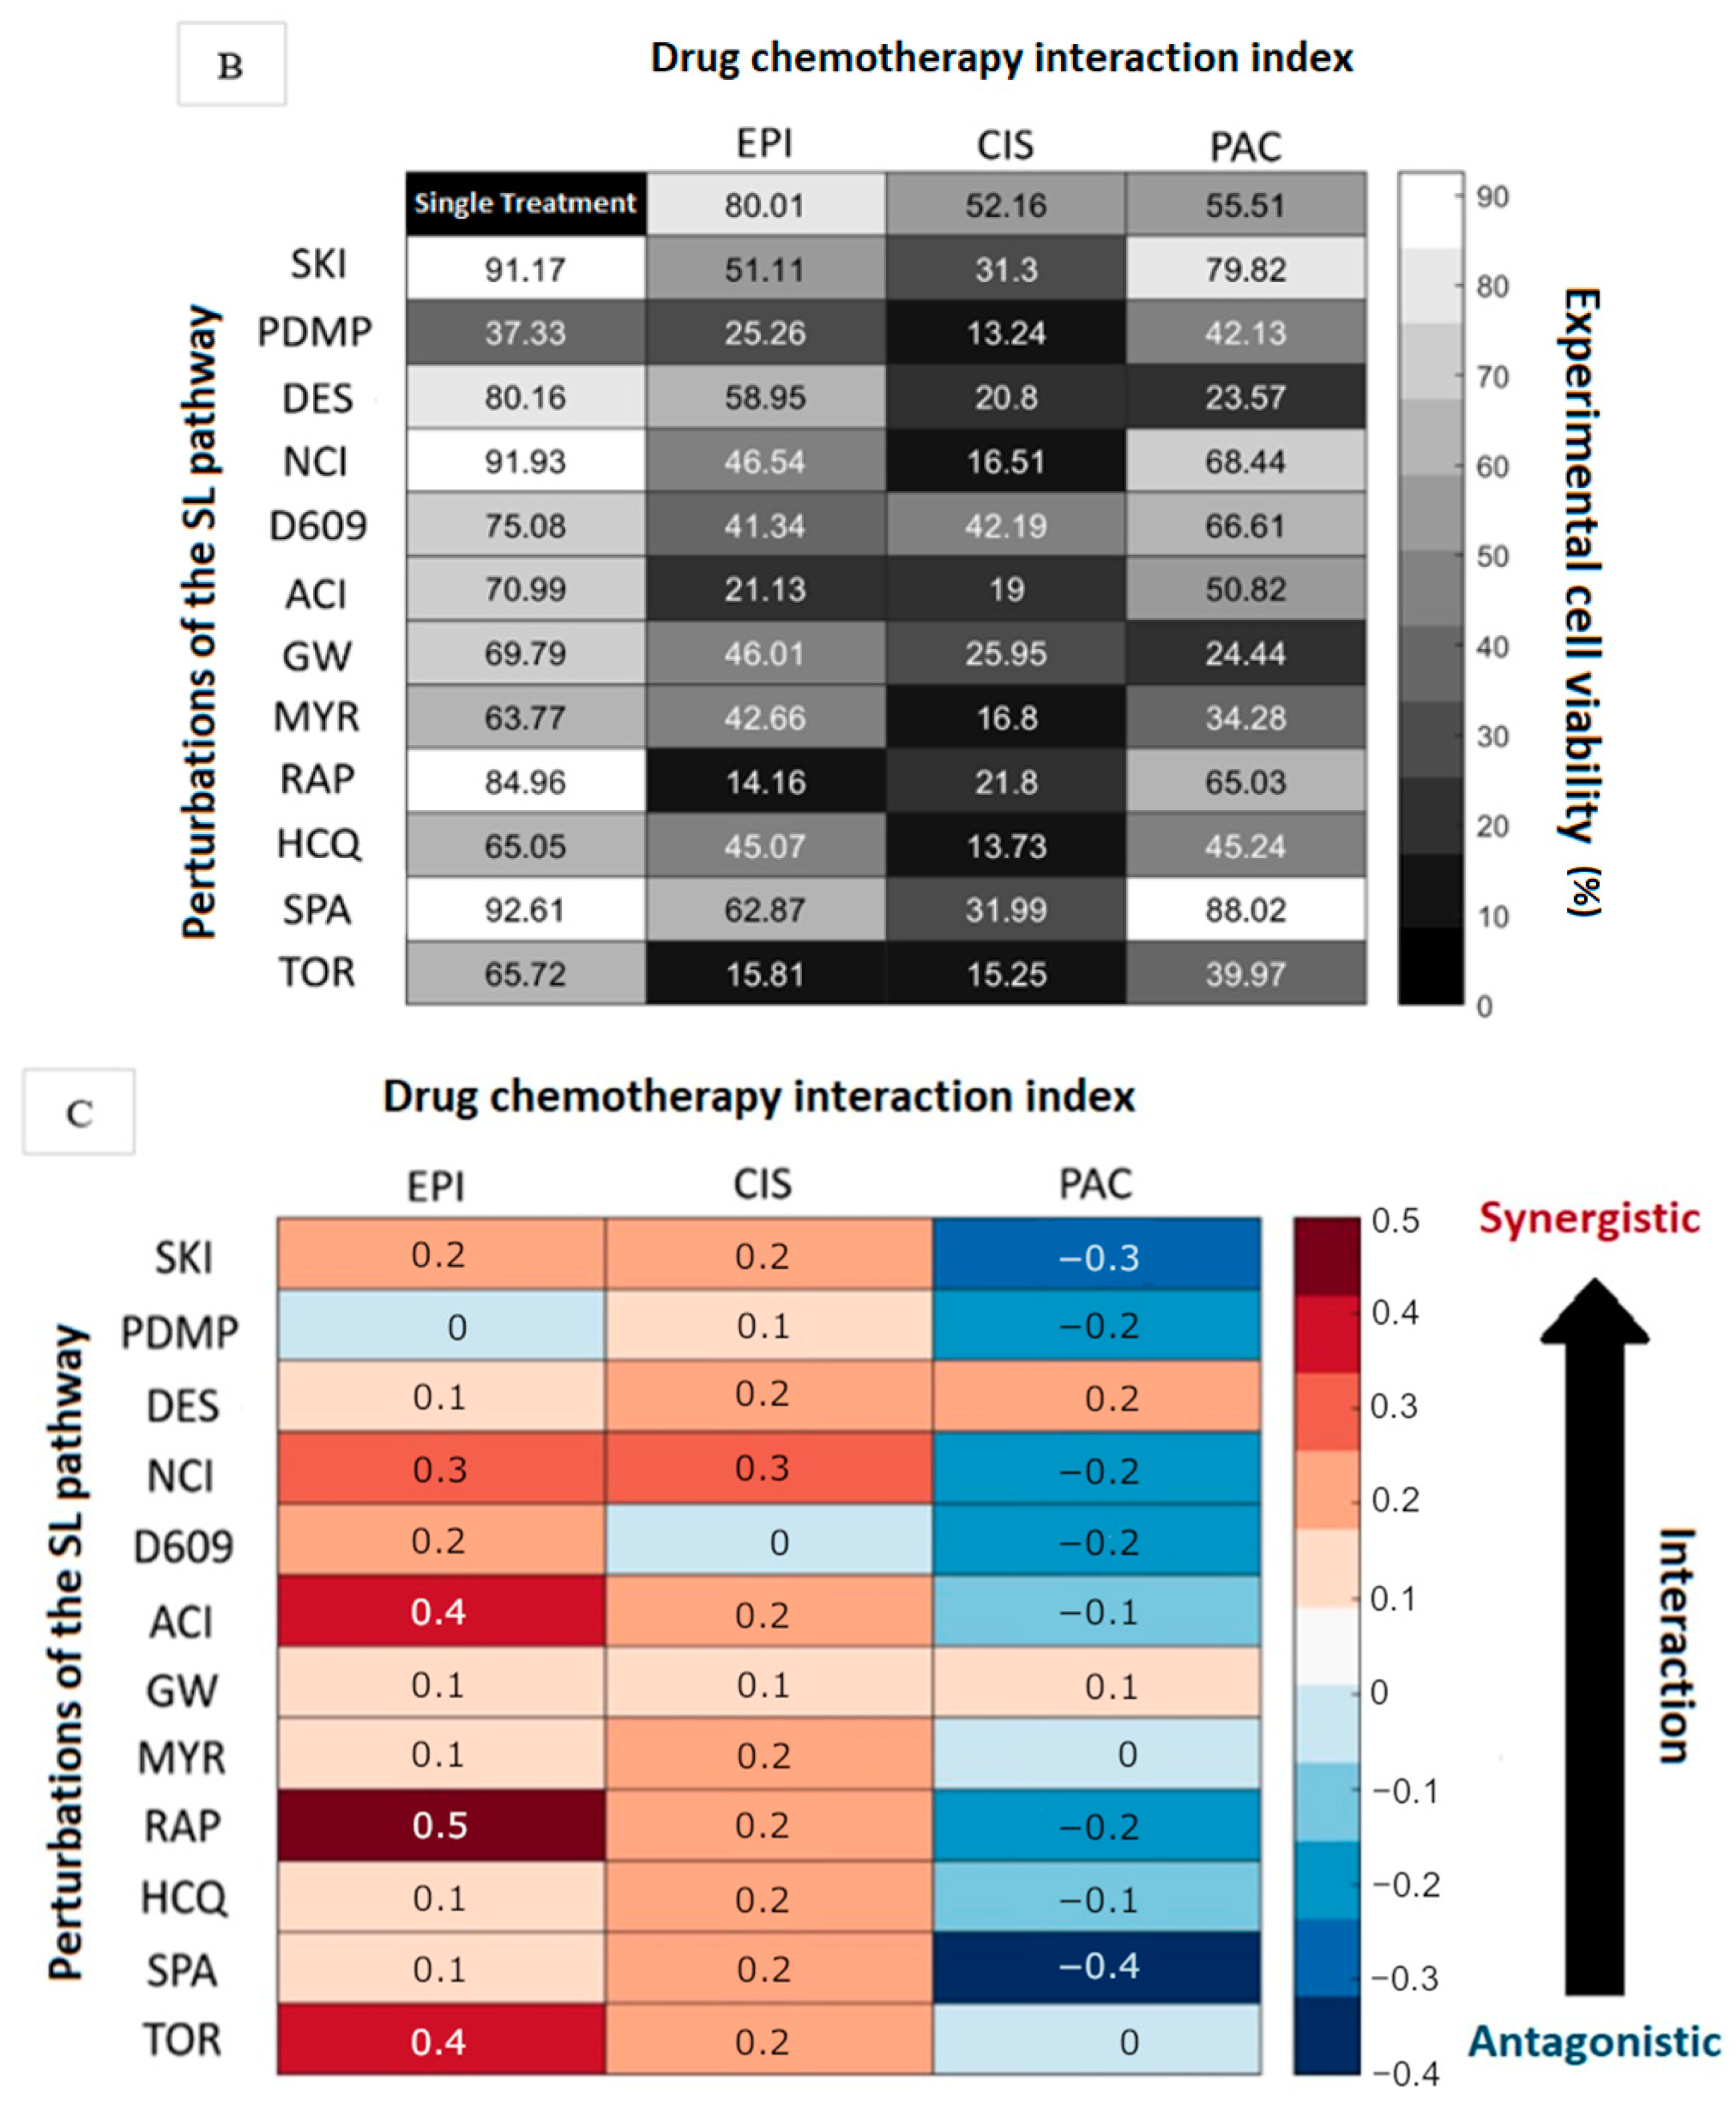
3.1. Chemotherapy Interacts with Autophagy Modulators and Inhibitors of the Sphingolipid Pathway to Modify Cytotoxicity
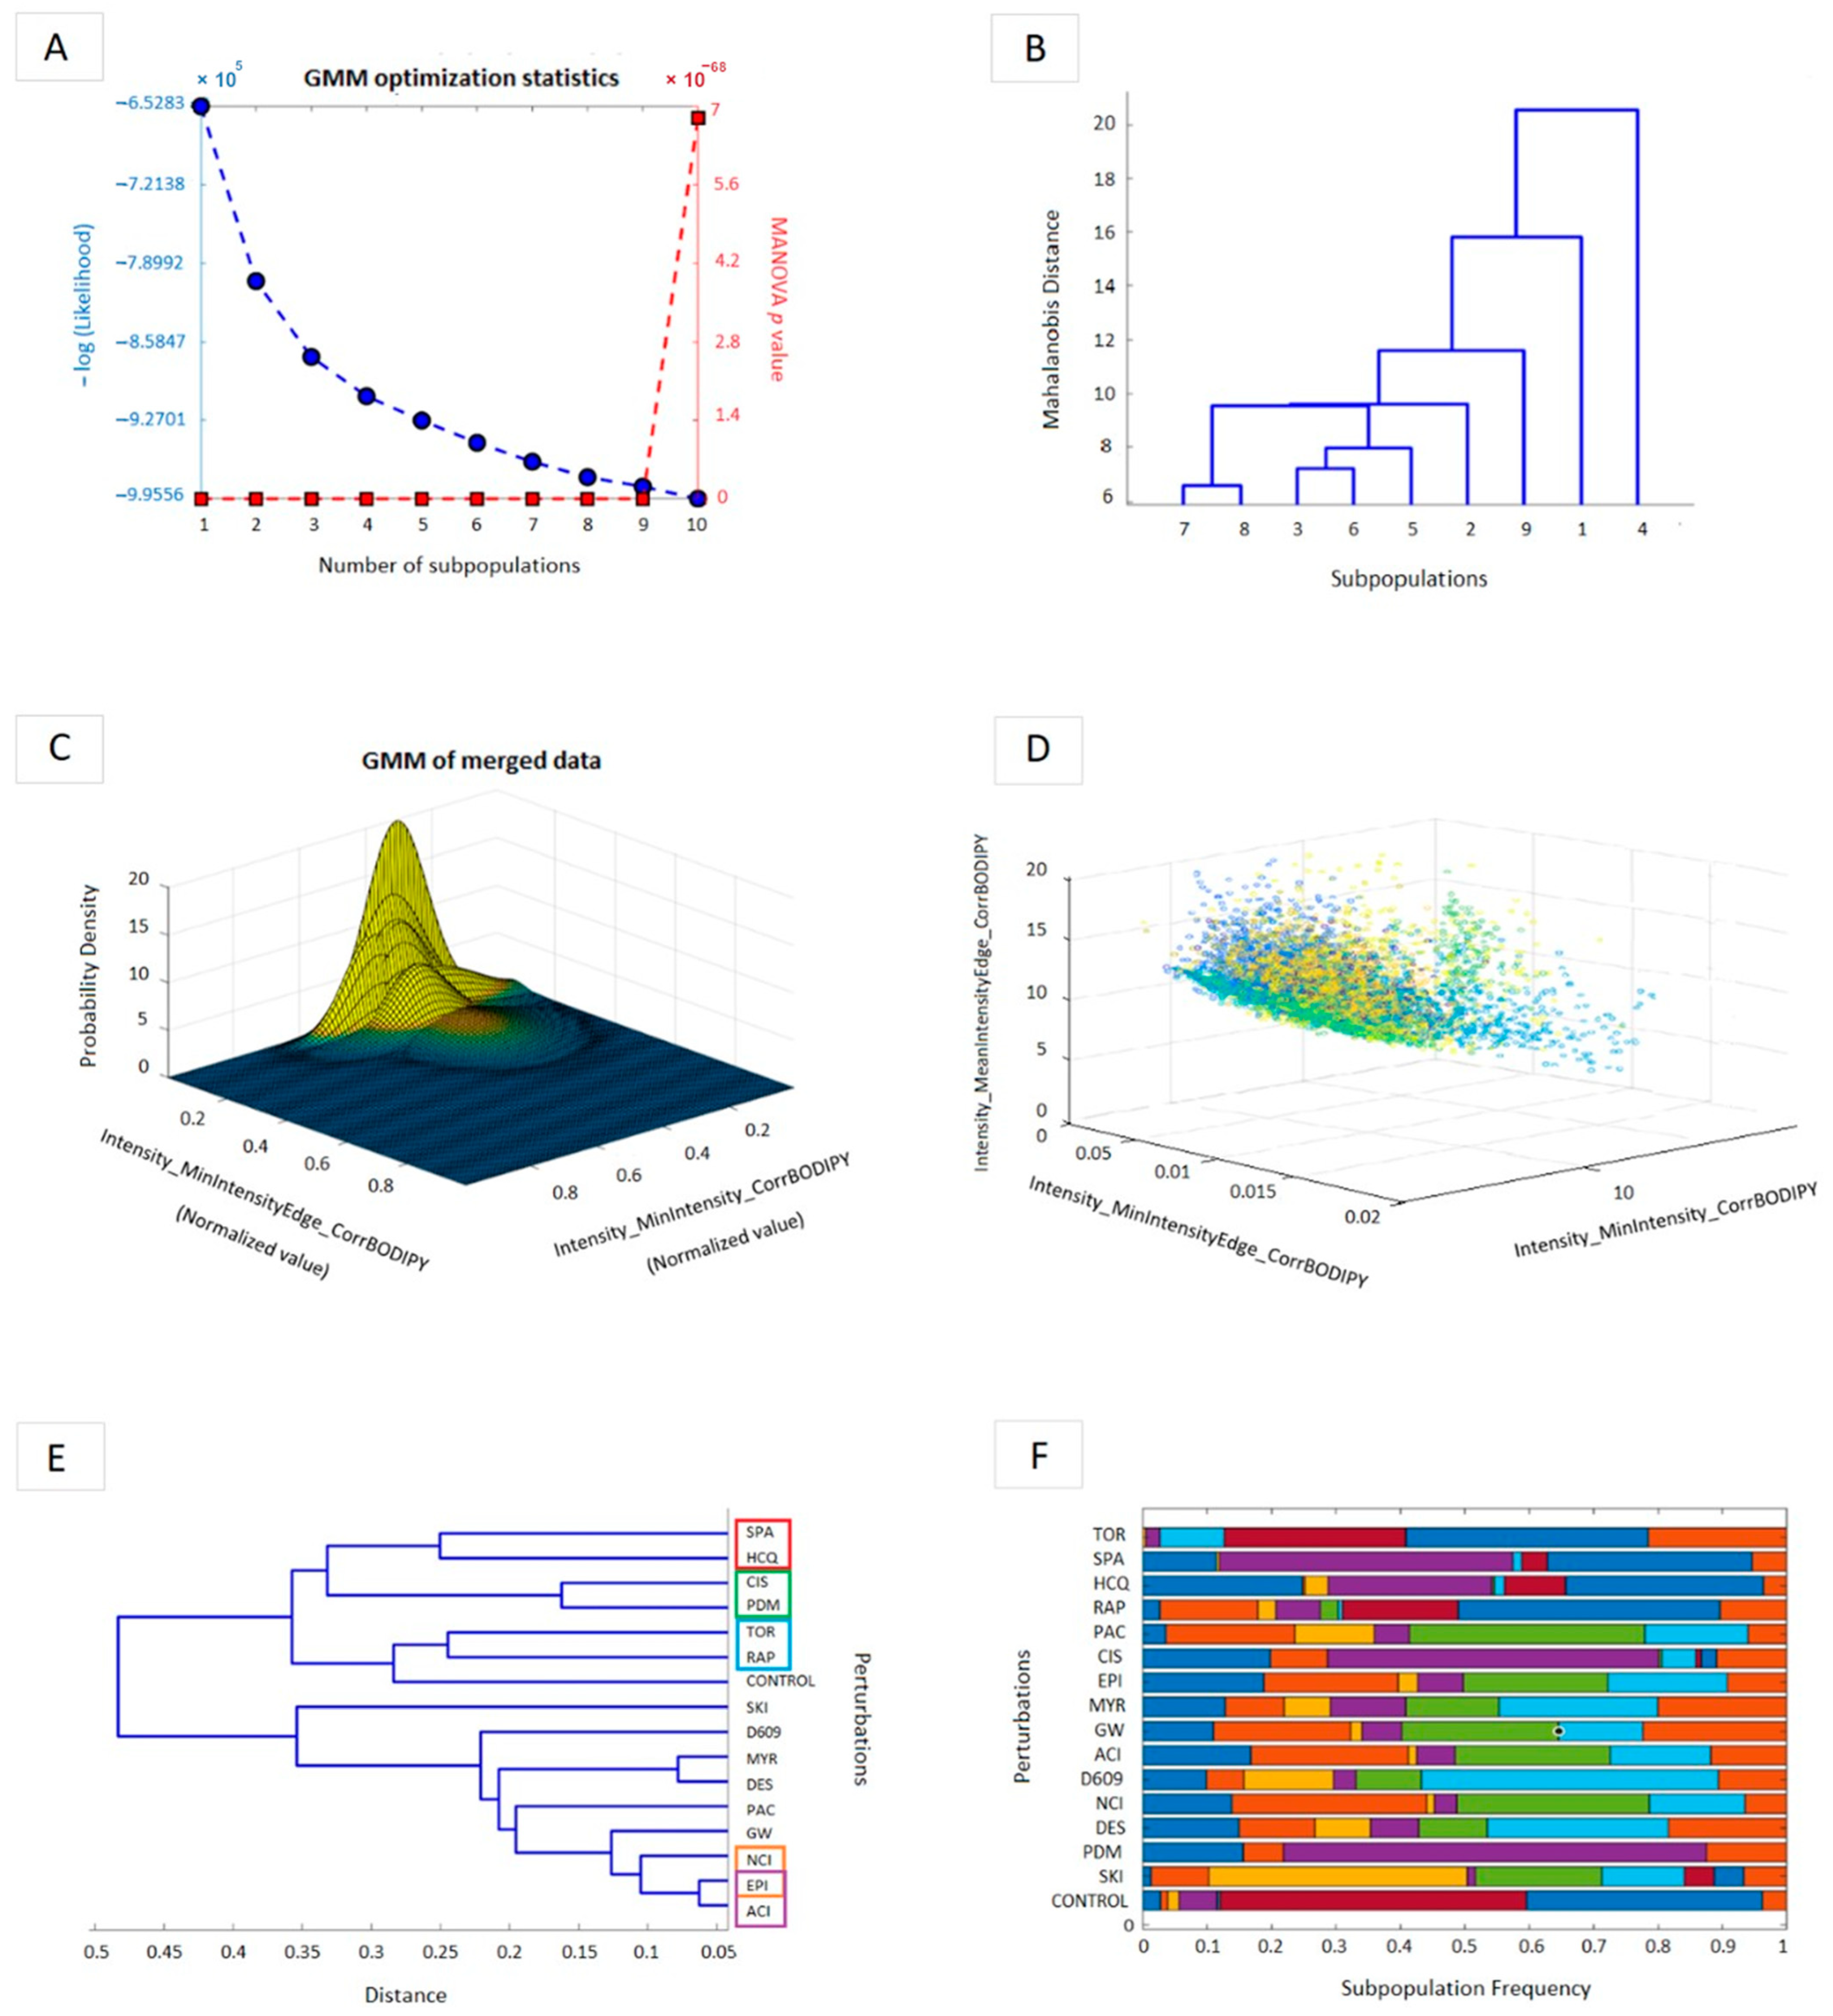
3.2. A GMM Model of Heterogeneity Profiles of the Metabolic Fate of a Fluorescent Sphingomyelin Analog Suggests the Mechanistic Base of the Synergistic Interactions Mapped to the SL Pathway
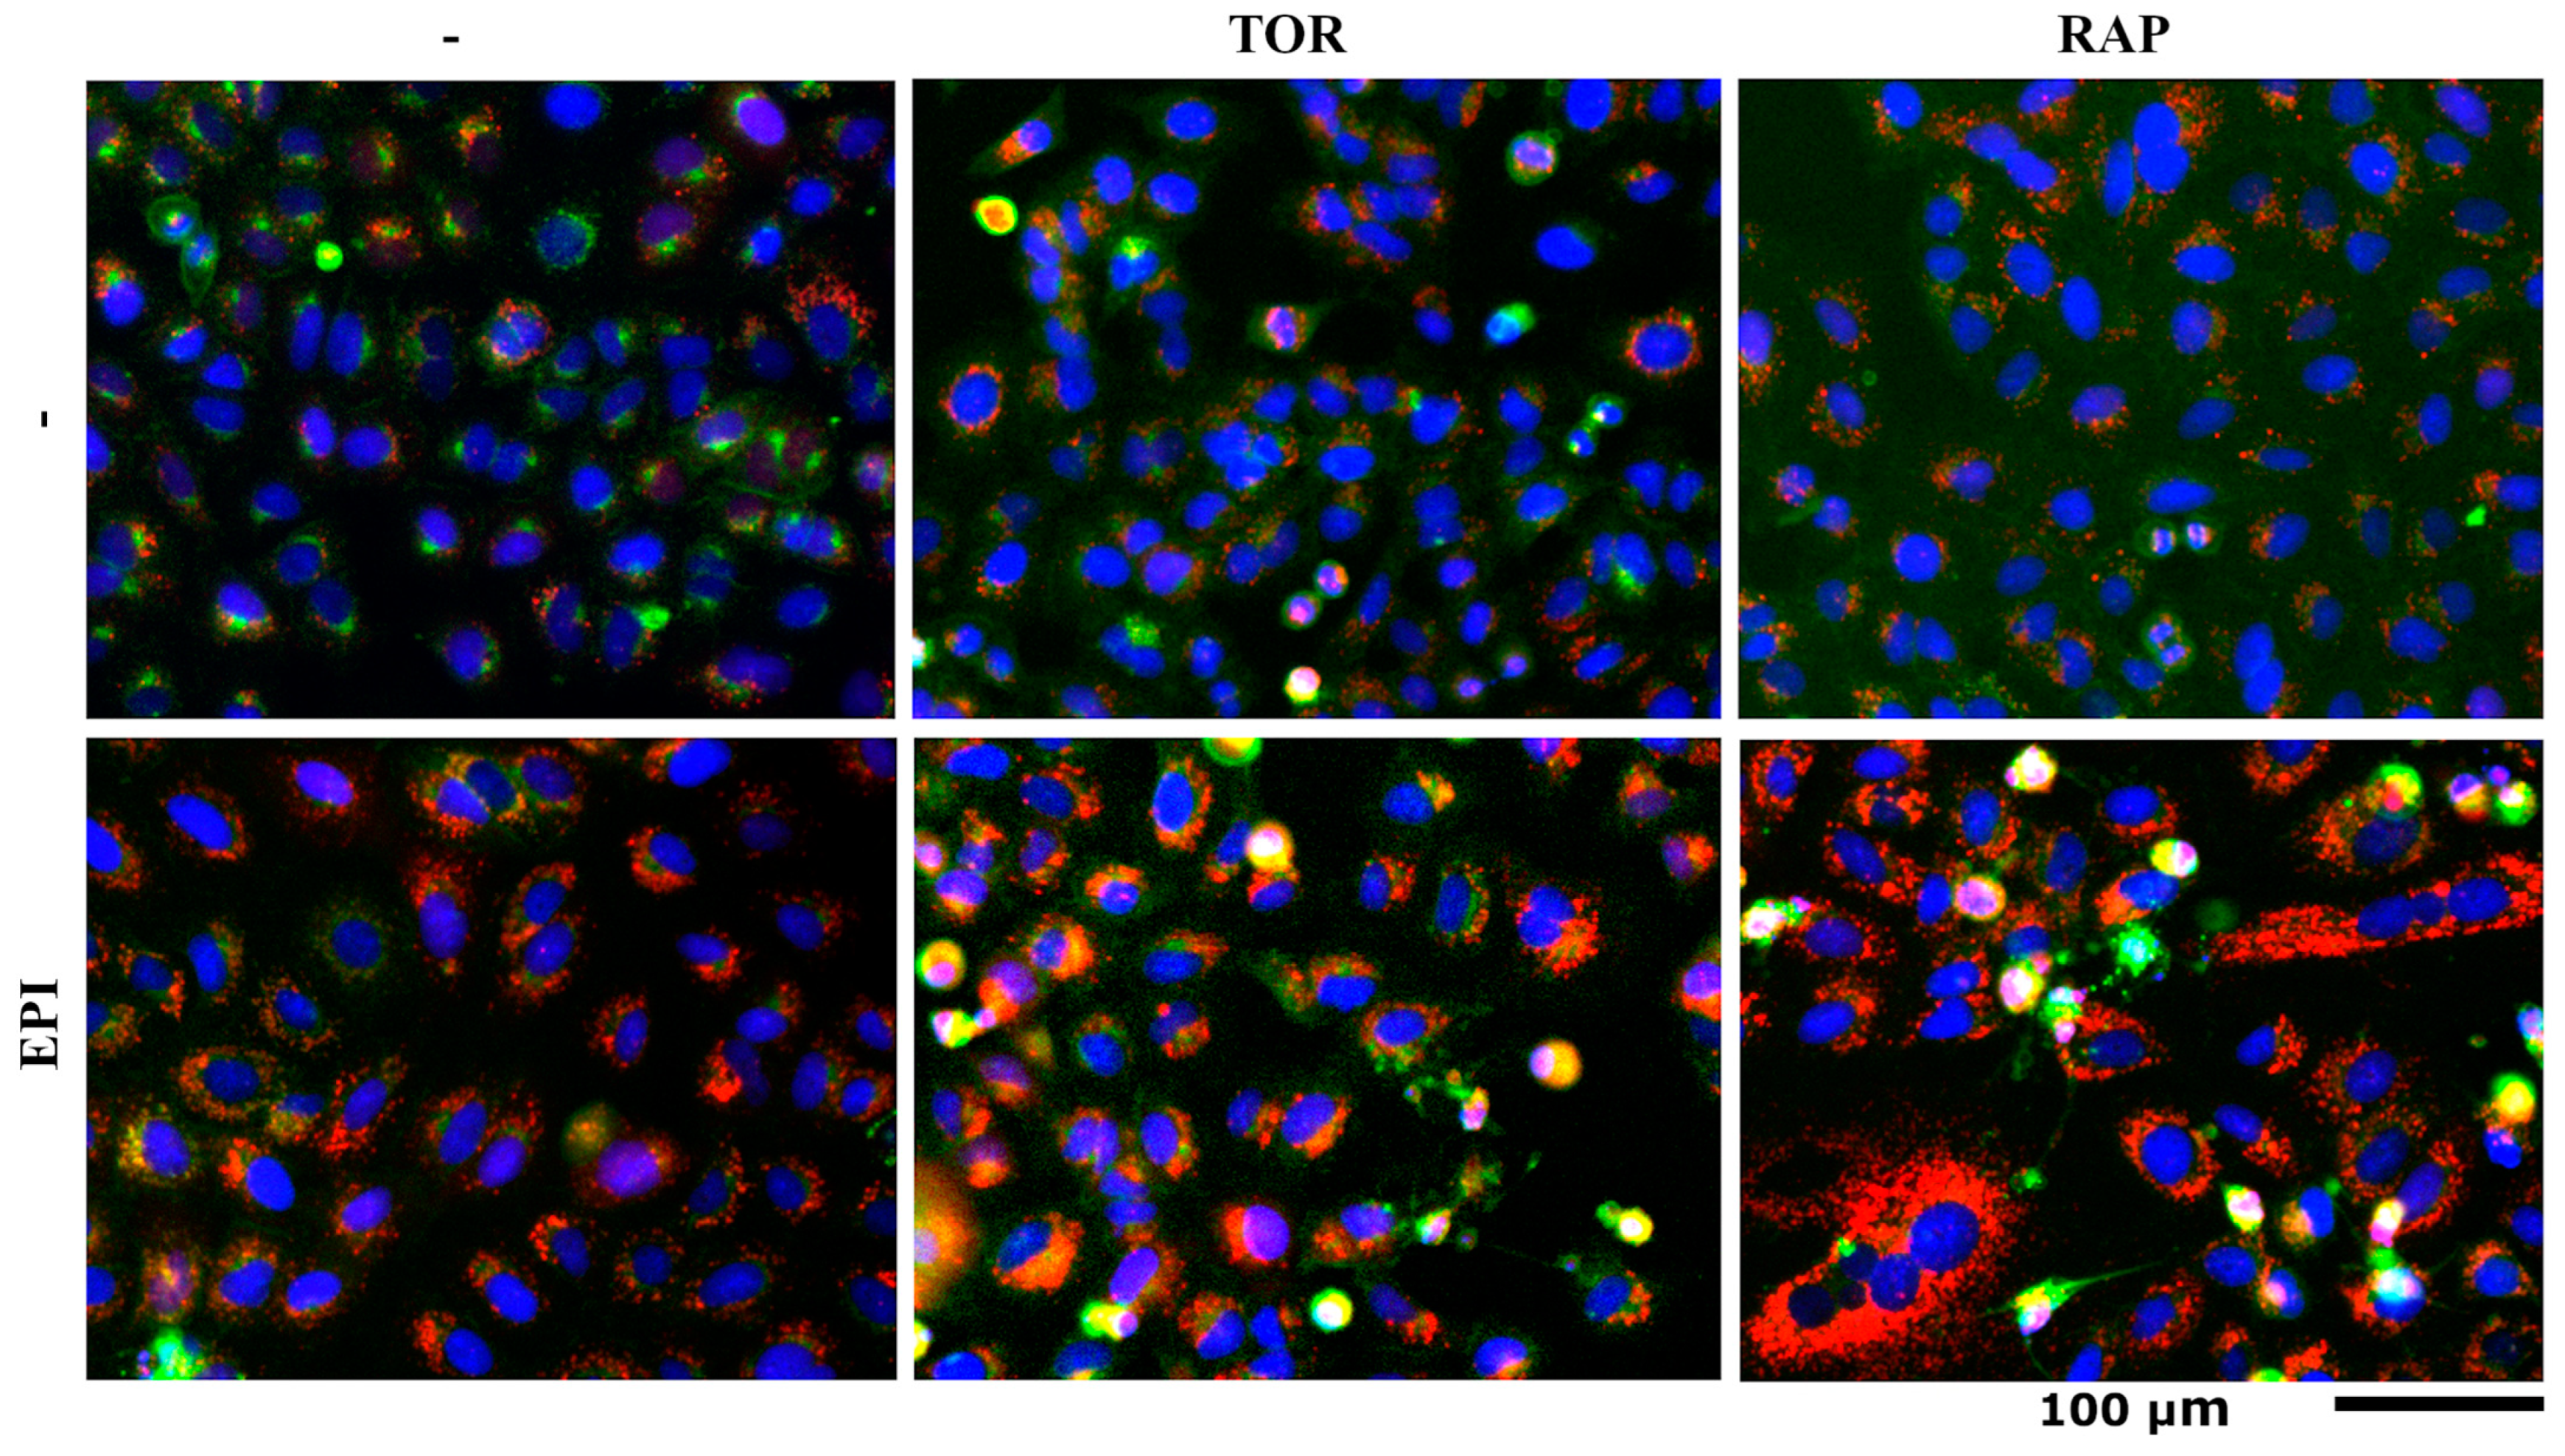
3.3. mCherry-EGFP-LC3B and SM-BOD Cell Labeling Show That the Interactions of Epirubicin with Torin and Rapamycin Stimulate the Accumulation of Autophagosomes
4. Discussion
5. Conclusions
Author Contributions
Funding
Institutional Review Board Statement
Informed Consent Statement
Data Availability Statement
Acknowledgments
Conflicts of Interest
References
- Luo, G.; Liu, N. An integrative theory for cancer (Review). Int. J. Mol. Med. 2019, 43, 647–656. [Google Scholar] [CrossRef]
- Centers for Disease Control and Prevention (CDC) and the National Cancer Institute (NCI) Cancer Statistics at a Glance. Available online: https://gis.cdc.gov/Cancer/USCS/?CDC_AA_refVal=https%3A%2F%2Fwww.cdc.gov%2Fcancer%2Fdataviz%2Findex.htm#/AtAGlance/ (accessed on 28 August 2023).
- Urruticoechea, A.; Alemany, R.; Balart, J.; Villanueva, A.; Viñals, F.; Capellá, G. Recent advances in cancer therapy: An Overview. Curr. Pharm. Des. 2010, 16, 3–10. [Google Scholar] [CrossRef]
- Cooper, G. The Cell: A Molecular Approach, 5th ed.; Sinauer Associate: Sunderland, MA, USA, 2010. [Google Scholar]
- Yamamoto, Y.; Kasashima, H.; Fukui, Y.; Tsujio, G.; Yashiro, M.; Maeda, K. The heterogeneity of cancer-associated fibroblast subpopulations: Their origins, biomarkers, and roles in the tumor microenvironment. Cancer Sci. 2023, 114, 16–24. [Google Scholar] [CrossRef]
- Dagogo-Jack, I.; Shaw, A.T. Tumour heterogeneity and resistance to cancer therapies. Nat. Rev. Clin. Oncol. 2018, 15, 81–94. [Google Scholar] [CrossRef]
- Slack, M.D.; Martinez, E.D.; Wu, L.F.; Altschuler, S.J. Characterizing heterogeneous cellular responses to perturbations. Proc. Natl. Acad. Sci. USA 2008, 105, 19306–19311. [Google Scholar] [CrossRef]
- Kitano, H. Cancer as a robust system: Implications for anticancer therapy. Nat. Rev. Cancer 2004, 4, 227–235. [Google Scholar] [CrossRef]
- Yabo, Y.A.; Niclou, S.P.; Golebiewska, A. Erratum: Cancer cell heterogeneity and plasticity: A paradigm shift in glioblastoma. Neuro-Oncology 2022, 24, 669–682. [Google Scholar] [CrossRef]
- Lodish, H.; Berk, A.; Zipursky, S.L. Molecular Cell Biology; W. H. Freeman: New York, NY, USA, 2000. [Google Scholar]
- Knizhnik, A.V.; Roos, W.P.; Nikolova, T.; Quiros, S.; Tomaszowski, K.H.; Christmann, M.; Kaina, B. Survival and Death Strategies in Glioma Cells: Autophagy, Senescence and Apoptosis Triggered by a Single Type of Temozolomide-Induced DNA Damage. PLoS ONE 2013, 8, e55665. [Google Scholar] [CrossRef]
- Lemjabbar-Alaoui, H.; Hassan, O.U.I.; Yang, Y.W.; Buchanan, P. Lung cancer: Biology and treatment options. Biochim. Biophys. Acta—Rev. Cancer 2015, 1856, 189–210. [Google Scholar] [CrossRef]
- Lung Cancer Research Foundation Facts About Lung Cancer. Available online: https://www.lungcancerresearchfoundation.org/lung-cancer-facts/ (accessed on 28 August 2023).
- Hannun, Y.A.; Obeid, L.M. Sphingolipids and their metabolism in physiology and disease. Nat. Rev. Mol. Cell Biol. 2018, 19, 175–191. [Google Scholar] [CrossRef]
- Dubin, S.; Griffin, D. SCIenCe OF MeDICIne lung cancer in non-smokers. Source Med. 2020, 117, 300–375. [Google Scholar]
- Futerman, A.H.; Hannun, Y.A. The complex life of simple sphingolipids. EMBO Rep. 2004, 5, 777–782. [Google Scholar] [CrossRef] [PubMed]
- Tirodkar, T.S.; Voelkel-Johnson, C. Sphingolipids in apoptosis. Exp. Oncol. 2012, 34, 231–242. [Google Scholar] [PubMed]
- Ogretmen, B. Sphingolipids in cancer: Regulation of pathogenesis and therapy. FEBS Lett. 2006, 580, 5467–5476. [Google Scholar] [CrossRef] [PubMed]
- Mullen, T.D.; Hannun, Y.A.; Obeid, L.M. Ceramide synthases at the centre of sphingolipid metabolism and biology. Biochem. J. 2012, 441, 789–802. [Google Scholar] [CrossRef] [PubMed]
- Sukocheva, O.A.; Furuya, H.; Ng, M.L.; Friedemann, M.; Menschikowski, M.; Tarasov, V.V.; Chubarev, V.N.; Klochkov, S.G.; Neganova, M.E.; Mangoni, A.A.; et al. Sphingosine kinase and sphingosine-1-phosphate receptor signaling pathway in inflammatory gastrointestinal disease and cancers: A novel therapeutic target. Pharmacol. Ther. 2020, 207, 107464. [Google Scholar] [CrossRef]
- Gomez-Larrauri, A.; Presa, N.; Dominguez-Herrera, A.; Ouro, A.; Trueba, M.; Gomez-Muñoz, A. Role of bioactive sphingolipids in physiology and pathology. Essays Biochem. 2020, 64, 579–589. [Google Scholar] [PubMed]
- Gómez-Muñoz, A. Ceramide 1-phosphate/ceramide, a switch between life and death. Biochim. Biophys. Acta—Biomembr. 2006, 1758, 2049–2056. [Google Scholar] [CrossRef]
- Mora, R.; Dokic, I.; Kees, T.; Hüber, C.M.; Keitel, D.; Geibig, R.; Brügge, B.; Zentgraf, H.; Brady, N.R.; Régnier-Vigouroux, A. Sphingolipid rheostat alterations related to transformation can be exploited for specific induction of lysosomal cell death in murine and human glioma. Glia 2010, 58, 1364–1383. [Google Scholar] [CrossRef]
- Fernandis, A.Z.; Wenk, M.R. Lipid-based biomarkers for cancer. J. Chromatogr. B 2009, 877, 2830–2835. [Google Scholar] [CrossRef]
- Young, M.M.; Kester, M.; Wang, H.G. Sphingolipids: Regulators of crosstalk between apoptosis and autophagy. J. Lipid Res. 2013, 54, 5–19. [Google Scholar] [CrossRef] [PubMed]
- Morad, S.A.F.; Cabot, M.C. The Onus of Sphingolipid Enzymes in Cancer Drug Resistance; Elsevier Ltd.: Amsterdam, The Netherlands, 2018; Volume 140, ISBN 9780128142233. [Google Scholar]
- Iessi, E.; Marconi, M.; Manganelli, V.; Sorice, M.; Malorni, W.; Garofalo, T.; Matarrese, P. On the Role of Sphingolipids in Cell Survival and Death, 1st ed.; Elsevier Inc.: Amsterdam, The Netherlands, 2020; Volume 351, ISBN 9780128201336. [Google Scholar]
- Li, Y.; Li, S.; Qin, X.; Hou, W.; Dong, H.; Yao, L.; Xiong, L. The pleiotropic roles of sphingolipid signaling in autophagy. Cell Death Dis. 2014, 5, e1245. [Google Scholar] [CrossRef] [PubMed]
- Lai, M.; La Rocca, V.; Amato, R.; Freer, G.; Pistello, M. Sphingolipid/ceramide pathways and autophagy in the onset and progression of melanoma: Novel therapeutic targets and opportunities. Int. J. Mol. Sci. 2019, 20, 3436. [Google Scholar] [CrossRef]
- Zheng, W.; Kollmeyer, J.; Symolon, H.; Momin, A.; Munter, E.; Wang, E.; Kelly, S.; Allegood, J.C.; Liu, Y.; Peng, Q.; et al. Ceramides and other bioactive sphingolipid backbones in health and disease: Lipidomic analysis, metabolism and roles in membrane structure, dynamics, signaling and autophagy. Biochim. Biophys. Acta—Biomembr. 2006, 1758, 1864–1884. [Google Scholar] [CrossRef] [PubMed]
- Harvald, E.B.; Olsen, A.S.B.; Færgeman, N.J. Autophagy in the light of sphingolipid metabolism. Apoptosis 2015, 20, 658–670. [Google Scholar] [CrossRef]
- Young, M.M.; Wang, H.G. Sphingolipids as Regulators of Autophagy and Endocytic Trafficking. Adv. Cancer Res. 2018, 140, 27–60. [Google Scholar]
- Yamagata, M.; Obara, K.; Kihara, A. Sphingolipid synthesis is involved in autophagy in Saccharomyces cerevisiae. Biochem. Biophys. Res. Commun. 2011, 410, 786–791. [Google Scholar] [CrossRef]
- Ghosal, P.; Sukocheva, O.A.; Wang, T.; Mayne, G.C.; Watson, D.I.; Hussey, D.J. Effects of chemotherapy agents on Sphingosine-1-Phosphate receptors expression in MCF-7 mammary cancer cells. Biomed. Pharmacother. 2016, 81, 218–224. [Google Scholar] [CrossRef]
- Karunakaran, I.; Alam, S.; Jayagopi, S.; Frohberger, S.J.; Hansen, J.N.; Kuehlwein, J.; Hölbling, B.V.; Schumak, B.; Hübner, M.P.; Gräler, M.H.; et al. Neural sphingosine 1-phosphate accumulation activates microglia and links impaired autophagy and inflammation. Glia 2019, 67, 1859–1872. [Google Scholar] [CrossRef]
- Goel, K.; Beatman, E.L.; Egersdorf, N.; Scruggs, A.; Cao, D.; Berdyshev, E.V.; Schweitzer, K.S.; Petrache, I. Sphingosine 1 phosphate (S1p) receptor 1 is decreased in human lung microvascular endothelial cells of smokers and mediates s1p effect on autophagy. Cells 2021, 10, 1200. [Google Scholar] [CrossRef]
- Lee, J.K.; Jin, H.K.; Park, M.H.; Kim, B.R.; Lee, P.H.; Nakauchi, H.; Carter, J.E.; He, X.; Schuchman, E.H.; Bae, J.S. Acid sphingomyelinase modulates the autophagic process by controlling lysosomal biogenesis in Alzheimer’s disease. J. Exp. Med. 2014, 211, 1551–1570. [Google Scholar] [CrossRef] [PubMed]
- Marks, D.L.; Bittman, R.; Pagano, R.E. Use of bodipy-labeled sphingolipid and cholesterol analogs to examine membrane microdomains in cells. Histochem. Cell Biol. 2008, 130, 819–832. [Google Scholar] [CrossRef] [PubMed]
- Klionsky, D.J.; Abeliovich, H.; Agostinis, P.; Agrawal, D.K.; Aliev, G.; Askew, D.S.; Baba, M.; Baehrecke, E.H.; Bahr, B.A.; Ballabio, A.; et al. Guidelines for the use and interpretation of assays for monitoring autophagy in higher eukaryotes. Autophagy 2008, 4, 151–175. [Google Scholar] [CrossRef] [PubMed]
- Tyteca, D.; D’Auria, L.; Van Der Smissen, P.; Medts, T.; Carpentier, S.; Monbaliu, J.C.; de Diesbach, P.; Courtoy, P.J. Three unrelated sphingomyelin analogs spontaneously cluster into plasma membrane micrometric domains. Biochim. Biophys. Acta—Biomembr. 2010, 1798, 909–927. [Google Scholar] [CrossRef] [PubMed]
- Fan, W.; Tang, S.; Fan, X.; Fang, Y.; Xu, X.; Li, L.; Xu, J.; Li, J.L.; Wang, Z.; Li, X. SIRT1 regulates sphingolipid metabolism and neural differentiation of mouse embryonic stem cells through c-Myc-SMPDL3B. Elife 2021, 10, e67452. [Google Scholar] [CrossRef] [PubMed]
- Molina-Mora, J.A.; Mora-Rodriguez, R.A. Identification of cancer chemosensitivity by ODE and GMM modeling of heterogeneous cellular response to perturbations in fluorescent sphingolipid metabolism. In Proceedings of the 2016 IEEE 36th Central American and Panama Convention CONCAPAN 2016, San Jose, Costa Rica, 9–11 November 2016. [Google Scholar]
- Molina-Mora, J.A.; Kop-Montero, M.; Quirós-Fernández, I.; Quiros, S.; Crespo-Mariño, J.L.; Mora-Rodríguez, R.A. A hybrid mathematical modeling approach of the metabolic fate of a fluorescent sphingolipid analogue to predict cancer chemosensitivity. Comput. Biol. Med. 2018, 97, 8–20. [Google Scholar] [CrossRef]
- Quiros-Fernandez, I.; Molina-Mora, J.; Kop-Montero, M.; Salas-Hidalgo, E.; Mora-Rodriguez, R. Predicting Cancer Chemosensitivity Based on Intensity/Distribution Profiles of Cells Loaded with a Fluorescent Sphingolipid Analogue. In Proceedings of the 2018 IEEE International Work Conference on Bioinspired Intelligence (IWOBI), San Carlos, Costa Rica, 18–20 July 2018; IEEE: Piscataway, NJ, USA, 2018; pp. 1–8. [Google Scholar]
- Molina-Mora, J.A.; Mesen-Porras, S.; Quiros-Fernandez, I.; Kop-Montero, M.; Rojas-Cespedes, A.; Quiros, S.; Siles, F.; Mora, R. Sphingolipid pathway as a biosensor of cancer chemosensitivity: A proof of principle. Uniciencia 2022, 36, 687–701. [Google Scholar] [CrossRef]
- N’Diaye, E.N.; Kajihara, K.K.; Hsieh, I.; Morisaki, H.; Debnath, J.; Brown, E.J. PLIC proteins or ubiquilins regulate autophagy-dependent cell survival during nutrient starvation. EMBO Rep. 2009, 10, 173–179. [Google Scholar] [CrossRef]
- Naviaux, R.K.; Costanzi, E.; Haas, M.; Verma, I.M. The pCL vector system: Rapid production of helper-free, high-titer, recombinant retroviruses. J. Virol. 1996, 70, 5701–5705. [Google Scholar] [CrossRef]
- Muñoz-Cuevas, J.H. Sinergia y adición en anestesiología. Rev. Mex. Anestesiol. 2011, 34, 195–199. [Google Scholar]
- Haberkant, P.; Stein, F.; Höglinger, D.; Gerl, M.J.; Brügger, B.; Van Veldhoven, P.P.; Krijgsveld, J.; Gavin, A.C.; Schultz, C. Bifunctional Sphingosine for Cell-Based Analysis of Protein-Sphingolipid Interactions. ACS Chem. Biol. 2016, 11, 222–230. [Google Scholar] [CrossRef] [PubMed]
- Lavieu, G.; Scarlatti, F.; Sala, G.; Levade, T.; Ghidoni, R.; Botti, J.; Codogno, P. Is autophagy the key mechanism by which the sphingolipid rheostat controls the cell fate decision? Autophagy 2007, 3, 45–47. [Google Scholar] [CrossRef] [PubMed]
- Jameson, L.P.; Smith, N.W.; Annunziata, O.; Dzyuba, S.V. Interaction of BODIPY dyes with bovine serum albumin: A case study on the aggregation of a click-BODIPY dye. Phys. Chem. Chem. Phys. 2016, 18, 14182–14185. [Google Scholar] [CrossRef]
- Koivusalo, M.; Jansen, M.; Somerharju, P.; Ikonen, E. Endocytic Trafficking of Sphingomyelin Depends on Its Acyl Chain Length. Mol. Biol. Cell 2007, 18, 3250–3263. [Google Scholar] [CrossRef] [PubMed]
- Weigel, C.; Hüttner, S.S.; Ludwig, K.; Krieg, N.; Hofmann, S.; Schröder, N.H.; Robbe, L.; Kluge, S.; Nierhaus, A.; Winkler, M.S.; et al. S1P lyase inhibition protects against sepsis by promoting disease tolerance via the S1P/S1PR3 axis. EBioMedicine 2020, 58, 102898. [Google Scholar] [CrossRef]
- Sala, V.; Della Sala, A.; Hirsch, E.; Ghigo, A. Signaling Pathways Underlying Anthracycline Cardiotoxicity; Mary Ann Liebert, Inc.: Larchmont, NY, USA, 2020; Volume 32, ISBN 3901167064. [Google Scholar]
- Russo, M.; Della Sala, A.; Tocchetti, C.G.; Porporato, P.E.; Ghigo, A. Metabolic Aspects of Anthracycline Cardiotoxicity. Curr. Treat. Options Oncol. 2021, 22, 18. [Google Scholar] [CrossRef]
- Blaho, V.A. Sphingosine 1-phosphate escapes the Catch-22 of sepsis prevention and mitigation therapies. EBioMedicine 2020, 59, 102952. [Google Scholar] [CrossRef]
- Capelôa, T.; Benyahia, Z.; Zampieri, L.X.; Blackman, M.C.N.M.; Sonveaux, P. Metabolic and non-metabolic pathways that control cancer resistance to anthracyclines. Semin. Cell Dev. Biol. 2020, 98, 181–191. [Google Scholar] [CrossRef]
- Kyriakou, K.; Lederer, C.W.; Kleanthous, M.; Drousiotou, A.; Malekkou, A. Acid ceramidase depletion impairs neuronal survival and induces morphological defects in neurites associated with altered gene transcription and sphingolipid content. Int. J. Mol. Sci. 2020, 21, 1607. [Google Scholar] [CrossRef]
- Sun, X.; Zhou, L.; Wang, X.; Li, Y.; Liu, X.; Chen, Y.; Zhong, Z.; Chen, J. FYCO1 regulates migration, invasion, and invadopodia formation in HeLa cells through CDC42/N-WASP/Arp2/3 signaling pathway. Biochem. Cell Biol. 2022, 100, 458–472. [Google Scholar] [CrossRef]
- Li, X.; He, S.; Ma, B. Autophagy and autophagy-related proteins in cancer. Mol. Cancer 2020, 19, 12. [Google Scholar] [CrossRef] [PubMed]
- Cao, W.; Li, J.; Yang, K.; Cao, D. An overview of autophagy: Mechanism, regulation and research progress. Bull. Cancer 2021, 108, 304–322. [Google Scholar] [CrossRef] [PubMed]
- Sentelle, R.D.; Senkal, C.E.; Jiang, W.; Ponnusamy, S.; Gencer, S.; Panneer Selvam, S.; Ramshesh, V.K.; Peterson, Y.K.; Lemasters, J.J.; Szulc, Z.M.; et al. Ceramide targets autophagosomes to mitochondria and induces lethal mitophagy. Nat. Chem. Biol. 2012, 8, 831–838. [Google Scholar] [CrossRef] [PubMed]
- Peralta, E.R.; Edinger, A.L. Ceramide-induced starvation triggers homeostatic autophagy. Autophagy 2009, 5, 407–409. [Google Scholar] [CrossRef] [PubMed]
- Alexaki, A.; Gupta, S.; Majumder, S.; Kono, M.; Tuymetova, G.; Harmon, J.; Dunn, T.; Proia, R. Autophagy regulates sphingolipid levels in the liver. J. Lipid Res. 2014, 55, 2521–2531. [Google Scholar] [CrossRef] [PubMed]
- Scarlatti, F.; Bauvy, C.; Ventruti, A.; Sala, G.; Cluzeaud, F.; Vandewalle, A.; Ghidoni, R.; Codogno, P. Ceramide-mediated Macroautophagy Involves Inhibition of Protein Kinase B and Up-regulation of Beclin 1. J. Biol. Chem. 2004, 279, 18384–18391. [Google Scholar] [CrossRef]
- Pyne, N.J.; Pyne, S. Sphingosine 1-phosphate and cancer. Nat. Rev. Cancer 2010, 10, 489–503. [Google Scholar] [CrossRef]
- Dupre, T.V.; Doll, M.A.; Shah, P.P.; Sharp, C.N.; Siow, D.; Megyesi, J.; Shayman, J.; Bielawska, A.; Bielawski, J.; Beverly, L.J.; et al. Inhibiting glucosylceramide synthase exacerbates cisplatin-induced acute kidney injury. J. Lipid Res. 2017, 58, 1439–1452. [Google Scholar] [CrossRef]
- Dimanche-Boitrel, M.T.; Rebillard, A. Sphingolipids and Response to Chemotherapy. Handb. Exp. Pharmacol. 2013, 216, 73–91. [Google Scholar]
- Liu, J.; Xia, H.; Kim, M.; Xu, L.; Li, Y.; Zhang, L.; Cai, Y.; Norberg, H.V.; Zhang, T.; Furuya, T.; et al. Beclin1 controls the levels of p53 by regulating the deubiquitination activity of USP10 and USP13. Cell 2011, 147, 223–234. [Google Scholar] [CrossRef]
- Liu, Q.; Luo, X.Y.; Jiang, H.; Yang, M.H.; Yuan, G.H.; Tang, Z.; Wang, H. Hydroxychloroquine facilitates autophagosome formation but not degradation to suppress the proliferation of cervical cancer SiHa cells. Oncol. Lett. 2014, 7, 1057–1062. [Google Scholar] [CrossRef] [PubMed]
- Xu, R.; Sun, W.; Jin, J.; Obeid, L.M.; Mao, C. Role of alkaline ceramidases in the generation of sphingosine and its phosphate in erythrocytes. FASEB J. 2010, 24, 2507–2515. [Google Scholar] [CrossRef] [PubMed]
- Singh, J.; Luqman, S.; Meena, A. Emerging role of phytochemicals in targeting predictive, prognostic, and diagnostic biomarkers of lung cancer. Food Chem. Toxicol. 2020, 144, 111592. [Google Scholar] [CrossRef] [PubMed]


Disclaimer/Publisher’s Note: The statements, opinions and data contained in all publications are solely those of the individual author(s) and contributor(s) and not of MDPI and/or the editor(s). MDPI and/or the editor(s) disclaim responsibility for any injury to people or property resulting from any ideas, methods, instructions or products referred to in the content. |
© 2023 by the authors. Licensee MDPI, Basel, Switzerland. This article is an open access article distributed under the terms and conditions of the Creative Commons Attribution (CC BY) license (https://creativecommons.org/licenses/by/4.0/).
Share and Cite
Mesén-Porras, S.; Rojas-Céspedes, A.; Molina-Mora, J.A.; Vega-Baudrit, J.; Siles, F.; Quiros, S.; Mora-Rodríguez, R. Sphingolipid-Based Synergistic Interactions to Enhance Chemosensitivity in Lung Cancer Cells. Cells 2023, 12, 2588. https://doi.org/10.3390/cells12222588
Mesén-Porras S, Rojas-Céspedes A, Molina-Mora JA, Vega-Baudrit J, Siles F, Quiros S, Mora-Rodríguez R. Sphingolipid-Based Synergistic Interactions to Enhance Chemosensitivity in Lung Cancer Cells. Cells. 2023; 12(22):2588. https://doi.org/10.3390/cells12222588
Chicago/Turabian StyleMesén-Porras, Susana, Andrea Rojas-Céspedes, José Arturo Molina-Mora, José Vega-Baudrit, Francisco Siles, Steve Quiros, and Rodrigo Mora-Rodríguez. 2023. "Sphingolipid-Based Synergistic Interactions to Enhance Chemosensitivity in Lung Cancer Cells" Cells 12, no. 22: 2588. https://doi.org/10.3390/cells12222588