Article

Metabolic Advantage of 25(OH)D3 versus 1,25(OH)2D3 Supplementation in Infantile Nephropathic Cystinosis-Associated Adipose Tissue Browning and Muscle Wasting

1
Division of Pediatric Nephrology, Rady Children’s Hospital, University of California, San Diego, CA 92093, USA
2
Department of Pediatric Nephrology and Rheumatology, Sichuan Provincial Maternity and Child Health Care Hospital and The Affiliated Women’s and Children’s Hospital of Chengdu Medical College, Chengdu 610031, China
3
Integrative Biology & Physiology, University of California, Los Angeles, CA 90095, USA
4
Department of Pediatrics, Health Sciences Postgraduate Program, School of Medicine, Federal University of Minas Gerais (UFMG), Belo Horizonte 30310-100, MG, Brazil
*
Author to whom correspondence should be addressed.
Cells 2022, 11(20), 3264; https://doi.org/10.3390/cells11203264
Submission received: 16 May 2022 / Revised: 13 September 2022 / Accepted: 14 October 2022 / Published: 17 October 2022

Abstract

:
Manifestations of infantile nephropathic cystinosis (INC) often include cachexia and deficiency of circulating vitamin D metabolites. We examined the impact of 25(OH)D3 versus 1,25(OH)2D3 repletion in Ctns null mice, a mouse model of INC. Six weeks of intraperitoneal administration of 25(OH)D3 (75 μg/kg/day) or 1,25(OH)2D3 (60 ng/kg/day) resulted in Ctns−/− mice corrected low circulating 25(OH)D3 or 1,25(OH)2D3 concentrations. While 25(OH)D3 administration in Ctns−/− mice normalized several metabolic parameters characteristic of cachexia as well as muscle function in vivo, 1,25(OH)2D3 did not. Administration of 25(OH)D3 in Ctns−/− mice increased muscle fiber size and decreased fat infiltration of skeletal muscle, which was accompanied by a reduction of abnormal muscle signaling pathways. 1,25(OH)2D3 administration was not as effective. In conclusion, 25(OH)D3 supplementation exerts metabolic advantages over 1,25(OH)2D3 supplementation by amelioration of muscle atrophy and fat browning in Ctns−/− mice.

1. Introduction

Infantile nephropathic cystinosis (INC), a genetic chronic kidney disease (CKD), results from cystinosin (CTNS) mutations and involves the deposition of cystine crystals in multiple organs [1,2]. Children with INC present with myopathy and neuromuscular abnormalities such as swallowing difficulty. Currently, there are no known treatments to address these comorbidities [3,4]. We described the cachexic phenotype in Ctns null mice, an animal model of INC, with extensive fat browning and muscle atrophy [5]. White fat stores energy, whereas brown fat utilizes stored energy during thermogenesis to produce heat [6]. White fat browning (a process in which white adipocytes phenotypically change to brown-fat-like cells) has been implicated in the progression of cachexia, as demonstrated by recent studies [7,8,9,10]. The metabolism of skeletal muscle and brown fat are connected as brown fat modulates the function of skeletal muscle through the release of myostatin, a powerful inhibitor of muscle function [11]. Importantly, fat browning precedes muscle wasting in cancer and CKD [12,13]. Characterizing the complex interactions between various energy-wasting pathways involved in cachexia represents a key step towards establishing effective clinical therapies for this profound complication in patients with INC.
Vitamin D acts as an anti-proliferative factor in various tissues (such as fat and muscle) and physiological systems (such as renal, cardiovascular, and immune systems) [14]. Insufficiency of vitamin D is present in numerous pathological conditions [15]. INC patients commonly present with insufficiency of 25(OH)D3 and 1,25(OH)2D3 [16,17,18]. Previously, we found that the administration of 25(OH)D3 and 1,25(OH)2D3 reduced the effect of cachexia and white adipose tissue (WAT) browning in Ctns−/− mice [19]. 1α-hydroxylase, which is present in the kidney as well as locally in muscle, activates the metabolite 25(OH)D3 (the most prevalent metabolite in circulation) to circulating 1,25(OH)2D3, which binds the vitamin D receptor (VDR) to exert the downstream responses [20,21,22]. Interestingly, 25(OH)D3 shows strong in vivo and ex vivo effects by itself [23,24,25,26,27]. Here, we compared 25(OH)D3 versus 1,25(OH)2D3 administration in Ctns−/− mice, specifically focusing on fat and muscle abnormalities.

2. Materials and Methods

2.1. Study Design

Twelve-month-old male, c57BL/6 wild-type (WT) mice and Ctns−/− mice (c57BL/6 genetic background) [28] were subcutaneously supplemented with 25(OH)D3 (Sigma, Northbrook, IL, USA, Catalog 739,650-1ML, 25, 50 or 75 μg/kg/day), 1,25(OH)2D3 (Sigma, Northbrook, IL, USA, Catalog 740,578-1ML, 20, 40 or 60 ng/kg/day) or vehicle (ethylene glycol) for six weeks by using Alzet mini-osmotic pump model 2006 (Durect Corporation, Cupertino, CA, USA). We used both ad libitum and pair-feeding strategy. Mice were fed with rodent diet 5015 (catalog 0001328, LabDiet, St Louis, MO, USA). This study was approved and performed at University of California, San Diego.

2.2. Measuremnt of Lean and Fat Mass

Body composition was determined by using EchoMRI-100™ (Echo Medical System, Huston, TX, USA) [5,19].

2.3. Resting Metabolic Rate

This was assessed by using Oxymax calorimetry (Columbus Instruments, Columbus, OH, USA) during the daytime (0900-1700) [5,19].

2.4. Mouse Muscle Function

Rotarod activity (model RRF/SP, Accuscan Instrument, Columbus, OH, USA) and forelimb grip strength (Model 47106, UGO Basile, Gemonio, VA, Italy) in mice [5,19] were assessed.

2.5. Serum and Blood Chemistry

At sacrifice, BUN, electrolytes, 25(OH)D3, and 1,25(OH)2D3 were measured (Supplemental Table S1). Serum creatinine was measured as previously reported [28].

2.6. Protein Assay for Muscle and Adipose Tissue

Protein concentration of the tissue homogenate was analyzed using a Pierce BAC Protein Assay Kit (catalog 23227, Thermo Scientific, Waltham, MA, USA).

2.7. Fiber Size and Fatty Infiltration of Gastrocnemius

We used Image J software (https://imagej.nih.gob/ij/download.html) (accessed on 13 January 2021) to determine gastrocnemius muscle fiber size [5,19]. In addition, Oil Red O incubation was used to quantify fatty infiltration in skeletal muscle using ImageJ software [29,30].

2.8. Muscle Cystine Content Measurement

Muscle cystine contents of gastrocnemius was measured according to published protocols [31,32] by mass spectrometry.

2.9. Muscle RNAseq Analysis

RNAseq analysis previously identified differentially expressed muscle genes in Ctns−/− mice relative to WT mice [19]. In this study, we performed qPCR analysis for these muscle genes in the different experimental groups.

2.10. Quantitative Real-Time PCR

We reverse transcribed 3 µg of total RNA to cDNA. Quantitative real-time RT-PCR of target genes was performed as previously published [5,19]. Information for primers are provided (Supplemental Table S2).

2.11. Statistics

Statistics analysis was performed using GraphPad Prism version 9.3.1 (GraphPad Software, San Diego, CA, USA). Post hoc analysis was performed with Tukey’s test.

3. Results

3.1. Supplementation of 25(OH)D3 or 1,25(OH)2D3 Replenishes Serum 25(OH)D3 or 1,25(OH)2D3 Concentration in Ctns−/− Mice

Twelve-month-old Ctns−/− mice showed significantly lower serum concentration of both 25(OH)D3 and 1,25(OH)2D3. We determined the optimal doses of 25(OH)D3 and 1,25(OH)2D3 needed to normalize serum concentrations of these molecules in Ctns−/− mice, (Supplemental Tables S3–S5). We observed that supplementation of 25(OH)D3 (75 μg/kg/day for 6 weeks) normalized serum concentration of 25(OH)D3 as well as significantly increased but not normalized serum concentration of 1,25(OH)2D3 in Ctns−/− mice whereas supplementation of 1,25(OH)2D3 (60 ng/kg/day for 6 weeks) normalized serum concentration of 1,25(OH)2D3 but did not increase serum concentration of 25(OH)D3 in Ctns−/− mice.

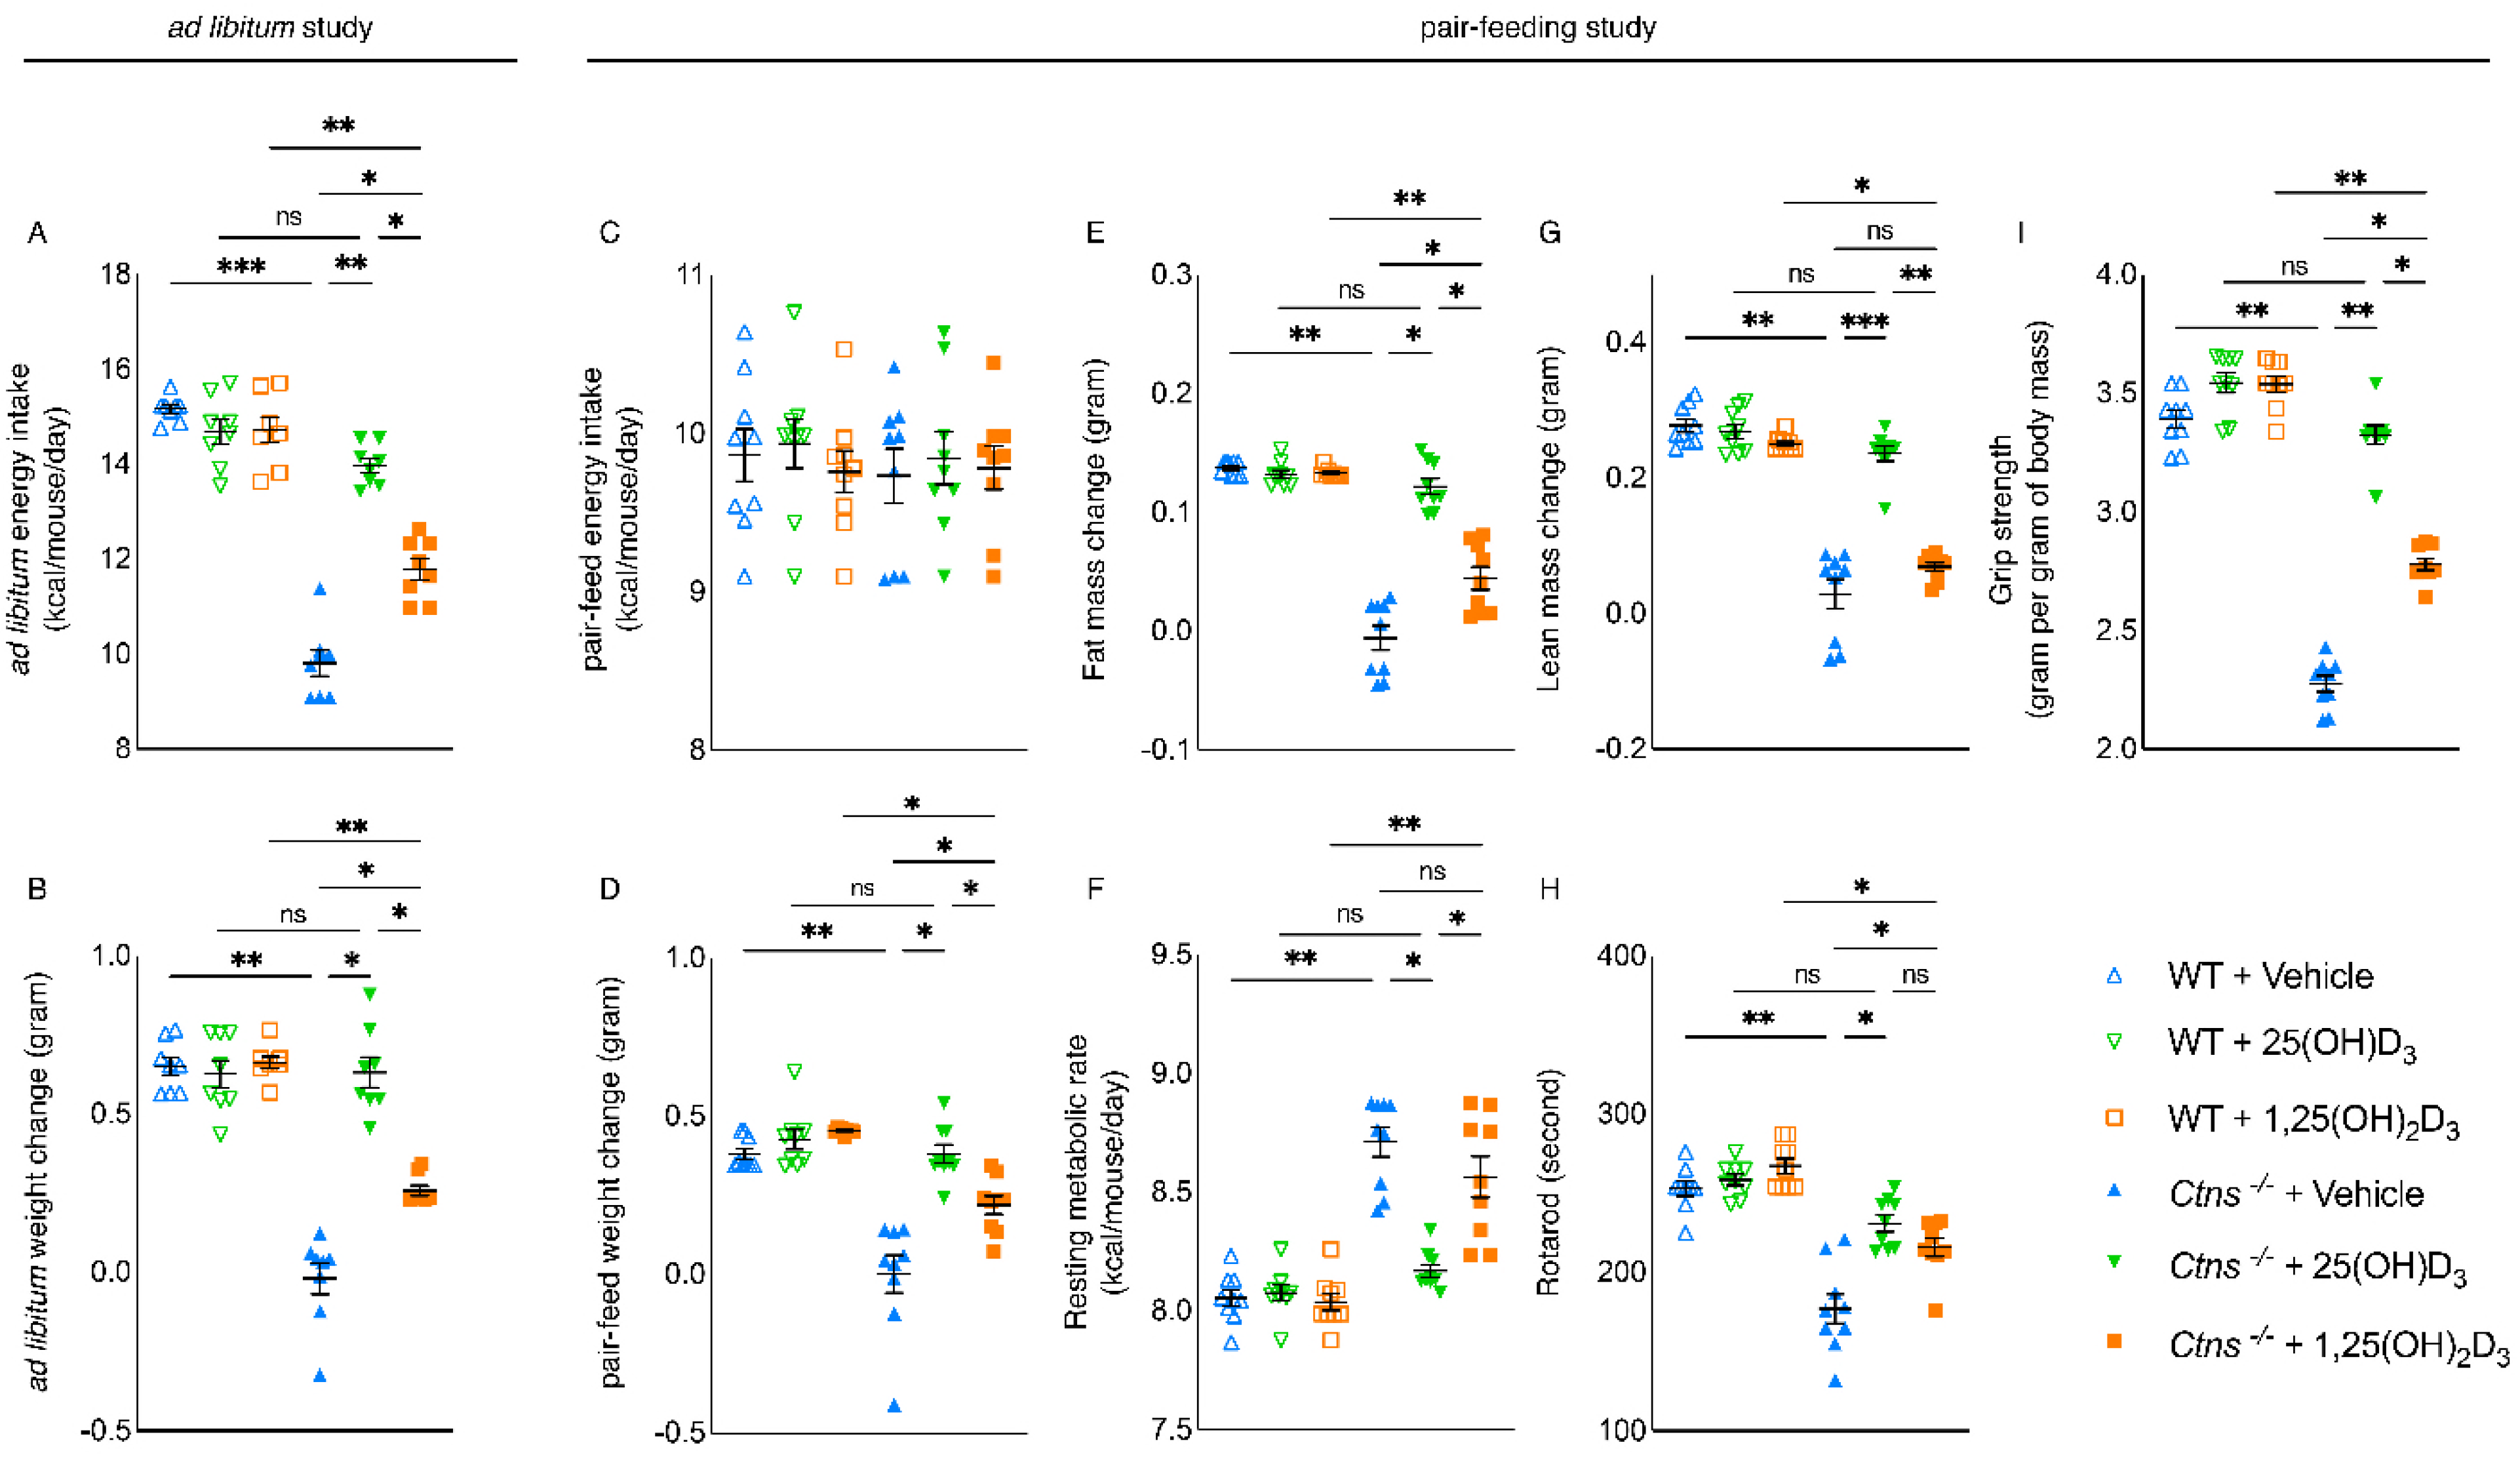
3.2. Repletion of 25-Hydroxyvitamin D3 Normalizes Caloric Intake and Weight Gain in Ctns−/− Mice

In the first series of experiments, all mice were fed ad libitum. Serum chemistry of the mice is listed in Table 1. While supplementing 1,25(OH)2D3 did not have an effect, repletion of 25(OH)D3 in Ctns−/− mice corrected anorexia (Figure 1A) and normalized weight gain (Figure 1B).

3.3. Repletion of 25-Hydroxyvitamin D3 Improves Energy Homeostasis in Ctns−/− Mice

In the second series of experiments, we utilized a food restrictive strategy to study the effects of restoring 25(OH)D3 versus 1,25(OH)2D3 levels in Ctns−/− mice without the effects of different nutritional intake. Ctns−/− + Vehicle mice were fed ad libitum and we determined their daily ad libitum caloric intake. The other mouse groups received an energy intake amount equal to that of Ctns−/− + Vehicle (Figure 1C). Serum chemistry of the mice is listed in Table 2. Replenishing serum 25(OH)D3 concentration normalized weight gain, fat mass content, resting metabolic rate, lean mass content, and muscle function (shown by rotarod and grip strength) in Ctns−/− mice; whereas replenishing serum 1,25(OH)2D3 concentration improved but not normalize these parameters in Ctns−/− mice (Figure 1D–I).

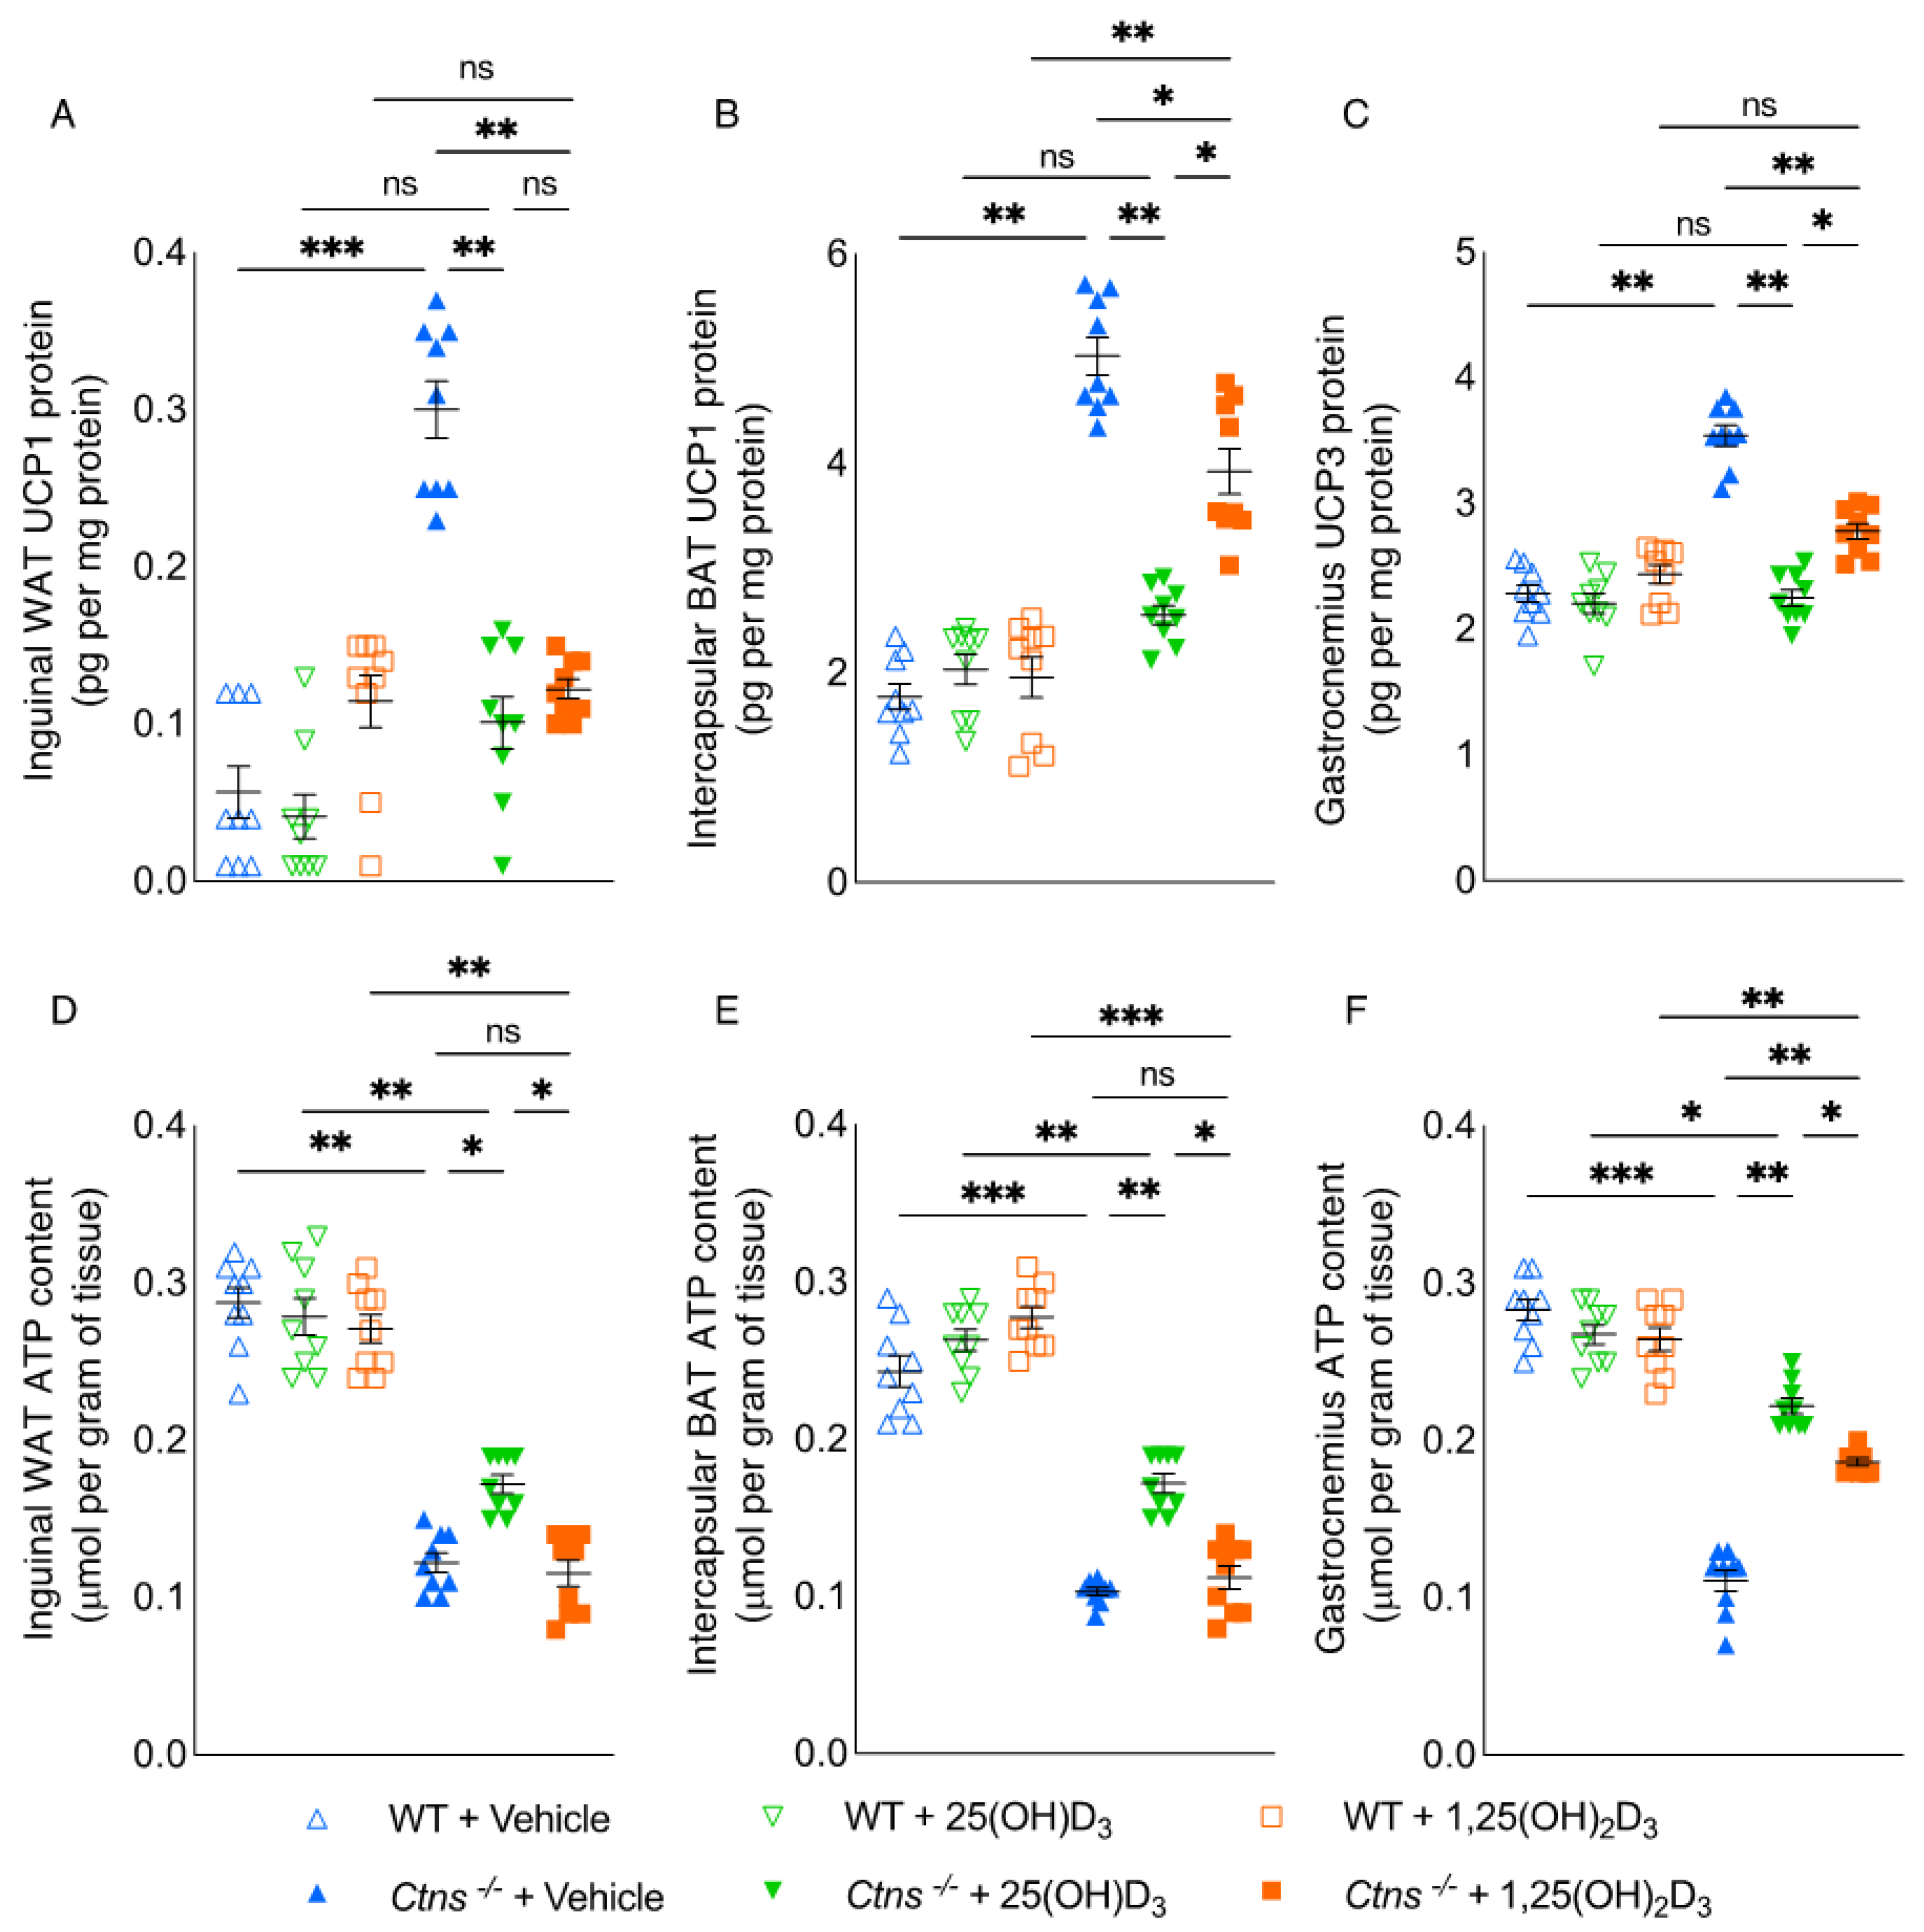
3.4. Repletion of 25-Hydroxyvitamin D3 Improves Adipose Tissue and Skeletal Muscle Energy Homeostasis in Ctns−/− Mice

We analyzed the effects of vitamin D repletion in Ctns−/− mice on energy homeostasis in adipose tissue and skeletal muscle. In WAT, BAT, and the gastrocnemius of Ctns−/− mice, the protein content of UCPs was significantly higher whereas ATP content was significantly lower relative to WT control mice (Figure 2). The protein content of UCPs was normalized in WAT, BAT, and the gastrocnemius with the repletion of 25(OH)D3 in Ctns−/− mice (Figure 2A–C). Additionally, the improvement in ATP content in WAT, BAT, and the gastrocnemius was significantly better with the repletion of 25(OH)D3 compared to the repletion of 1,25(OH)2D3 in Ctns−/− mice (Figure 2D–F).

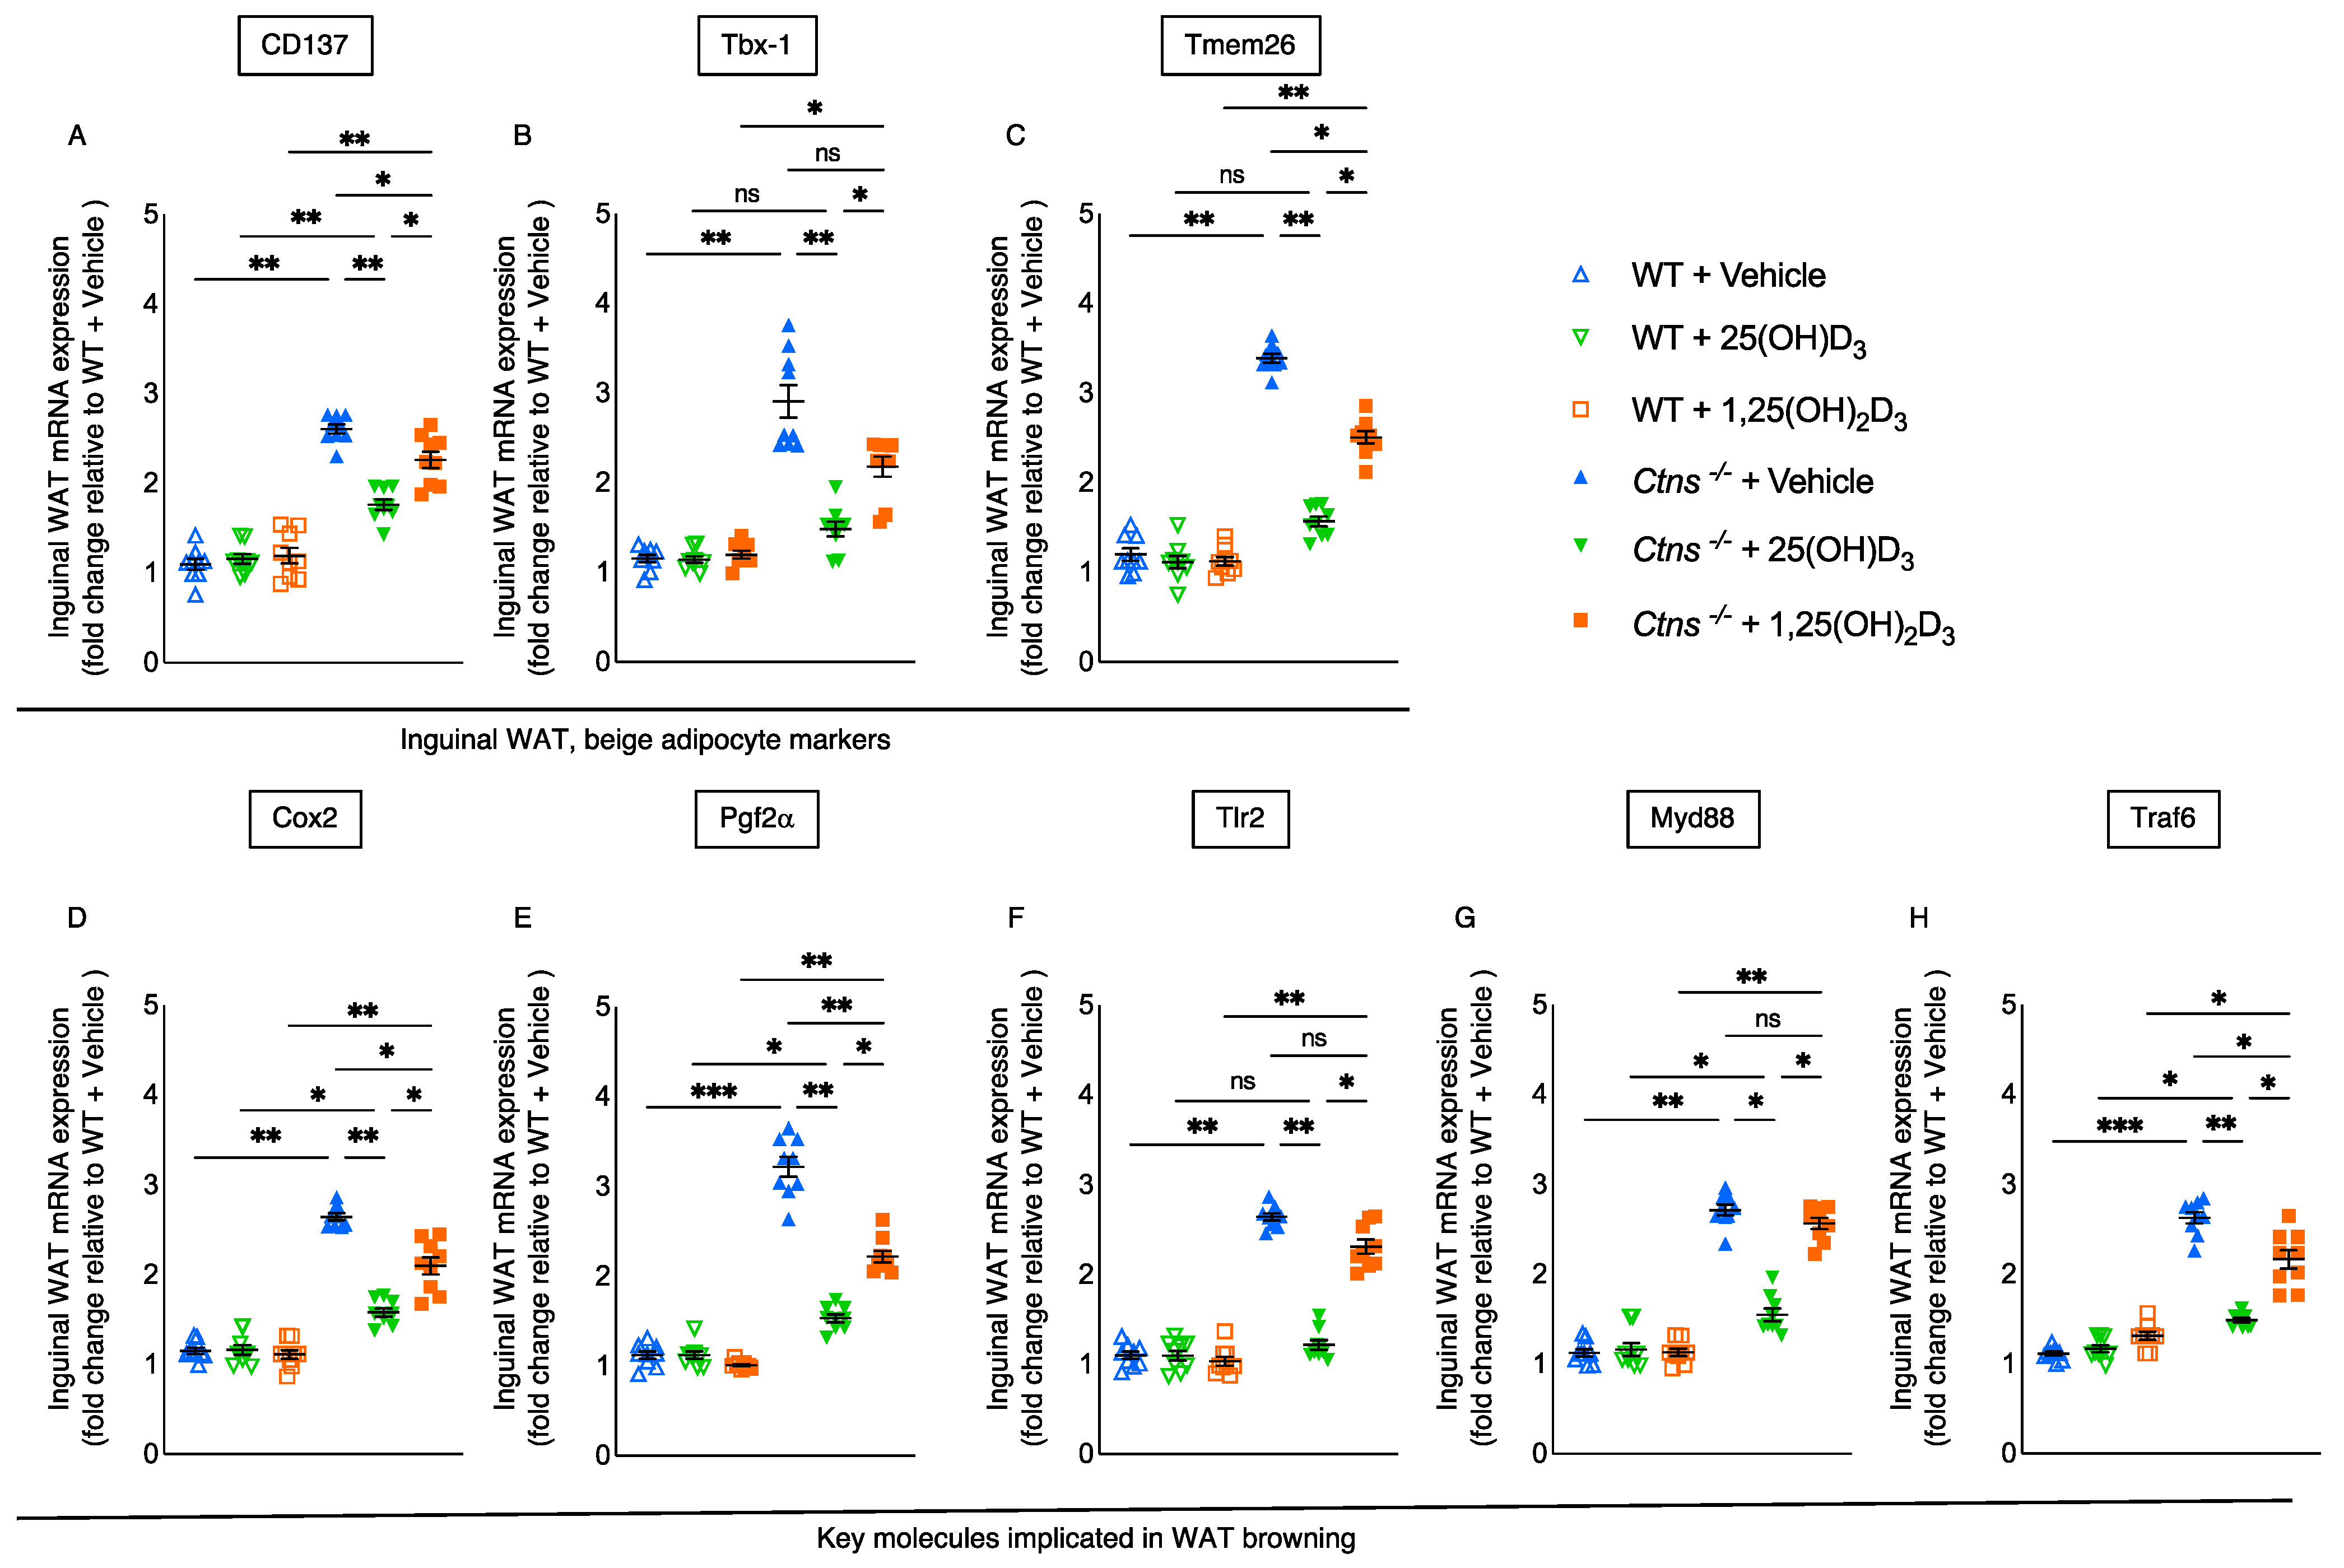
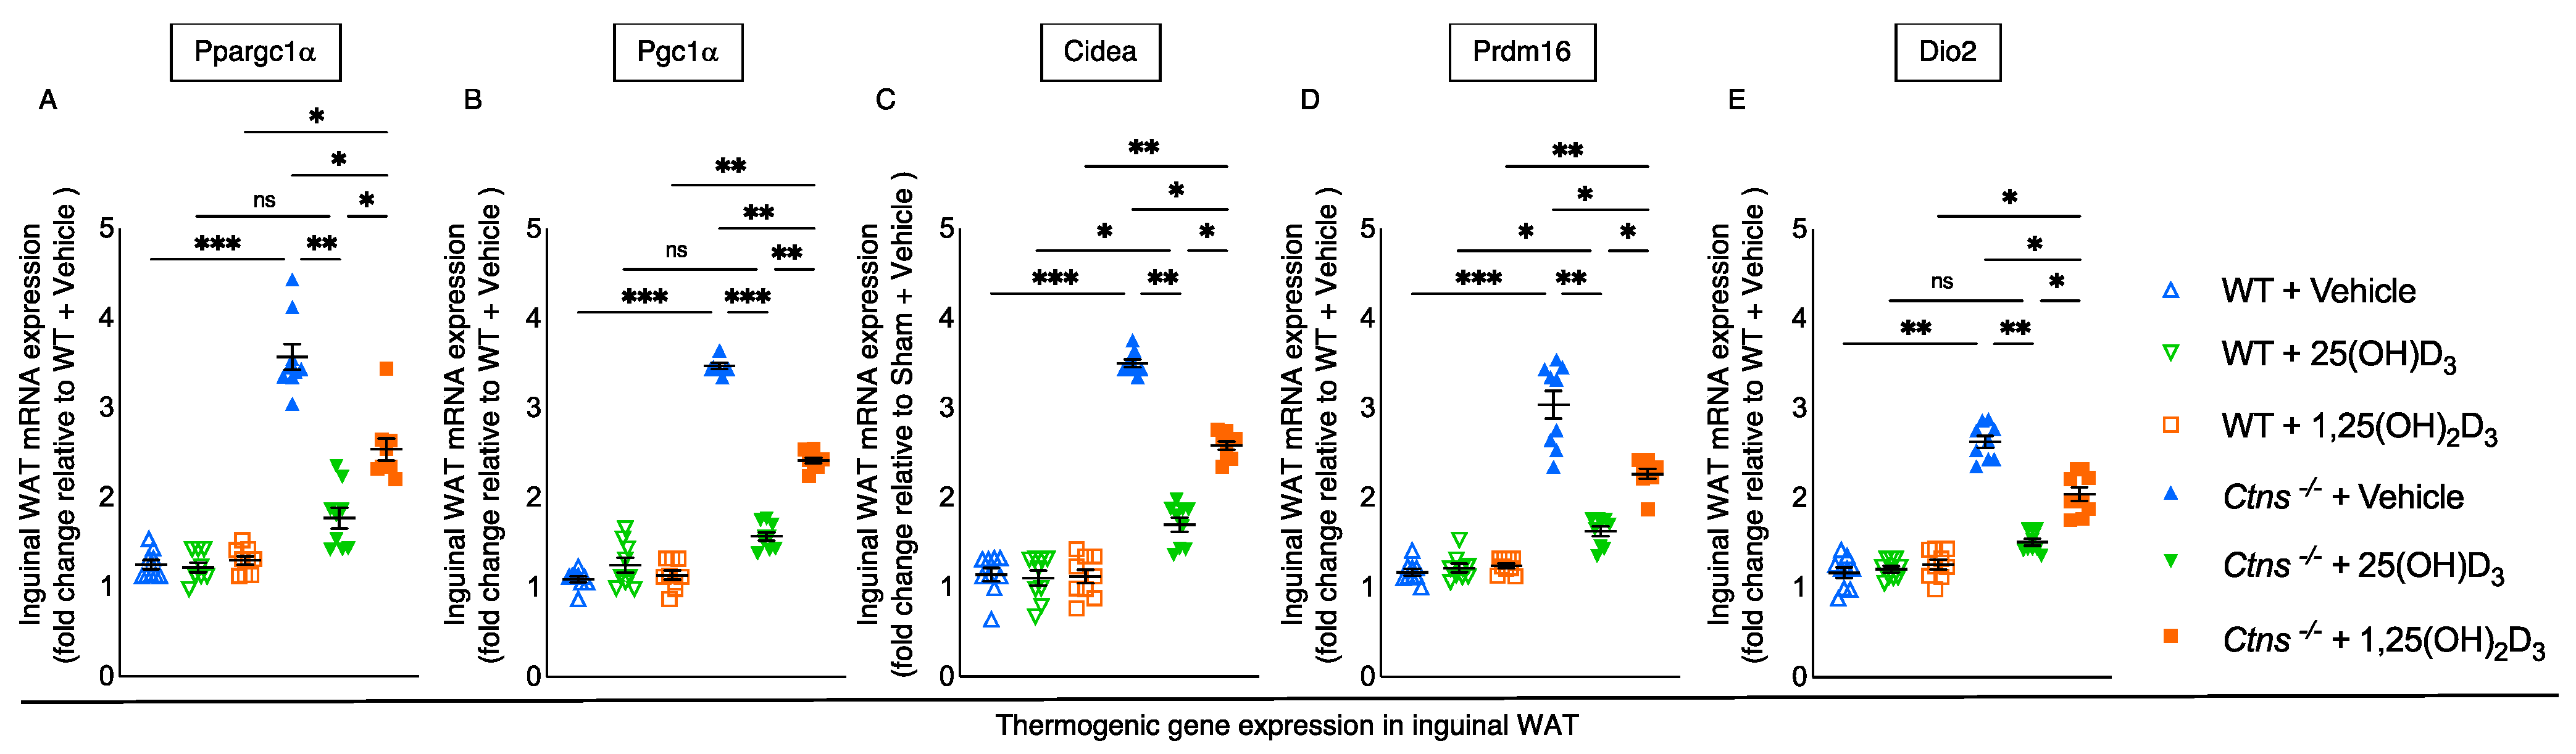
3.5. Repletion of 25-Hydroxyvitamin D3 Mitigates White Adipose Tissue Browning in Ctns−/− Mice

Beige adipocyte cell surface markers (CD137, Tbx1, and Tmem26) expression in inguinal WAT was significantly more reduced with the repletion of 25(OH)D3 levels than with the repletion of 25(OH)D3 Ctns−/− mice (Figure 3A–C). In WAT, de novo browning recruitment is promoted by the activation of Cox2/Pgf2α pathway and Toll-like receptor Tlr2 and adaptor molecules, such as Myd88 and Traf6 [33]. The expression of inguinal WAT Cox2, Pgf2α, Tlr2, Myd88, and Traf6 was significantly more reduced with the repletion of 25(OH)D3 than with the repletion of 1,25(OH)2D3 in Ctns−/− mice (Figure 3D–H).

3.6. Repletion of 25-Hydroxyvitamin D3 Decreases WAT Thermogenic Gene Expression in Ctns−/− Mice

Compared to WT mice, there was significantly increased expression of thermogenesis genes (Ppargc1α, Pgc1α, Cidea, Prdm16, and Dio2) in inguinal WAT of Ctns−/− mice. The expression of inguinal WAT genes was normalized (Ppargc1α, Pgc1α, and Dio2) or decreased (Cidea and Prdm16) with the repletion of 25(OH)D3. With repletion of 1,25(OH)2D3 in Ctns−/− mice, there was improvement but not normalization of these genes. (Figure 4).

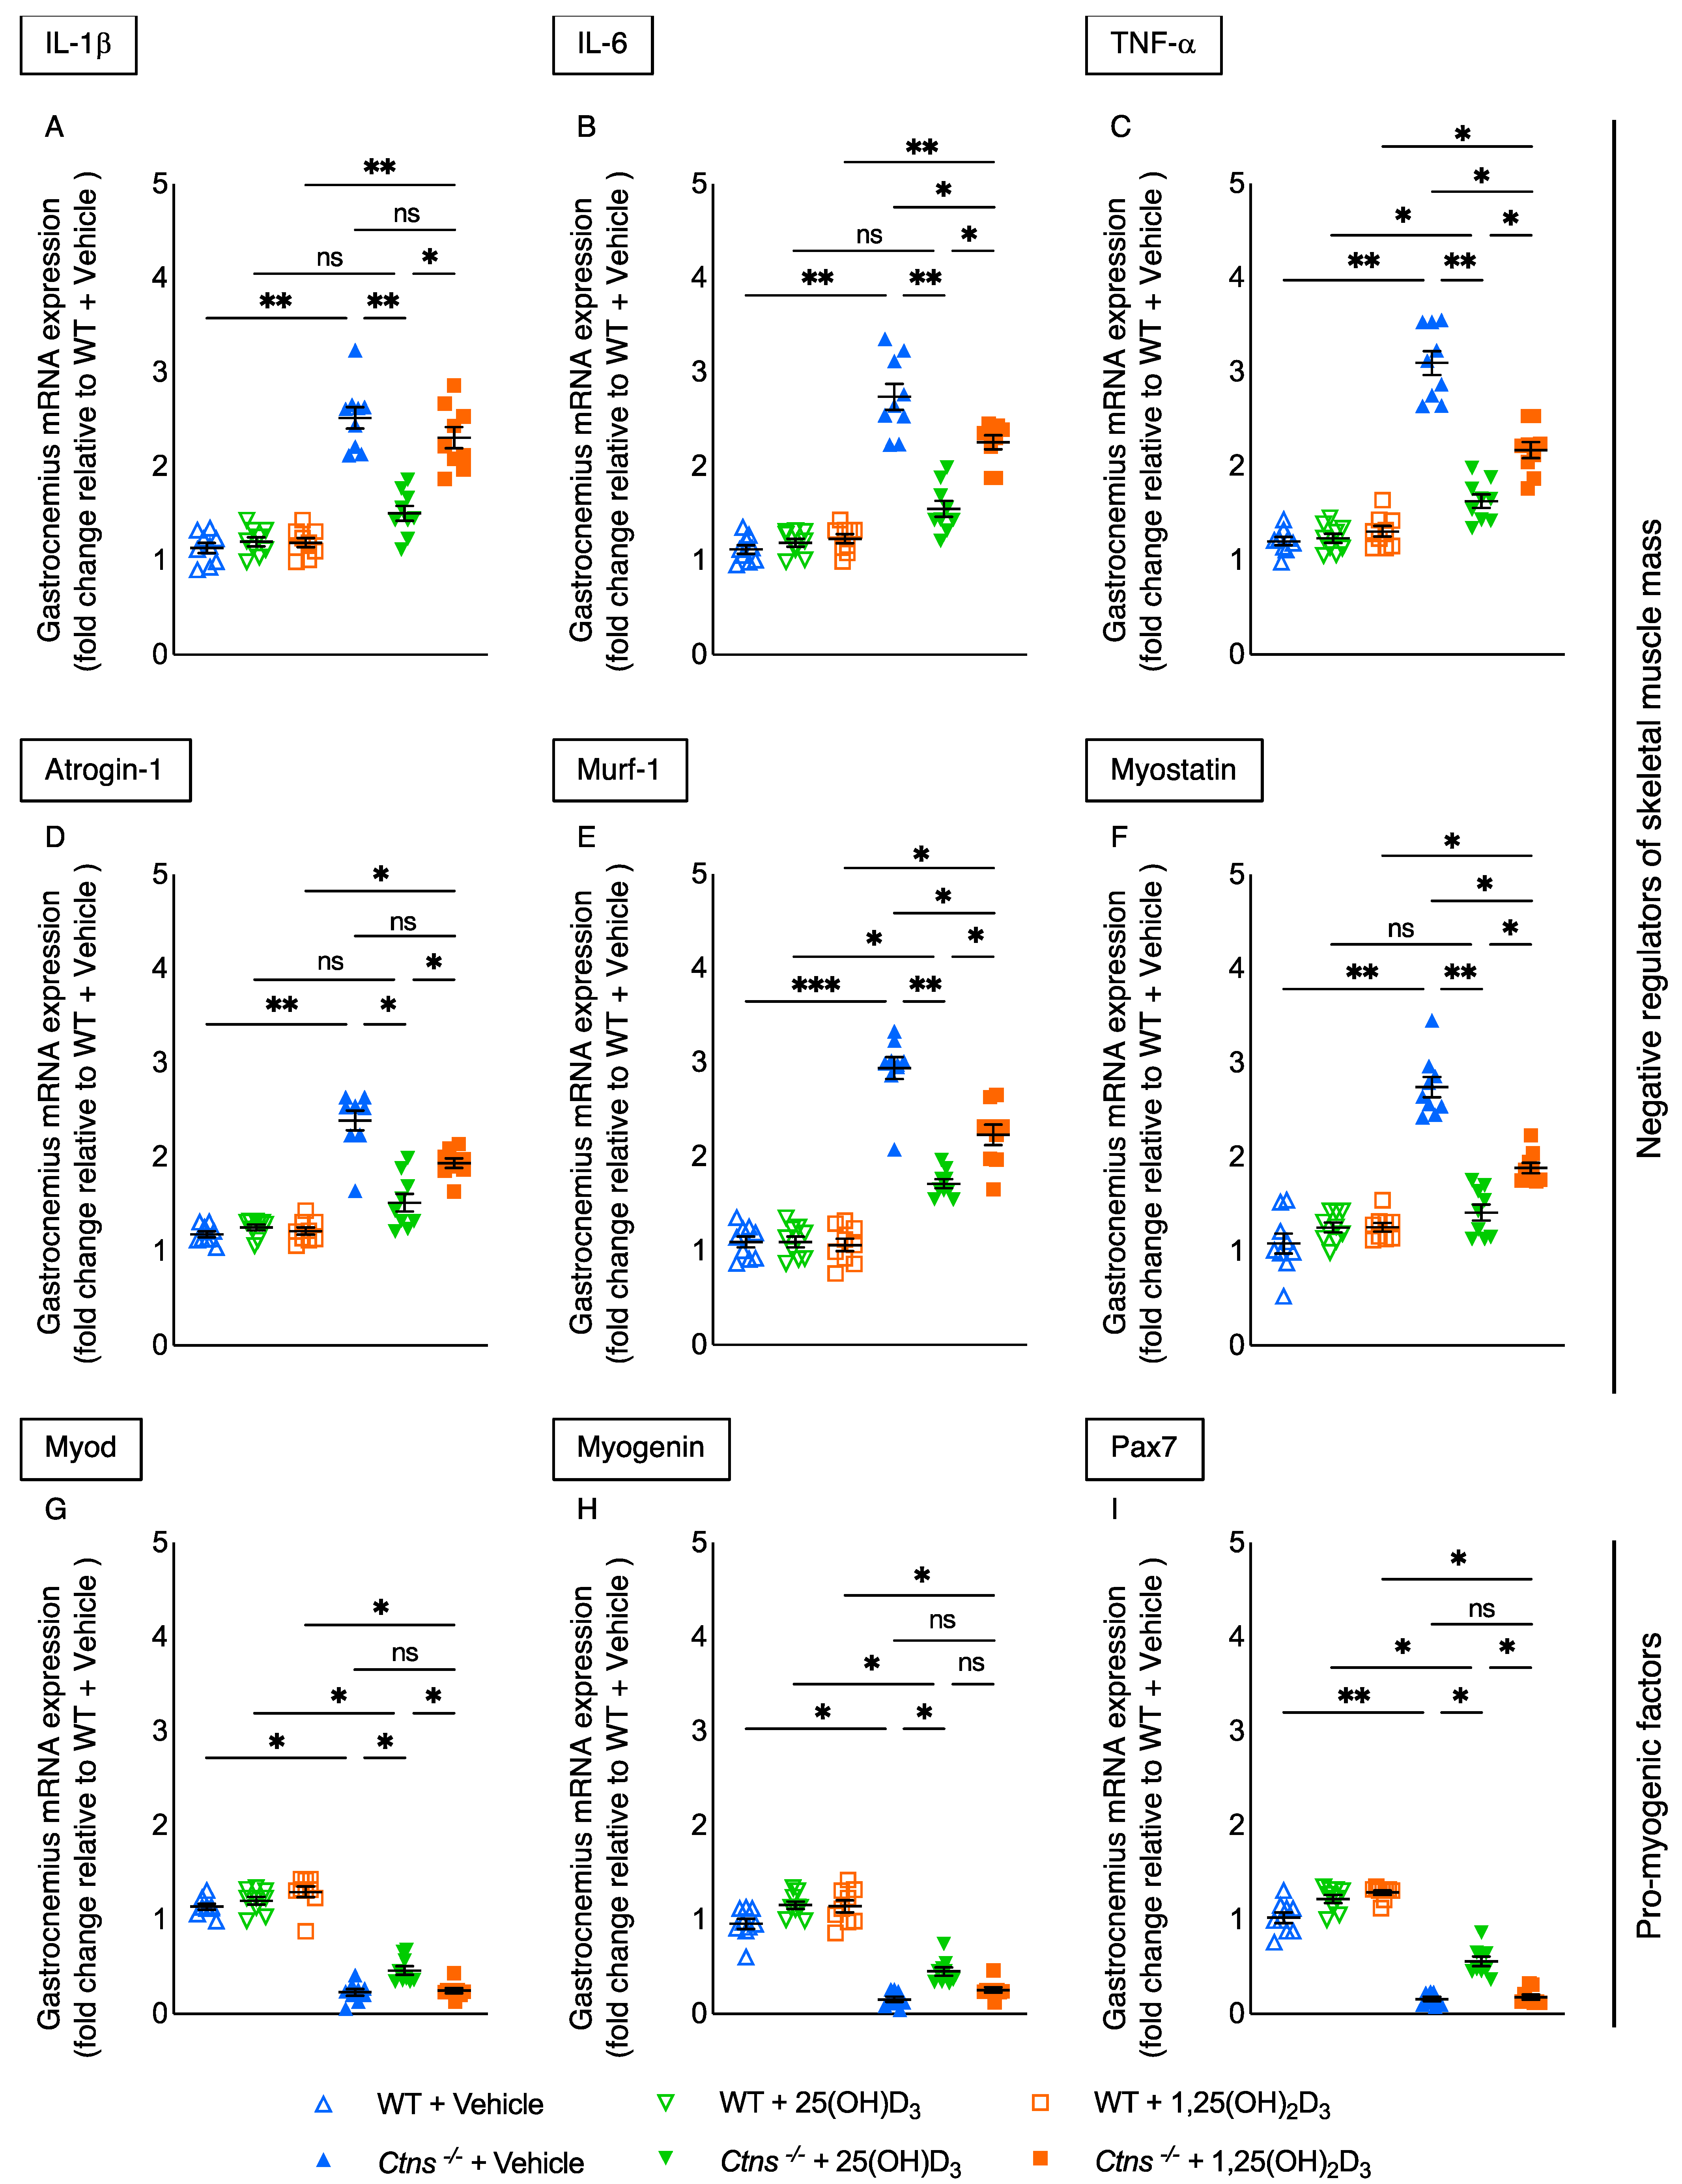
3.7. Repletion of 25-Hydroxyvitamin D3 Ameliorates Muscle Wasting Signaling Pathways in Ctns−/− Mice

Gastrocnemius expression of inflammatory cytokine was normalized (IL-1β and IL-6) or significantly decreased (TNF-α) with the repletion of 25(OH)D3 in Ctns−/− mice (Figure 5A–C). Additionally, the expression of negative regulators of skeletal muscle mass (Atrogin-1, Murf-1, and Myostatin) in the gastrocnemius was normalized or decreased by the repletion of 25(OH)D3 in Ctns−/− mice (Figure 5D–F), which was a significantly stronger effect than observed with the repletion of 1,25(OH)2D3. Furthermore, there was increased expression of pro-myogenic factors (Myod, Myogenin and Pax7) with the repletion of 25(OH)D3 (Figure 5G–I). There were no significant changes in expression of these genes with the repletion 1,25(OH)2D3.

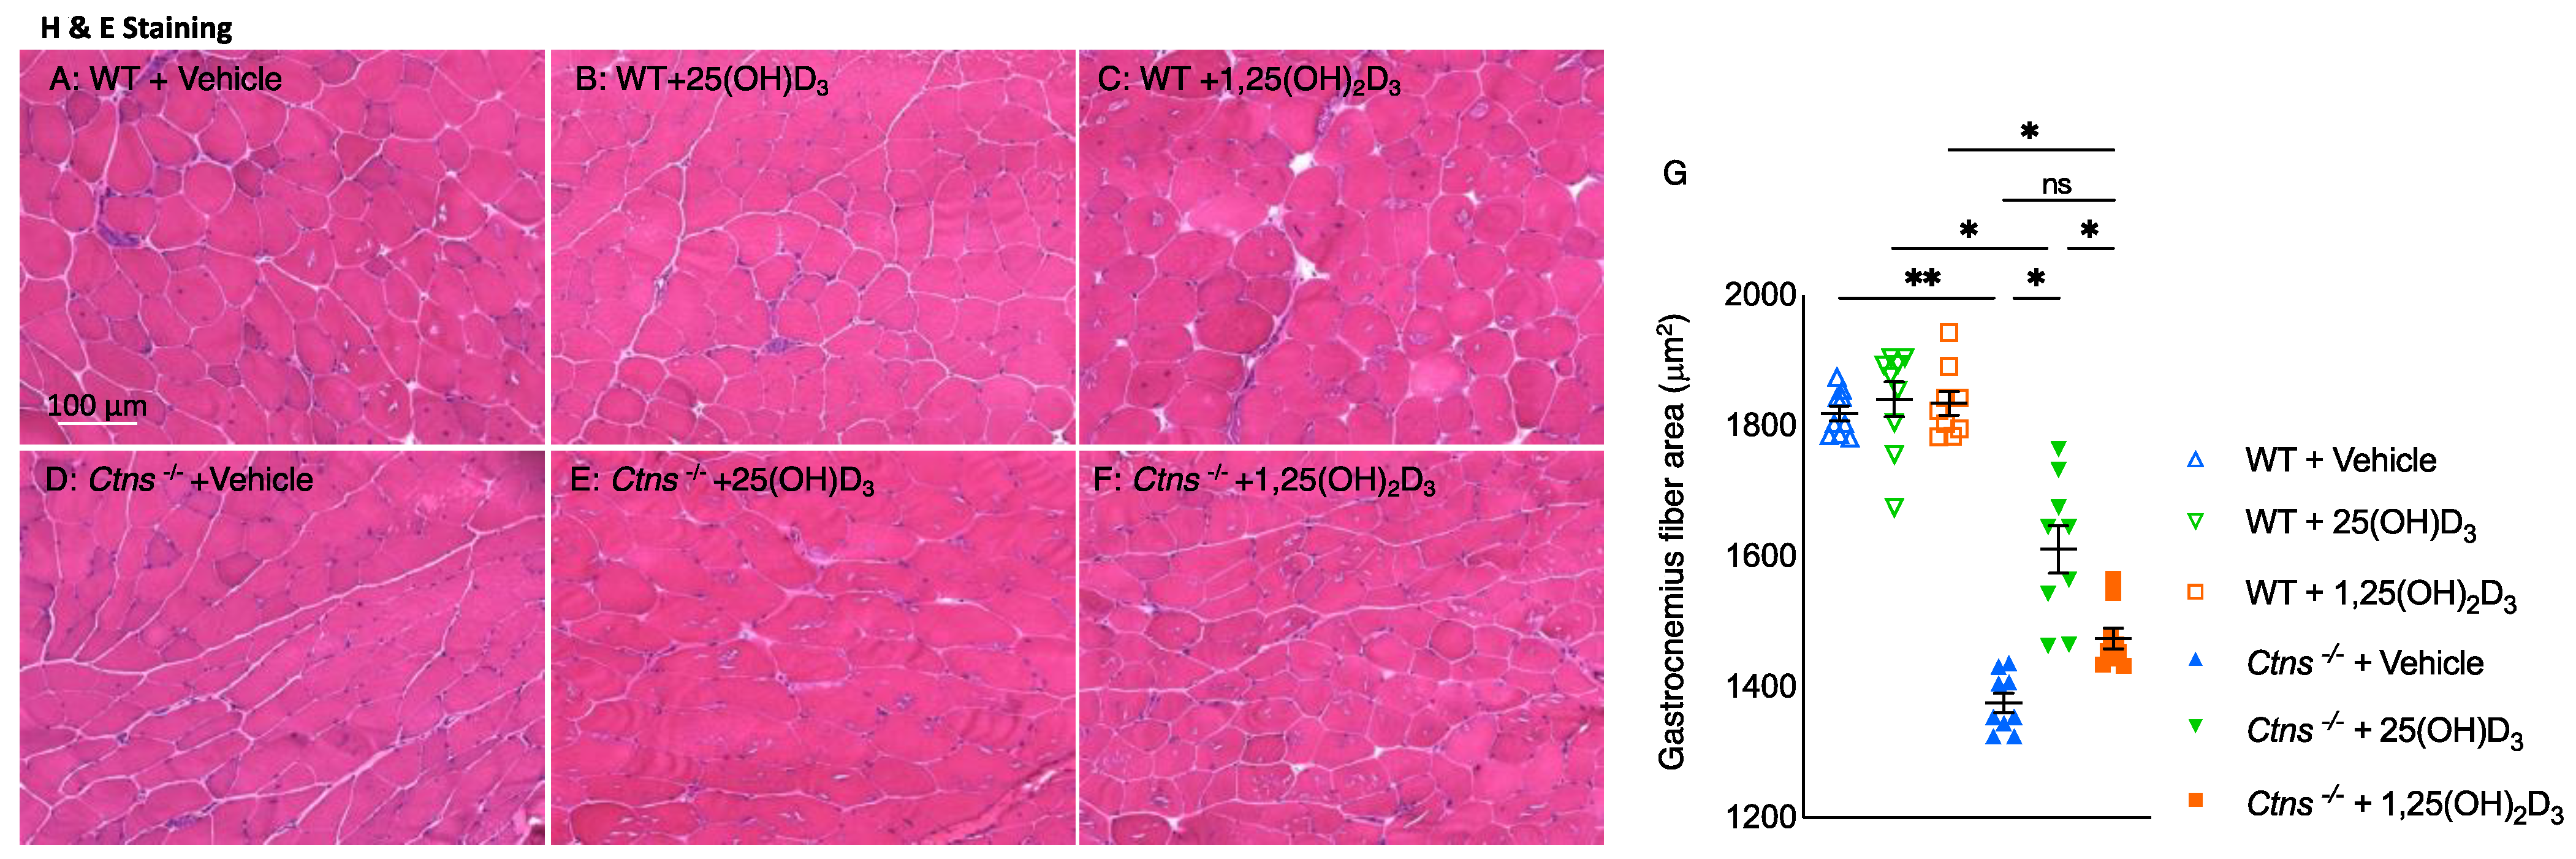
3.8. Repletion of 25-Hydroxyvitamin D3 Increases Muscle Fiber Size in Ctns−/− Mice

While investigating the effect of vitamin D repletion on skeletal muscle morphology in Ctns−/− mice, we found that the average cross-sectional area of the gastrocnemius increased significantly when restoring the levels of 25(OH)D3 but not 1,25(OH)2D3 (Figure 6).

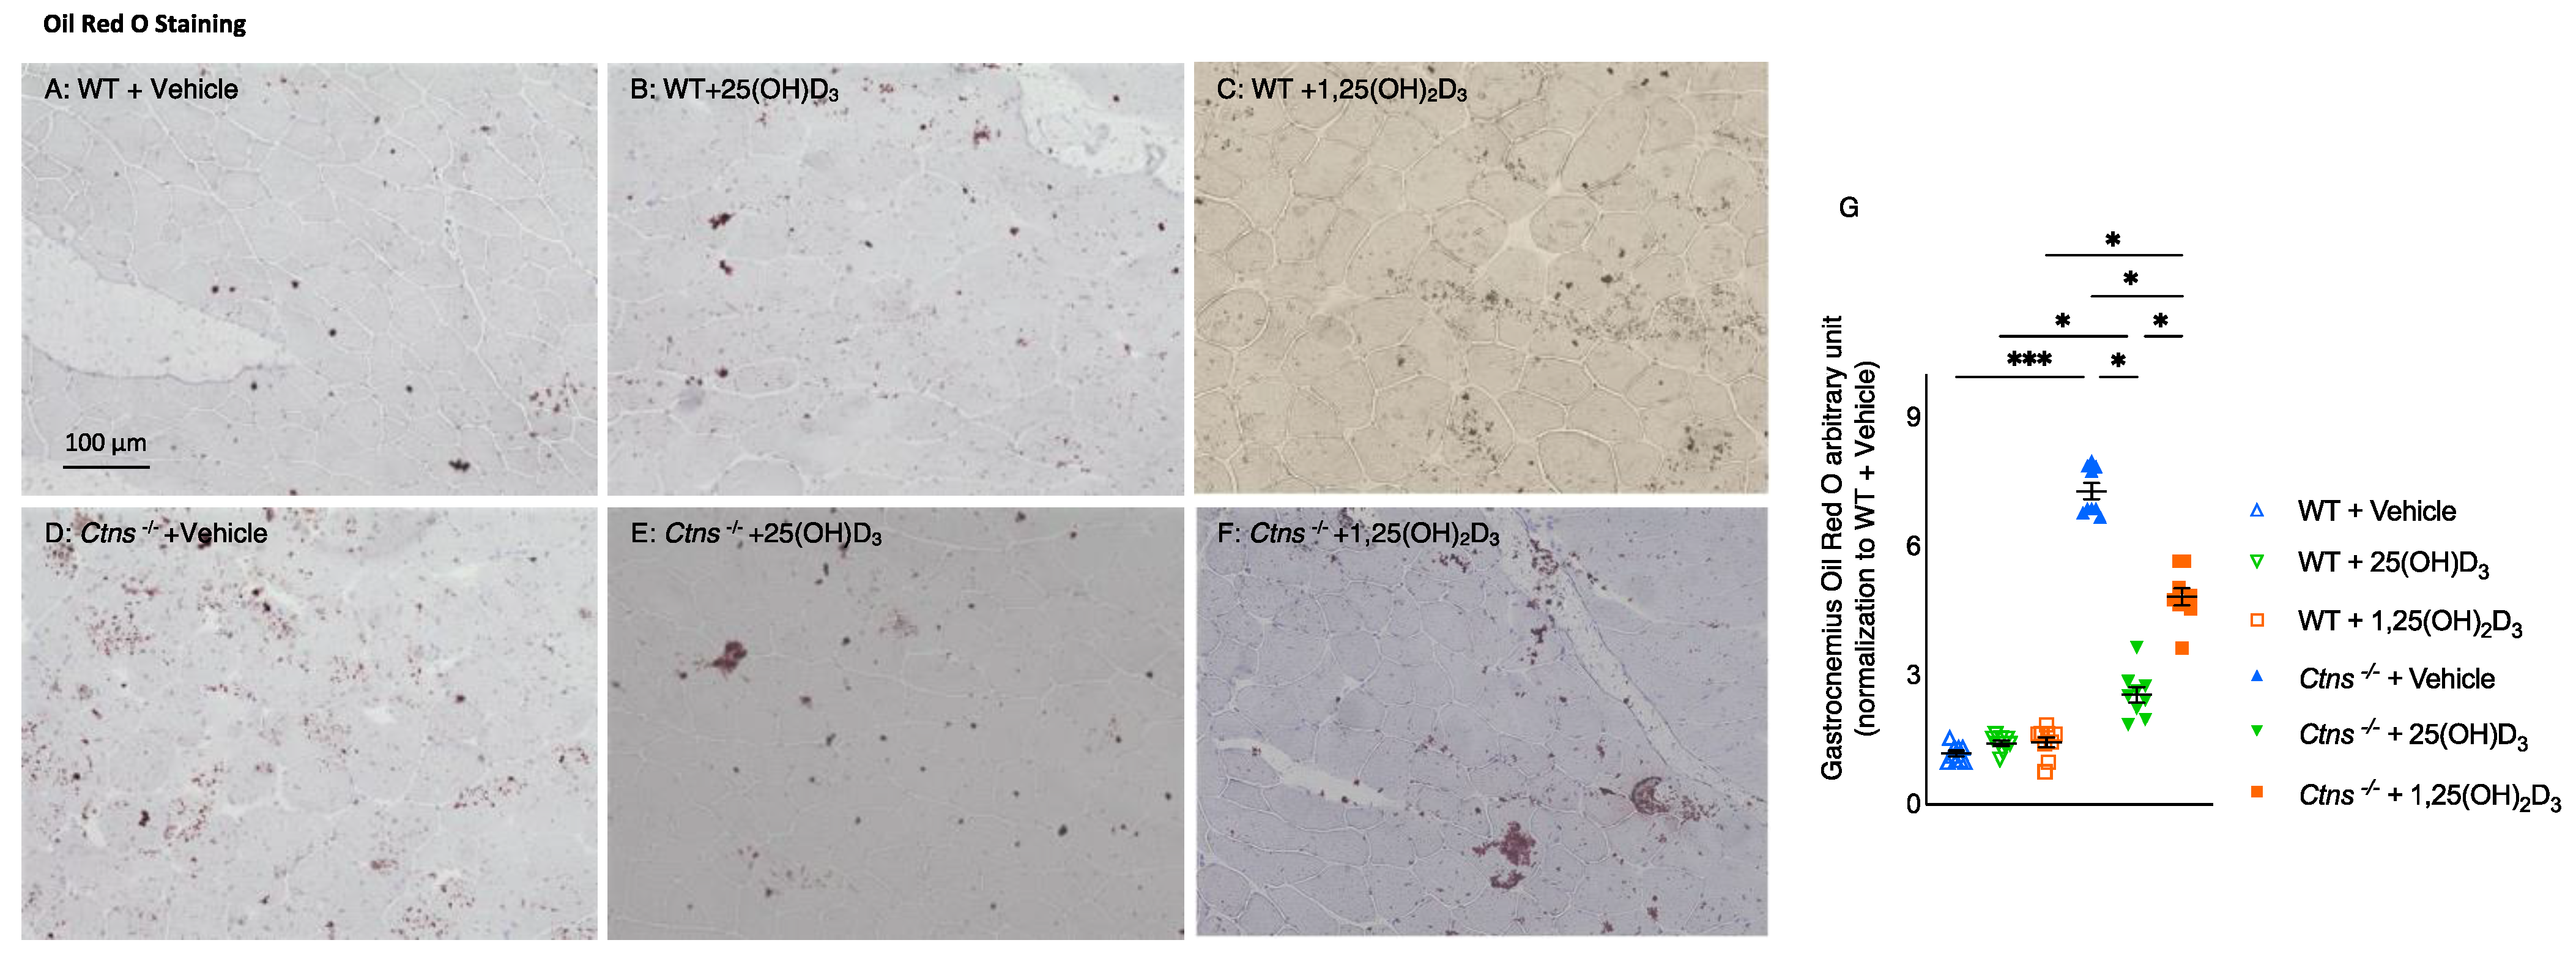
3.9. Repletion of 25-Hydroxyvitamin D3 Decreases Muscle Fat Infiltration in Ctns−/− Mice

Fatty infiltration in skeletal muscle was significantly decreased with the repletion of 25(OH)D3 compared to repletion of 1,25(OH)2D3 (Figure 7).

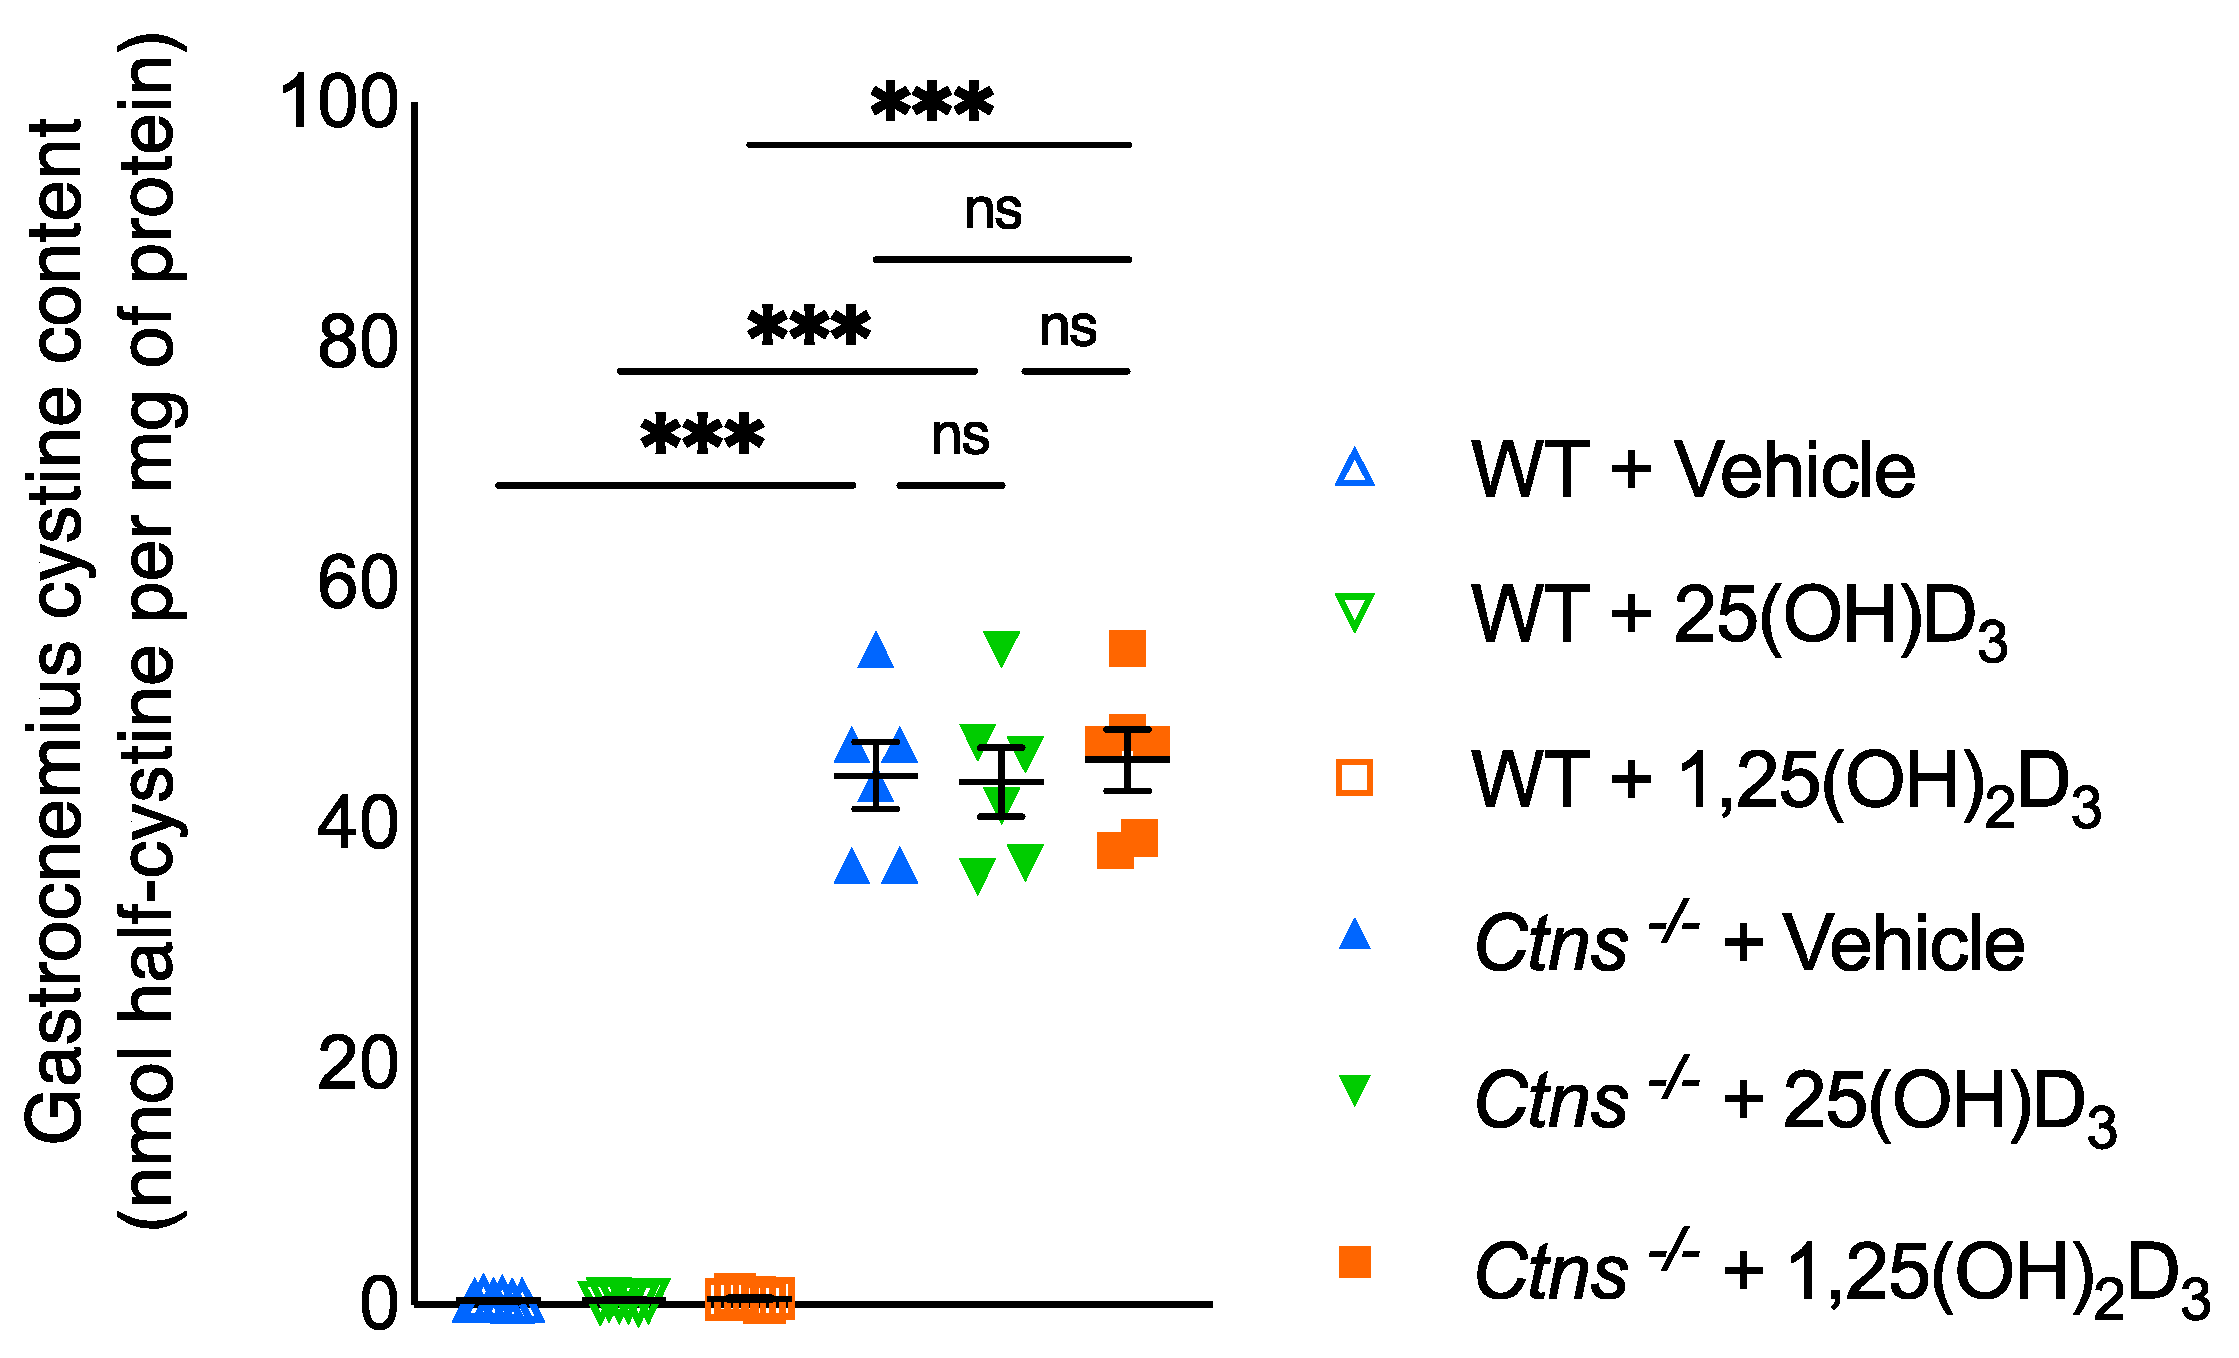
3.10. Muscle Content of Cystine in Ctns−/− Mice

We measured gastrocnemius cystine in the experimental mice. Muscle cystine content was significantly increased in Ctns−/− mice (Figure 8). Supplementation of 25(OH)D3 or 1,25(OH)2D3 did not influence muscle cystine content in Ctns−/− mice.

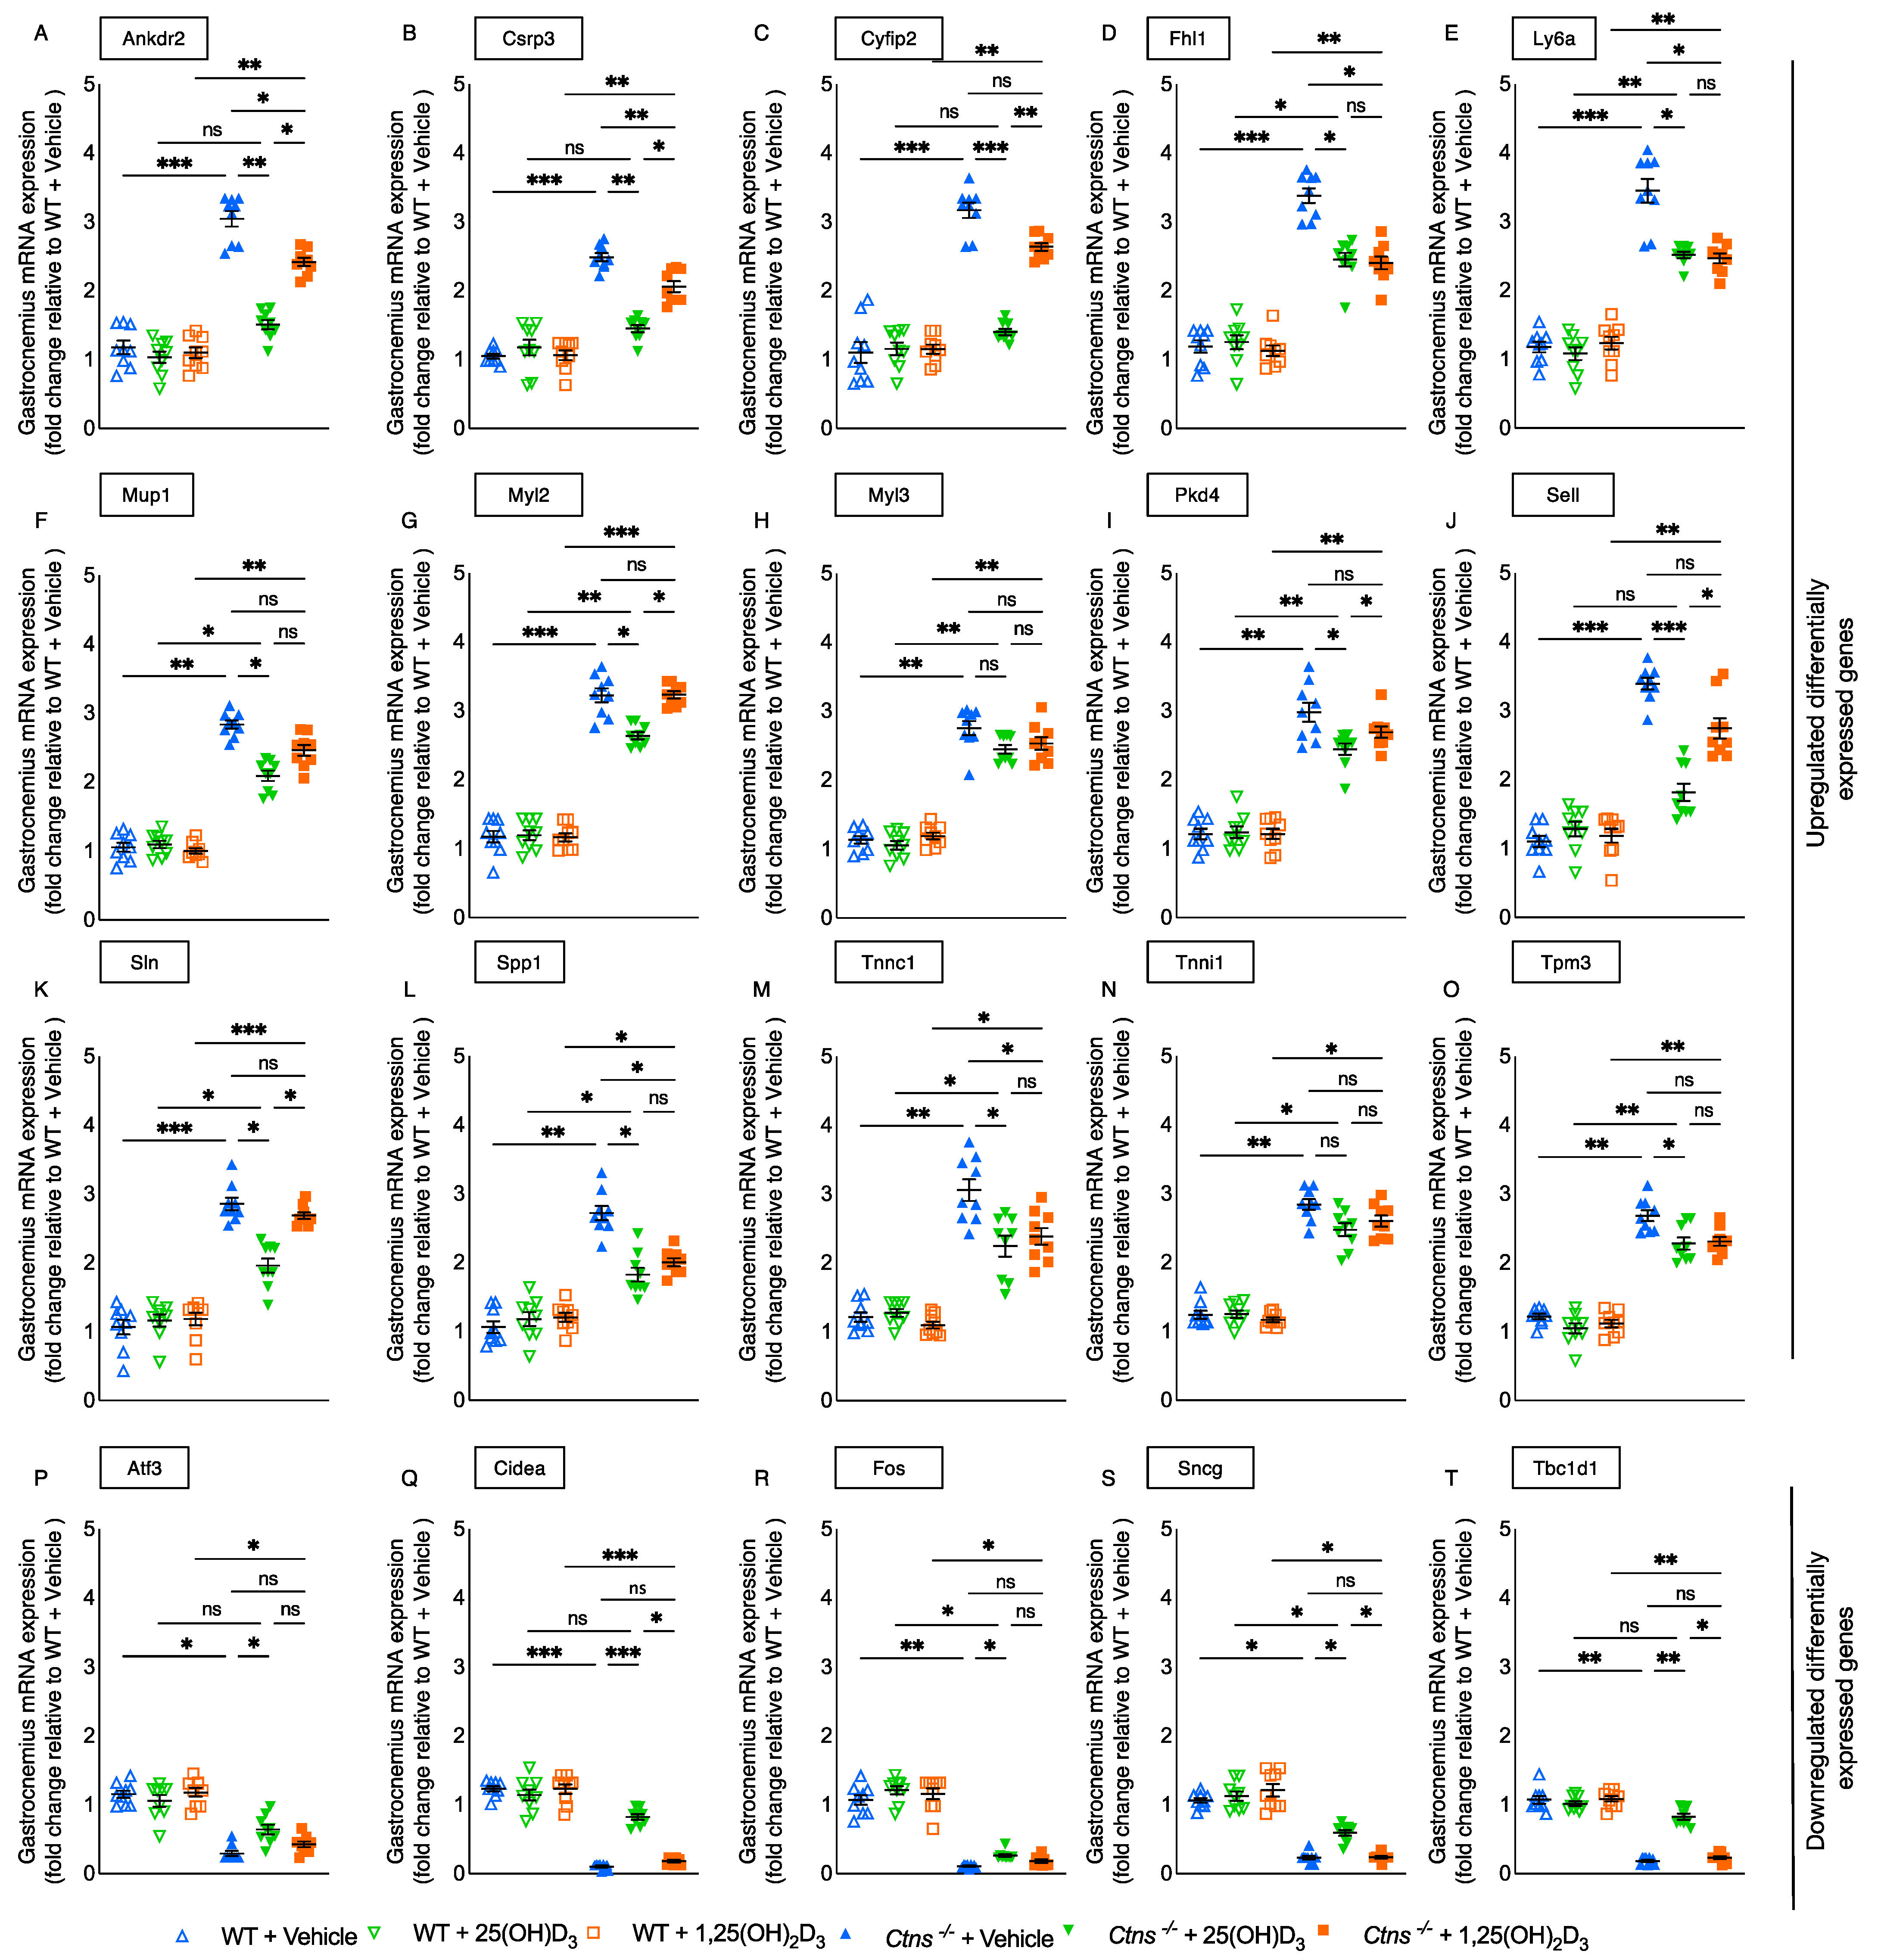
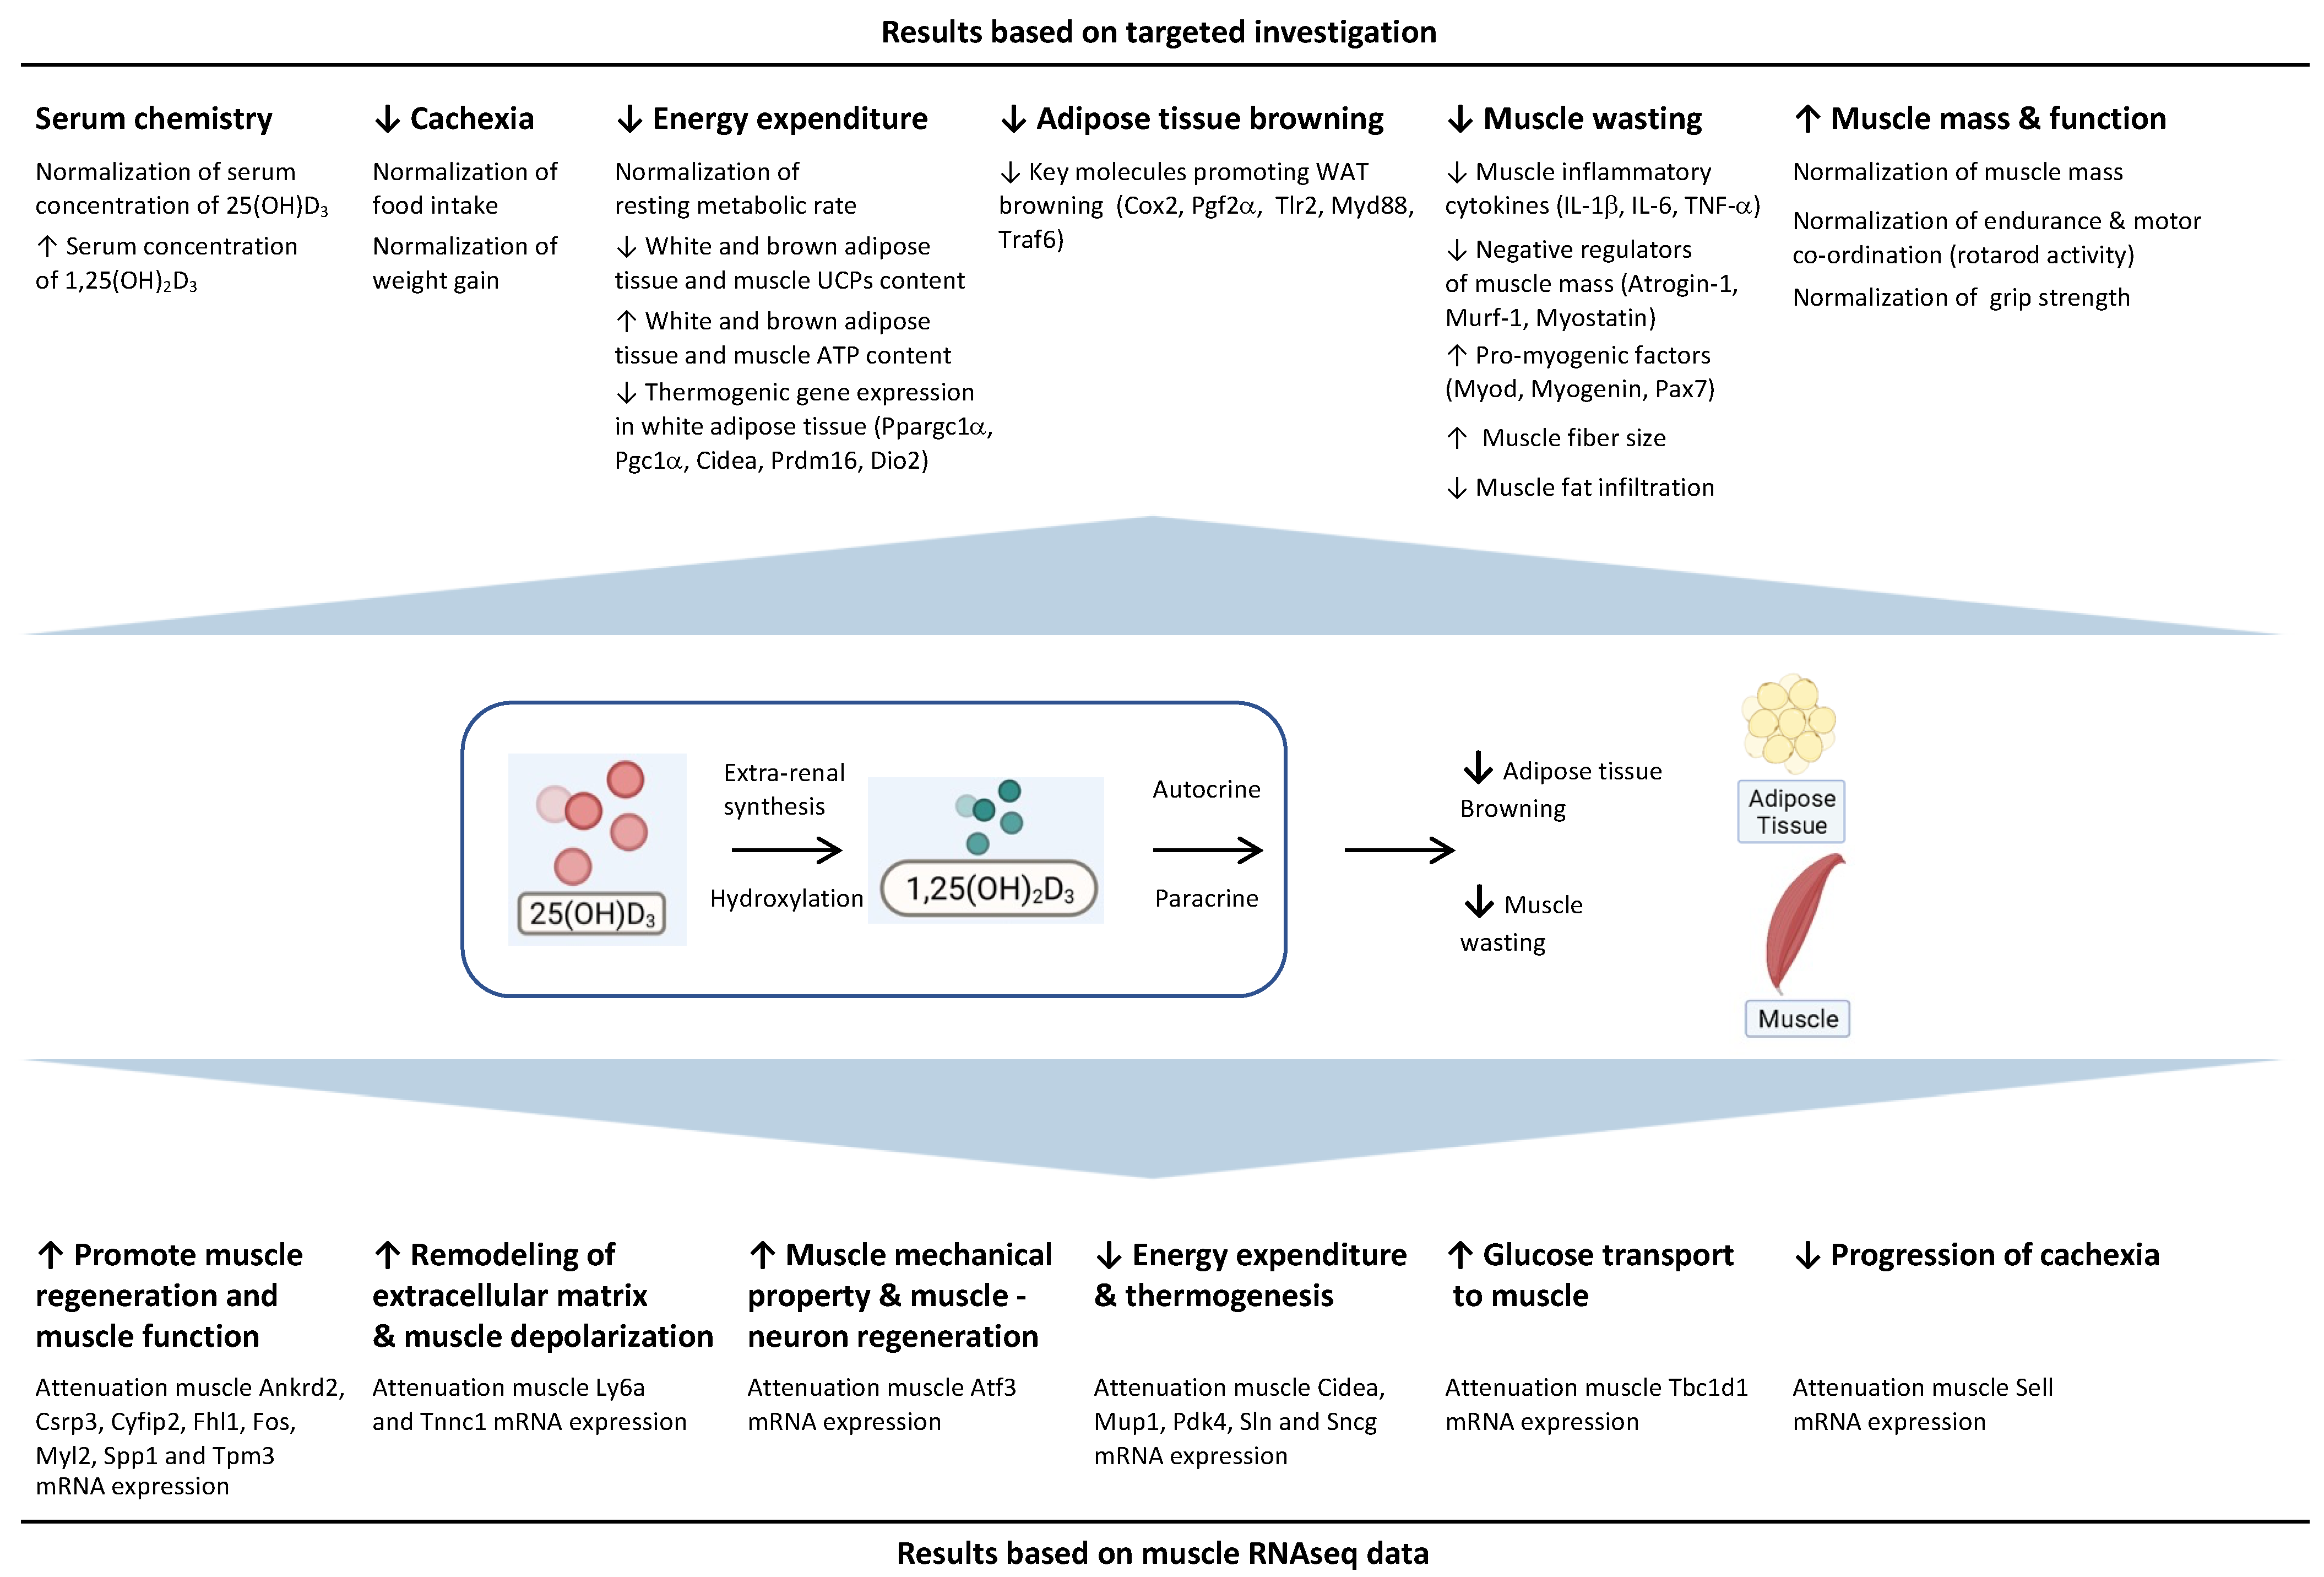
3.11. Molecular Mechanism of 25-Hydroxyvitamin D3 Repletion by RNAseq Analysis

In a previous study, we identified twenty different genes that play a role in energy metabolism, organismal injury and abnormalities, as well as the development and function of skeletal, muscular, and nervous systems by performing RNAseq analysis on gastrocnemius samples from Ctns−/− mice and WT mice [19]. For Myl3 and Tnni1, no significant changes were detected. Notable, repletion of 25(OH)D3 improved or normalized (Ankrd2, Csrp3, Cyfip2, Fhl1, Ly6a, Mup1, Myl2, Pdk4, Sell, Sln, Spp1, Tnnc1 and Tpm3) as well as (Atf3, Cidea, Fos, Sncg and Tbc1d1) muscle gene expression, but repletion of 1,25(OH)2D3 did not, in Ctns−/− mice (Figure 9). Potential functional significance of these specific 18 differentially expressed muscle genes has been previously discussed [19].

4. Discussion

In this paper, we report novel findings of the metabolic advantages of 25(OH)D3 over 1,25(OH)2D3 repletion in Ctns−/− mice, a genetic model of INC. Importantly, the 25(OH)D3 supplementation protocol normalized serum concentration of 25(OH)D3 and significantly increased but not normalize serum concentration of 1,25(OH)2D3 in Ctns−/− mice whereas the 1,25(OH)2D3 supplementation protocol normalized serum concentration of 1,25(OH)2D3 but did not change the serum concentration of 25(OH)D3 in Ctns−/− mice. At these administration dosages, 25(OH)D3 repletion corrected cachexia as well as attenuated fat and muscle pathologies in Ctns−/− mice, but 1,25(OH)2D3 repletion did not.
The metabolic advantages that accompanied 25(OH)D3 repletion over 1,25(OH)2D3 repletion in Ctns−/− mice involve many pathways. The main mechanism of 25(OH)D3 action likely results from local hydroxylation to 1,25(OH)2D3. Autocrine and paracrine effects may be involved as 1α-hydroxylase as well as VDR are present locally in target tissues such as skeletal muscle and fat. In addition, provision of more substrate such as 25(OH)D3 to the kidney will increase renal 1α-hydroxylation, accounting for the increase of circulating 1,25(OH)2D3. Thus, 25(OH)D3 supplementation has dual effects of increasing 1,25(OH)2D3 both locally and systemically. Furthermore, due to its hydrophobic nature, 25(OH)D3 potentially has increased cellular uptake compared to 1,25(OH)2D3. Cellular uptake of 25(OH)D3 occurs through the endocytosis of 25(OH)D3 to its binding complex mediated by megalin [34,35]. Furthermore, circulating 25(OH)D3 has much longer half-life (approximately two to three weeks) than 1,25(OH)2D3 (less than four hours) [20,36]. In several cell types, 25(OH)D3 at physiological concentrations has a similar level of potency compared with 1,25(OH)2D3 at pharmacological concentrations [22,23,24,25,26,27]. Even when it is not hydroxylated, 25(OH)D3 is an active hormone (as shown by the inhibition of 1-α hydroxylase) in various types of cells [22,25,26,27,37]. 25(OH)-19-nor-D3, a 25(OH)D3 analog exhibits anti-proliferative activity that is dependent on VDR but independent of 1α-hydroxylation [37]. Furthermore, 24-hydroxylase catalyzes the conversion of 25(OH)D3 and 1,25(OH)2D3 to 24R,25(OH)2D and 1,24,25-(OH)3D3, respectively [36,37]. Since distinct biological effects have been described for both 24R,25(OH)2D and 1,24,25-(OH)3D3 in numerous tissues and cell lines [37,38], the extent to which 25(OH)D3 acts directly or through its metabolites, such as 24R,25(OH)2D and 1,24,25-(OH)3D3, is unclear [39]. Therefore, a comprehensive system biology analysis is needed in future studies to further characterize the beneficial metabolic effects that resulted from 25(OH)D3 supplementation.
We showed the impact of 25(OH)D3 repletion in correcting cachexia and in vivo muscle function in Ctns−/− mice. These results may have translational importance. Anorexia and increased energy use at rest are associated with poor survival in subjects on chronic dialysis [40,41].
UCPs regulates energy metabolism for the entire body [42]. Upregulation of adipose and muscle UCPs has been described in cachexia from different diseases and thought to be mechanistic involved in hypermetabolism in these disorders [43,44]. UCPs, mitochondrial inner membrane proteins, produce heat while ATPases, proton channels located in the same membrane, generate ATP. Increased expression of UCPS not only stimulates the process of thermogenesis but also inhibits the synthesis of ATP [42]. Compared to the repletion of 1,25(OH)2D3, 25(OH)D3 repletion in Ctns−/− mice not only normalized fat UCP1 and muscle UCP3 levels but also significantly increased their ATP content. Murine fat and human cells all expressed VDR and 1α hydroxylase, the local enzyme that hydroxylates 25(OH)D3 to 1,25(OH)2D3 [45,46,47]. When mouse 3T3-L1 pre-adipocytes were incubated with 25(OH)D3, the media showed a buildup of 1,25(OH)2D3 [48]. 25(OH)D3 also binds to the UCP3 promoter region to modulate its expression in muscle [49]. WAT of Ctns−/− mice, there show upregulated thermogenic genes (Ppargc1α, Pgc1α, Cidea, Prdm16, and Dio2) (Figure 4), which was attenuated or normalized with 25(OH)D3 repletion.
Injury stimulates muscle satellite cells to differentiate and regenerate muscle fibers through activation of the transcription factor pair box 7 (Pax7) [50]. Compared to 1,25(OH)2D3 repletion, 25(OH)D3 repletion not only significantly decreased atrophy-related molecules but also significantly increased regenerative molecules in Ctns−/− mice (Figure 5).
Additionally, we documented morphological features in skeletal muscle of mice by measuring fiber diameter and fat deposition in gastrocnemius muscle. In Ctns−/− mice, 25(OH)D3 significantly improved muscle diameter and decreased fat deposition whereas 1,25(OH)2D3 did not (Figure 6 and Figure 7).
INC results from cystine accumulation primarily in kidney with many comorbidities [2,3]. Myopathy is prevalent in long term follow up studies in INC patients, including those who were treated with cysteamine. Gahl et al. [51] reported myopathy in 50% of 100 patients with INC; the incidence rising to 80% as the time of off-cysteamine therapy increased. Brodin-Sartoruius et al. reported myopathy in 22 out of 86 adult INC patients who were treated with cysteamine in a more recent long-term follow up study [52]. We measured muscle cystine content in our experimental animals. Muscle cystine content was significantly increased in Ctns−/− mice and repletion of 25(OH)D3 or 1,25(OH)2D3 did not change muscle cystine content in Ctns−/− mice (Figure 8). This would suggest that muscle wasting in INC is not the direct consequence of cystine accumulation.
Repletion of 25(OH) normalized or decreased muscle inflammatory cytokine expression in Ctns−/− mice (Figure 5). Inflammation may interact with oxidative stress, abnormal autophagy, apoptosis, defective endocystic trafficking, impaired proteolysis as well as mitochondrial dysfunction in cystinotic cells [53,54]. We will plan future research to address these potential pathways.
Finally, we used RNAseq analysis to assess the muscle transcriptome. Importantly, 25(OH)D3, but not 1,25(OH)2D3, significantly improved the abnormal signature of muscle genes (13 upregulated and 5 downregulated) in Ctns−/− mice (Figure 9). Ankrd2, Csrp3, Cyfip2, Fhl1, Ly6a, Spp1, and Tpm3 as well as Fos and Tbc1d1 are important determinants of muscle mass [19]. Mup1, Myl2, Pdk4, and Sln as well as Cidea and Sncg have been associated with energy metabolism.

5. Conclusions

Patients with INC exhibit diminished serum concentrations of 25(OH)D3 and 1,25(OH)2D3. In this study we demonstrated several metabolic advantages of 25(OH)D3 repletion over 1,25(OH)2D3 in Ctns−/− mice, a mouse model of INC, involving various cellular pathways (Figure 10). Monitoring and maintaining sufficient levels of circulating 25(OH)D3 and appropriate supplementation should be highlighted as a crucial treatment strategy in patients with INC to mitigate the devastating complications of adipose tissue browning and cachexia.

Supplementary Materials

The following supporting information can be downloaded at: https://www.mdpi.com/article/10.3390/cells11203264/s1, Table S1: Immunoassay information for blood and serum chemistry, muscle adenosine triphosphate content as well as muscle and adipose tissue protein analysis. Table S2: PCR primer information. Tables S3–S5: Serum and blood chemistry of mice.

Author Contributions

Conceptualization, W.W.C. and R.H.M.; methodology, W.W.C. and R.H.M.; software, W.W.C. and A.G.; data curation, P.Z., W.W.C., A.G. and V.V.; validation, W.W.C. and R.H.M.; formal analysis, P.Z., W.W.C., A.G., V.V. and R.H.M.; investigation, P.Z., W.W.C., A.G. and V.V.; resources, W.W.C. and A.G.; writing—original draft preparation, P.Z., W.W.C., A.G., V.V., E.A.O. and R.H.M.; writing—review and editing, P.Z., W.W.C., A.G., V.V., E.A.O. and R.H.M.; visualization, W.W.C. and A.G.; supervision, W.W.C. and R.H.M.; project administration, W.W.C.; funding acquisition, R.H.M. All authors have read and agreed to the published version of the manuscript.

Funding

This investigation was supported by Cystinosis Research Foundation. P.Z. was supported by the following fundings—“Chunhui Plan” Cooperative Scientific Research Project, Ministry of Education of the People’s Republic of China (HLJ2019023), 2022 Key R&D Plan of Science and Technology Department of Sichuan Province (2022YFS0149), Science and Technology Fund of Chengdu Medical College in 2021 (CYZYB21-22), Medical Research Project of Sichuan Province in 2021, Sichuan Medical Association (S21037) and Medical Research Project of Chengdu Municipal Health Commission (2022113).

Institutional Review Board Statement

This study (protocol S01754 was approved on 18 January 2008) was in line with the National Institutes of Health.

Informed Consent Statement

Not applicable.

Data Availability Statement

The authors confirm that the data supporting the findings of this study can be found in the article and Supplementary Materials. Additional raw data supporting the findings of this study can be made available by request from the corresponding author (R.H.M).

Acknowledgments

We thank Jianhua Shao, UCSD Pediatric Diabetes Research Center for the use of EchoMRI-100™. A National Cancer Institute Cancer Center Support Grant (CCSG Grant P30CA23100) supports the Tissue Technology Shared Resource at University of California, San Diego. A P30 grant (DK 079337) from the National Institute of Diabetes and Digestive and Kidney Diseases (NIDDK) supports the Acute Kidney Injury Research Bioanalytical Core at the O’Brien Center of the University of Alabama at Birmingham.

Conflicts of Interest

The authors declare no conflict of interest.

References

  1. Town, M.M.; Jean, G.; Cherqui, S.; Attard, M.; Forestier, L.; Whitmore, S.A.; Callen, D.F.; Gribouval, O.; Broyer, M.; Bates, G.; et al. A novel gene encoding an integral membrane protein is mutated in nephropathic cystinosis. Nat. Genet. 1998, 18, 319–324. [Google Scholar] [CrossRef]
  2. Gahl, W.A.; Thoene, J.G.; Schneider, J.A. Cystinosis. N. Engl. J. Med. 2002, 347, 111–121. [Google Scholar] [CrossRef]
  3. Nesterova, G.; Gahl, W. Nephropathic cystinosis: Late complications of a multisystemic disease. Pediatr. Nephrol. 2007, 23, 863–878. [Google Scholar] [CrossRef]
  4. Theodoropoulos, D.S.; Krasnewich, D.; Kaiser-Kupfer, M.I.; Gahl, W.A. Classic Nephropathic Cystinosis as an Adult Disease. JAMA 1993, 270, 2200–2204. [Google Scholar] [CrossRef]
  5. Cheung, W.W.; Cherqui, S.; Ding, W.; Esparza, M.; Zhou, P.; Shao, J.; Lieber, R.; Mak, R.H. Muscle wasting and adipose tissue browning in infantile nephropathic cystinosis. J. Cachexia Sarcopenia Muscle 2015, 7, 152–164. [Google Scholar] [CrossRef]
  6. Fenzl, A.; Kiefer, F.W. Brown adipose tissue and thermogenesis. Horm. Mol. Biol. Clin. Investig. 2014, 19, 25–37. [Google Scholar] [CrossRef]
  7. Petruzzelli, M.; Schweiger, M.; Schreiber, R.; Campos-Olivas, R.; Tsoli, M.; Allen, J.; Swarbrick, M.; Rose-John, S.; Rincon, M.; Robertson, G.; et al. A Switch from White to Brown Fat Increases Energy Expenditure in Cancer-Associated Cachexia. Cell Metab. 2014, 20, 433–447. [Google Scholar] [CrossRef] [Green Version]
  8. A Vaitkus, J.; Celi, F.S. The role of adipose tissue in cancer-associated cachexia. Exp. Biol. Med. 2016, 242, 473–481. [Google Scholar] [CrossRef] [PubMed] [Green Version]
  9. Elattar, S.; Dimri, M.; Satyanarayana, A. The tumor secretory factor ZAG promotes white adipose tissue browning and energy wasting. FASEB J. 2018, 32, 4727–4743. [Google Scholar] [CrossRef] [PubMed] [Green Version]
  10. He, Y.; Liu, R.-X.; Zhu, M.-T.; Shen, W.-B.; Xie, J.; Zhang, Z.-Y.; Chen, N.; Shan, C.; Guo, X.-Z.; Lu, Y.-D.; et al. The browning of white adipose tissue and body weight loss in primary hyperparathyroidism. EBioMedicine 2019, 40, 56–66. [Google Scholar] [CrossRef] [PubMed]
  11. Kong, X.; Yao, T.; Zhou, P.; Kazak, L.; Tenen, D.; Lyubetskaya, A.; Dawes, B.A.; Tsai, L.; Kahn, B.B.; Spiegelman, B.M.; et al. Brown adipose tissue controls skeletal muscle function via the secretion of myostatin. Cell Metab. 2018, 28, 631–643.e3. [Google Scholar] [CrossRef] [Green Version]
  12. Kir, S.; White, J.P.; Kleiner, S.; Kazak, L.; Cohen, P.; Baracos, V.E.; Spiegelman, B.M. Tumour-derived PTH-related protein triggers adipose tissue browning and cancer cachexia. Nature 2014, 513, 100–104. [Google Scholar] [CrossRef] [Green Version]
  13. Kir, S.; Komaba, H.; Garcian, A.P.; Economopoulos, K.P.; Liu, W.; Lanske, B.; Hodin, R.A.; Spiegelman, B.M. PTH/PTHrP receptor mediates cachexia in models of kidney failure and cancer. Cell Metab. 2015, 23, 315–323. [Google Scholar] [CrossRef] [PubMed] [Green Version]
  14. Autier, P.; Boniol, M.; Pizot, C.; Mullie, P. Vitamin D status and ill health: A systematic review. Lancet Diabetes Endocrinol. 2014, 2, 76–89. [Google Scholar] [CrossRef]
  15. Park, J.E.; Tirupathi Pichiah, P.B.; Cha, Y.-S. Vitamin D and Metabolic Diseases: Growing Roles of Vitamin D. J. Obes. Metab. Syndr. 2018, 27, 223–232. [Google Scholar] [CrossRef] [Green Version]
  16. Katzir, Z.; Shivil, Y.; Landau, H.; Kidrony, G.; Popovtzer, M.M. Nephrogenic diabetes insipidus, cystinosis, and vitamin D. Arch. Dis. Child. 1988, 63, 548–550. [Google Scholar] [CrossRef] [Green Version]
  17. Steinherz, R.; Chesney, R.W.; Schulman, J.D.; DeLuca, H.F.; Phelps, M. Circulating vitamin D metabolites in nephropathic cystinosis. J. Pediatr. 1983, 102, 592–594. [Google Scholar] [PubMed]
  18. Chesney, R.W.; Hamstra, J.; Mazess, R.B.; Rose, P.; DeLuca, H.F. Circulating vitamin D metabolites concentrations in childhood renal disease. Kidney Int. 1982, 21, 65–69. [Google Scholar] [CrossRef] [Green Version]
  19. Cheung, W.W.; Hao, S.; Wang, Z.; Ding, W.; Zheng, R.H.; Gonzalez, A.; Zhan, J.-Y.; Zhou, P.; Li, S.P.; Esparza, M.C.; et al. Vitamin D repletion ameliorates adipose tissue browning and muscle wasting in infantile nephropathic cystinosis-associated cachexia. J. Cachexia Sarcopenia Muscle 2020, 11, 120–134. [Google Scholar] [CrossRef] [Green Version]
  20. Querfeld, U.; Mak, R.H. Vitamin D deficiency and toxicity in chronic kidney disease: In search of the therapeutic window. Pediatr. Nephrol. 2010, 25, 2413–2430. [Google Scholar] [CrossRef] [PubMed]
  21. Dusso, A.S. Kidney disease and vitamin D levels: 25-hydroxyvitamin D, 1,25-dihydroxyvitamin D, and VDR activation. Kidney Int. Suppl. 2011, 1, 136–141. [Google Scholar] [CrossRef] [PubMed] [Green Version]
  22. Lou, Y.-R.; Laaksi, I.; Syvala, A.; Blauer, M.; Tammela, T.L.J.; YLikomi, T.; Tuohimaa, P. 25-hydroxyvitamin D3 is an active hormone in human primary prostatic stromal cells. FASEB J. 2004, 18, 332–334. [Google Scholar] [CrossRef] [PubMed] [Green Version]
  23. Peng, X.; Hawthorne, M.; Vaishnav, A.; St-Arnaud, R.; Mehta, R.G. 25-Hydroxyvitamin D3 is a natural chemopreventive agent against carcinogen induced precancerous lesions in mouse mammary gland organ culture. Breast Cancer Res. Treat. 2009, 113, 31–41. [Google Scholar] [CrossRef] [PubMed] [Green Version]
  24. Lou, Y.-R.; Molnar, F.; Perakyla, M.; Qiao, S.; Kalueff, A.V.; St-Arnaud, R.; Carlberg, C.; Tuohimaa, P. 25-Hydroxyvitamin D(3) is an agonistic vitamin D receptor ligand. J. Steroid Biochem. Mol. Biol. 2010, 118, 162–170. [Google Scholar] [CrossRef] [PubMed]
  25. Ritter, C.S.; Armbrecht, H.J.; Slatopolsky, E.; Brown, A.J. 25-Hydroxyvitamin D(3) suppresses PTH synthesis and secretion by bovine parathyroid cells. Kidney Int. 2006, 70, 654–659. [Google Scholar] [CrossRef] [PubMed] [Green Version]
  26. Zhang, Z.L.; Ding, X.F.; Tong, J.; Li, B.Y. Partial rescue of the phenotype in 1alpha-hydroxylase gene knockout mice by vitamin D3 injection. Endocr. Res. 2011, 36, 101–108. [Google Scholar] [CrossRef] [PubMed]
  27. Tuohimaa, P.; Wang, J.-H.; Khan, S.; Kuuslahti, M.; Qian, K.; Manninen, T.; Auvinen, P.; Vihinen, M.; Lou, Y.-R. Gene expression profiles in human and mouse primary cells provide new insights into the differential actions of vitamin D3 metabolites. PLoS ONE 2013, 8, e75338. [Google Scholar] [CrossRef]
  28. Young, S.; Struys, E.; Wood, T. Quantification of creatine and guanidinoacetate using GC-MS and LC-MS/MS for the detection of cerebral creatine deficiency syndromes. Curr. Protoc. Hum. Genet. 2007, 54, 17-3. [Google Scholar] [CrossRef]
  29. Du bowitz, V.; Sewry, C.A.; Oldfors, A.; Lane, R.J.M. Muscle Biopsy: A Practical Approach; Elsevier Health Sciences: Amsterdam, The Netherlands, 2013; 572p. [Google Scholar]
  30. Mehlem, A.; Hagberg, C.; Muhl, L.; Eriksson, U.; Falkevall, A. Imaging of neutral lipids by oil red O for analyzing the metabolic status in health and disease. Nat. Protoc. 2013, 8, 1149–1154. [Google Scholar] [CrossRef] [Green Version]
  31. Cherqui, S.; Sevin, C.; Hamard, G.; Kaatzis, V.; Sich, M.; Pequignot, M.O.; Gogat, K.; Abitbol, M.; Broyer, M.; Gubler, M.-C.; et al. Intralysosomal cystine Accumulation in Mice Lacking Cystinosin, the Protein Defective in Cystinosis. Mol. Cell Biol. 2002, 22, 7622–7632. [Google Scholar] [CrossRef]
  32. Syres, K.; Harrison, F.; Tedlock, M.; Jester, J.-V.; Simpson, J.; Roy, S.; Salomon, D.R.; Cherqui, S. Successful treatment of the murine model of cystinosis using bone marrow cell transplantation. Blood 2009, 11, 2542–2552. [Google Scholar] [CrossRef] [PubMed] [Green Version]
  33. Xie, P. TRAF molecules in cell signaling and in human diseases. J. Mol. Signal. 2013, 8, 7. [Google Scholar] [CrossRef] [PubMed] [Green Version]
  34. Hassan-Smith, Z.; Jenkinson, C.; Smith, D.J.; Hernadez, I.; Morgan, S.A.; Crabtree, N.J.; Gittoes, N.J.; Keevil, B.G.; Stewart, P.M.; Hewison, M. 25-hydroxyvitamin D3 and 1,25-dihydroxyvitamin D3 exert distinct effects on human skeletal muscle function and gene expression. PLoS ONE 2017, 12, e0170665. [Google Scholar] [CrossRef] [PubMed] [Green Version]
  35. Atkins, G.J.; Anderson, P.H.; Findlay, D.M.; Welldon, K.J.; Vincent, C.; Zannettino, A.C.W.; O’Loughlin, P.D.; Morris, H.A. Metabolism of vitamin D3 in human osteoblasts: Evidence for autocrine and paracrine activities of 1 alpha,25-dihydroxyvitamin D3. Bone 2007, 40, 1517–1528. [Google Scholar] [CrossRef] [PubMed]
  36. Boullata, J.I. Vitamin D supplementation: A pharmacologic perspective. Curr. Opin. Clin. Nutr. Metab. Care 2010, 13, 677–684. [Google Scholar] [CrossRef] [PubMed]
  37. Askeno, A.; Saikatsu, S.; Kawane, T.; Horiuchi, N. Mouse vitamin D-24-hydroxylase: Molecular cloning, tissue distribution, and transcriptional regulation by 1alpha,25-dihydroxyvitamin D3. Endocrinology 1997, 138, 2233–2240. [Google Scholar] [CrossRef] [PubMed]
  38. Munetsuna, E.; Kawanami, R.; Nishikawa, M.; Ikeda, S.; Nakabayashi, S.; Yasuda, K.; Ohta, M.; Kamakura, M.; Ikushiro, S.; Sakaki, T. Anti-proliferative activity of 25-hydroxyvitamin D3 in human prostate cells. Mol. Cell. Endocrinol. 2014, 382, 960–970. [Google Scholar] [CrossRef] [PubMed]
  39. Horst, R.L.; Wovkulich, P.M.; Baggiolini, E.G.; Uskoković., M.R.; Engstrom, G.W.; Napoli, J.L. (23S)-1,23,25-Trihydroxyvitamin D3: Its biologic activity and role in 1 alpha,25-dihydroxyvitamin D3 26,23-lactone biosynthesis. Biochemistry 1984, 23, 3973–3979. [Google Scholar] [CrossRef]
  40. Ikizler, T.A.; Wingard, R.L.; Sun, M.; Harvell, J.; Parker, R.A.; Hakim, R.M. Increased energy expenditure in hemodialysis patients. J. Am. Soc. Nepohrol. 1996, 7, 2646–2653. [Google Scholar] [CrossRef]
  41. Wang, A.Y.-M.; Sea, M.M.-M.; Tang, N.; Sanderson, J.E.; Lui, S.-F.; Li, P.K.-T.; Woo, J. Resting energy expenditure and subsequent mortality risk in peritoneal dialysis patients. J. Am. Soc. Nephrol. 2004, 15, 3134–3143. [Google Scholar] [CrossRef]
  42. Rousset, S.; Alves-Guerra, M.-C.; Mozo, J.; Miroux, B.; Cassard-Doulcier, A.-M.; Bouillaud, F.; Ricquier, D. The biology of mitochondrial uncoupling proteins. Diabetes 2004, 53 (Suppl. 1), S130–S135. [Google Scholar] [CrossRef] [PubMed] [Green Version]
  43. Bing, C.; Brown, M.; King, P.; Collins, P.; Tisdsale, M.J.; Williams, G. Increased gene expression of brown fat uncoupling protein (UCP)1 and skeletal muscle UCP2 and UCP3 in MAC16-induced cancer cachexia. Cancer Res. 2000, 60, 2405–2410. [Google Scholar] [PubMed]
  44. Wong, K.E.; Szeto, F.L.; Zhang, W.; Ye, H.; Kong, J.; Zhang, Z.; Sun, X.J.; Li, Y.C. Involvement of the vitamin D receptor in energy metabolism: Regulation of uncoupling proteins. Am. J. Physiol. Endocrinol. Metab. 2009, 296, E820–E828. [Google Scholar] [CrossRef] [PubMed] [Green Version]
  45. Kamei, Y.; Kawada, T.; Kazuki, R.; Ono, T.; Kato, S.; Sugimoto, E. Vitamin D receptor gene expression is up-regulated by 1, 25-dihydroxyvitamin D3 in 3T3-L1 preadipocytes. Biochem. Biophys. Res. Commun. 1993, 193, 948–955. [Google Scholar] [CrossRef]
  46. Wang, P.-Q.; Pan, D.-X.; Hu, C.-Q.; Zhu, Y.-L.; Liu, X.-J. Vitamin D–vitamin D receptor system down-regulates expression of uncoupling proteins in brown adipocyte through interaction with hairless protein. Biosci. Rep. 2020, 40, BSR20194294. [Google Scholar] [CrossRef] [PubMed]
  47. Jonas, M.I.; Kurylowicz, A.; Bartoszewicz, Z.; Lisik, W.; Jonas, M.; Kozniewski, K.; Puzianowska-Kuznicka, M. Vitamin D receptor gene expression in adipose tissue of obese individuals is regulated by miRNA and correlates with the pro-inflammatory cytokine level. Int. J. Mol. Sci. 2019, 20, 5272. [Google Scholar] [CrossRef] [Green Version]
  48. Nimitphong, H.; Holick, M.F.; Fried, S.K.; Lee, M.-J. 25-hydroxyvitamin D3 and 1,25-dihydroxyvitamin D3 promote the differentiation of human subcutaneous preadipocytes. PLoS ONE 2012, 7, e52171. [Google Scholar] [CrossRef] [Green Version]
  49. Fan, Y.; Futawaka, K.; Komaya, R.; Fukuda, Y.; Hayashi, M.; Imamoto, M.; Miyawaki, T.; Kasahara, M.; Tagami, T.; Moriyama, K. Vitamin D3/VDR resists diet-induced obesity by modulating UCP3 expression in muscle. J. Biomed. Sci. 2016, 23, 56. [Google Scholar] [CrossRef] [Green Version]
  50. Mierzejewski, B.; Archacka, K.; Grabowska, I.; Florkowska, A.; Ciemerych, M.A.; Brzoska, E. Human and mouse skeletal muscle stem and progenitor cells in health and disease. Semin. Cell Devel. Biol. 2020, 104, 93–104. [Google Scholar] [CrossRef] [PubMed]
  51. Gahl, W.A.; Balog, J.Z.; Kleta, R. Nephropathic cystinosis in adults: Natural history and effects of oral cysteamine therapy. Ann. Intern. Med. 2007, 147, 242–250. [Google Scholar] [CrossRef]
  52. Brodin-Sartorius, A.; Tete, M.J.; Niaudet, P.; Antignac, C.; Guest, G.; Ottolenghi, C.; Charbit, M.; Moyse, D.; Legendre, C.; Lesavre, P.; et al. Cysteamine therapy delays the progression of nephropathic cystinosis in late adolescents and adults. Kidney Int. 2012, 81, 179–189. [Google Scholar] [CrossRef] [PubMed] [Green Version]
  53. Ruivo, R.; Anne, C.; Sagne, C.; Gasnier, B. Molecular and cellular basis of lysosomal transmembrane protein dysfunction. Biochim. Biophys. Acta 2009, 1793, 636–649. [Google Scholar] [CrossRef] [PubMed]
  54. Elmonem, M.A.; Veys, K.R.P.; Prencipe, G. Nephropathic cystinosis: Pathogenic roles of inflammation and potential for new therapies. Cells 2022, 11, 190. [Google Scholar] [CrossRef] [PubMed]
Figure 1. Repletion of 25(OH)D3 corrects cachexia in Ctns−/− mice. We have performed two studies. For the first study, Ctns−/− and WT mice were given 25(OH)D3 (75 µg/kg/day), 1,25(OH)2D3 (60 ng/kg/day), or vehicle (ethylene glycol), respectively, for six weeks. All mice were fed ad libitum. We calculated ad libitum caloric intake (A) and recorded weight change in mice (B). For the second experiment, we employed a diet restrictive strategy. Ctns−/− + Vehicle mice were given an ad libitum amount of food whereas other groups of mice were given an equivalent amount of food (C). Weight gain, fat and lean content, resting metabolic rate, and in vivo muscle function (rotarod and grip strength) were measured in mice (DI). Data are expressed as mean ± SEM. Results of Ctns−/− + Vehicle, Ctns−/− + 25(OH)D3, and Ctns−/− + 1,25(OH)2D3 mice were compared to those of WT + Vehicle, WT + 25(OH)D3, and WT + 1,25(OH)2D3 mice, respectively. In addition, results of Ctns−/− + Vehicle were compared to those of Ctns−/− + 25(OH)D3 and Ctns−/− + 1,25(OH)2D3 mice, respectively. Furthermore, results of Ctns−/− + 25(OH)D3 mice were compared to those of Ctns−/− + 1,25(OH)2D3 mice. Specific p-values are shown above the bar. ns signifies not significant, * p < 0.05, ** p < 0.01, *** p < 0.001.
Cells 11 03264 g001
Figure 2. Energy homeostasis improved in skeletal muscle and adipose tissue following repletion of 25-hydroxyvitamin D3 in Ctns−/− mice. UCP content (AC) and ATP content (DF) in various tissues were measured. Results are expressed and analyzed as in Figure 1. ns signifies not significant, * p < 0.05, ** p < 0.01, *** p < 0.001.
Cells 11 03264 g002
Figure 3. White adipose tissue browning in Ctns−/− mice was reduced with the repletion of 25-hydroxyvitamin D3. qPCR was used to measure gene expression levels in inguinal WAT, specifically for beige adipocyte markers (CD137, Tbx−1 and Tmem26) (AC, respectively) and important molecules that mediate WAT browning (Cox2, Pgf2α, Tlr2, Myd88 and Traf6) (DH, respectively). Final results were expressed in arbitrary units, with one unit being the mean level in WT + Vehicle mice. Results are expressed and analyzed as in Figure 1. ns signifies not significant, * p < 0.05, ** p < 0.01, *** p < 0.001.
Cells 11 03264 g003
Figure 4. White adipose tissue thermogenic gene expression was normalized or decreased with the repletion of 25-hydroxyvitamin D3 in Ctns−/− mice. In inguinal WAT, qPCR was used to measure thermogenic gene (Ppargc1α, Pgc1α, Cidea, Prdm16 and Dio2) expression (AE, respectively). Results are expressed and analyzed as in Figure 3. ns signifies not significant, * p < 0.05, ** p < 0.01, *** p < 0.001.
Cells 11 03264 g004
Figure 5. Signaling pathway abnormalities implicated in muscle wasting were improved or normalized with repletion of 25-hydroxyvitamin D3 in Ctns−/− mice. qPCR was used to determine expression levels of negative regulators of skeletal muscle mass (IL-1β, IL-6, TNF-α, Atrogin-1, Murf-1, and Myostatin) and pro-myogenic factors (Myod, Myogenin, and Pax7) in gastrocnemius muscle (AI, respectively). Results are expressed and analyzed as in Figure 3. ns signifies not significant, * p < 0.05, ** p < 0.01, *** p < 0.001.
Cells 11 03264 g005
Figure 6. Gastrocnemius fiber size significantly increased with repletion of 25-hydroxyvitamin D3 in Ctns−/− mice. Representative photomicrographs of the gastrocnemius with H&E staining (AF). Average gastrocnemius cross-sectional area was measured (G). Results are expressed and analyzed as in Figure 1. ns signifies not significant, * p < 0.05, ** p < 0.01.
Cells 11 03264 g006
Figure 7. Fatty infiltration in skeletal muscle was reduced with repletion of 25-hydroxyvitamin D3 in Ctns−/− mice. Visualization of the quantification of fatty infiltration by Oil Red O analysis in the gastrocnemius muscle (AF). Final results were expressed in arbitrary units, with one unit being the mean staining intensity in WT + Vehicle mice (G). Results are expressed and analyzed as in Figure 1. * p < 0.05, *** p < 0.001.
Cells 11 03264 g007
Figure 8. Gastrocnemius cystine content in the mice. Results are expressed and analyzed as in Figure 1. ns signifies not significant, *** p < 0.001.
Cells 11 03264 g008
Figure 9. Gastrocnemius muscle gene expression was decreased with repletion of 25-hydroxyvitamin D3 in Ctns−/− mice. Repletion of 25-hydroxyvitamin D3 significantly decreased or normalized (Ankdr2, Csrp3, Cyfip2, Fhl1, Ly6a, Mup1, Myl2, Pkd4, Sell, Sln, Spp1, Tnnc1, and Tpm3) (AO, respectively) as well as (Atf3, Cidea, Fos, Sncg, and Tbc1d1) (PT, respectively) muscle gene expression, but repletion of 1,25(OH)2D3 did not, in Ctns−/− mice. Nonsignificant changes were observed in Myl3 and Tnni1. qPCR was used to measure the expression of targeted molecules in gastrocnemius muscle. Results are analyzed and expressed as in Figure 3. ns signifies not significant, * p < 0.05, ** p < 0.01, *** p < 0.001.
Cells 11 03264 g009
Figure 10. Summary of the metabolic advantages of repletion of 25(OH)D3 over repletion of 1,25(OH)2D3 in Ctns−/− mice. Created with BioRender.com, accessed on 7 September 2021.
Cells 11 03264 g010
Table 1. Serum and blood chemistry of mice. Twelve-month-old Ctns−/− mice and WT mice were treated with 25(OH)D3 (75 µg/kg/day), 1,25(OH)2D3 (60 ng/kg/day), or vehicle control (ethylene glycol) for six weeks. Data are expressed as mean ± SEM. Results of all five groups of mice were compared to those of WT + Vehicle mice, respectively. a p < 0.05, significantly different than WT + Vehicle mice. b p < 0.05, significantly different in Ctns−/− + 25(OH)D3 mice or Ctns−/− + 1,25(OH)2D3 mice relative to Ctns−/− + Vehicle mice.
WT
+ Vehicle
(n = 8)
WT
+ 25(OH)D3
(n = 8)
WT
+ 1,25(OH)2D3
(n = 8)
Ctns−/−
+ Vehicle
(n = 8)
Ctns−/−
+ 25(OH)D3
(n = 8)
Ctns−/−
+ 1,25(OH)2D3
(n = 8)
BUN (mg/dL)26.3 ± 4.327.9 ± 2.623.1 ± 4.367.6 ± 12.4 a57.6 ± 9.8 a65.7 ± 7.9 a
Creatinine (mg/dL)0.09 ± 0.020.08 ± 0.030.09 ± 0.020.24 ± 0.05 a0.23 ± 0.04 a0.21 ± 0.05 a
Bicarbonate (mmol/L)27.6 ± 2.327.8 ± 2.426.7 ± 2.726.7 ± 2.327.1 ± 5.626.7 ± 2.7
25(OH)D3 (ng/mL)104.2 ± 13.5105.3 ± 13.9113.6 ± 12.843.6± 3.4 a109.4 ± 13.7 b58.9 ± 5.7 a
1,25(OH)2D3 (pg/mL)263.6 ± 31.5201.7 ± 21.5243.7 ± 12.8125.6 ± 17.8 a193.4 ± 14.3 a,b276.1 ± 17.8 b
Table 2. Serum and blood chemistry of mice. Twelve-month-old Ctns−/− mice and WT mice were treated with 25(OH)D3 (75 µg/kg/day), 1,25(OH)2D3 (60 ng/kg/day), or vehicle control (ethylene glycol) for six weeks. Ctns−/− + Vehicle mice were fed ad libitum whereas all other groups of mice were given the equivalent amount of energy intake as those of Ctns−/− + Vehicle mice. Results are expressed and analyzed as in Table 1. a p < 0.05, significantly different than WT + Vehicle mice. b p < 0.05, significantly different in Ctns−/− + 25(OH)D3 mice or Ctns−/− + 1,25(OH)2D3 mice relative to Ctns−/− + Vehicle mice.
WT
+ Vehicle
(n = 9)
WT
+ 25(OH)D3
(n = 9)
WT
+ 1,25(OH)2D3
(n = 9)
Ctns−/−
+ Vehicle
(n = 9)
Ctns−/−
+ 25(OH)D3
(n = 9)
Ctns−/−
+ 1,25(OH)2D3
(n = 9)
BUN (mg/dL)27.3 ± 4.322.7 ± 6.524.5 ± 2.565.9 ± 22.1 a75.4 ± 11.1 a76.9 ± 12.7 a
Creatinine (mg/dL)0.08 ± 0.040.09 ± 0.020.08 ± 0.030.21 ± 0.06 a0.26 ± 0.07 a0.28 ± 0.04 a
Bicarbonate (mmol/L)27.5 ± 2.627.1 ± 3.327.3 ± 2.426.7 ± 2.327.5 ± 4.326.9 ± 3.3
25(OH)D3 (ng/mL)121.8 ± 23.5124.1 ± 21.5109.5 ± 17.648.2 ± 6.9 a125.4 ± 23.7 b64.5 ± 11.3 a
1,25(OH)2D3 (pg/mL)254.3 ± 24.3213.6 ± 16.5235.4 ± 23.6126.4 ± 24.3 a189.8 ± 25.4 a,b254.3 ± 14.3 b
Publisher’s Note: MDPI stays neutral with regard to jurisdictional claims in published maps and institutional affiliations.

