
Potential Cross Talk between Autism Risk Genes and Neurovascular Molecules: A Pilot Study on Impact of Blood Brain Barrier Integrity

 ,
,  ,
,
Abstract
:1. Introduction
2. Material and Methods
2.1. IRB Approvals
2.2. Clinical Derived Database
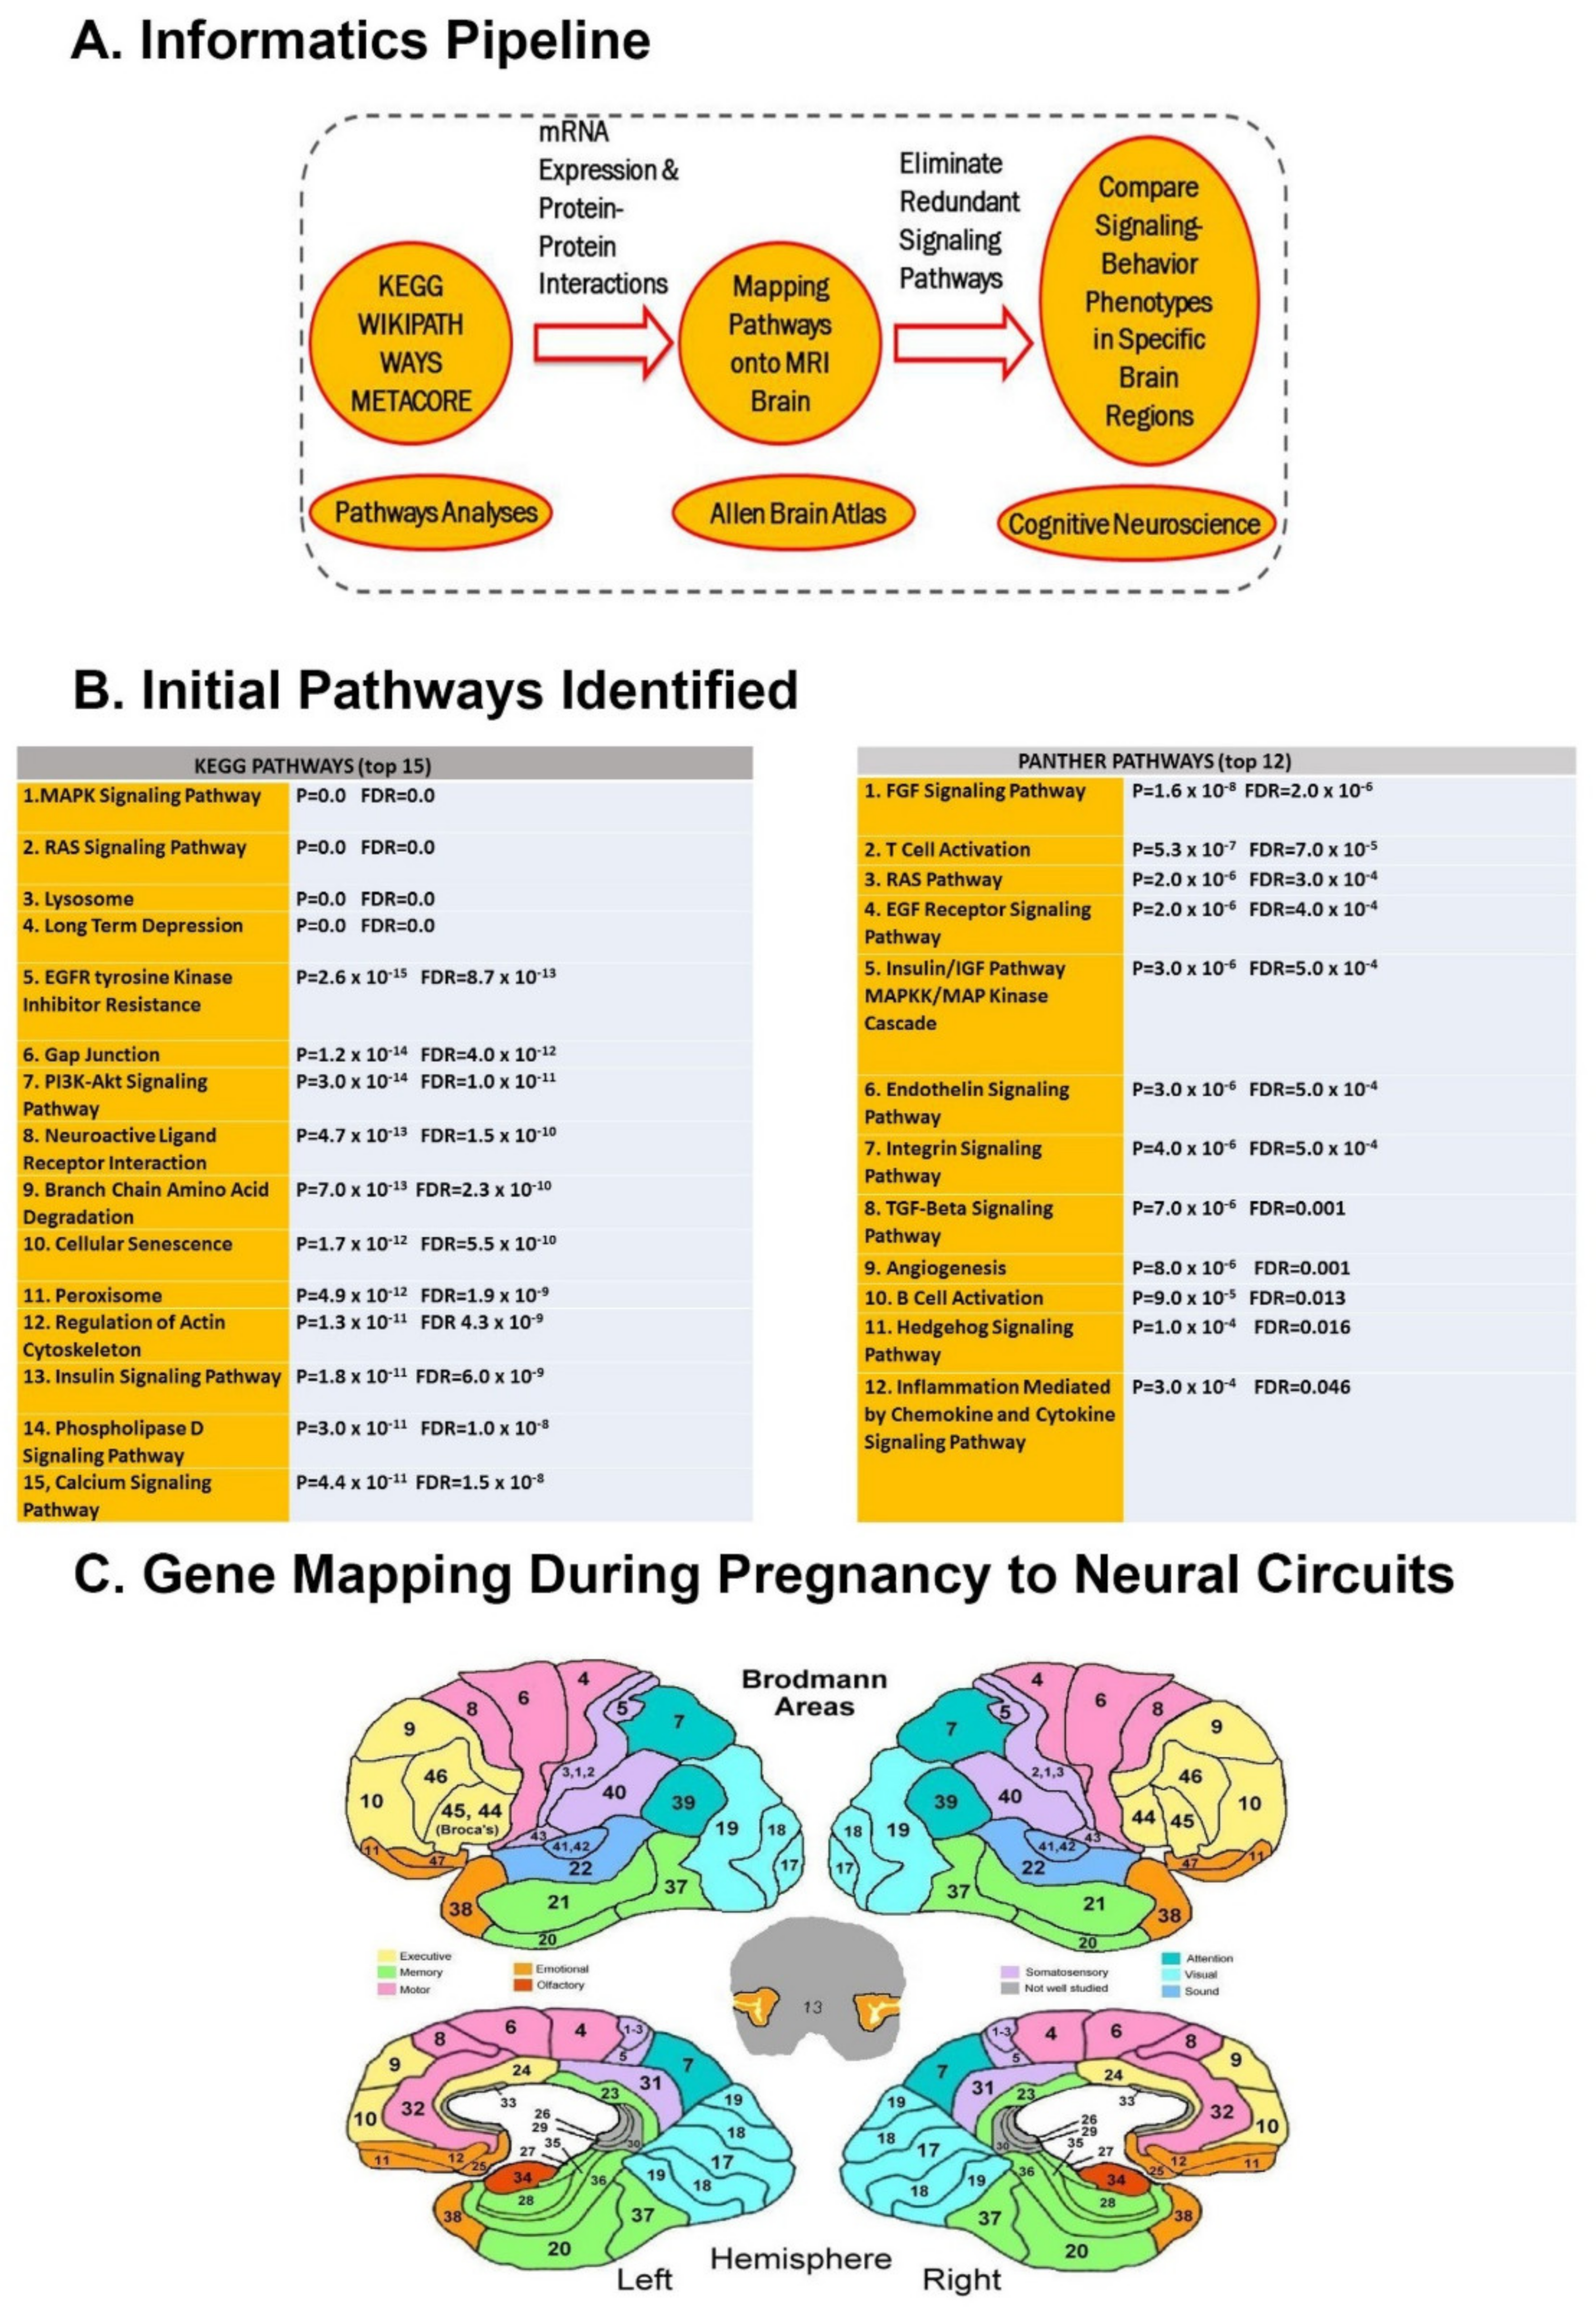
2.3. Gene Set Enrichment Analysis
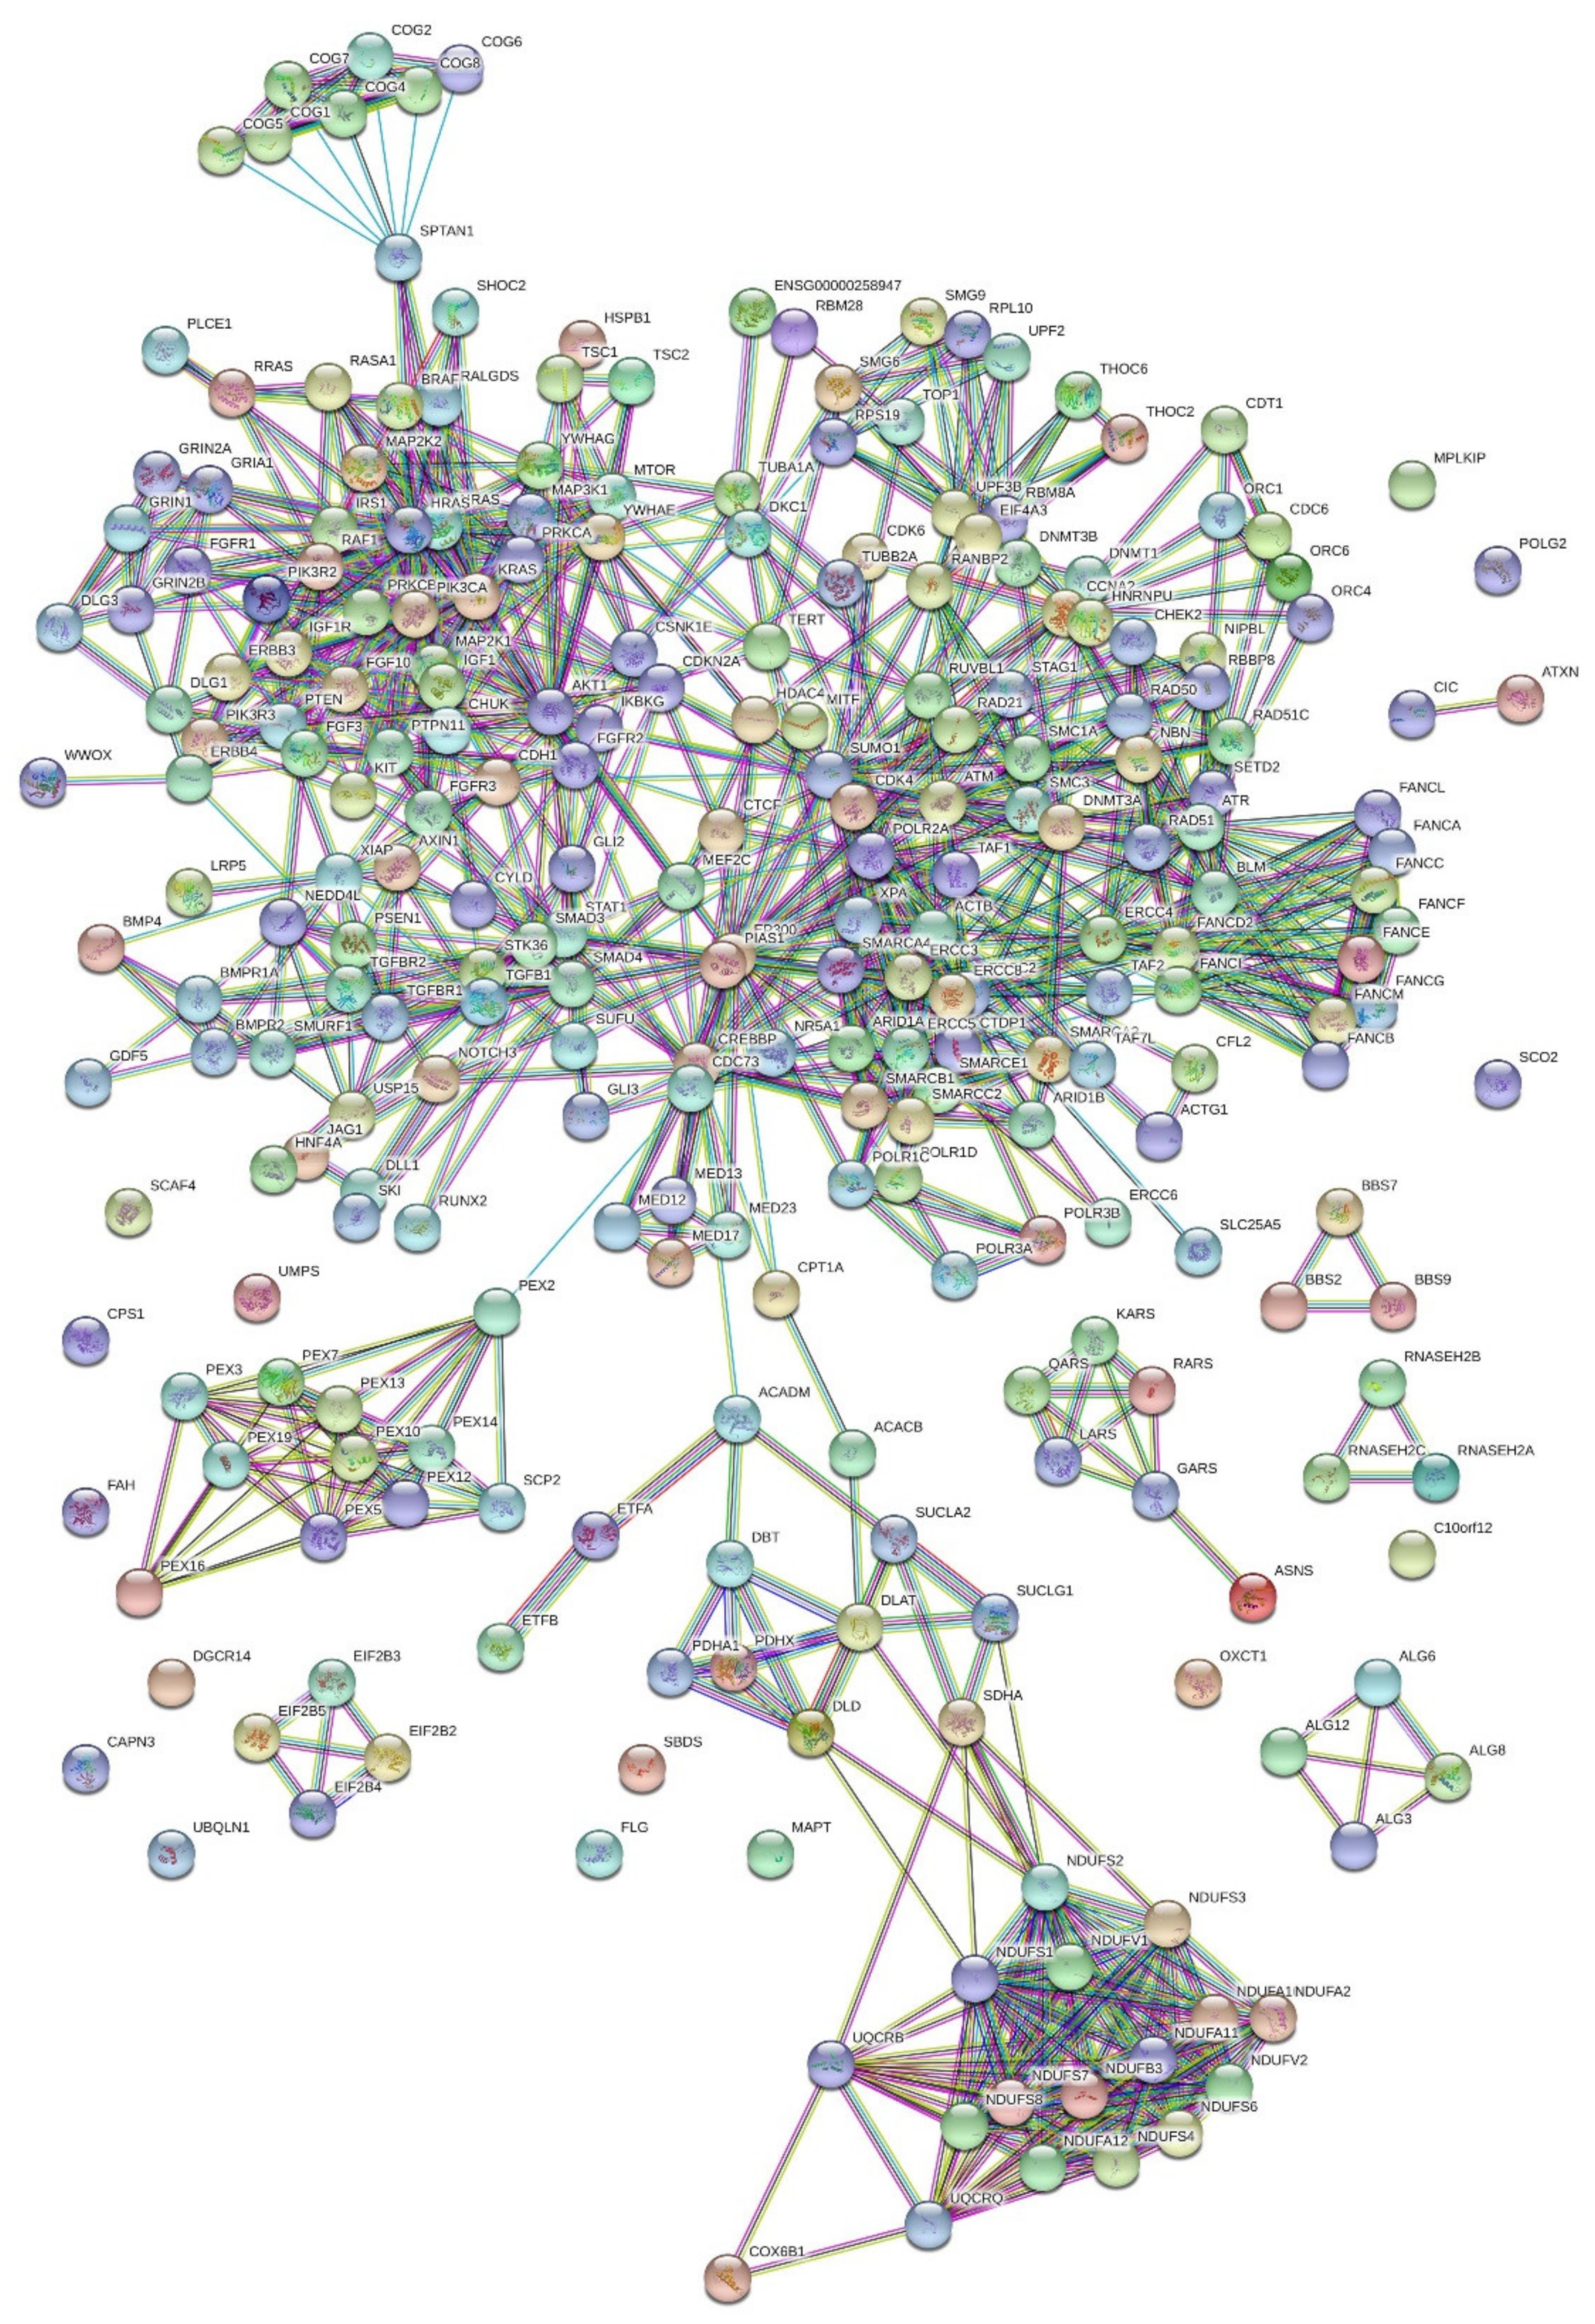
2.4. Protein–Protein Interactions
2.5. mRNA Co-Expression
2.6. Prenatal Brain Gene Expression Mapping
2.7. Mapping Brain Gene Expression to RDoC Neural Circuits
2.8. Statistical Analysis for Neural Circuit Comparisons
2.9. Mouse Experiments
2.9.1. Mouse Lines
2.9.2. EEG Recording
2.9.3. Immunofluorescence
2.9.4. Immunohistochemistry
2.9.5. Statistical Analysis
3. Results
3.1. Analyses of Human Genetic Risk Variants in Children with ASD
3.2. Analyses of Neurovascular Signaling and Blood Brain Barrier Integrity in Mouse Models of Neurodevelopment Disorders and Epilepsy
3.2.1. Gross Anatomy and Electrophysiological Assessments
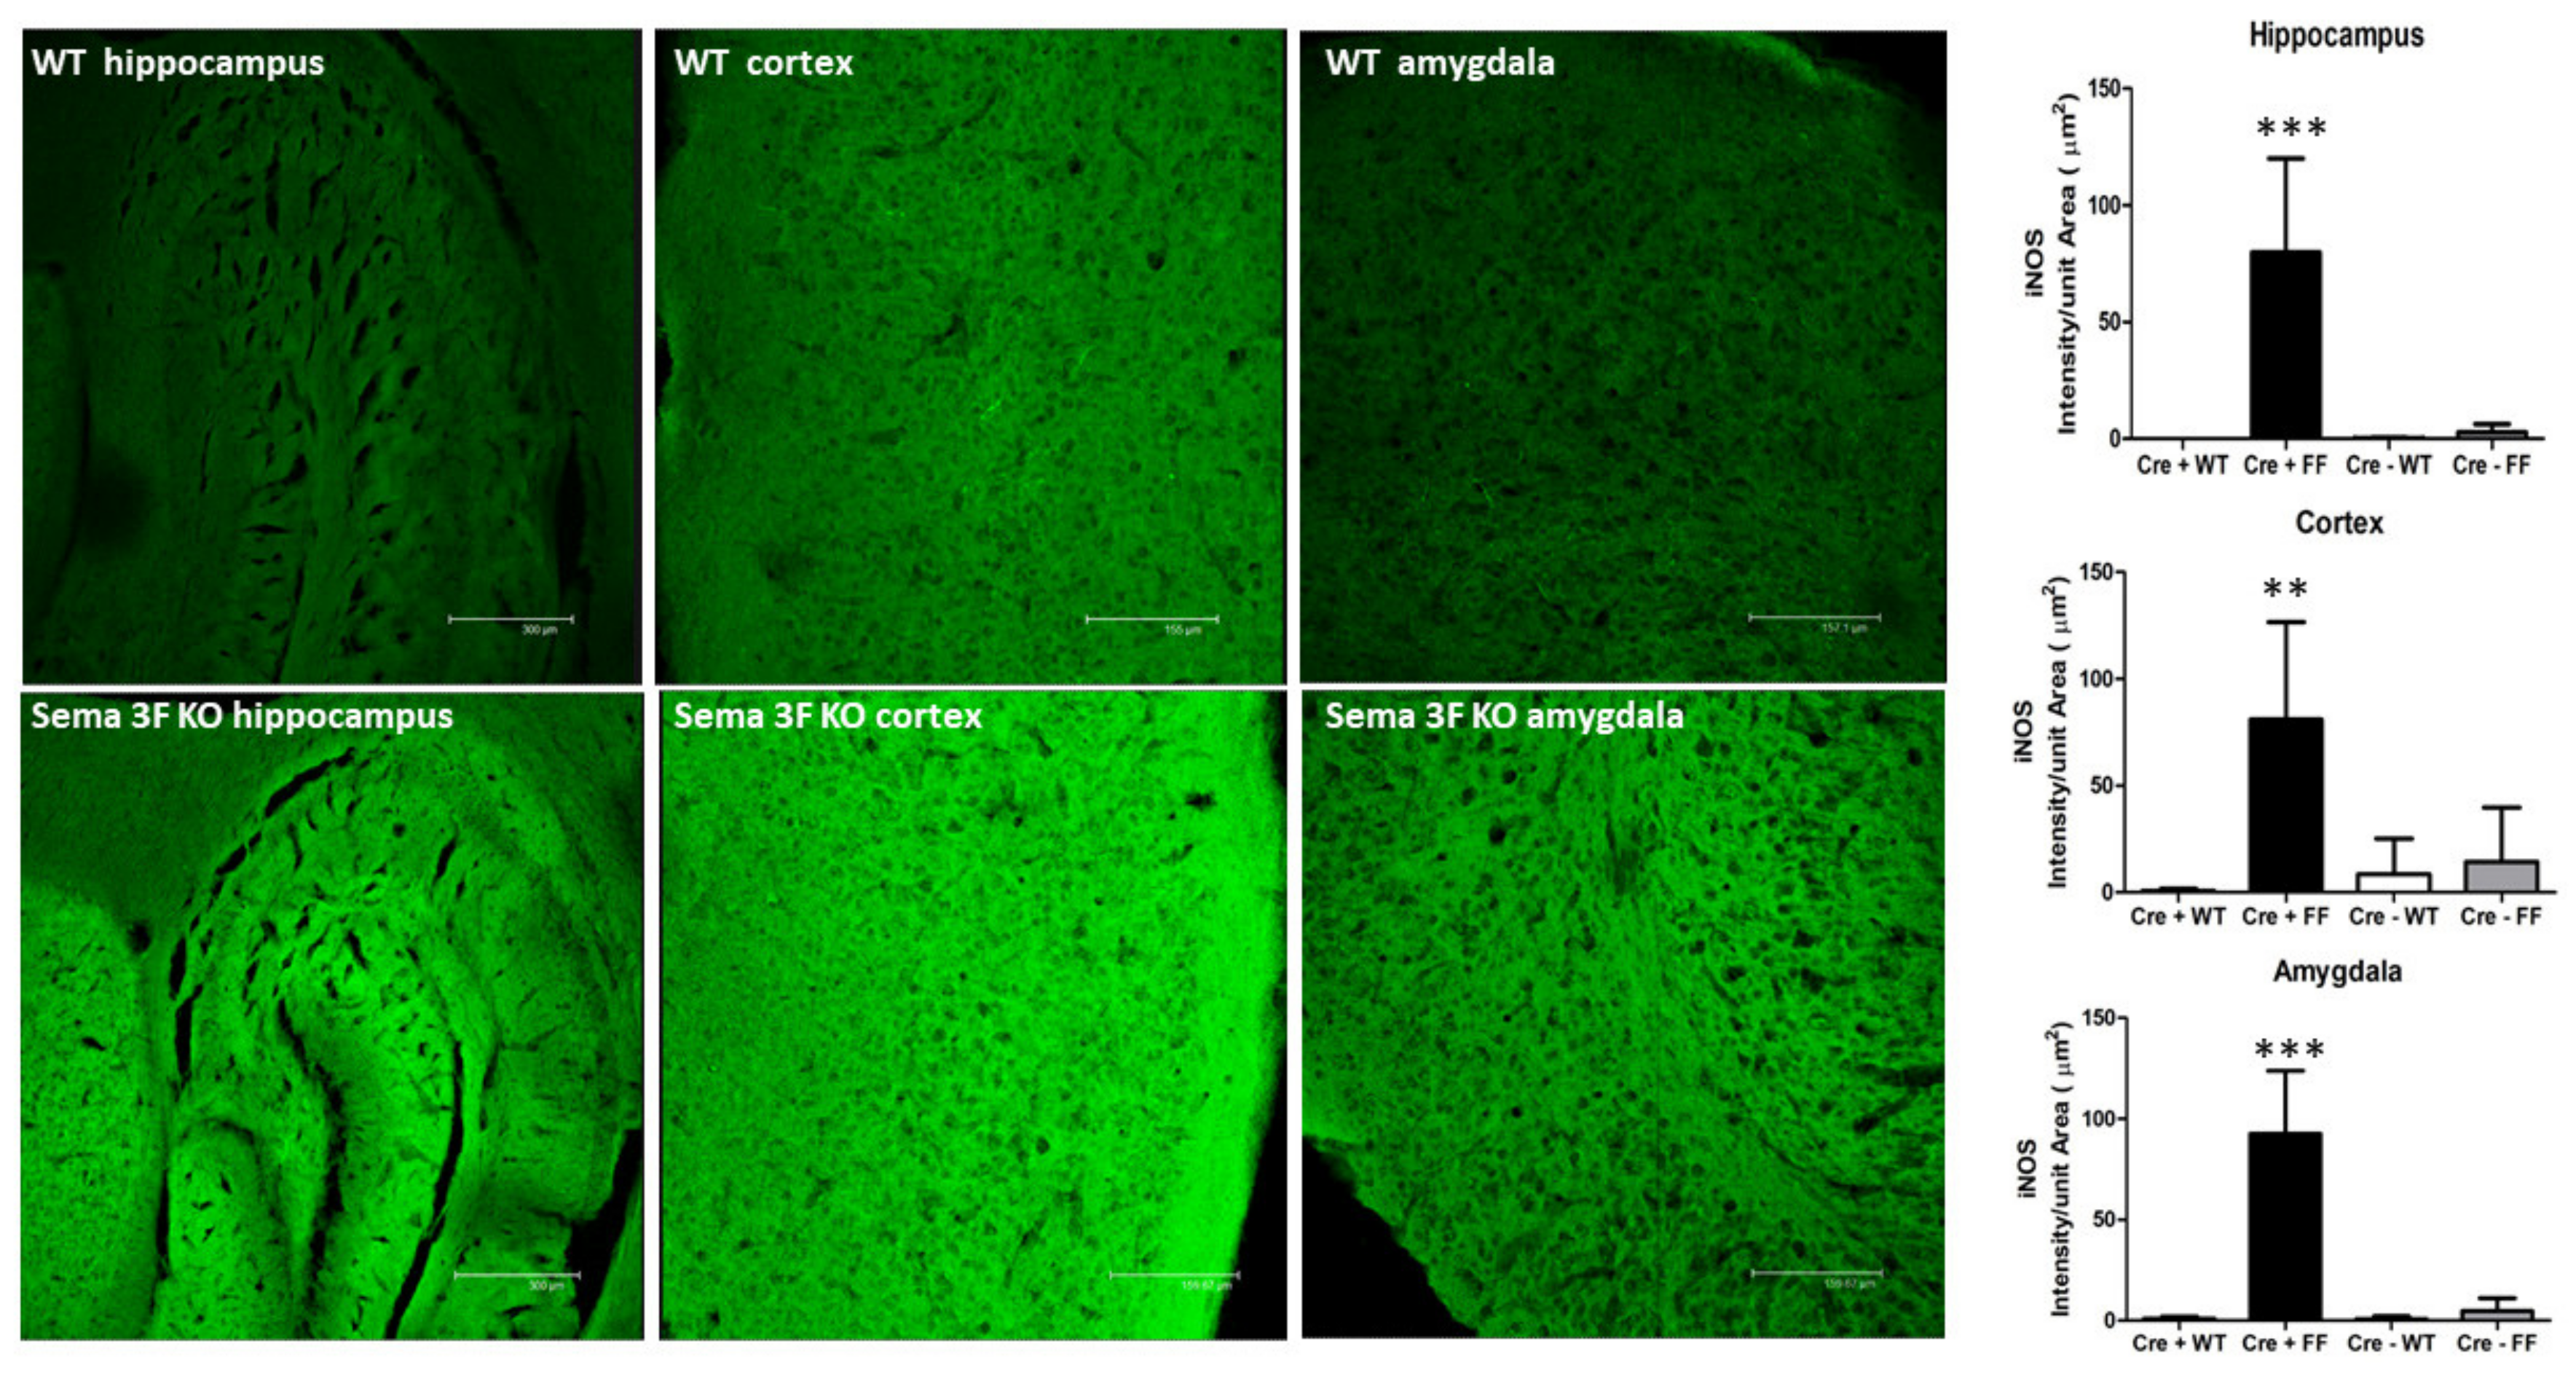
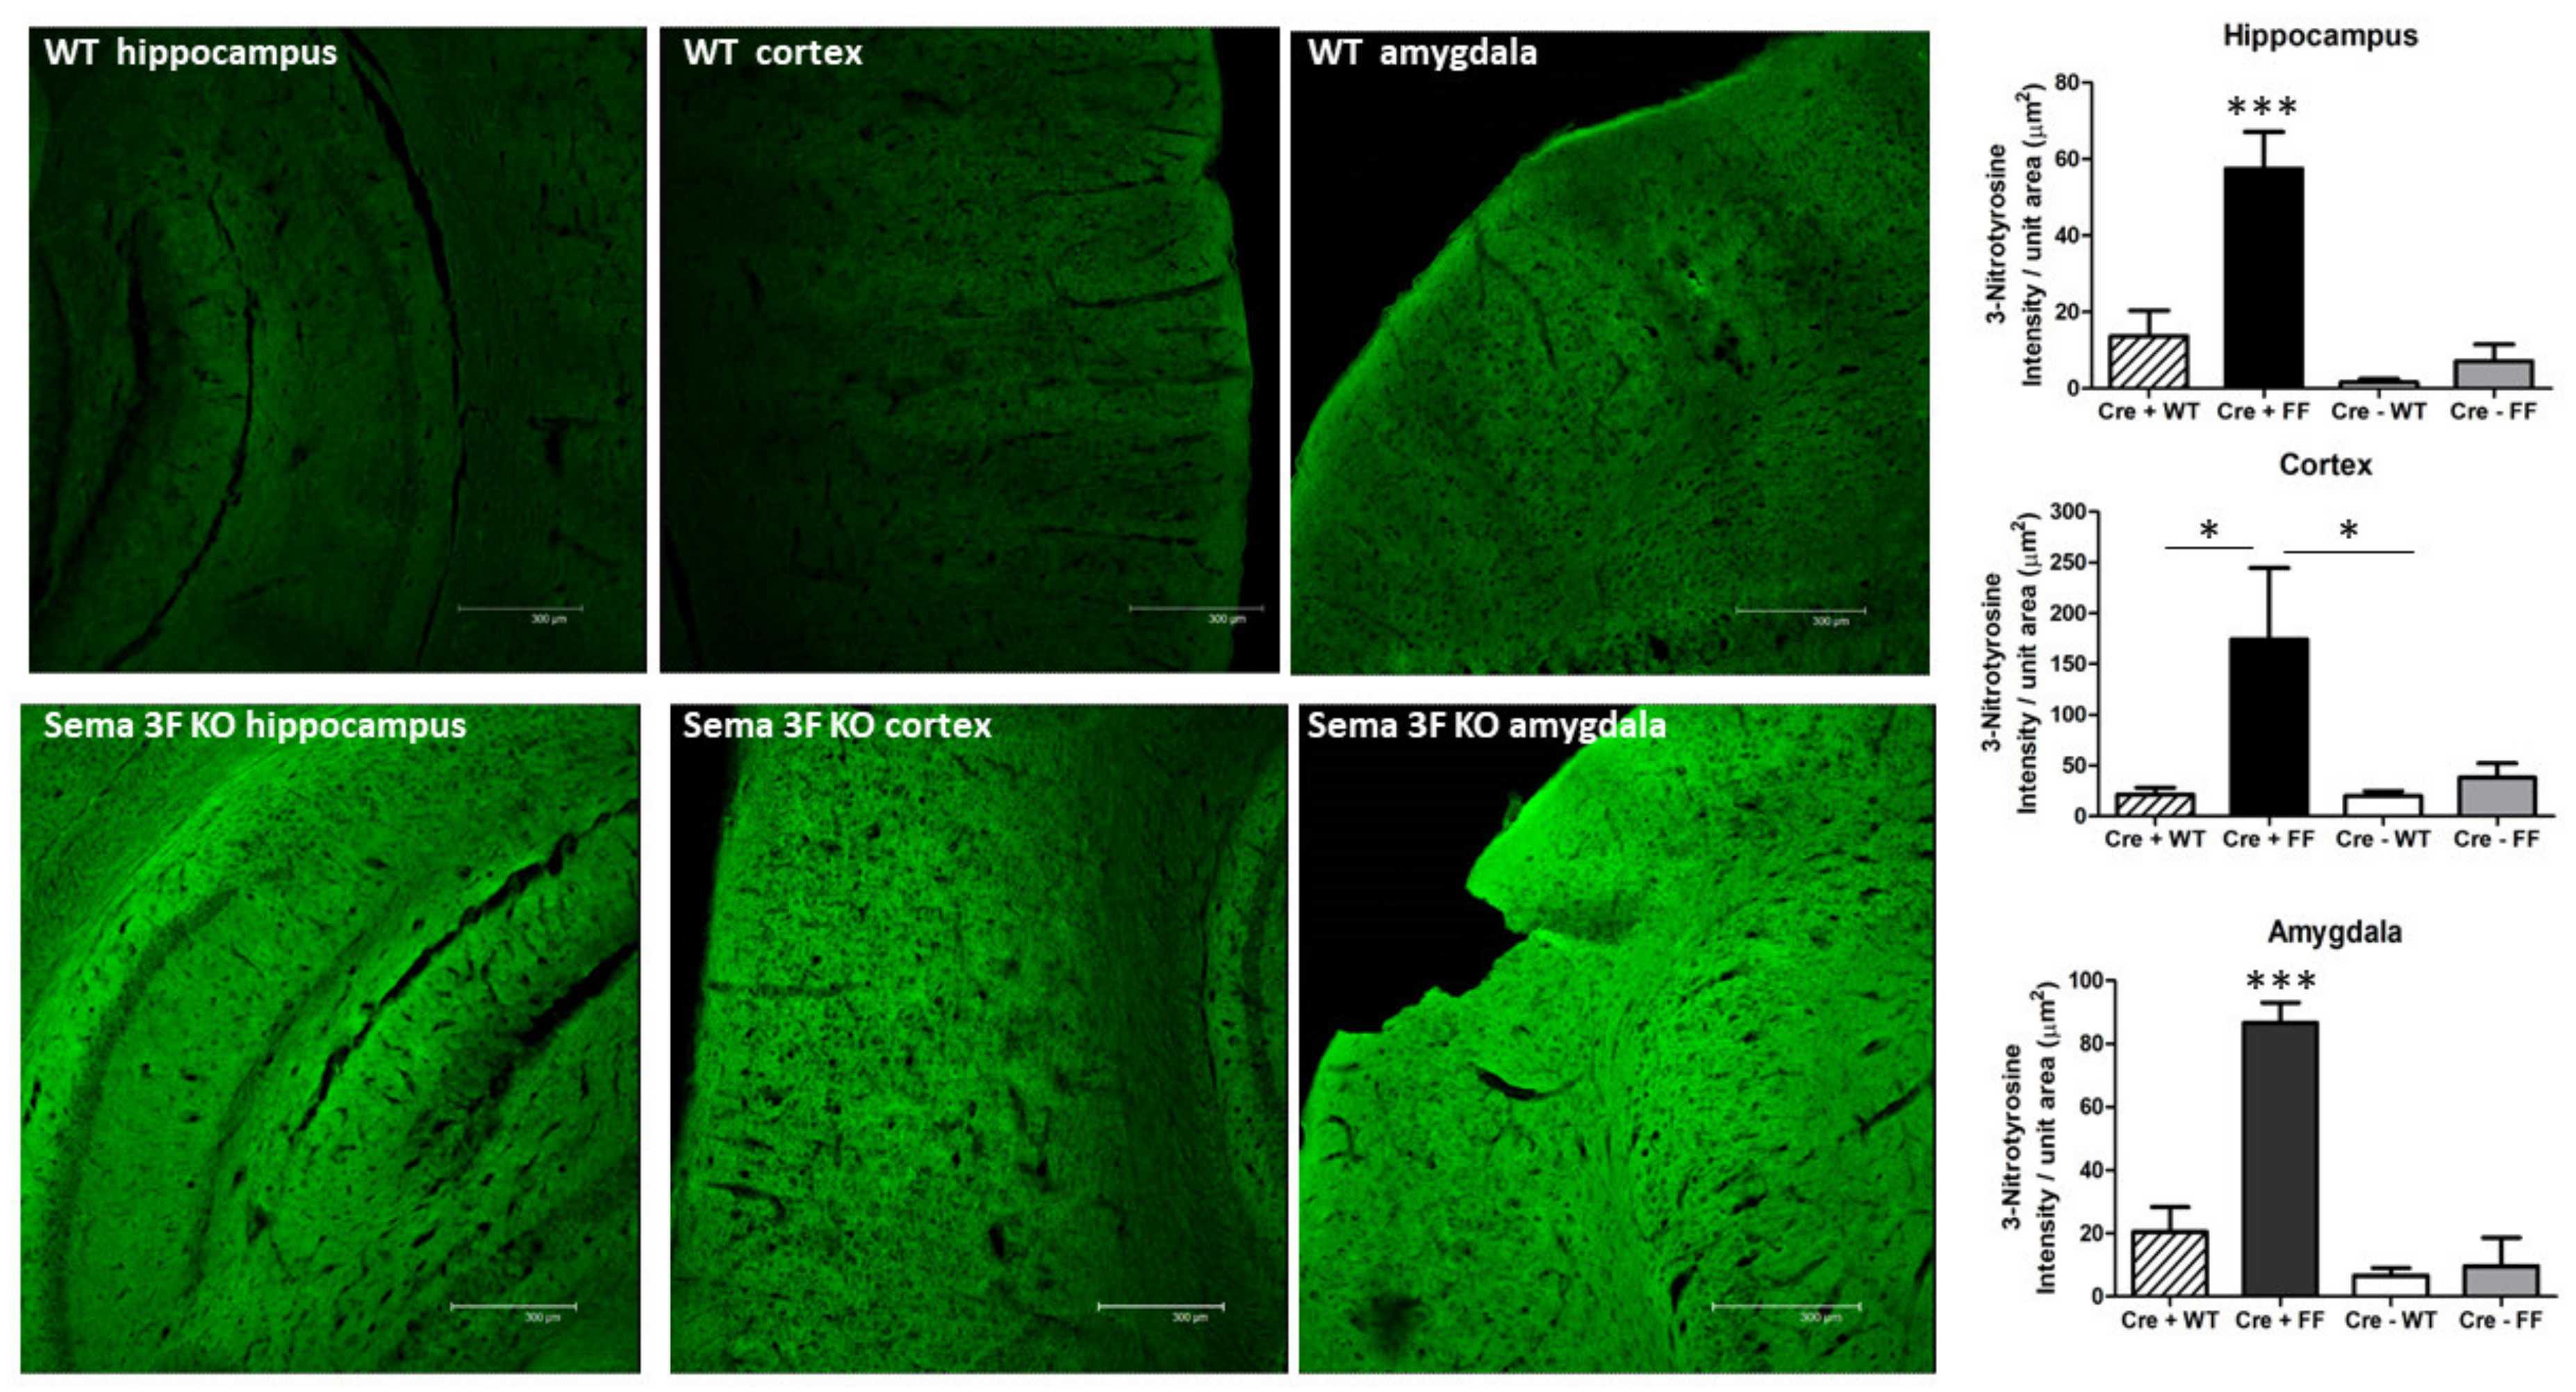
3.2.2. Immunofluorescence Assessment of Oxidative Stress and Inflammation
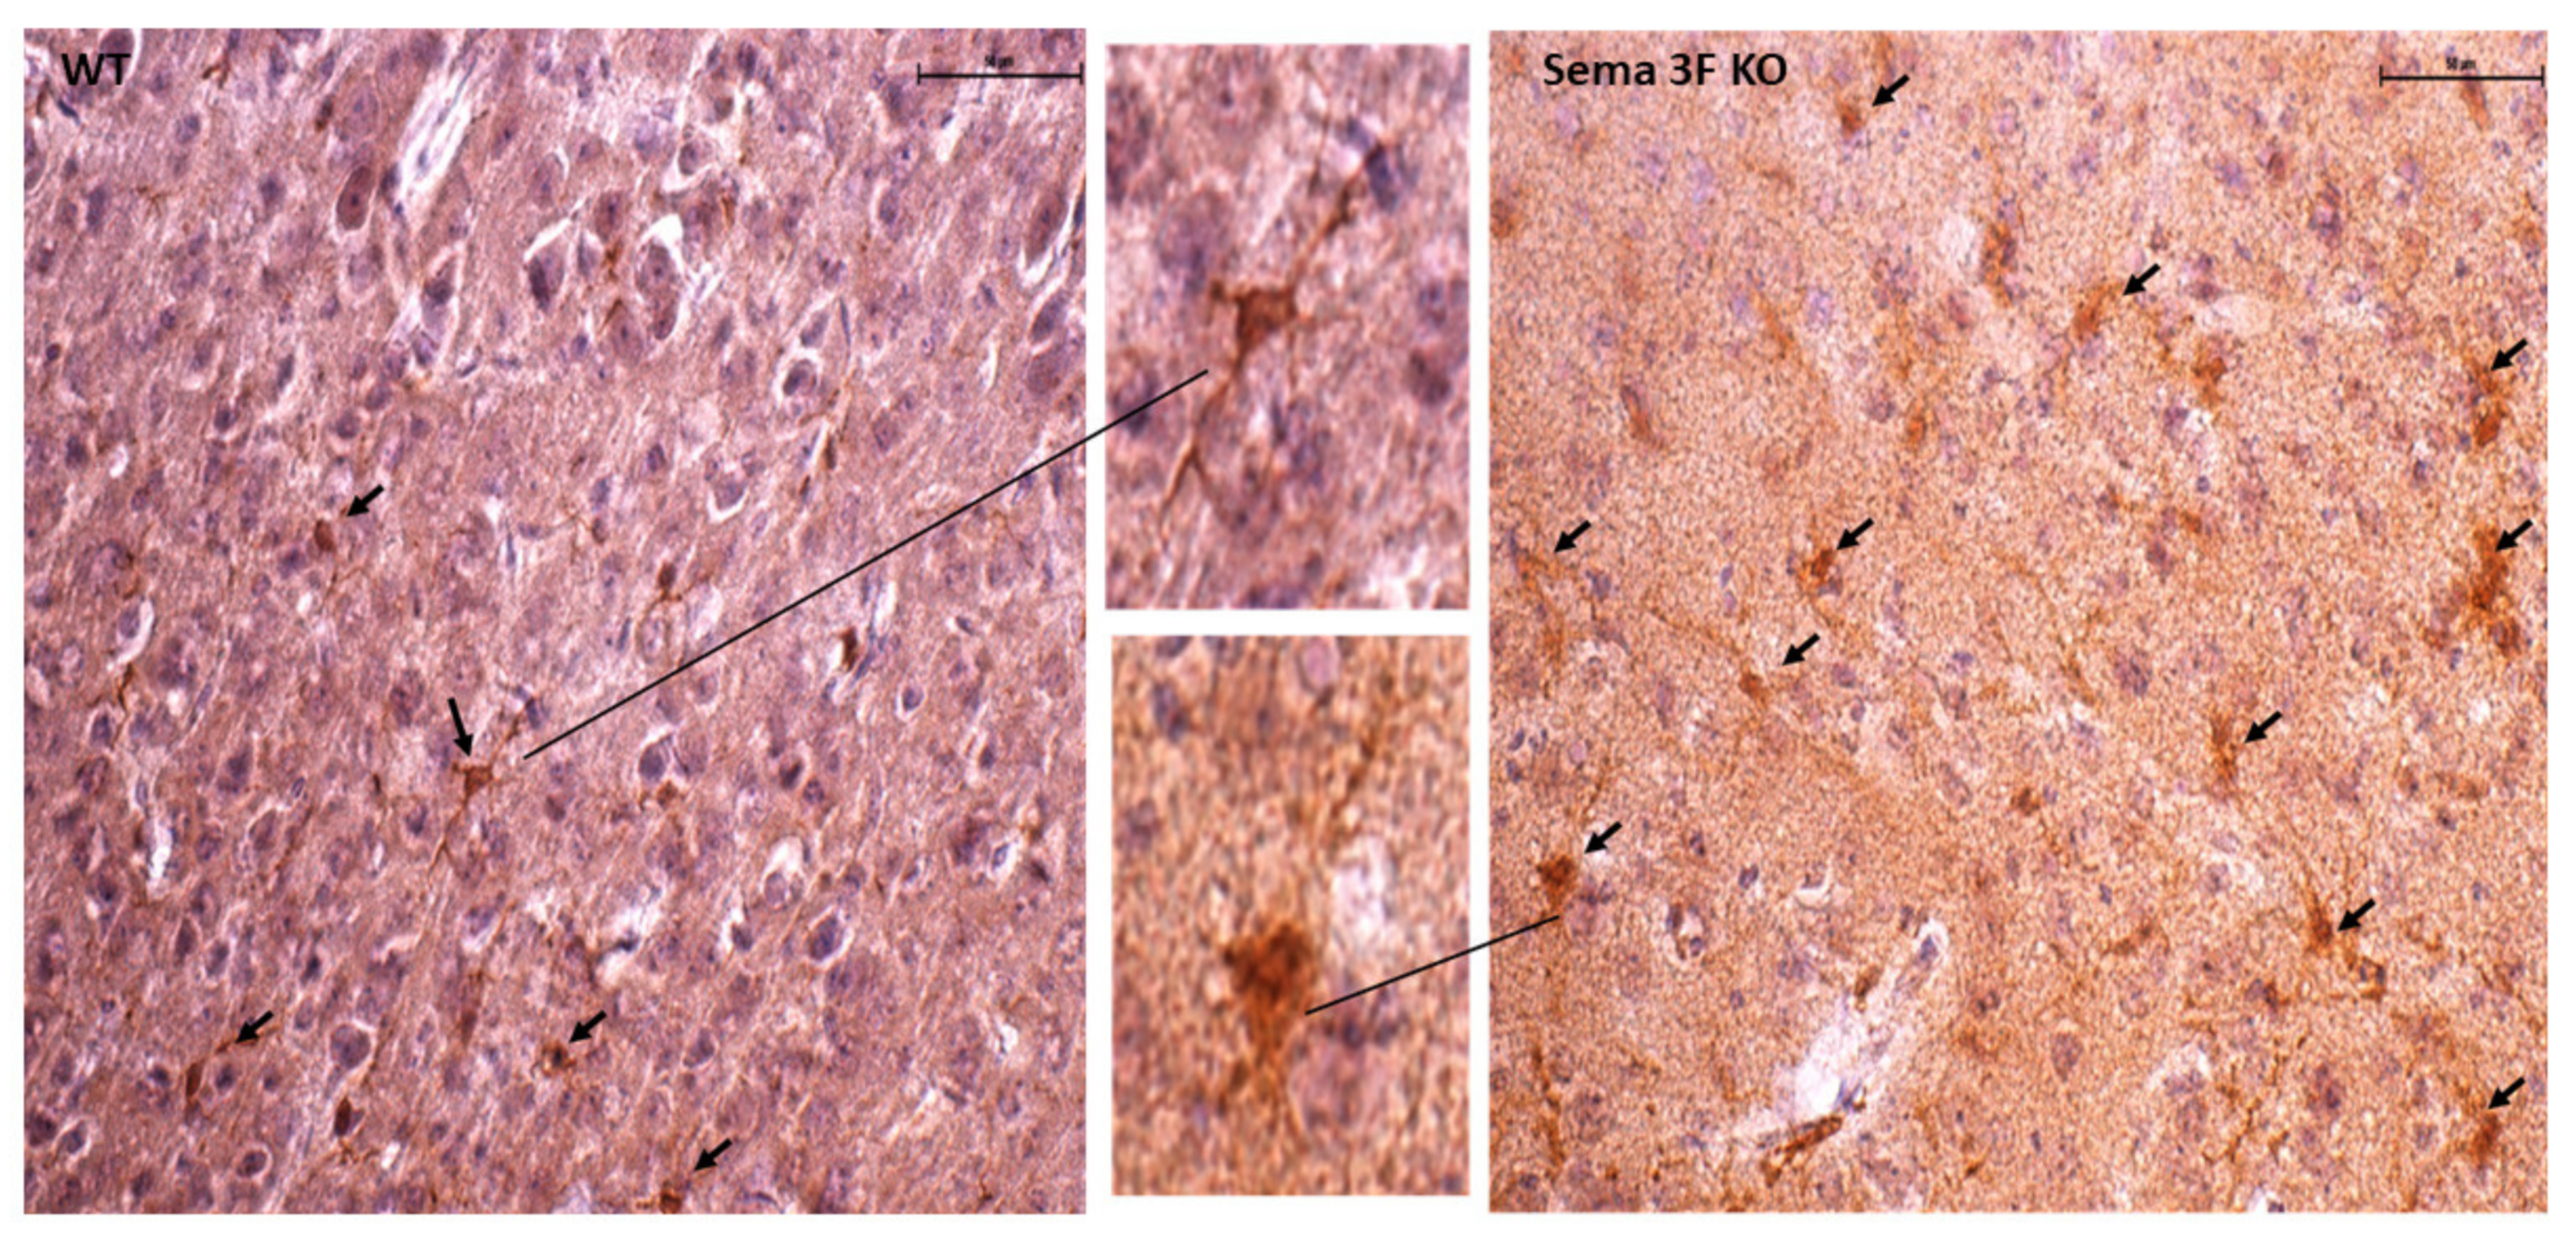
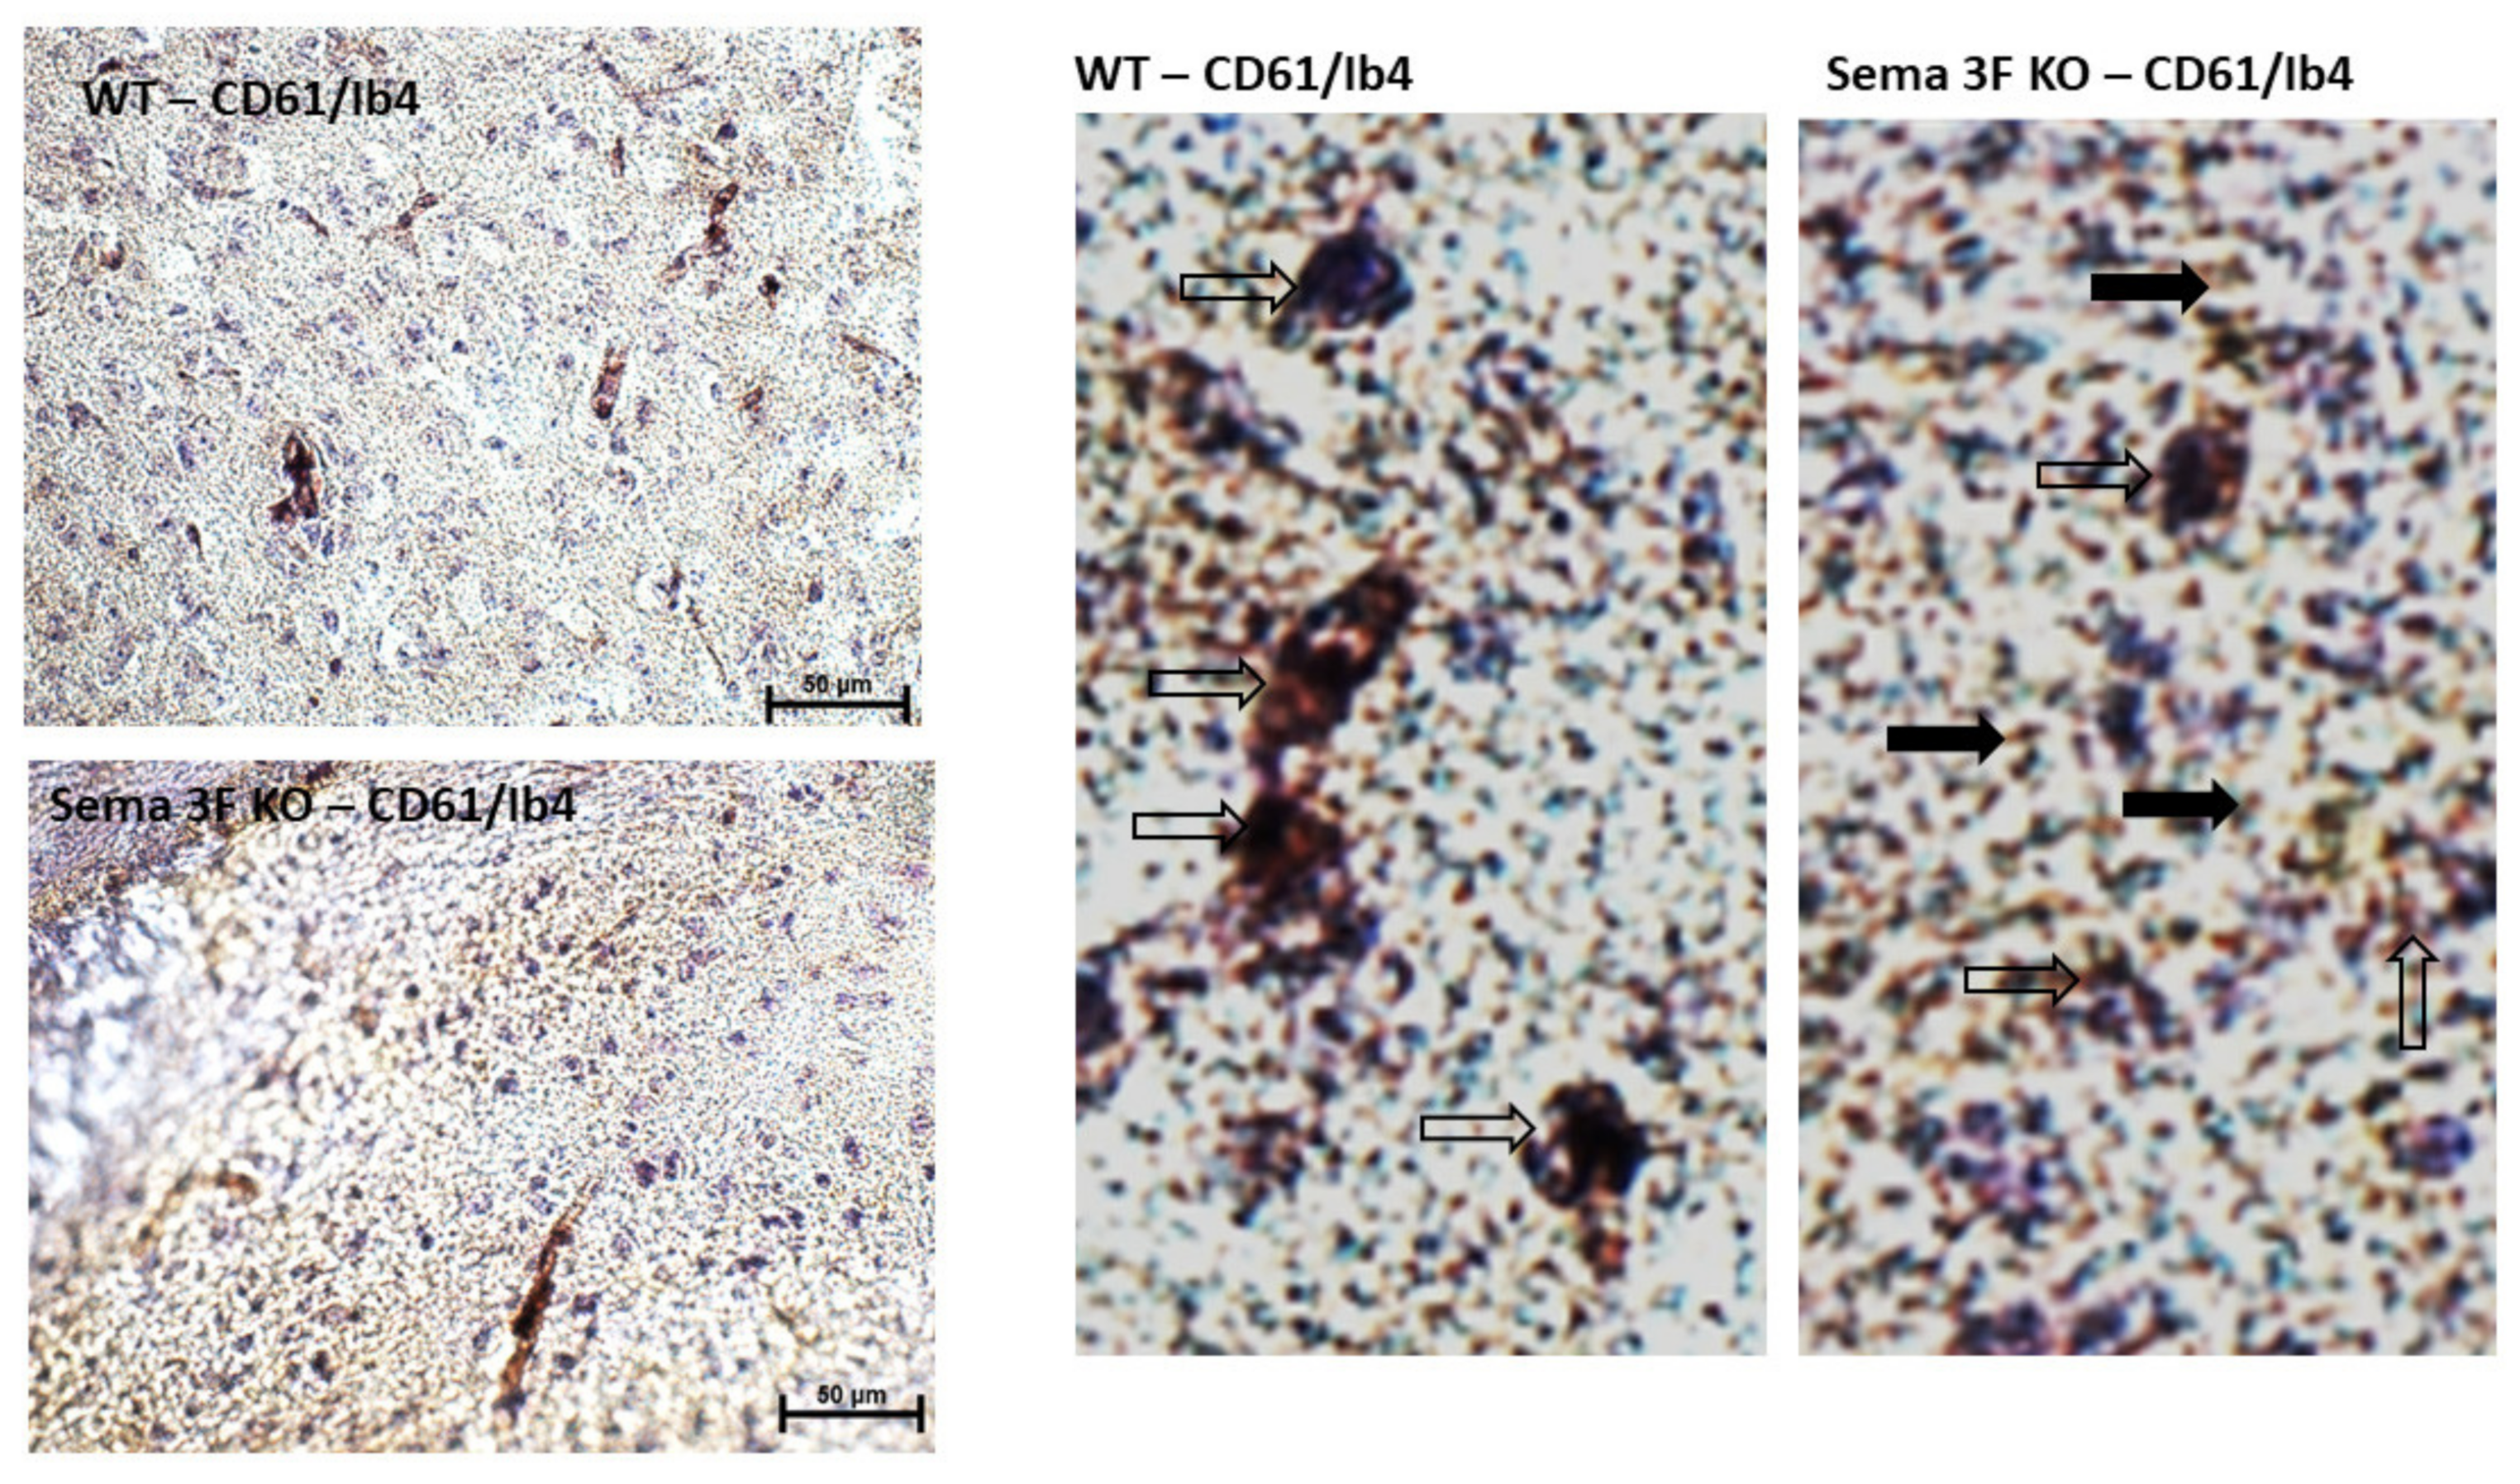
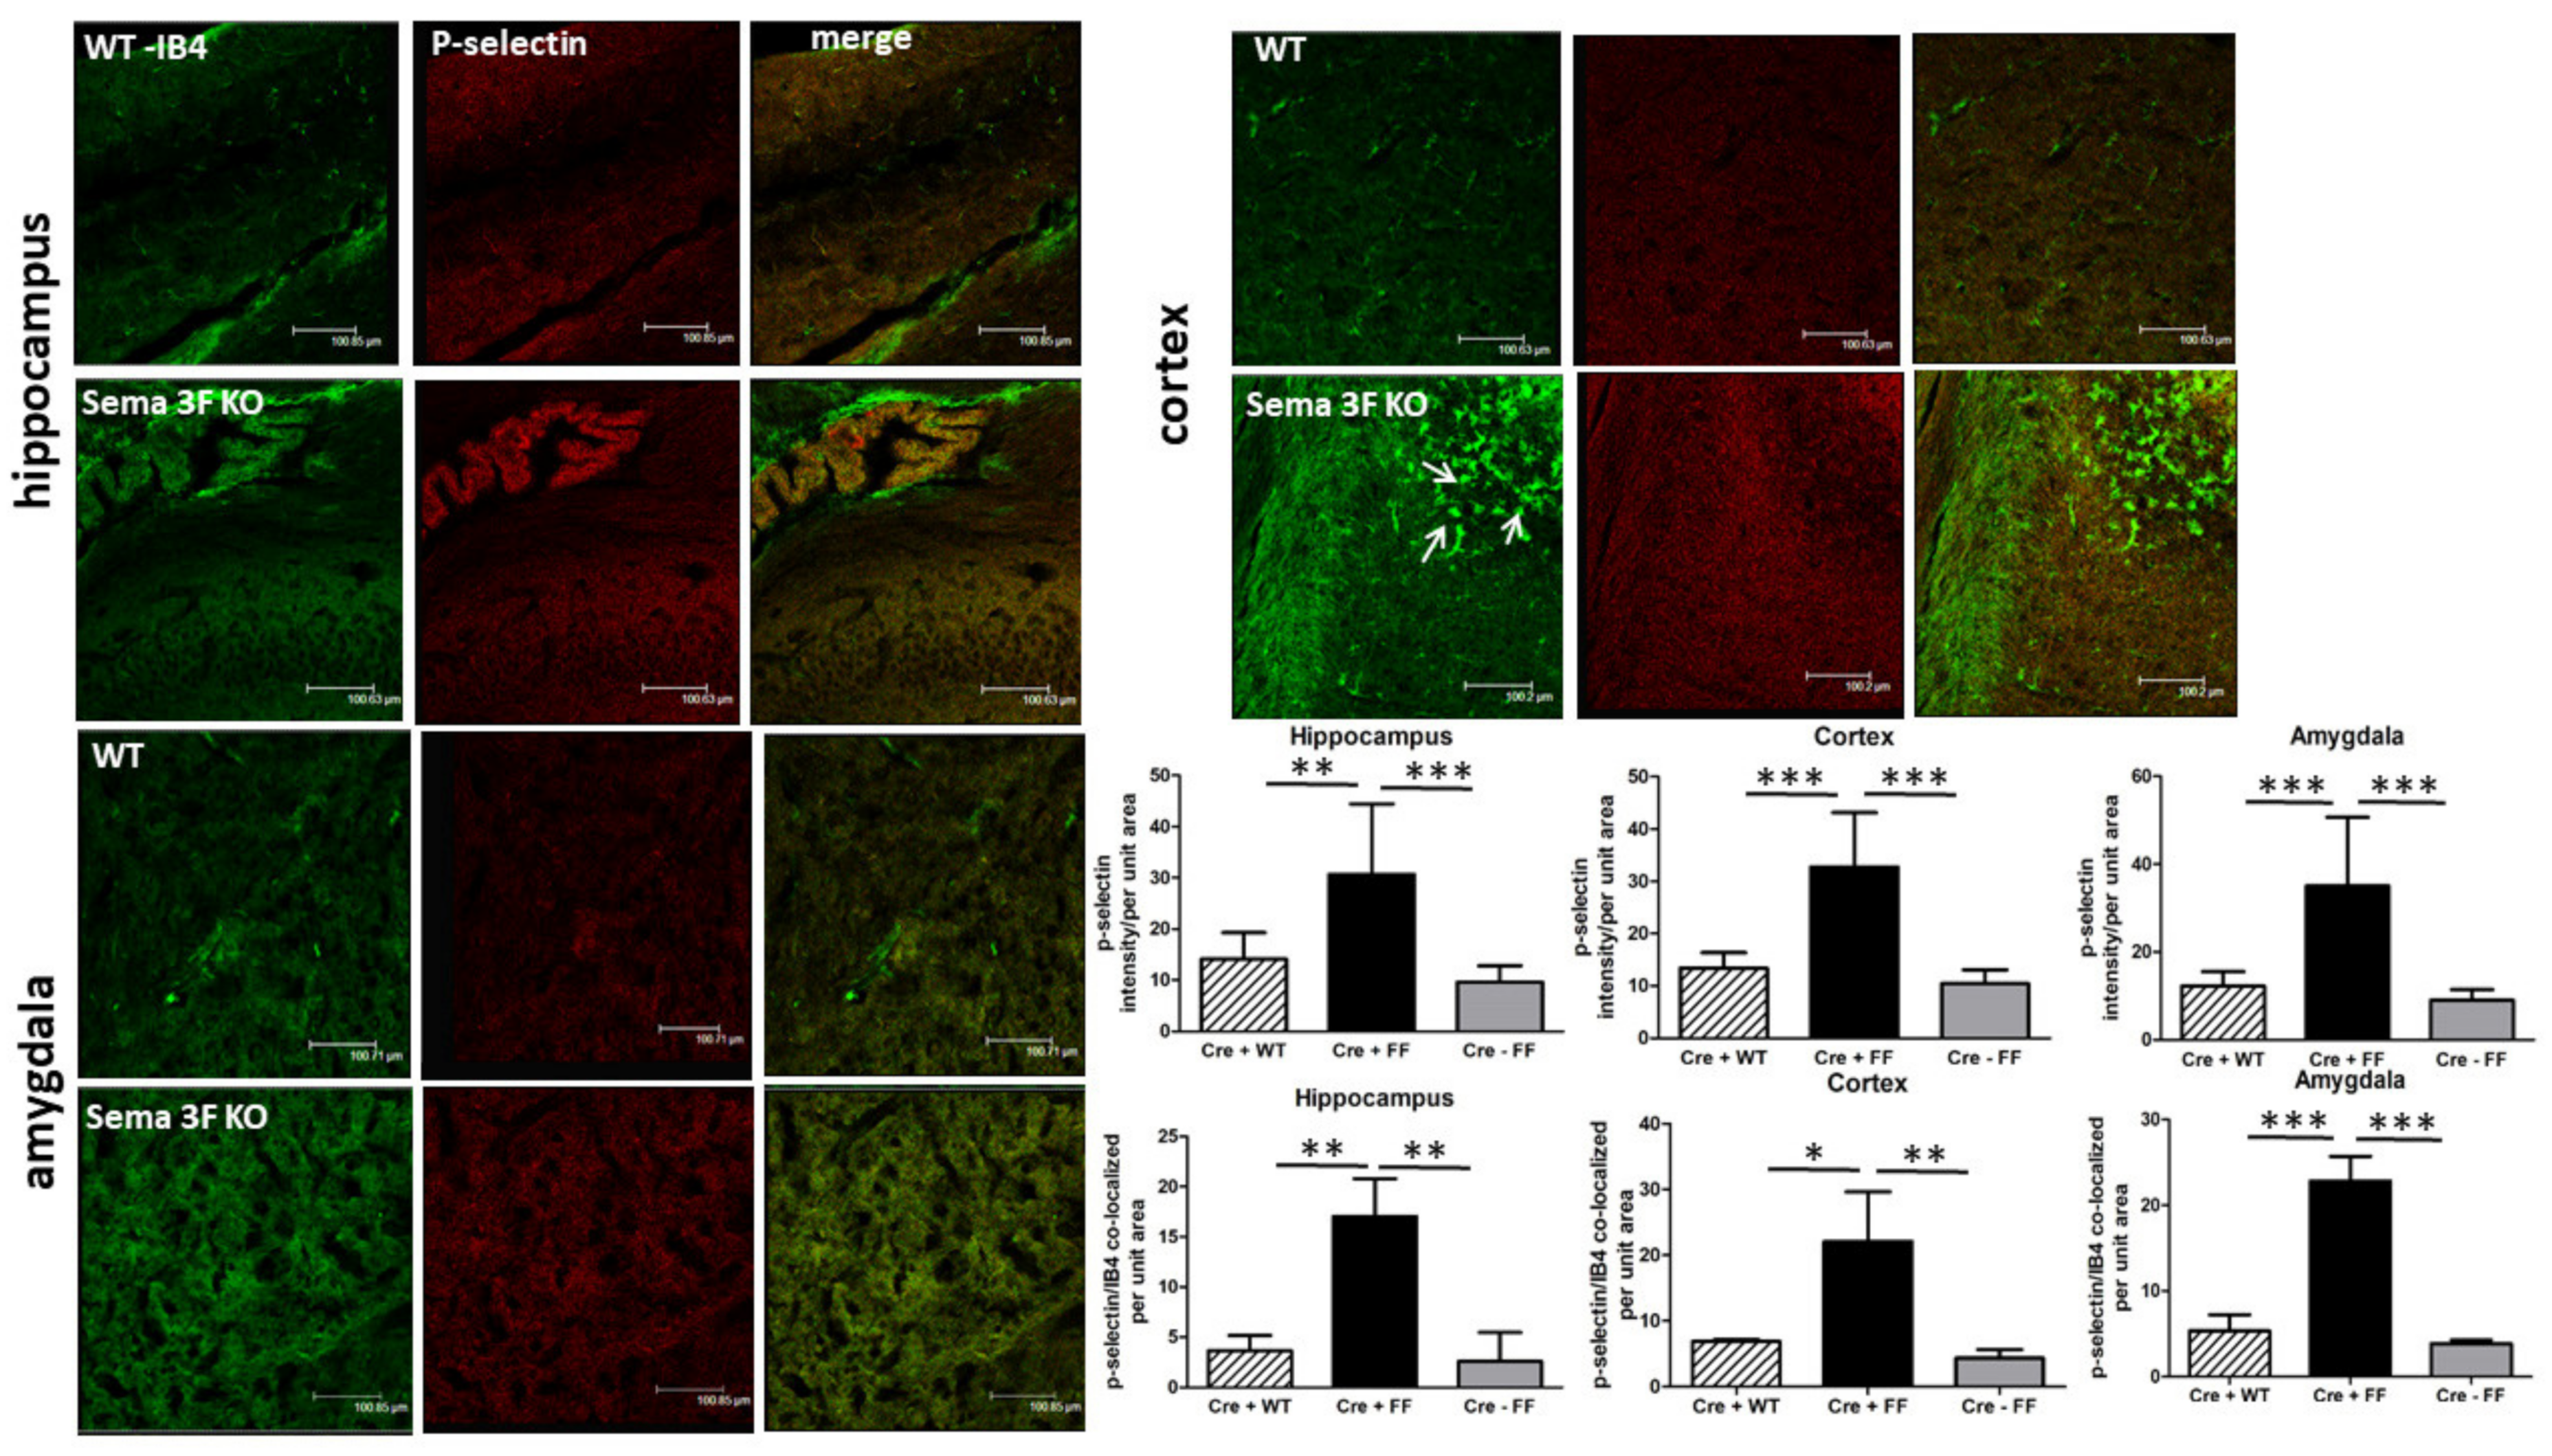
3.2.3. Immunohistochemical Analysis of CD61 and P-Selectin
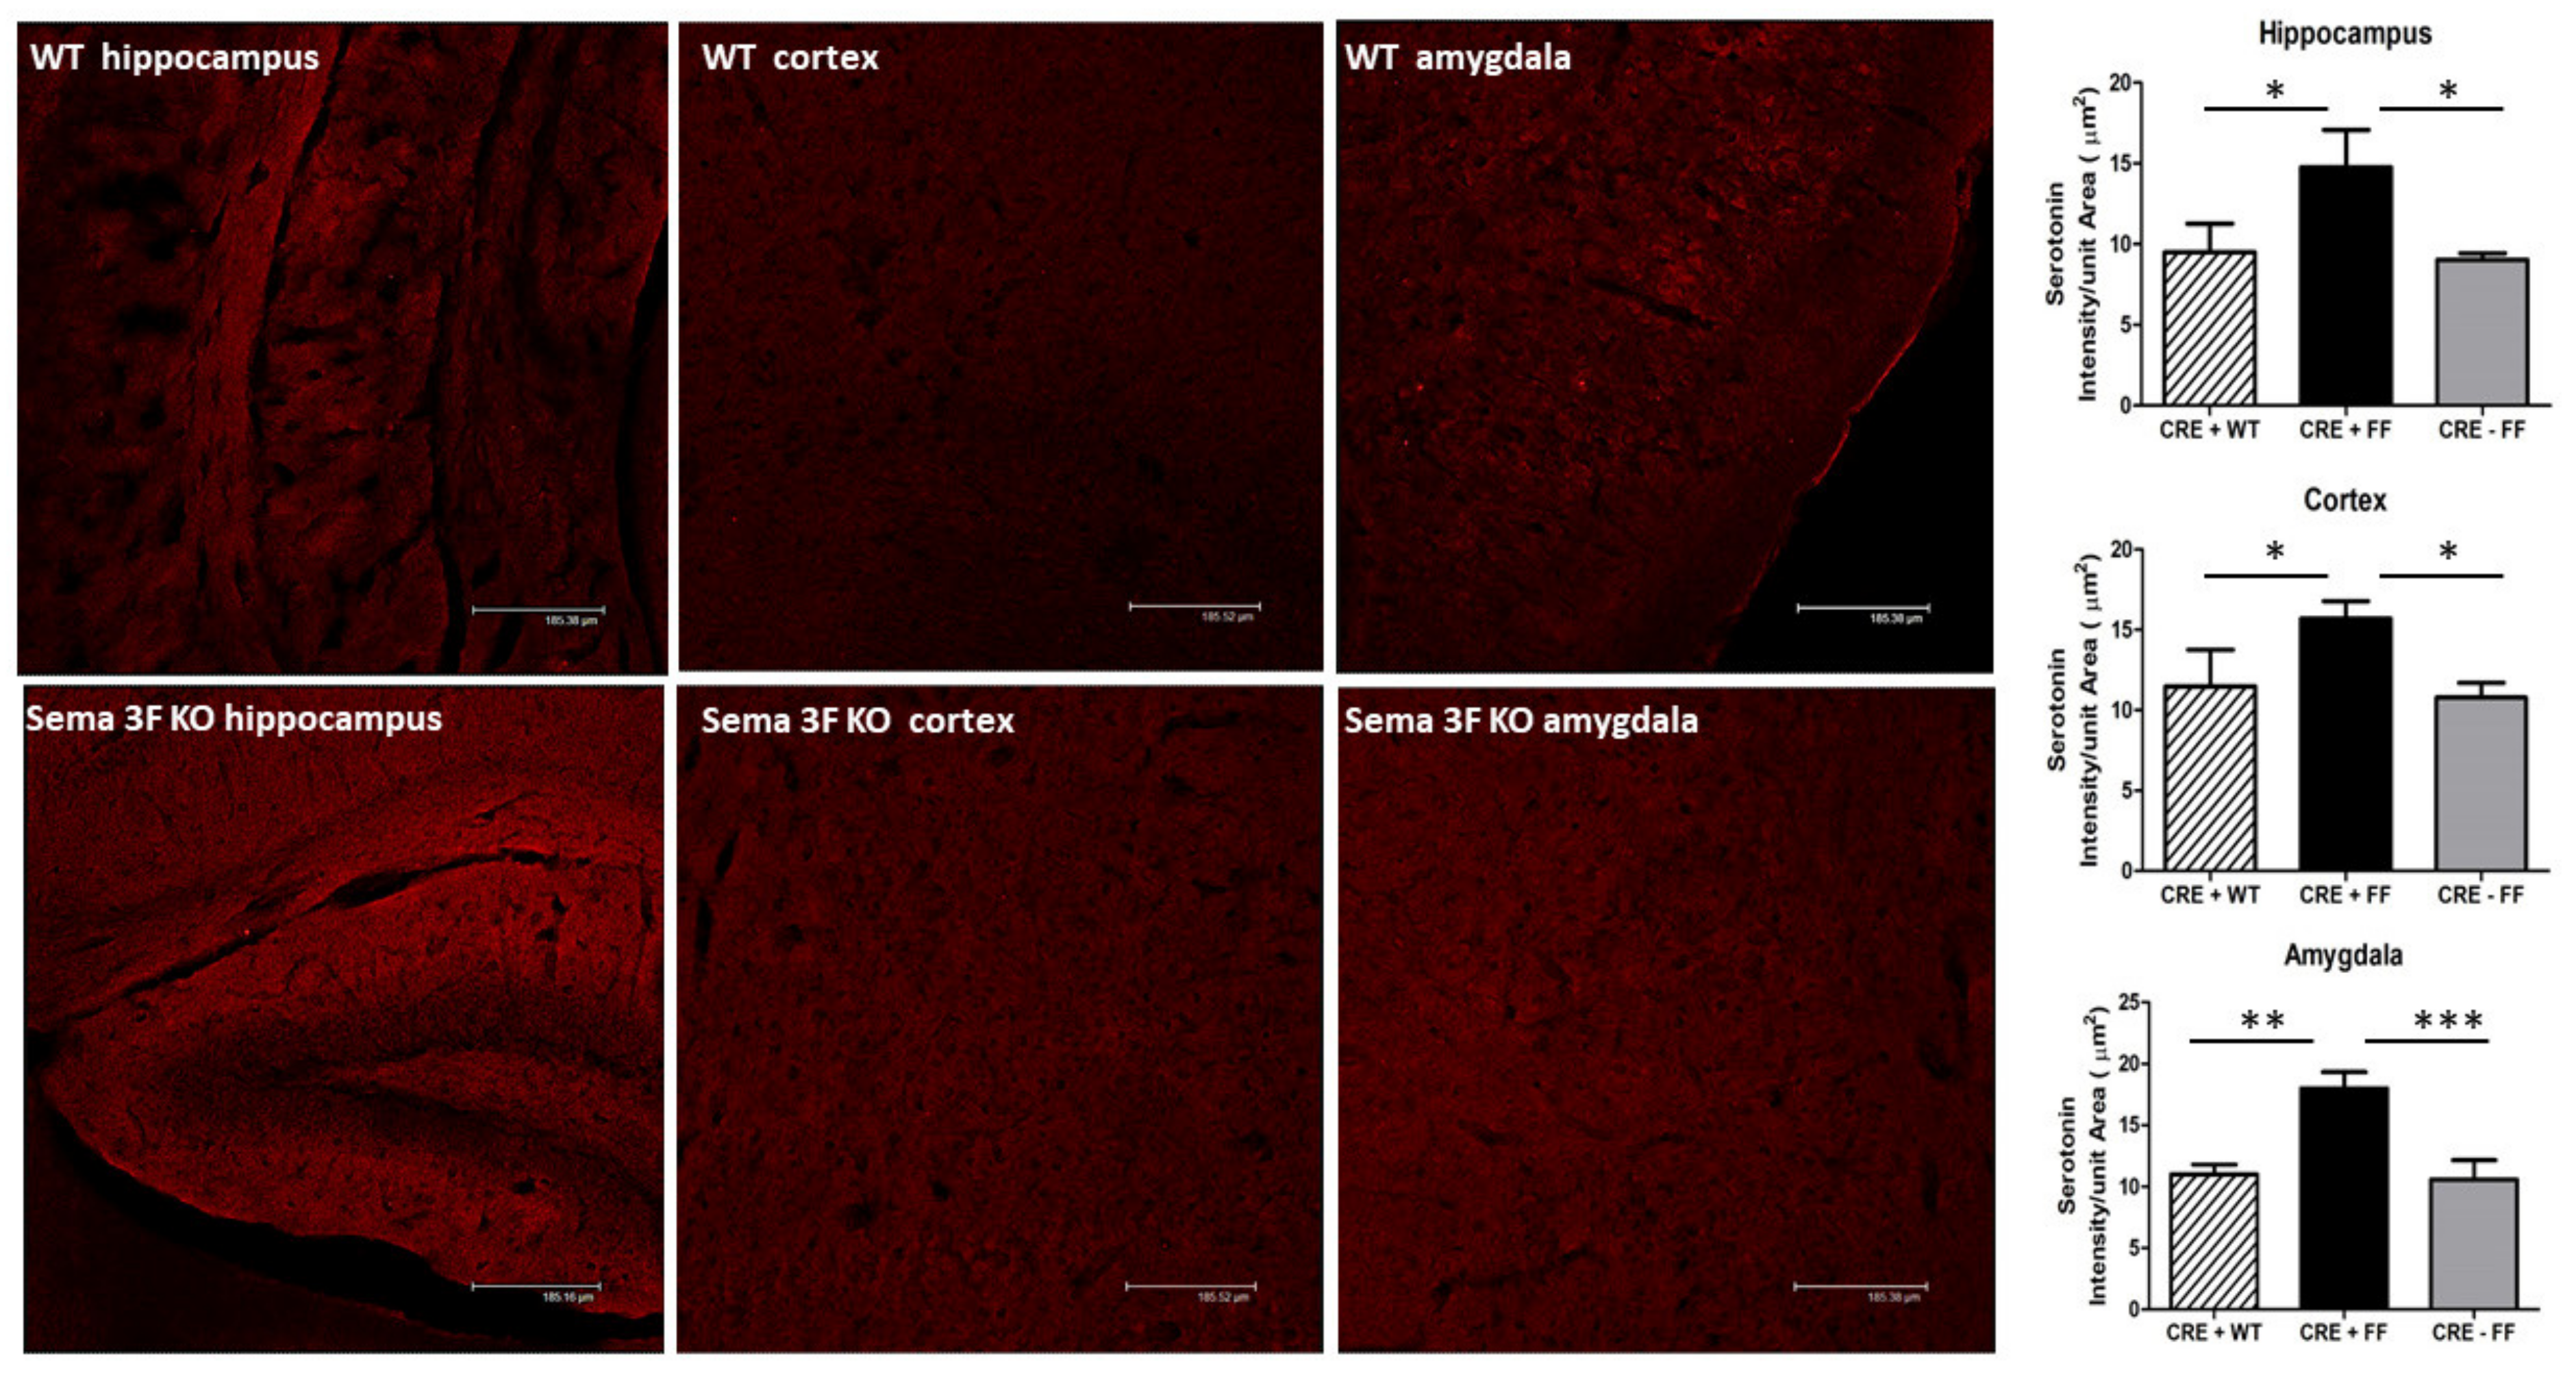
3.2.4. Immunofluorescence Analysis of Serotonin Expression
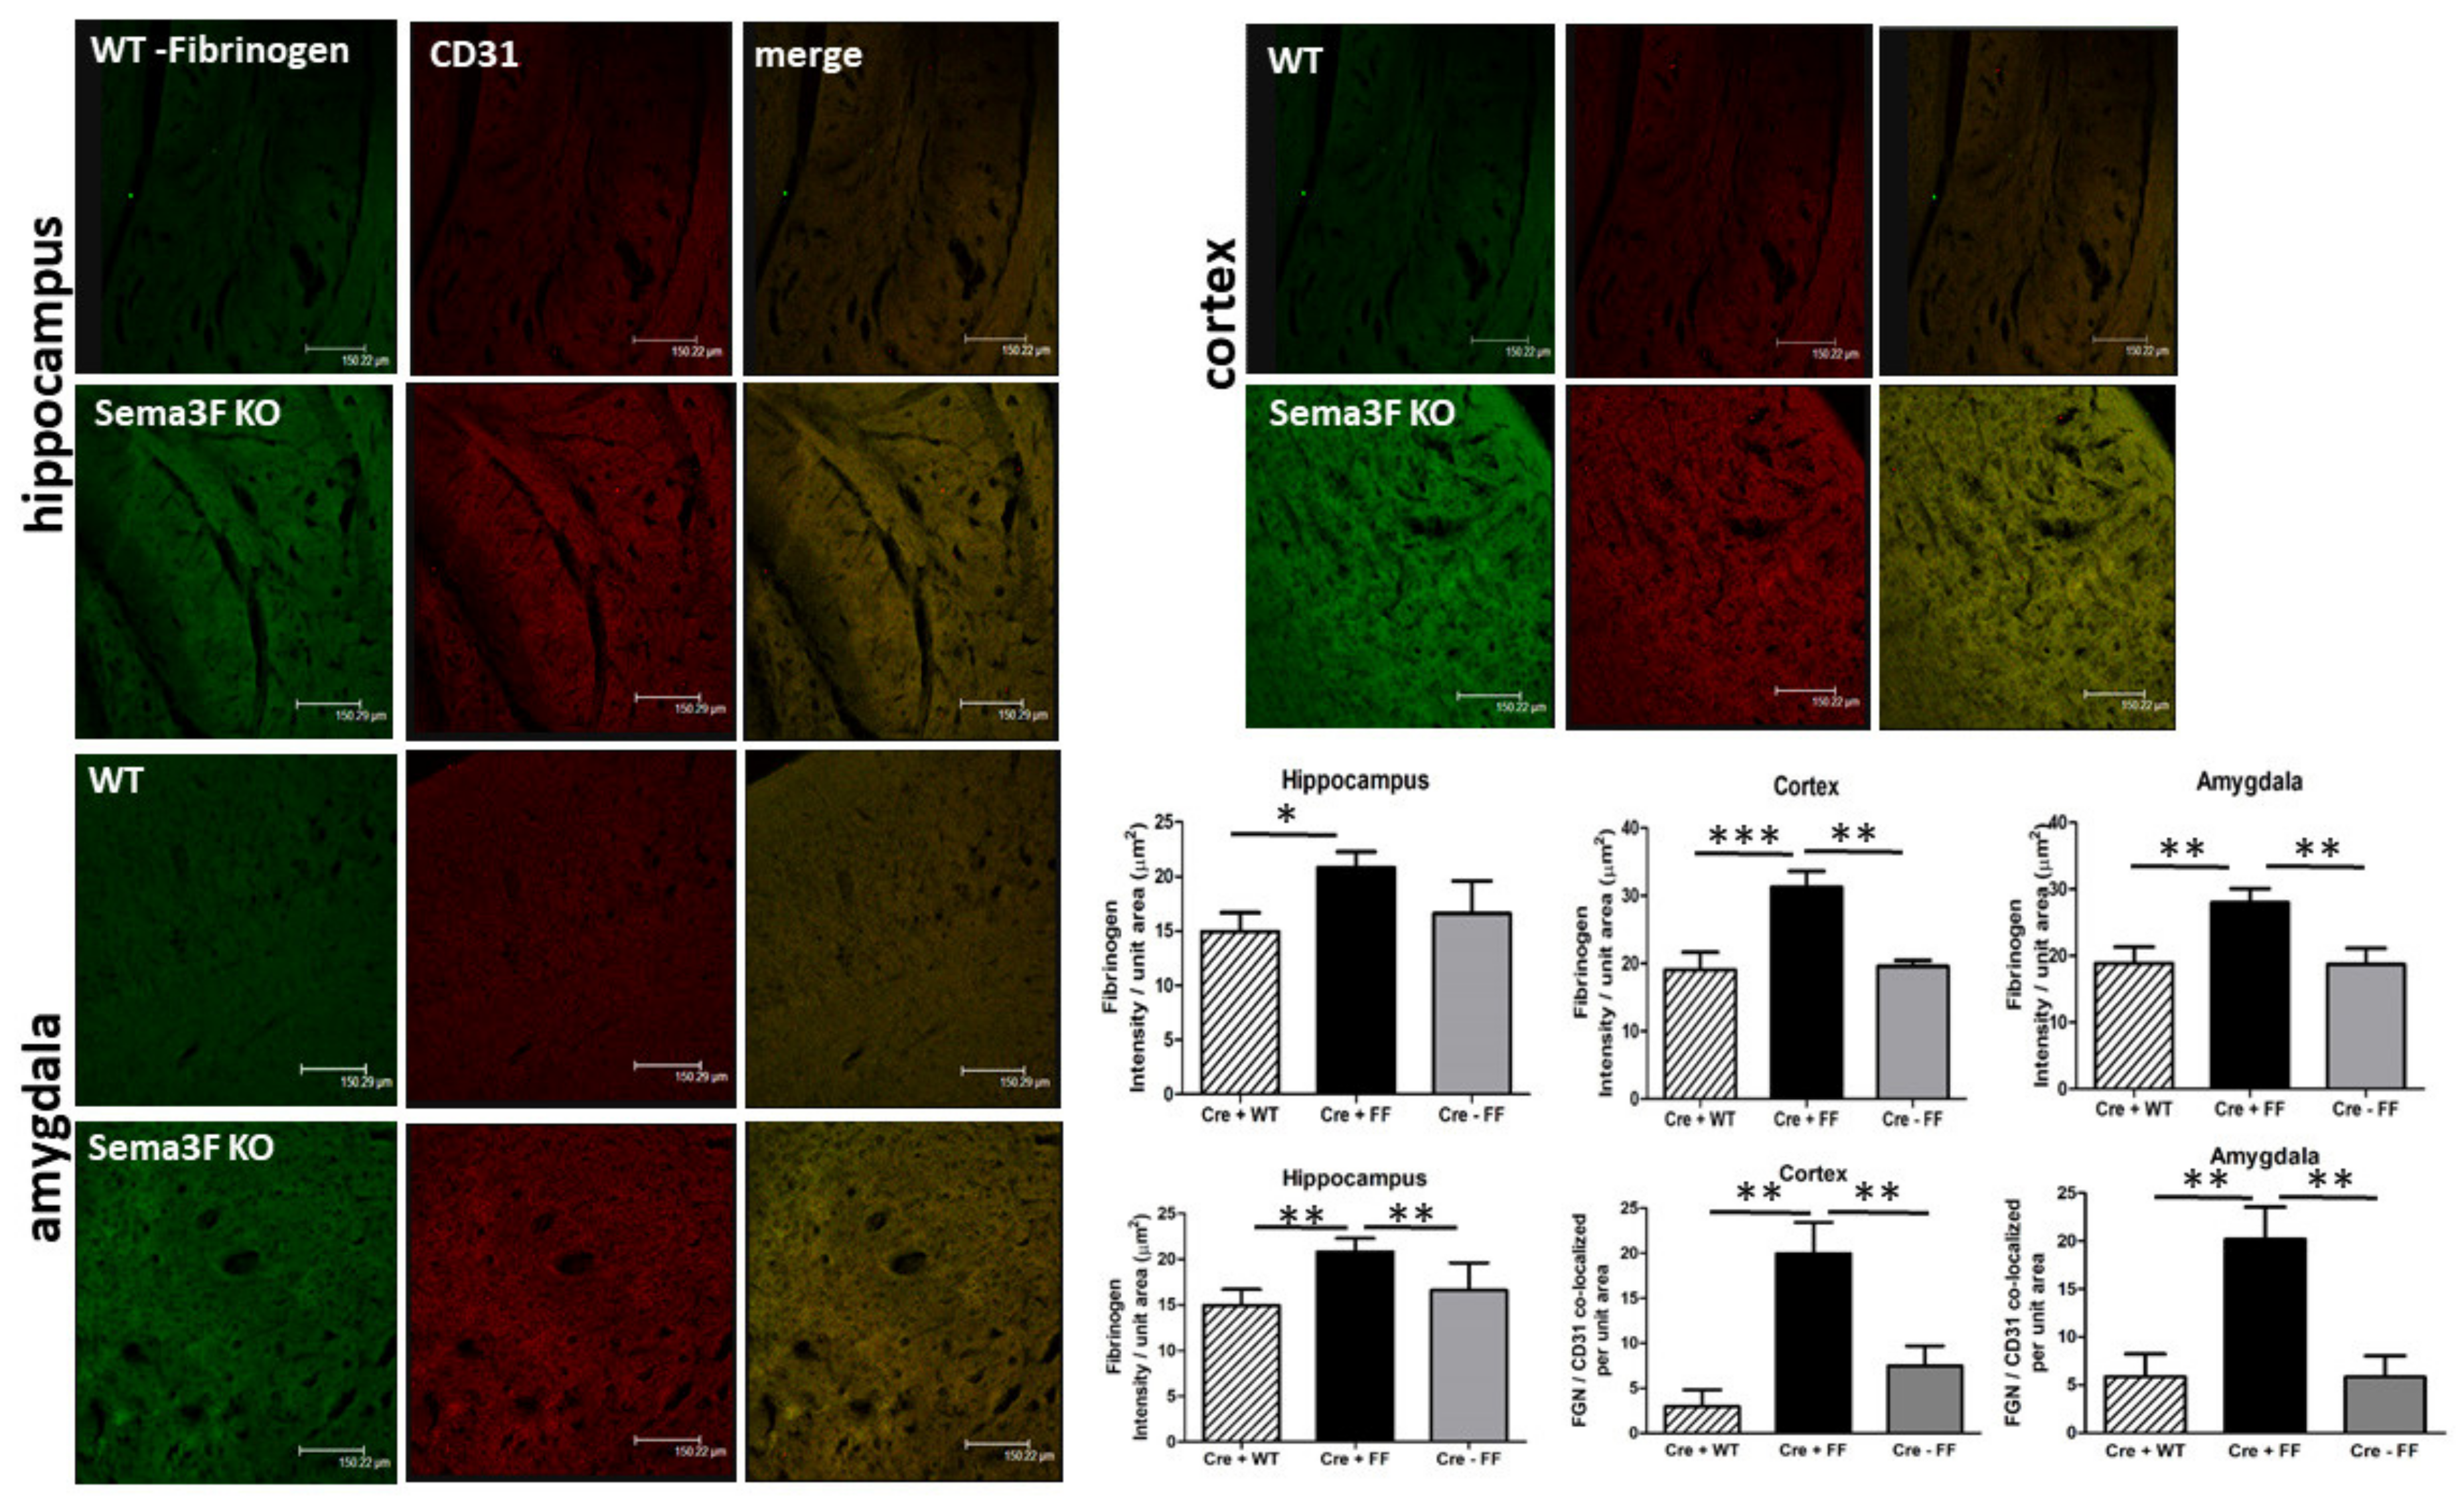
3.2.5. Immunofluorescence Analysis of Fibrinogen and CD31
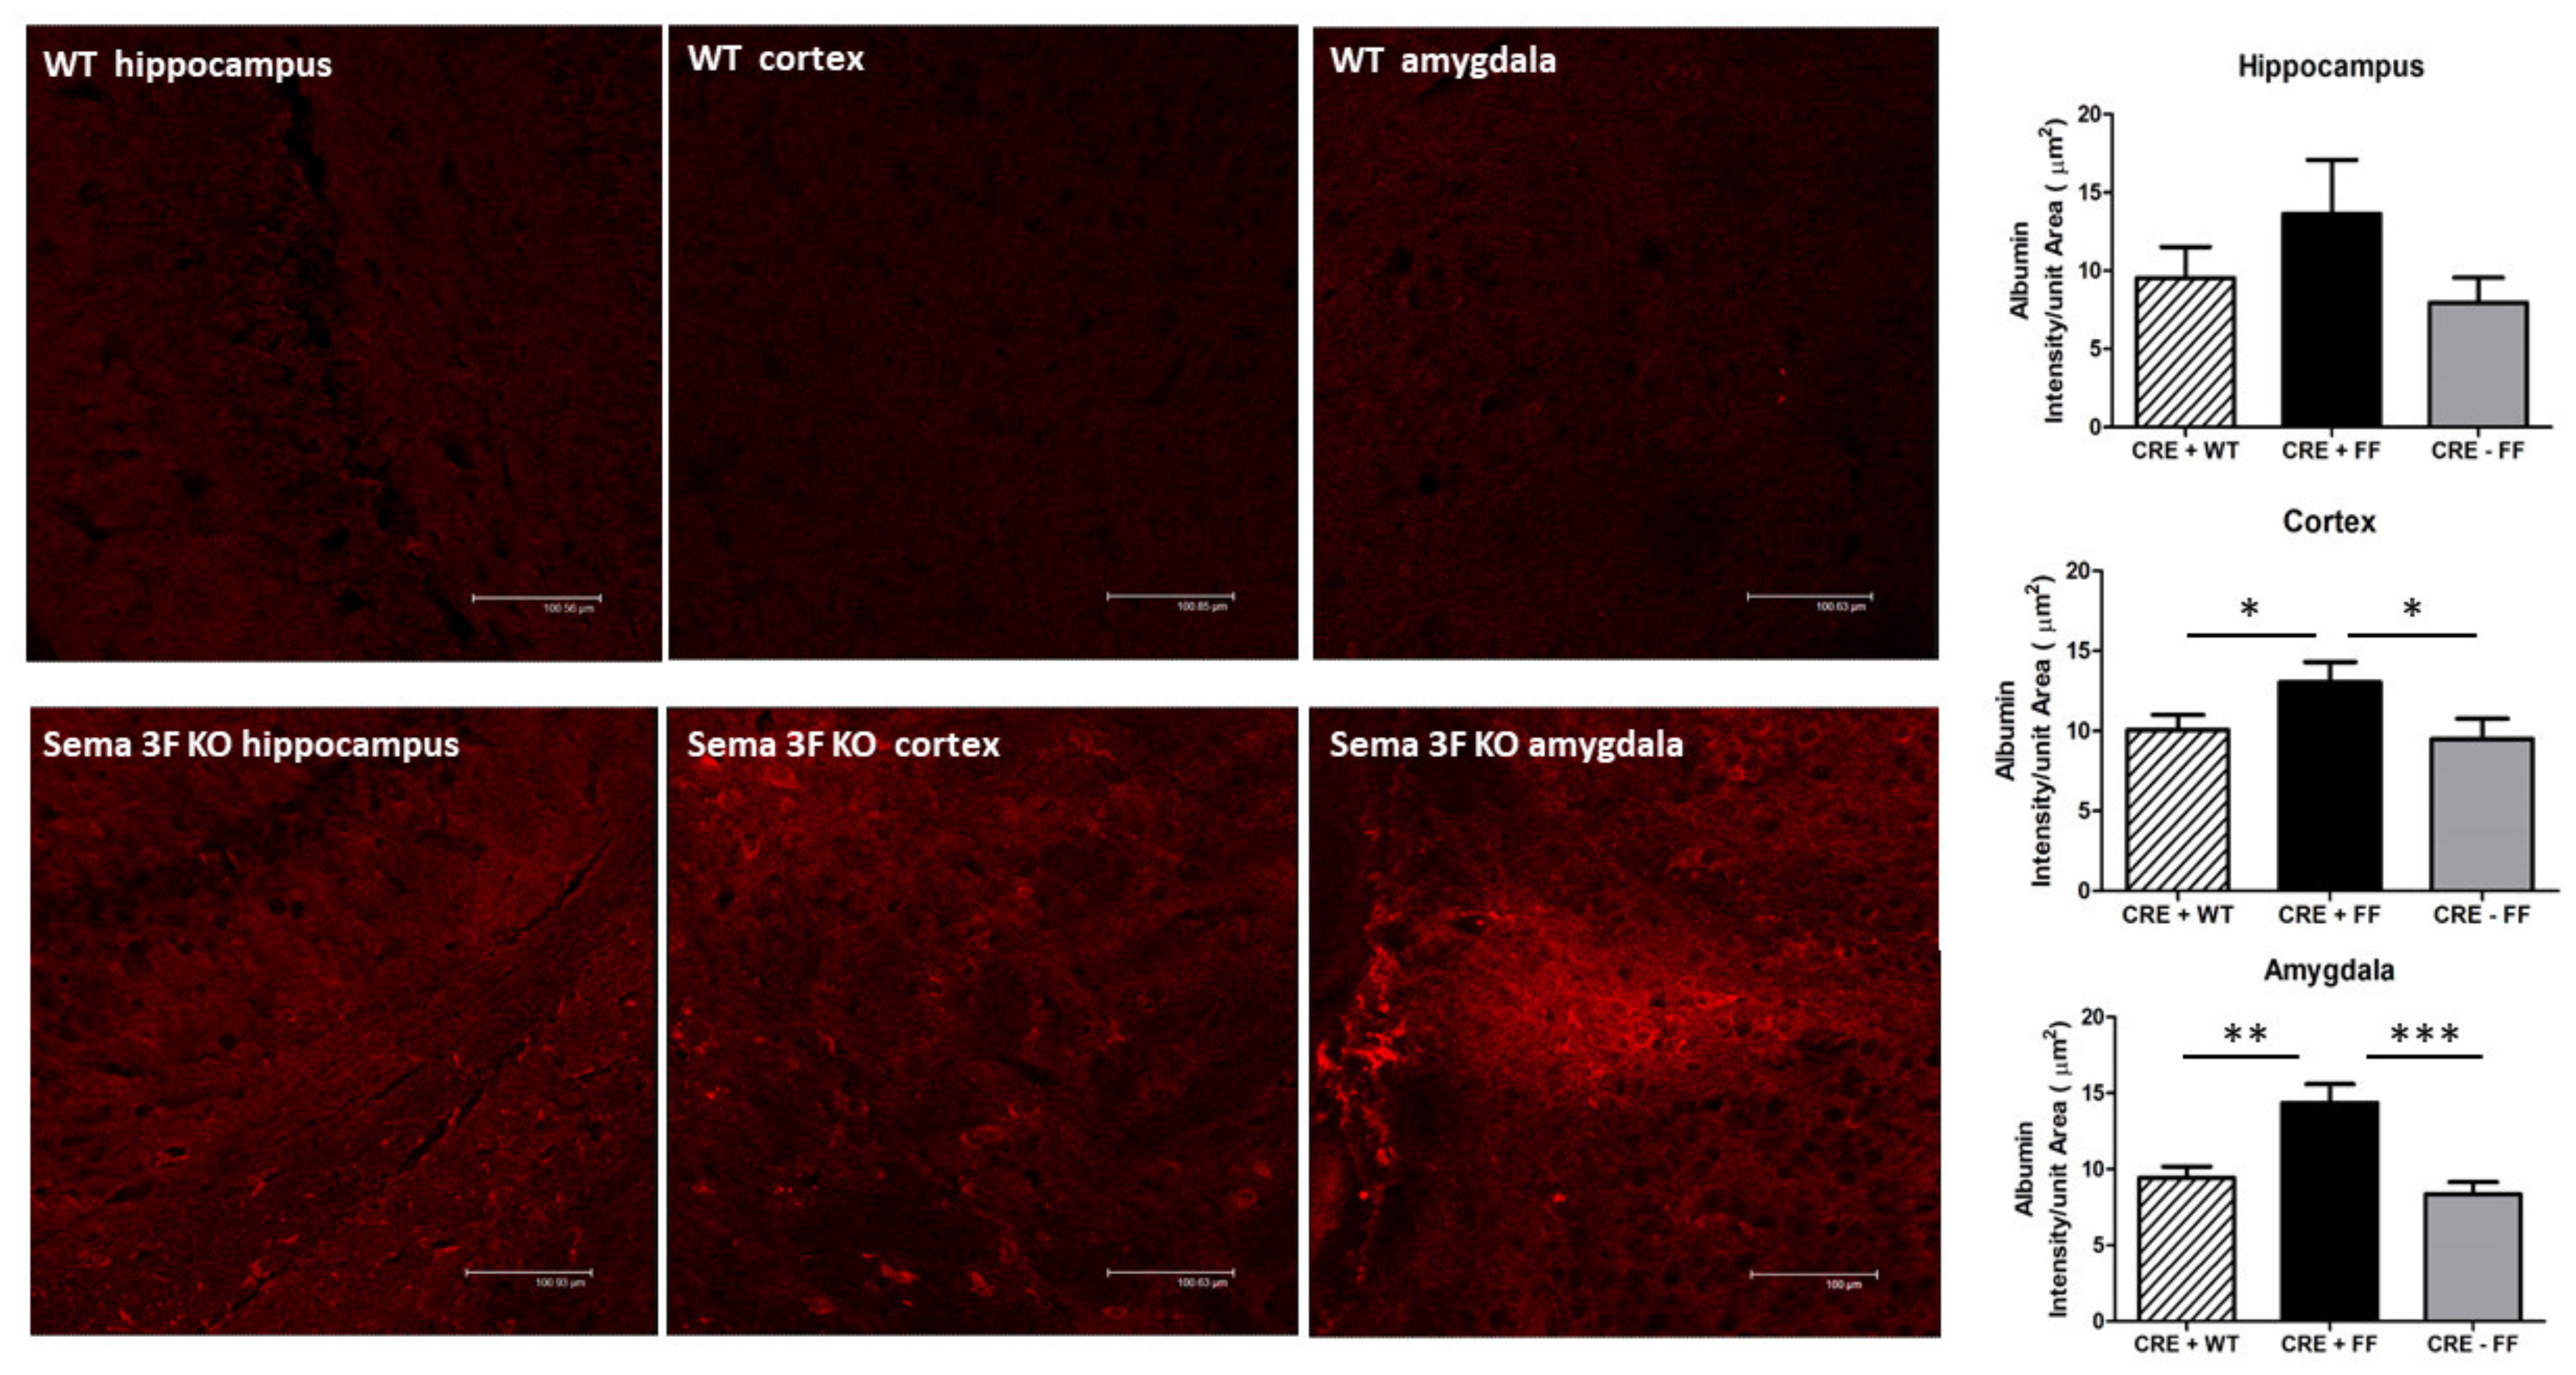
3.2.6. Immunofluorescence Analysis of Albumin Leakage
4. Discussion
4.1. Development of Blood Brain Barrier and Relationship to Autism Spectrum Disorder
4.2. Neurogenesis and Vasculogenesis Share Similar Biological Pathways
4.3. Semaphorin 3F Biology and the Blood Brain Barrier
4.4. Neuroinflammation in Autism Spectrum Disorder
4.5. Interactions between Semaphorin and Immune Signaling
4.6. Semaphorin and Serotonin Signaling
4.7. Impact of Impaired Developmental Neurovascular Signaling on CNS Development and Neuroinflammation
4.8. Limitations
5. Conclusions
Supplementary Materials
Author Contributions
Funding
Institutional Review Board Statement
Informed Consent Statement
Data Availability Statement
Conflicts of Interest
References
- Dekhil, O.; Shalaby, A.; Soliman, A.; Mahmoud, A.; Kong, M.; Barnes, G.; Elmaghraby, A.; El-Baz, A. Identifying brain areas correlated with ADOS raw scores by studying altered dynamic functional connectivity patterns. Med. Image Anal. 2021, 68, 101899. [Google Scholar] [CrossRef]
- Pardo, C.A.; Vargas, D.L.; Zimmerman, A.W. Immunity, neuroglia and neuroinflammation in autism. Int. Rev. Psychiatry 2005, 17, 485–495. [Google Scholar] [CrossRef] [Green Version]
- Takano, T. Role of Microglia in Autism: Recent Advances. Dev. Neurosci. 2015, 37, 195–202. [Google Scholar] [CrossRef]
- Vargas, D.L.; Nascimbene, C.; Krishnan, C.; Zimmerman, A.W.; Pardo, C.A. Neuroglial activation and neuroinflammation in the brain of patients with autism. Ann. Neurol. 2005, 57, 67–81. [Google Scholar] [CrossRef]
- Herbet, G.; Duffau, H. Revisiting the Functional Anatomy of the Human Brain: Toward a Meta-Networking Theory of Cerebral Functions. Physiol. Rev. 2020, 100, 1181–1228. [Google Scholar] [CrossRef]
- Betancur, C. Etiological heterogeneity in autism spectrum disorders: More than 100 genetic and genomic disorders and still counting. Brain Res. 2011, 1380, 42–77. [Google Scholar] [CrossRef] [Green Version]
- Geschwind, D.H. Genetics of autism spectrum disorders. Trends Cogn. Sci. 2011, 15, 409–416. [Google Scholar] [CrossRef] [Green Version]
- Kreiman, B.L.; Boles, R.G. State of the Art of Genetic Testing for Patients with Autism: A Practical Guide for Clinicians. Semin. Pediatr. Neurol. 2020, 34, 100804. [Google Scholar] [CrossRef]
- RK, C.Y.; Merico, D.; Bookman, M.; Howe, J.L.; Thiruvahindrapuram, B.; Patel, R.V.; Whitney, J.; Deflaux, N.; Bingham, J.; Wang, Z.; et al. Whole genome sequencing resource identifies 18 new candidate genes for autism spectrum disorder. Nat. Neurosci. 2017, 20, 602–611. [Google Scholar] [CrossRef]
- Luo, W.; Zhang, C.; Jiang, Y.H.; Brouwer, C.R. Systematic reconstruction of autism biology from massive genetic mutation profiles. Sci. Adv. 2018, 4, e1701799. [Google Scholar] [CrossRef] [Green Version]
- Aldinger, K.A.; Timms, A.E.; Thomson, Z.; Mirzaa, G.M.; Bennett, J.T.; Rosenberg, A.B.; Roco, C.M.; Hirano, M.; Abidi, F.; Haldipur, P.; et al. Redefining the Etiologic Landscape of Cerebellar Malformations. Am. J. Hum. Genet. 2019, 105, 606–615. [Google Scholar] [CrossRef] [Green Version]
- Choi, Y.K.; Vasudevan, A. Mechanistic insights into autocrine and paracrine roles of endothelial GABA signaling in the embryonic forebrain. Sci. Rep. 2019, 9, 16256. [Google Scholar] [CrossRef] [Green Version]
- Ohja, K.; Gozal, E.; Fahnestock, M.; Cai, L.; Cai, J.; Freedman, J.H.; Switala, A.; El-Baz, A.; Barnes, G.N. Neuroimmunologic and Neurotrophic Interactions in Autism Spectrum Disorders: Relationship to Neuroinflammation. Neuromol. Med. 2018, 20, 161–173. [Google Scholar] [CrossRef] [Green Version]
- Pizzarelli, R.; Cherubini, E. Alterations of GABAergic signaling in autism spectrum disorders. Neural Plast. 2011, 2011, 297153. [Google Scholar] [CrossRef] [Green Version]
- Li, S.; Kumar, T.P.; Joshee, S.; Kirschstein, T.; Subburaju, S.; Khalili, J.S.; Kloepper, J.; Du, C.; Elkhal, A.; Szabo, G.; et al. Endothelial cell-derived GABA signaling modulates neuronal migration and postnatal behavior. Cell Res. 2018, 28, 221–248. [Google Scholar] [CrossRef]
- Gant, J.C.; Thibault, O.; Blalock, E.M.; Yang, J.; Bachstetter, A.; Kotick, J.; Schauwecker, P.E.; Hauser, K.F.; Smith, G.M.; Mervis, R.; et al. Decreased number of interneurons and increased seizures in neuropilin 2 deficient mice: Implications for autism and epilepsy. Epilepsia 2009, 50, 629–645. [Google Scholar] [CrossRef]
- Li, Z.; Jagadapillai, R.; Gozal, E.; Barnes, G. Deletion of Semaphorin 3F in Interneurons Is Associated with Decreased GABAergic Neurons, Autism-like Behavior, and Increased Oxidative Stress Cascades. Mol. Neurobiol. 2019, 56, 5520–5538. [Google Scholar] [CrossRef] [Green Version]
- Sahay, A.; Molliver, M.E.; Ginty, D.D.; Kolodkin, A.L. Semaphorin 3F is critical for development of limbic system circuitry and is required in neurons for selective CNS axon guidance events. J. Neurosci. 2003, 23, 6671–6680. [Google Scholar] [CrossRef]
- Alto, L.T.; Terman, J.R. Semaphorins and their Signaling Mechanisms. Methods Mol. Biol. 2017, 1493, 1–25. [Google Scholar] [CrossRef] [Green Version]
- Raimondi, C.; Ruhrberg, C. Neuropilin signalling in vessels, neurons and tumours. Semin. Cell Dev. Biol. 2013, 24, 172–178. [Google Scholar] [CrossRef]
- Sahay, A.; Kim, C.H.; Sepkuty, J.P.; Cho, E.; Huganir, R.L.; Ginty, D.D.; Kolodkin, A.L. Secreted semaphorins modulate synaptic transmission in the adult hippocampus. J. Neurosci. 2005, 25, 3613–3620. [Google Scholar] [CrossRef] [PubMed] [Green Version]
- Matsuda, I.; Shoji, H.; Yamasaki, N.; Miyakawa, T.; Aiba, A. Comprehensive behavioral phenotyping of a new Semaphorin 3 F mutant mouse. Mol. Brain 2016, 9, 15. [Google Scholar] [CrossRef] [PubMed] [Green Version]
- Orr, B.O.; Fetter, R.D.; Davis, G.W. Retrograde semaphorin-plexin signalling drives homeostatic synaptic plasticity. Nature 2017, 550, 109–113. [Google Scholar] [CrossRef] [PubMed] [Green Version]
- Shiflett, M.W.; Gavin, M.; Tran, T.S. Altered hippocampal-dependent memory and motor function in neuropilin 2-deficient mice. Transl. Psychiatry 2015, 5, e521. [Google Scholar] [CrossRef]
- Wang, Q.; Chiu, S.L.; Koropouli, E.; Hong, I.; Mitchell, S.; Easwaran, T.P.; Hamilton, N.R.; Gustina, A.S.; Zhu, Q.; Ginty, D.D.; et al. Neuropilin-2/PlexinA3 Receptors Associate with GluA1 and Mediate Sema3F-Dependent Homeostatic Scaling in Cortical Neurons. Neuron 2017, 96, 1084–1098.e7. [Google Scholar] [CrossRef] [Green Version]
- Fiorentino, M.; Sapone, A.; Senger, S.; Camhi, S.S.; Kadzielski, S.M.; Buie, T.M.; Kelly, D.L.; Cascella, N.; Fasano, A. Blood-brain barrier and intestinal epithelial barrier alterations in autism spectrum disorders. Mol. Autism. 2016, 7, 49. [Google Scholar] [CrossRef] [Green Version]
- Al-Ayadhi, L.; Zayed, N.; Bhat, R.S.; Moubayed, N.M.S.; Al-Muammar, M.N.; El-Ansary, A. The use of biomarkers associated with leaky gut as a diagnostic tool for early intervention in autism spectrum disorder: A systematic review. Gut. Pathog. 2021, 13, 54. [Google Scholar] [CrossRef]
- Vuong, H.E.; Hsiao, E.Y. Emerging Roles for the Gut Microbiome in Autism Spectrum Disorder. Biol. Psychiatry 2017, 81, 411–423. [Google Scholar] [CrossRef] [Green Version]
- Wassman, E.R.; Ho, K.S.; Bertrand, D.; Davis, K.W.; Martin, M.M.; Page, S.; Peiffer, A.; Prasad, A.; Serrano, M.A.; Twede, H.; et al. Critical exon indexing improves clinical interpretation of copy number variants in neurodevelopmental disorders. Neurol. Genet. 2019, 5, e378. [Google Scholar] [CrossRef] [Green Version]
- Liao, Y.; Wang, J.; Jaehnig, E.J.; Shi, Z.; Zhang, B. WebGestalt 2019: Gene set analysis toolkit with revamped UIs and APIs. Nucleic Acids Res. 2019, 47, W199–W205. [Google Scholar] [CrossRef] [Green Version]
- Zhang, B.; Kirov, S.; Snoddy, J. WebGestalt: An integrated system for exploring gene sets in various biological contexts. Nucleic Acids Res. 2005, 33, W741–W748. [Google Scholar] [CrossRef]
- Szklarczyk, D.; Franceschini, A.; Wyder, S.; Forslund, K.; Heller, D.; Huerta-Cepas, J.; Simonovic, M.; Roth, A.; Santos, A.; Tsafou, K.P.; et al. STRING v10: Protein-protein interaction networks, integrated over the tree of life. Nucleic Acids Res. 2015, 43, D447–D452. [Google Scholar] [CrossRef]
- Mulligan, M.K.; Mozhui, K.; Prins, P.; Williams, R.W. GeneNetwork: A Toolbox for Systems Genetics. Methods Mol. Biol. 2017, 1488, 75–120. [Google Scholar] [CrossRef]
- Sestan, N.; State, M.W. Lost in Translation: Traversing the Complex Path from Genomics to Therapeutics in Autism Spectrum Disorder. Neuron 2018, 100, 406–423. [Google Scholar] [CrossRef] [Green Version]
- Wood, J.J.; Kendall, P.C.; Wood, K.S.; Kerns, C.M.; Seltzer, M.; Small, B.J.; Lewin, A.B.; Storch, E.A. Cognitive Behavioral Treatments for Anxiety in Children with Autism Spectrum Disorder: A Randomized Clinical Trial. JAMA Psychiatry 2020, 77, 474–483. [Google Scholar] [CrossRef]
- Bartolotti, J.; Sweeney, J.A.; Mosconi, M.W. Functional brain abnormalities associated with comorbid anxiety in autism spectrum disorder. Dev. Psychopathol. 2020, 32, 1273–1286. [Google Scholar] [CrossRef]
- Girirajan, S.; Johnson, R.L.; Tassone, F.; Balciuniene, J.; Katiyar, N.; Fox, K.; Baker, C.; Srikanth, A.; Yeoh, K.H.; Khoo, S.J.; et al. Global increases in both common and rare copy number load associated with autism. Hum. Mol. Genet. 2013, 22, 2870–2880. [Google Scholar] [CrossRef] [Green Version]
- Tomchek, S.; Koenig, K.P.; Arbesman, M.; Lieberman, D. Occupational Therapy Interventions for Adolescents With Autism Spectrum Disorder. Am. J. Occup. Ther. 2017, 71, 7101395010p1–7101395010p3. [Google Scholar] [CrossRef] [Green Version]
- Mendes-da-Cruz, D.A.; Brignier, A.C.; Asnafi, V.; Baleydier, F.; Messias, C.V.; Lepelletier, Y.; Bedjaoui, N.; Renand, A.; Smaniotto, S.; Canioni, D.; et al. Semaphorin 3F and neuropilin-2 control the migration of human T-cell precursors. PLoS ONE 2014, 9, e103405. [Google Scholar] [CrossRef] [Green Version]
- Gozal, E.; Jagadapillai, R.; Cai, J.; Barnes, G.N. Potential crosstalk between sonic hedgehog-WNT signaling and neurovascular molecules: Implications for blood-brain barrier integrity in autism spectrum disorder. J. Neurochem. 2021, 159, 15–28. [Google Scholar] [CrossRef]
- Daneman, R.; Prat, A. The blood-brain barrier. Cold Spring Harb. Perspect. Biol. 2015, 7, a020412. [Google Scholar] [CrossRef] [Green Version]
- Hawkins, B.T.; Davis, T.P. The blood-brain barrier/neurovascular unit in health and disease. Pharmacol. Rev. 2005, 57, 173–185. [Google Scholar] [CrossRef]
- Kealy, J.; Greene, C.; Campbell, M. Blood-brain barrier regulation in psychiatric disorders. Neurosci. Lett. 2020, 726, 133664. [Google Scholar] [CrossRef] [Green Version]
- Liu, W.Y.; Wang, Z.B.; Zhang, L.C.; Wei, X.; Li, L. Tight junction in blood-brain barrier: An overview of structure, regulation, and regulator substances. CNS Neurosci. Ther. 2012, 18, 609–615. [Google Scholar] [CrossRef]
- Sweeney, M.D.; Zhao, Z.; Montagne, A.; Nelson, A.R.; Zlokovic, B.V. Blood-Brain Barrier: From Physiology to Disease and Back. Physiol. Rev. 2019, 99, 21–78. [Google Scholar] [CrossRef]
- Caracci, M.O.; Avila, M.E.; De Ferrari, G.V. Synaptic Wnt/GSK3beta Signaling Hub in Autism. Neural Plast. 2016, 2016, 9603751. [Google Scholar] [CrossRef] [Green Version]
- Bell, R.D.; Zlokovic, B.V. Neurovascular mechanisms and blood-brain barrier disorder in Alzheimer’s disease. Acta Neuropathol. 2009, 118, 103–113. [Google Scholar] [CrossRef] [Green Version]
- Gray, M.T.; Woulfe, J.M. Striatal blood-brain barrier permeability in Parkinson’s disease. J. Cereb. Blood Flow Metab. 2015, 35, 747–750. [Google Scholar] [CrossRef] [Green Version]
- Heinemann, U.; Kaufer, D.; Friedman, A. Blood-brain barrier dysfunction, TGFbeta signaling, and astrocyte dysfunction in epilepsy. Glia 2012, 60, 1251–1257. [Google Scholar] [CrossRef] [PubMed] [Green Version]
- Milikovsky, D.Z.; Ofer, J.; Senatorov, V.V., Jr.; Friedman, A.R.; Prager, O.; Sheintuch, L.; Elazari, N.; Veksler, R.; Zelig, D.; Weissberg, I.; et al. Paroxysmal slow cortical activity in Alzheimer’s disease and epilepsy is associated with blood-brain barrier dysfunction. Sci. Transl. Med. 2019, 11, eaaw8954. [Google Scholar] [CrossRef] [PubMed]
- Moor, A.C.; de Vries, H.E.; de Boer, A.G.; Breimer, D.D. The blood-brain barrier and multiple sclerosis. Biochem. Pharmacol. 1994, 47, 1717–1724. [Google Scholar] [CrossRef]
- Xiao, M.; Xiao, Z.J.; Yang, B.; Lan, Z.; Fang, F. Blood-Brain Barrier: More Contributor to Disruption of Central Nervous System Homeostasis Than Victim in Neurological Disorders. Front. Neurosci. 2020, 14, 764. [Google Scholar] [CrossRef]
- Kang, D.W.; Adams, J.B.; Gregory, A.C.; Borody, T.; Chittick, L.; Fasano, A.; Khoruts, A.; Geis, E.; Maldonado, J.; McDonough-Means, S.; et al. Microbiota Transfer Therapy alters gut ecosystem and improves gastrointestinal and autism symptoms: An open-label study. Microbiome 2017, 5, 10. [Google Scholar] [CrossRef]
- Braniste, V.; Al-Asmakh, M.; Kowal, C.; Anuar, F.; Abbaspour, A.; Toth, M.; Korecka, A.; Bakocevic, N.; Ng, L.G.; Kundu, P.; et al. The gut microbiota influences blood-brain barrier permeability in mice. Sci. Transl. Med. 2014, 6, 263ra158. [Google Scholar] [CrossRef] [Green Version]
- Alvarez, J.I.; Dodelet-Devillers, A.; Kebir, H.; Ifergan, I.; Fabre, P.J.; Terouz, S.; Sabbagh, M.; Wosik, K.; Bourbonniere, L.; Bernard, M.; et al. The Hedgehog pathway promotes blood-brain barrier integrity and CNS immune quiescence. Science 2011, 334, 1727–1731. [Google Scholar] [CrossRef] [Green Version]
- Liu, L.; Zhao, B.; Xiong, X.; Xia, Z. The Neuroprotective Roles of Sonic Hedgehog Signaling Pathway in Ischemic Stroke. Neurochem. Res. 2018, 43, 2199–2211. [Google Scholar] [CrossRef]
- Rahi, S.; Mehan, S. Understanding Abnormal SMO-SHH Signaling in Autism Spectrum Disorder: Potential Drug Target and Therapeutic Goals. Cell. Mol. Neurobiol. 2020, 42, 931–953. [Google Scholar] [CrossRef]
- Stenman, J.M.; Rajagopal, J.; Carroll, T.J.; Ishibashi, M.; McMahon, J.; McMahon, A.P. Canonical Wnt signaling regulates organ-specific assembly and differentiation of CNS vasculature. Science 2008, 322, 1247–1250. [Google Scholar] [CrossRef]
- Scott-Van Zeeland, A.A.; Abrahams, B.S.; Alvarez-Retuerto, A.I.; Sonnenblick, L.I.; Rudie, J.D.; Ghahremani, D.; Mumford, J.A.; Poldrack, R.A.; Dapretto, M.; Geschwind, D.H.; et al. Altered functional connectivity in frontal lobe circuits is associated with variation in the autism risk gene CNTNAP2. Sci. Transl. Med. 2010, 2, 56ra80. [Google Scholar] [CrossRef] [Green Version]
- Tan, G.C.; Doke, T.F.; Ashburner, J.; Wood, N.W.; Frackowiak, R.S. Normal variation in fronto-occipital circuitry and cerebellar structure with an autism-associated polymorphism of CNTNAP2. Neuroimage 2010, 53, 1030–1042. [Google Scholar] [CrossRef] [Green Version]
- Zhang, Y.; Sun, Y.; Wang, F.; Wang, Z.; Peng, Y.; Li, R. Downregulating the canonical Wnt/beta-catenin signaling pathway attenuates the susceptibility to autism-like phenotypes by decreasing oxidative stress. Neurochem. Res. 2012, 37, 1409–1419. [Google Scholar] [CrossRef]
- Won, C.; Lin, Z.; Kumar, T.P.; Li, S.; Ding, L.; Elkhal, A.; Szabo, G.; Vasudevan, A. Autonomous vascular networks synchronize GABA neuron migration in the embryonic forebrain. Nat. Commun. 2013, 4, 2149. [Google Scholar] [CrossRef] [Green Version]
- Parra, L.M.; Zou, Y. Sonic hedgehog induces response of commissural axons to Semaphorin repulsion during midline crossing. Nat. Neurosci. 2010, 13, 29–35. [Google Scholar] [CrossRef]
- Liu, M.H.; Fu, W.J.; Cui, Y.H.; Guo, Q.N.; Zhou, Y. Downregulation of Semaphorin-3F is associated with poor prognostic significance in osteosarcoma patients. Am. J. Cancer Res. 2016, 6, 2252–2262. [Google Scholar]
- Ng, T.; Hor, C.H.; Chew, B.; Zhao, J.; Zhong, Z.; Ryu, J.R.; Goh, E.L. Neuropilin 2 Signaling Is Involved in Cell Positioning of Adult-born Neurons through Glycogen Synthase Kinase-3beta (GSK3beta). J. Biol. Chem. 2016, 291, 25088–25095. [Google Scholar] [CrossRef] [Green Version]
- Rao, J.; Zhou, Z.H.; Yang, J.; Shi, Y.; Xu, S.L.; Wang, B.; Ping, Y.F.; Chen, L.; Cui, Y.H.; Zhang, X.; et al. Semaphorin-3F suppresses the stemness of colorectal cancer cells by inactivating Rac1. Cancer Lett. 2015, 358, 76–84. [Google Scholar] [CrossRef]
- Samuel, S.; Gaur, P.; Fan, F.; Xia, L.; Gray, M.J.; Dallas, N.A.; Bose, D.; Rodriguez-Aguayo, C.; Lopez-Berestein, G.; Plowman, G.; et al. Neuropilin-2 mediated beta-catenin signaling and survival in human gastro-intestinal cancer cell lines. PLoS ONE 2011, 6, e23208. [Google Scholar] [CrossRef]
- Zhang, H.; Vreeken, D.; Junaid, A.; Wang, G.; Sol, W.; de Bruin, R.G.; van Zonneveld, A.J.; van Gils, J.M. Endothelial Semaphorin 3F Maintains Endothelial Barrier Function and Inhibits Monocyte Migration. Int. J. Mol. Sci. 2020, 21, 1471. [Google Scholar] [CrossRef] [PubMed] [Green Version]
- Yang, Y.; Rosenberg, G.A. Blood-brain barrier breakdown in acute and chronic cerebrovascular disease. Stroke 2011, 42, 3323–3328. [Google Scholar] [CrossRef] [PubMed] [Green Version]
- Kumar, H.; Sharma, B.M.; Sharma, B. Benefits of agomelatine in behavioral, neurochemical and blood brain barrier alterations in prenatal valproic acid induced autism spectrum disorder. Neurochem. Int. 2015, 91, 34–45. [Google Scholar] [CrossRef] [PubMed]
- Kumar, H.; Sharma, B. Memantine ameliorates autistic behavior, biochemistry & blood brain barrier impairments in rats. Brain Res. Bull. 2016, 124, 27–39. [Google Scholar] [CrossRef]
- Downs, R.; Perna, J.; Vitelli, A.; Cook, D.; Dhurjati, P. Model-based hypothesis of gut microbe populations and gut/brain barrier permeabilities in the development of regressive autism. Med. Hypotheses 2014, 83, 649–655. [Google Scholar] [CrossRef]
- Heberling, C.A.; Dhurjati, P.S.; Sasser, M. Hypothesis for a systems connectivity model of Autism Spectrum Disorder pathogenesis: Links to gut bacteria, oxidative stress, and intestinal permeability. Med. Hypotheses 2013, 80, 264–270. [Google Scholar] [CrossRef]
- Zimmerman, A.W.; Jyonouchi, H.; Comi, A.M.; Connors, S.L.; Milstien, S.; Varsou, A.; Heyes, M.P. Cerebrospinal fluid and serum markers of inflammation in autism. Pediatr. Neurol. 2005, 33, 195–201. [Google Scholar] [CrossRef]
- Nimmerjahn, A.; Kirchhoff, F.; Helmchen, F. Resting microglial cells are highly dynamic surveillants of brain parenchyma in vivo. Science 2005, 308, 1314–1318. [Google Scholar] [CrossRef] [Green Version]
- Parkhurst, C.N.; Yang, G.; Ninan, I.; Savas, J.N.; Yates, J.R., 3rd; Lafaille, J.J.; Hempstead, B.L.; Littman, D.R.; Gan, W.B. Microglia promote learning-dependent synapse formation through brain-derived neurotrophic factor. Cell 2013, 155, 1596–1609. [Google Scholar] [CrossRef] [Green Version]
- Schafer, D.P.; Lehrman, E.K.; Stevens, B. The “quad-partite” synapse: Microglia-synapse interactions in the developing and mature CNS. Glia 2013, 61, 24–36. [Google Scholar] [CrossRef] [Green Version]
- Shatz, C.J. Impulse activity and the patterning of connections during CNS development. Neuron 1990, 5, 745–756. [Google Scholar] [CrossRef]
- Le Belle, J.E.; Sperry, J.; Ngo, A.; Ghochani, Y.; Laks, D.R.; Lopez-Aranda, M.; Silva, A.J.; Kornblum, H.I. Maternal inflammation contributes to brain overgrowth and autism-associated behaviors through altered redox signaling in stem and progenitor cells. Stem Cell Rep. 2014, 3, 725–734. [Google Scholar] [CrossRef] [Green Version]
- Rose, S.; Melnyk, S.; Pavliv, O.; Bai, S.; Nick, T.G.; Frye, R.E.; James, S.J. Evidence of oxidative damage and inflammation associated with low glutathione redox status in the autism brain. Transl. Psychiatry 2012, 2, e134. [Google Scholar] [CrossRef] [Green Version]
- Steullet, P.; Cabungcal, J.H.; Coyle, J.; Didriksen, M.; Gill, K.; Grace, A.A.; Hensch, T.K.; LaMantia, A.S.; Lindemann, L.; Maynard, T.M.; et al. Oxidative stress-driven parvalbumin interneuron impairment as a common mechanism in models of schizophrenia. Mol. Psychiatry 2017, 22, 936–943. [Google Scholar] [CrossRef]
- Markina, N.V.; Salimov, R.M.; Perepelkina, O.V.; Maiskii, A.I.; Poletaeva, I.I. The correlation between brain weight and behavior changes in response to ethanol administration in laboratory mice. Genetika 2003, 39, 826–830. [Google Scholar]
- Markina, N.V.; Salimov, R.M.; Poletaeva, I.I. Behavioral screening of two mouse lines selected for different brain weight. Prog. Neuropsychopharmacol. Biol. Psychiatry 2001, 25, 1083–1109. [Google Scholar] [CrossRef]
- Diaz, J.L. Brain weights correlate with behavioral parameters in individual inbred mice housed in a common and enriched environment. Behav. Neural Biol. 1988, 50, 164–183. [Google Scholar] [CrossRef]
- Davis, E.J.; Foster, T.D.; Thomas, W.E. Cellular forms and functions of brain microglia. Brain Res. Bull. 1994, 34, 73–78. [Google Scholar] [CrossRef]
- Domercq, M.; Vazquez-Villoldo, N.; Matute, C. Neurotransmitter signaling in the pathophysiology of microglia. Front. Cell. Neurosci. 2013, 7, 49. [Google Scholar] [CrossRef] [Green Version]
- Fernandez-Arjona, M.D.M.; Grondona, J.M.; Granados-Duran, P.; Fernandez-Llebrez, P.; Lopez-Avalos, M.D. Microglia Morphological Categorization in a Rat Model of Neuroinflammation by Hierarchical Cluster and Principal Components Analysis. Front. Cell. Neurosci. 2017, 11, 235. [Google Scholar] [CrossRef] [Green Version]
- Miyamoto, A.; Wake, H.; Moorhouse, A.J.; Nabekura, J. Microglia and synapse interactions: Fine tuning neural circuits and candidate molecules. Front. Cell. Neurosci. 2013, 7, 70. [Google Scholar] [CrossRef] [PubMed] [Green Version]
- Olah, M.; Biber, K.; Vinet, J.; Boddeke, H.W. Microglia phenotype diversity. CNS Neurol. Disord. Drug Targets 2011, 10, 108–118. [Google Scholar] [CrossRef] [PubMed] [Green Version]
- Baron, R.; Babcock, A.A.; Nemirovsky, A.; Finsen, B.; Monsonego, A. Accelerated microglial pathology is associated with Abeta plaques in mouse models of Alzheimer’s disease. Aging Cell 2014, 13, 584–595. [Google Scholar] [CrossRef] [PubMed]
- Careaga, M.; Schwartzer, J.; Ashwood, P. Inflammatory profiles in the BTBR mouse: How relevant are they to autism spectrum disorders? Brain Behav. Immun. 2015, 43, 11–16. [Google Scholar] [CrossRef] [Green Version]
- Onore, C.E.; Careaga, M.; Babineau, B.A.; Schwartzer, J.J.; Berman, R.F.; Ashwood, P. Inflammatory macrophage phenotype in BTBR T+tf/J mice. Front. Neurosci. 2013, 7, 158. [Google Scholar] [CrossRef] [Green Version]
- Chez, M.G.; Chang, M.; Krasne, V.; Coughlan, C.; Kominsky, M.; Schwartz, A. Frequency of epileptiform EEG abnormalities in a sequential screening of autistic patients with no known clinical epilepsy from 1996 to 2005. Epilepsy Behav. 2006, 8, 267–271. [Google Scholar] [CrossRef]
- Swatzyna, R.J.; Boutros, N.N.; Genovese, A.C.; MacInerney, E.K.; Roark, A.J.; Kozlowski, G.P. Electroencephalogram (EEG) for children with autism spectrum disorder: Evidential considerations for routine screening. Eur. Child Adolesc. Psychiatry 2019, 28, 615–624. [Google Scholar] [CrossRef]
- Gurau, O.; Bosl, W.J.; Newton, C.R. How Useful Is Electroencephalography in the Diagnosis of Autism Spectrum Disorders and the Delineation of Subtypes: A Systematic Review. Front. Psychiatry 2017, 8, 121. [Google Scholar] [CrossRef] [Green Version]
- Sheikhani, A.; Behnam, H.; Mohammadi, M.R.; Noroozian, M.; Mohammadi, M. Detection of abnormalities for diagnosing of children with autism disorders using of quantitative electroencephalography analysis. J. Med. Syst. 2012, 36, 957–963. [Google Scholar] [CrossRef]
- Bosl, W.J.; Tager-Flusberg, H.; Nelson, C.A. EEG Analytics for Early Detection of Autism Spectrum Disorder: A data-driven approach. Sci. Rep. 2018, 8, 6828. [Google Scholar] [CrossRef]
- Bachiller, S.; Jimenez-Ferrer, I.; Paulus, A.; Yang, Y.; Swanberg, M.; Deierborg, T.; Boza-Serrano, A. Microglia in Neurological Diseases: A Road Map to Brain-Disease Dependent-Inflammatory Response. Front. Cell. Neurosci. 2018, 12, 488. [Google Scholar] [CrossRef] [Green Version]
- Kummer, M.P.; Hermes, M.; Delekarte, A.; Hammerschmidt, T.; Kumar, S.; Terwel, D.; Walter, J.; Pape, H.C.; Konig, S.; Roeber, S.; et al. Nitration of tyrosine 10 critically enhances amyloid beta aggregation and plaque formation. Neuron 2011, 71, 833–844. [Google Scholar] [CrossRef] [Green Version]
- Franzolin, G.; Tamagnone, L. Semaphorin Signaling in Cancer-Associated Inflammation. Int. J. Mol. Sci. 2019, 20, 377. [Google Scholar] [CrossRef] [Green Version]
- Roy, S.; Bag, A.K.; Singh, R.K.; Talmadge, J.E.; Batra, S.K.; Datta, K. Multifaceted Role of Neuropilins in the Immune System: Potential Targets for Immunotherapy. Front. Immunol. 2017, 8, 1228. [Google Scholar] [CrossRef] [Green Version]
- Schellenburg, S.; Schulz, A.; Poitz, D.M.; Muders, M.H. Role of neuropilin-2 in the immune system. Mol. Immunol. 2017, 90, 239–244. [Google Scholar] [CrossRef]
- Dixon, J.T.; Gozal, E.; Roberts, A.M. Platelet-mediated vascular dysfunction during acute lung injury. Arch. Physiol. Biochem. 2012, 118, 72–82. [Google Scholar] [CrossRef]
- Ho-Tin-Noe, B.; Demers, M.; Wagner, D.D. How platelets safeguard vascular integrity. J. Thromb. Haemost. 2011, 9 (Suppl. 1), 56–65. [Google Scholar] [CrossRef]
- Huggenberger, R.; Siddiqui, S.S.; Brander, D.; Ullmann, S.; Zimmermann, K.; Antsiferova, M.; Werner, S.; Alitalo, K.; Detmar, M. An important role of lymphatic vessel activation in limiting acute inflammation. Blood 2011, 117, 4667–4678. [Google Scholar] [CrossRef] [Green Version]
- Kajiya, K.; Detmar, M. An important role of lymphatic vessels in the control of UVB-induced edema formation and inflammation. J. Investig. Dermatol. 2006, 126, 919–921. [Google Scholar] [CrossRef] [Green Version]
- Kumar, P.; Shen, Q.; Pivetti, C.D.; Lee, E.S.; Wu, M.H.; Yuan, S.Y. Molecular mechanisms of endothelial hyperpermeability: Implications in inflammation. Expert Rev. Mol. Med. 2009, 11, e19. [Google Scholar] [CrossRef] [Green Version]
- Kunstfeld, R.; Hirakawa, S.; Hong, Y.K.; Schacht, V.; Lange-Asschenfeldt, B.; Velasco, P.; Lin, C.; Fiebiger, E.; Wei, X.; Wu, Y.; et al. Induction of cutaneous delayed-type hypersensitivity reactions in VEGF-A transgenic mice results in chronic skin inflammation associated with persistent lymphatic hyperplasia. Blood 2004, 104, 1048–1057. [Google Scholar] [CrossRef] [Green Version]
- Mucka, P.; Levonyak, N.; Geretti, E.; Zwaans, B.M.M.; Li, X.; Adini, I.; Klagsbrun, M.; Adam, R.M.; Bielenberg, D.R. Inflammation and Lymphedema Are Exacerbated and Prolonged by Neuropilin 2 Deficiency. Am. J. Pathol. 2016, 186, 2803–2812. [Google Scholar] [CrossRef] [Green Version]
- Ed Rainger, G.; Chimen, M.; Harrison, M.J.; Yates, C.M.; Harrison, P.; Watson, S.P.; Lordkipanidze, M.; Nash, G.B. The role of platelets in the recruitment of leukocytes during vascular disease. Platelets 2015, 26, 507–520. [Google Scholar] [CrossRef] [Green Version]
- Adams, R.A.; Schachtrup, C.; Davalos, D.; Tsigelny, I.; Akassoglou, K. Fibrinogen signal transduction as a mediator and therapeutic target in inflammation: Lessons from multiple sclerosis. Curr. Med. Chem. 2007, 14, 2925–2936. [Google Scholar] [CrossRef] [PubMed]
- Ahn, H.J.; Zamolodchikov, D.; Cortes-Canteli, M.; Norris, E.H.; Glickman, J.F.; Strickland, S. Alzheimer’s disease peptide beta-amyloid interacts with fibrinogen and induces its oligomerization. Proc. Natl. Acad. Sci. USA 2010, 107, 21812–21817. [Google Scholar] [CrossRef] [PubMed] [Green Version]
- Cortes-Canteli, M.; Paul, J.; Norris, E.H.; Bronstein, R.; Ahn, H.J.; Zamolodchikov, D.; Bhuvanendran, S.; Fenz, K.M.; Strickland, S. Fibrinogen and beta-amyloid association alters thrombosis and fibrinolysis: A possible contributing factor to Alzheimer’s disease. Neuron 2010, 66, 695–709. [Google Scholar] [CrossRef] [PubMed] [Green Version]
- Ryu, J.K.; McLarnon, J.G. A leaky blood-brain barrier, fibrinogen infiltration and microglial reactivity in inflamed Alzheimer’s disease brain. J. Cell. Mol. Med. 2009, 13, 2911–2925. [Google Scholar] [CrossRef] [PubMed] [Green Version]
- Plant, T.; Eamsamarng, S.; Sanchez-Garcia, M.A.; Reyes, L.; Renshaw, S.A.; Coelho, P.; Mirchandani, A.S.; Morgan, J.M.; Ellett, F.E.; Morrison, T.; et al. Semaphorin 3F signaling actively retains neutrophils at sites of inflammation. J. Clin. Investig. 2020, 130, 3221–3237. [Google Scholar] [CrossRef]
- Stokes, K.Y.; Granger, D.N. Platelets: A critical link between inflammation and microvascular dysfunction. J. Physiol. 2012, 590, 1023–1034. [Google Scholar] [CrossRef]
- Hanby, H.A.; Bao, J.; Noh, J.Y.; Jarocha, D.; Poncz, M.; Weiss, M.J.; Marks, M.S. Platelet dense granules begin to selectively accumulate mepacrine during proplatelet formation. Blood Adv. 2017, 1, 1478–1490. [Google Scholar] [CrossRef] [Green Version]
- Ciabattoni, G.; Porreca, E.; Di Febbo, C.; Di Iorio, A.; Paganelli, R.; Bucciarelli, T.; Pescara, L.; Del Re, L.; Giusti, C.; Falco, A.; et al. Determinants of platelet activation in Alzheimer’s disease. Neurobiol. Aging 2007, 28, 336–342. [Google Scholar] [CrossRef]
- Sevush, S.; Jy, W.; Horstman, L.L.; Mao, W.W.; Kolodny, L.; Ahn, Y.S. Platelet activation in Alzheimer disease. Arch. Neurol. 1998, 55, 530–536. [Google Scholar] [CrossRef]
- Yao, Y.; Walsh, W.J.; McGinnis, W.R.; Pratico, D. Altered vascular phenotype in autism: Correlation with oxidative stress. Arch. Neurol. 2006, 63, 1161–1164. [Google Scholar] [CrossRef] [Green Version]
- Bijl, N.; Thys, C.; Wittevrongel, C.; De la Marche, W.; Devriendt, K.; Peeters, H.; Van Geet, C.; Freson, K. Platelet studies in autism spectrum disorder patients and first-degree relatives. Mol. Autism 2015, 6, 57. [Google Scholar] [CrossRef] [Green Version]
- Nakayama, H.; Bruneau, S.; Kochupurakkal, N.; Coma, S.; Briscoe, D.M.; Klagsbrun, M. Regulation of mTOR Signaling by Semaphorin 3F-Neuropilin 2 Interactions In Vitro and In Vivo. Sci. Rep. 2015, 5, 11789. [Google Scholar] [CrossRef] [Green Version]
- Wannemacher, K.M.; Wang, L.; Zhu, L.; Brass, L.F. The role of semaphorins and their receptors in platelets: Lessons learned from neuronal and immune synapses. Platelets 2011, 22, 461–465. [Google Scholar] [CrossRef]
- Jaiswal, P.; Mohanakumar, K.P.; Rajamma, U. Serotonin mediated immunoregulation and neural functions: Complicity in the aetiology of autism spectrum disorders. Neurosci. Biobehav. Rev. 2015, 55, 413–431. [Google Scholar] [CrossRef]
- Humphrey, J.H.; Jaques, R. Liberation of histamine and serotonin from platelets by antigen-antibody reactions in vitro. J. Physiol. 1953, 119, 43P. [Google Scholar]
- Muller, C.L.; Anacker, A.M.J.; Veenstra-VanderWeele, J. The serotonin system in autism spectrum disorder: From biomarker to animal models. Neuroscience 2016, 321, 24–41. [Google Scholar] [CrossRef] [Green Version]
- Packham, M.A.; Guccione, M.A.; Greenberg, J.P.; Kinlough-Rathbone, R.L.; Mustard, J.F. Release of 14C-serotonin during initial platelet changes induced by thrombin, collagen, or A23187. Blood 1977, 50, 915–926. [Google Scholar] [CrossRef] [Green Version]
- Lossinsky, A.S.; Wisniewski, H.M.; Dambska, M.; Mossakowski, M.J. Ultrastructural studies of PECAM-1/CD31 expression in the developing mouse blood-brain barrier with the application of a pre-embedding technique. Folia Neuropathol. 1997, 35, 163–170. [Google Scholar]
- Suzuki, H.; Abe, K.; Tojo, S.; Kimura, K.; Mizugaki, M.; Itoyama, Y. A change of P-selectin immunoreactivity in rat brain after transient and permanent middle cerebral artery occlusion. Neurol. Res. 1998, 20, 463–469. [Google Scholar] [CrossRef]
- Onore, C.; Careaga, M.; Ashwood, P. The role of immune dysfunction in the pathophysiology of autism. Brain Behav. Immun. 2012, 26, 383–392. [Google Scholar] [CrossRef] [Green Version]
- Duerschmied, D.; Suidan, G.L.; Demers, M.; Herr, N.; Carbo, C.; Brill, A.; Cifuni, S.M.; Mauler, M.; Cicko, S.; Bader, M.; et al. Platelet serotonin promotes the recruitment of neutrophils to sites of acute inflammation in mice. Blood 2013, 121, 1008–1015. [Google Scholar] [CrossRef] [Green Version]
- Tanaka, M.; Sato, A.; Kasai, S.; Hagino, Y.; Kotajima-Murakami, H.; Kashii, H.; Takamatsu, Y.; Nishito, Y.; Inagaki, M.; Mizuguchi, M.; et al. Brain hyperserotonemia causes autism-relevant social deficits in mice. Mol. Autism 2018, 9, 60. [Google Scholar] [CrossRef]
- Chakraborti, B.; Verma, D.; Guhathakurta, S.; Jaiswal, P.; Singh, A.S.; Sinha, S.; Ghosh, S.; Mukhopadhyay, K.; Mohanakumar, K.P.; Rajamma, U. Gender-Specific Effect of 5-HT and 5-HIAA on Threshold Level of Behavioral Symptoms and Sex-Bias in Prevalence of Autism Spectrum Disorder. Front. Neurosci. 2019, 13, 1375. [Google Scholar] [CrossRef]
- Gabriele, S.; Sacco, R.; Persico, A.M. Blood serotonin levels in autism spectrum disorder: A systematic review and meta-analysis. Eur. Neuropsychopharmacol. 2014, 24, 919–929. [Google Scholar] [CrossRef]
- Ledo, J.H.; Azevedo, E.P.; Beckman, D.; Ribeiro, F.C.; Santos, L.E.; Razolli, D.S.; Kincheski, G.C.; Melo, H.M.; Bellio, M.; Teixeira, A.L.; et al. Cross Talk Between Brain Innate Immunity and Serotonin Signaling Underlies Depressive-Like Behavior Induced by Alzheimer’s Amyloid-beta Oligomers in Mice. J. Neurosci. 2016, 36, 12106–12116. [Google Scholar] [CrossRef]
- Su, F.; Yi, H.; Xu, L.; Zhang, Z. Fluoxetine and S-citalopram inhibit M1 activation and promote M2 activation of microglia in vitro. Neuroscience 2015, 294, 60–68. [Google Scholar] [CrossRef]
- Hoshiko, M.; Arnoux, I.; Avignone, E.; Yamamoto, N.; Audinat, E. Deficiency of the microglial receptor CX3CR1 impairs postnatal functional development of thalamocortical synapses in the barrel cortex. J. Neurosci. 2012, 32, 15106–15111. [Google Scholar] [CrossRef]
- Nagarajan, N.; Jones, B.W.; West, P.J.; Marc, R.E.; Capecchi, M.R. Corticostriatal circuit defects in Hoxb8 mutant mice. Mol. Psychiatry 2018, 23, 1868–1877. [Google Scholar] [CrossRef]
- Liebner, S.; Plate, K.H. Differentiation of the brain vasculature: The answer came blowing by the Wnt. J. Angiogenes Res. 2010, 2, 1. [Google Scholar] [CrossRef] [Green Version]
- Obermeier, B.; Daneman, R.; Ransohoff, R.M. Development, maintenance and disruption of the blood-brain barrier. Nat. Med. 2013, 19, 1584–1596. [Google Scholar] [CrossRef]
- Langen, U.H.; Ayloo, S.; Gu, C. Development and Cell Biology of the Blood-Brain Barrier. Annu. Rev. Cell Dev. Biol. 2019, 35, 591–613. [Google Scholar] [CrossRef] [PubMed] [Green Version]
- Mirakaj, V.; Rosenberger, P. Immunomodulatory Functions of Neuronal Guidance Proteins. Trends Immunol. 2017, 38, 444–456. [Google Scholar] [CrossRef] [PubMed]
- Staton, C.A. Class 3 semaphorins and their receptors in physiological and pathological angiogenesis. Biochem. Soc. Trans. 2011, 39, 1565–1570. [Google Scholar] [CrossRef] [PubMed] [Green Version]
- Takashima, S.; Kitakaze, M.; Asakura, M.; Asanuma, H.; Sanada, S.; Tashiro, F.; Niwa, H.; Miyazaki, J.; Hirota, S.; Kitamura, Y.; et al. Targeting of both mouse neuropilin-1 and neuropilin-2 genes severely impairs developmental yolk sac and embryonic angiogenesis. Proc. Natl. Acad. Sci. USA 2002, 99, 3657–3662. [Google Scholar] [CrossRef] [PubMed] [Green Version]
- Kumari, S.; Dash, D. Regulation of beta-catenin stabilization in human platelets. Biochimie 2013, 95, 1252–1257. [Google Scholar] [CrossRef]
- Blair, P.; Flaumenhaft, R. Platelet alpha-granules: Basic biology and clinical correlates. Blood Rev. 2009, 23, 177–189. [Google Scholar] [CrossRef] [Green Version]
- Padmakumar, M.; Van Raes, E.; Van Geet, C.; Freson, K. Blood platelet research in autism spectrum disorders: In search of biomarkers. Res. Pract. Thromb. Haemost. 2019, 3, 566–577. [Google Scholar] [CrossRef] [Green Version]
- Sharda, A.; Flaumenhaft, R. The life cycle of platelet granules. F1000Research 2018, 7, 236. [Google Scholar] [CrossRef]
- Yang, J.; Houk, B.; Shah, J.; Hauser, K.F.; Luo, Y.; Smith, G.; Schauwecker, E.; Barnes, G.N. Genetic background regulates semaphorin gene expression and epileptogenesis in mouse brain after kainic acid status epilepticus. Neuroscience 2005, 131, 853–869. [Google Scholar] [CrossRef]
- Borquez, D.A.; Urrutia, P.J.; Wilson, C.; van Zundert, B.; Nunez, M.T.; Gonzalez-Billault, C. Dissecting the role of redox signaling in neuronal development. J. Neurochem. 2016, 137, 506–517. [Google Scholar] [CrossRef] [Green Version]
- Dazzo, E.; Rehberg, K.; Michelucci, R.; Passarelli, D.; Boniver, C.; Vianello Dri, V.; Striano, P.; Striano, S.; Pasterkamp, R.J.; Nobile, C. Mutations in MICAL-1cause autosomal-dominant lateral temporal epilepsy. Ann. Neurol. 2018, 83, 483–493. [Google Scholar] [CrossRef]
- Vanoni, M.A.; Vitali, T.; Zucchini, D. MICAL, the flavoenzyme participating in cytoskeleton dynamics. Int. J. Mol. Sci. 2013, 14, 6920–6959. [Google Scholar] [CrossRef] [Green Version]
- Nakayama, H.; Huang, L.; Kelly, R.P.; Oudenaarden, C.R.; Dagher, A.; Hofmann, N.A.; Moses, M.A.; Bischoff, J.; Klagsbrun, M. Infantile hemangioma-derived stem cells and endothelial cells are inhibited by class 3 semaphorins. Biochem. Biophys. Res. Commun. 2015, 464, 126–132. [Google Scholar] [CrossRef]
- Yufune, S.; Satoh, Y.; Takamatsu, I.; Ohta, H.; Kobayashi, Y.; Takaenoki, Y.; Pages, G.; Pouyssegur, J.; Endo, S.; Kazama, T. Transient Blockade of ERK Phosphorylation in the Critical Period Causes Autistic Phenotypes as an Adult in Mice. Sci. Rep. 2015, 5, 10252. [Google Scholar] [CrossRef] [Green Version]
- Barlati, S.; Minelli, A.; Ceraso, A.; Nibbio, G.; Carvalho Silva, R.; Deste, G.; Turrina, C.; Vita, A. Social Cognition in a Research Domain Criteria Perspective: A Bridge Between Schizophrenia and Autism Spectra Disorders. Front. Psychiatry 2020, 11, 806. [Google Scholar] [CrossRef]
- Goldwaser, E.L.; Swanson, R.L., 2nd; Arroyo, E.J.; Venkataraman, V.; Kosciuk, M.C.; Nagele, R.G.; Hong, L.E.; Acharya, N.K. A Preliminary Report: The Hippocampus and Surrounding Temporal Cortex of Patients with Schizophrenia Have Impaired Blood-Brain Barrier. Front. Hum. Neurosci. 2022, 16, 836980. [Google Scholar] [CrossRef]
- Cheng, Y.; Wang, T.; Zhang, T.; Yi, S.; Zhao, S.; Li, N.; Yang, Y.; Zhang, F.; Xu, L.; Shan, B.; et al. Increased blood-brain barrier permeability of the thalamus and the correlation with symptom severity and brain volume alterations in schizophrenia patients. Biol. Psychiatry Cogn. Neurosci. Neuroimaging 2022, in press. [Google Scholar] [CrossRef]
- Hoang, D.; Xu, Y.; Lutz, O.; Bannai, D.; Zeng, V.; Bishop, J.R.; Keshavan, M.; Lizano, P. Inflammatory Subtypes in Antipsychotic-Naive First-Episode Schizophrenia are Associated with Altered Brain Morphology and Topological Organization. Brain Behav. Immun. 2022, 100, 297–308. [Google Scholar] [CrossRef]
- Casas, B.S.; Vitoria, G.; Prieto, C.P.; Casas, M.; Chacon, C.; Uhrig, M.; Ezquer, F.; Ezquer, M.; Rehen, S.K.; Palma, V. Schizophrenia-derived hiPSC brain microvascular endothelial-like cells show impairments in angiogenesis and blood-brain barrier function. Mol. Psychiatry 2022. [Google Scholar] [CrossRef]
- Cong, X.; Kong, W. Endothelial tight junctions and their regulatory signaling pathways in vascular homeostasis and disease. Cell. Signal. 2020, 66, 109485. [Google Scholar] [CrossRef]


| Number | PCQ (N) | Vineland (N) |
|---|---|---|
| Group 1 (Normal CMA) | 47 | 30 |
| Group 2 (CNVs) | 90 | 87 |
| total | 137 | 129 |
| Behavior | Circuit | Group | Number | Mean | Std. Error | p | Brain Region | Related Genes |
|---|---|---|---|---|---|---|---|---|
| PCQ12- Self-stimulatory behavior | Inter-group | 1 | 47 | 2.79 | 0.158 | 0.037 | ||
| 2 | 90 | 2.39 | 0.107 | |||||
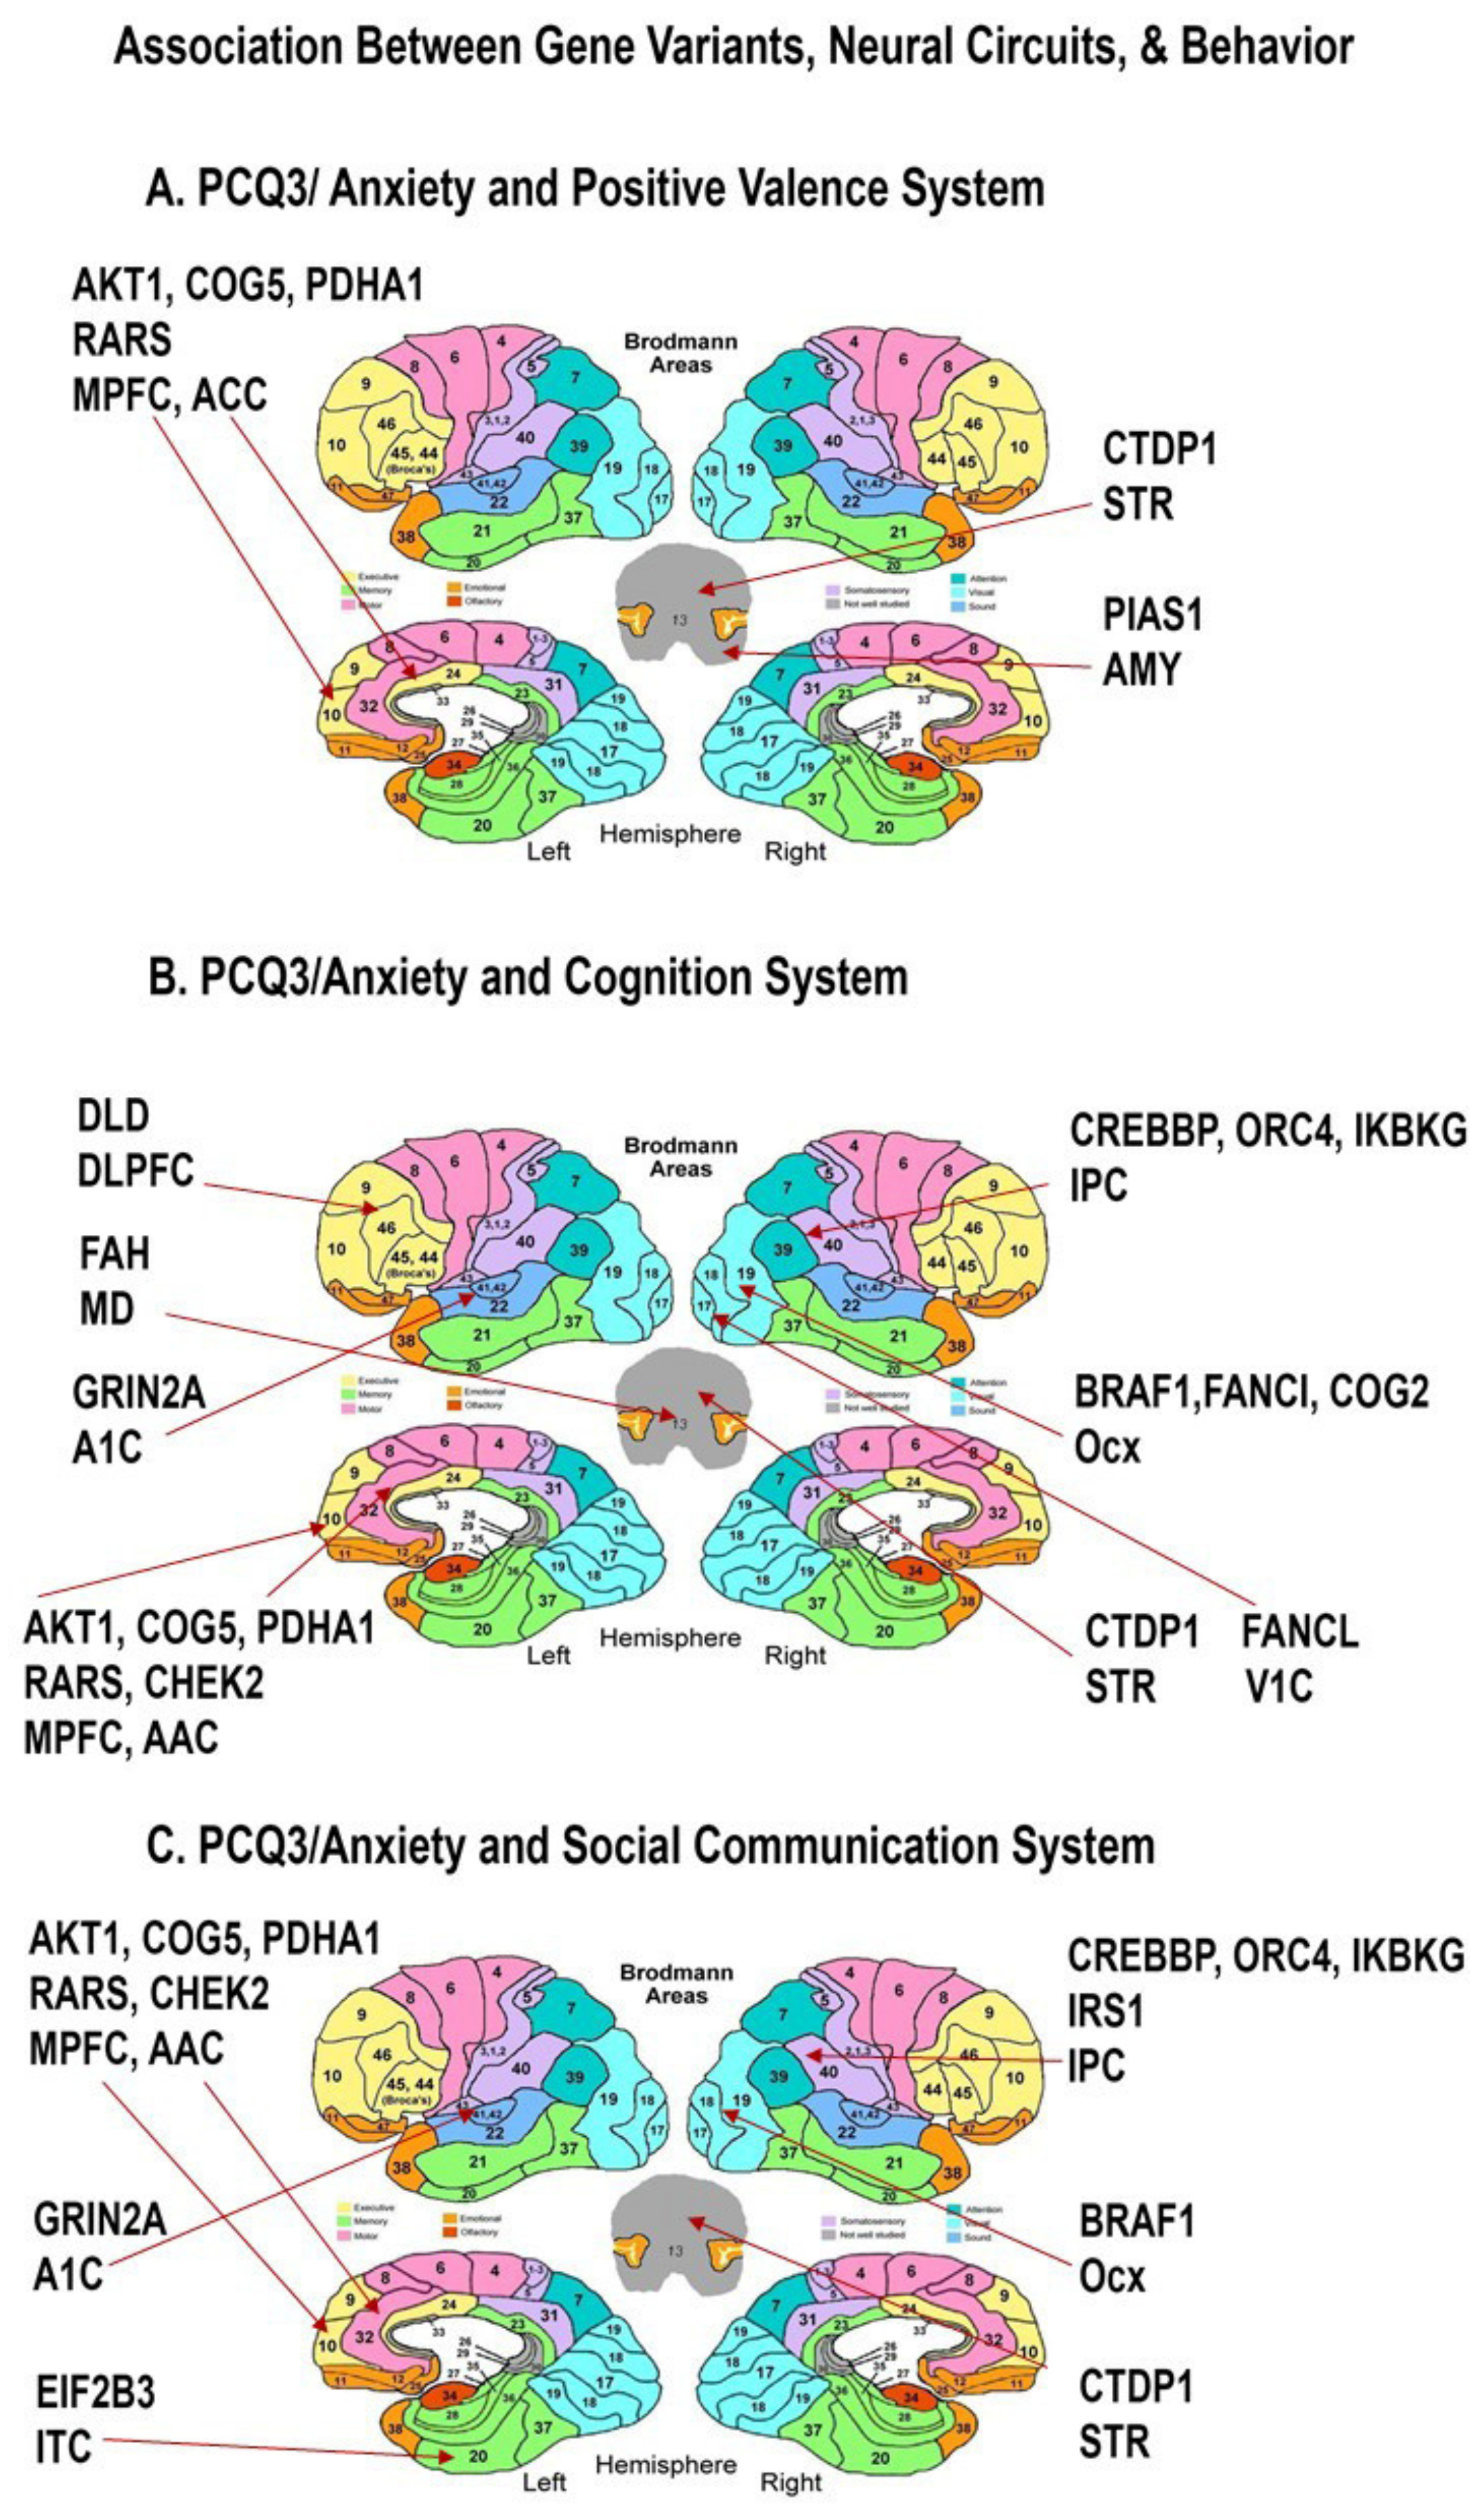
| PCQ3-Anxiety | Positive Valence system | 1 | 129 | 2.57 | 0.090 | 0.006 | MPFC, ACC, Amy, STR | COG5, AKT1, PDHA1, CHEK2 *, RARS *; PIAS1 *; CTDP1 |
| 2 | 13 | 2.00 | 0.160 | |||||
| Cognition system | 1 | 121 | 2.59 | 0.091 | 0.029 | ACC, Ocx, DLPFC, MD, A1C, IPC, STR, V1C, | COG5, AKT1, PDHA1, CHEK2 *, RARS *; BRAF *, FANCI *, COG2 *; OLD *; FAN, GRIN2A; CREBBP, ORC4, IKBKG; CTDP1; FANCL; | |
| 2 | 21 | 2.10 | 0.194 | |||||
| PCQ3-Anxiety | Social communication system | 1 | 124 | 2.58 | 0.090 | 0.042 | IPC, ACC, Ocx, ITC, V1C, A1C, STR | COG5, AKT1, PDHA1, CHEK2 *, RARS *; CREBBP, ORC4, IKBKG, IRS1; BRAF *; EIF2B3; FANCL; GRIN2A; CTDP1; |
| 2 | 22 | 2.14 | 0.190 | |||||
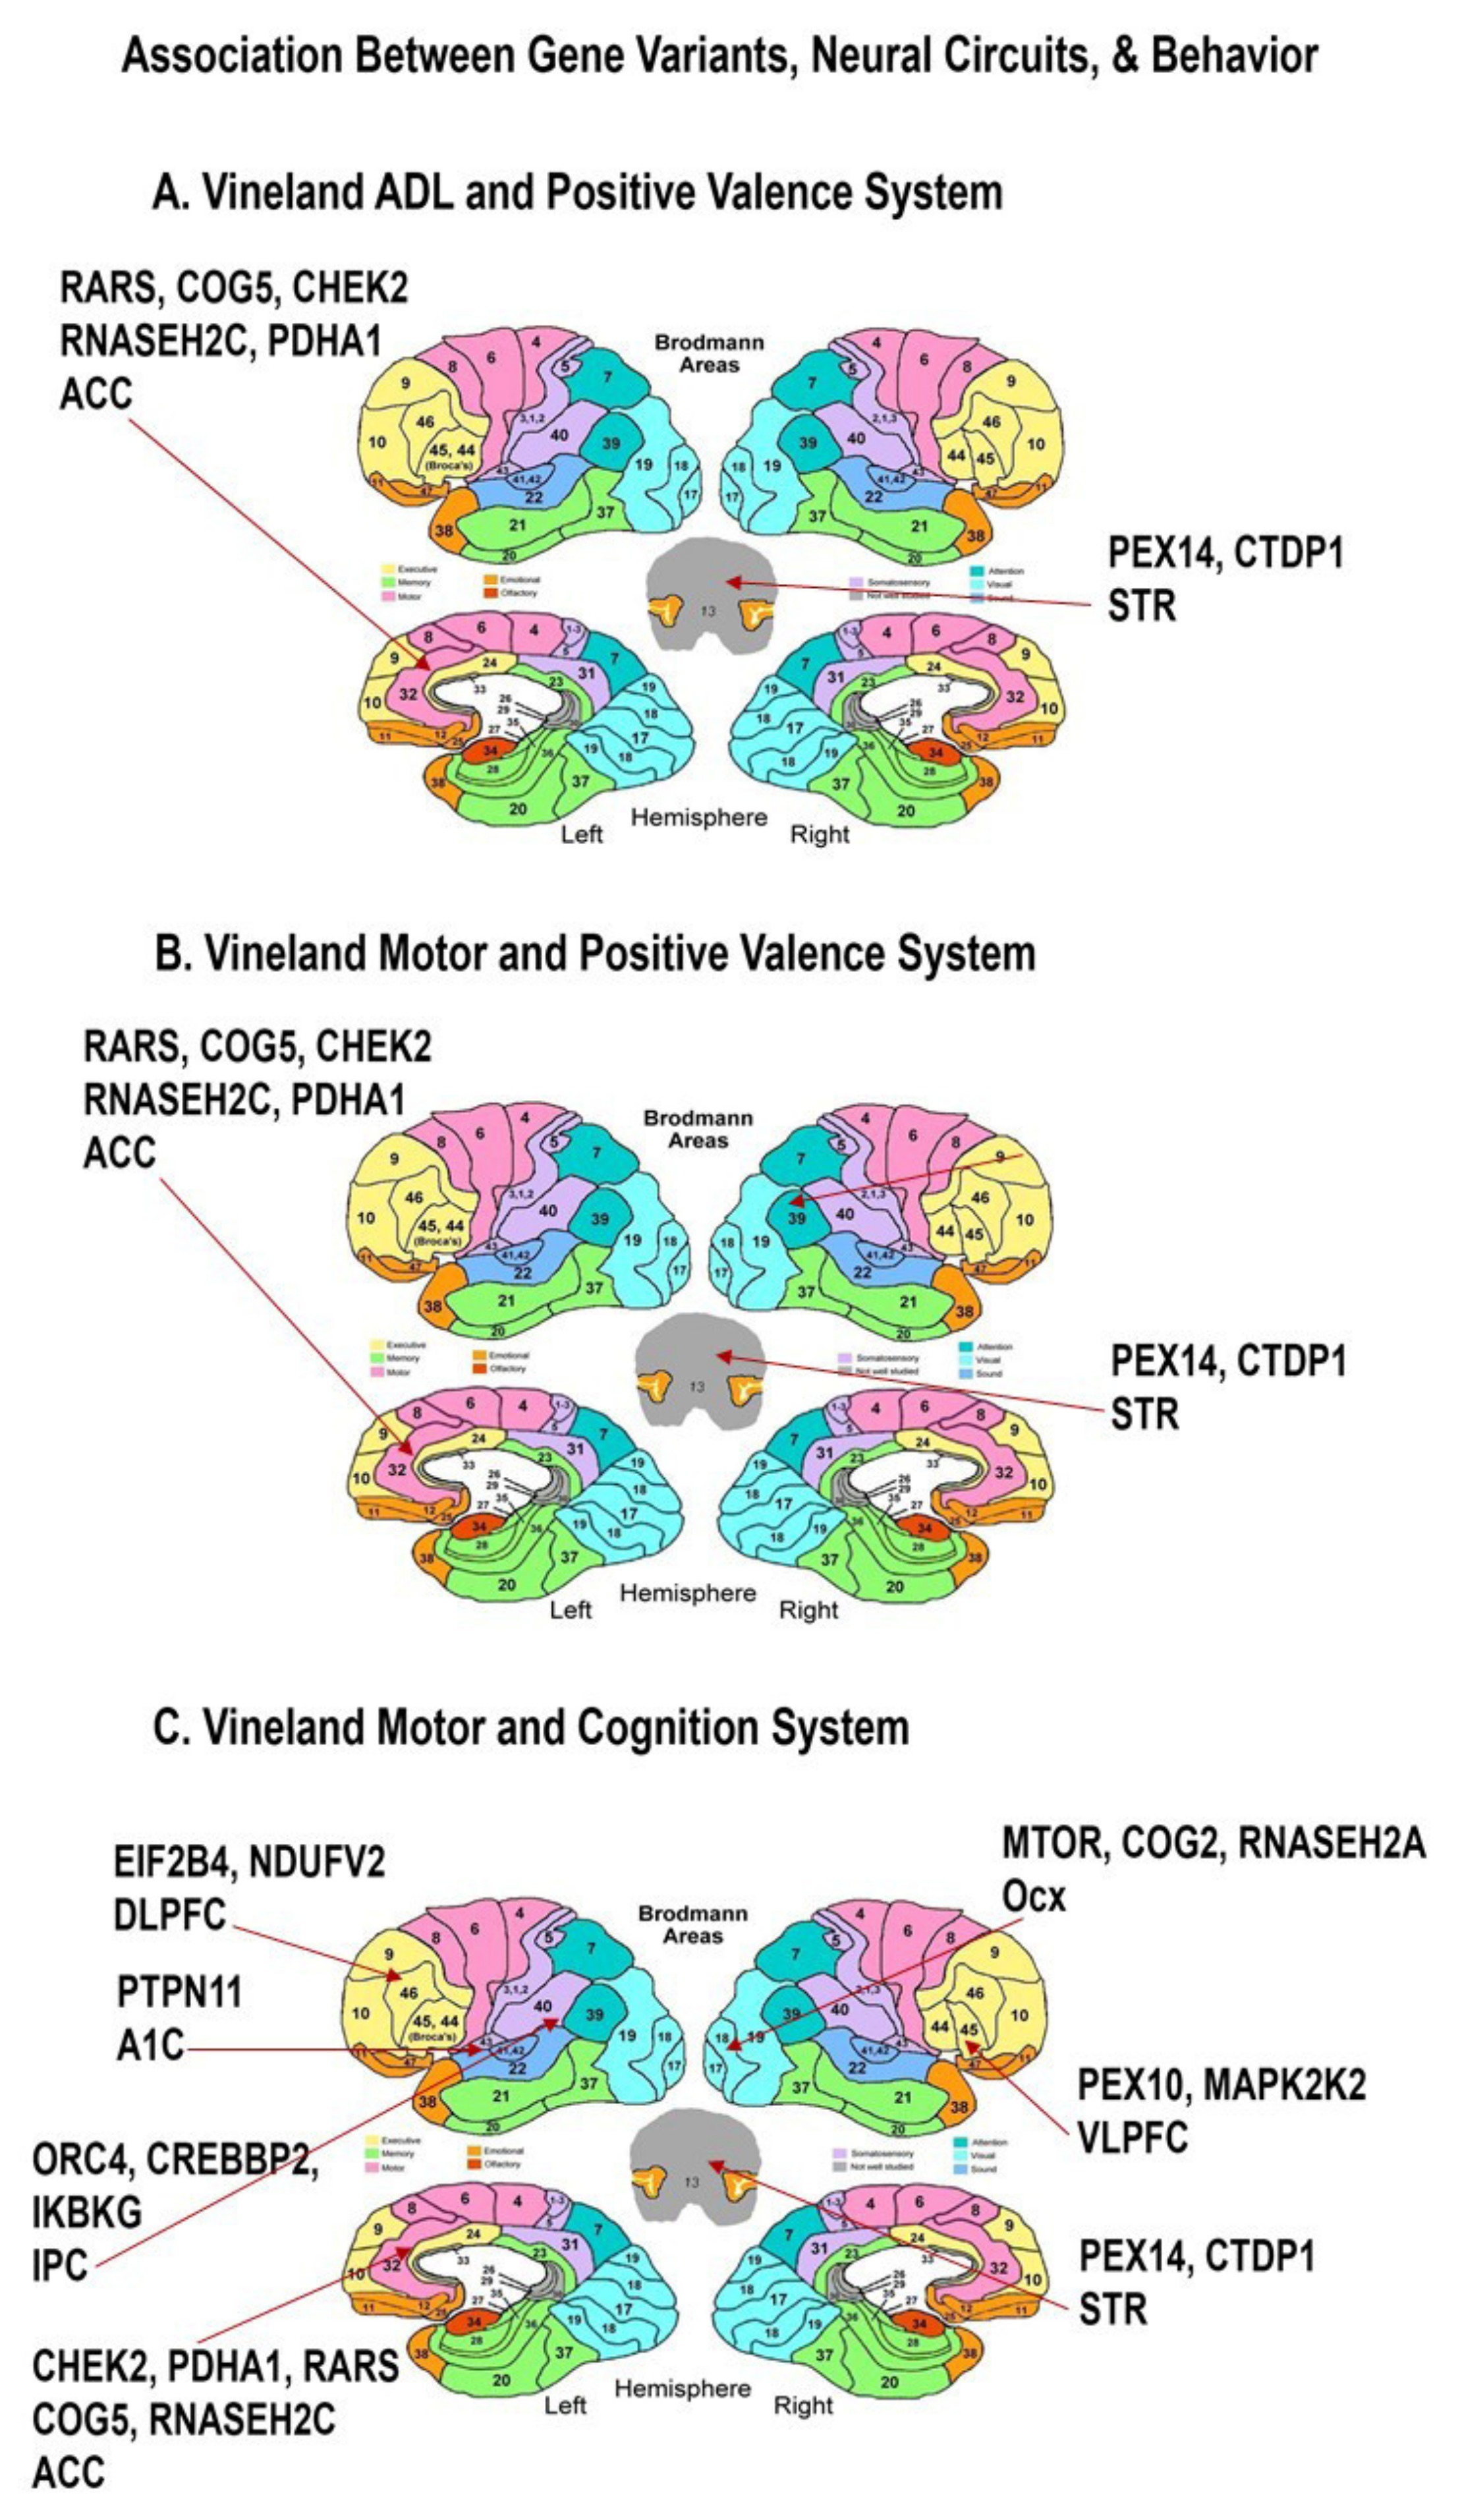
| Vineland ADL(Daily Living Skill) | Positive Valence system | 1 | 111 | 68.26 | 1.110 | 0.028 | STR, ACC, | PEX14, CTDP1, RARS *; RARS *, COG5, CHEK2 *, RNASEH2C, PDHA1; |
| 2 | 6 | 76.00 | 2.582 | |||||
| Vineland Motor | Positive Valence system | 1 | 111 | 74.71 | 1.183 | 0.030 | STR, ACC, | PEX14, CTDP1, RARS *; RARS *, COG5, CHEK2 *, RNASEH2C, PDHA1; |
| 2 | 6 | 86.00 | 3.044 | |||||
| Vineland Motor | Cognition system | 1 | 104 | 74.53 | 1.244 | 0.025 | Ocx, VLPFC, STR, DLPFC, A1C, ACC, IPC | MTOR *, COG2 *, RNASEH2A *; PEX10, MAP2K2; FEX14, CTDP1; EIF2B4, NDUFV2 *; PTPN11; CHEK2 *, PDHA1, RARS *, COG5, RNASEH2C; ORC4, CREBBP, IKBKG; |
| 2 | 13 | 81.38 | 2.521 |
| Behavior | Circuit | Brain Region | Related Genes | Panther Pathways Analyses |
|---|---|---|---|---|
| PCQ3-Anxiety | Positive Valence system | MPFC, ACC, Amy, STR | COG5, AKT1, PDHA1, CHEK2 *, RARS *; PIAS1 *; CTDP1 | PI3K/Akt/mTOR-Vit D3 signaling (p = 0.00009) |
| Lipid metabolism pathway (p = 0.0001) | ||||
| PCQ3-Anxiety | Cognition system | ACC, Ocx, DLPFC, MD, A1C, IPC, STR, V1C | COG5, AKT1, PDHA1, CHEK2 *, RARS * BRAF *, FANCI *, COG2 *; OLD *; FAN, GRIN2A; CREBBP, ORC4, IKBKG; CTDP1; FANCL; | Estrogen signaling (p = 0.000003) |
| DNA IR-damage and cellular response via ATR (p = 0.0001) | ||||
| Social communication system | IPC, ACC, Ocx, ITC, V1C, A1C, STR | COG5, AKT1, PDHA1, CHEK2 *, RARS *; CREBBP, ORC4, IKBKG, IRS1; BRAF *; EIF2B3; FANCL; GRIN2A; CTDP1; | Estrogen signaling (p = 0.000005) | |
| Leptin signaling (p = 0.0002) | ||||
| Vineland ADL(Daily Living Skill) | Positive Valence system | STR, ACC | PEX14, CTDP1, RARS *; RARS *, COG5, CHEK2 *, RNASEH2C, PDHA1; | amino acid metabolism (p = 0.001) |
| Vineland Motor | Positive Valence system | STR, ACC | PEX14, CTDP1, RARS *; RARS *, COG5, CHEK2 *, RNASEH2C, PDHA1 | amino acid metabolism (p = 0.001) |
| Vineland Motor | Cognition system | Ocx, VLPFC, STR, DLPFC, A1C, ACC, IPC | MTOR *, COG2 *, RNASEH2A *; PEX10, MAP2K2; FEX14, CTDP1; EIF2B4, NDUFV2 *; PTPN11; CHEK2 *, PDHA1, RARS *, COG5, RNASEH2C; ORC4, CREBBP, IKBKG | Leptin signaling (p = 0.000004) |
| IL-6 signaling (p = 0.00007) |
| Strain at P21 | Body (gms) | Brain (gms) | Brain/Body Ratio |
|---|---|---|---|
| DLX5/6Cre | |||
| CRE-FF | 10+/−2.0 | 0.41+/−0.03 | 0.042+/−0.007 |
| CRE+FF | 8.3+/−0.4 0.37+/−0.02 | 0.045+/−0.004 | |
| p Value | p = 0.14 p = 0.05 | p = 0.39 | |
| EMX1Cre | |||
| CRE-FF | 8.94+/−2.0 | 0.39+/−0.03 | 0.046+/−0.009 |
| CRE+FF | 8.31+/−1.0 | 0.39+/−0.01 | 0.047+/−0.006 |
| p Value | p = 0.48 p = 0.53 | p = 0.70 |
| Strain at P60-P100 | CRE+FF (µV2) | CRE-FF (µV2) | p Value |
|---|---|---|---|
| DLX5/6Cre | |||
| Alpha | 73+/−9 | 112+/−16 | 0.060 |
| Beta | 46+/−6 | 108+/−12 | 0.009 |
| Delta | 203+/−27 | 221+/−32 | 0.460 |
| Theta | 194+/−23 | 209+/−41 | 0.680 |
Publisher’s Note: MDPI stays neutral with regard to jurisdictional claims in published maps and institutional affiliations. |
© 2022 by the authors. Licensee MDPI, Basel, Switzerland. This article is an open access article distributed under the terms and conditions of the Creative Commons Attribution (CC BY) license (https://creativecommons.org/licenses/by/4.0/).
Share and Cite
Jagadapillai, R.; Qiu, X.; Ojha, K.; Li, Z.; El-Baz, A.; Zou, S.; Gozal, E.; Barnes, G.N. Potential Cross Talk between Autism Risk Genes and Neurovascular Molecules: A Pilot Study on Impact of Blood Brain Barrier Integrity. Cells 2022, 11, 2211. https://doi.org/10.3390/cells11142211
Jagadapillai R, Qiu X, Ojha K, Li Z, El-Baz A, Zou S, Gozal E, Barnes GN. Potential Cross Talk between Autism Risk Genes and Neurovascular Molecules: A Pilot Study on Impact of Blood Brain Barrier Integrity. Cells. 2022; 11(14):2211. https://doi.org/10.3390/cells11142211
Chicago/Turabian StyleJagadapillai, Rekha, Xiaolu Qiu, Kshama Ojha, Zhu Li, Ayman El-Baz, Shipu Zou, Evelyne Gozal, and Gregory N. Barnes. 2022. "Potential Cross Talk between Autism Risk Genes and Neurovascular Molecules: A Pilot Study on Impact of Blood Brain Barrier Integrity" Cells 11, no. 14: 2211. https://doi.org/10.3390/cells11142211