
Surface Marker Expression in Small and Medium/Large Mesenchymal Stromal Cell-Derived Extracellular Vesicles in Naive or Apoptotic Condition Using Orthogonal Techniques

 ,
,  , and
, and 
Abstract
:1. Introduction
2. Materials and Methods
2.1. Cell Culture
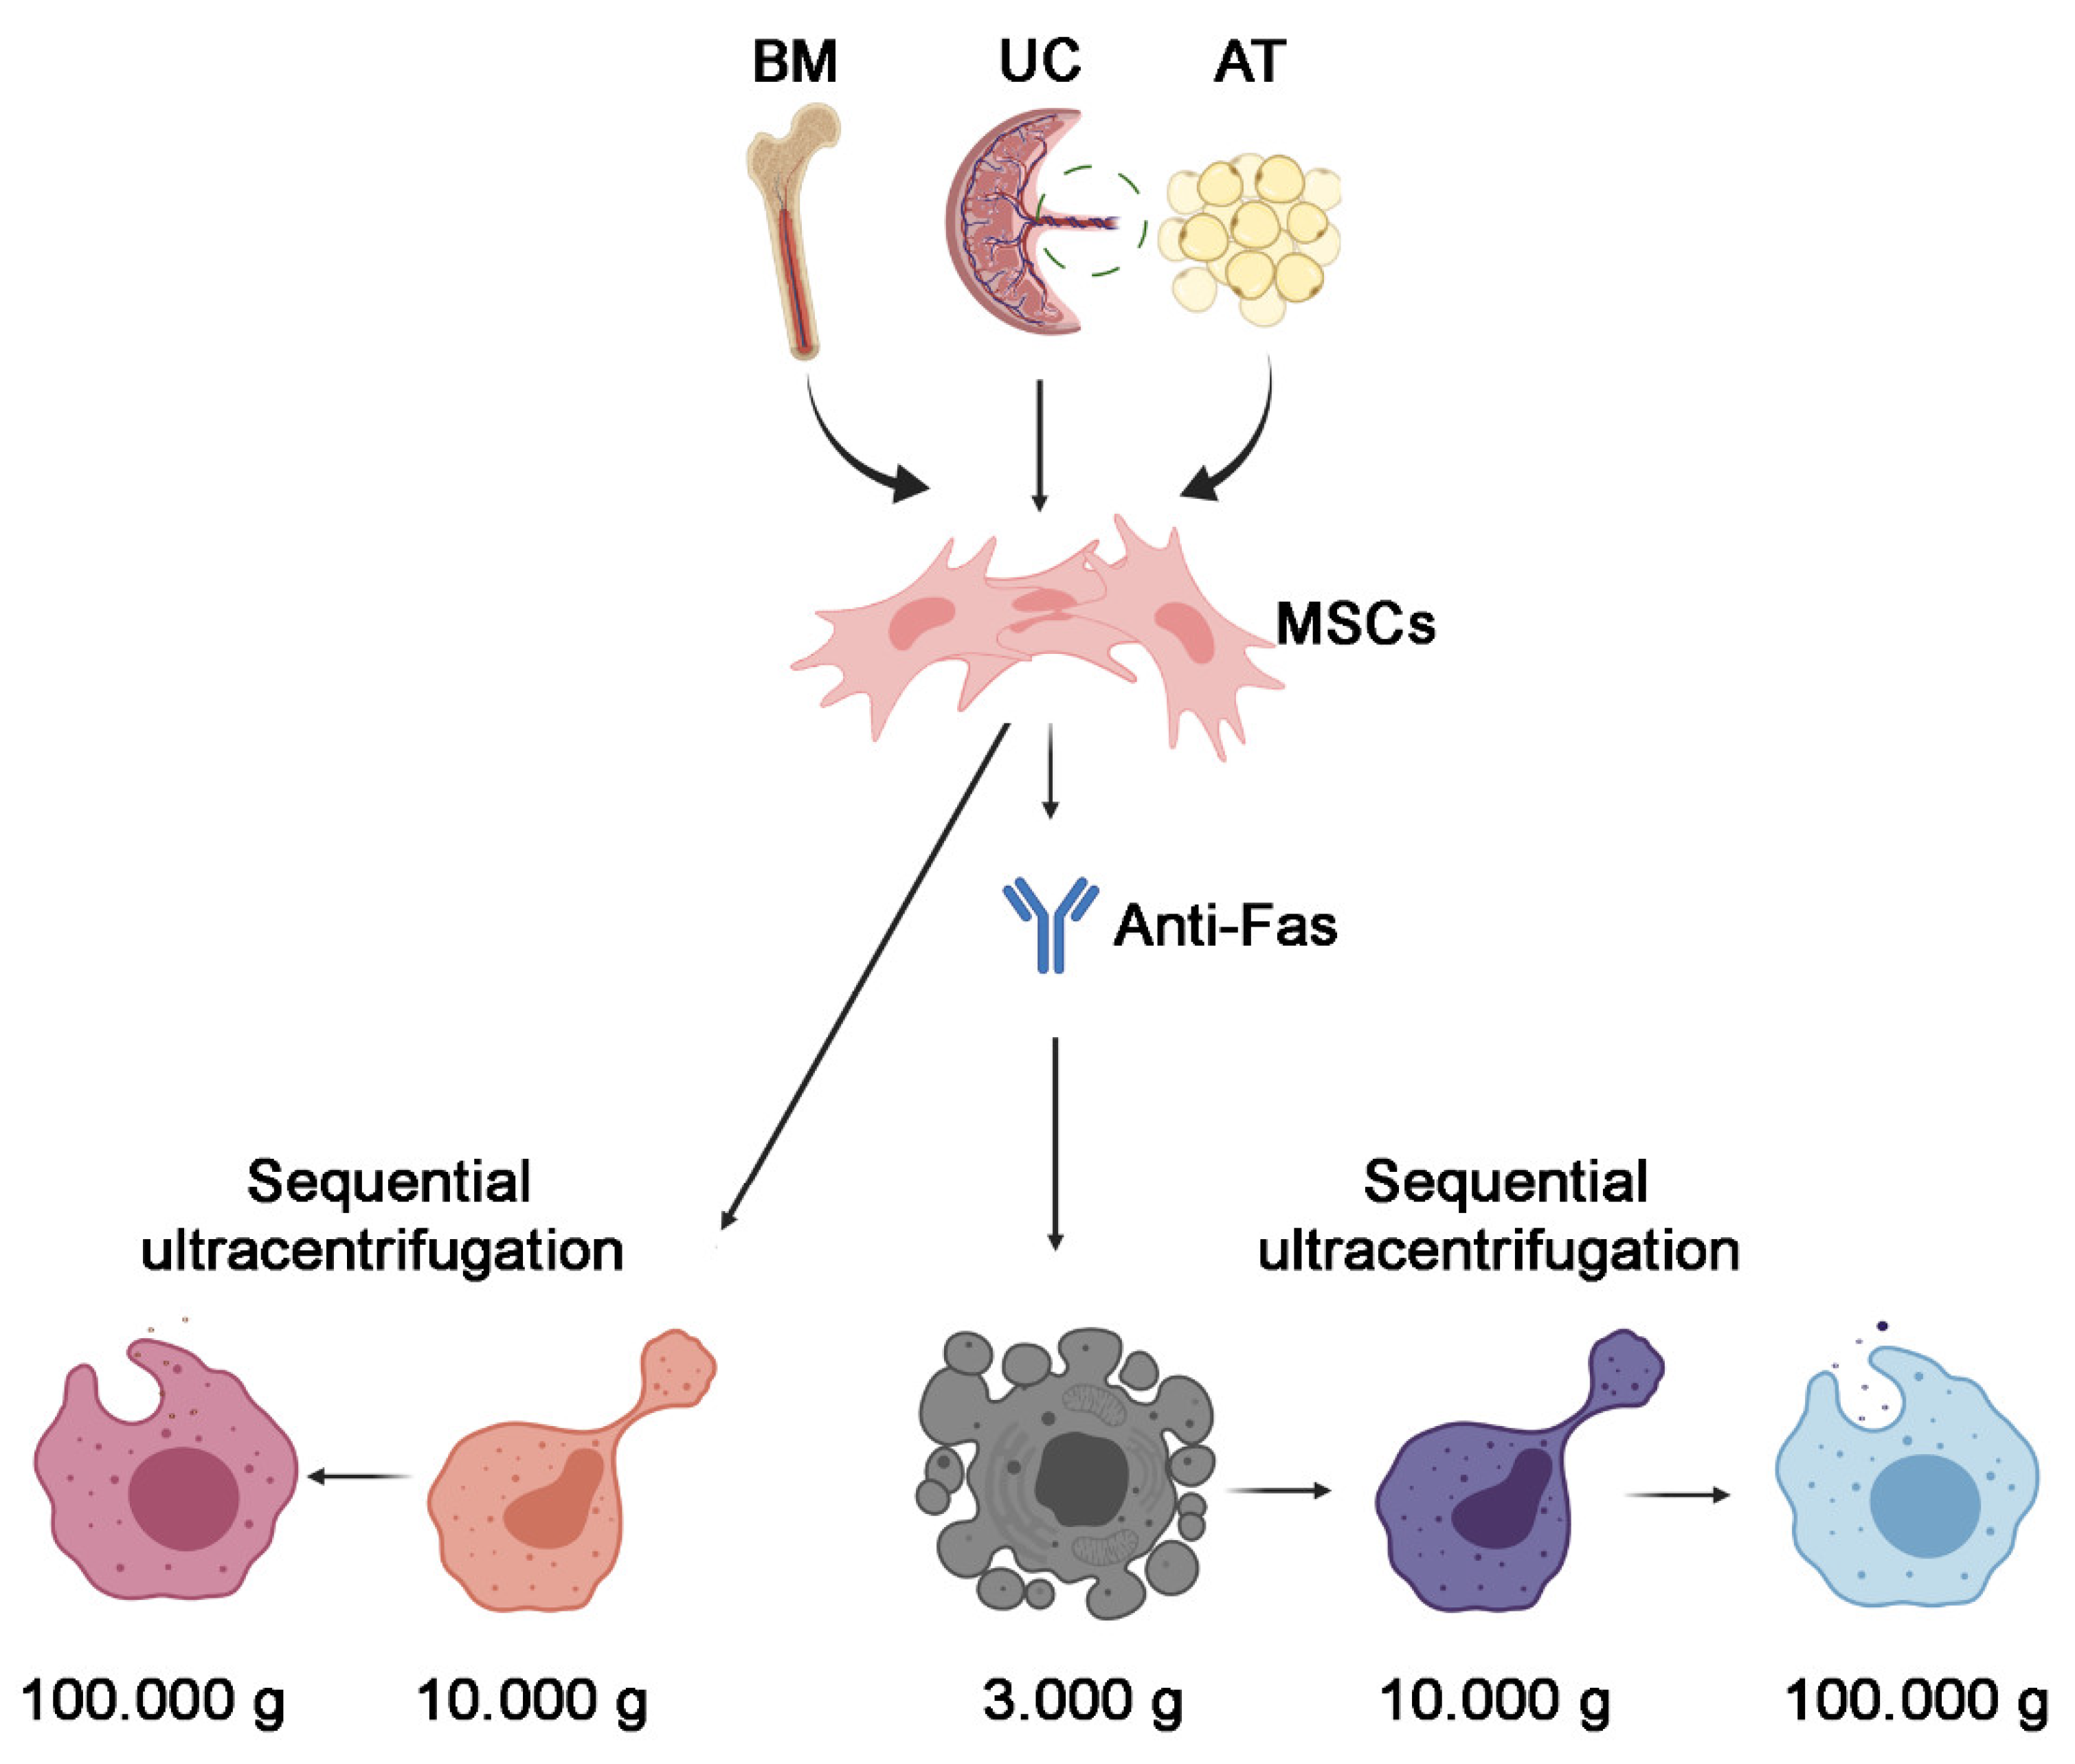
2.2. EV Isolation
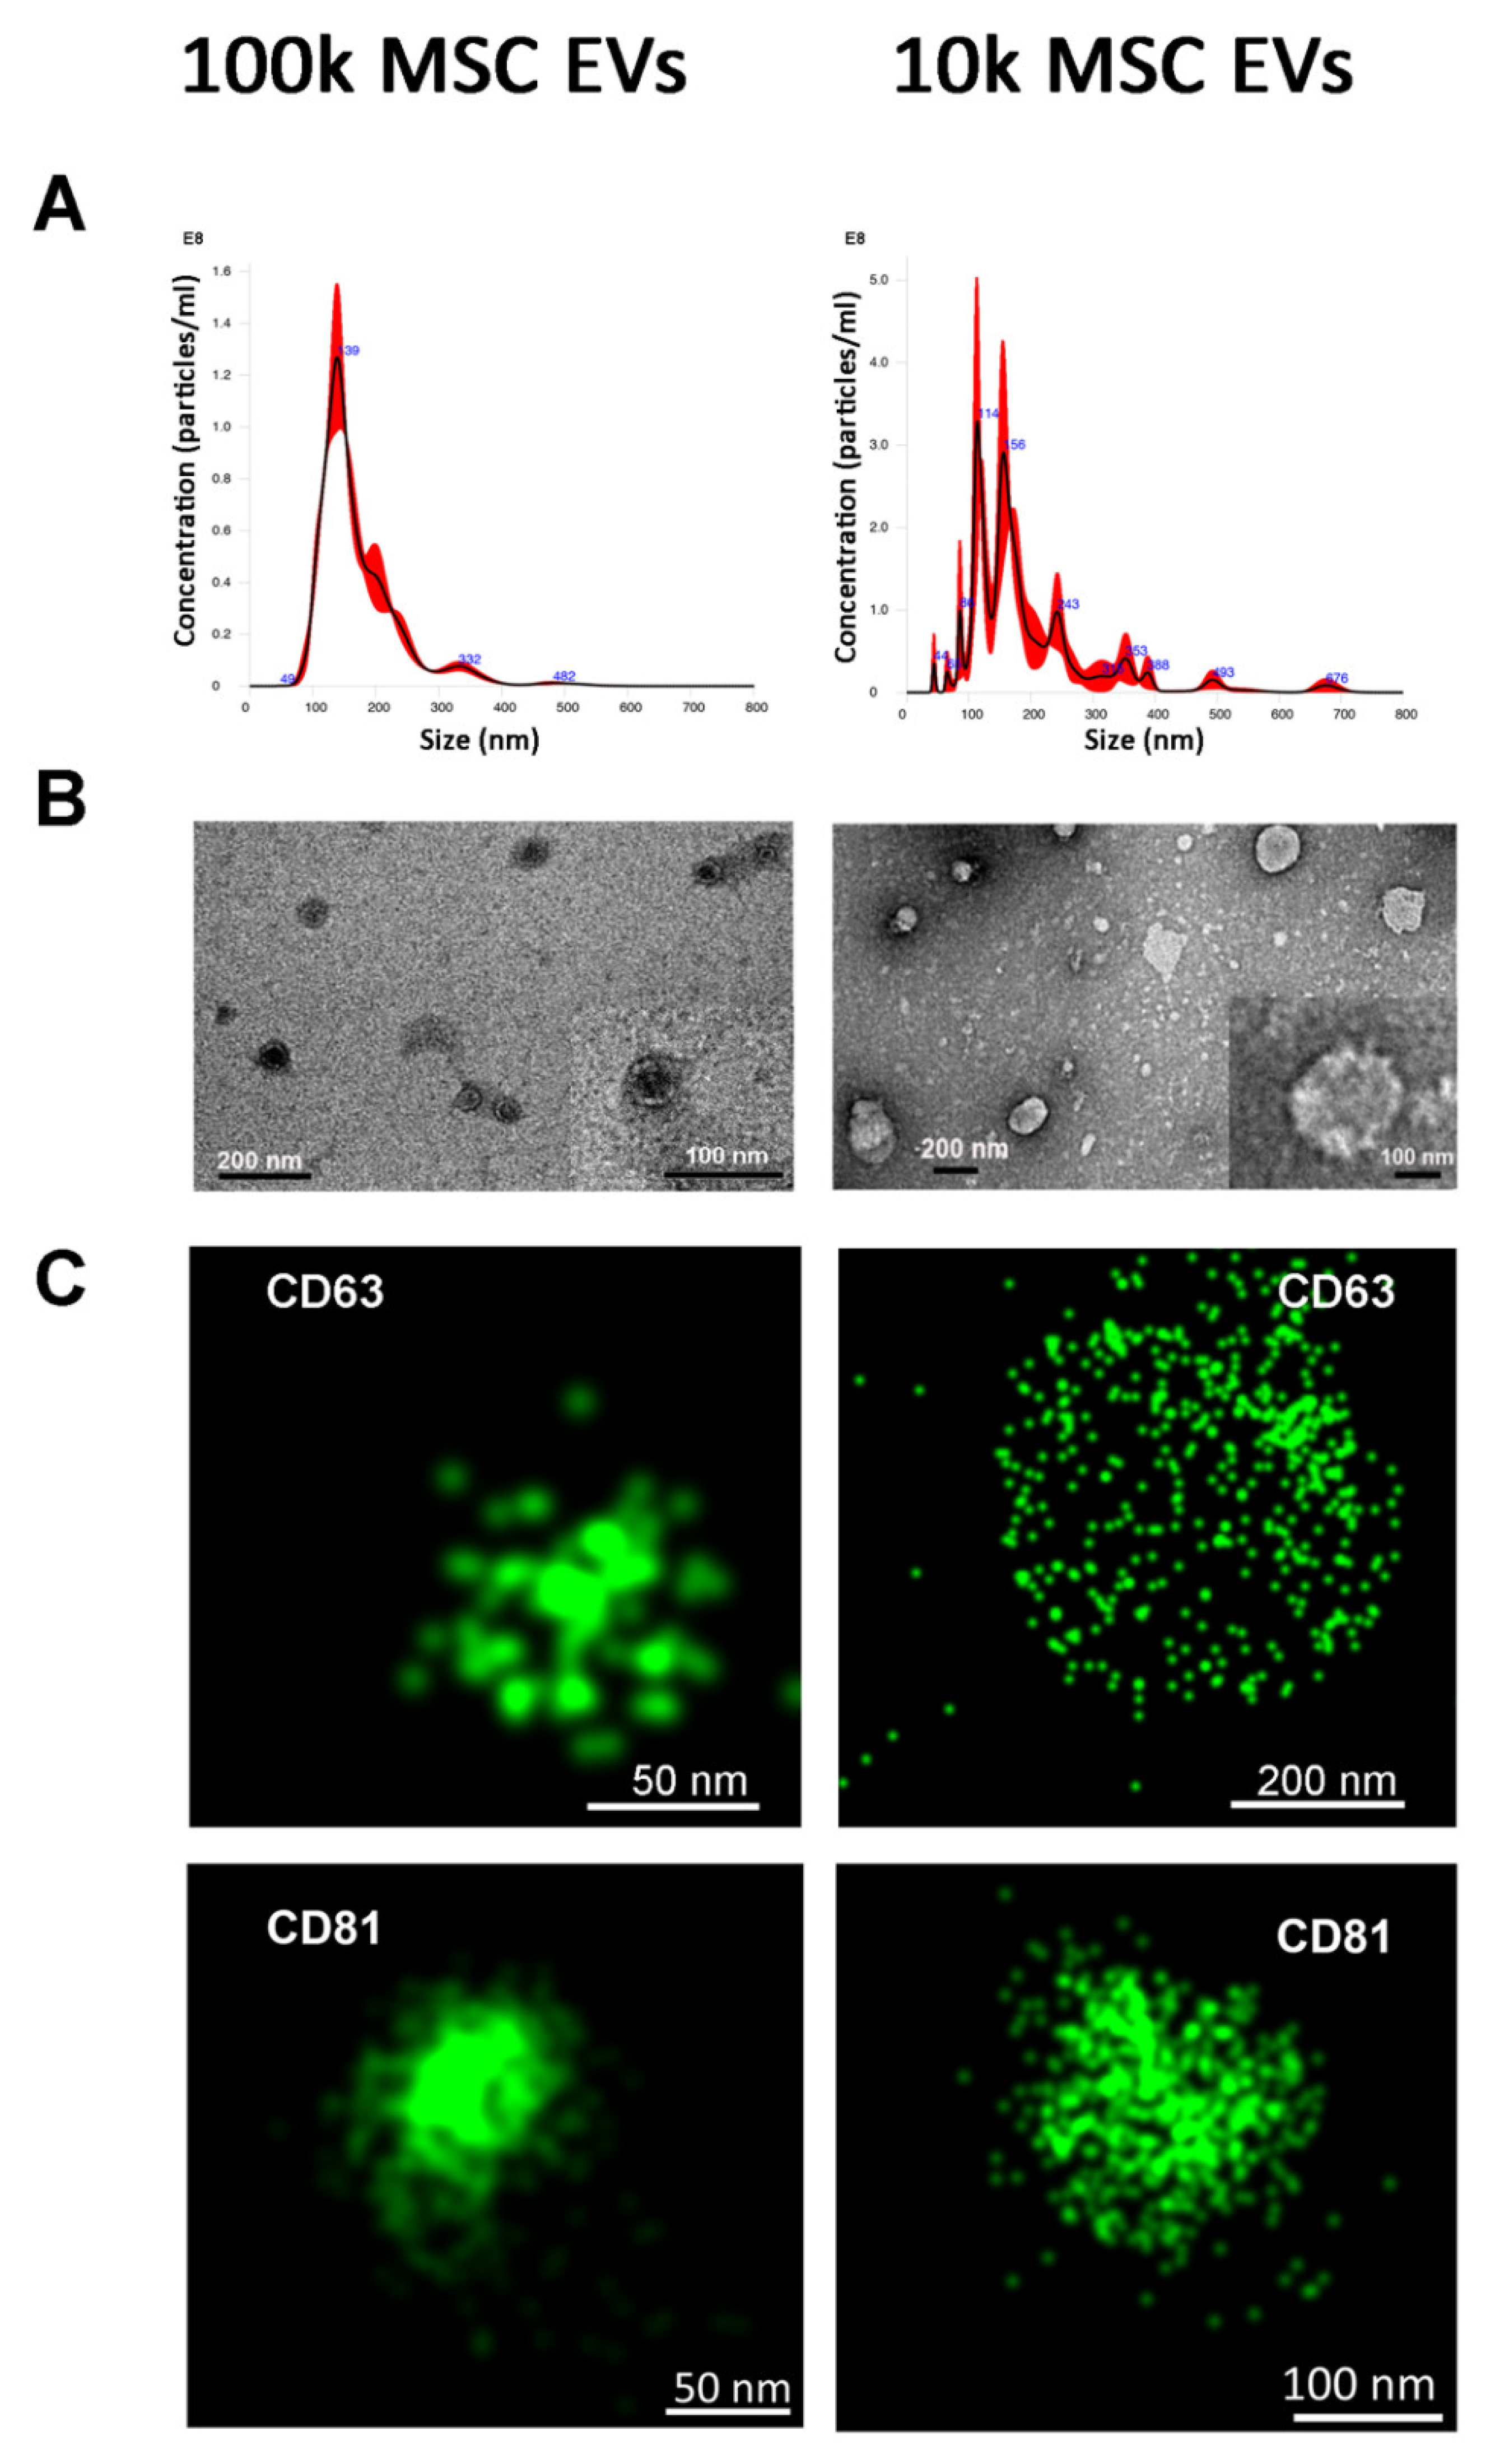
2.3. Nanoparticle Tracking Analysis
2.4. Transmission Electron Microscopy
2.5. Cytofluorimetric Analysis
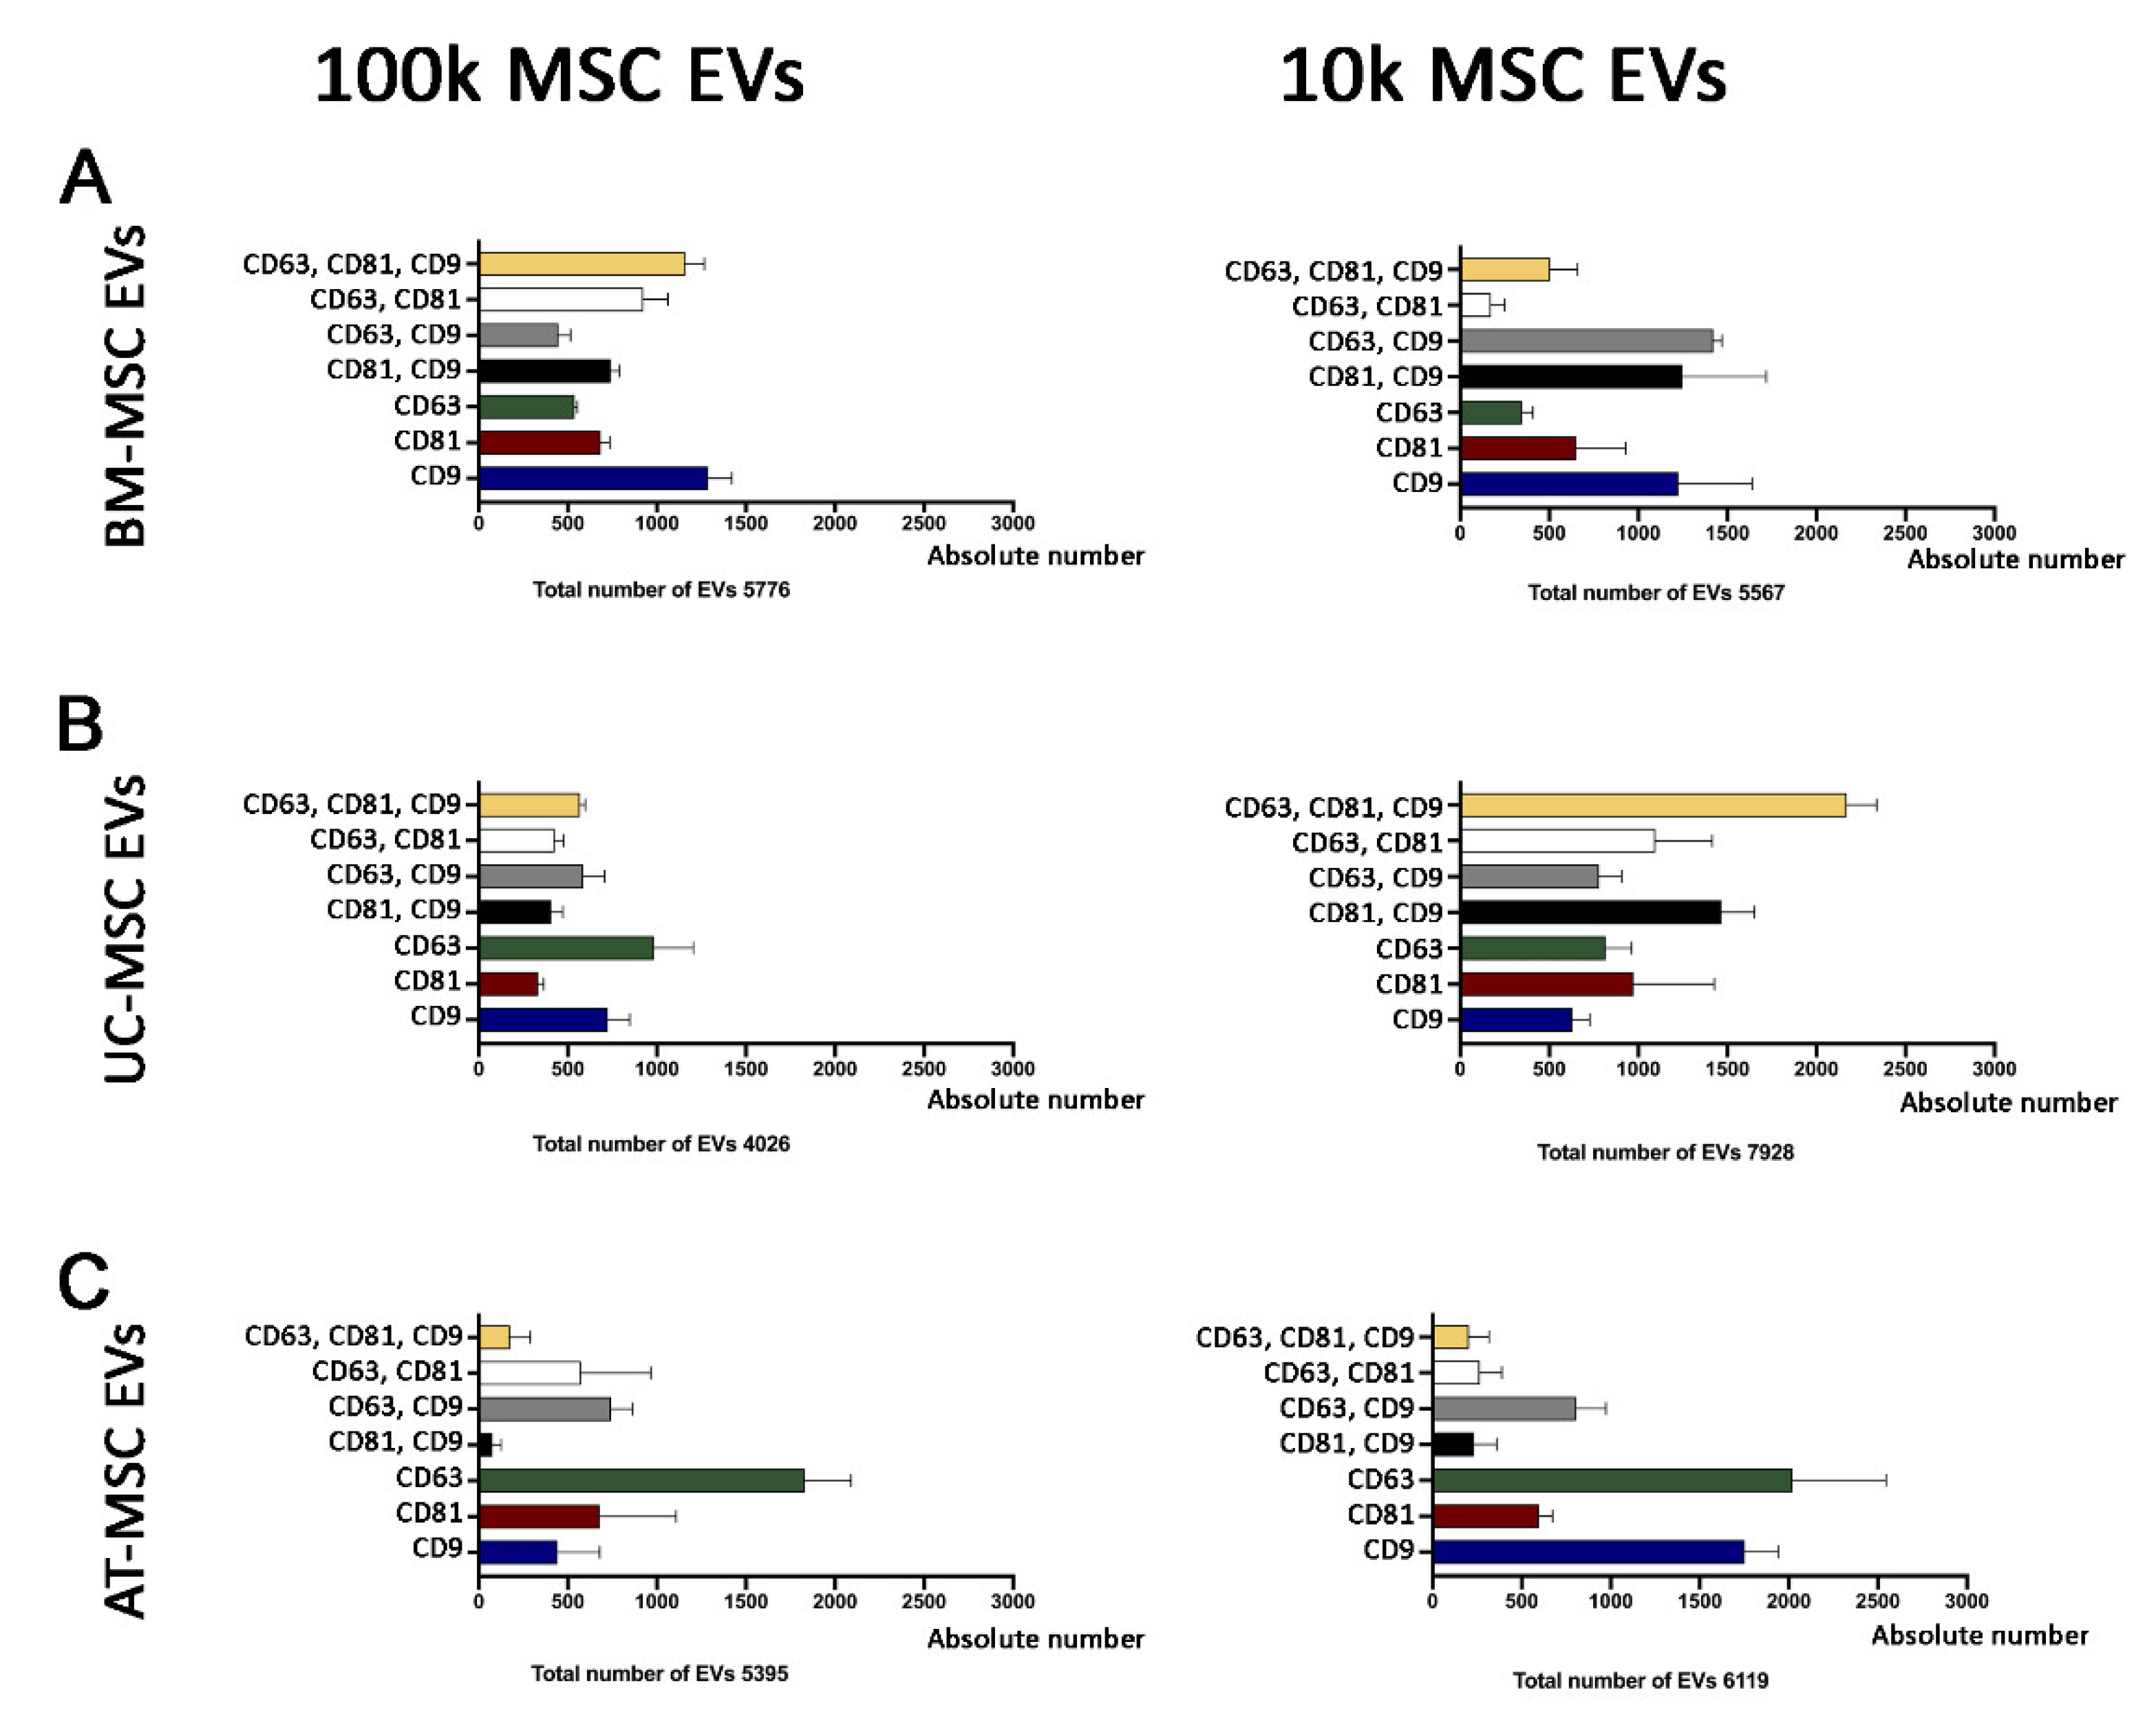
2.6. ExoView Chip-Based Analysis
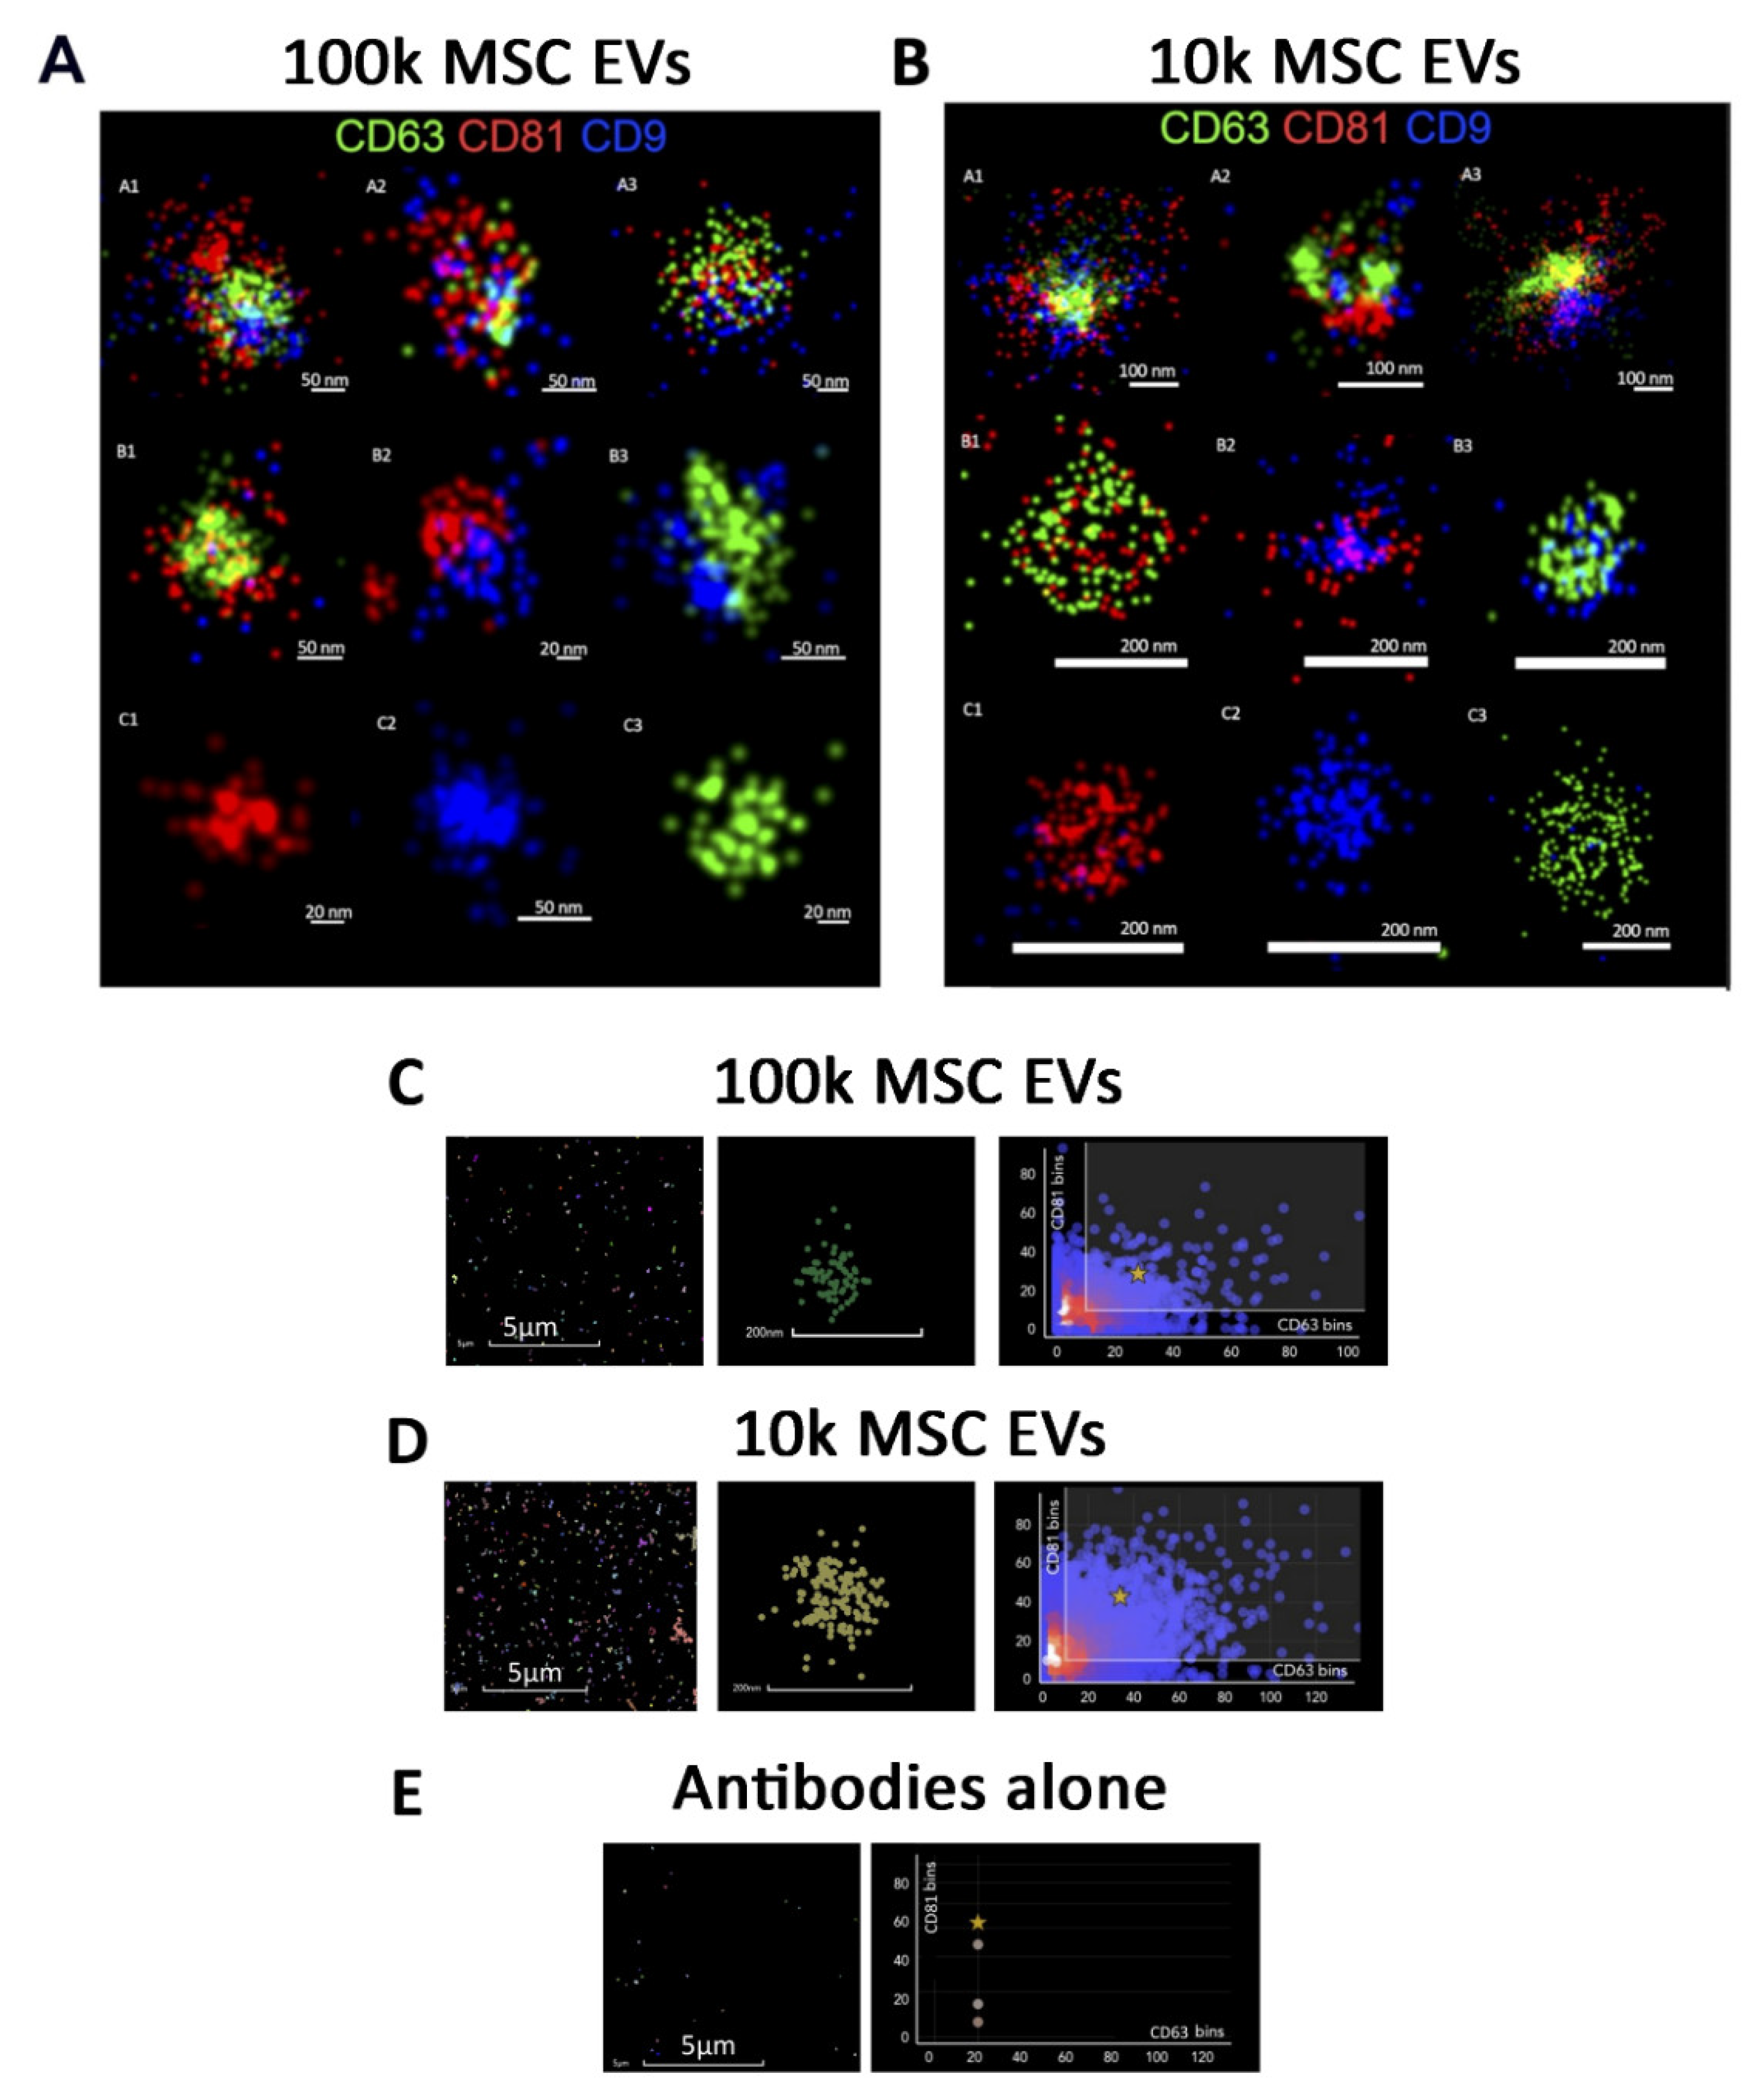
2.7. Super-Resolution Microscopy
2.8. Statistical Analysis
3. Results
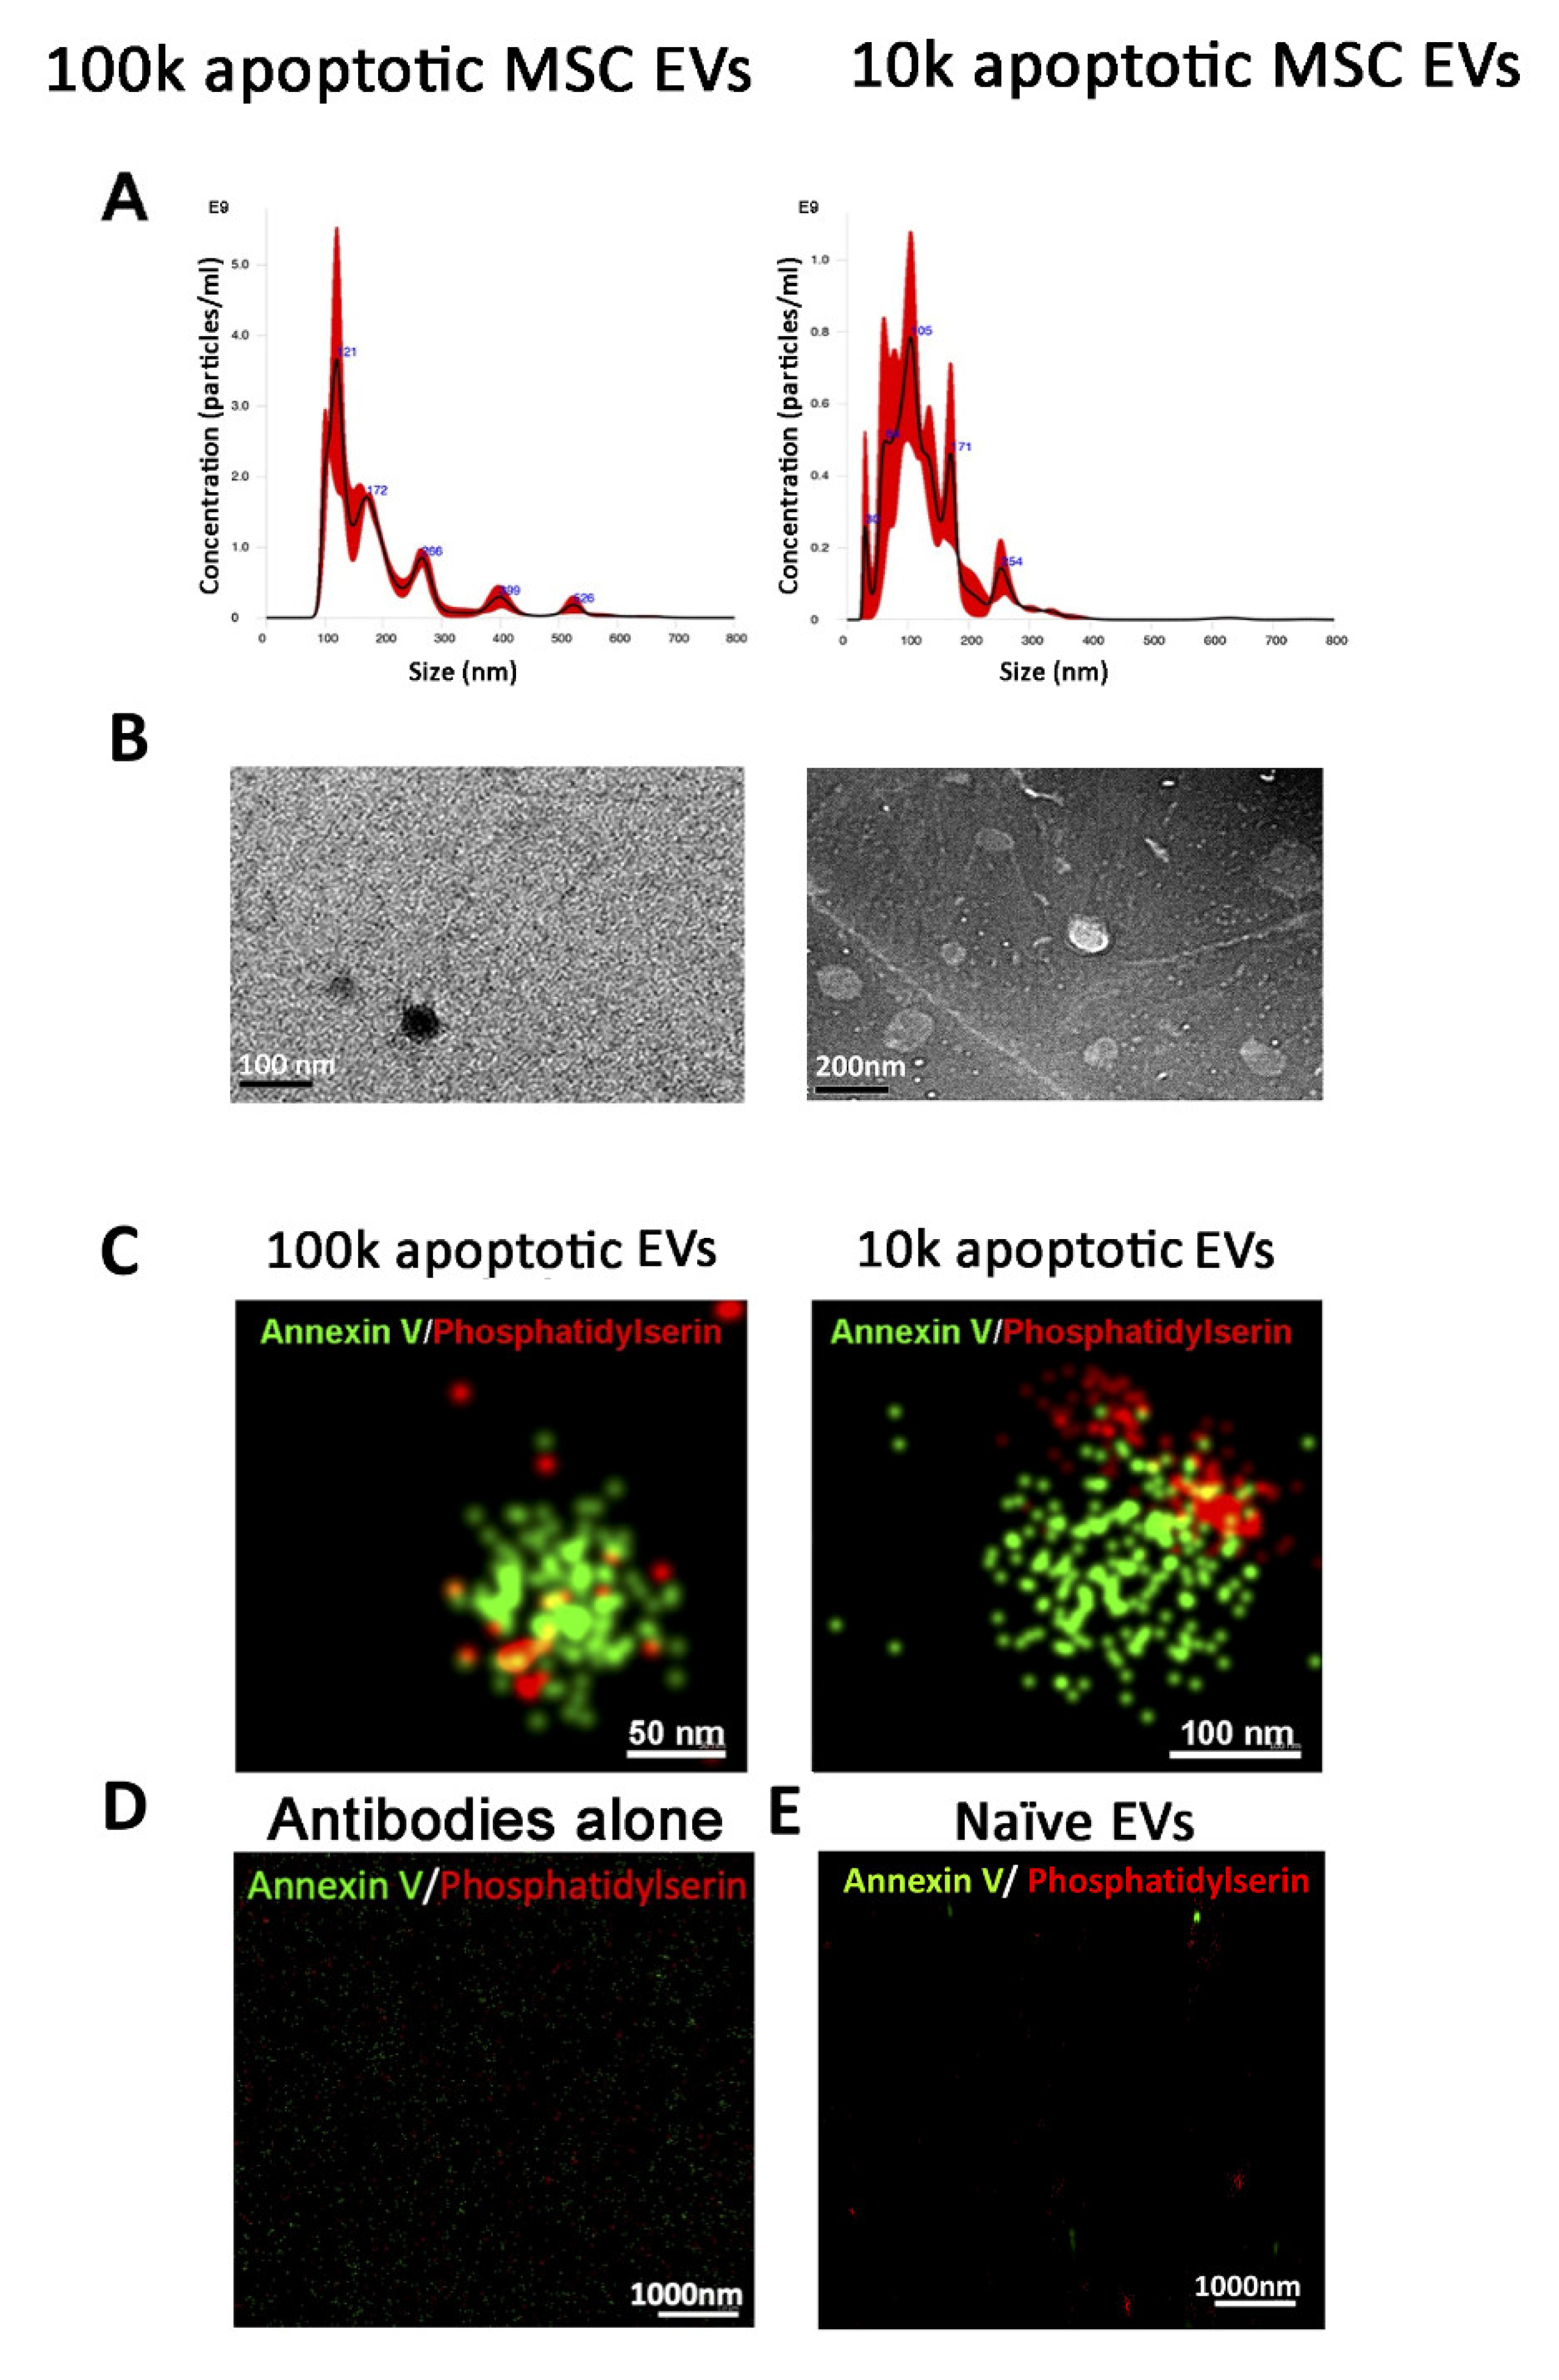
3.1. Isolation of 100k and 10k MSC EVs and Size Analysis
Variable Tetraspanin Expression on 100k and 10k Single MSC EVs by Super-Resolution Microscopy
3.2. Isolation of 100k and 10k MSC EVs from Apoptotic Cells
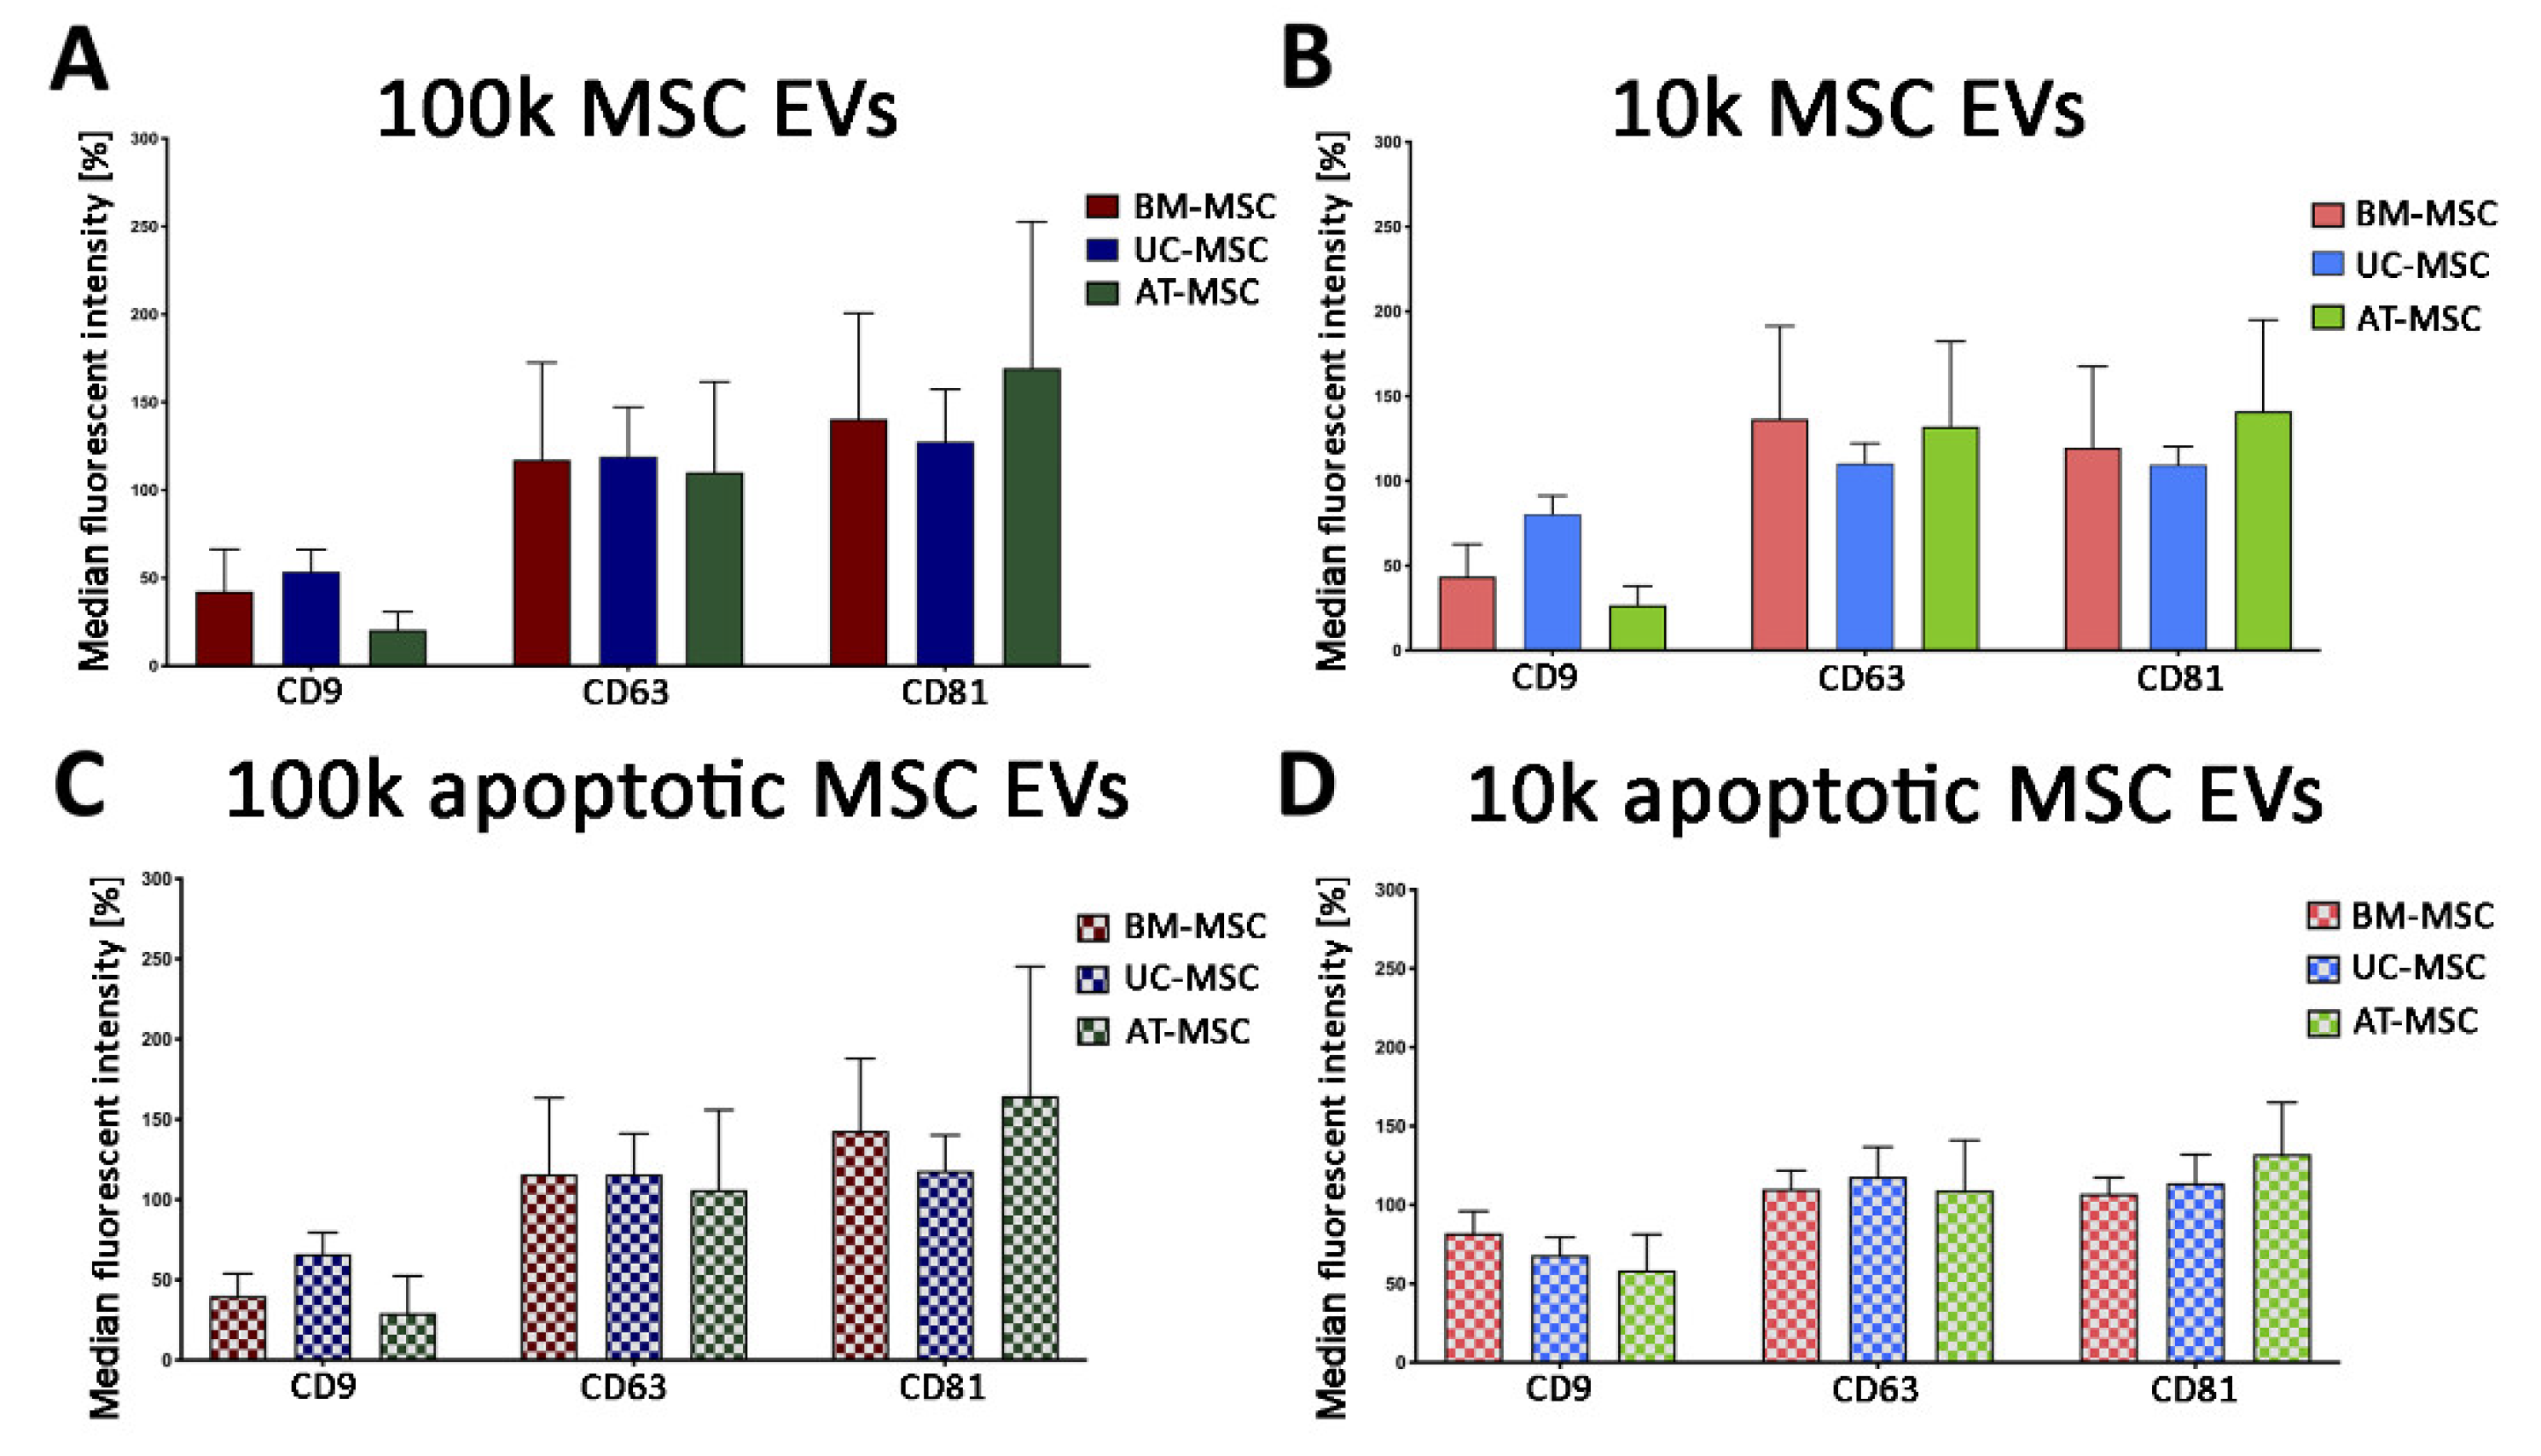
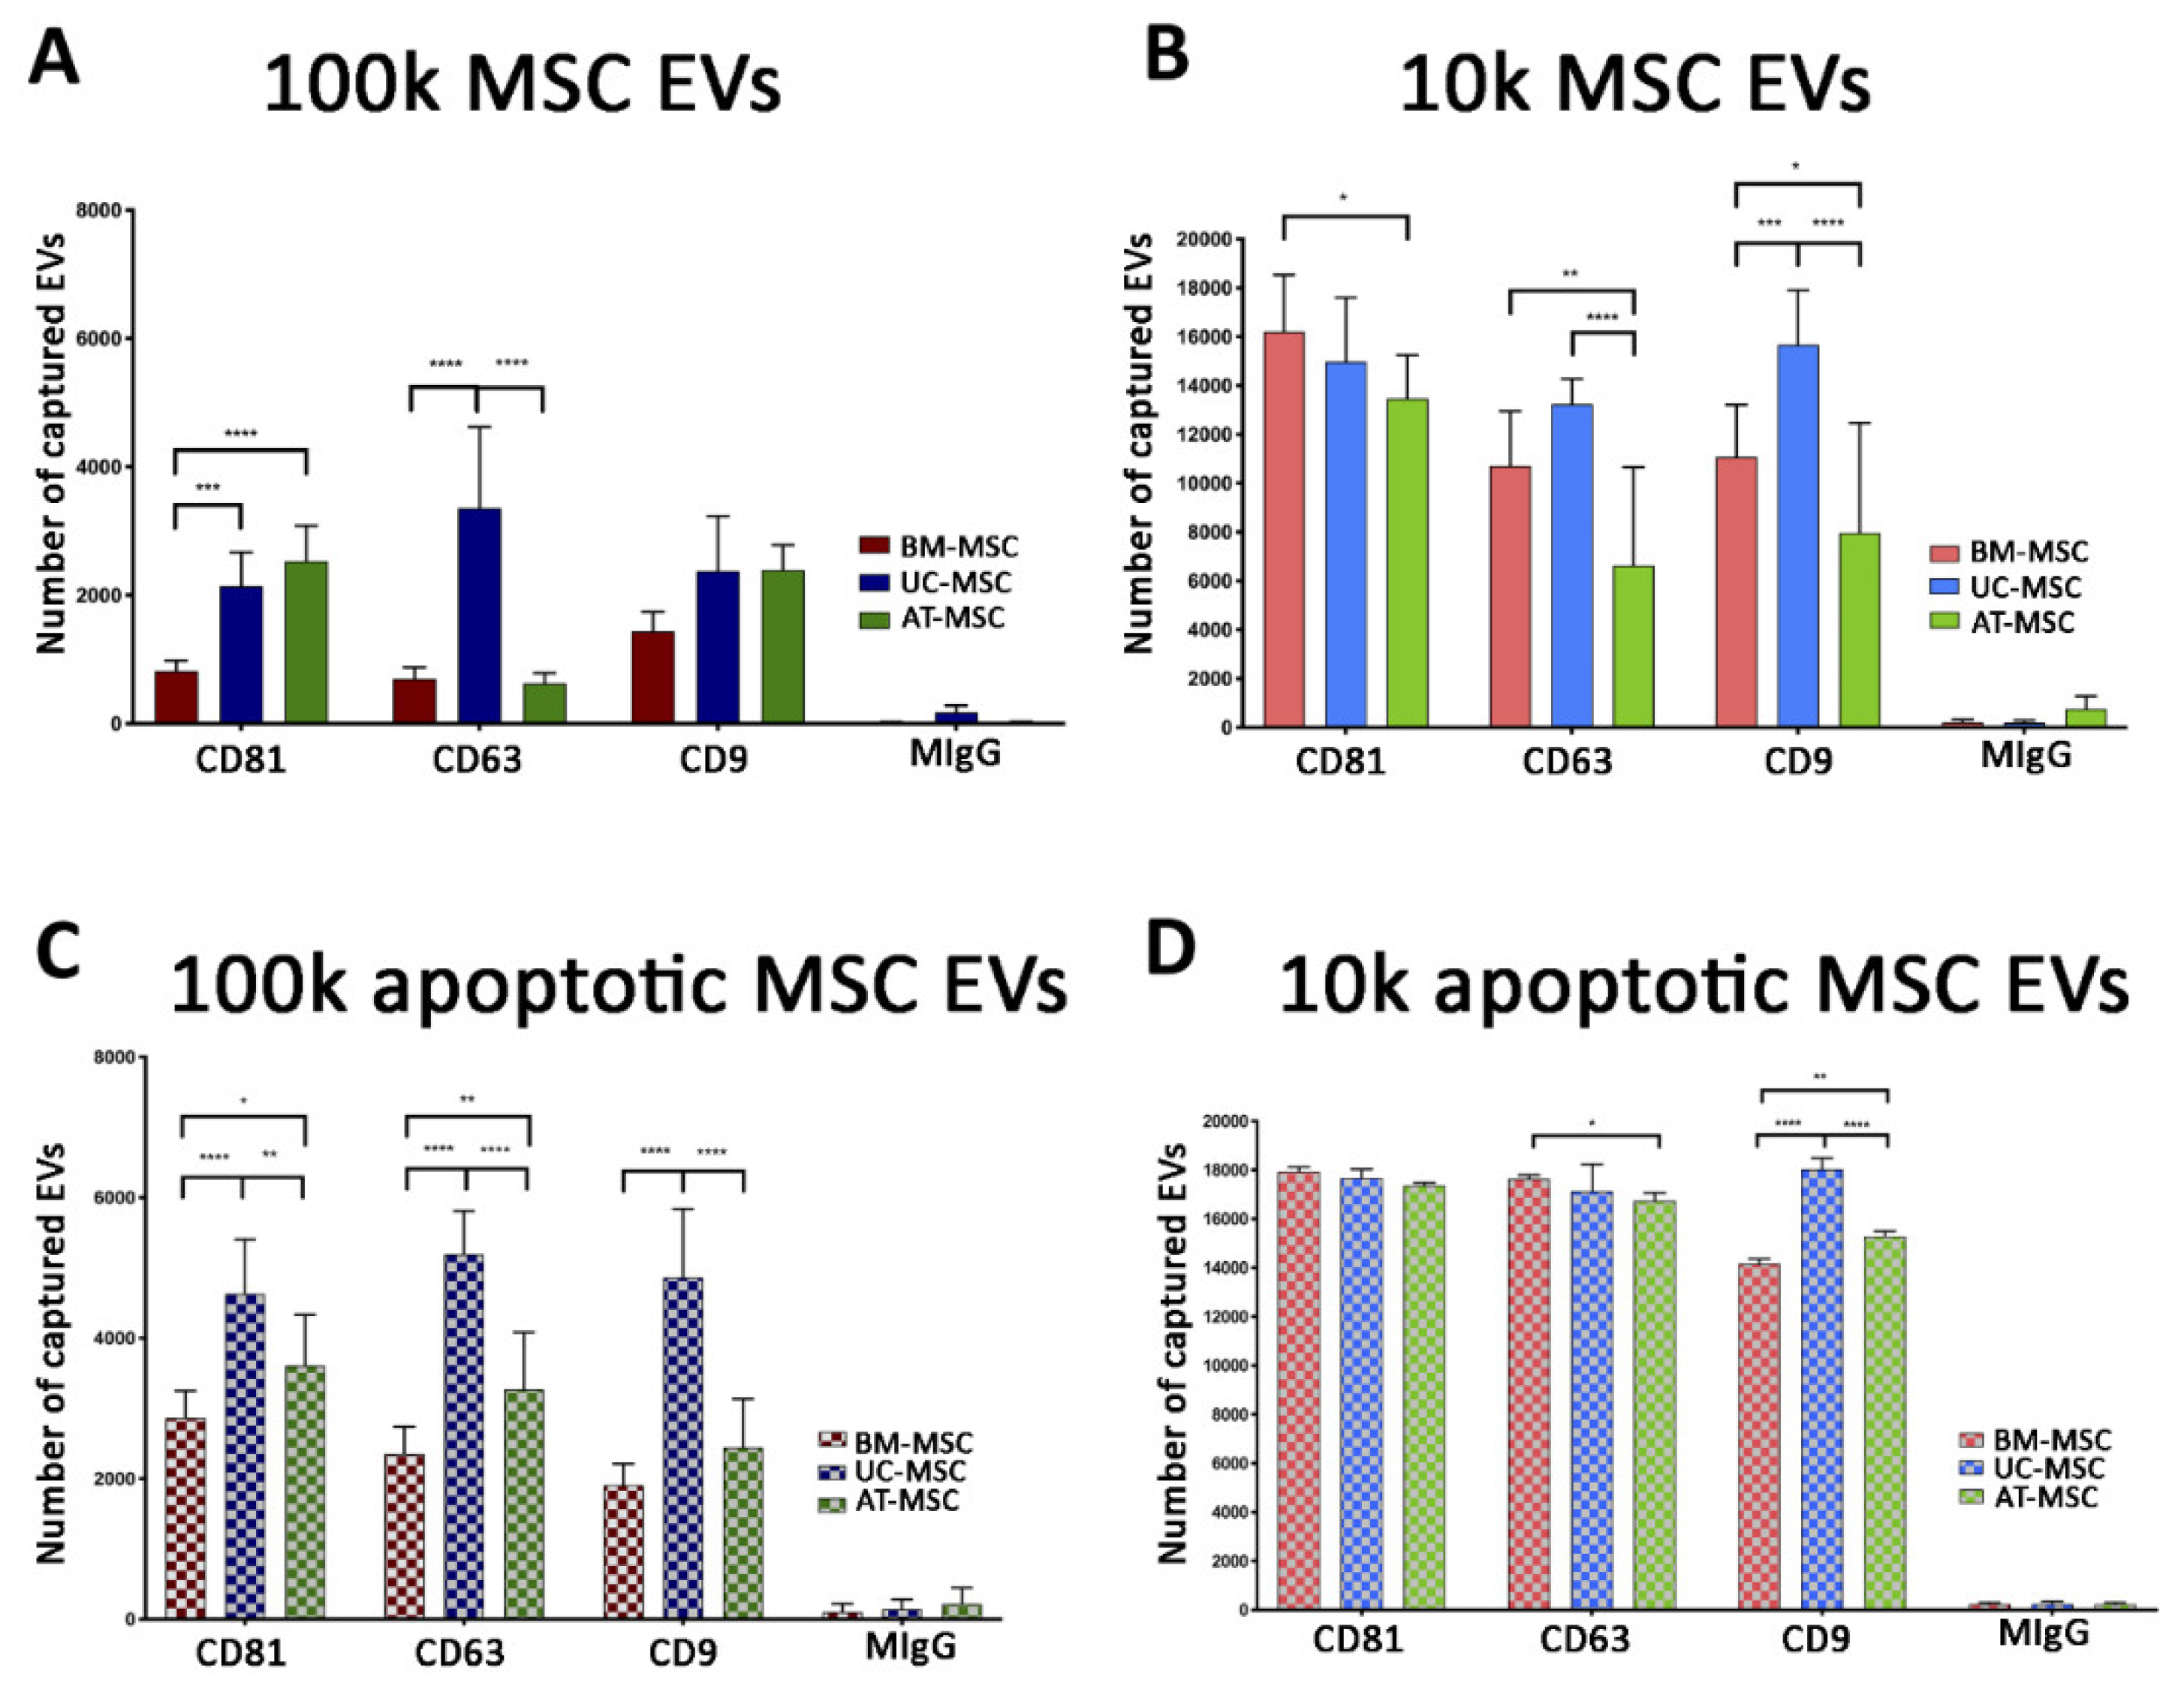
3.2.1. Quantitative Tetraspanin Evaluation of Naive and Apoptotic 100k and 10k MSC EVs
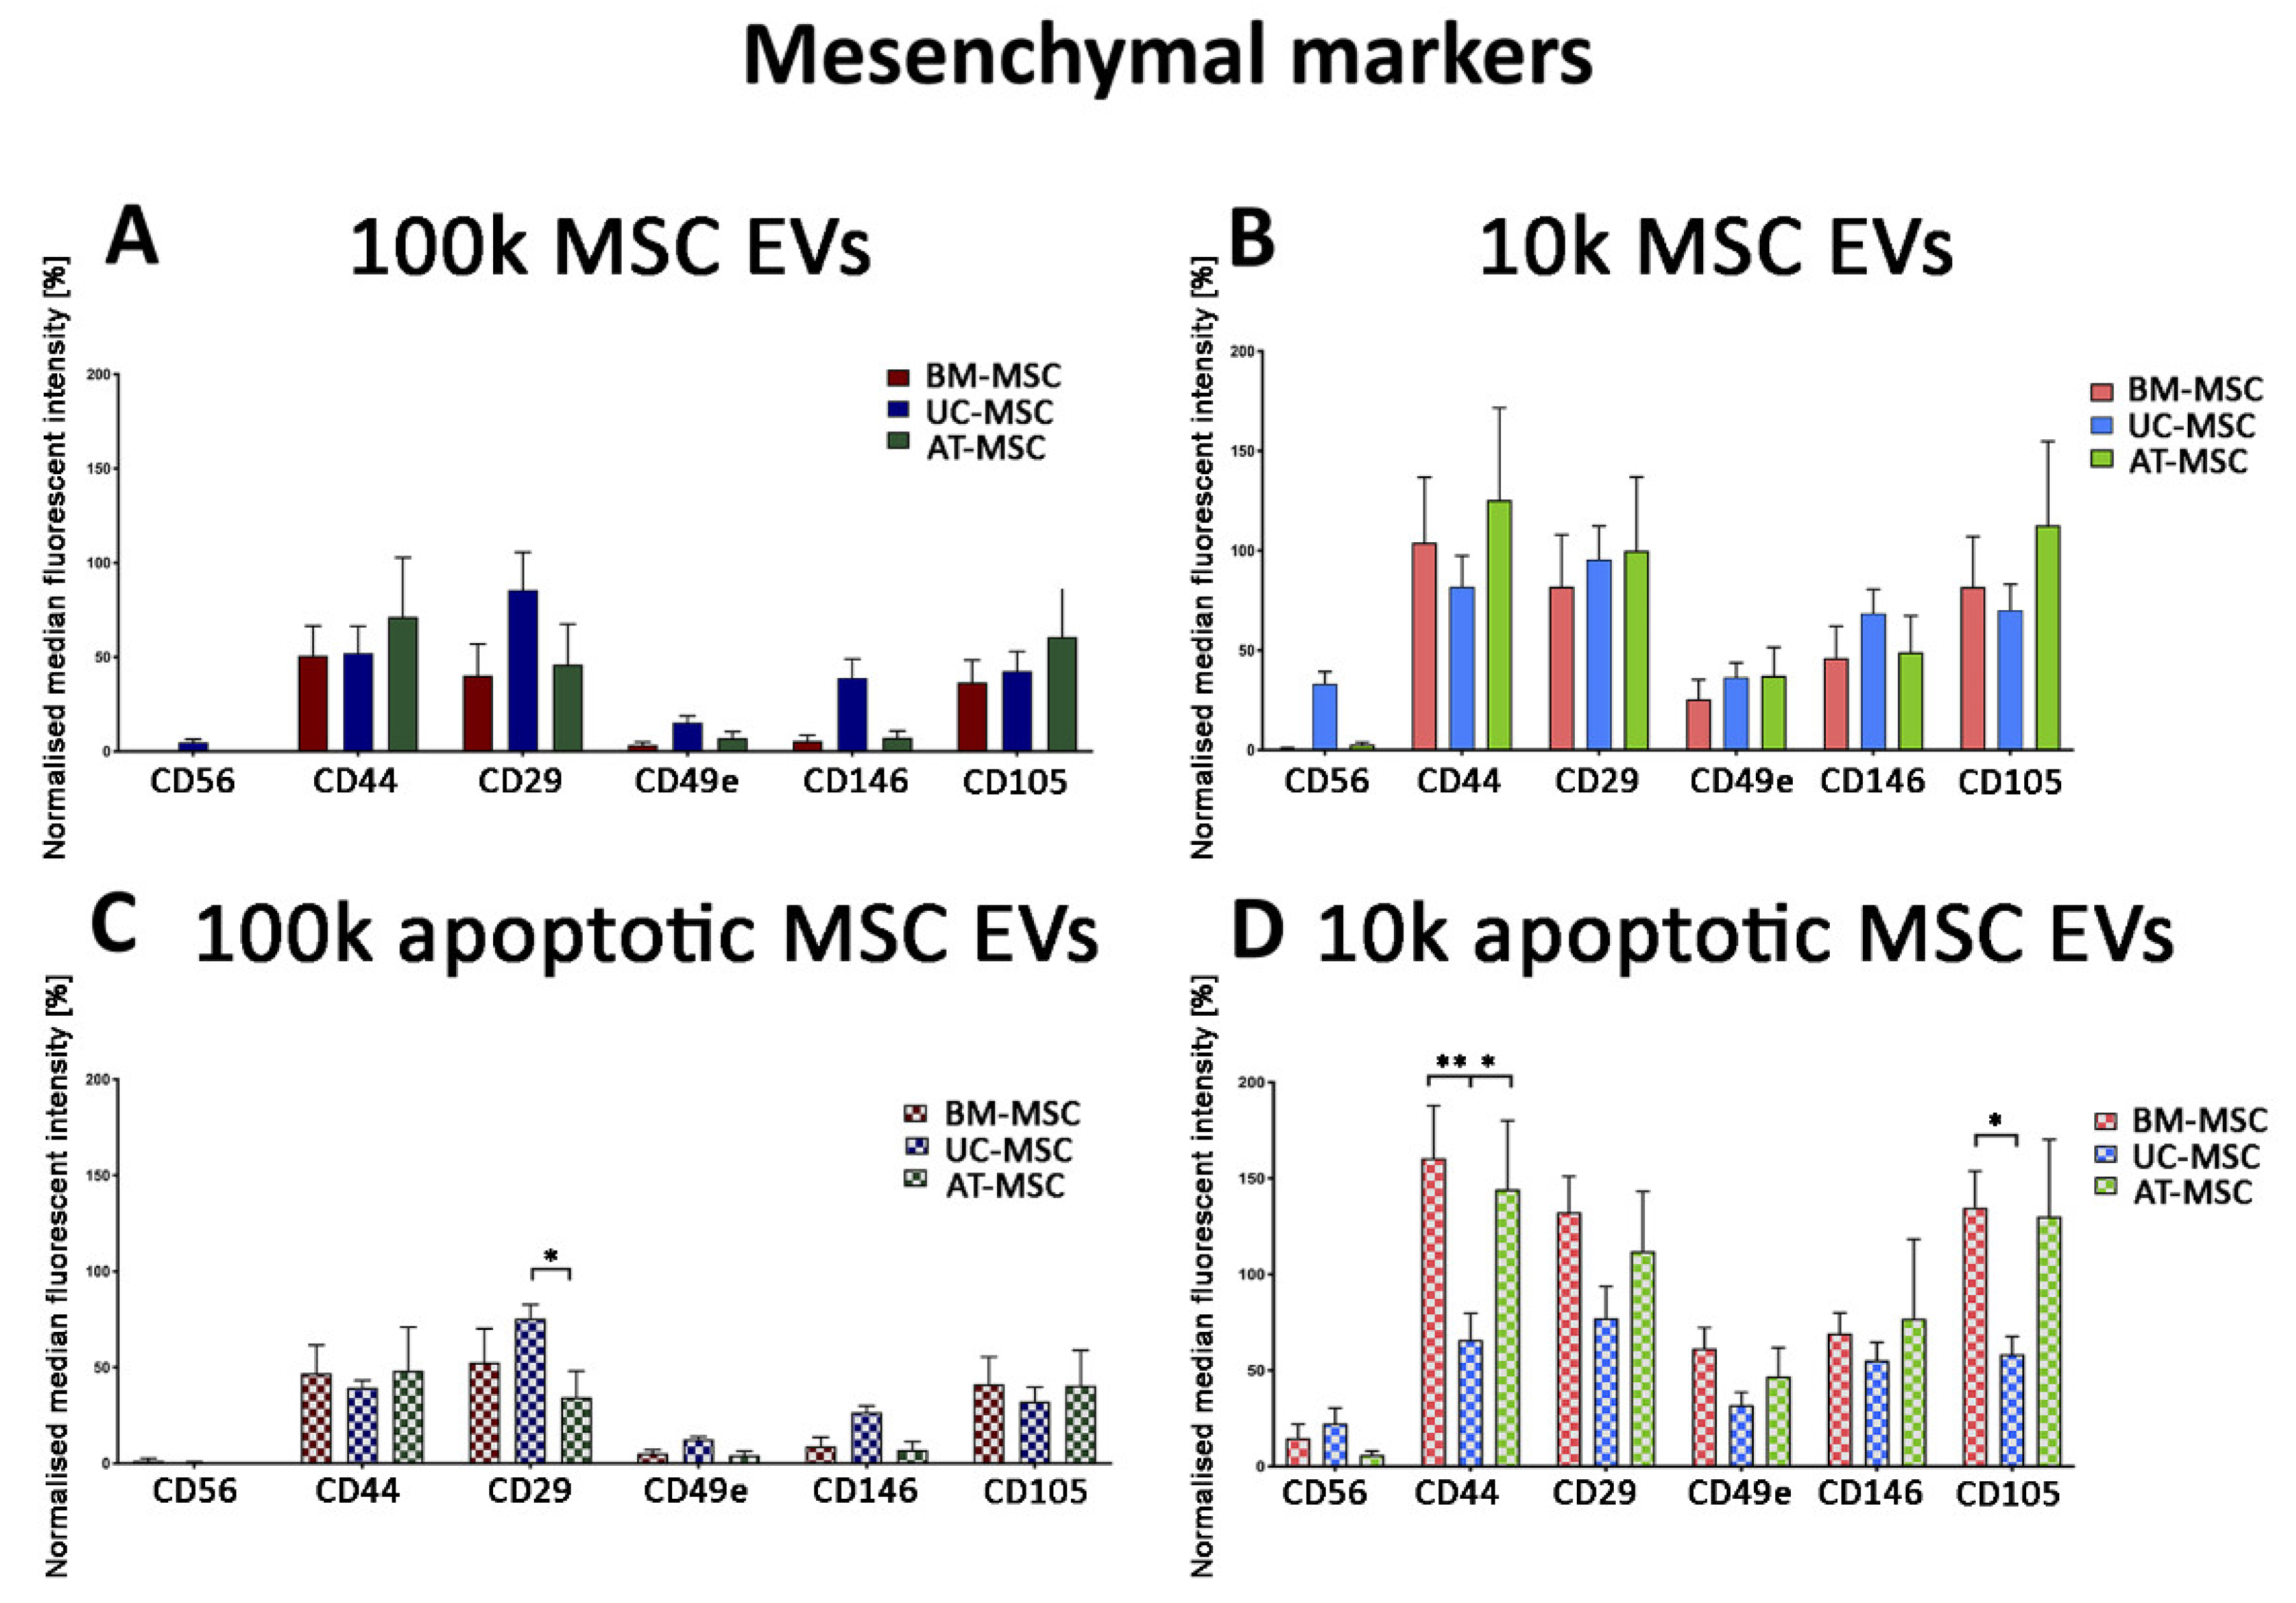
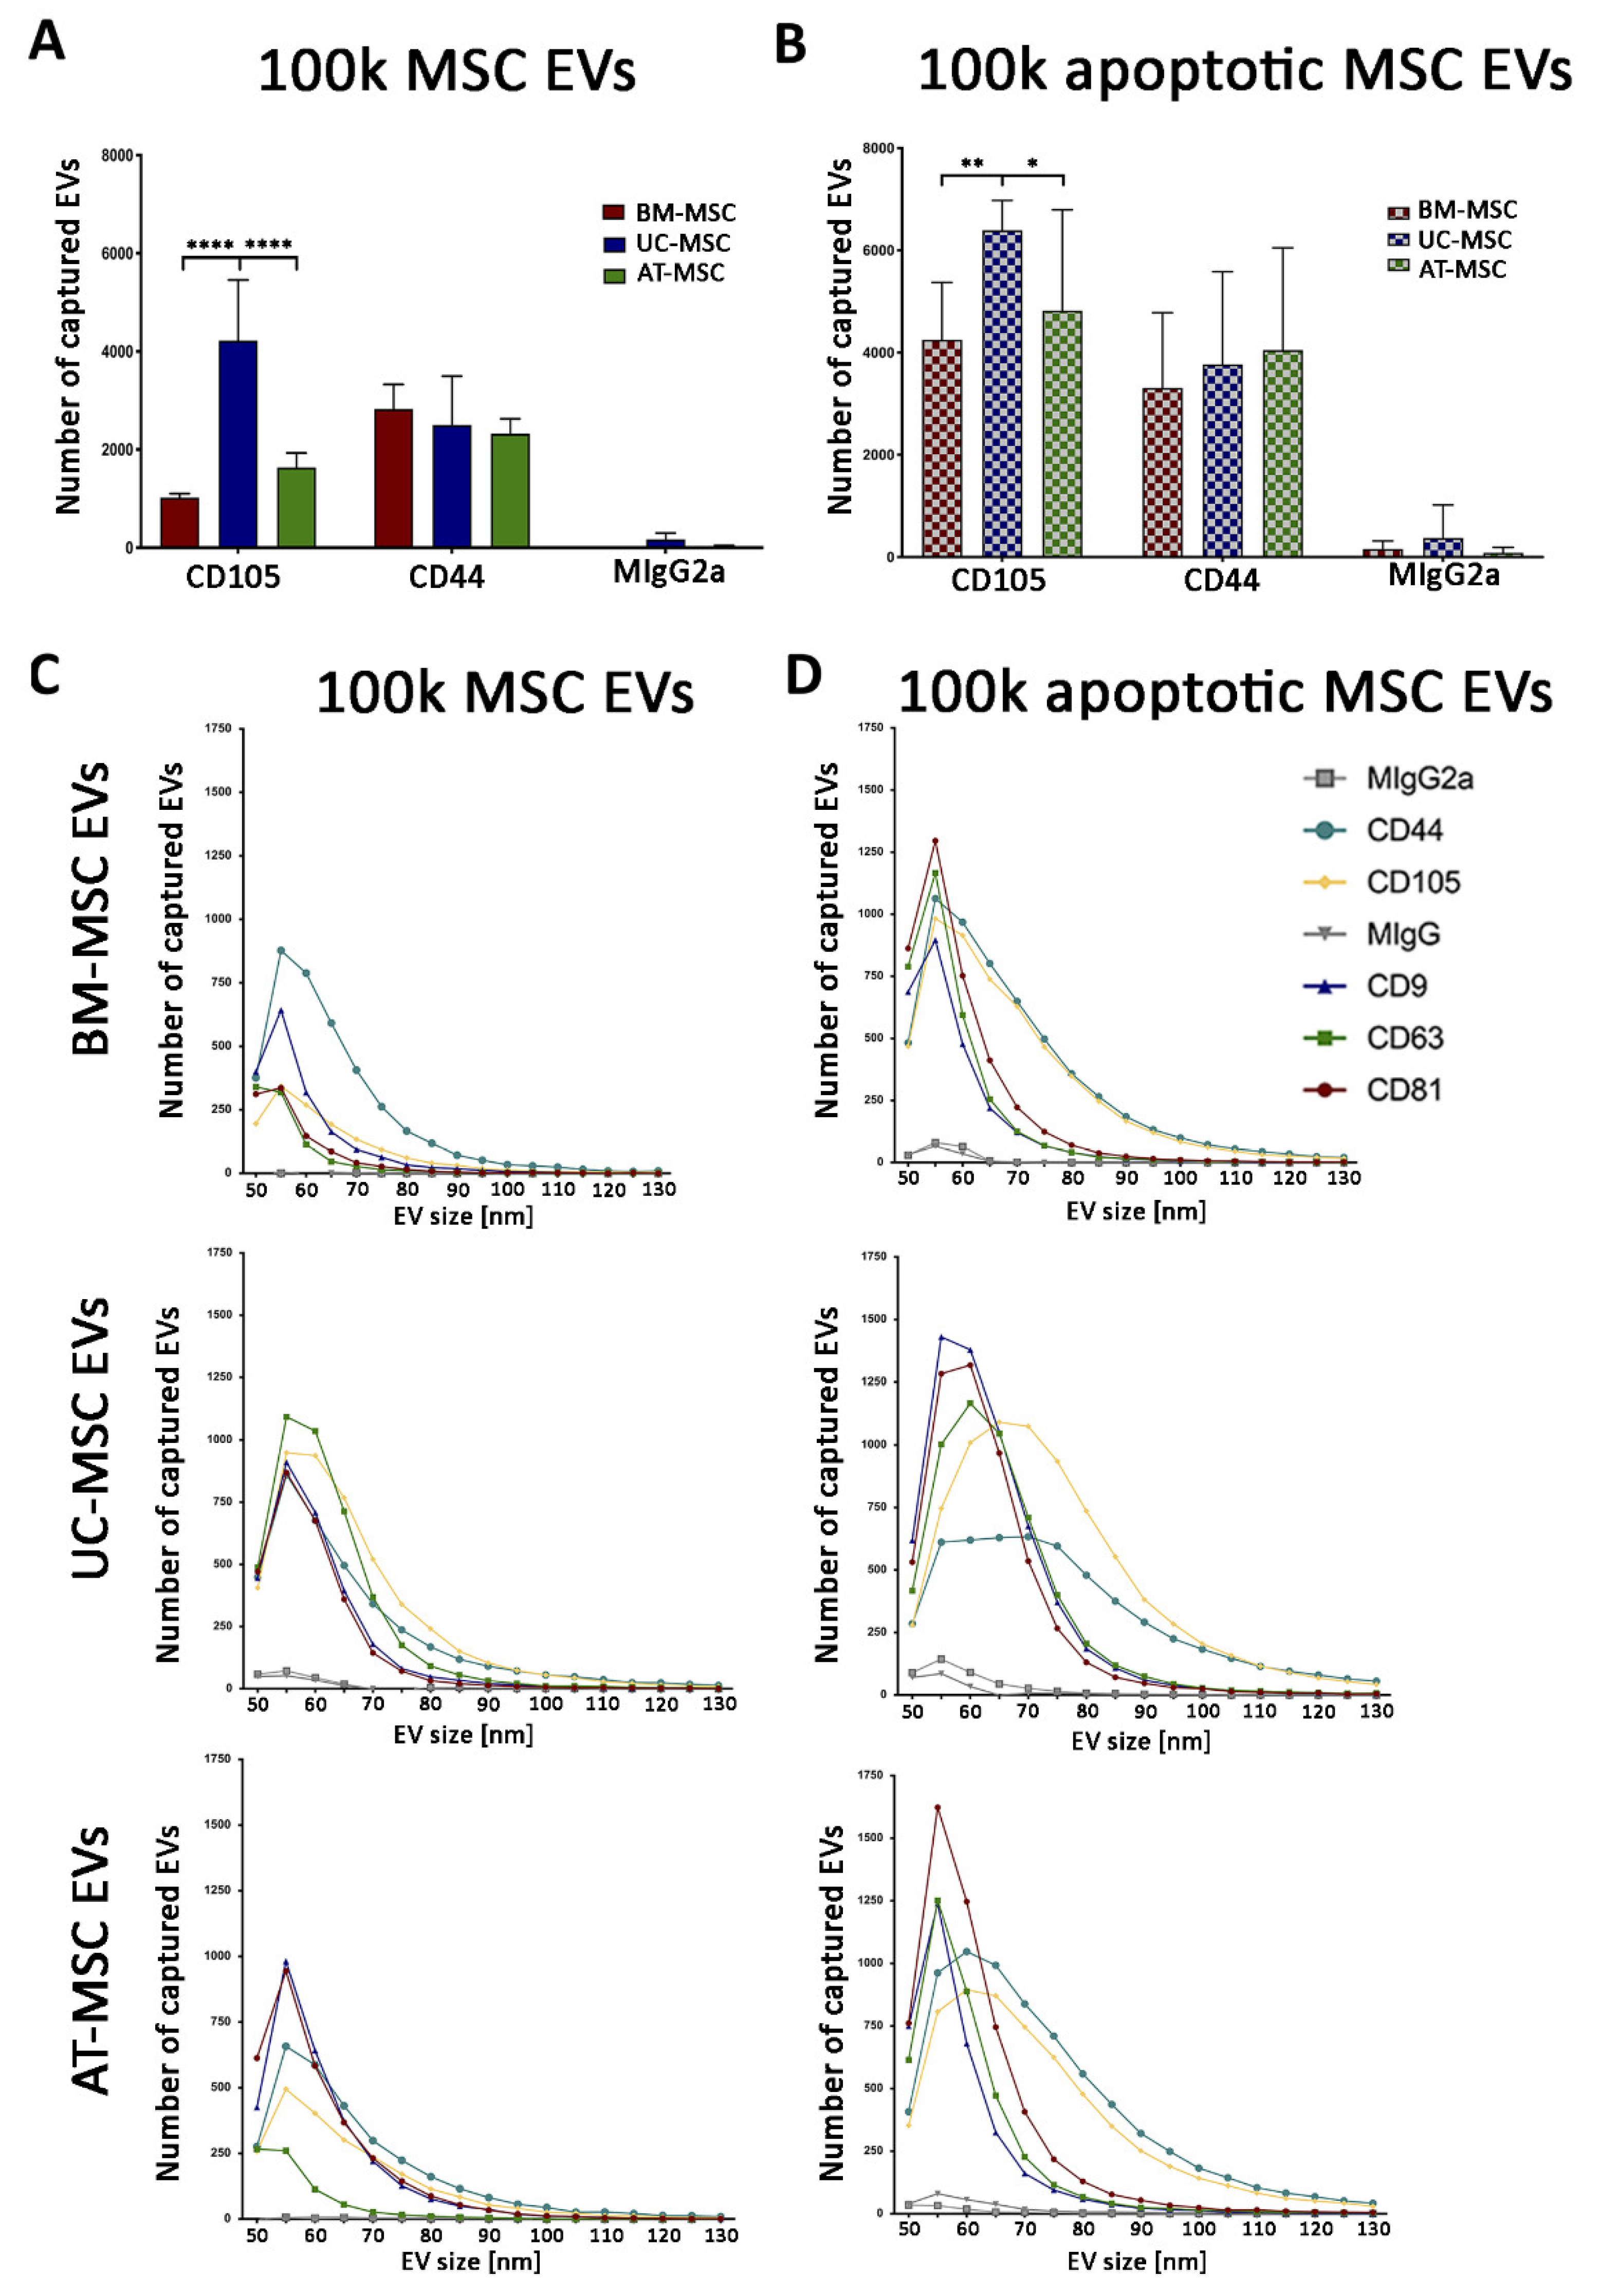
3.2.2. Mesenchymal, and Immunological Marker Expression on Naive and Apoptotic 100k and 10k MSC EVs
4. Discussion
5. Conclusions
Supplementary Materials
Author Contributions
Funding
Institutional Review Board Statement
Data Availability Statement
Acknowledgments
Conflicts of Interest
References
- Flemming, A.; Schallmoser, K.; Strunk, D.; Stolk, M.; Volk, H.D.; Seifert, M. Immunomodulative efficacy of bone marrow-derived mesenchymal stem cells cultured in human platelet lysate. J. Clin. Immunol. 2011, 31, 1143–1156. [Google Scholar] [CrossRef]
- Humphreys, B.D.; Bonventre, J.V. Mesenchymal stem cells in acute kidney injury. Annu. Rev. Med. 2008, 59, 311–325. [Google Scholar] [CrossRef] [PubMed] [Green Version]
- Bussolati, B.; Hauser, P.; Carvalhosa, R.; Camussi, G. Contribution of Stem Cells to Kidney Repair. Curr. Stem Cell Res. Ther. 2009, 4, 2–8. [Google Scholar] [CrossRef] [PubMed]
- Lener, T.; Gimona, M.; Aigner, L.; Börger, V.; Buzas, E.; Camussi, G.; Chaput, N.; Chatterjee, D.; Court, F.A.; del Portillo, H.A.; et al. Applying extracellular vesicles based therapeutics in clinical trials—An ISEV position paper. J. Extracell. Vesicles 2015, 4. [Google Scholar] [CrossRef] [PubMed]
- Chargaff, E.; West, R. The biological significance of the thromboplastic protein of blood. J. Biol. Chem. 1946, 166, 189–197. [Google Scholar] [CrossRef]
- Park, K.S.; Bandeira, E.; Shelke, G.V.; Lässer, C.; Lötvall, J. Enhancement of therapeutic potential of mesenchymal stem cell-derived extracellular vesicles. Stem Cell Res. Ther. 2019, 10, 1–15. [Google Scholar] [CrossRef]
- Théry, C.; Witwer, K.W.; Aikawa, E.; Alcaraz, M.J.; Anderson, J.D.; Andriantsitohaina, R.; Antoniou, A.; Arab, T.; Archer, F.; Atkin-Smith, G.K.; et al. Minimal information for studies of extracellular vesicles 2018 (MISEV2018): A position statement of the International Society for Extracellular Vesicles and update of the MISEV2014 guidelines. J. Extracell. Vesicles 2018, 7, 1535750. [Google Scholar] [CrossRef] [PubMed] [Green Version]
- Willms, E.; Johansson, H.J.; Mäger, I.; Lee, Y.; Blomberg, K.E.M.; Sadik, M.; Alaarg, A.; Smith, C.I.E.; Lehtiö, J.; El Andaloussi, S.; et al. Cells release subpopulations of exosomes with distinct molecular and biological properties. Sci. Rep. 2016, 6, 22519. [Google Scholar] [CrossRef] [PubMed]
- Yáñez-Mó, M.; Siljander, P.R.-M.; Andreu, Z.; Zavec, A.B.; Borras, F.E.; Buzas, E.I.; Buzas, K.; Casal, E.; Cappello, F.; Carvalho, J.; et al. Biological properties of extracellular vesicles and their physiological functions. J. Extracell. Vesicles 2015, 4, 27066. [Google Scholar] [CrossRef] [PubMed] [Green Version]
- Leventis, P.A.; Grinstein, S. The Distribution and Function of Phosphatidylserine in Cellular Membranes. Annu. Rev. Biophys. 2010, 39, 407–427. [Google Scholar] [CrossRef] [PubMed]
- Mobarrez, F.; Sjövik, C.; Soop, A.; Hållström, L.; Frostell, C.; Pisetsky, D.S.; Wallén, H. CD40L expression in plasma of volunteers following LPS administration: A comparison between assay of CD40L on platelet microvesicles and soluble CD40L. Platelets 2014, 26, 486–490. [Google Scholar] [CrossRef] [PubMed]
- Bruno, S.; Tapparo, M.; Collino, F.; Chiabotto, G.; Deregibus, M.C.; Lindoso, R.S.; Neri, F.; Kholia, S.; Giunti, S.; Wen, S.; et al. Renal Regenerative Potential of Different Extracellular Vesicle Populations Derived from Bone Marrow Mesenchymal Stromal Cells. Tissue Eng. Part A 2017, 23, 1262–1273. [Google Scholar] [CrossRef]
- Aliotta, J.M.; Pereira, M.; Wen, S.; Dooner, M.S.; Del Tatto, M.; Papa, E.; Goldberg, L.R.; Baird, G.L.; Ventetuolo, C.; Quesenberry, P.J.; et al. Exosomes induce and reverse monocrotaline-induced pulmonary hypertension in mice. Cardiovasc. Res. 2016, 110, 319–330. [Google Scholar] [CrossRef] [Green Version]
- Wen, S.; Dooner, M.; Cheng, Y.; Papa, E.; del Tatto, M.; Pereira, M.; Deng, Y.; Goldberg, L.; Aliotta, J.; Chatterjee, D.; et al. Mesenchymal stromal cell derived extracellular vesicles rescue radiation damage to murine marrow hematopoietic cells Sicheng. Physiol. Behav. 2016, 176, 139–148. [Google Scholar]
- Xu, R.; Greening, D.W.; Rai, A.; Ji, H.; Simpson, R.J. Highly-purified exosomes and shed microvesicles isolated from the human colon cancer cell line LIM1863 by sequential centrifugal ultrafiltration are biochemically and functionally distinct. Methods 2015, 87, 11–25. [Google Scholar] [CrossRef] [PubMed]
- Witwer, K.W.; van Balkom, B.W.M.; Bruno, S.; Choo, A.; Dominici, M.; Gimona, M.; Hill, A.F.; de Kleijn, D.; Koh, M.; Lai, R.C.; et al. Defining mesenchymal stromal cell (MSC)-derived small extracellular vesicles for therapeutic applications. J. Extracell. Vesicles 2019, 8. [Google Scholar] [CrossRef] [Green Version]
- Gimona, M.; Brizzi, M.F.; Choo, A.B.H.; Dominici, M.; Davidson, S.M.; Grillari, J.; Hermann, D.M.; Hill, A.F.; de Kleijn, D.; Lai, R.C.; et al. Critical considerations for the development of potency tests for therapeutic applications of mesenchymal stromal cell-derived small extracellular vesicles. Cytotherapy 2021, 23, 373–380. [Google Scholar] [CrossRef]
- Caruso, S.; Poon, I.K.H. Apoptotic cell-derived extracellular vesicles: More than just debris. Front. Immunol. 2018, 9, 1486. [Google Scholar] [CrossRef] [PubMed] [Green Version]
- Crescitelli, R.; Lässer, C.; Szabó, T.G.; Kittel, A.; Eldh, M.; Dianzani, I.; Buzás, E.I.; Lötvall, J. Distinct RNA profiles in subpopulations of extracellular vesicles: Apoptotic bodies, microvesicles and exosomes. J. Extracell. Vesicles 2013, 2, 1–10. [Google Scholar] [CrossRef]
- Kowal, J.; Arras, G.; Colombo, M.; Jouve, M.; Morath, J.P.; Primdal-Bengtson, B.; Dingli, F.; Loew, D.; Tkach, M.; Théry, C. Proteomic comparison defines novel markers to characterize heterogeneous populations of extracellular vesicle subtypes. Proc. Natl. Acad. Sci. USA 2016, 113, E968–E977. [Google Scholar] [CrossRef] [Green Version]
- Adachi, K.; Osaki, M.; Kase, S.; Takeda, A.; Ito, H. Anti-Fas antibody-induced apoptosis and its signal transduction in human gastric carcinoma cell lines. Int. J. Oncol. 2003, 23, 713–719. [Google Scholar] [CrossRef] [PubMed]
- Wang, Y.; Xia, C.; Lv, Y.; Li, C.; Mei, Q.; Li, H.; Wang, H.; Li, S. Crosstalk Influence between P38MAPK and Autophagy on Mitochondria-Mediated Apoptosis Induced by Anti-Fas Antibody/Actinomycin D in Human Hepatoma Bel-7402 Cells. Molecules 2017, 22, 1705. [Google Scholar] [CrossRef] [PubMed] [Green Version]
- Tixeira, R.; Caruso, S.; Paone, S.; Baxter, A.A.; Atkin-Smith, G.K.; Hulett, M.D.; Poon, I.K.H. Defining the morphologic features and products of cell disassembly during apoptosis. Apoptosis 2017, 22, 475–477. [Google Scholar] [CrossRef]
- Giebel, B.; Kordelas, L.; Börger, V. Clinical potential of mesenchymal stem/stromal cell-derived extracellular vesicles. Stem Cell Investig. 2017, 4, 84. [Google Scholar] [CrossRef] [PubMed] [Green Version]
- EV-TRACK Consortium; Van Deun, J.; Mestdagh, P.; Agostinis, P.; Akay, A.; Anand, S.; Anckaert, J.; Martinez, Z.A.; Baetens, T.; Beghein, E.; et al. EV-TRACK: Transparent reporting and centralizing knowledge in extracellular vesicle research. Nat. Methods 2017, 14, 228–232. [Google Scholar] [CrossRef]
- Rohde, E.; Pachler, K.; Gimona, M. Manufacturing and characterization of extracellular vesicles from umbilical cord–derived mesenchymal stromal cells for clinical testing. Cytotherapy 2019, 21, 581–592. [Google Scholar] [CrossRef]
- Han, C.; Kang, H.; Yi, J.; Kang, M.; Lee, H.; Kwon, Y.; Jung, J.; Lee, J.; Park, J. Single-vesicle imaging and co-localization analysis for tetraspanin profiling of individual extracellular vesicles. J. Extracell. Vesicles 2021, 10, e12047. [Google Scholar] [CrossRef] [PubMed]
- Jeong, H.; Han, C.; Cho, S.; Gianchandani, Y.; Park, J. Analysis of Extracellular Vesicles Using Coffee Ring. ACS Appl. Mater. Interfaces 2018, 10, 22877–22882. [Google Scholar] [CrossRef] [PubMed]
- Kovalenko, O.V.; Yang, X.; Kolesnikova, T.V.; Hemler, M.E. Evidence for specific tetraspanin homodimers: Inhibition of palmitoylation makes cysteine residues available for cross-linking. Biochem. J. 2004, 377, 407–417. [Google Scholar] [CrossRef] [Green Version]
- Hadjiargyrou, M.; Kaprielian, Z.; Kato, N.; Patterson, P.H. Association of the Tetraspan Protein CD9 with Integrins on the Surface of S-16 Schwann Cells. J. Neurochem. 2002, 67, 2505–2513. [Google Scholar] [CrossRef]
- Kern, S.; Eichler, H.; Stoeve, J.; Klüter, H.; Bieback, K. Comparative Analysis of Mesenchymal Stem Cells from Bone Marrow, Umbilical Cord Blood, or Adipose Tissue. Stem Cells 2006, 24, 1294–1301. [Google Scholar] [CrossRef] [PubMed]
- Wiklander, O.P.B.; Bostancioglu, R.B.; Welsh, J.A.; Zickler, A.M.; Murke, F.; Corso, G.; Felldin, U.; Hagey, D.W.; Evertsson, B.; Liang, X.; et al. Systematic methodological evaluation of a multiplex bead-based flow cytometry assay for detection of extracellular vesicle surface signatures. Front. Immunol. 2018, 9. [Google Scholar] [CrossRef] [PubMed] [Green Version]
- Gamperl, H.; Plattfaut, C.; Freund, A.; Quecke, T.; Theophil, F.; Gieseler, F. Extracellular vesicles from malignant effusions induce tumor cell migration: Inhibitory effect of LMWH tinzaparin. Cell Biol. Int. 2016, 40, 1050–1061. [Google Scholar] [CrossRef] [Green Version]
- Chance, T.C.; Rathbone, C.R.; Kamucheka, R.M.; Peltier, G.C.; Cap, A.P.; Bynum, J.A. The effects of cell type and culture condition on the procoagulant activity of human mesenchymal stromal cell-derived extracellular vesicles. J. Trauma Acute Care Surg. 2019, 87 (Suppl. 1), S74–S82. [Google Scholar] [CrossRef]
- Silachev, D.; Goryunov, K.; Shpilyuk, M.; Beznoschenko, O.; Morozova, N.; Kraevaya, E.; Popkov, V.; Pevzner, I.; Zorova, L.; Evtushenko, E.; et al. Effect of MSCs and MSC-Derived Extracellular Vesicles on Human Blood Coagulation. Cells 2019, 8, 258. [Google Scholar] [CrossRef]
- Atkin-Smith, G.K.; Tixeira, R.; Paone, S.; Mathivanan, S.; Collins, C.; Liem, M.; Goodall, K.; Ravichandran, K.; Hulett, M.; Poon, I.K. A novel mechanism of generating extracellular vesicles during apoptosis via a beads-on-a-string membrane structure. Nat. Commun. 2015, 6, 7439. [Google Scholar] [CrossRef] [PubMed]


| 100k | 10k | |||||||
|---|---|---|---|---|---|---|---|---|
| Naive | Mode (nm) | SD | Concentration (Particles/mL) | SD | Mode (nm) | SD | Concentration (Particles/mL) | SD |
| BM | 187.70 | 14.31 | 5.1 × 10⁸ | 2.4 × 10⁸ | 188.83 | 2.73 | 5.8 × 10⁸ | 3.1 × 10⁸ |
| UC | 184.23 | 19.63 | 3.6 × 10⁸ | 2.1 × 10⁸ | 197.07 | 8.54 | 6.8 × 10⁸ | 4.9 × 10⁸ |
| AT | 208.53 | 26.44 | 6.2 × 10⁸ | 2.5 × 10⁸ | 238.61 | 25.38 | 6.2 × 10⁸ | 2.7 × 10⁸ |
| 100k | 10k | |||||||
| Apoptotic | Mode (nm) | SD | Concentration (Particles/mL) | SD | Mode (nm) | SD | Concentration (Particles/mL) | SD |
| BM | 183.67 | 15.63 | 1.4 × 10⁹ | 1.1 × 10⁹ | 169.10 | 18.71 | 1.4 × 10⁹ | 1.1 × 10⁹ |
| UC | 179.57 | 16.24 | 7.8 × 10⁹ | 9.0 × 10⁹ | 211.03 | 14.61 | 1.2 × 10⁹ | 1.4 × 10⁹ |
| AT | 170.90 | 35.94 | 1.1 × 10⁹ | 6.7 × 10⁸ | 202.77 | 22.80 | 7.9 × 10⁹ | 1.0 × 10⁹ |
| Sample | TEM | Super-Resolution Microscopy | ExoView (50–200 nm Detection) | |
|---|---|---|---|---|
| SIZE 100k EVs [nm] | BM | 40–100 | 88.00 ± 7.94 | 61.85 ± 3.64 |
| UC | 40–100 | 88.00 ± 3.46 | 59.14 ± 2.03 | |
| AT | 40–100 | 98.00 ± 2.11 | 59.92 ± 2.72 | |
| SIZE 10k EVs [nm] | BM | 100–300 | 140.00 ± 5.77 | 90.00 ± 1.73 |
| UC | 100–300 | 120.00 ± 5.77 | 90.33 ± 2.34 | |
| AT | 100–300 | 120.00 ± 8.42 | 92.83 ± 5.08 |
Publisher’s Note: MDPI stays neutral with regard to jurisdictional claims in published maps and institutional affiliations. |
© 2021 by the authors. Licensee MDPI, Basel, Switzerland. This article is an open access article distributed under the terms and conditions of the Creative Commons Attribution (CC BY) license (https://creativecommons.org/licenses/by/4.0/).
Share and Cite
Skovronova, R.; Grange, C.; Dimuccio, V.; Deregibus, M.C.; Camussi, G.; Bussolati, B. Surface Marker Expression in Small and Medium/Large Mesenchymal Stromal Cell-Derived Extracellular Vesicles in Naive or Apoptotic Condition Using Orthogonal Techniques. Cells 2021, 10, 2948. https://doi.org/10.3390/cells10112948
Skovronova R, Grange C, Dimuccio V, Deregibus MC, Camussi G, Bussolati B. Surface Marker Expression in Small and Medium/Large Mesenchymal Stromal Cell-Derived Extracellular Vesicles in Naive or Apoptotic Condition Using Orthogonal Techniques. Cells. 2021; 10(11):2948. https://doi.org/10.3390/cells10112948
Chicago/Turabian StyleSkovronova, Renata, Cristina Grange, Veronica Dimuccio, Maria Chiara Deregibus, Giovanni Camussi, and Benedetta Bussolati. 2021. "Surface Marker Expression in Small and Medium/Large Mesenchymal Stromal Cell-Derived Extracellular Vesicles in Naive or Apoptotic Condition Using Orthogonal Techniques" Cells 10, no. 11: 2948. https://doi.org/10.3390/cells10112948