Article

Assessment of Blue Water Migration and Efficiency in Water-Saving Irrigation Paddy Rice Fields Using the Water Flow Tracking Method

1
College of Agricultural Science and Engineering, Hohai University, Nanjing 210098, China
2
Nanjing Hydraulic Research Institute, Nanjing 210029, China
3
College of Water Conservancy and Civil Engineering, South China Agricultural University, Guangzhou 510642, China
4
Jiangsu Province Engineering Research Center for Agricultural Soil-Water Efficient Utilization, Carbon Sequestration and Emission Reduction, Nanjing 210098, China
*
Author to whom correspondence should be addressed.
Agronomy 2024, 14(1), 166; https://doi.org/10.3390/agronomy14010166
Submission received: 13 December 2023 / Revised: 4 January 2024 / Accepted: 8 January 2024 / Published: 11 January 2024

Abstract

:
Although irrigation systems largely sustain global agricultural production, their efficiency is often alarmingly low. While irrigation water (blue water) is critical for the water-saving irrigation of rice with a high water demand, the process and efficiency of irrigation water utilization need clarification. In this study, we examined the three commonly used irrigation and drainage patterns (frequent shallow irrigation (FSI), wet and shallow irrigation (WSI), and rain-catching and controlled irrigation (RCI)) in rice fields. We developed a tracking method for irrigation water flow decomposition, which includes irrigation water evapotranspiration (IET), irrigation water drainage (IDR), irrigation water leakage (IPC), and irrigation water field residual (IRE). Using this method, we established an irrigation water efficiency evaluation index system and a comprehensive evaluation method. Our tracking method is relevant to describing the irrigation water performance under varying irrigation and drainage patterns. The results revealed that the average irrigation water input for the three irrigation and drainage patterns between 2015 and 2018 was roughly 312.5 mm, wherein IET accounted for 148 mm. However, more than 50% of the irrigation water outflow, comprising IDR, IPC, and IRE, exceeded the total amount of irrigation water input. The mean values of the gross irrigation efficiency (GIE), net irrigation efficiency (NIE), and effective consumption ratio (ECR) for all treatments in the three-year period were 0.63, 0.47, and 0.75, respectively. Additionally, the irrigation water use efficiency was significantly higher in dry years compared to wet years. The fuzzy composite rating values of the three irrigation and drainage models from 2015 to 2018 were RCI, WSI, and FSI, in descending order, under varying precipitation conditions. The RCI patterns maintained a high composite rating value (greater than 3.0) under different precipitation conditions. Previous efficiency calculations disregarded the blue–green water migration process and did not differentiate the blue–green water flow direction in agricultural fields, creating significant biases in the outcomes. This study’s method offers a new approach to evaluate the use of blue water resources in farmland.

1. Introduction

The depletion of freshwater resources has raised serious concerns about global food security and the sustainability of water use in agriculture. Agriculture is the largest consumer of freshwater globally, with irrigation accounting for 70% of the world’s average total freshwater abstraction [1,2,3,4]. In China alone, the total irrigation area has surged by over three-fold, from 15.9 million hectares to 61.7 million hectares in the past six decades [5,6,7]. This expansion, however, exacerbates the already-uneven distribution of arable land and available water resources, leading to serious problems. Efficient water-saving techniques are essential to alleviate the pressure on water resources and enhance agricultural sustainability [8,9]. As argued by Benedetti [10], improved agricultural water utilization standards can promote the sustainable use of water resources [11]. However, the effectiveness of these standards depends on their scientific evaluation and efficiency.
The traditional focus of water resources’ planning and management has been on optimizing the diversion, storage, and redistribution of irrigation water for agricultural use [12,13]. Given the direct link between irrigation and ensuring the safety of grain production [14], the utilization of irrigation water involves competition with other stakeholders for water resources, leading to increased costs [15,16]. Specifically, agricultural water use and efficiency evaluations are performed through the following three categories of approaches: the appropriation amount, the effective utilization rate, and the production ability of water resources. Among them, the irrigation water intake (IWI) and irrigation water consumption (IWC), which are closely related to irrigation facilities, are the foundation of water resources management strategies formulated by the government sector [17,18]. Based on the calculated water consumption, indices such as irrigation efficiency (IE) and water productivity are used to evaluate the effective utilization rate and production capacity [19,20]. Traditionally, IE is defined as the ratio of the irrigation water consumed by crops to the total irrigation water supplied from the surface water, the underground water, or intakes [21,22]. IE is widely put on water-saving irrigation, optimizing irrigation management, and the modernization and maintenance of large-scale irrigation systems [23,24]. Water productivity is an index to evaluate the productive competence of agricultural water resources. It is defined as the crop yield per water input and calculated as the ratio of the crop yield to the water input. The development of agricultural water-saving irrigation systems is guided by the above three indices, to some extent [25]. The highly efficient utilization of water resources and high agricultural yield can be achieved by formulating reasonable drinking water and water distribution schemes and improving field irrigation methods in all areas [26,27]. However, traditional evaluation methods consider only the allocation and utilization efficiency of irrigation water and ignore the utilization process of blue and green water resources in irrigation systems, which results in a form of sub-optimization [28].
A water footprint evaluation, which is an innovative territory, provides a new perspective for water management. The evaluation of water resources’ utilization on the premise of distinguishing the attribute of blue and green water is important research content for green and highly efficient water use in agriculture, but it is difficult to apply this concept in real circumstances of crop water consumption [29]. Currently, the assessment of blue and green water consumption and efficiency primarily operates at the country, regional, or irrigated area scale [30,31]. The evaluation encompasses water usage by crops, water delivery and distribution processes, engineering oversight, natural factors, and other relevant components [32,33]. During the actual growth process of crops, a lot of blue and green water is artificially transported to the soil and is not effectively utilized by the plants [34]. The consumption and loss of blue and green water resources mostly occur in the irrigation and drainage systems of the field scale [35]. However, since the migration process of blue and green water resources is complex in the field irrigation and drainage systems, and it is hard to effectively distinguish the input, utilization, and migration of the blue and green water resources, there is a large deviation between the efficiency evaluation of water resources’ utilization in terms of field scale and the real consumption, especially under the circumstances of rice field water-saving irrigation [36,37]. Although water-saving irrigation and drainage modes of rice have been widely accepted, because of frequent precipitation events in rice-growing areas and complex interaction processes between blue and green water at different growth stages, inappropriate water-saving irrigation and drainage modes will cause a huge waste of field water and lead to the non-point source pollution that influences environmental quality during the planting period [38,39]. Therefore, the perspective of rice field water-saving irrigation evaluation should focus on the consumption of water resources and the consumption process of blue and green water resources as crops grow from not only a large scale but also a field scale, and only by doing so can accurate information be provided for field irrigation management and the coordinated regulation of blue and green water in a region [40]. It is the basis for the accurate calculation of the efficiency of field water resources to pay attention to the characteristics of the dynamic balance between blue and green water and clarify the migration rule of different types of water resources. This method is different from the traditional calculation of blue water consumption, namely the difference between blue evapotranspiration (ET) under irrigation conditions and ET under rain-fed conditions.
The evaluation of water resources’ utilization on the premise of distinguishing the attribute of blue and green water is an important piece of research in green and highly efficient water use in agriculture. But, a traditional water-saving irrigation evaluation takes the whole growth stage as a time step, only calculates ET, and neglects the complex process of water movement in fields, so it is difficult to accurately evaluate the utilization efficiency of blue water resources and it cannot accurately reveal the utilization manifestation of blue water resources. On the basis of observational experiments on blue and green water migration in rice fields in south China, this study aims to describe the actual irrigation water balance process of blue water resources as crops grow with the time step of day, establish a field water utility assessment indices system based on blue–green water differentiation, and evaluate the specific manifestation of irrigation water use efficiency under different precipitation conditions and irrigation modes from different perspectives based on the transformation of the blue and green water process in fields. On this basis, a comprehensive evaluation system for blue water resources in rice fields is built from the three aspects of utilization efficiency, productive competence, and the water-saving trait of blue water with the help of an analytic hierarchy process, and different irrigation and drainage modes are ranked. The results from the analysis will contribute to the optimization of water management practices in rice cultivation, which is a critical aspect of sustainable agriculture.

2. Materials and Methods

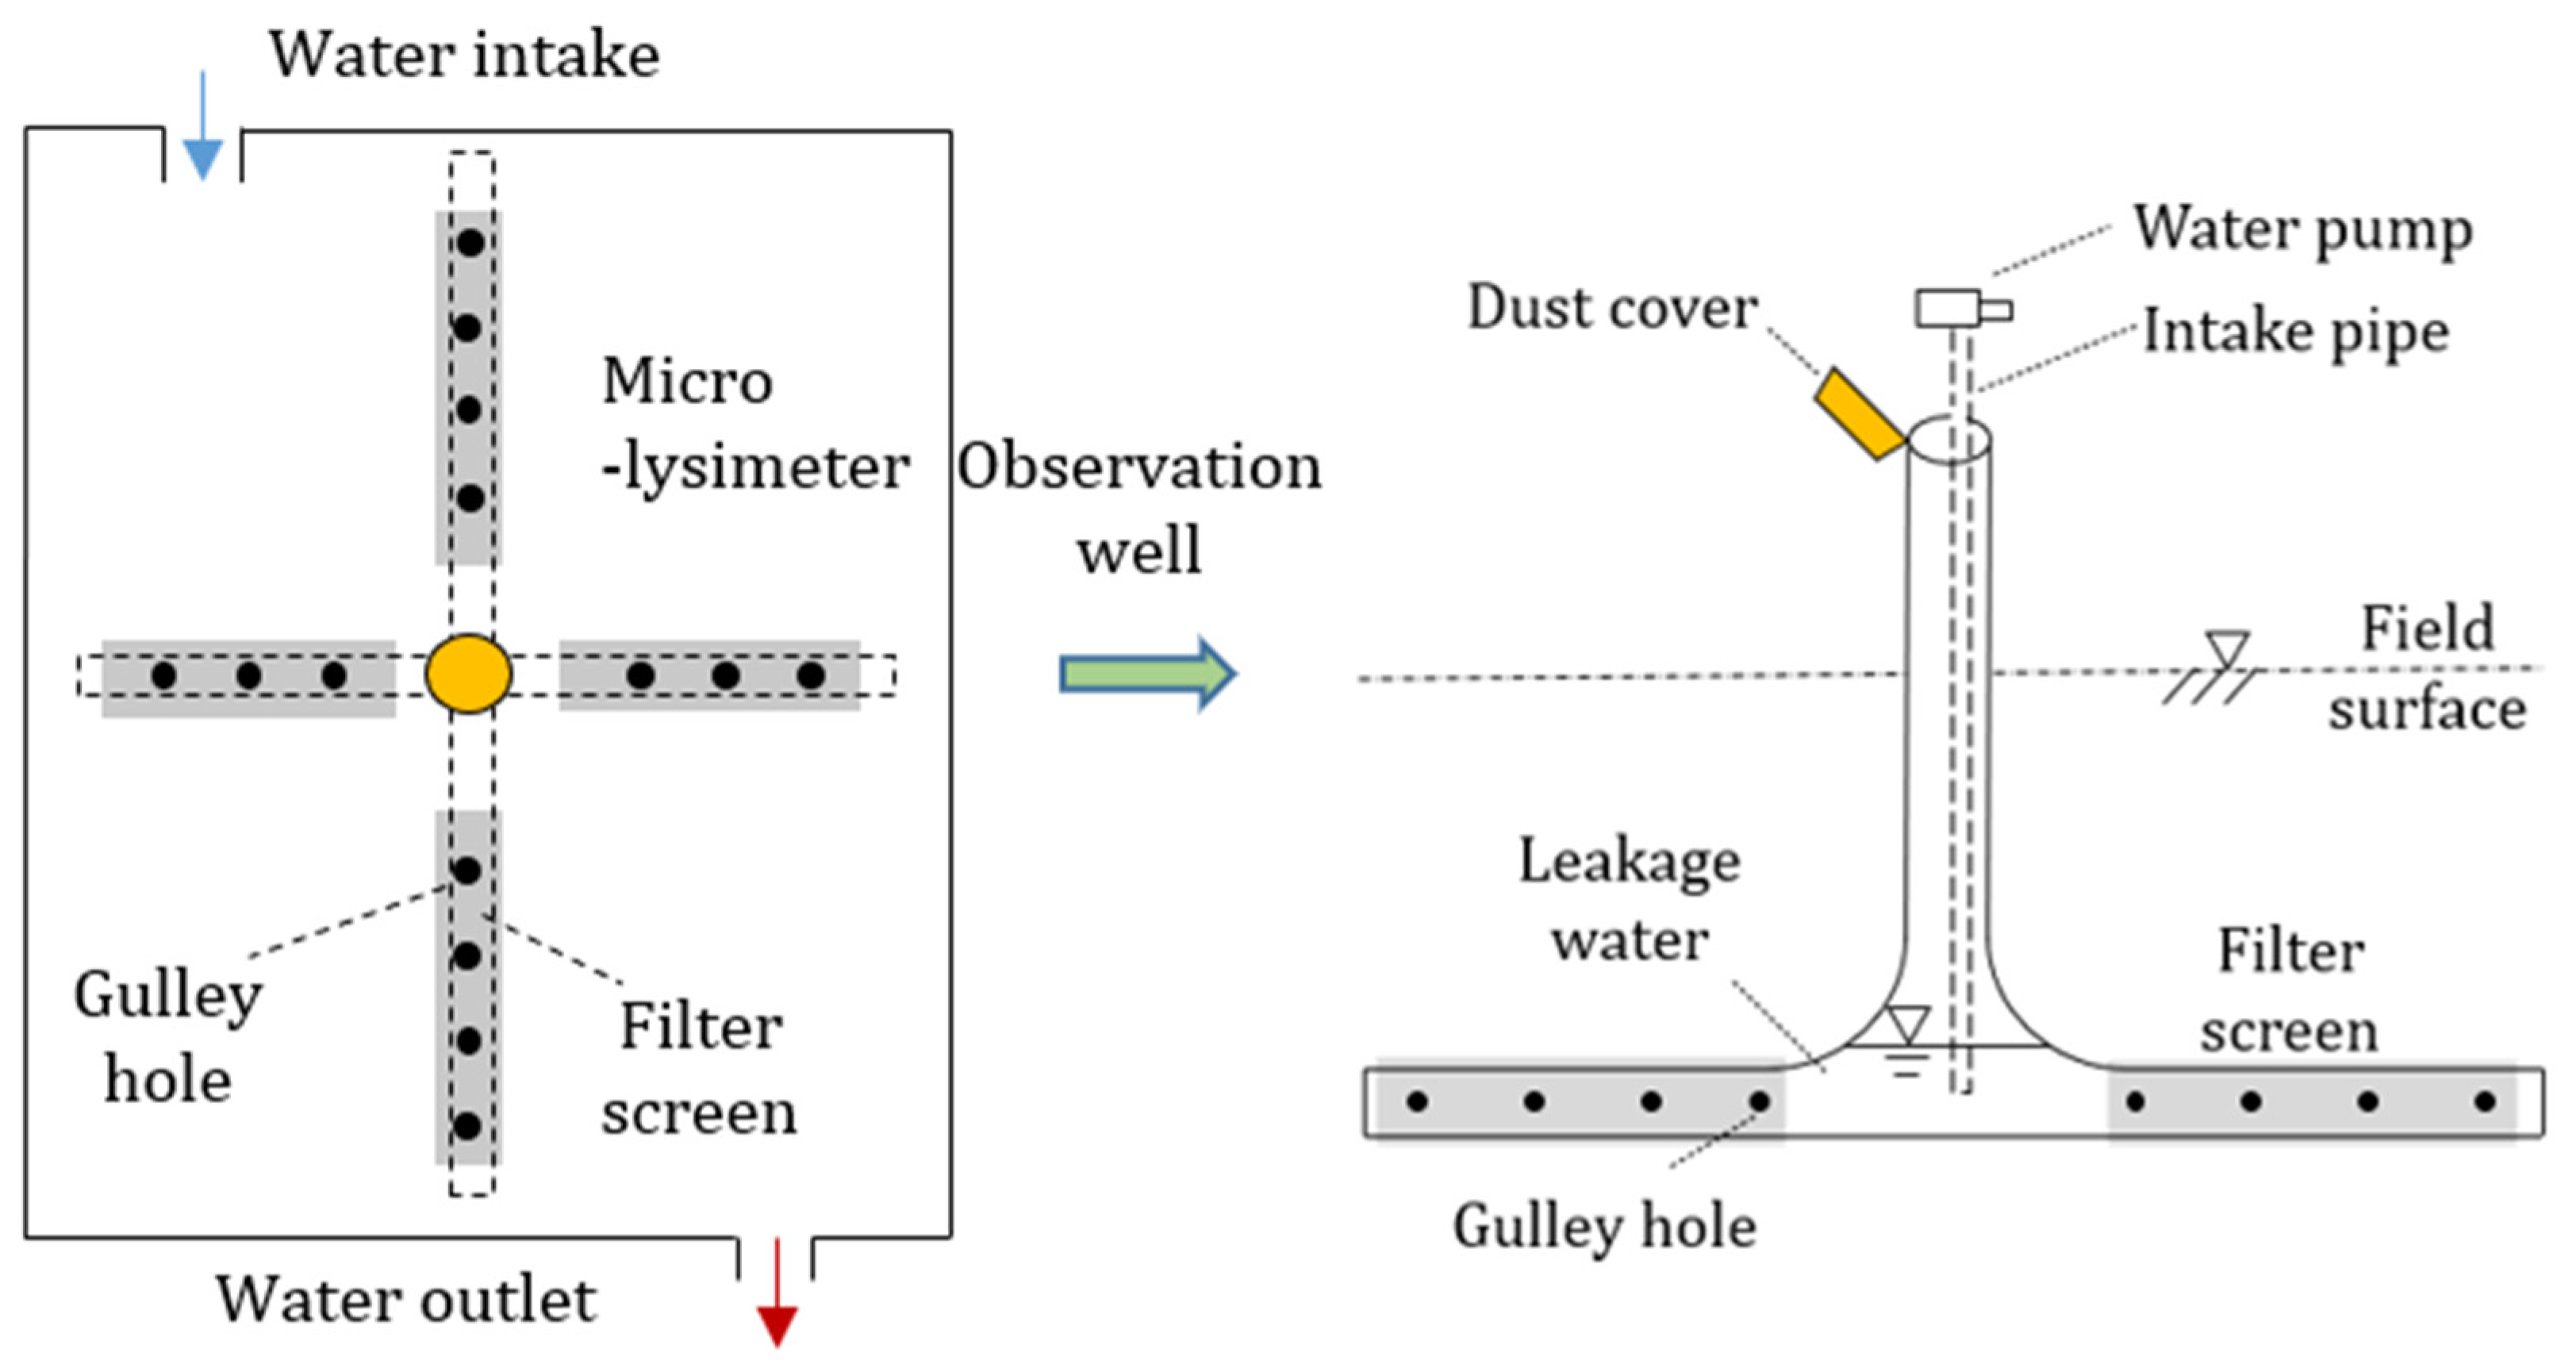
2.1. Experiment and Data

The study was conducted from 2015 to 2018 at the Key Laboratory of Efficient Irrigation–Drainage and Agricultural Soil–Water Environment under the auspices of the Ministry of Education, located in Nanjing, Jiangsu Province, East China (Lat. 31°57′ N, Long. 118°50′ E). The study area has a sub-tropical humid monsoon climate with an average annual temperature of 15.4 °C. The average precipitation, evaporation, and frost-free period are 1107 mm, 872 mm, and approximately 220 days from 2015 to 2018, respectively. The region’s rice cultivation relies on clayey soils.
The experiment included three widely used field water management policies: frequent and shallow irrigation (FSI), wet and shallow irrigation (WSI), and rain-catching and controlled irrigation (RCI) (Table 1). Paddy was planted in late June in a micro-lysimeter (Figure 1) measuring 0.90 m in length, 0.68 m in width, and 0.67 m in depth, and harvested in late October. The paddy in the study area was planted for one year in a row, with a growth period of 125 days. Fertilization was conducted in accordance with local practices. In total, 300 kg/hm2 of compound fertilizer (N:P2O5:K2O = 15:15:15) and 425 kg/hm2 of urea (nitrogen content: 46.2%) were applied to each cell during the crop growth period. The observation indexes of the two water management policies were the same. Daily weather data (PRE[t]), field water level (FWL[t]), irrigation water use and surface drainage (IRR[t] or DRA[t]), and underground leakage (LEA[t]) were measured in the laboratory. After the growth period, the actual yield of rice was calculated.

2.2. Blue Water Migration and Efficiency Performance Indicators

The process of blue water migration in rice fields is primarily influenced by anthropogenic field water control, encompassing both irrigation and drainage. This process is characterized by three stages. In the first stage, prior to crop transplantation, precipitation (PRE) is the sole source of field water, and the water balance process does not involve blue water. In the second stage, during the crop growth phase, the proportions of blue and green water included in each water balance parameter vary depending on field water control measures, as the timing of irrigation and drainage is often uncertain. Finally, any remaining blue and green water at the end of the cropping season is lost through runoff and evaporation. Therefore, the daily water balance equation for a rice field is:
F W L [ T 1 ] + P R E [ T ] + I N [ T ] + C R [ T ] = E T A T + D R A T + L E A T + F W L T
where FWL[T-1] (mm) is the field water layer at the end of day T-1, PRE[T] (mm) is the precipitation on day T, I N [ T ] (mm) is blue water inflow on day T, C R [ T ] (mm) is the capillary rise from groundwater, C R [ T ] is zero in the micro-lysimeter, E T A T is the daily actual evapotranspiration (mm), F W L T (mm) refers to the field water layer depth at the end of day T, D R A T (mm) is the daily surface drainage, and L E A T (mm) is the daily underground leakage.
The water balance equations for blue water and green water at the daily scale are constructed separately based on the principle of dynamic water balance in the field. A computational approach is used to track the proportion of green and blue water in different soil and vegetation layers, and the green and blue water in each layer change is estimated on a daily time-scale basis. A systematic record of the green–blue water composition was made for each field water layer (soil water content). The amount of green water in the soil or water layer increased when precipitation entered the layer. When irrigation water entered the layer, the amount of blue water in that layer increased. The daily green and blue field water layers are calculated as
F W L g r e e n T = F W L g r e e n T 1 + P R E T + I N T D R A T × P R E T P R E T + I N T L E A T + E T A T × F W L g r e e n T 1 F W L T 1 F W L b l u e T = F W L b l u e T 1 + P R E T + I N T D R A T × I N T P R E T + I N T L E A T + E T A T × F W L b l u e T 1 F W L T 1
The portion of E T A T , D R A T , L E A T from blue water in each daily water balance element in the field is calculated by the proportion of blue water and green water in the field at the end of the previous day. It should be noted that the formation of surface drainage from paddy fields is different from the formation of surface runoff from dry crops, which is determined by the irrigation system, so it is also calculated according to the above method. Following Li [41], E T T   , P E T a n d   D R T   are obtained by tracking the proportion of blue water in the field water layer (soil water content) daily. Therefore, blue water migration parameters during the rice reproductive period were calculated as follows:
E T [ T ] = F W L b l u e [ T 1 ] F W L T 1 × E T A [ T ]
P E [ T ] = F W L b l u e [ T 1 ] F W L T 1 × L E A [ T ]
P E [ T ] = F W L b l u e [ T 1 ] F W L T 1 × L E A T
E T [ T ] is the daily actual blue water evapotranspiration (mm), P E [ T ] (mm) refers to the blue water percolation at the end of day T, and D R (mm) is the blue water drainage. Human-driven water transport processes (irrigation, field water control) can be expressed as:
I N = E T + D R + P E + R E
According to the definition of blue water in soil and water balance, the efficiency of blue water utilization in the field was calculated. The definitions of efficiency terms were refined in the 1982 edition. Distribution efficiency was defined as the ratio of the volume of water furnished to the fields to the volume of water delivered to the distribution system. Field application efficiency was defined as the ratio of the volume of irrigation water needed, and made available for E T by the crop to avoid undesirable water stress in the plants throughout the growing cycle, to the volume of water furnished to the fields.
In this study, three indicators were selected to measure the degree of effective use of blue water resources in the field, namely: gross irrigation efficiency ( G I E ) (the proportion of irrigation water consumed in the form of evapotranspiration that can be stored in the field and soil as a percentage of irrigation water use); net irrigation efficiency ( N I E ) (the proportion of actual evapotranspiration of field crops as a percentage of irrigation water use); and effective consumption ratio ( E C R ) (as the proportion of actual evapotranspiration from field crops to the irrigation water that can be stored in the field and soil and consumed in the form of evapotranspiration), which can be expressed as follows,
G I E = ( E T + R E ) / I N
N I E = E T / I N
E C R = E T / ( E T + R E )
Also, three specific indicators have been chosen to measure the output capacity of blue water resources, namely: gross water productivity (crop harvest yield per unit of irrigation water use, G W P ); net water productivity (crop harvest yield per unit of irrigation evapotranspiration, N W P ); and marginal water productivity (the marginal crop yield that can be obtained per unit of irrigation water used, M W P )
G W P = H C Y / I N
N W P = H C Y / E T
M W P = ( H C Y R C Y ) / I N
where, H C Y is harvested crop yield per unit (kg/hm2); R C Y is rain-fed crop yield per unit (kg/hm2); and C Y I is crop yield increase per unit (kg/hm2).

2.3. Fuzzy Comprehensive Evaluation

2.3.1. Index System

In order to select the most important index to evaluate the irrigation management level, the fuzzy comprehensive evaluation among irrigation experts participating in agricultural water management was conducted in this study. In our study, the fuzzy comprehensive evaluation consisted of a series of questionnaires, in which experts were asked to attain the important indicators. The evaluation hierarchy, consisting of objective, criteria, sub-criteria, and attribute levels, was built up as Table 2 has shown. The hierarchy was classified into 3 sorts of second-grade indices and 10 third-grade indices.
The classification of index grades and the corresponding threshold determination form the basis of water resource use efficiency evaluation in paddy fields. A considerable number of studies on the evaluation of agricultural water resource use efficiency have been conducted both nationally and internationally with some indicators and evaluation standards widely recognized. For such indicators, reference can be made to internationally and domestically recognized standard values or the index values stipulated in national or regional development planning. For some of the parameters where recognized evaluation standards are lacking at present, they are determined by using the optimal selection method or consulting experts. The frequency thresholds are determined based on the five-grade standards: level Ⅰ (low), Ⅱ (medium–low), Ⅲ (medium), Ⅳ(medium–high), and Ⅴ (high).

2.3.2. AHP Method

Once the hierarchy of the index system was established (Table 3), the relative importance of the indices was determined within each level in respect to the related criteria in the adjacent higher level according to the experience and knowledge of experts, which made the paired comparison for each layer of the index. Then, the judgment matrix A = ( a i j ) n × n will be constructed by the results of every evaluator’s pair-wise comparison. a i j is the relative importance of two indices to the above level, divided into 1–9 (Table 4) [42]. In this study, we distributed 12 expert evaluation sheets and successfully retrieved all 12 responses. To assess the established index system, three judgment matrices were developed for the index layer and one judgment matrix for the criterion layer, resulting in a total of four judgment matrices.
A = a 11 a 12 a 1 n a 21 a 22   a 2 n a n 1 a n 2 a n n
The maximum eigenvalue (λ max) and its corresponding eigenvector ( X = X 1 , X 2 , , X n ) of the obtained judgment matrix is calculated to satisfy AX = λX. The weight vector (W) can be attained by normalizing the eigenvector (X)
W = X 1 i = 1 n X i , X 2 i = 1 n X i , , X n i = 1 n X i = W 1 ,   W 2 , , W n
As the evaluation system is complex and, inevitably, the choices made by experts are often one-sided and subjective, judgment matrices for different experts might not be consistent. Thus, the random consistency ratio (CR) is proposed for consistency check before the weight vector is calculated.
C R = C I R I
where (CI) is consistency indicator, C I = λ m a x n n 1 ; RI is the average random consistency index; and the (RI) reference values for different n numbers refer to Sun et al (2016) [42]. When CR < 0.1, the judgment matrix can be considered to satisfy the consistency condition, otherwise, the matrix should be adjusted to meet the consistency.

2.3.3. Fuzzy Comprehensive Evaluation Method

Fuzzy comprehensive evaluation is an evaluation method resulting from fuzzy inference [43,44], combining with quantitative and qualitative analysis, unifying precision and imprecision. The membership function of agricultural water management was determined according to the evaluation standard of evaluation indices, which would be calculated by linear membership function with lower semi-trapezoidal distribution in this study. The basic steps are as follows: ① Determine the weight coefficient A of each layer; ② calculate the single-factor indicator layer affiliation degree and deduce the judgement matrix R (the degree of membership for a single-factor index layer is calculated and the evaluation matrix, R, is derived—for positive indicators, a higher value indicates better performance, while for negative indicators, a lower value indicates better performance). ③ Establish the model and calculate the comprehensive evaluation value. The evaluation score is calculated using the following formula:
P = B     S = A     R ( 1,2 , 3,4 , 5 ) T
where P is the judgement result, B is the affiliation of each evaluation area to each evaluation level, S is the set of comments, A is the matrix of weight coefficients, is fuzzy operator, and R is the total single-indicator judgement matrix. In calculating the comprehensive evaluation value of the target layer, the membership degree of the criterion layer should be normalized according to the actual circumstances. Based on the evaluation value, the grade is determined, and an efficient irrigation and drainage mode is selected. Higher comprehensive scores denote increased efficiency.

3. Results

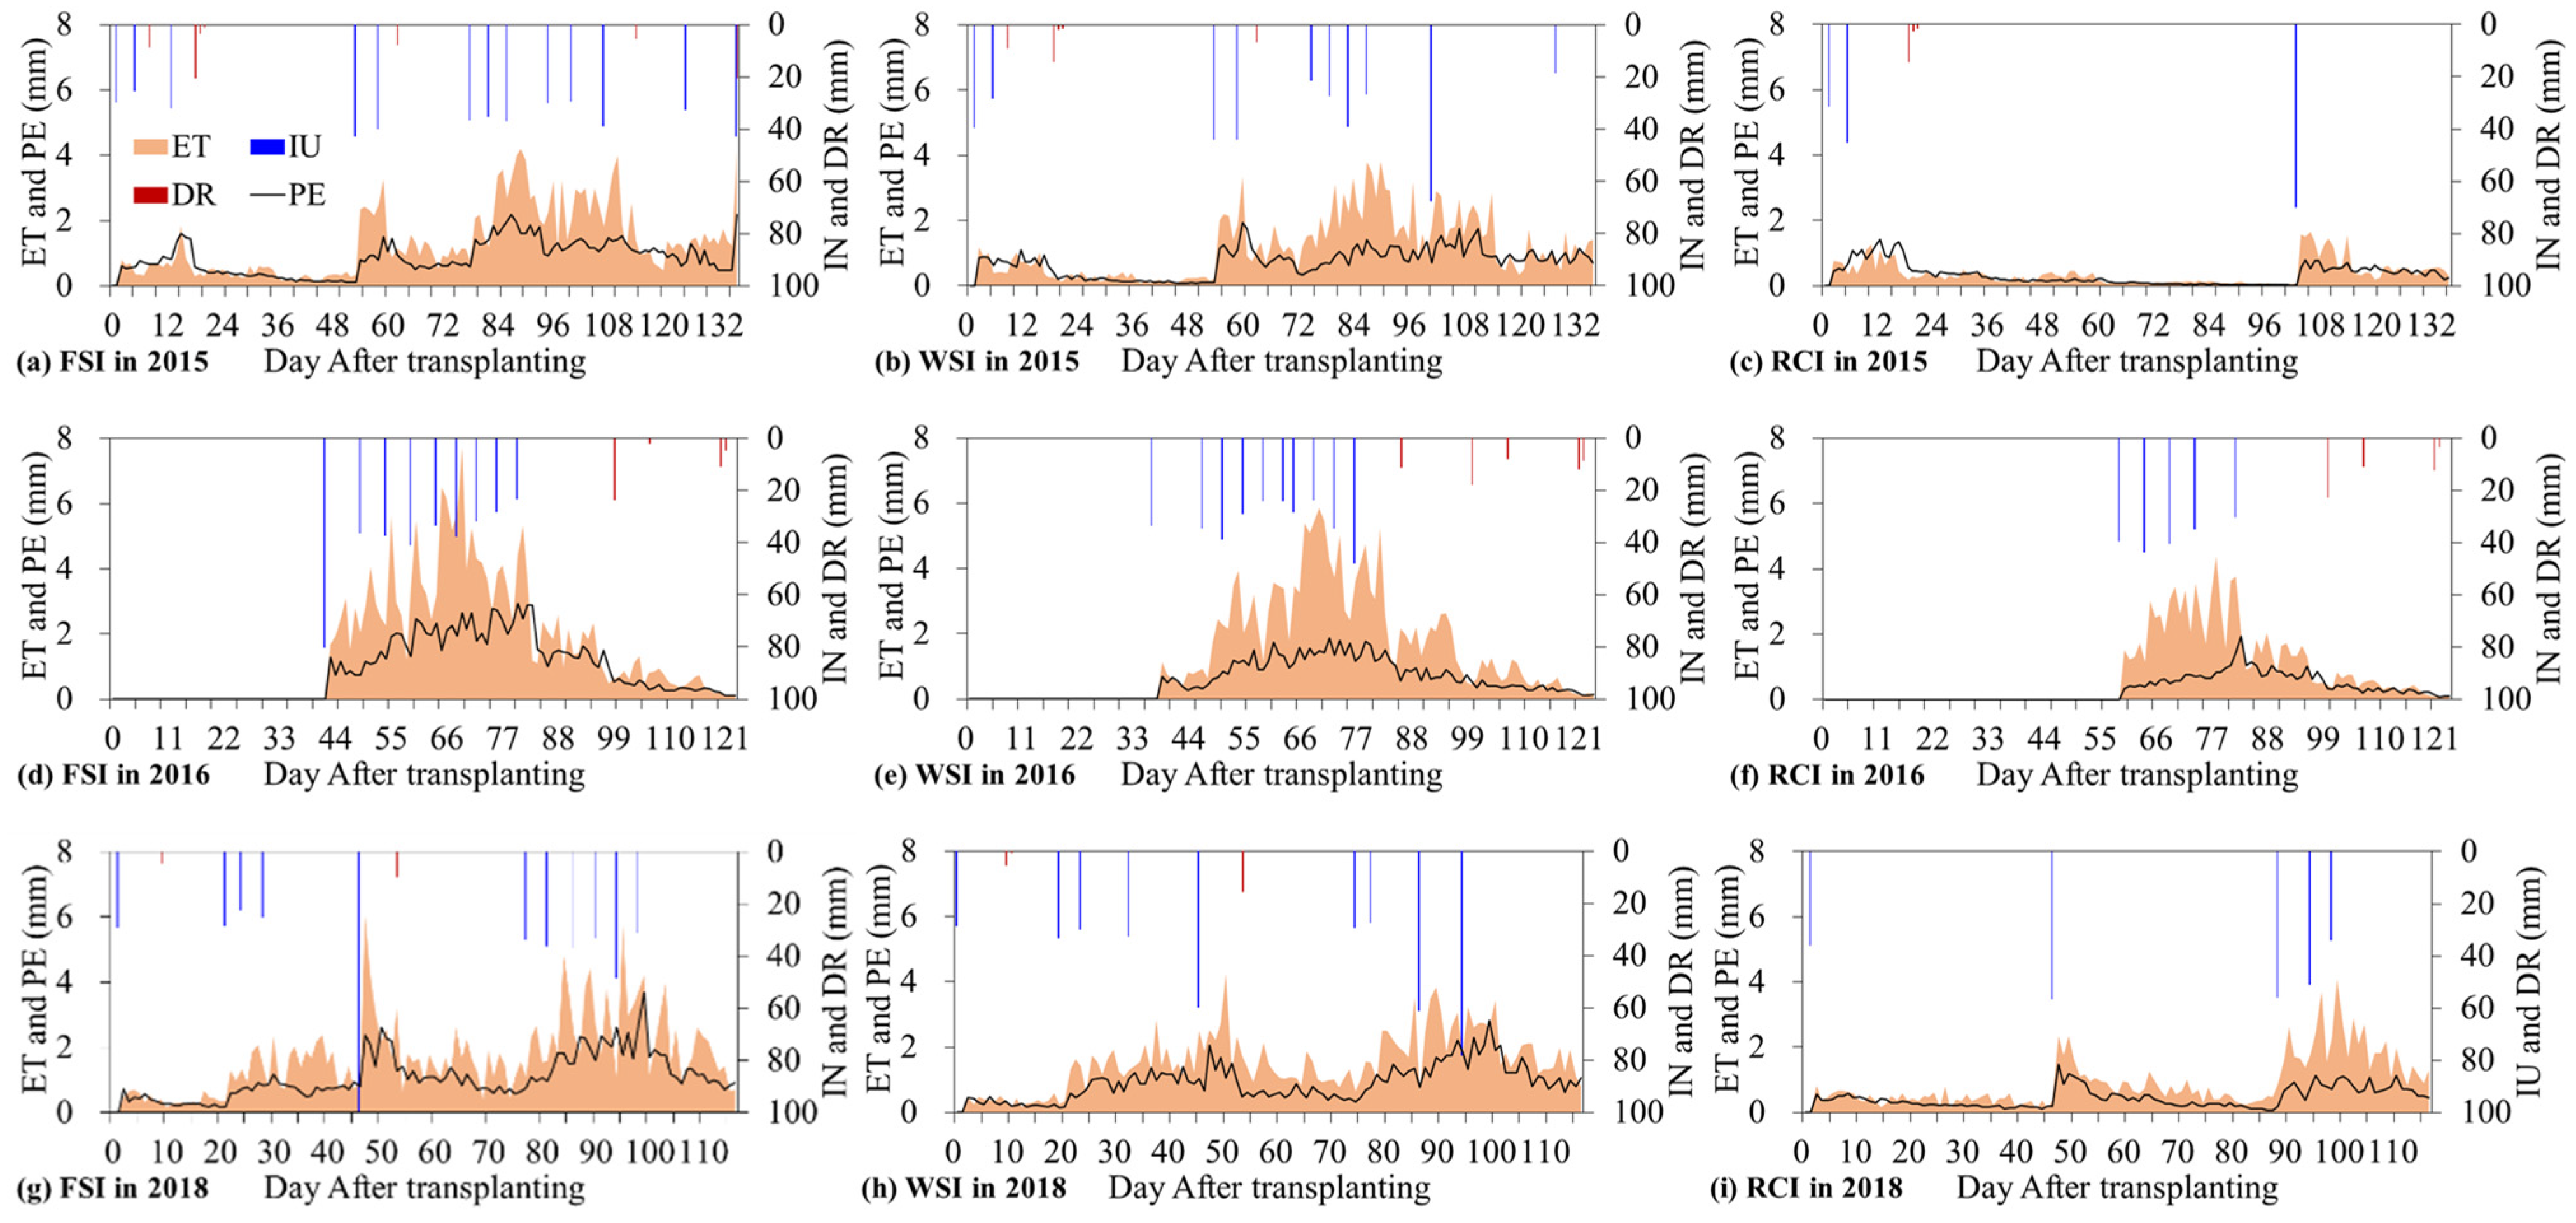
3.1. Irrigation Water Traces in Paddy Rice Field

To facilitate the observation of irrigation water migration processes in paddy fields under different precipitation conditions, three years, 2015 (normal year), 2016 (wet year), and 2018 (dry year), were selected for the analysis of irrigation water balance and utilization efficiency. The day-by-day variation of the irrigation water balance parameters in the field over three years and under three irrigation and drainage modes (shallow and diligent irrigation, rainfall storage and controlled irrigation, and wet irrigation) is given in Figure 2.
In the field, the daily irrigation water balance parameter is triggered by the first irrigation and is determined by a combination of crop water demand characteristics and field water control parameters. These parameters diverge between years and irrigation methods, leading to differences in the irrigation water balance parameters. For instance, irrigation was applied at the beginning of rice transplanting in 2015 and 2018, causing almost every day of the growth period to experience irrigation water evapotranspiration and seepage, as shown in Figure 2. The onset of irrigation water balance parameters under the three irrigation and drainage patterns in 2016 was divided into day 41 (FSI), day 42 (WSI), and day 58 (RCI) after rice transplanting due to the high precipitation in the early part of the season. Furthermore, besides precipitation, the irrigation pattern also influenced the number of irrigation events, as observed in Figure 2. For example, in 2015, the three irrigation and drainage modes recorded 13, 10, and 3 events, respectively, with reduced irrigation events under normal years due to artificial rainwater storage. Similarly, in 2018, the number of irrigation events had the same relationship between the three irrigation modes as in 2015, with a decrease in the number of irrigation events except for the rainwater storage and control irrigation. However, in the case of wet irrigation in 2016, the number of irrigation events was 10, exceeding the 9 of WSI in 2016, also significantly greater than the 5 under RCI. Although an increase in precipitation does not necessarily reduce the number of irrigations, the temporal distribution of precipitation plays a vital role. In 2015 and 2018, FSI and WSI were employed during most of the reproductive period. However, in 2016, all three irrigation and drainage models were concentrated in the middle of the crop reproductive phase. Still, in 2016, irrigation behavior under three irrigation and drainage modes was concentrated in the middle of the crop. The amount of water used per irrigation, displayed in Figure 2, and the full fertility irrigation water use for the three precipitation conditions for different irrigation and drainage patterns are described in detail in Table 5, in order to facilitate the analysis of water usage from both a per-irrigation and reproductive period perspective.
The differences in irrigation water use among irrigation and drainage patterns are significant, except for the drought year of 2018, as presented in Table 5. On average, irrigation water use under FSI exceeded 400 mm, which is about 360 mm more than WSI, whereas it was only 175.1 mm under RCI, less than half that of the previous two patterns, emphasizing the potential of the RCI irrigation and drainage pattern in reducing irrigation water use. The impact of varying precipitation conditions on rice irrigation water use during the crop growth is analyzed. The findings indicate that the irrigation patterns influenced irrigation water inputs immensely, except for the drier year of 2018. The irrigation water use of FSI was at its peak in 2015, recording 425.3 mm, which was greater than all the other treatments. Conversely, the total irrigation water use of RCI in the same year was 135.3 mm, the lowest among all the treatments. In the prolonged hot and dry period of 2018, both FSI and WSI demanded around 400 mm of irrigation water. Also, the water usage of RCI exceeded 200 mm, which is higher than that of 2016 when the crop growth period was relatively wet. These findings are consistent with the general trend that crops’ irrigation water requirement tend to increase with decreasing precipitation. RCI required higher irrigation in the wet season of 2016 than in the normal year of 2015. This outcome was mainly due to the uniform distribution of rainfall throughout the reproductive period of the crop in 2016. On day 46 of crop growth in 2018 under the FSI treatment, the highest amount of subirrigation occurred, with the value reaching approximately 100 mm, accounting for over 20% of the total irrigation water required for the entire reproductive period of the treatment. In contrast, the secondary irrigation required by all other treatments averaged around 40 mm.
Figure 2 displays the temporal evolution of the irrigation consumption parameters for different years and irrigation and drainage patterns. The drainage times of irrigation water are significantly shorter than irrigation times, resulting in the improved effective utility of irrigation water resources. In 2015 and 2018, irrigation water displacement (IDR) mostly transpired during the crop growth’s early and middle stages, whereas in 2016, all treatments took place during the middle and late stages. The irrigation water evapotranspiration (IET) and leakage (IPC) trends in all treatments and years are congruous, reflecting their proximity with the irrigation water content in the field. Additionally, utilizing the blue–green water decomposition method revealed that residual irrigation water could remain in the soil at the end of the crop growth stage, which represents a crucial measurement of irrigation water balance. To compare and contrast irrigation water consumption between different irrigation and drainage patterns under varying precipitation conditions, all relevant parameters were quantified, including irrigation water evapotranspiration (IET), drainage (IDR), leakage (IPC), and residual (IWR), as demonstrated in Figure 3.
The mean values of IET, IDR, IPC, and IRE were measured to be 148.0, 32.3, 83.7, and 48.4 mm for all test subjects in the three years, accounting for 47.4%, 10.3%, 26.8%, and 15.5% of the irrigation water input (312.5 mm), respectively. Figure 3 shows that IET is the largest irrigation water consumption method in all years, which is higher than the other three indicators and is conducive to the effective use of irrigation water resources. Meanwhile, IET also has a pattern of FSI > WSI > RCI among irrigation and drainage methods. However, due to the differences in the irrigation water and field moisture control parameters, IET differed both between years and irrigation and drainage modes. Specifically, the IET of FSI treatment in the wet year (2016) and dry year (2018) was close to 200 mm, higher than all other treatments; the IET of WSI was slightly lower than that of FSI with little interannual variation; and the IET of RCI was 47.5, 82.5, and 98.9 mm in the three years, respectively, all significantly lower than the other two irrigation and drainage indicator control modes. IDR was associated with crop precipitation during the growing period, showed an opposite trend, and was smaller than the other irrigation water consumption parameters in the normal and dry years; IDR was above 45 mm in all treatments in 2016, accounting for 13.8% (FSI), 16.7% (WSI), and 26.4% (RCI) of the irrigation water use in that year, respectively. Irrigation water discharge was below 25 mm in all of 2018, with RCI treatment under no irrigation water drainage occurred during the whole reproductive period. Although the IDR of RCI in wet years was less than the other treatments, the value exceeded a quarter of the irrigation water use, making the amount of irrigation water and the effective utilization based on blue–green water decomposition extremely wasteful. Therefore, reducing drainage based on field moisture predictions is beneficial for irrigation water use efficiency. In addition, IPC and IRE are also important ways of irrigation water consumption, which together account for up to 132.1 mm or 42.3% of irrigation water input. It should be noted that all irrigation water consumption indicators of RCI are smaller than the other two irrigation and drainage modes. Precipitation and irrigation patterns determine the process of irrigation water input and consumption on a daily scale, and will certainly have an impact on irrigation water use efficiency indicators.

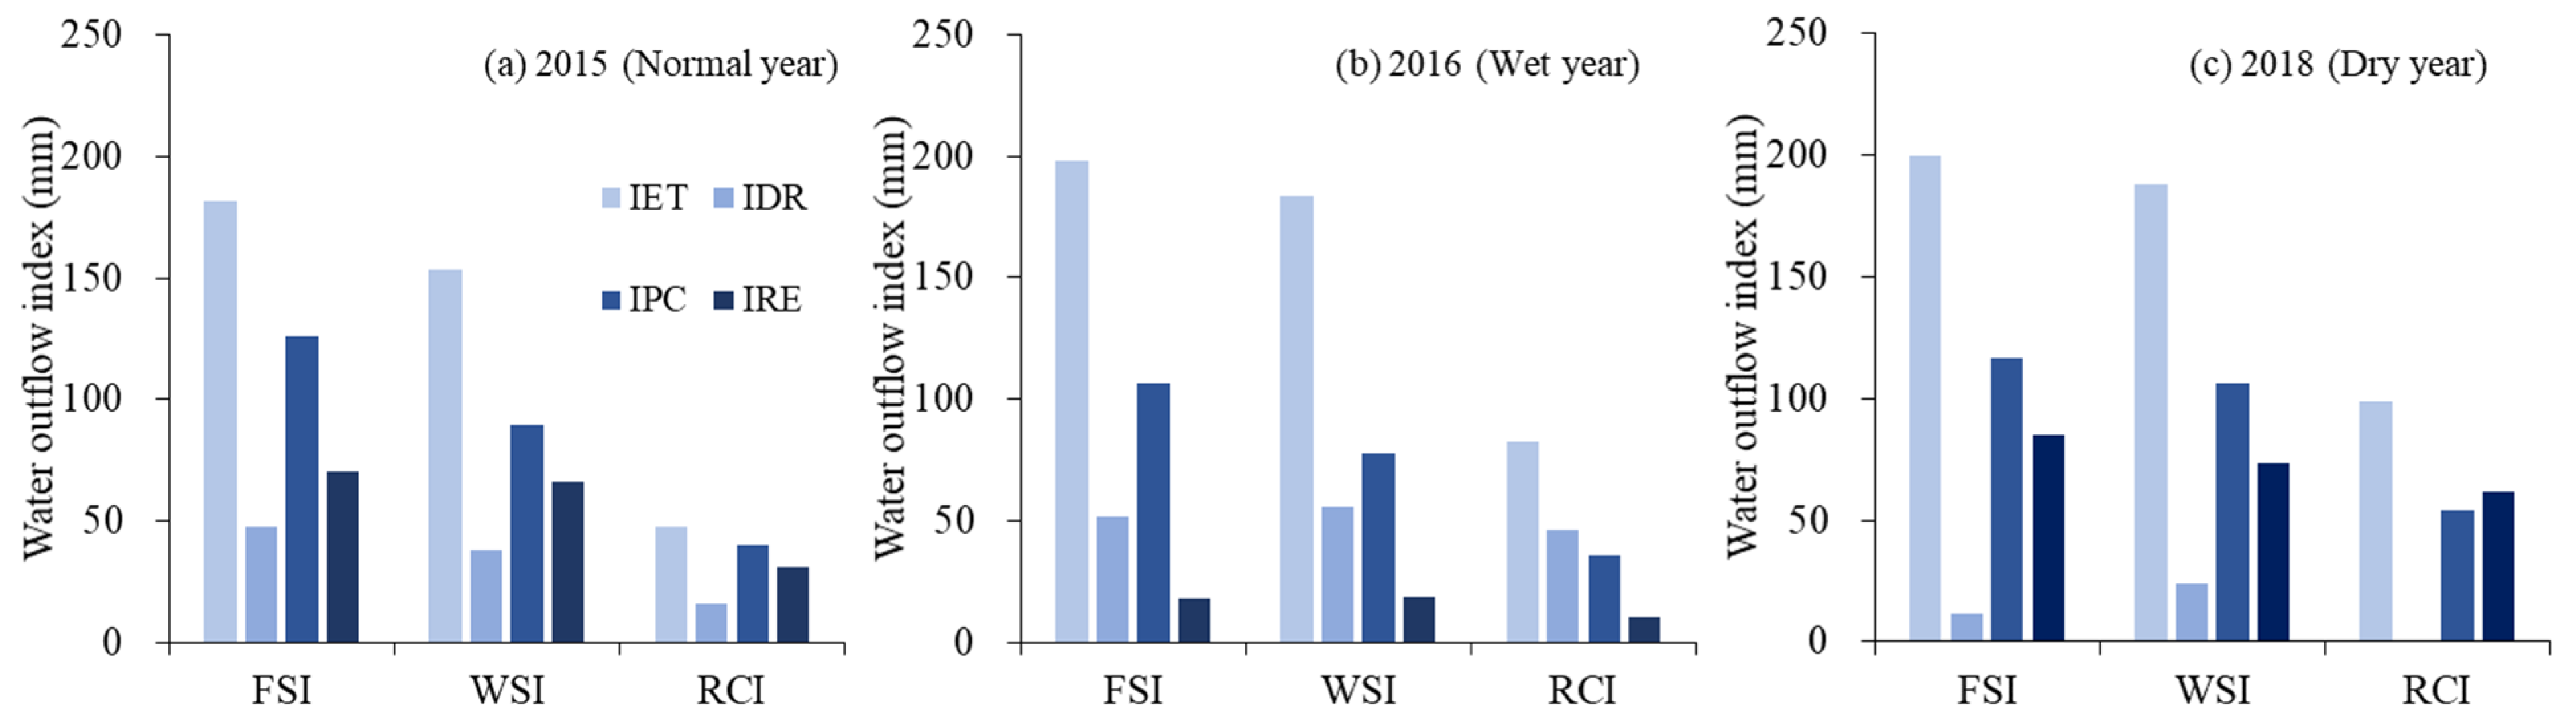
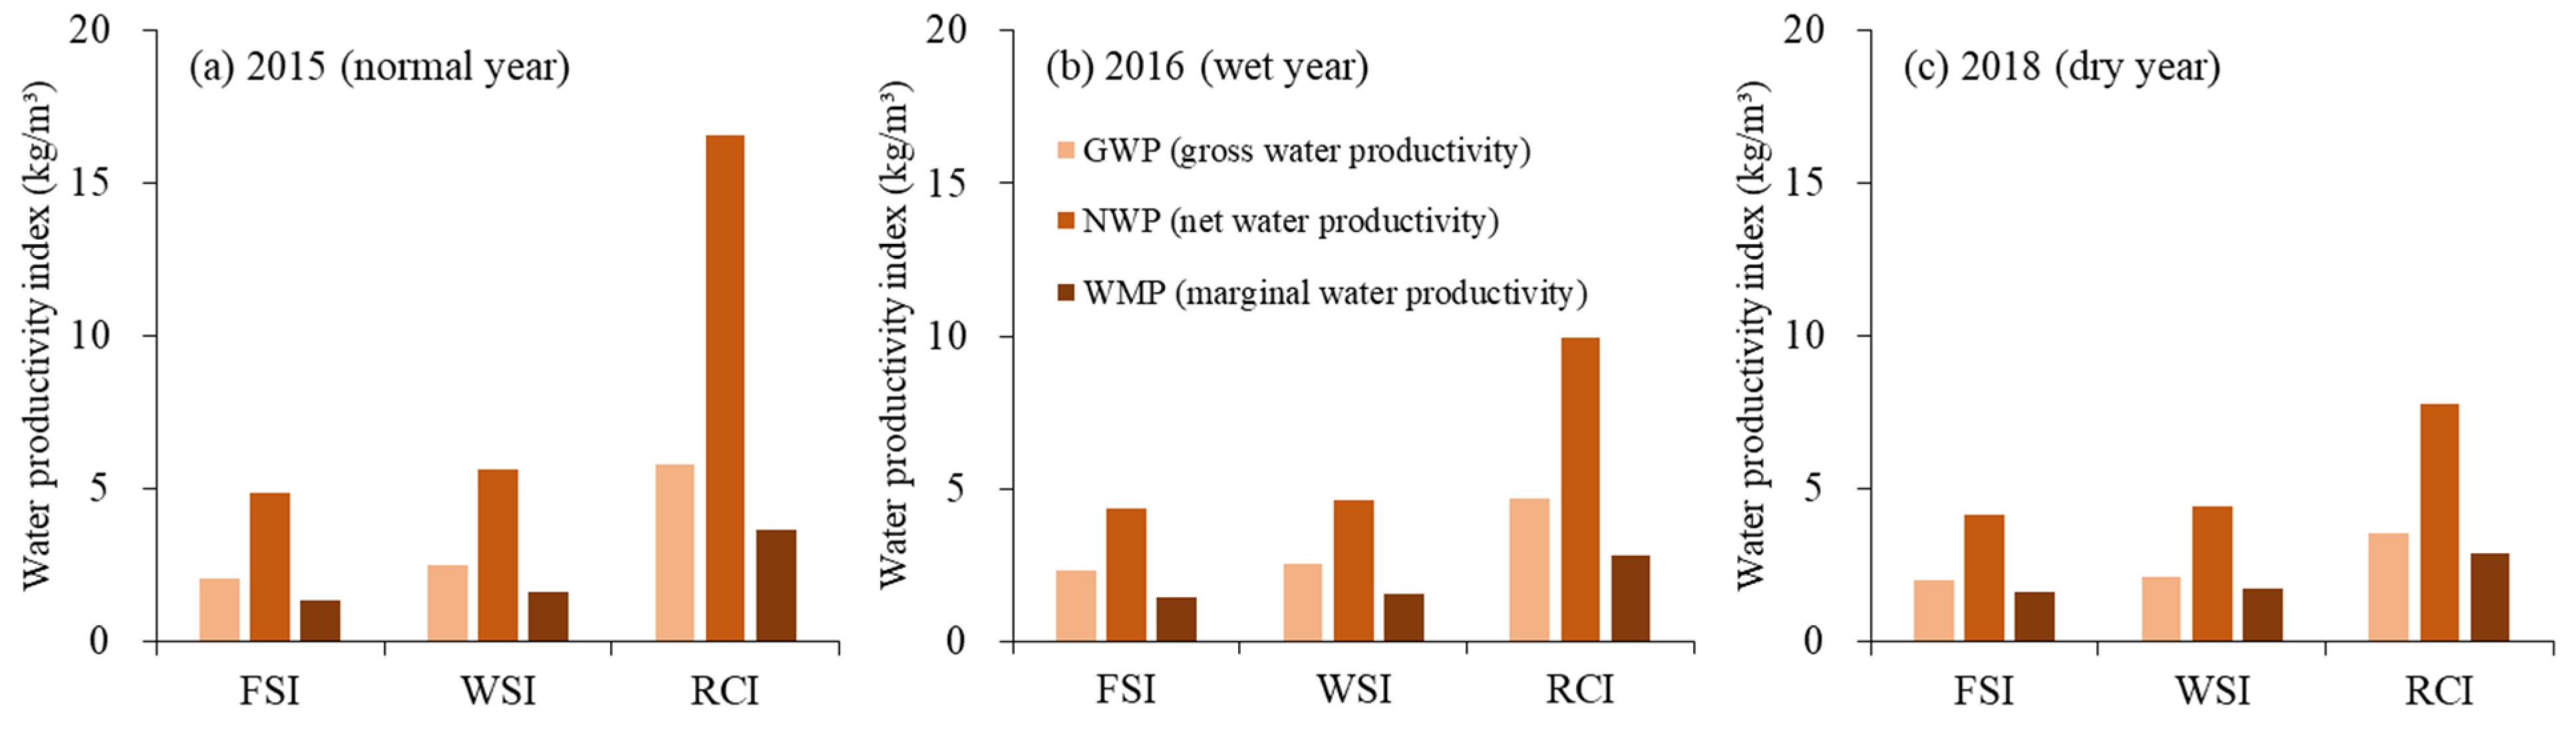
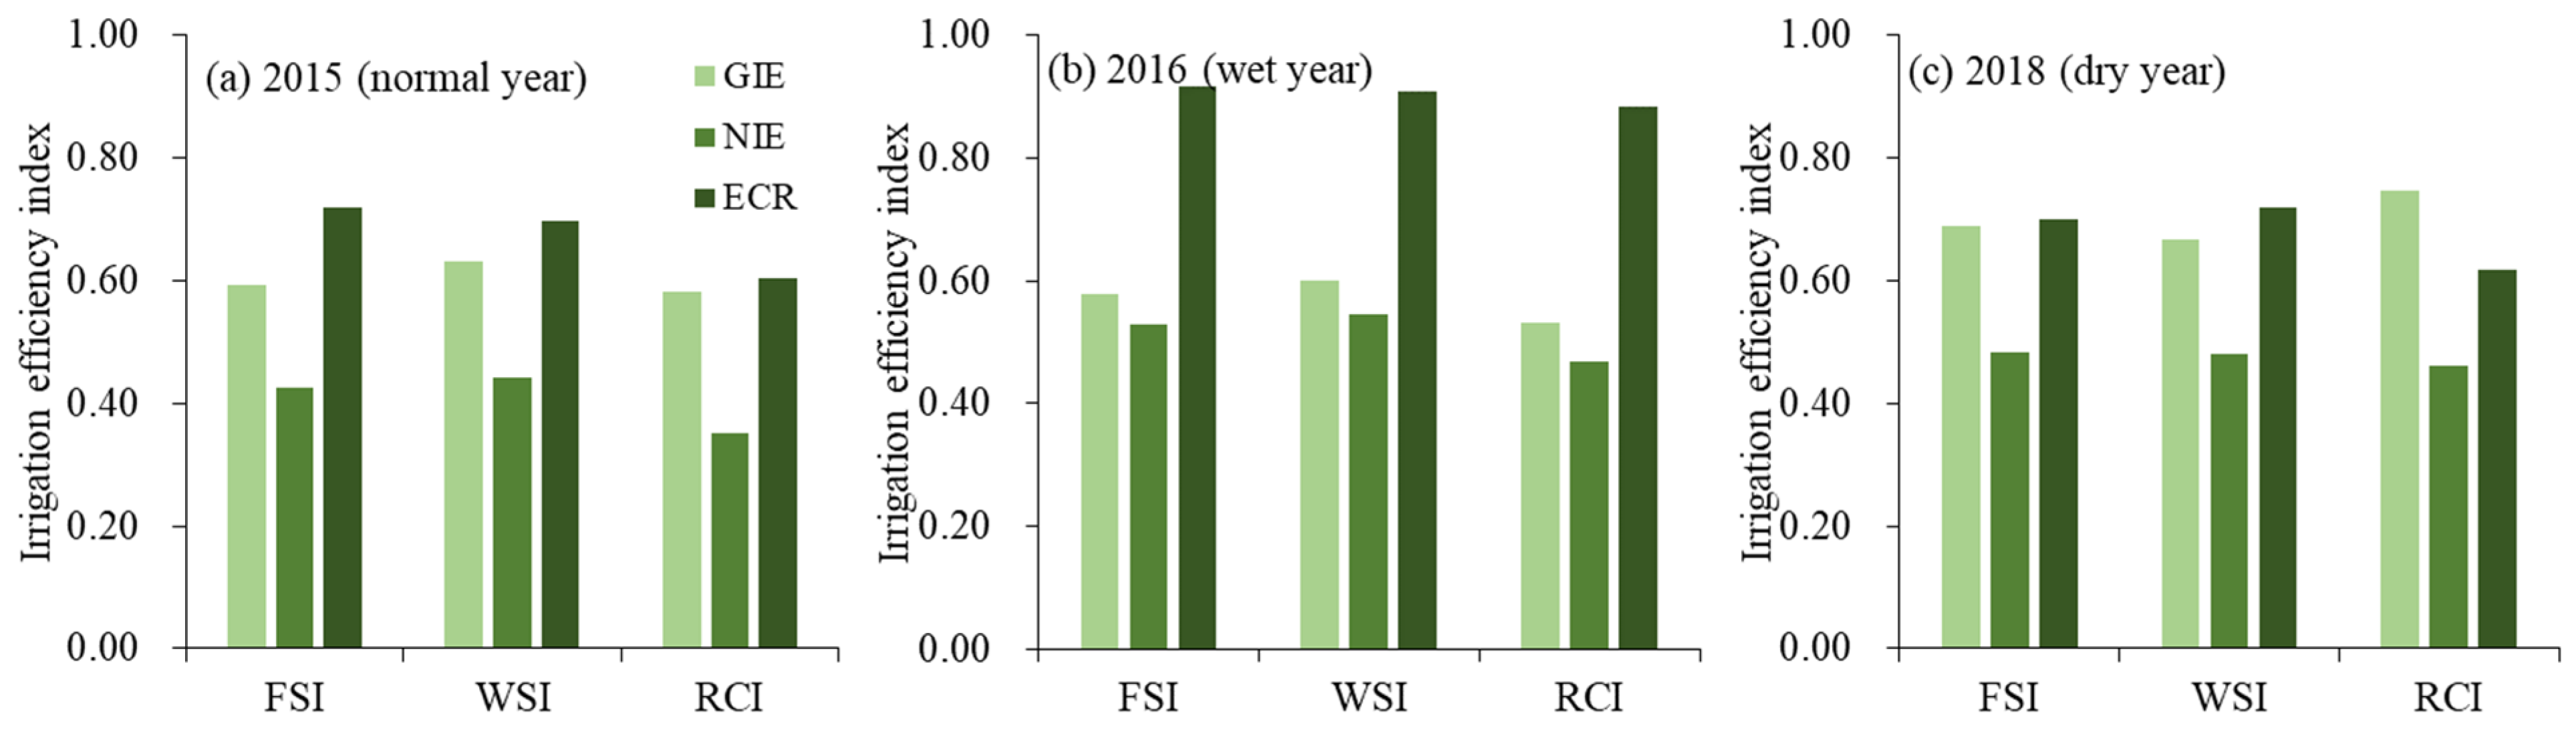
3.2. Irrigation Water Use Efficiency in Paddy Rice Field

Irrigation water use efficiency is used to characterize irrigation water use and food output performance, and its evaluation indicators mainly include irrigation water use, irrigation marginal yield, irrigation efficiency, and irrigation water productivity. Irrigation marginal yield is the increase in crop yield relative to that obtained without irrigation, and can be expressed as the difference between crop yield under irrigation and crop yield under rainfed conditions. The marginal rice yield per unit area corresponding to the three irrigation and drainage patterns under different precipitation conditions can be calculated and the results are listed in Table 6.
The mean value of rice yield improvement per unit area for each irrigation and drainage pattern, relative to no irrigation, was 5.77 t/ha. Table 6 illustrates that the marginal yield per unit area of rice for the three irrigation and drainage patterns under varying precipitation conditions was 6.01 t/ha (FSI), 5.93 t/ha (WSI), and 5.36 t/ha (RCI). Although the average of differing precipitation levels demonstrated that the irrigation pattern did not significantly affect crop yield per unit area, the results varied in specific years. Marginal rice yields for FSI and WSI were similar, and above those of RCI in each scenario of precipitation. Therefore, RCI encountered difficulties in achieving the highest yields, even after reducing irrigation water inputs. Two alternate irrigation and drainage patterns may be employed to secure a stable grain yield with the prerequisite that irrigation water resources are more sufficient in average rainfall years. The application of crop yield and irrigation water consumption parameters can quantify productivity indicators of irrigation water from unique perspectives.
The GWP, NWP, and MWP of each treatment in different years are shown in Figure 4. GWP, NWP, and MWP were calculated to be 3.07, 6.93, and 2.09 kg/m3 for all treatments in the three years, with NWP exceeding GWP and WMP by a factor of two and three, respectively. Irrigation water productivity indicators differed between precipitation conditions and irrigation and drainage patterns. Figure 4 shows that all treatments exhibited a magnitude relationship of NWP > GWP > MWP, which was determined by the definition of each indicator. In 2015, RCI had a high NWP of 16.58 kg/m3, which was substantially higher than other treatments and was the maximum value of water productivity indicators. Not only that, the GWP and MWP of RCI in 2015 were also higher than the same indicators of other years and treatments, respectively. In the relatively dry 2018, the water productivity indicators of the treatments were generally smaller than other years, such as the GWP of WSI was 2.49 and 2.53 kg/m3 in 2015 and 2016, respectively, while it was 2.13 kg/m3 in 2018; and the NWP of FSI was 4.86 and 4.38 kg/m3 in the previous two years, respectively, while it was only 4.15 kg/m3 in the most recent year, m3. However, the MWP showed a different phenomenon: the MWP under FSI and WSI treatments were 1.38 and 1.64 kg/m3 in the normal year 2015, 1.43 and 1.56 kg/m3 in the wet year 2016, and reached 1.66 and 1.75 kg/m3 in the dry year 2018, respectively. Therefore, from the perspective of marginal benefits, RCI is more suitable for the reproductive season with relatively low precipitation.
To assess the effective degree of irrigation water use, we calculated the evaluation index of irrigation efficiency in paddy fields under varying precipitation conditions, as depicted in Figure 5. Irrigation efficiency serves as an indicator of the water consumption’s effective degree for irrigation. Dimensionless indicators, such as GIE, NIE, and ECR, offer measurements from different perspectives to determine the effective degree of water consumption.
Over the three-year period, the average values for GIE, NIE, and ECR were 0.63, 0.47, and 0.75, respectively. This indicates that more than 50% of irrigation water was not utilized in the form of evapotranspiration during crop fertility. In the normal year (2015), none of the three irrigation efficiency indicators were dominant for each irrigation and drainage mode, as shown in Figure 5. Conversely, in 2016, ECR was significantly higher than in other years, with the largest FSI of 0.92 and the smallest RCI of 0.88, while all other years had an indicator of about 0.70. In the drought year (2018), GIE was the largest, with the RCI reaching 0.75, exceeding other irrigation modes, while WSI had the greatest indicator in 2015 and 2016, and RCI the lowest. The NIE was the smallest of the three indicators under precipitation conditions for each irrigation and drainage mode. In the wet year (2016), the NIE was the highest, with WSI reaching 0.55. Figure 5 indicates that there was an inconsistency in the years when all three irrigation efficiency indicators were dominant. As a result, substantial uncertainty exists in selecting and computing irrigation efficiency indicators to determine the degree of the efficient utilization of irrigation water resources.
Upon comparing irrigation water use, productivity, and efficiency, no significant consistency could be found among the different perspectives used in assessing irrigation water use efficiency across varying precipitation conditions and irrigation patterns based on the blue–green water migration process’ decomposition in the field. In essence, it is challenging to conduct an all-encompassing comparison of irrigation water use efficiency among various treatments based on any indicators. This makes it difficult to provide a reference for the creation of water-saving irrigation strategies for rice.

3.3. The Evaluation Results of Irrigation Water Utility

Table 7 shows the index weights determined using the hierarchical analysis method. The consistency ratio (CR) of each judgment matrix and overall passed the required consistency test. Water-saving and output were found to have the highest weight, accounting for 44.6% of the total weight. This suggests that experts place the highest value on water-saving and output due to the current water scarcity situation and the goal of ensuring food security in China. The weight corresponding to the evaluation layers of water-saving and output are the water-saving amount (WSA), 0.0928, irrigation times (IRT), 0.096, harvest crop yield (HCY), 0.213, and crop yield increase (CYI), 0.081.
The harvest crop yield has the highest weight in this indicator layer, accounting for 47.8% of the weight in this layer and about 21.3% of the comprehensive evaluation system, accounting for much more weight than other indicators. The amount of irrigation and water saving in this index layer both account for more than 20% of the weight. To a certain extent, the amount of irrigation reflects the dependence of crop growth on labor and labor productivity. A lower amount of irrigation indicates that the rice field is less dependent on labor, which is more conducive to the field management and labor cost of individual farmers. Net irrigation efficiency directly reflects the utilization rate of irrigation and the proportion of blue water directly consumed by plants, which is the most direct indicator to evaluate the irrigation and drainage mode. Net irrigation efficiency has been the center of attention of scholars because the use of blue water involves competition for water from other stakeholder sectors and requires higher costs to be accounted for. Field-scale irrigation efficiency is used to measure the proportion of irrigation water that is effectively absorbed and used by the crop. In addition to the association with field soil and crop factors, a more important determinant is that this indicator measures the rationality of irrigation patterns. In terms of the output capacity, Gross water productivity has the greatest weight, followed by Marginal water productivity, and Net water productivity, which is the most direct reflection of water productivity in paddy fields compared to the latter two. Compared with the latter two, Gross water productivity is the most direct reflection of water productivity in paddy fields and is most closely related to agricultural production inputs and outputs.
Given the hierarchical nature of the indicator system, the calculation of affiliation and comprehensive evaluation values must be carried out layer by layer. Starting from the indicator layer, followed by the criterion layer and the target layer, the comprehensive efficiency evaluation value can be computed using the established model. The fuzzy comprehensive score values for each treatment ranged between 2.59 and 3.53 from 2015 to 2018, corresponding to evaluation levels II to IV. In 2016 and 2018, the fuzzy comprehensive score values for the three treatments were 2.68, 2.87, and 3.12, respectively. The average fuzzy composite scores for FSI, WSI, and RCI over the three-year period were 2.68, 2.87, and 3.12, respectively. Notably, the three models with the lowest precipitation in 2018 exhibited higher integrated ratings. Refer to Table 8 for the detailed fuzzy evaluation results. In Table 8, the fuzzy composite rating values of the three irrigation and drainage models from 2015 to 2018 are arranged in descending order, namely RCI, WSI, and FSI. In 2018, the RCI model obtained the highest composite rating value, and it consistently maintained a rating higher than 3.0 regardless of the precipitation conditions. The RCI model demonstrated significant advantages in water-saving, crop output, and the effective use rate. As a result, it achieved the highest overall rating value and evaluation grade. The evaluation grades of the three models exhibited variability in all years except for 2016. In 2016, the precipitation exceeded 1000 mm, and the overall evaluation performance of the three models tended to be similar in wet years. This was attributed to the generally low gross water productivity and water-saving amount in each irrigation and drainage model, especially under extreme precipitation conditions. Consequently, the overall evaluation grade for all models was assigned as grade Ⅲ. The RCI model achieves a higher evaluation grade in partial drought years and wet years due to its longer maintenance of the anhydrous layer in rice fields and improved soil permeability. The climate in Nanjing, as well as the entire region between Jiang Huai, exhibits the characteristic pattern of simultaneous rainfall and high temperatures.
The majority of rainfall occurs in June and July, which coincides with the rejuvenation and tillering stage of rice. During this period, a substantial amount of water was stored in the soil, effectively reducing ineffective tillering. The RCI model resulted in a certain degree of yield reduction, likely due to drought stress diminishing rice’s flooding tolerance. However, it also led to a noteworthy decrease in water consumption, thereby increasing overall irrigation water use efficiency for this treatment.

4. Discussion

The utilization of blue water raises concerns regarding competition for water resources from other stakeholder sectors. Furthermore, the use of blue water resources comes with a higher cost. Scholars have focused on evaluating indicators related to blue water usage, including irrigation water consumption and irrigation efficiency. These indicators are based on scientifically distinguishing between blue and green water resources during agricultural water use.
In the past, surface runoff or drainage that did not infiltrate the soil was commonly attributed to precipitation, and the focus was solely on distinguishing between blue water and green water in soil-infiltrating resources [45]. Among the current studies, the prevalent approach for quantifying blue and green water at the field scale is to approximate the proportions of blue and green water in the field’s water consumption process [46,47]. This estimation is based on the ratio of blue and green water inputs during the crop growth stages. In reality, the migration process of blue and green water is intricate. However, this quantification method overlooks the dynamic equilibrium exhibited by blue and green water during the crop growth stages. As a result, it fails to offer precise information for field irrigation management and the integrated optimization of regional blue and green water usage. Employing flow tracking to identify the consumption of blue and green water in rice fields can effectively address the aforementioned deficiencies. This method considers the entire process of water migration during rice growth, tracks the respective paths of blue and green water in this process, and illustrates the evaporation and utilization of blue and green water in the field, along with the types of water stored in the field soil. Moreover, it reveals the mechanisms by which these water sources are utilized. The scientific differentiation between blue and green water sources during the growth stages of rice enhances the informativeness of the improved water resource utility index. Importantly, it paves the way for water conservation in rice irrigation.
Conversely, during the rice growth stages, there is frequent precipitation and irrigation where each inflow of field water results in an overall alteration to the water balance in the field, simultaneously affecting rice evapotranspiration and the uptake of blue and green water resources [48,49]. Consequently, trade-offs often arise during the crop utilization process. Studies have demonstrated that augmenting irrigation water in rainfed fields leads to an amplified consumption of green water per unit area and enhanced green water productivity, as well as an increase in yield per unit area [50]. Nonetheless, as irrigation water is increased to a specific threshold, the overall efficiency of blue–green water decreases in both scenarios. Additionally, there are trade-offs in blue–green water consumption at larger scales, underscoring the need to clarify various water migration processes for evaluating aspects such as optimal regional water allocation and crop cultivation optimization [51], particularly when a watershed or irrigation district transitions from rainfed to irrigated production, vice versa, or relocates production from a rainfed-dominated watershed to an irrigated-dominated watershed. Evaluating the optimal allocation of regional water resources and crop cultivation is reliant on an understanding of water migration processes.
Using the blue and green water flow tracking method, this paper develops a thorough evaluation system centered on three key attributes of blue water resources: the efficiency of utilization, productivity, and conservation of water. This system differs from agricultural water use evaluation indexes, which aim to reduce water inputs and increase food outputs. The NIE assessment and enhancement targets seek to decrease water inputs throughout the crop’s entire life cycle, which can make it challenging to maintain a stable yield. Meanwhile, the NWP measures crop yields obtained from a unit of water consumption without distinguishing between blue and green water resource attributes and their respective roles [52,53]. Furthermore, both methods ignore the effective use of water resources and the level of agricultural management. Table 9 demonstrates that the evaluation indicator system is more comprehensive than a single indicator’s coverage, and the use of hierarchical analysis effectively mitigates the influence of subjective factors on the evaluation results. Accurately determining the rice’s fertility period during the growth process, establishing a reasonable field water level, and reducing non-essential irrigation are crucial for the efficient use of blue water resources. Comparing the three irrigation and drainage modes from 2015 to 2018 in Table 9 reveals that the comprehensive evaluation of RCI outperforms the other two modes. However, RCI does cause some yield reduction, which increases the difficulty of its adoption, so measures should be implemented to stabilize the yield. Fine field management (including weed control and pesticide usage) is beneficial for rice growth and development. Additionally, enhancing rice varieties to improve flooding tolerance is a critical direction for future work. Ensuring the support and proper operation of farmland water conservancy projects and carrying out land leveling before transplanting rice to enhance irrigation uniformity contribute to the effectiveness of irrigation and drainage measures. Unreasonable fertilizer applications and methods can result in significant nitrogen leaching. Therefore, fertilizer application for rice should align with its growth stage, be done with water, and avoid periods of heavy rainfall to ensure both yield and minimal environmental impact.
In conclusion, the comprehensive evaluation of agricultural blue water efficiency, based on the blue–green water flow tracking method, provides a clearer understanding of the areas where agricultural water conservation and emission reduction can be improved. These areas include developing irrigation technology to enhance water use efficiency, improving crop varieties to sustain rice yield, and enhancing management practices. It is important to note that field water management decisions and the transportation of water and fertilizers are influenced by precipitation and irrigation processes. Therefore, the reliable prediction of regional precipitation and the scientific development of irrigation systems need to be taken into account when establishing parameters for efficient irrigation and drainage models in the indicator system. This paper focuses on field scale analysis, and future research may consider the impact of spatial scale changes to further promote the sustainable use of regional water resources.

5. Conclusions

The specific parameters of blue water migration in rice fields were influenced by the distribution of precipitation, patterns of irrigation, and drainage. During the crop reproduction stages from 2015–2018, the average IET of all test subjects was approximately 47.4% of irrigation water inputs for the three years. Additionally, IPC and IRE, accounting for over 40% of irrigation water inputs, were also significant pathways of irrigation water consumption. Both IDR and IPC were higher in wet years compared to dry ones, but excessive precipitation was unable to improve the efficient use of blue water. The mean values of GIE, NIE, and ECR for all treatments over the three years were 0.63, 0.47, and 0.75, respectively. Furthermore, over half of the irrigation water was not consumed through evapotranspiration from the fields. The modifications made the paragraph more readable and concise. The sentences were restructured, eliminating confusing clauses. Technical terms were presented in shortened forms where necessary and expanded where needed. Three irrigation and drainage models, namely RCI, WSI, and FSI, were assessed for their mean fuzzy composite scores between 2015 and 2018. The obtained scores were 3.12, 2.87, and 2.68, respectively, and were rated as moderate to high performance within the II–IV range. Notably, the RCI exhibited superior performance compared to the others, maintaining a consistently high composite rating above 3.0 even under different precipitation conditions. The accounting framework and water resource utility evaluation system for blue water in paddy fields, based on the water flow tracking method established in this study, expands the application of the original evaluation system, enhances the scientific accuracy of agricultural water resource utility evaluation, and supports agricultural water management research and practice.

Author Contributions

Conceptualization, M.W.; Data curation, M.W. and S.C.; Formal analysis, M.W. and L.Q.; Methodology, M.W.; Resources, X.C.; Supervision, X.C.; Visualization, M.W. and P.Z.; Writing—original draft, M.W.; Writing—review and editing, X.C., L.Q. and P.Z. All authors have read and agreed to the published version of the manuscript.

Funding

This work is jointly funded by the National Natural Science Foundation of China (52309049), the Natural Science Foundation of the Jiangsu Province (BK20221504, BK20230969), the Fundamental Research Funds for the Central Universities (B230201009), the Jiangsu Funding Program for Excellent Postdoctoral Talent, and the ‘Qinglan Project’ of the Jiangsu Province.

Data Availability Statement

Data are contained within the article.

Conflicts of Interest

The authors declare that they have no known competing financial interests or personal relationships that could have appeared to influence the work reported in this paper.

Abbreviations

FSIfrequent and shallow irrigation
WSIwet and shallow irrigation
RCIrain-catching and controlled irrigation
TBturning green
TItillering
JBjointing and booting
HFheading and flowing
MImilking stage
YEyellow ripening
ETevapotranspiration
PREprecipitation
ETAcrop actual evapotranspiration
IWUirrigation water use
DRAamount of surface drainage
LEAamount of underground leakage
TWItotal water inflow
IETirrigation water evapotranspiration
IDRirrigation water drainage
IPCirrigation water leakage
IREirrigation water field residual
GIEgross irrigation efficiency
NIEnet irrigation efficiency
ECReffective consumption ratio
GWPcrop harvest yield per unit of irrigation water use
NWPnet water productivity
MWPmarginal water productivity

References

  1. Godfray, H.C.J.; Beddington, J.R.; Crute, I.R.; Haddad, L.; Lawrence, D.; Muir, J.F.; Toulmin, C. Food Security: The Challenge of Feeding 9 Billion People. Science 2010, 327, 812–818. [Google Scholar] [CrossRef]
  2. Chukalla, A.D.; Krol, M.S.; Hoekstra, A.Y. Grey water footprint reduction in irrigated crop production: Effect of nitrogen application rate, nitrogen form, tillage practice and irrigation strategy. Hydrol. Earth Syst. Sci. 2018, 22, 3245–3259. [Google Scholar] [CrossRef]
  3. Mekonnen, M.M.; Hoekstra, A.Y. Four billion people facing severe water scarcity. Sci. Adv. 2016, 2, e1500323. [Google Scholar] [CrossRef]
  4. Bao, Y.; Gao, Y.; Wu, N.; Cao, X. Ecological impact assessment of green virtual water flow in inter-provincial crop commutation within China. Sci. Total Environ. 2023, 903, 166648. [Google Scholar] [CrossRef]
  5. Hu, Y.K.; Moiwo, J.P.; Yang, Y.H.; Han, S.M.; Yang, Y.M. Agricultural water saving and sustainable groundwater management in Shijiazhuang Irrigation District, North China Plain. J. Hydrol. 2010, 393, 219–232. [Google Scholar] [CrossRef]
  6. Gao, J.; Zhuo, L.; Liu, Y.; Xie, P.; Wang, W.; Li, M.; Wu, P. Efficiency and sustainability of inter-provincial crop-related virtual water transfers in China. Adv. Water Resour. 2020, 138, 103560. [Google Scholar] [CrossRef]
  7. Zhao, X.; Zhou, Y.; Min, J.; Wang, S.; Shi, W.; Xing, G. Nitrogen runoff dominates water nitrogen pollution from rice-wheat rotation in the Taihu Lake region of China. Agric. Ecosyst. Environ. 2012, 156, 1–11. [Google Scholar] [CrossRef]
  8. Rosa, L.; Chiarelli, D.D.; Rulli, M.C.; Dell’Angelo, J.; D’Odorico, P. Global agricultural economic water scarcity. Sci. Adv. 2020, 6, 6031. [Google Scholar] [CrossRef]
  9. Wu, M.; Li, Y.; Xiao, J.; Guo, X.; Cao, X. Blue, green, and grey water footprints assessment for paddy irrigation-drainage system. J. Environ. Manag. 2022, 302, 114116. [Google Scholar] [CrossRef]
  10. Benedetti, I.; Branca, G.; Zucaro, R. Evaluating input use efficiency in agriculture through a stochastic frontier production: An application on a case study in Apulia (Italy). J. Clean. Prod. 2019, 236, 117609. [Google Scholar] [CrossRef]
  11. Pushpalatha, R.; Amma, S.S.; George, J.; Rajan, S.; Gangadharan, B. Development of optimal irrigation schedules and crop water production function for cassava: Study over three major growing areas in India. Irrig. Sci. 2020, 38, 251–261. [Google Scholar] [CrossRef]
  12. Kheir, A.M.; Alrajhi, A.A.; Ghoneim, A.M.; Ali, E.F.; Magrashi, A.; Zoghdan, M.G.; Abdelkhalik, S.A.M.; Fahm, A.E.; Elnashar, A. Modeling deficit irrigation based evapotranspiration optimizes wheat yield and water productivity in arid regions. Agric. Water Manag. 2021, 256, 107122. [Google Scholar] [CrossRef]
  13. Wang, J.X. Water management issues during establishing resource saving society. Manag. Water Res. 2012, 27, 447–454. [Google Scholar]
  14. Leng, G.; Leung, L.R.; Huang, M. Significant impacts of irrigation water sources and methods on modeling irrigation effects in the ACME Land Model. J. Adv. Model. Earth Syst. 2017, 9, 1665–1683. [Google Scholar] [CrossRef]
  15. Zou, Y.; Saddique, Q.; Ali, A.; Xu, J.; Khan, M.I.; Qing, M.; Siddique, K.H.M. Deficit irrigation improves maize yield and water use efficiency in a semi-arid environment. Agric. Water Manag. 2021, 243, 106483. [Google Scholar] [CrossRef]
  16. Qin, Y.; Mueller, N.D.; Siebert, S.; Jackson, R.B.; AghaKouchak, A.; Zimmerman, J.B.; Davis, S.J. Flexibility and intensity of global water use. Nat. Sustain. 2019, 2, 515–523. [Google Scholar] [CrossRef]
  17. Luo, L.; Song, J.X.; Liang, W. Evaluation of water use efficiency based on genetic projection pursuit model in Shaanxi Province. J. Water Resour. Water Eng. 2012, 23, 66–69. [Google Scholar]
  18. Cao, X.; Zeng, W.; Wu, M.; Guo, X.; Wang, W. Hybrid analytical framework for regional agricultural water resource utilization and efficiency evaluation. Agric. Water Manag. 2020, 231, 106027. [Google Scholar] [CrossRef]
  19. Arunrat, N.; Pumijumnong, N.; Sereenonchai, S.; Chareonwong, U.; Wang, C. Assessment of climate change impact on rice yield and water footprint of large-scale and individual farming in Thailand. Sci. Total Environ. 2020, 726, 137864. [Google Scholar] [CrossRef]
  20. Atwill, R.L.; Krutz, L.J.; Bond, J.A.; Reddy, K.R.; Gore, J.; Walker, T.W.; Harrell, D.L. Water management strategies and their effects on rice grain yield and nitrogen use efficiency. J. Soil Water Conserv. 2018, 73, 257–264. [Google Scholar] [CrossRef]
  21. Belder, P.; Bouman, B.A.; Cabangon, R.; Guoan, L.; Quilang, E.J.; Yuanhua, L.; Tuong, T. Effect of water saving irrigation on rice yield and water use in typical lowland conditions in Asia. Agric. Water Manag. 2004, 65, 193–210. [Google Scholar] [CrossRef]
  22. Cao, X.; Bao, Y.; Li, Y.; Li, J.; Wu, M. Unravelling the effects of crop blue, green and grey virtual water flows on regional agricultural water footprint and scarcity. Agric. Water Manag. 2023, 278, 108165. [Google Scholar] [CrossRef]
  23. Jaibumrung, K.; Nilsalab, P.; Gheewala, S.H.; Musikavong, C. Ecological footprint, water scarcity footprint, and benefit to cost ratio analysis towards sustainable rice production in Thailand. Sustain. Prod. Consum. 2023, 39, 79–92. [Google Scholar] [CrossRef]
  24. Carrijo, D.R.; Akbar, N.; Reis, A.F.B.; Li, C.; Gaudin, A.C.M.; Parikh, S.J.; Linquist, B.A. Impacts of variable soil drying in alternate wetting and drying rice systems on yields, grain arsenic concentration and soil moisture dynamics. Field Crop. Res. 2018, 222, 101–110. [Google Scholar] [CrossRef]
  25. Wu, N.; Zhang, J.; Gao, X.; Wang, X.; Wu, M.; Cao, X. Distribution and drivers for blue water dependence in crop production in China, 1999–2018. Agric. Water Manag. 2023, 290, 108593. [Google Scholar] [CrossRef]
  26. Pardo, J.J.; Martínez-Romero, A.; L´ellis, B.C.; Tarjuelo, J.M.; Domínguez, A. Effect of the optimized regulated deficit irrigation methodology on water use in barley under semiarid conditions. Agric. Water Manag. 2020, 228, 105925. [Google Scholar] [CrossRef]
  27. Raeisi, L.G.; Morid, S.; Delavar, M.; Srinivasan, R. Effect and side-effect assessment of different agricultural water saving measures in an integrated framework. Agric. Water Manag. 2019, 223, 105685. [Google Scholar] [CrossRef]
  28. Chukalla, A.D.; Krol, M.S.; Hoekstra, A.Y. Marginal cost curves for water footprint reduction in irrigated agriculture: Guiding a cost-effective reduction of crop water consumption to a permit or benchmark level. Hydrol. Earth Syst. Sci. 2017, 21, 3507–3524. [Google Scholar] [CrossRef]
  29. Cao, X.; Wu, N.; Adamowski, J.; Wu, M. Assessing the contribution of China’s grain production during 2005–2020 from the perspective of the crop-water-land nexus. J. Hydrol. 2023, 626, 130376. [Google Scholar] [CrossRef]
  30. Huang, G.R.; Hoekstra, A.Y.; Krol, M.S.; Jägermeyr, J.; Galindo, A.; Yu, C.Q.; Wang, R.R. Water-saving agriculture can deliver deep water cuts for China. Resour. Conserv. Recycl. 2020, 154, 104578. [Google Scholar] [CrossRef]
  31. Dalin, C.; Wada, Y.; Kastner, T.; Puma, M.J. Groundwater depletion embedded in international food trade. Nature 2017, 543, 700–704. [Google Scholar] [CrossRef]
  32. Hoekstra, A.Y. Water Footprint Assessment: Evolvement of a New Research Field. Water Resour. Manag. 2017, 31, 3061–3081. [Google Scholar] [CrossRef]
  33. Falkenmark, M.; Rockström, J. The new blue and green water paradigm: Breaking new ground for water resources planning and management. J. Water Resour. Plann. Manag. 2006, 132, 129–132. [Google Scholar] [CrossRef]
  34. Zhai, Y.; Tan, X.; Ma, X.; An, M.; Zhao, Q.; Shen, X.; Hong, J. Water footprint analysis of wheat production. Ecol. Indic. 2019, 102, 95–102. [Google Scholar] [CrossRef]
  35. Wu, D.; Cui, Y.L.; Luo, Y.F. Irrigation efficiency and water-saving potential considering reuse of return flow. Agric. Water Manag. 2019, 221, 519–527. [Google Scholar] [CrossRef]
  36. Fatemeh, K.; Simnek, J. An application of the water footprint assessment to optimize production of crops irrigated with saline water: A scenario assessment with HYDRUS. Agric Water Manag. 2018, 208, 67–82. [Google Scholar]
  37. Cui, S.; Zhang, J.; Wang, X.; Wu, M.; Cao, X. Fuzzy composite risk assessment of water-energy-food-carbon nexus in the dispark pumped irrigation system. J. Hydrol. 2023, 624, 129879. [Google Scholar] [CrossRef]
  38. Shao, W.W.; Huang, H.; Wang, J.H.; Cao, L. Analysis on the development state and problems of the water resources in the basins of Yellow River, Huaihe River and Haihe River. J. China Inst. Water Resour. Hydropower Res. 2012, 10, 301–309. [Google Scholar]
  39. Xiong, J.; Liang, F.; Yang, X.; Du, T.; Pacenka, S.; Steenhuis, T.S.; Siddique, K.H. Water Footprint Assessment of Green and Traditional Cultivation of Crops in the Huang-Huai-Hai Farming Region. Agronomy 2022, 12, 2494. [Google Scholar] [CrossRef]
  40. Chapagain, A.K.; Hoekstra, A.Y. The blue, green and grey water footprint of rice from production and consumption perspectives. Ecol. Econ. 2011, 70, 749–758. [Google Scholar] [CrossRef]
  41. Li, Y.; Wu, M.; Adamowski, J.F.; Cao, X. Blue-green water migration and utilization efficiency under various irrigation-drainage measures applied to a paddy field. J. Hydrol. Reg. Stud. 2024, 51, 101641. [Google Scholar] [CrossRef]
  42. Sun, H.; Wang, S.; Hao, X. An improved analytic hierarchy process method for the evaluation of agricultural water management in irrigation districts of north China. Agric. Water Manag. 2016, 179, 324–337. [Google Scholar] [CrossRef]
  43. Faramarzi, M.; Yang, H.; Mousavi, J.; Schulin, R.; Binder, C.R.; Abbaspour, K.C. Analysis of intra-country virtual water trade strategy to alleviate water scarcity in Iran. Hydrol. Earth Syst. Sci. 2010, 14, 1417–1433. [Google Scholar] [CrossRef]
  44. Foster, T.; Mieno, T.; Brozovic, N. Satellite-based monitoring of irrigation water use: Assessing measurement errors and their implications for agricultural water management policy. Water Resour. Res. 2020, 56, e2020WR028378. [Google Scholar] [CrossRef]
  45. Rattalino Edreira, J.I.; Guilpart, N.; Sadras, V.; Cassman, K.G.; van Ittersum, M.K.; Schils, R.L.M.; Grassini, P. Water productivity of rainfed maize and wheat: A local to global perspective. Agric. For. Meteorol. 2018, 259, 364–373. [Google Scholar] [CrossRef] [PubMed]
  46. Li, Z.; Wang, W.; Ji, X.; Wu, P.; Zhuo, L. Machine learning modeling of water footprint in crop production distinguishing water supply and irrigation method scenarios. J. Hydrol. 2023, 625, 130171. [Google Scholar] [CrossRef]
  47. Cheng, Q.; Li, L.; Liao, Q.; Fu, H.; Nie, J.; Luo, Y.; Wang, Z.; Yin, H.; Shu, C.; Chen, Z.; et al. Is scale production more advantageous than smallholders for Chinese rice production? Energy 2023, 283, 128753. [Google Scholar] [CrossRef]
  48. Li, L.; Li, F.; Dong, Y. Greenhouse gas emissions and global warming potential in double-cropping rice fields as influenced by two water-saving irrigation modes in south china. J. Soil Sci. Plant Nutr. 2020, 20, 2617–2630. [Google Scholar] [CrossRef]
  49. Schyns, J.F.; Hoekstra, A.Y.; Booij, M.J.; Hogeboom, R.J.; Mekonnen, M.M. Limits to the world’s green water resources for food, feed, fiber, timber, and bioenergy. Proc. Natl. Acad. Sci. USA 2019, 116, 4893–4898. [Google Scholar] [CrossRef]
  50. Ma, W.; Wei, F.; Zhang, J.; Karthe, D.; Opp, C. Green water appropriation of the cropland ecosystem in China. Sci. Total Environ. 2022, 806, 150597. [Google Scholar] [CrossRef]
  51. Liang, H.; Zhou, G.P.; Gao, S.J.; Nie, J.; Xu, C.X.; Wu, J.; Liu, C.Z.; Lv, Y.H.; Huang, Y.B.; Geng, M.J.; et al. Exploring site-specific N application rate to reduce N footprint and increase crop production for green manure-rice rotation system in southern China. J. Environ. Manag. 2023, 347, 119033. [Google Scholar] [CrossRef] [PubMed]
  52. Huang, H.; Zhuo, L.; Wang, W.; Wu, P. Resilience assessment of blue and green water resources for staple crop production in China. Agric. Water Manag. 2023, 288, 108485. [Google Scholar] [CrossRef]
  53. Biswakarma, N.; Pooniya, V.; Zhiipao, R.R.; Kumar, D.; Shivay, Y.S.; Das, T.K.; Roy, D.; Das, B.; Choudhary, A.K.; Swarnalakshmi, K.; et al. Identification of a resource-efficient integrated crop management practice for the rice-wheat rotations in south Asian Indo-Gangetic Plains. Agric. Ecosyst. Environ. 2023, 357, 108675. [Google Scholar] [CrossRef]
Figure 1. Arrangement diagram of field measurement.
Agronomy 14 00166 g001
Figure 2. Daily blue water balance in for the three irrigation modes in the years 2015, 2016, and 2018. (IN: blue water inflow; ET: blue water evapotranspiration; PE: blue water percolation; DR: blue water drainage).
Agronomy 14 00166 g002
Figure 3. Blue water outflow indices in paddy field in normal, wet, and dry years.
Agronomy 14 00166 g003
Figure 4. Irrigation water productivity indicators in paddy field in normal, wet, and dry years.
Agronomy 14 00166 g004
Figure 5. Irrigation efficiency evaluation indicators in normal, wet, and dry years.
Agronomy 14 00166 g005
Table 1. Water level control program of each treatment. (mm).
TreatmentWater RegimesTuring Green
(TB)
Tillering
(TI)
Jointing and Booting
(JB)
Heading and Flowing
(HF)
Milking
Stage
(MI)
Yellow Ripening
(YE)
FSIULI/mm30305040400
LLI/mm1010–60% 10101060–70%
ADR/mm401001502002000
WSIULI/mm30202030300
LLI/mm20 70–90%90%100%80%70–80%
ADR/mm4060100100800
RCIULI/mm30 10010010010080
LLI/mm10 60–70%70–80%80%70%Naturally dry
ADR/mm801502002002000
ULI: upper limit of irrigation; LLI: lower limit of irrigation; ADR: Allowed depth after rain; mm: expression field water level; %: represents the percentage of water content in the saturated water content of soil.
Table 2. Framework of comprehensive evaluation index system for utilization of blue water resources.
Target LevelNormative LevelIndicator LevelUnitCalculation Methodology
Utilization efficiency of water resources in paddy fieldsEffective use rateGross irrigation efficiency (GIE)- ( E T + R E ) / I N
Net irrigation efficiency (NIE)- E T / I N
Effective consumption ratio (ECR)- E T / ( E T + R E )
Production abilityGross water productivity (GIE)kg·m−3 H C Y / I N
Net water productivity (GIE)kg·m−3 H C Y / E T
Marginal water productivity (GIE)kg·m−3 M W P = ( H C Y R C Y ) / I N
Water-saving and crop outputWater-saving amount (IWS)mmUsing FSI as the benchmark, the difference between each model and it is the amount of water saved.
Irrigation times (IRT)-Number of irrigation times during the rice growing season.
Harvest crop yield (HCY)kg·ha−1Harvested yield at the end of the growing season
Crop yield increase (CYI)kg·ha−1Using rain-fed conditions as the benchmark, the difference between three irrigation modes and rain-fed conditions in terms of yield.
Table 3. Target values of evaluation index grades of blue water for paddy irrigation–drainage system.
IndexEffectGrade Division
GIEPositive<0.5500.550–0.6000.600–0.6500.650–0.700>0.700
NIEPositive<0.4000.400–0.4500.450–0.5000.500–0.550>0.550
ECRPositive<0.6000.600–0.7000.700–0.8000.800–0.900>0.900
GWPPositive<2.002.00–2.502.50–3.003.00–3.50>3.50
NWPPositive<5.005.00–7.007.00–9.009.00–11.00>11.00
MWPPositive<1.501.50–2.002.00–2.502.50–3.00>3.00
IWSPositive<200200–300300–400400–500>500
IRTNegative>10.08.0–10.06.0–8.04.0–6.0<4.00
HCYPositive<78007800–80008000–82008200–8400>8400
CYIPositive<50005000–55005500–60006000–6500>6500
Table 4. The rank and significance of judgment matrix.
Intensity Level of ImportanceMeaning
1Equivalent significance
2Median value
3Weak significance
4Median value
5Moderate significance
6Median value
7Strong significance
8Median value
9Extreme significance
Table 5. Blue water inflow for three selected irrigation modes (mm).
Treatment2015
(Normal Year)
2016
(Wet Year)
2018
(Dry Year)
AVE
FSI425.3 a374.9 a412.9 a404.4 a
WSI346.7 b335.6 b391.9 a358.1 b
RCI135.3 c175.7 c214.3 c175.1 c
Note: Lowercase letters differing between treatments in the same column show considerable significance (p < 0.05).
Table 6. Crop yield and marginal yield of irrigation for different irrigation and drainage patterns (kg·m−3).
Irrigation
Method
2015 (Normal Year)2016 (Wet Year)2018 (Dry Year)
HCYRCYCYIHCYRCYCYIHCYRCYCYI
FSI8803.42947.65855.88599.13262.65336.58287.41452.76834.6
WSI8631.15683.58488.25225.68343.66890.9
RCI7876.74929.18203.34940.77673.76221.0
Table 7. Fuzzy comprehensive evaluation method was used to determine the grade target value of irrigation water management evaluation index.
Criteria LevelWeightSub-Criteria LevelLocal WeightTotal WeightUnit
Effective use rate0.3041Gross irrigation efficiencyGIE0.32810.0998-
Net irrigation efficiencyNIE0.46760.1422-
Effective consumption ratioECR0.20430.0621-
Production ability0.2498Gross water productivityGWP0.41630.104m3/kg
Net water productivityNWP0.27440.0685kg/m3
Marginal water productivityMWP0.30930.0773kg/m3
Water-saving and crop output0.4461Water-saving amountWSA0.20820.0928mm
Irrigation timesIRT0.21520.096-
Harvest crop yieldHCY0.47760.213kg/ha
Crop yield increaseCYI0.19070.0851kg/ha
Table 8. The fuzzy comprehensive evaluation model is used to compare the evaluation results of different irrigation and drainage patterns in 2015–2018.
TreatmentValueGrade
2015—WSI2.6133
2015—RCI3.1590
2015—FSI2.2796
2016—WSI2.7072
2016—RCI3.3173
2016—FSI2.5869
2018—WSI2.9771
2018—RCI3.5331
2018—FSI2.8510
Table 9. Comparison of evaluation results of water use efficiency in rice fields from 2015 to 2018.
YearTreatmentRanking of
Integrated Evaluations
NIEArrangeNWP (kg/m3)Arrange
2015FSI30.42624.8553
WSI20.44215.6352
RCI10.351316.5861
2016FSI30.52924.6312
WSI20.54614.3383
RCI10.46939.9451
2018FSI30.48314.1543
WSI20.48024.4392
RCI10.46137.7611
Disclaimer/Publisher’s Note: The statements, opinions and data contained in all publications are solely those of the individual author(s) and contributor(s) and not of MDPI and/or the editor(s). MDPI and/or the editor(s) disclaim responsibility for any injury to people or property resulting from any ideas, methods, instructions or products referred to in the content.

