Article

Effect of Subsurface Drainage in Regulating Water on Desalinization and Microbial Communities in Salinized Irrigation Soils

1
College of Water Conservancy and Civil Engineering, Inner Mongolia Agricultural University, Hohhot 010018, China
2
Water Conservancy Research Institute of Bayannur City, Bayannur 015100, China
3
Inner Mongolia Academy of Agricultural & Animal Husbandry Sciences, Hohhot 010030, China
*
Author to whom correspondence should be addressed.
These authors contributed equally to this work.
Agronomy 2024, 14(2), 282; https://doi.org/10.3390/agronomy14020282
Submission received: 23 December 2023 / Revised: 23 January 2024 / Accepted: 24 January 2024 / Published: 27 January 2024

Abstract

:
In order to achieve water conservation and salt control in saline irrigation areas and improve the soil ecological environment of farmland in irrigation areas, this study carried out a field trial in 2020–2021 on edible sunflowers planted in saline subsurface farmland in the Hetao Irrigation District. Three irrigation level treatments and a control setup under subsurface drainage were compared. The control was with no drainage and local conventional irrigation levels (the spring irrigation amount is 240 mm and the bud stage irrigation amount is 90 mm, CK); and the three irrigation levels were conventional irrigation (the spring irrigation amount is 240 mm and the bud stage irrigation amount is 90 mm, W1), medium water (the spring irrigation amount is 120 mm and the bud stage irrigation amount is 90 mm, W2), and low water (the spring irrigation amount is 120 mm and there is no irrigation in the bud stage, W3). The results showed that soil desalinization was best in the conventional irrigation (W1) treatment and lowest in the low-water treatment (W3) under subsurface drainage. The desalinization rate was 13.54% higher in the subsurface drainage than in the undrained treatment with the same amount of irrigation water. Under subsurface drainage, the medium-water treatment (W2) increased the diversity of soil microorganisms and the relative abundance of dominant phyla such as Ascomycetes, Chlorobacterium, Acidobacterium, and Ascomycetes among soil bacteria and Ascomycetes and Tephritobacterium amongst fungi. The average sunflower yield in the treatments under subsurface drainage increased by 32.37% compared with the undrained treatment, and the medium-water treatment (W2) was the most favorable for protein and essential amino acid synthesis. Structural equation modeling indicated that desalinization rate, irrigation water utilization efficiency, bacterial Chao1 abundance and Shannon diversity, and fungal Chao1 abundance and Shannon diversity were the major influences on sunflower yield. Based on the entropy weight method TOPSIS model, 15 indicators such as soil desalinization rate, soil microbial diversity, water and nitrogen utilization rate, and sunflower yield and quality were evaluated comprehensively for each water treatment of subsurface drainage farmland. It was found that the irrigation volume under tile drainage of 210 mm (W2) had the highest comprehensive score, which could improve the soil microenvironment of the farmland while realizing water conservation and salt control in salty farmland, increase the production of high-quality crops, and be conducive to the sustainable development of agriculture; it was the optimal irrigation treatment for the comprehensive effect. The results of this study are of great significance for the realization of efficient water conservation and salt control and the protection of food security and ecological safety in the Hetao Irrigation District.

1. Introduction

The Hetao Irrigation District is the main agricultural base for large-scale production of commercial grain and oil in China [1], but the area has a typical salinization irrigation area with an arid climate, little rainfall, and strong evaporation, and saline and alkaline arable land accounts for as much as 68.65% of the total arable land [2]. The increasing degree of soil salinization has led to low water and nitrogen utilization in irrigation areas [3], an imbalance in the microbial community structure [4], and a reduction in the yield and quality of sunflowers [5]. At present, there are a variety of methods for improving saline–alkali land, mainly including biological improvement, straw burying depth [6], and planting saline–alkali-tolerant crops [7], but the above methods cannot fundamentally achieve the effect of complete soil desalination. At present, the irrigation situation in the Hetao Irrigation District leads to serious salt accumulation. Therefore, drainage measures are the most critical step in the improvement in saline–alkali land. Subsurface drainage has the advantages of improving land utilization rates, facilitating mechanized farm operations, reducing water leaching, etc. It can effectively reduce groundwater level and prevent soil salt return [8], and it has been well applied in saline–alkali land improvement in all countries in the world [9]. It is a drainage and salt control measure more suitable for the Hetao irrigation area. At the same time, with the deepening of the irrigation district water-conservation renovation project and the continuous implementation of water rights conversion, water conservation requirements are becoming more and more important [10], and the development of water-saving agriculture has also become a priority for the development of the Hetao Irrigation District. Under the dual tasks of vigorously developing water-saving agriculture and saline–alkali land improvement, it is of great significance to safeguard food security and ecological safety in salinized irrigation areas by combining subsurface drainage with water-saving irrigation and formulating a suitable irrigation and drainage management system for water saving, salt control, and quality enhancement of crops with the concept of ecological priority and green development.
At present, there have been many reports on the improvement in the saline–alkali soil in the Hetao Irrigation District with subsurface drainage. Previous studies have shown that a drainage system with subsurface drainage can significantly improve the leaching and desalting effects. By comparing the influence of different subsurface drainage systems on the leaching and desalting improvement in saline soil, it was found that a drainage system with a narrow space between dark pipes had a better improvement effect. Drainage areas with hidden pipes can improve crop yield [11] and irrigation water production efficiency [12]. Previous studies on the effect of different border irrigation quotas on soil desalting showed that reducing the conventional irrigation amount by 10% combined with drainage technology was an appropriate irrigation model to achieve water saving [13] and salt control [14]. However, considering the influence of different irrigation quotas for underground drainage on farmland soil ecosystems at the same time, there are few reports to formulate appropriate irrigation models. Soil microorganisms are an evaluation index for stabilizing farmland soil ecosystems [15] and monitoring soil quality change [16]. Microbial quantity and diversity are of great significance for nutrient element cycling [17] and land quality improvement [18] in farmland ecosystems and can promote crop growth. However, the effects of different irrigation rates on the distribution of soil microbial communities in saline soils under tile drainage have rarely been reported. Furthermore, the direct effects of different irrigation rates on the soil environment and the indirect effects on soil microorganisms in subsurface drainage farmland are not clearly understood. In addition, few studies have evaluated the improvement effects of tile drainage projects from the perspective of the combined effect on soil microbial diversity and community structure. In this study, field experiments were carried out in the saline subsurface drainage farmland deployment area of the Hetao Irrigation District to determine the effects of water regulation under subsurface drainage on soil desalinization, soil microorganisms, and sunflower yield and quality. The results of this study are of great significance for the realization of high-efficiency water conservation and salinity control in the Hetao Irrigation District and for protecting food security and ecological safety.

2. Materials and Methods

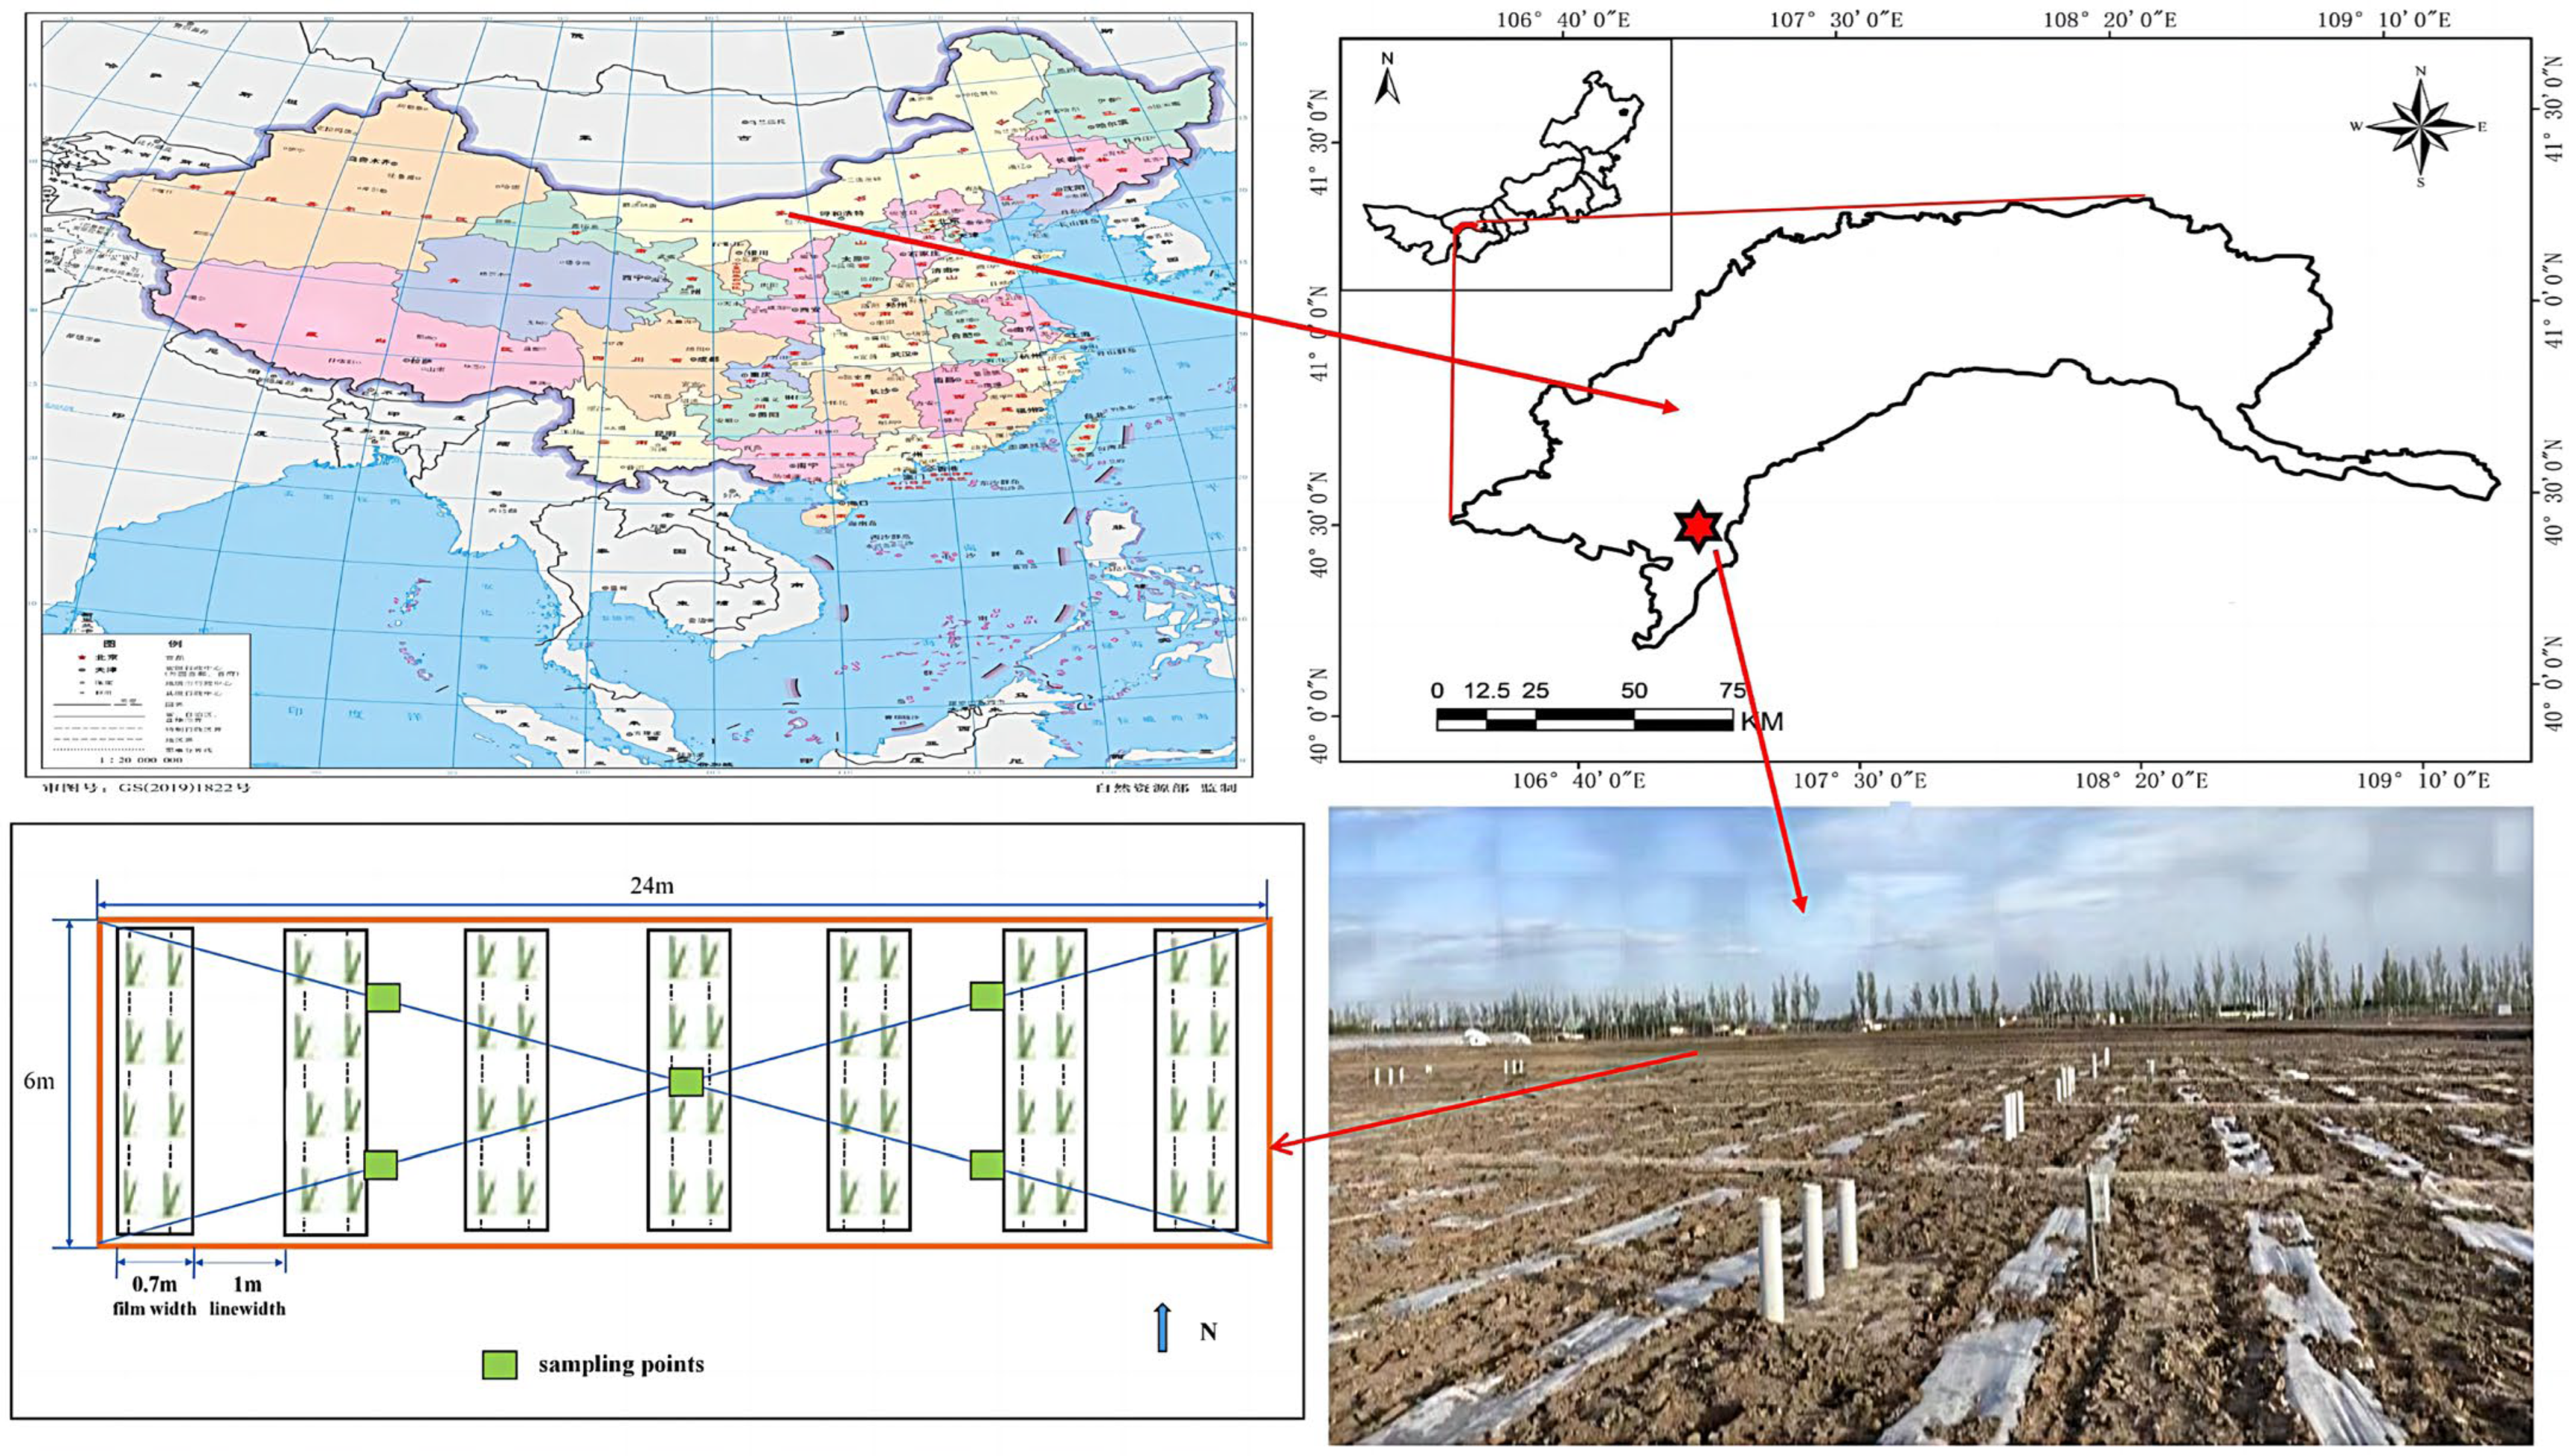
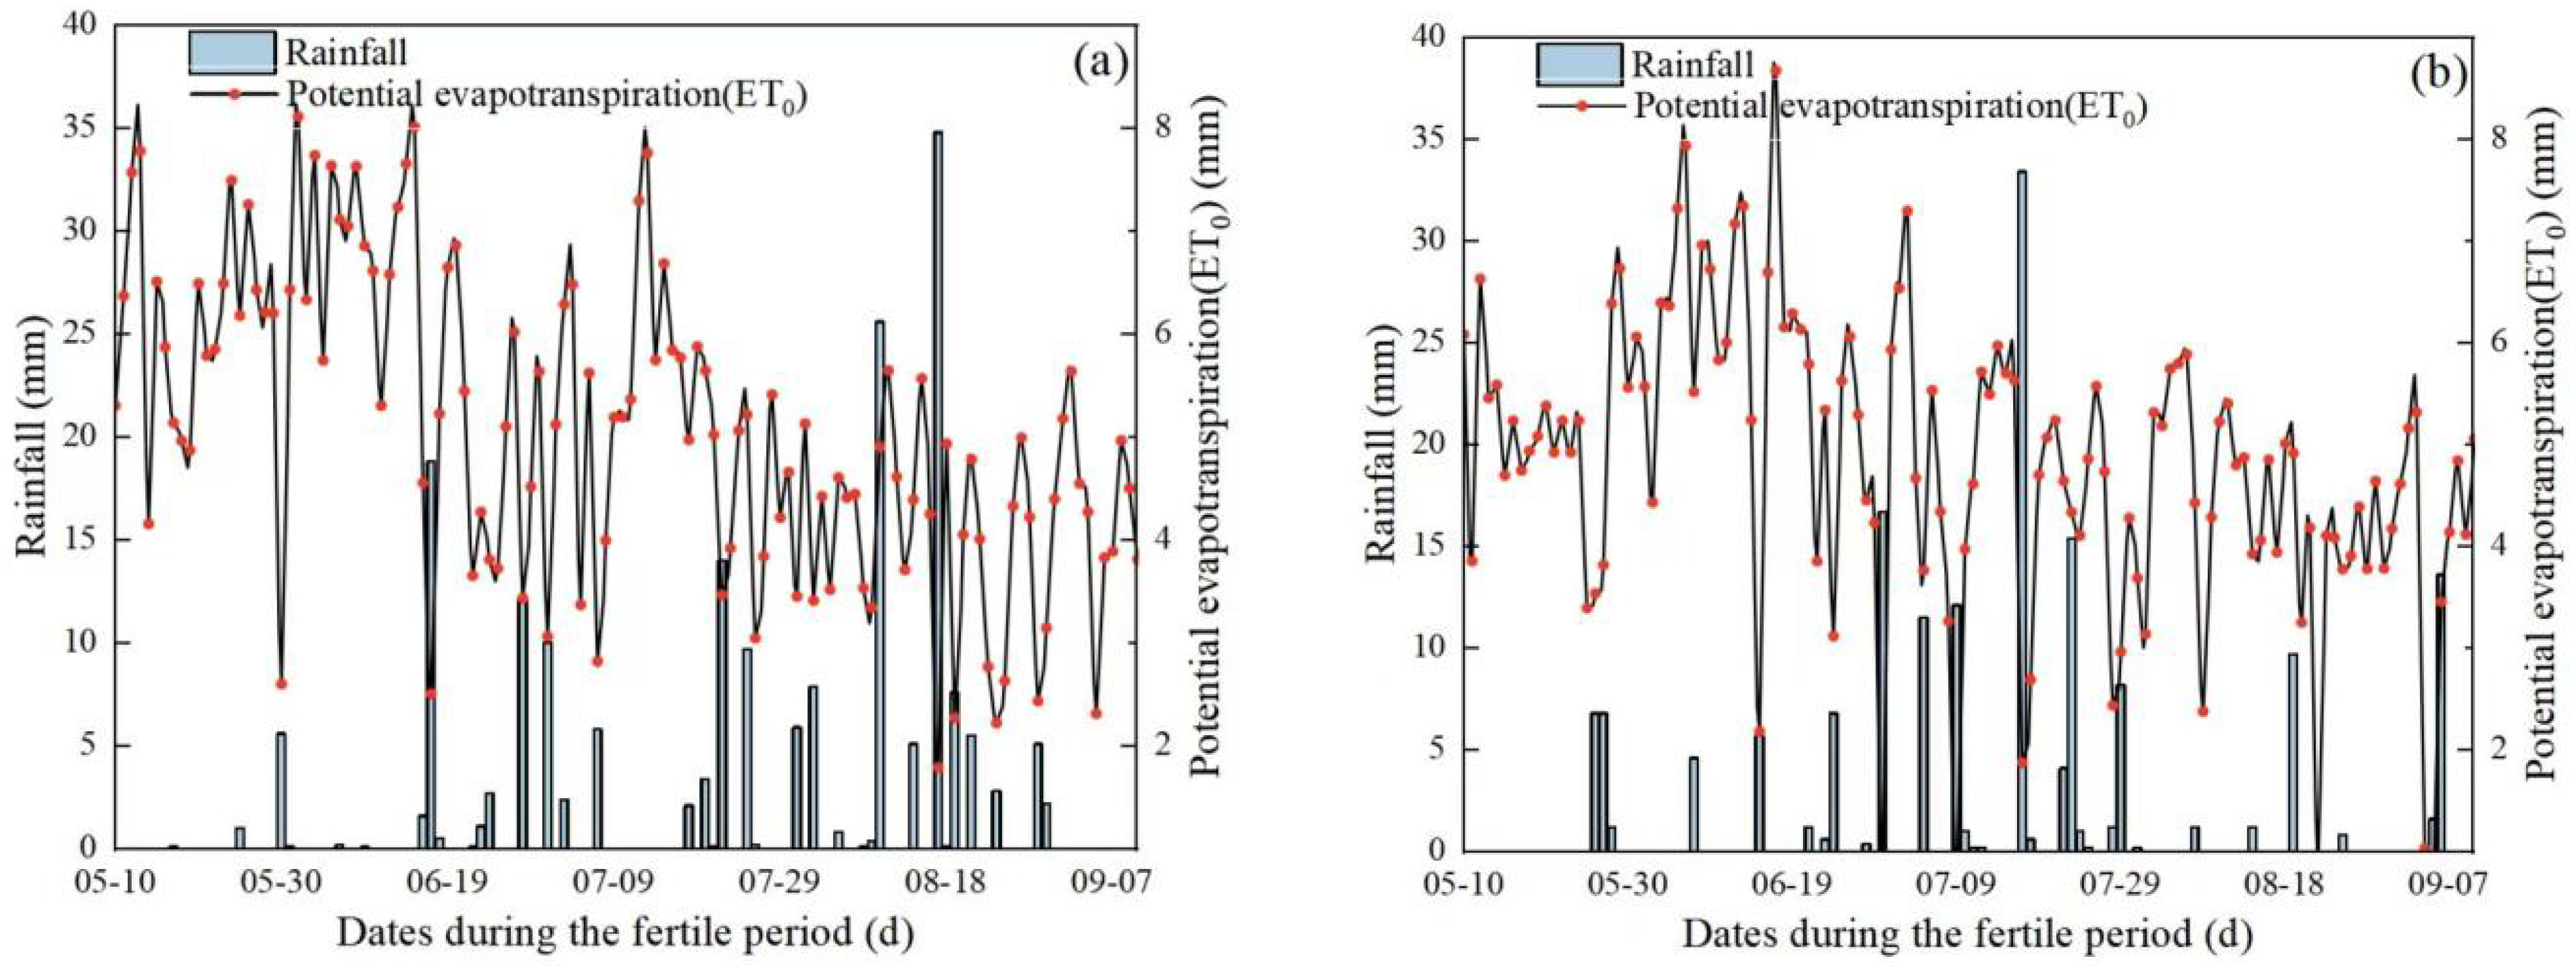
2.1. Description of the Experimental Site

Field experiments were conducted from May through September 2020 and May through September 2021 in the subsurface drainage experimental area of Bayannur City Agricultural and Animal Husbandry Science Research Institute (107°16′ E, 38°52′ N) located in the Hetao Irrigation District, as shown in Figure 1. The terrain of the test area was flat, the drainage and irrigation facilities were perfect, the suction pipe was laid in the north–south direction with a total length of 500 m, the depth of burial at the extremity and last ends was 1.2~1.7 m, the spacing was 25 m, and the slope was 1%. The field test plot was laid out in an east–west direction of 24 m and a north–south direction of 6 m. There was a collector pipe through the middle, and the buried depth of subsurface drainage in the test area was between 1.45 m and 1.50 m. The suction pipe was a PVC single-arm corrugated pipe with a diameter of 80 mm, the collector pipe was a PVC hard plastic pipe with a diameter of 80 mm, and the subsurface drainage measures used in this area were part of a secondary drainage system. After considering the study area and the number of samples, we preferred a sampling method with an average relative estimation error of less than 5% for a sampling volume of 100 sampling units (100 m2), with the error for five-point sampling being smaller at about 3%.
The experimental site used a small automatic monitoring meteorological station with regular computerized collection of meteorological data, including air temperature, rainfall, relative humidity, hours of sunshine, and average wind speed. The test area had a typical temperate continental monsoon climate, rich in wind energy and sunshine resources, high evaporation, and high precipitation. The average annual sunshine was 3223 h, the average annual evaporation was 1937.9 mm, rainfall was less and more concentrated in July and August, the average annual precipitation was 138.8 mm, and the average frost-free period was shorter at about 130 days. The total rainfall during the crop reproductive period (May to September) in the experimental area was 146.1 mm and 81.2 mm in 2020 and 2021, respectively, and the multi-year average wind speed ranged from 2.5 to 3.3 m per second. The dynamic change in groundwater level in the experimental area was monitored by placing an automatic water level meter in the drench pipe. Figure 2 shows the relationship between precipitation and potential evapotranspiration (ET0) during the sunflower reproductive period in 2020–2021.
Soil texture was determined using a laser particle size analyzer and classified according to the soil texture description of the United States Department of Agriculture (USDA). The soil texture in the 0–40 cm layer of the experimental area with different drainage patterns was chalky sandy loam. Before the experiment, the 0–40 cm layer of soil was moderately saline, with Na+ (250 ± 22 mg·kg−1) as the dominant cation and HCO3− (193 ± 16 mg·kg−1) as the dominant anion. The basic physical and chemical properties of the soil are shown in Table 1.

2.2. Experimental Treatments and Design

Edible sunflower was selected as the test crop for the two-year experiment (HZ2399). In this experiment, three levels of irrigation were set up under the conditions of subsurface drainage. A spring irrigation amount of 240 mm and a bud stage irrigation amount of 90 mm were set as the local conventional irrigation level (330 mm, W1), the W1 treatment with 50% spring irrigation and 90 mm of irrigation at the bud stage was set as the medium-water treatment (210 mm, W2), the W1 treatment with 50% spring irrigation and no irrigation at the bud stage was set as the low-water treatment (120 mm, W3), and the local conventional irrigation level under undrained water was set as the control treatment (330 mm, CK). The same amount of nitrogen was applied to all treatments; diamine phosphate (18% N) was applied as the base fertilizer at 67.5 kg/hm2, and urea (46% N) was applied as the follow-up fertilizer at 210 kg/hm2.
Irrigation occurred on 10 May 2020 and 15 May 2021, and then on 15 July 2020 and 17 July 2021 during the bud stage. The irrigation method used was border irrigation with Yellow River water, and the amount of water was controlled by a water meter. The experimental plots were 24 m × 6 m in size, and 1 m deep plastic film was laid around the plots to prevent water, salt, and nutrients from seeping through. The experiment was conducted in a completely randomized block design with three replications per treatment and a total of 12 plots. Sunflower sowing dates were 28 May in 2020 and 29 May in 2021; planting mode was 1 membrane with 2 rows, plant spacing of 0.55 m, row spacing of 1 m, and a planting density of about 25,000 plants/hm2. Sunflower planting is done by hand mulching and spot seeding. Other field management measures, including local planting habits to maintain consistency; the full experimental design is shown in Table 2.

2.3. Research Method

The soil was sampled in layers from 0 to 40 cm depth using the soil auger method. Soil samples were air-dried and ground to pass through a 1 mm sieve, and the conductivity value of the soil leachate with a soil–water mass ratio of 1:5 was determined using a conductivity meter (DDS-307A, Shanghai LeiMagnet, Shanghai, China).
Soil samples were taken during the sunflower ripening period, 0~2 cm of topsoil was removed during sampling, gravel and plant residues and other debris were excluded, and soil samples were taken from the surface of the soil layer at depths of 0~20 cm and 20~40 cm in each treatment using a five-point sampling method; soil samples from the five points were mixed uniformly, placed in aseptic bags, and preserved at −80 °C for soil DNA extraction and bacterial 16S rDNA sequencing. Soil DNA was extracted using a soil DNA extraction kit (Omega Bio-Tek, Norcross, GA, USA). Integrity of the extracted DNA was determined using 1% agarose gel electrophoresis, and the purity and concentration of the DNA were determined using a NanoDrop 2000 UV spectrophotometer with primers 338F (5′-barcode+ACTCCTACGGGGAGGCAGCA-3′) and 806R (5′-GGACTACHVGGGGTWTCTAAT-3′) to amplify the V3-V4 region of the bacterial 16S rRNA gene. PCR products were detected by 2% agarose gel electrophoresis, and the target fragments were excised and recovered using the Axygen Gel Recovery Kit. Libraries were constructed using the TruSeq Nano DNA LT Library Prep Kit, quality-checked using the Agilent High Sensitivity DNA Kit on an Agilent Bioanalyzer machine, and analyzed using the Quant-iT PicoGreen dsDNA Assay Kit on a Promodent Bioanalyzer machine. The dsDNA Assay Kit was used to quantify libraries on Promega QuantiFluor. After libraries were qualified, they were subjected to bipartite 2 × 250 bp high-throughput sequencing using the Illumina MiSeq sequencing platform.
At sunflower maturity, each plot was harvested separately, and the seed weight, 100-seed weight, mu yield, and fruiting rate were measured. Sunflower seeds were picked at the positions of the 3rd and 4th circles on the outside of the disk, and the quality indices of the 50 kernels per plot were examined after hulling and mixing uniformly. Experiments were replicated three times, and average values were taken. The protein content of seed kernels was determined using kjeltecTM8100 (FOSS, Beijing, China). The crude fat content of seed kernels was determined using PE Clarus680 (Varian, Palo Alto, CA, USA), and the amino acid fraction was determined using an L-8900 amino acid analyzer.
The desalinization rate was defined as the reduction in soil conductivity as a percentage of the initial value and was calculated using the formula:
ω = S 0 S t S 0 × 100 %
where ω represents the soil desalinization rate; S0 denotes the soil EC after the maturation period (mS/cm); and St indicates the soil EC before sowing (mS/cm).
The irrigation water use efficiency (kg/m3) was calculated using the formula:
        I W U E = Y I
where Y represents the crop seed yield at maturity (kg/hm2) and I denotes the total irrigation water (m3/hm2).
The formula for calculating nitrogen fertilizer bias productivity (NPFP, kg/kg) was:
N P F P = Y F n
where Fn represents the nitrogen application rate (kg/hm2).

2.4. Data Analysis

Microsoft Excel 2016 software was used for preliminary organization and analysis of the data; SPSS 26.0 was used for the analysis of variance and significance of difference; Mothur was used to calculate the Alpha diversity index of microbial communities (Shannon, Chao1 index); modeling and analysis of structural equation models were performed using AMOS software (IBM SPSS Amos 28) and plotted using Origin2021.

3. Results

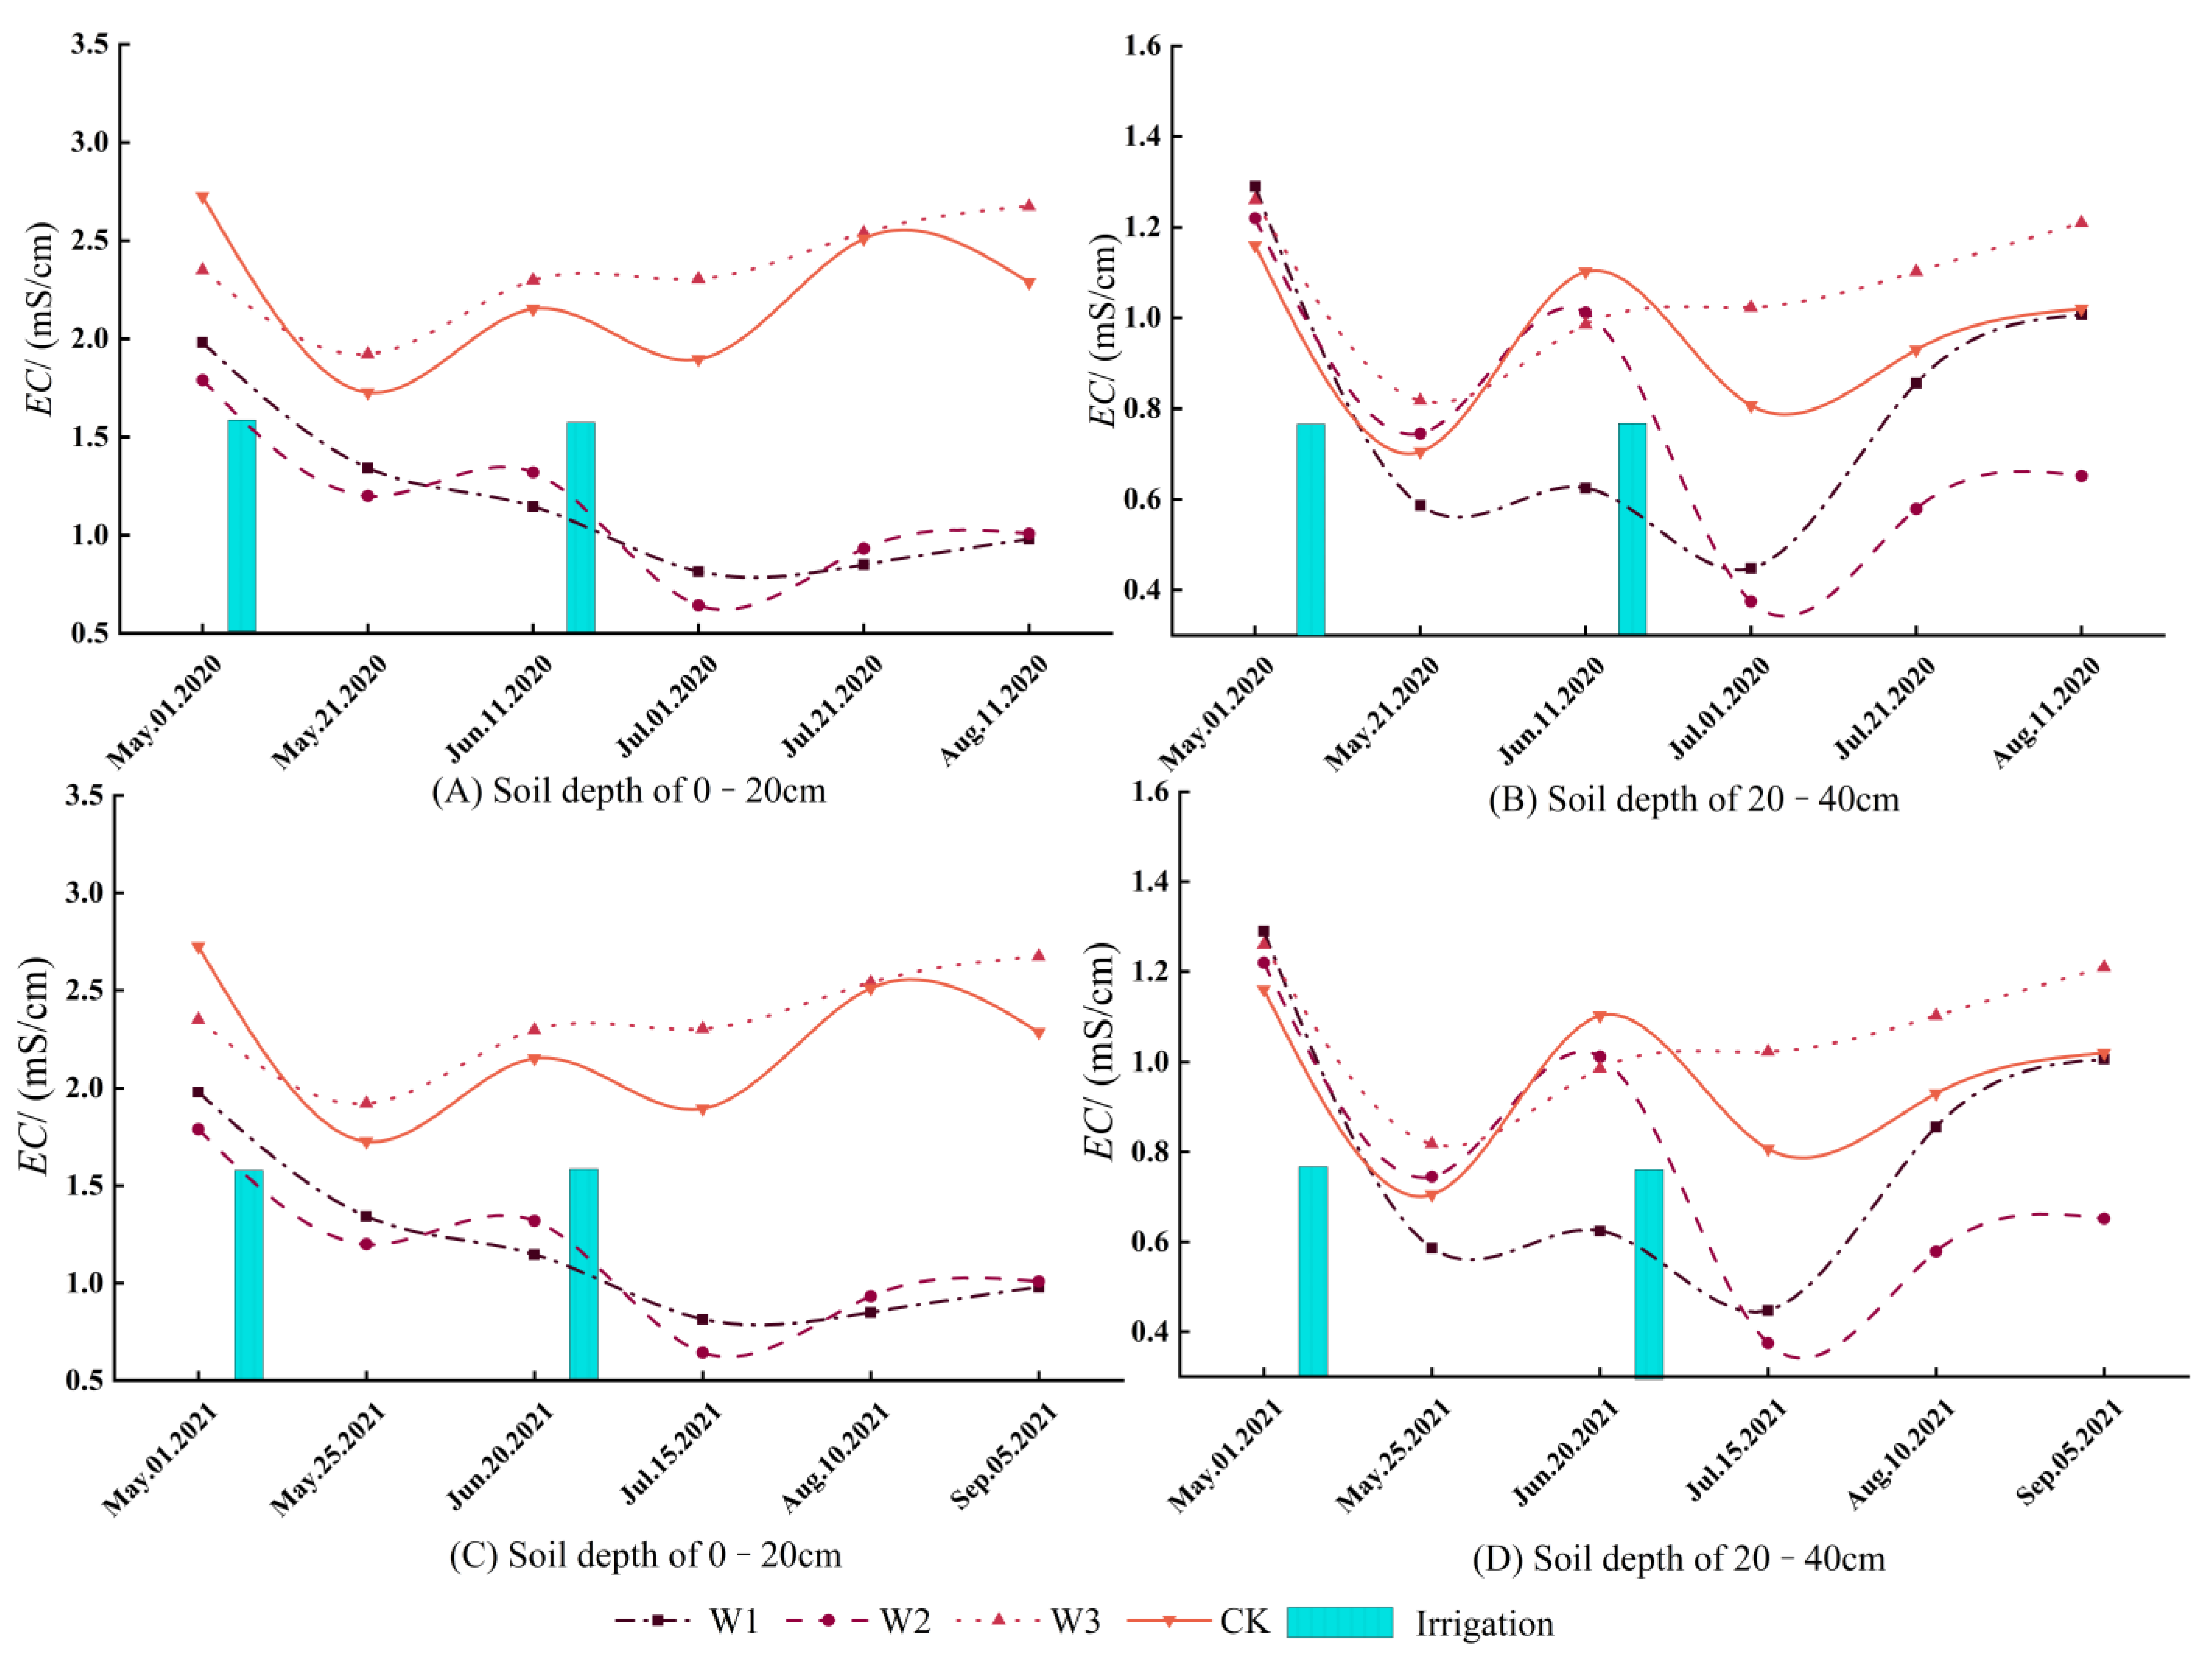
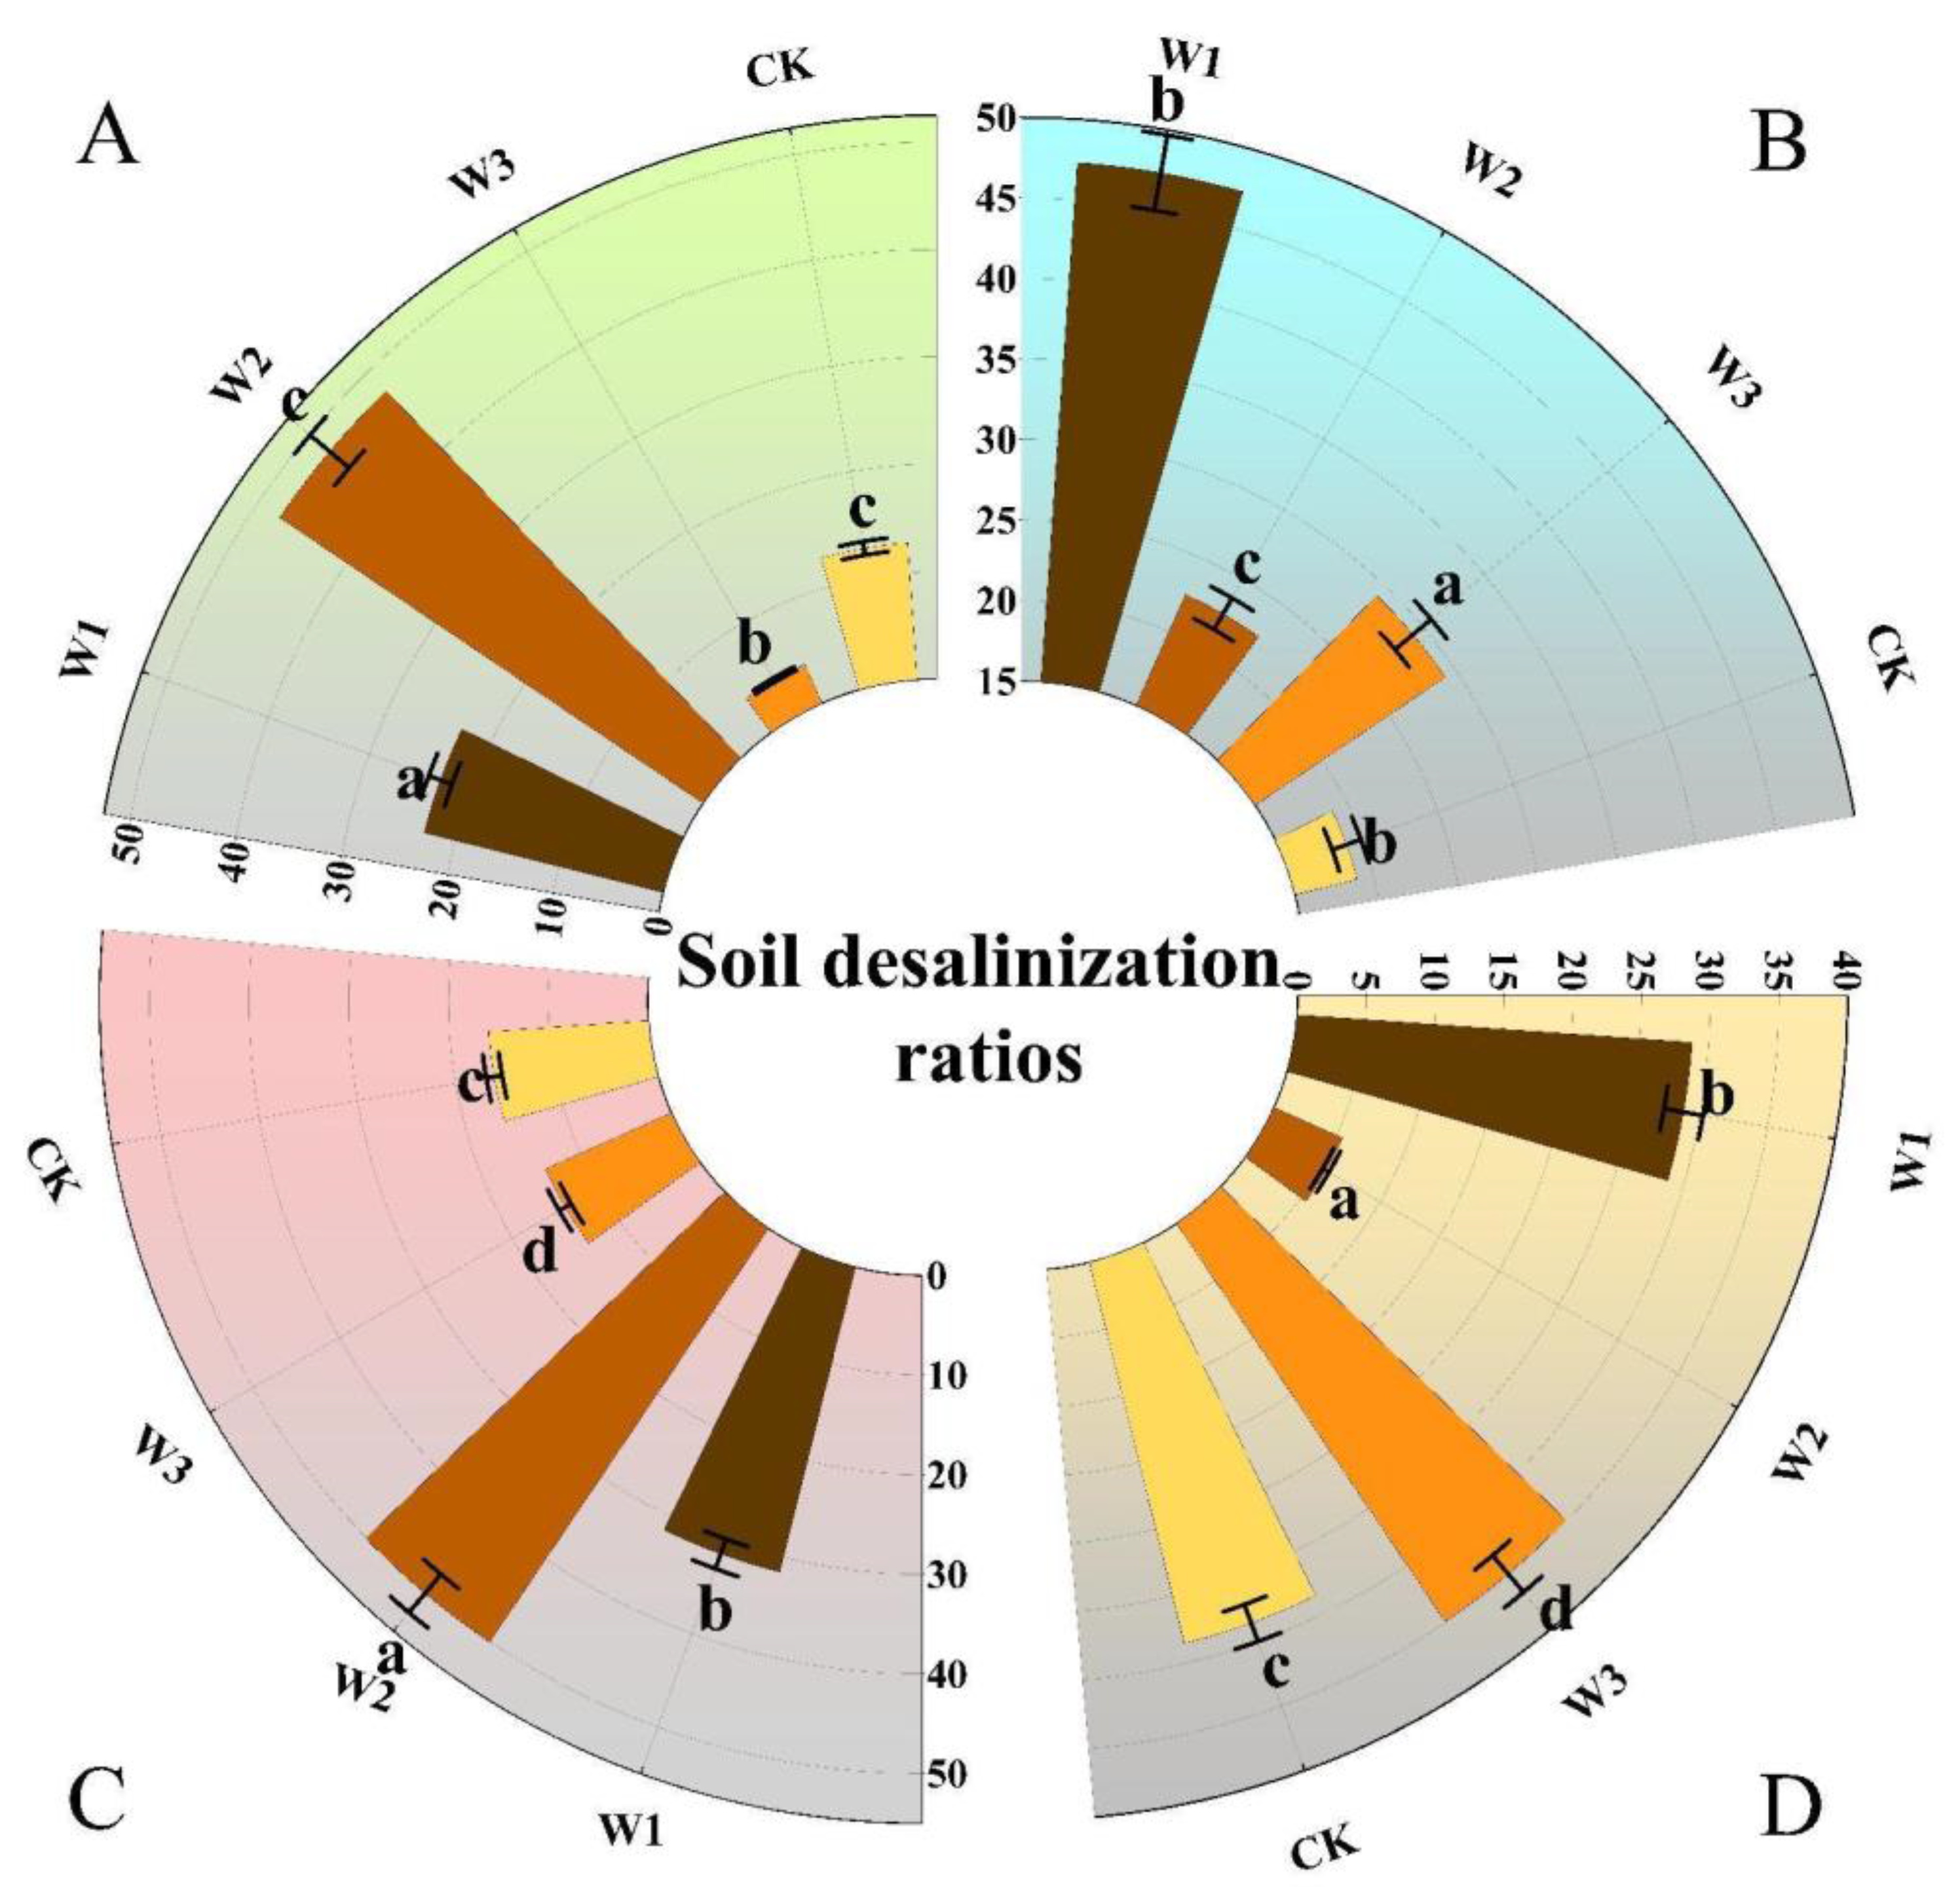
3.1. Distribution Characteristics of Water and Salt in Cultivated Wasteland

The changes in soil EC from 0 to 40 cm in each treatment in 2020 and 2021 are shown in Figure 3. The two-year results showed that the soil salinity among treatments as a whole was W3 > CK > W2 > W1, and when the irrigation water volume was the same, the subsurface drainage reduced soil salinity compared with the no-drainage treatment. When analyzed from the perspective of two-year averages, at soil depths of 0–20 cm, the EC values of W1 and W2 were 91% and 85% lower than those of W3, respectively. At soil depths from 20 to 40 cm, the EC values of W1 and W2 were reduced by 29.7% and 26%, respectively, compared with W3. This indicated that, under the conditions of subsurface drainage, irrigation volume was negatively correlated with soil salinity content, and the higher the irrigation volume, the lower the soil salinity. As the fertility period progressed, the EC values of each treatment showed a fluctuating trend of repeated decreases and then increases, with an overall decreasing trend throughout the fertility period. The two reductions in soil salinity during the whole reproductive period occurred after irrigation with pressurized saline water and after irrigation at the bud stage, whereas in the W3 treatment, which was not irrigated at the bud stage, there was no tendency for reduced soil salinity, suggesting that irrigation significantly reduced the salinity of the surface soil. After irrigation, soil salinity rose again with the advancement of the fertility period. This was due to drought and little rainfall in the river-loop irrigation area, resulting in strong evaporation, groundwater salts, and increased capillary gathering in the soil surface that returned salts to the surface. This was coupled with the absence of bud stage irrigation during the whole fertility period, which was prevented due to the presence of surface soil salts and meant that surface salts continued to accumulate, elevating salinity.
The desalinization rate of 0–40 cm of soil for each treatment in 2020 and 2021 is shown in Figure 4. In 2020, the desalination rates of the W1 and W2 treatments were 64.23% and 30.91% higher, respectively, at soil depths of 0 to 20 cm than at soil depths of 20 to 40 cm; in 2021, the desalination rates of the W1 and W2 treatments were 37.55% and 5.38% higher, respectively, at soil depths of 0 to 20 cm than at soil depths of 20 to 40 cm. This indicated that the soil desalinization rate decreased with increased soil depth in the W1 and W2 treatments. The desalinization effect of soil in each treatment was W1 > W2 > CK > W3, but the difference between the two treatments, W1 and W2, was not significant (p-value > 0.05). The desalinization rate of W1 was 11.45%, 13.54%, and 12.79% higher than that of the other three treatments in the two years. The soil desalinization rate of W1 was 13.54% higher than that of CK with the same amount of irrigation water. The desalinization rate of each soil layer in the W2 treatment was greater than that of the corresponding soil layer in the W1 treatment in 2021, which indicated that the desalinization effect of the soil was not better than that of the larger irrigation volume under the conditions of subsurface drainage. Although the subsurface drainage had the effect of lowering the water table, the irrigation volume was too large, causing the water table of the soil to rise transiently, and the salts were transported upward with the water to form secondary salinity. The desalinization effect of the soil in the W3 treatment was the lowest, and salt accumulation became evident in 2021 because the irrigation volume was larger than that of the W2 treatment. This took place because the irrigation water volume was small and the soil salt washing was insufficient; hence, it could not wash the surface soil salt into the deeper soil layers, causing it to remain in the tillage layer. Moreover, after the treatment of saline water pressure, there was no more irrigation during the whole fertility period, which, together with the arid, low-rainfall, and strong-evaporation climatic conditions in the Hetao Irrigation District, led to the accumulation of soil salts at the surface layer during the fertility period and the formation of returning salts, thus making the salt accumulation phenomenon obvious. So, from the perspective of water saving and salt control, the W2 water treatment ensured the soil desalinization effect and also improved water saving. As a result, it achieved high efficiency in both water saving and salt control.

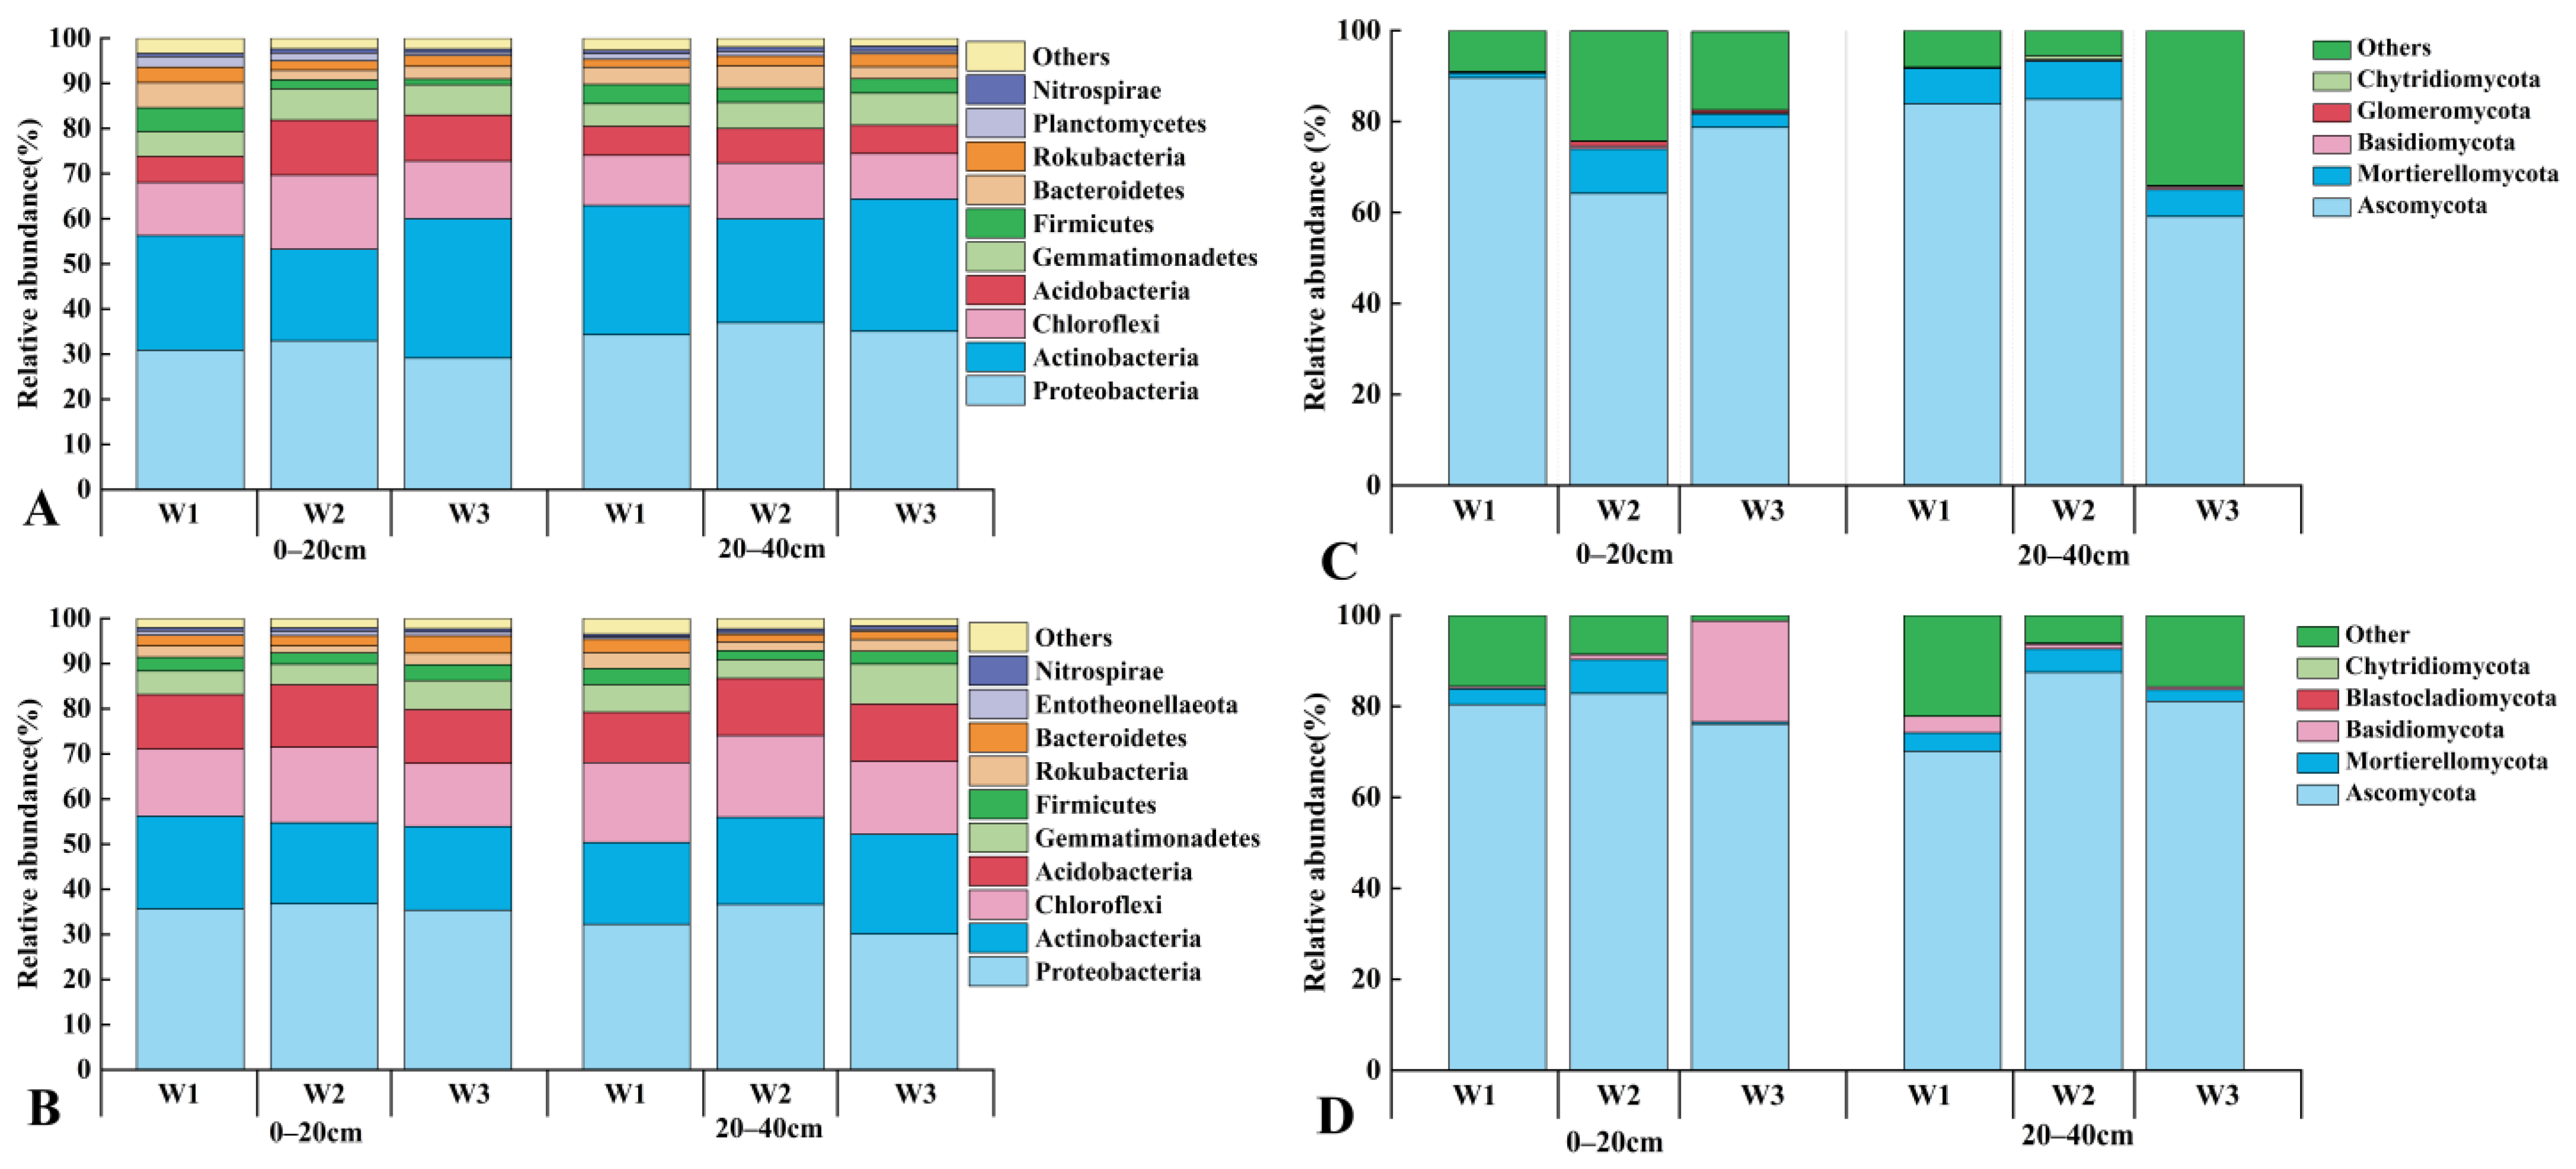
3.2. Effects of Water Regulation on Soil Microbial Diversity and Community Structure under Subsurface Drainage

Table 3 shows the diversity of soil bacteria and fungi for each moisture treatment under subsurface drainage conditions in 2020 and 2021. The Chao1 index and the Shannon index denote the community richness and diversity of microorganisms, respectively. In terms of bacteria, the Chao1 index of each treatment in 2020 and 2021 ranged from 4016.74 to 5113.60 and from 4095.49 to 5508.17, and the Shannon index of each treatment in 2020 and 2021 ranged from 10.06 to 10.68 and from 10.56 to 11.03, respectively. Shannon diversity indices generally showed that W2 > W1 > W3, although there were no significant differences in Shannon index between treatments (p-value > 0.05). From the perspective of yearly means, W2 showed 15.62% and 18.46% increases in the Chao1 index and 12.75% and 15.10% increases in the Shannon indices compared with W1 and W3.
For fungi, the Chao1 index of each treatment ranged from 298.61 to 674.94 and from 111.05 to 258.34 in 2020 and 2021, and the Shannon index of each treatment ranged from 2.61 to 5.78 and from 2.61 to 5.04 in 2020 and 2021, respectively. Overall, the fungal Chao1 index and Shannon diversity index of all treatments were generally W2 > W1 > W3. When analyzed from the perspective of two-year average values, W2 showed an increase in the Chao1 index of 9.49% and 57.91% and an increase in the Shannon index of 26.79% and 33.02% compared with W1 and W3, respectively. These results indicated that the medium-water treatment (W2) enriched the microbial community in the soil, which was conducive to the improvement in soil microbial diversity.
Soil bacterial community composition and abundance at the phylum level during sunflower ripening under different moisture regimes in 2020 and 2021 are shown in Figure 5A,B. The top ten phyla of soil bacteria distributed at the phylum level in 2020 and 2021 were as follows: Proteobacteria, Actinobacteria, Chloroflexi, Acidobacteria, Gemmatimonadetes, Firmicutes, Bacteroidetes, Rokubacteria, Planctomycetes, and Nitrospirae. Microbial statistics were analyzed only considering those phyla with an average relative abundance greater than 5% as the dominant phyla. The two-year averages showed that in the 0–20 cm soil layer, W2 showed an average increase of 2.47% and 6.43% in Ascomycetes, 3.29% and 3.2% in Chlorobacterium, and 4.63% and 3.11% in Acidobacterium, compared with W1 and W3, respectively. In the 20–40 cm soil layer, W2 showed an increase in relative abundance of 4.38% and 4.27% in Ascomycetes, 1.32% and 3.45% in Chlorobacterium, and 1.35% and 2.52% in Acidobacterium, compared with W1 and W3, respectively. In the soil layer from 0–20 cm, W3 showed an increase of 4.89% and 8.59% in the relative abundance of Actinobacterium compared with W1 and W2, respectively, and in the soil layer from 20 to 40 cm, W3 showed an increase of 6.05% and 6.75% compared with W1 and W2, respectively. In conclusion, the medium-water treatment (W2) favored the growth of Ascomycota, Chlorobacterium, and Acidobacterium in the soil, while the low-water treatment (W3) favored the growth of Actinobacteria.
Figure 5C shows that the top five phyla of soil fungi distributed at the phylum level in 2020 were as follows: Ascomycota, Mortierellomycota, Basidiomycota, Chytridiomycota, and Glomeromycota. In 2021, the top five phyla of soil fungi distributed at the phylum level were as follows: Ascomycota, Mortierellomycota, Basidiomycota, Blastocladiomycota, and Chytridiomycota. The dominant phyla in the soil in 2020 were Ascomycota (59.09–88.62%) and Mortierellomycota (1.26–15.85%). In the 0–20 cm soil layer, Mortierellomycota was the dominant phylum in W2, and the relative abundance of Mortierellomycota in W2 was higher than that in W1 (8.70%) and W3 (6.84%). In the 20–40 cm soil layer, the relative abundance of Aspergillus spp. in W2 was higher than in W1. Figure 5D shows that the dominant phyla in all soil layers in 2021 were Ascomycota (67.00~91.29%), Mortierellomycota (1.42~12.12%), and Basidiomycota (0.51~22.22%). In W2, the abundance of Ascomycota increased by 0.03~17.35% and that of Tephritobacterium by 0.6~7.31% compared with W1 and W3, respectively. In the W3 treatment, the relative abundance of Tephritobacterium significantly increased in the soil by 21.72% and 21.11% compared with W1 and W2 in the 20~40 cm soil layer.

3.3. Effect of Water Regulation on Yield Quality of Sunflower under Subsurface Drainage

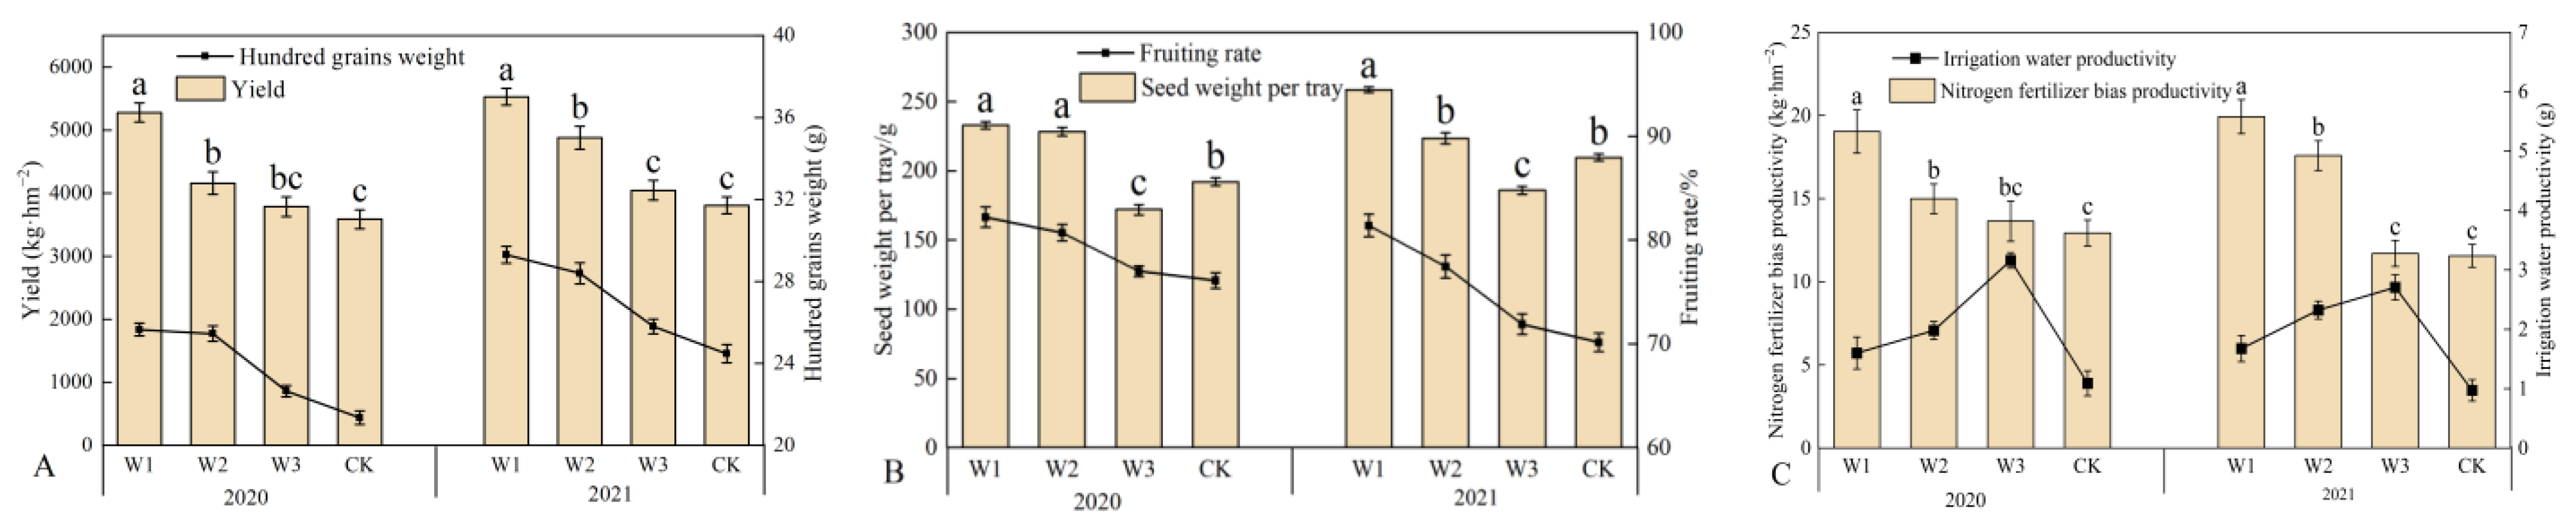
3.3.1. Yield Indicators and Water and Nitrogen Use Efficiency in Sunflower

The yield and components of sunflower seeds in 2020 and 2021 are shown in Figure 6. The yield was analyzed, and the sunflower yield in 2020 and 2021 ranged from 3588.96 to 5279.44 kg/hm2 and from 3207.43 to 5529.44 kg/hm2. The two-year results showed that the W1 yield was significantly higher than in the W2, W3, and CK treatments (p-value < 0.05). In 2020, the production of W1 increased by 26.91%, 39.44% and 47.10% compared to W2, W3 and CK respectively. In 2021, the production of W1 increased by 13.31%, 36.63% and 45.2% compared to W2, W3 and CK respectively. The yield of W1, W2, and W3 was higher than that of the CK treatments by 47.1%, 15.9%, and 5.5% and 45.2%, 28.1%, and 6.2%, respectively, in the two-year period, but the difference between W3 and CK was not significant (p-value > 0.05), which indicated that subsurface drainage was more favorable for sunflower yield compared to no drainage. Under subsurface drainage, the irrigation treatments showed a trend of higher yield with higher irrigation volume, which indicated that increasing the irrigation volume under subsurface drainage helped to increase sunflower yield, while decreasing the irrigation volume resulted in sunflower yield reduction, and the stronger the reduction, the greater the effect on crop yield. The hundred-grain weight was significantly higher in the subsurface-drained treatment compared with the undrained treatment, with increases over CK of 20.14%, 19.20%, and 6.10% in 2020 and 19.75%, 16.07%, and 5.45% in 2021 in the W1, W2, and W3 treatments, respectively. The seed weight of sunflower seeds per disk ranged from 178.0 g to 233.0 g in 2020 and from 186.7 g to 258.6 g in 2021. Sunflower seed kernel fertility ranged from 76.1% to 82.2% in 2020 and from 70.14% to 81.4% in 2021. In 2021, the difference between the treatments (W1, W2, W3) and CK was significant (p-value < 0.05), and W1 was 15.7%, 39.0%, and 23.3% higher than W2, W3, and CK, respectively. Fruiting percentage was significantly higher in the subsurface-drained treatment than in the undrained treatment, with increases of 6.01%, 4.6%, and 0.9% in 2020 and 11.25%, 7.30%, and 1.74% in 2021 for all treatments compared with CK. Under subsurface drainage conditions, W1 was 1.5% and 5.2% higher than W2 and W3, respectively, in 2020, and 3.94% and 9.51% higher than W2 and W3, respectively, in 2021.
In conclusion, subsurface drainage was more favorable for increasing yield, 100-seed weight, seed weight per panicle, and fruiting rate of sunflower than the undrained treatment. Under subsurface drainage conditions, the irrigation treatments showed that a higher irrigation volume was most favorable for increasing yield, 100-seed weight, seed weight per panicle, and fruiting rate.
The irrigation water productivity and nitrogen fertilizer bias on productivity in 2020 and 2021 are shown in Figure 6C. The irrigation water productivity of the treatments in 2020 and 2021 ranged from 1.09 to 3.16 kg/m3 and from 0.97 to 2.71 kg/m3, respectively, and nitrogen fertilizer bias productivity ranged from 12.93 to 19.03 kg/kg and from 11.56 to 19.93 kg/kg, respectively. The two-year results showed that the treatment with the highest irrigation water productivity was W3, which increased by 1.56%, 1.18%, and 2.07% in 2020 and 1.71%, 0.39%, and 1.74% in 2021 compared with the W1, W2, and CK treatments, respectively. The treatment with the highest nitrogen fertilizer bias productivity was W1, which was higher than the W2, W3, and CK treatments by 4.04%, 5.39%, and 6.1% in 2020 and 2.34%, 8.23%, and 8.37% in 2021, respectively. At the same irrigation water volume, subsurface drainage increased irrigation water productivity and nitrogen fertilizer bias productivity compared with no drainage. Under subsurface drainage, the smaller the irrigation water volume was, the more favorable it was to increasing irrigation water productivity, and the larger the irrigation water volume was, the more favorable it was to increasing nitrogen fertilizer bias productivity.

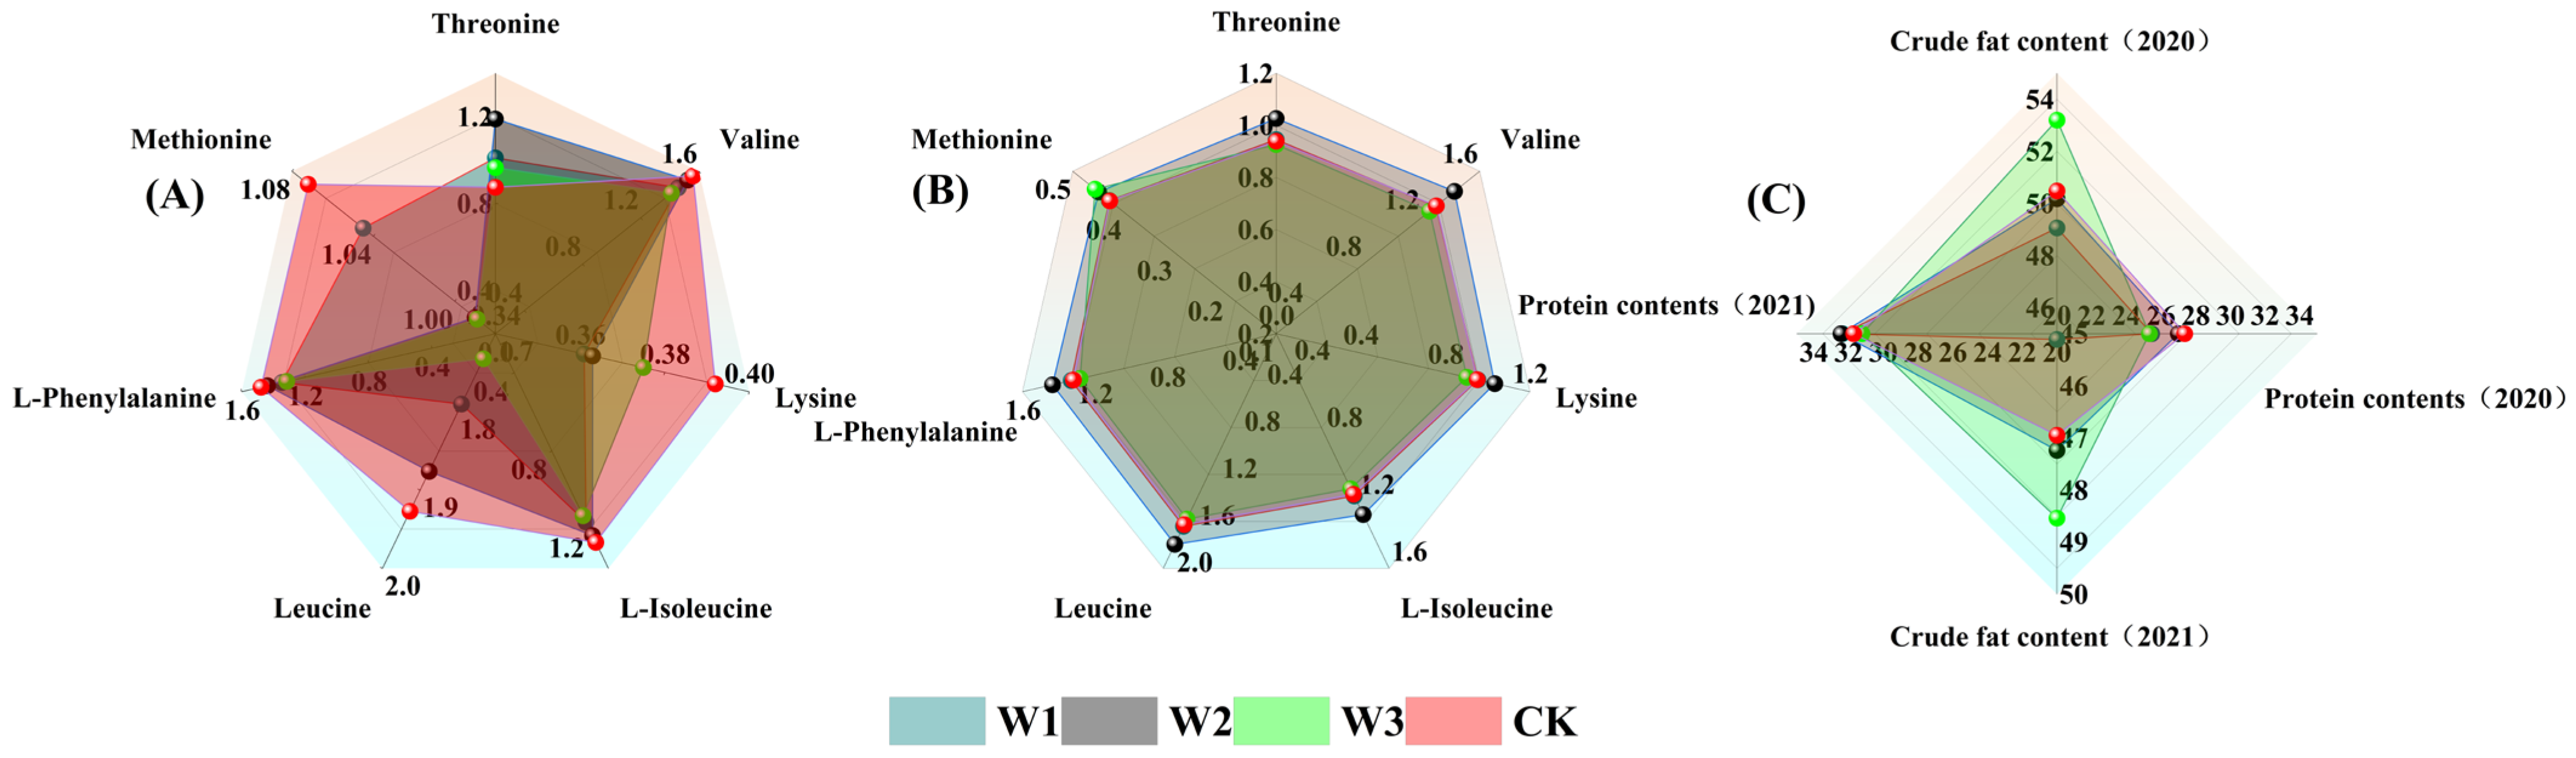
3.3.2. Quality in Sunflower

The protein, crude fat, and essential amino acid content of sunflower seeds in 2020 and 2021 are shown in Figure 7. The treatment with the highest protein content in 2020 was CK, but the difference between CK and W2 was not significant (p-value > 0.05), while the difference between CK and W1 and W2 was significant (p-value < 0.05). In 2021, the protein content of the W1 and W2 treatments was higher than that of W3 and CK. The treatment with the highest crude fat content amongst the treatments was W3, although this was only significantly higher than W1 and not significantly different from the W2 and CK treatments. The treatment with the highest sum of essential amino acids was W2, and crude fat content increased by 4.4%, 6.9%, and 4% in 2020 and 6.8%, 9.2%, and 7.2% in 2021 compared with W1, W3, and CK, respectively. The crude fat content of all treatments under subsurface drainage conditions was W3 > W2 > W1, and W2 was the most favorable for protein synthesis amongst all treatments. This indicates that the higher water volume under subsurface drainage conditions was detrimental to the synthesis of crude fat, while normal- and medium-water conditions under subsurface drainage conditions were most favorable for protein synthesis. Low-water conditions affect protein synthesis, and medium-water conditions are most favorable for the synthesis of essential amino acids.

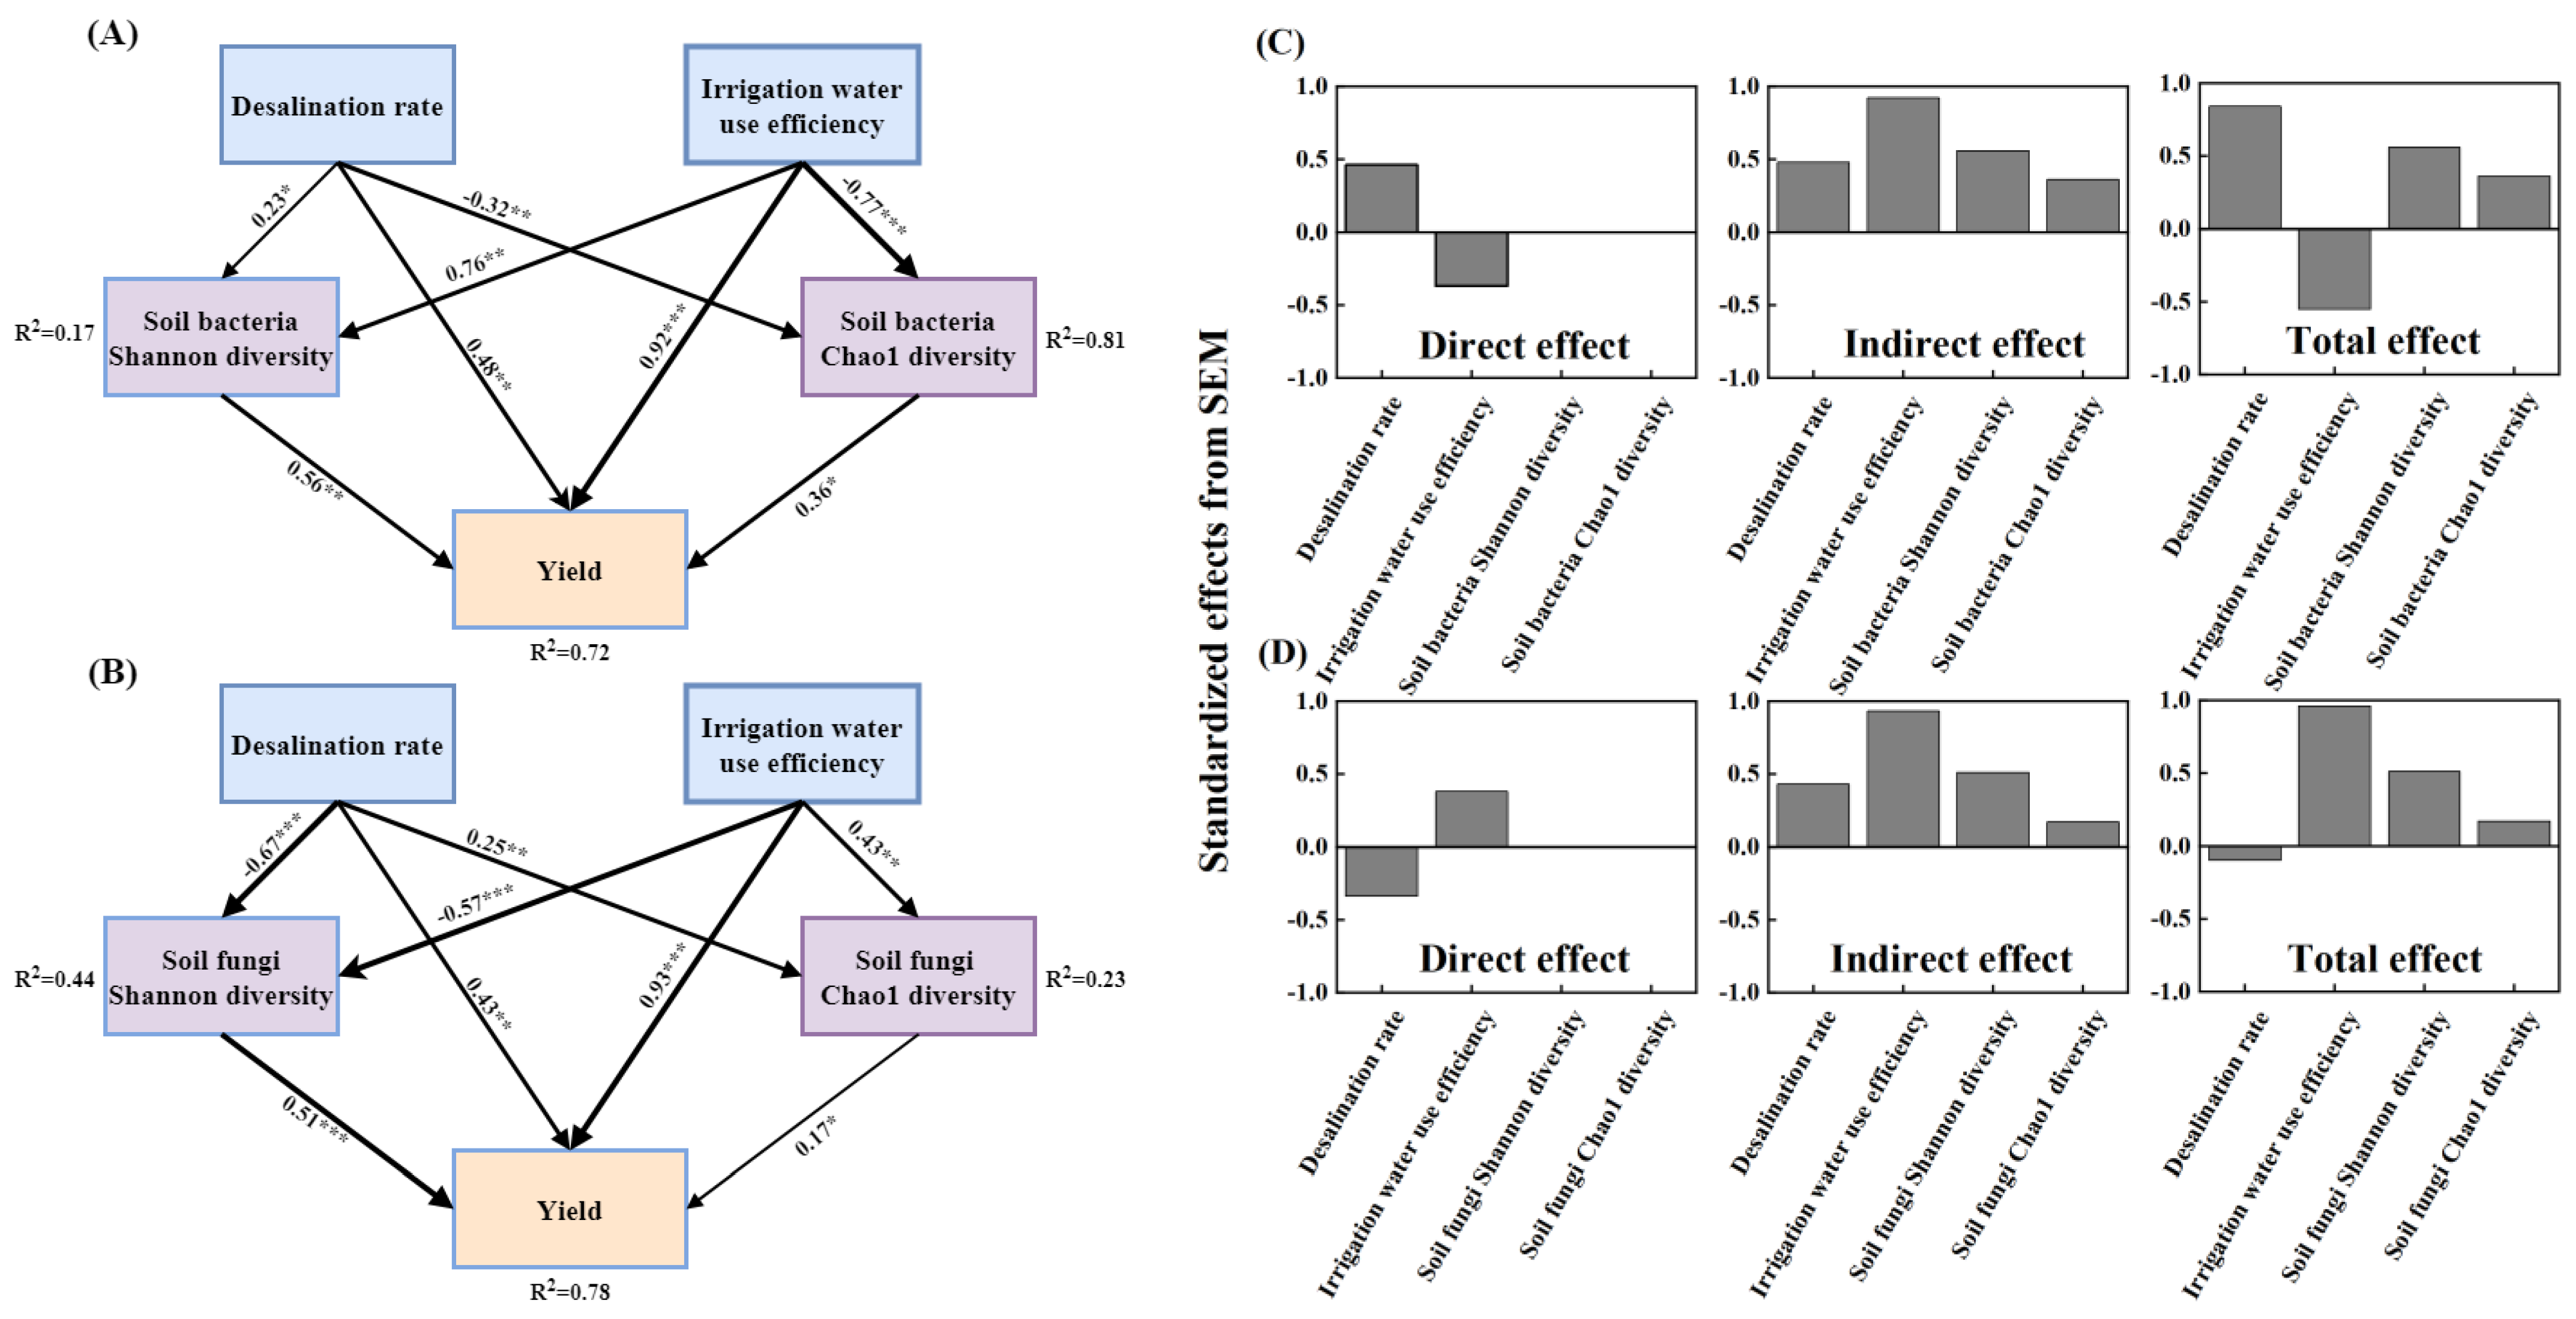
3.3.3. Correlation Analysis between Soil Microenvironment and Sunflower Yield

Water regulation under subsurface drainage had a significant effect on the soil microenvironment of the sunflower root zone. Improving the soil microenvironment is an important measure to promote crop growth and enhance crop yield and quality [19]. To investigate the relationship between the soil microenvironment and sunflower yield, soil microbial diversity, desalinization rate, irrigation water use efficiency, and sunflower yield were correlated using structural equation modeling. As can be seen from Figure 8, the desalinization rate was highly significantly and positively correlated with yield (p-value < 0.01) and significantly and positively correlated with Chao1 richness (p-value < 0.05). The irrigation water use efficiency was highly significantly and positively correlated with yield (p-value < 0.01). Bacterial Chao1 abundance and fungal Chao1 abundance were significantly and positively correlated with yield (p-value < 0.05), and bacterial Shannon diversity and fungal Shannon diversity were highly significantly and positively correlated with yield (p-value < 0.01). These results indicate that desalinization rate, irrigation water utilization efficiency, bacterial Chao1 abundance and Shannon diversity, and fungal Chao1 abundance and Shannon diversity were the main factors influencing sunflower yield.

3.4. Comprehensive Evaluation of Improvement Effect of Subsurface Drainage Farmland Based on Entropy Weight TOPSIS

In order to realize the comprehensive improvement effect of subsurface farmland, the soil desalinization rate was selected as the evaluation index of the desalinization effect. The soil microbial diversity and richness index and the number of dominant bacterial groups were selected as the evaluation index of ecological effect, and the biased productivity of nitrogen fertilizer and utilization efficiency of irrigation water were selected as the evaluation index of the effect of water conservation and nitrogen reduction. Sunflower yield, seed weight per disk, fruiting rate, 100-grain weight, crude fat, protein, and essential amino acid content were selected as indicators for evaluating the effect of high-quality yield enhancement. The entropy weighting method TOPSIS model was used to evaluate the above 15 indices comprehensively and determine the irrigation treatment with the best comprehensive improvement effect in the subsurface drainage farmland. In this paper, the TOPSIS model was combined with the entropy weight method for evaluating the comprehensive effect of the improvement in subsurface drainage farmland. The specific steps were as follows:
(1)
Build an original matrix of n indicators for m treatments, where rij is the jth indicator of the ith treatment (i = 1, 2, …, m; j = 1, 2, …, n).
    R = r i j m × n
(2)
Indicator normalization of the original matrix.
    Z i j = r i j i = 1 n r i j 2
(3)
Calculate the information entropy of the jth metric.
e j = i = 1 m p i j ln p i j ln m
where p i j represents Z i j / i = 1 m Z i j .
(4)
Calculate the weights of the indicators using the entropy weighting method.
    ω j = 1 e j n j = 1 n e j    
(5)
Determine positive and negative ideal solutions Z + and Z .
Z + = ( m a x { Z 11 , Z 21 , Z m 1 } , m a x { Z 12 , Z 22 , Z m 2 } , m a x { Z 1 n , Z 2 n , Z m n } ) = ( Z + 1 , Z + 2 , Z + n )
  Z = ( m i n { Z 11 , Z 21 , Z m 1 } , m i n { Z 12 , Z 22 , Z m 2 } , m i n { Z 1 n , Z 2 n , Z m n } ) = ( Z 1 , Z 2 , Z n )
(6)
Calculate the distance of each evaluation treatment indicator value from the positive and negative ideal solutions.
  D i + = j = 1 n ω j ( z j + z i j ) 2
D i = j = 1 n ω j ( z j z i j ) 2
(7)
Calculate the degree of closeness Ci.
C i = D i / ( D i + + D i )
where Ci is the closeness of each evaluation treatment to the optimal program 0 < Ci < 1; the closer the C value is to 1, the better the comprehensive evaluation is and the higher the comprehensive benefit.
The objective weights of the indicators obtained by the entropy weighting method are shown in Table 4.
The entropy weighting method and the TOPSIS model were applied to comprehensively evaluate the 15 indices of the three water control treatments under subsurface drainage, and the relative closeness C of each treatment was obtained (Table 5). The larger the relative closeness C value, the higher the comprehensive score of the treatment and the better the comprehensive effect. The ranking results of the C value of each treatment showed that W2 > W1 > W3, and W2 (210 mm of water volume) had the highest comprehensive score. This indicates that the irrigation volume of 210 mm under subsurface drainage conditions was the irrigation treatment with the best comprehensive effect, which achieved efficient water conservation and salt control, increased yield and quality, and improved the ecological environment of the irrigation area, which is conducive to the sustainable development of agriculture.

4. Discussion

4.1. Effect of Moisture Regulation on Desalinization Rate under Subsurface Drainage

The use of border irrigation and drenching together with subsurface drainage is an effective improvement method to solve the problem of soil salinization [20]. In the case of poor soil structure, subsurface drainage can deepen the desalinization layer, change the physical properties of the soil, and change the morphological characteristics of the salinity profile of mildly and moderately salinized soil from surface aggregation to desalinization [21]. It has been shown that the desalinization effect of subsurface drainage is better than that of no drainage [22], which is because the subsurface drainage accelerates the infiltration of soil water, and irrigation makes soil salts dissolve in the irrigation water, from where they migrate, with the water, to the subsurface drainage and are discharged out of the soil. We found that the average desalinization rate of the conventional irrigation treatment was greater than that of the medium-water treatment under the conditions provided by subsurface drainage, but the difference between the two treatments was not significant. Furthermore, the desalinization rate of the 0–20 cm soil layer in the W2 treatment was greater than that of the corresponding layer in the W1 treatment in both years, which indicated that, unexpectedly, a greater irrigation volume did not improve the desalinization effect of the soil under the conditions of subsurface drainage. Above a certain range, the increment in desalinization rate decreased because too much irrigation caused the soil water table to rise briefly, and the salts migrated upwards with the water to form secondary salinization. The W3 soil desalinization effect was the lowest, and, in 2021, there was an obvious salt accumulation phenomenon because the irrigation water volume was insufficient to wash salts from the soil surface to the deep soil, and so the salt remained in the tillage layer. Moreover, the treatment was no longer irrigated during the entire fertility period, which, coupled with the aridity, low rainfall, and strong evaporation in the river-loop irrigation area, led to the accumulation of soil salts on the surface layer during the fertility period and the formation of returning salts, making the phenomenon of salt accumulation more obvious.

4.2. Effect of Moisture Regulation on Microorganisms under Subsurface Drainage

Soil microbial diversity is an important indicator of soil ecological function [23], and the higher the diversity index of the soil microbial community, the better the stability of the soil ecological environment [24]. Previous studies have shown that subsurface drainage can significantly improve the desalinization effect of soil compared with no drainage. Therefore, to clarify the optimal amount of irrigation water under subsurface drainage conditions, it is necessary to further investigate the effect of water regulation on microbial diversity and community structure in such conditions. Water regulation under subsurface drainage affects microbial community structure and composition by altering soil physicochemical properties [25]. In this study, the relative abundance of Ascomycetes, Chlorobacterium, Acidobacterium, and Ascomycetes among soil bacteria and Ascomycetes and Tephritobacterium among fungi was increased by the treatment of water under the subsurface drainage. Methanobacteria are eutrophic anaerobic bacteria with nitrogen fixation, environmental adaptation, and disease resistance [26]. Chlorobacteria are autotrophic, beneficial anaerobic bacteria that can participate in soil lignin degradation [27]. Acidobacteria are suitable for living in acidic environments and can degrade plant residues [28]. Ascomycetes are mostly saprophytes, which are important decomposers in the soil and can degrade soil organic matter and promote nutrient cycling [29]. Fungi in the genus Aspergillus have a strong ability to decompose cellulose, which can promote the nutrient transformation cycle and maintain soil fertility [30]. In this study, we found that the treatment of water under subsurface drainage increased the relative abundance of dominant phyla such as Ascomycetes, Chlorobacterium, Acidobacterium, and Ascomycetes in the soil bacteria and Ascomycetes and Tephritobacterium in fungi, which indicated that the treatment increased the species and relative abundance of the beneficial bacterial flora in the soil, optimized the structure of the flora, and was more conducive to the promotion of stability in the soil ecological environment.

4.3. Effect of Water Regulation on Crop Yield Quality under Subsurface Drainage

Sunflower quality determines the edible value and economic benefits of the seeds [31], so the quality of sunflower kernels should be emphasized along with yield. The crude fat, protein, and amino acid contents are important indicators of sunflower quality. In this study, we found that the treatment with a water volume of 210 mm (W2) increased the content of several essential amino acids such as threonine, valine, isoleucine, leucine, phenylalanine, and lysine. It is worth noting that lysine has the effect of improving the utilization rate of proteins, balancing nutrition, and enhancing immune system function [32]. This indicates that the ratio and structure of essential amino acids in W2 meet the human body’s demand for amino acids and have the highest nutritional value. The present study showed that a higher irrigation volume under subsurface drainage helped to increase crop yield, 100-grain weight, seed weight per panicle, and fruiting rate, and a decrease in irrigation volume led to a reduction in crop yield, which was in good agreement with the study of Zhang [33] but not in agreement with the results of Darabnoush Tehrani [34]. Although the observation could be due to the fact that the present study was carried out under subsurface drainage, which accelerated the infiltration of soil water and thus reduced the soil water content, it may also be due to differences in the results produced by different levels of deficits in the reproductive stages of sunflower. In the present study, the water treatment favored the synthesis of proteins and essential amino acids in sunflower kernels. Sah et al. [35] also showed that a sufficient water deficit could accelerate the transportation of substances stored in nutrient organs to the kernels, thus increasing the nutrient content of the kernels. Moreover, an appropriate water deficit can encourage the plant root system to grow deeper, which, after rewatering, can then absorb more soil water and nutrients, thus increasing nutrient accumulation in the seed kernels [36]. It has been shown that subsurface drainage can ensure that nitrogen is not lost in large quantities [37], but it also helps in the dissolution of fertilizer into available nitrogen in the soil, where it can be absorbed and utilized by the crop more easily, thus promoting the synthesis of amino acids and proteins [38]. At the same time, subsurface drainage can improve soil aeration [39], reduce soil salinity [40], and provide suitable hydrothermal and nutrient environments for crop growth [41]; a water deficit can also significantly increase soil microbial diversity and the relative abundance of dominant flora [42].
In this study, we found that bacterial Chao1 abundance and Shannon diversity and fungal Shannon diversity and Chao1 abundance were the main factors influencing sunflower yield. This was because more nutrients were obtained from the degradation of organic matter by soil flora, resulting in higher soil fertility; thus, improved soil ecology was favorable to crop yield and quality. In this study, based on the entropy weighting method TOPSIS model, 15 indices, including soil desalinization rate, soil microbial diversity, water and nitrogen utilization rate, and sunflower yield and quality, were comprehensively evaluated under different water treatments within a subsurface drainage system, and we demonstrated that an irrigation water volume of 210 mm (W2) under subsurface drainage had the highest comprehensive score, making it the most effective and appropriate irrigation water volume. This shows that an irrigation volume of 210 mm under the conditions of subsurface drainage can realize the comprehensive improvement effect of efficient water conservation and salt control, higher yielding and better quality crops, and an improved ecological environment of the irrigation area.

5. Conclusions

Subsurface drainage could significantly improve soil desalinization, and the desalinization rate of subsurface drainage was increased by 13.54% compared with the undrained treatment for the same amount of irrigation water. The conventional irrigation treatment under subsurface drainage showed the best desalinization effect; the desalinization rate of the conventional irrigation treatment was increased by 11.45%, 13.54%, and 12.79%, respectively, compared with the other three treatments. Under subsurface drainage, the medium-water treatment increased the diversity of soil microorganisms and the relative abundance of dominant phyla such as Ascomycetes, Chlorobacteria, Acidobacteria, Ascomycetes, and Tephritobacteria. The low-water treatment increased the relative abundance of Actinobacteria in the soil.
For the same amount of irrigation water, compared with the undrained treatment, subsurface drainage increased sunflower 100-grain weight, seed weight per tray, and fruiting rate by 19.95%, 22.33%, and 8.63%, respectively, and also increased irrigation water productivity and fertilizer partial productivity. A higher irrigation volume under subsurface drainage helped increase sunflower yield, 100-grain weight, seed weight per tray, and fruiting rate. Based on the TOPSIS model of the entropy weight method, the comprehensive evaluation of 15 indicators in the subsurface farmland determined that the comprehensive score of the reclaimed water treatment under the subsurface drainage (with an irrigation amount of 210 mm) was the highest. This treatment not only realized efficient water saving and salt control but also improved the ecological environment of the farmland in the irrigation area, which was conducive to the sustainable development of agriculture and was the irrigation water treatment with the best comprehensive improvement effect.

Author Contributions

Conceptualization, W.L.; Methodology, W.L.; Validation, W.L.; Formal analysis, J.Z., L.F. and S.Z.; Investigation, J.Z., S.Z., W.L., L.F., Z.C. and Z.L.; Software, L.F., Z.C. and Z.L.; Validation, Z.C. and Z.L.; Resources, W.L.; Data curation, W.L.; Writing—original draft, J.Z.; Writing—review and editing, J.Z., W.L. and S.Z.; Visualization, J.Z., W.L. and Q.M.; Supervision, W.L. and Q.M.; Project administration, W.L. All authors have read and agreed to the published version of the manuscript.

Funding

This study was supported by a project of the National Nature Fund (52069022); the Project of Science and Technology of Inner Mongolia Province (2023QN05041) and the Basic Research Projects of Colleges and Universities directly under the Inner Mongolia Autonomous Region (BR220141); and the Interdisciplinary Research Fund of Inner Mongolia Agricultural University (BR231504).

Data Availability Statement

No new data were created or analyzed in this study. Data sharing is not applicable to this article.

Conflicts of Interest

The authors declare no conflicts of interest.

References

  1. Liu, H.; Wang, X.; Zhang, X.; Zhang, L.; Li, Y.; Huang, G. Evaluation on the responses of maize (Zea mays L.) growth, yield and water use efficiency to drip irrigation water under mulch condition in the Hetao irrigation District of China. Agric. Water Manag. 2017, 179, 144–157. [Google Scholar] [CrossRef]
  2. Zhang, J.; Xiao, H. Past, Current and Future Prospect for Research on Agricultural Water Use in Irrigation Districts in the Yellow River Basin. J. Irrig. Drain. 2020, 39, 9–17. [Google Scholar] [CrossRef]
  3. Cao, Z.; Zhu, T.; Cai, X. Hydro-agro-economic optimization for irrigated farming in an arid region: The Hetao Irrigation District, Inner Mongolia. Agric. Water Manag. 2023, 277, 108095. [Google Scholar] [CrossRef]
  4. Wang, C.; Wu, J.; Zeng, W.; Zhu, Y.; Huang, J. Five-Year Experimental Study on Effectiveness and Sustainability of a Dry Drainage System for Controlling Soil Salinity. Water 2019, 11, 111. [Google Scholar] [CrossRef]
  5. Feng, L.; Li, W.; Shi, Q.; Zhao, S.; Hao, Y.; Liu, H.; Shi, H. Effects of Irrigation and Nitrogen Application Rates on Protein and Amino Acid Content of Sunflower Seed Kernels. Water 2021, 13, 78. [Google Scholar] [CrossRef]
  6. Cao, J.; Liu, C.; Zhang, W.; Guo, Y. Effect of integrating straw into agricultural soils on soil infiltration and evaporation. Water Sci. Technol. 2012, 65, 2213–2218. [Google Scholar] [CrossRef]
  7. Sembiring, H.; Raun, W.; Johnson, G.; Boman, R. Effect of wheat straw inversion on soil water conservation. Soil Sci. 1995, 159, 81–89. [Google Scholar] [CrossRef]
  8. Haj-Amor, Z.; Bouri, S. Subsurface drainage system performance, soil salinization risk, and shallow groundwater dynamic under irrigation practice in an arid land. Arab. J. Sci. Eng. 2019, 44, 467–477. [Google Scholar] [CrossRef]
  9. Jafari-Talukolaee, M.; Shahnazari, A.; Ahmadi, M.Z.; Darzi-Naftchali, A. Drain discharge and salt load in response to subsurface drain depth and spacing in paddy fields. J. Irrig. Drain. Eng. 2015, 141, 04015017. [Google Scholar] [CrossRef]
  10. Xu, X.; Huang, G.; Qu, Z.; Pereira, L.S. Assessing the groundwater dynamics and impacts of water saving in the Hetao Irrigation District, Yellow River basin. Agric. Water Manag. 2010, 98, 301–313. [Google Scholar] [CrossRef]
  11. Wang, X.; Zhang, H.; Zhang, Z.; Zhang, C.; Zhang, K.; Pang, H.; Bell, S.M.; Li, Y.; Chen, J. Reinforced soil salinization with distance along the river: A case study of the Yellow River Basin. Agric. Water Manag. 2023, 279, 108184. [Google Scholar] [CrossRef]
  12. Mao, W.; Yang, J.; Zhu, Y.; Ye, M.; Wu, J. Loosely coupled SaltMod for simulating groundwater and salt dynamics under well-canal conjunctive irrigation in semi-arid areas. Agric. Water Manag. 2017, 192, 209–220. [Google Scholar] [CrossRef]
  13. Ayars, J.E.; Christen, E.W.; Hornbuckle, J. Controlled drainage for improved water management in arid regions irrigated agriculture. Agric. Water Manag. 2006, 86, 128–139. [Google Scholar] [CrossRef]
  14. Hooper, D.U.; Bignell, D.E.; Brown, V.K.; Brussard, L.; Dangerfield, J.M.; Wall, D.H.; Wardle, D.A.; Coleman, D.C.; Giller, K.E.; Lavelle, P. Interactions between Aboveground and Belowground Biodiversity in Terrestrial Ecosystems: Patterns, Mechanisms, and Feedbacks: We assess the evidence for correlation between aboveground and belowground diversity and conclude that a variety of mechanisms could lead to positive, negative, or no relationship—Depending on the strength and type of interactions among species. Bioscience 2000, 50, 1049–1061. [Google Scholar]
  15. Xia, Q.; Rufty, T.; Shi, W. Soil microbial diversity and composition: Links to soil texture and associated properties. Soil Biol. Biochem. 2020, 149, 107953. [Google Scholar] [CrossRef]
  16. Jing, J.; Ming-Hua, S. Review of the roles of plants and soil microorganisms in regulating ecosystem nutrient cycling. Chin. J. Plant Ecol. 2010, 34, 979. [Google Scholar]
  17. Bach, E.M.; Baer, S.G.; Meyer, C.K.; Six, J. Soil texture affects soil microbial and structural recovery during grassland restoration. Soil Biol. Biochem. 2010, 42, 2182–2191. [Google Scholar] [CrossRef]
  18. Singh, J.S.; Pandey, V.C.; Singh, D.P. Efficient soil microorganisms: A new dimension for sustainable agriculture and environmental development. Agric. Ecosyst. Environ. 2011, 140, 339–353. [Google Scholar] [CrossRef]
  19. Liu, C.; Wang, J.; Huang, P.; Hu, C.; Gao, F.; Liu, Y.; Li, Z.; Cui, B. Response of Soil Microenvironment and Crop Growth to Cyclic Irrigation Using Reclaimed Water and Brackish Water. Plants 2023, 12, 2285. [Google Scholar] [CrossRef]
  20. Singh, A. Poor-drainage-induced salinization of agricultural lands: Management through structural measures. Land Use Policy 2019, 82, 457–463. [Google Scholar] [CrossRef]
  21. Heng, T.; He, X.-L.; Yang, L.-L.; Xu, X.; Feng, Y. Mechanism of Saline–Alkali land improvement using subsurface pipe and vertical well drainage measures and its response to agricultural soil ecosystem. Environ. Pollut. 2022, 293, 118583. [Google Scholar] [CrossRef]
  22. Zhao, L.; Heng, T.; Yang, L.; Xu, X.; Feng, Y. Study on the Farmland Improvement Effect of Drainage Measures under Film Mulch with Drip Irrigation in Saline–Alkali Land in Arid Areas. Sustainability 2021, 13, 4159. [Google Scholar] [CrossRef]
  23. Kirk, J.L.; Beaudette, L.A.; Hart, M.; Moutoglis, P.; Klironomos, J.N.; Lee, H.; Trevors, J.T. Methods of studying soil microbial diversity. J. Microbiol. Methods 2004, 58, 169–188. [Google Scholar] [CrossRef]
  24. Venter, Z.S.; Jacobs, K.; Hawkins, H.-J. The impact of crop rotation on soil microbial diversity: A meta-analysis. Pedobiologia 2016, 59, 215–223. [Google Scholar] [CrossRef]
  25. Kimura, M.; Asakawa, S. Comparison of community structures of microbiota at main habitats in rice field ecosystems based on phospholipid fatty acid analysis. Biol. Fertil. Soils 2006, 43, 20–29. [Google Scholar] [CrossRef]
  26. Schoch, C.L.; Sung, G.-H.; López-Giráldez, F.; Townsend, J.P.; Miadlikowska, J.; Hofstetter, V.; Robbertse, B.; Matheny, P.B.; Kauff, F.; Wang, Z.; et al. The Ascomycota Tree of Life: A Phylum-wide Phylogeny Clarifies the Origin and Evolution of Fundamental Reproductive and Ecological Traits. Syst. Biol. 2009, 58, 224–239. [Google Scholar] [CrossRef]
  27. Zhao, L.; Xue, N.; Lu, Z.; Xue, L. Pyrrhotite-Based Constructed Wetland–Microbial Fuel Cell: Reactive Brilliant Red X-3B Removal Performance and Microbial Communities. J. Environ. Eng. 2023, 149, 04022086. [Google Scholar] [CrossRef]
  28. Eichorst Stephanie, A.; Trojan, D.; Huntemann, M.; Clum, A.; Pillay, M.; Palaniappan, K.; Varghese, N.; Mikhailova, N.; Stamatis, D.; Reddy, T.B.K.; et al. One Complete and Seven Draft Genome Sequences of Subdivision 1 and 3 Acidobacteria Isolated from Soil. Microbiol. Resour. Announc. 2020, 9. [Google Scholar] [CrossRef]
  29. Wilson, A.M.; Wilken, P.M.; van der Nest, M.A.; Wingfield, M.J.; Wingfield, B.D. It’s All in the Genes: The Regulatory Pathways of Sexual Reproduction in Filamentous Ascomycetes. Genes 2019, 10, 330. [Google Scholar] [CrossRef] [PubMed]
  30. Kruczyńska, A.; Kuźniar, A.; Banach, A.; Jurczyk, S.; Podlewski, J.; Słomczewski, A.; Marzec-Grządziel, A.; Sochaczewska, A.; Gałązka, A.; Wolińska, A. Changes in the mycobiome structure in response to reduced nitrogen fertilization in two cropping systems of maize. Sci. Total Environ. 2023, 904, 166343. [Google Scholar] [CrossRef] [PubMed]
  31. Muhammad Anjum, F.; Nadeem, M.; Issa Khan, M.; Hussain, S. Nutritional and therapeutic potential of sunflower seeds: A review. Br. Food J. 2012, 114, 544–552. [Google Scholar] [CrossRef]
  32. Suzuki, T.; Miyata, N. Lysine Demethylases Inhibitors. J. Med. Chem. 2011, 54, 8236–8250. [Google Scholar] [CrossRef] [PubMed]
  33. Zhang, S.; Tan, Q.; Zhao, H.; Zhang, T. Drainage and Total Nitrogen Loss of Cropland under Drip Irrigation and Subsurface Pipe Drainage. IOP Conf. Ser. Mater. Sci. Eng. 2020, 730, 012064. [Google Scholar] [CrossRef]
  34. Darabnoush Tehrani, A.; Kohankar Kouchesfehani, Z.; Najafi, M. Review and recommendations for structural testing of buried gravity storm drain pipes and culverts. Can. J. Civ. Eng. 2020, 48, 173–186. [Google Scholar] [CrossRef]
  35. Sah, R.P.; Chakraborty, M.; Prasad, K.; Pandit, M.; Tudu, V.K.; Chakravarty, M.K.; Narayan, S.C.; Rana, M.; Moharana, D. Impact of water deficit stress in maize: Phenology and yield components. Sci. Rep. 2020, 10, 2944. [Google Scholar] [CrossRef]
  36. Patanè, C.; Cosentino, S.L. Effects of soil water deficit on yield and quality of processing tomato under a Mediterranean climate. Agric. Water Manag. 2010, 97, 131–138. [Google Scholar] [CrossRef]
  37. Yu, Y.; Xu, J.; Zhang, P.; Meng, Y.; Xiong, Y. Controlled Irrigation and Drainage Reduce Rainfall Runoff and Nitrogen Loss in Paddy Fields. Int. J. Environ. Res. Public Health 2021, 18, 3348. [Google Scholar] [CrossRef]
  38. Rothstein, D.E. Effects of amino-acid chemistry and soil properties on the behavior of free amino acids in acidic forest soils. Soil Biol. Biochem. 2010, 42, 1743–1750. [Google Scholar] [CrossRef]
  39. Wang, D.; Wang, Z.; Zhang, J.; Zhou, B.; Lv, T.; Li, W. Effects of Soil Texture on Soil Leaching and Cotton (Gossypium hirsutum L.) Growth under Combined Irrigation and Drainage. Water 2021, 13, 3614. [Google Scholar] [CrossRef]
  40. Ritzema, H.P.; Satyanarayana, T.V.; Raman, S.; Boonstra, J. Subsurface drainage to combat waterlogging and salinity in irrigated lands in India: Lessons learned in farmers’ fields. Agric. Water Manag. 2008, 95, 179–189. [Google Scholar] [CrossRef]
  41. Zhang, J.; Huang, J.; Qian, R.; Zhang, Q.; Gao, J. Lowland artificial watersheds with unique nutrient transport: Response to natural and anthropogenic drivers. J. Hydrol. 2023, 622, 129635. [Google Scholar] [CrossRef]
  42. Siebielec, S.; Siebielec, G.; Klimkowicz-Pawlas, A.; Gałązka, A.; Grządziel, J.; Stuczyński, T. Impact of Water Stress on Microbial Community and Activity in Sandy and Loamy Soils. Agronomy 2020, 10, 1429. [Google Scholar] [CrossRef]
Figure 1. Location of the study area and distribution of sampling points.
Agronomy 14 00282 g001
Figure 2. Rainfall and potential evapotranspiration (ET0) during the fertility period of sunflowers from May through September 2020 and May through September 2021. (a) shows the relationship between precipitation and potential evapotranspiration evapotranspiration (ET0) during the reproductive period of sunflower in 2020. (b) shows the relationship between precipitation and potential evapotranspiration (ET0) during the reproductive period of sunflower in 2021.
Agronomy 14 00282 g002
Figure 3. Variation in characteristics of soil salinity in 2020 and 2021.
Agronomy 14 00282 g003
Figure 4. Desalting effect of 0–40 cm soil treated in 2020 and 2021 ((A): desalinization rate of 0–20 cm soil in each treatment in 2020; (B): desalinization rate of 20–40 cm soil in each treatment in 2020; (C): desalinization rate of 0–20 cm soil in each treatment in 2021; (D): desalinization rate of 20–40 cm soil in each treatment in 2021). Lowercase letters (a–d) in the figure indicate the significance present among the four treatments.
Agronomy 14 00282 g004
Figure 5. Relative abundance of soil bacteria and fungi at phylum level in 2020 and 2021 ((A): bacterial community structure in 2020; (B): bacterial community structure in 2021; (C): fungal community structure in 2020; (D): fungal community structure in 2021).
Agronomy 14 00282 g005
Figure 6. Effects of different treatments on yield and water and nitrogen use efficiency of sunflowers in 2020 and 2021. (A): Relationship between Hundred grains weight and yield in 2020 and 2021. (B): Relationship between sunflower seed weight per tray and sunflower fruiting rate in 2020 and 2021. (C): Relationship between irrigation water productivity and nitrogen fertilizer bias productivity, 2020 and 2021. Lowercase letters (a–c) in the figure indicate the significance present among the four treatments.
Agronomy 14 00282 g006
Figure 7. Effects of different treatments on sunflower protein, crude fat, and essential amino acid synthesis in 2020 and 2021. (A): Essential amino acid content of each treatment in 2020. (B): Content of essential amino acids by treatment in 2021. (C): Protein and crude fat content of sunflower by treatment in 2020 and 2021.
Agronomy 14 00282 g007
Figure 8. The relationships between soil microenvironment and sunflower yield, soil microbial diversity, desalinization rate, irrigation water use efficiency, and sunflower yield were correlated using structural equation modeling. (A): Modeling of bacterial diversity and sunflower using structural equation modeling. (B): Modeling of fungal diversity with sunflowers using structural equation modeling. (C): Direct, indirect, and total impact on yield for each pathway in (A). (D): Direct, indirect, and total impact of each pathway on yield in (B). * denotes significance p < 0.05, ** denotes significance p < 0.01, *** denotes significance p < 0.001.
Agronomy 14 00282 g008
Table 1. Soil physical properties in the experimental area.
Soil Layer (cm)Soil
Density
(g cm−3)
Hydrolytic
Nitrogen
(mg kg−1)
Quick-Acting Phosphorus
(mg kg−1)
Quick-Acting Potassium
(mg kg−1)
Organic Matter
(g kg−1)
Total Salt Content
(g kg−1)
Subsurface drainage area0–202.6353.2710.29155.210.196.59
20–402.6531.652.6980.315.185.46
Drainage-free area0–202.6448.4413.45111.869.586.57
20–402.6840.993.1466.285.045.64
Table 2. Test design table.
Drainage ConditionsTreatmentIrrigation Quota Number of Irrigation TimesIrrigation Norm
(mm)
Base
Fertilizer
(kg hm−2)
Topdressing
(kg hm−2)
Spring IrrigationBud Stage
(mm)
Subsurface drainageW124090233067.5210
W212090221067.5210
W31200112067.5210
Drainage-freeCK24090233067.5210
Table 3. Bacterial and fungal diversity and richness indices of soil under each water treatment in 2020–2021. Lowercase letters (a–c) in the table indicate the significance present among the four treatments.
TreatmentIndexChao1 IndexShannon Index
Soil Layer/cm2020202120202021
0–2020–400–2020–400–2020–400–2020–40
W1Bacterial4667.25 ab4660.12 a4095.49 b5131.44 b10.34 a10.64 a10.76 a10.73 a
W24897.46 a5113.60 a4629.27 a5508.17 a10.41 a10.68 a10.82 a11.03 a
W34554.65 b4016.74 b4254.97 b4721.30 c10.06 a10.56 a10.77 a10.56 a
W1Fungal428.15 a602.02 a191.45 a230.23 a2.61 c5.03 ab4.45 a4.78 a
W2448.52 a674.94 a207.94 a258.34 a5.78 a5.66 a4.91 a5.04 a
W3298.61 b435.02 b111.05 b162.03 b4.61 b4.78 b2.61 b4.08 b
Table 4. Summary of weight results calculated using entropy method.
TargetsInformation Entropy (e)Information Utility Value (d)Weights (%)
Yield0.5470.4536.495
Essential amino acids0.5160.4846.942
Protein0.560.446.302
Seed weight per tray0.6150.3855.518
100-grain weight0.6270.3735.344
Fruiting rate0.6070.3935.629
Besalinization rate0.630.3705.310
Fertilizer partial productivity0.5880.4125.910
Irrigation water productivity0.5440.4566.539
Number of predominant bacteria phyla0.5450.4556.526
Fungal abundance0.6030.3975.691
Fungal diversity0.3420.6589.434
Bacterial diversity0.6170.3835.488
Bacterial abundance0.2010.79911.452
Crude fat content0.4830.5177.418
Table 5. TOPSIS evaluation results for each water treatment in subsurface farmland.
Index ValuePositive Ideal Solution
Distance (D+)
Negative Ideal Solution
Distance (D)
Composite Score Index (C)Ranking Order
W20.33580.83050.71201
W10.67230.67970.50272
W30.89790.31450.25943
Disclaimer/Publisher’s Note: The statements, opinions and data contained in all publications are solely those of the individual author(s) and contributor(s) and not of MDPI and/or the editor(s). MDPI and/or the editor(s) disclaim responsibility for any injury to people or property resulting from any ideas, methods, instructions or products referred to in the content.

