1. Introduction
Crop residues represent an abundant and renewable biomass resource [
1], with their reintegration into agricultural land recognized as a promising nutrient recycling strategy [
2]. Subsurface irrigation with the stalk composite pipe technique (SSI) is a novel fusion of subterranean watering and crop residue return practices [
3]. Its principal component, the stalk composite pipe (SCP), is composed of a blend of soil, maize stalk fragments, and water [
4]. This facilitates irrigation while simultaneously decomposing to augment soil fertility. The decomposition pace of the stalk within the stalk composite pipe is pivotal to both the efficacy and durability of the system. Soil microbes are instrumental in the breakdown of crop residues. Studies have shown that increasing microbial activity and population can accelerate stalk decomposition [
5,
6]. For instance, research by Hiba Shaghaleh et al. [
7] highlighted the addition of the N fertilizer and microorganisms accelerated the straw decomposition. Similarly, Zhang et al. [
8]. reported a substantial link between the decomposition rate of crop residues and the prevalence of soil microbial communities. Consequently, the operational lifespan of the stalk composite pipe is closely interwoven with the vigor of soil microbial processes.
Nitrogen fertilization profoundly influences soil microbial ecosystems [
9]. It is a key agent in enhancing crop yields [
10] and is widely utilized in agricultural practices. Current cultivar development efforts focus on achieving high yields with substantial nitrogen inputs. Yet, this approach has led to several adverse ecological effects, such as the reduction of soil biodiversity and fertility [
11]. Distinct microbial community structures have been observed at varying levels of nitrogen supplementation [
12]. Studies by Li et al. [
13] demonstrated that nitrogen fertilizer applications could diminish the diversity of bacterial and fungal communities. Song et al. [
14] found that excessive nitrogen application rates, specifically beyond 16 g N m
−2 per year, sharply reduced soil bacterial and fungal diversity. Conversely, Wang et al. [
15] determined that soil microbial metabolic activity, as indicated by AWCD values, increased with nitrogen applications up to 250 kg/ha and peaked at this rate. However, beyond this point, nitrogen can suppress microbial metabolic functions. Stalk material, with its high carbon-to-nitrogen ratio, decomposes slowly in soil [
16]. Nitrogen application, therefore, plays a pivotal role in modulating soil microbial activity and, consequently, the decomposition of stalks [
17]. Liao et al. [
18] disclosed that nitrogen fertilization notably boosts the relative abundance of saprotrophic microbes, which include wood, plant, and dung decomposers. Li et al. [
19] suggested that optimal nitrogen levels can promote the proliferation of decomposition-facilitating microbes. However, an excess can stifle microbial activity and impede their decomposing efficacy. Integrating nitrogen fertilizers with stalk return can circumvent microbial nitrogen competition in soil. This approach fulfills the nitrogen demand of wheat in its early growth stages [
20].
Soil microbial functional diversity is a mirror of the ecological traits of microbial communities and stands as a crucial metric for gauging soil health and fertility [
21]. The Biolog Ecoplate™ is specially crafted for probing bacterial populations in environmental specimens [
22]. It is adept for conducting community-level physiological profiling (CLPP) of soil biota. CLPP is ascertained by sorting and delineating heterotrophic microbial communities through their unique carbon source utilization profiles [
23,
24]. Equipped with three sets of wells, each containing 31 critical carbon sources for CLPP [
25], the Biolog Ecoplate™ offers an expansive insight into six classifications of soil microbial functionalities. The underlying mechanism of this assay hinges on the microbial consumption of carbon substrates within the wells, which instigates a colorimetric shift from a colorless triphenyl tetrazolium chloride to a violet triphenyl formazan [
26], thereby signaling the metabolic activity within each well [
27]. The intensity of this color shift, quantified as the average well color development (AWCD) value, is gauged by absorbance readings post-incubation. This method is notably straightforward, bypassing the need for culturing isolates while maintaining the metabolic characteristics of the microbial communities intact [
28]. Thus, the adoption of the Biolog Ecoplate™ has surged as it provides a rapid, data-rich, and intuitive approach for evaluating the functional diversity of soil microbes [
29,
30].
While the majority of research on straw return has concentrated on the impact of various geographical locales and soil types [
26], as well as on the return of different crop residues [
27,
28] on soil microbial ecology and straw decay, the implications of diverse fertilization approaches and nitrogen levels on the composition of soil microbial communities and straw breakdown are less understood. In light of this, the current investigation utilized Biolog Ecoplate™ to scrutinize how dual fertilization methods and trio nitrogen dosing regimens influence the functionality of soil microbial communities and the decomposition of straw. The study was driven by three key aims: (1) to elucidate the influence of distinct nitrogen doses and fertilization techniques on the functionality of soil microbial communities within the context of SSI, (2) to decode the relationship between straw decay and the functional diversity indexes of soil microbial communities, and (3) to pinpoint fertilization practices that fine-tune stalk composite pipe decomposition and govern its service life. The findings are anticipated to lay a scientific groundwork for developing efficacious fertilization blueprints for SSI systems.
2. Materials and Methods
2.1. Study Site
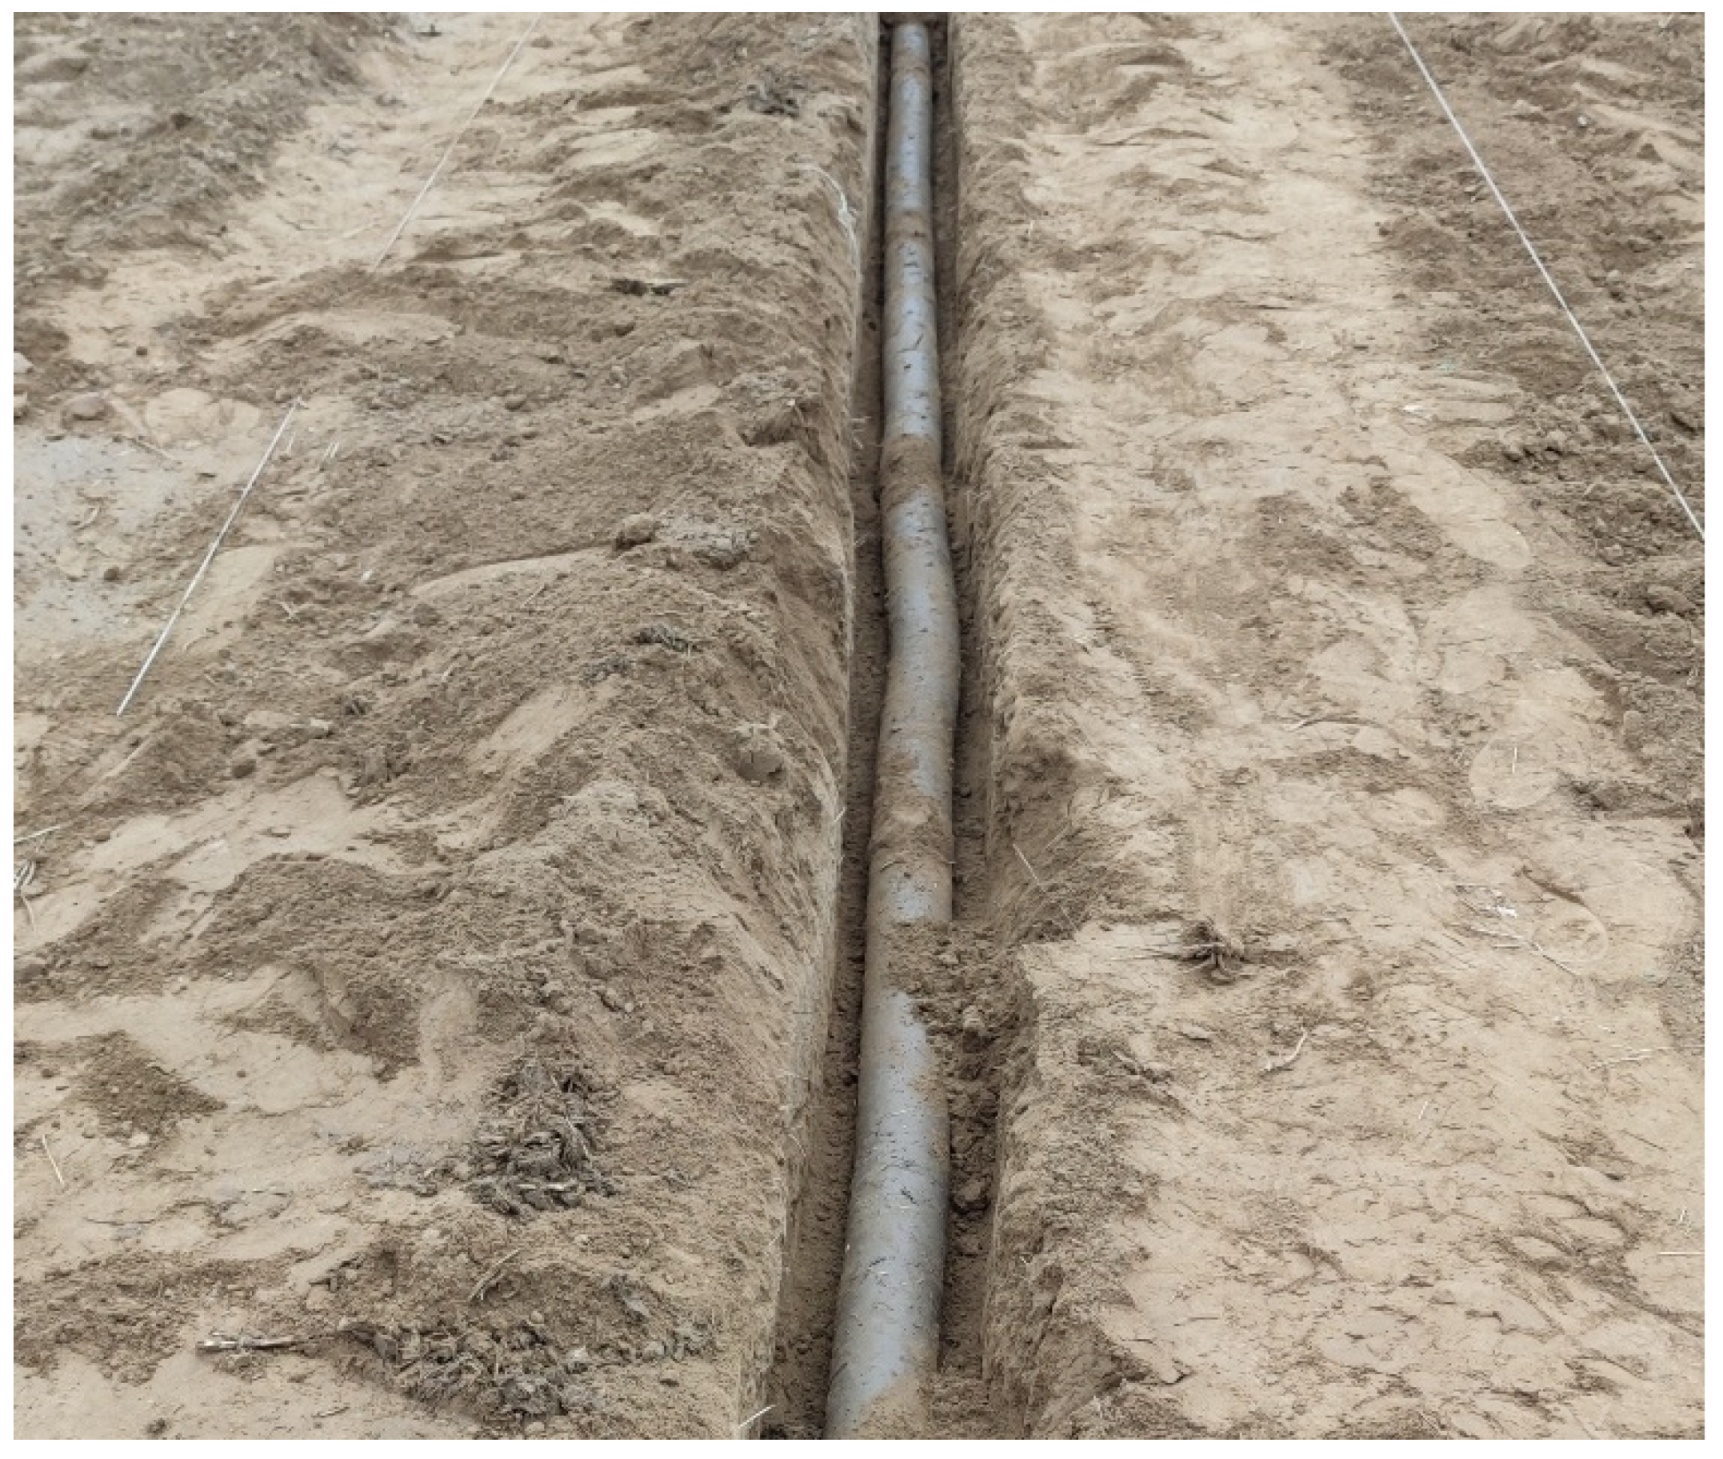
The study was carried out from November 2022 to May 2023 at the experimental field of the North China University of Water Resources and Electric Power in Zhengzhou, China (34.7666° N, 113.6712° E). The field is located in the North Temperate Zone, which is subject to a continental monsoon climate, distinctly partitioned into four seasons. The region receives an average annual rainfall of 637.1 mm. Characterized as sandy loam, the soil at the experimental site has a bulk density of 1.4 g/cm
3, an organic matter content of 5.45 g/kg, and a total nitrogen content of 0.33 g/kg, and it maintains a pH of 6.31. The cropping system in place is a rotation of wheat and corn. The stalk composite pipe, fabricated from the current year’s corn stover, displayed uniform initial crude fiber content. These stalk composite pipes, measuring 28 mm in internal diameter and 60 mm externally, were installed in trenches measuring 20 by 20 cm, which were then in-filled with soil to ground level as depicted in
Figure 1.
2.2. Experimental Treatments
The experimental design incorporated six distinct treatments, derived from a combination of two fertilization approaches and three levels of nitrogen application (referenced in
Table 1). The nitrogen was applied at 70% of three baseline amounts: 180, 240, and 300 kg/ha, respectively. The initial strategy involved fertilizing the winter wheat crop in a 7:3 ratio twice during its growth period. The chosen fertilizer was a blend of compound fertilizer and urea. Each plot received 135 kg/ha of P
2O
5 and 75 kg/ha of K
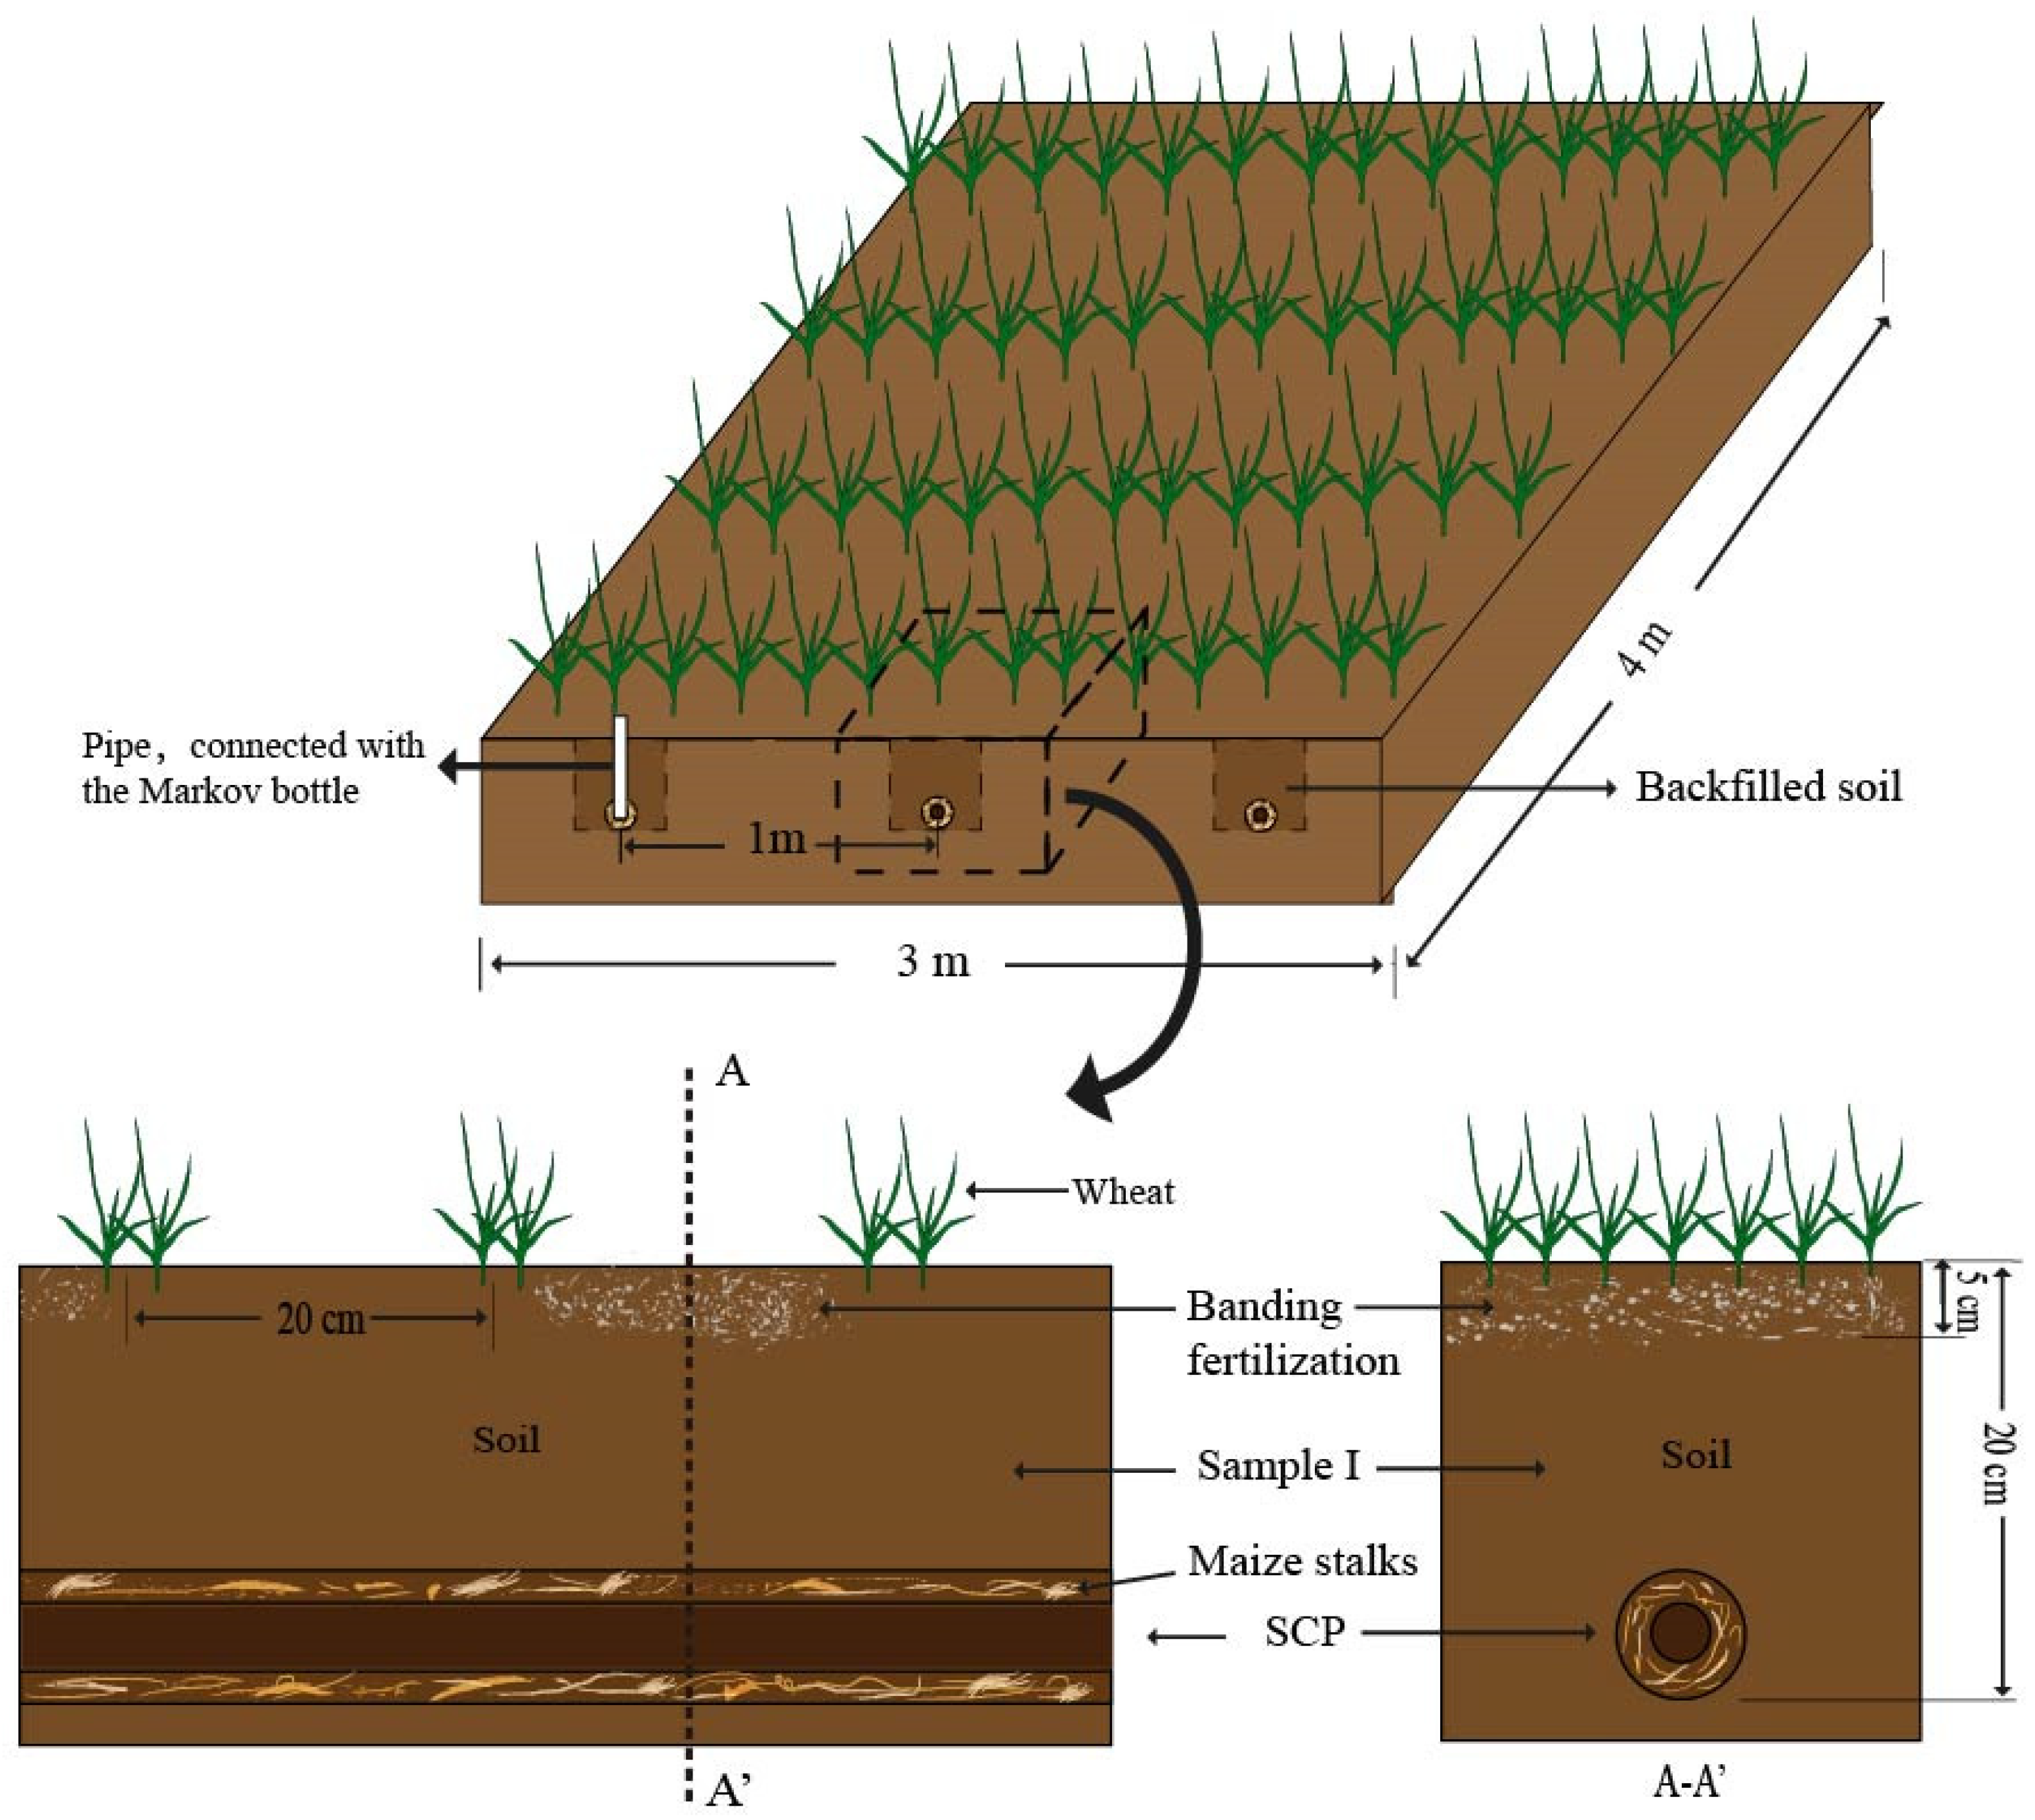
2O. For the banding fertilization method, fertilizers were incorporated into the soil parallel to the wheat rows. They were spaced 40 cm apart and at a depth of 5 cm, as illustrated in
Figure 2. Fertilization was conducted prior to irrigation. In the case of SCP fertigation, the fertilizer was dissolved in water and introduced into the stalk composite pipe using a Markov bottle. This method was utilized to irrigate the winter wheat throughout its growing season. Markov bottles, a tool for ensuring consistent irrigation, dispensed 60 mm of water per irrigation event. It is important to note that all the treatments were subjected to identical irrigation frequencies and volumes.
The experimental plots were designed with dimensions of 4.0 m in length and 3.0 m in width. Within each plot, three stalk composite pipes were installed as replicates. These stalk composite pipes were arranged 1.0 m apart from each other and buried at a depth of 0.2 m. The installation of the stalk composite pipes was completed on 7 November 2022. Subsequently, winter wheat of the variety Zhengmai 136 was sown on 9 November 2022. The seeding rate was 200 kg/ha with a row spacing of 20 cm. The orientation of the wheat seeds was perpendicular to the stalk composite pipe, ensuring optimal distribution relative to the irrigation system. The inaugural irrigation and fertilization session was conducted on 11 December 2022. It is noteworthy that for the SCP fertigation, the quantity of fertilizer introduced during this initial irrigation matched that of the banding fertilization. This standardization allowed for a fair comparison between the two fertilization strategies, ensuring that any observed differences in wheat growth or soil health could be attributed to the method of application rather than the amount of fertilizer used.
2.3. Sample Collection and Determination
Soil and straw samples were systematically collected from the experimental plots to assess the impact of different fertilization methods and nitrogen application rates on soil microbial activity and straw decomposition. On 15 December 2022, soil samples were gathered, followed by straw sampling on 1 March 2023. The sampling was executed in two distinct areas: (I) from the 20 cm subsoil layer within the plots, excluding the vicinity of the stalk composite pipes, and (II) directly from the walls of the stalk composite pipes. For the soil samples I, a mixed sampling technique was employed, utilizing the five-point method at a depth range of 0–20 cm. Given the uniformity of the stalk composite pipes within the plot, samples II and the straw residues were specifically collected from the stalk composite pipe’s end to facilitate destructive analysis, adhering to standard protocols for sample preparation and analysis.
The microbial consumption of carbon sources within the soil was evaluated using the Biolog Ecoplate™ (Biolog Inc., Hayward, CA, USA), in line with methodologies outlined by Garland and colleagues [
24], as well as by Zhang and team [
31]. A fresh soil sample equivalent to 10 g of dry soil was taken and placed into a sterile conical flask. Then, 90 mL of a sterilized 0.85% saline solution was added. The mixture was then agitated at 25 °C and 250 rpm for 30 min in a shaking incubator. Following a 30 min settlement period, the supernatant was diluted 1000-fold. Subsequently, 150 μL of this soil suspension was dispensed into each well of the Biolog Ecoplate™ and incubated at 25 °C over 7 days, with the absorbance at 590 nm (OD
590) recorded daily.
The decomposition rate of the stalk composite pipes was inferred from the crude fiber content in the straw samples, consisting of hemicellulose, cellulose, and lignin, with cellulose and hemicellulose being predominant in the residues post-decomposition. Crude fiber content was quantified using a JT-CXW-6 crude fiber tester. The straw samples underwent acid-alkali hydrolysis to determine the crude fiber content by the resultant weight change of the samples. This provided insights into the decomposition efficacy of stalk composite pipe within the tested fertilization and nitrogen application frameworks.
2.4. Statistical Analysis
The average well color development (AWCD) in the Biolog Ecoplate™ (Biolog Inc., Hayward, CA, USA) is a metric for evaluating the soil microbial community’s overall efficacy in carbon source utilization [
32]. A higher AWCD signifies enhanced microbial activity, greater population density [
8], and an increased capacity for stalk decomposition [
18]. This study delineates soil microbial diversity and functionality through the Shannon Index (
H′), Simpson Index (
D), Evenness Index (
E), and McIntosh Index (
U), calculated using OD
590 readings at 144 h (6 days). These indexes offer insights into the variety, dominance, uniformity, and ecological balance of microbial species and their roles in soil health.
Ci represents the OD
590 value of the
ith well, while
R represents the optical density value of the control.
ni is the OD
590 value for a specific substrate.
Pi is the ratio color development of the
ith well compared to the total color development of all the wells [
33]. If
Ci −
R ≤ 0,
p = 0. If
Ci −
R ≥ 0.25, it means that the pore carbon source is utilized, and
S represents the number of holes utilized.
The formula for calculating crude fiber content is as follows:
The mass of the sample is denoted by m. The weight of the crucible and sample residue after drying at 130 degrees Celsius for 2 h is denoted by m1, while m2 denotes the weight of the crucible and sample residue after drying at 500 degrees Celsius for 1 h.
The basic data in this study were organized in Microsoft Excel 2016. In addition, one-way ANOVA in SPSS 18.0, two-way ANOVA and principal component analysis, and the main graphing in this study used the Origin 2024. A two-way ANOVA analysis was used to evaluate the impact of the fertilization methods and nitrogen levels on the soil microbial functional diversity indexes and the utilization of six carbon groups. Additionally, principal component analysis was employed to examine the microbial utilization of 31 carbon sources.
3. Results
3.1. Soil Microbial Carbon Source Metabolic Activity
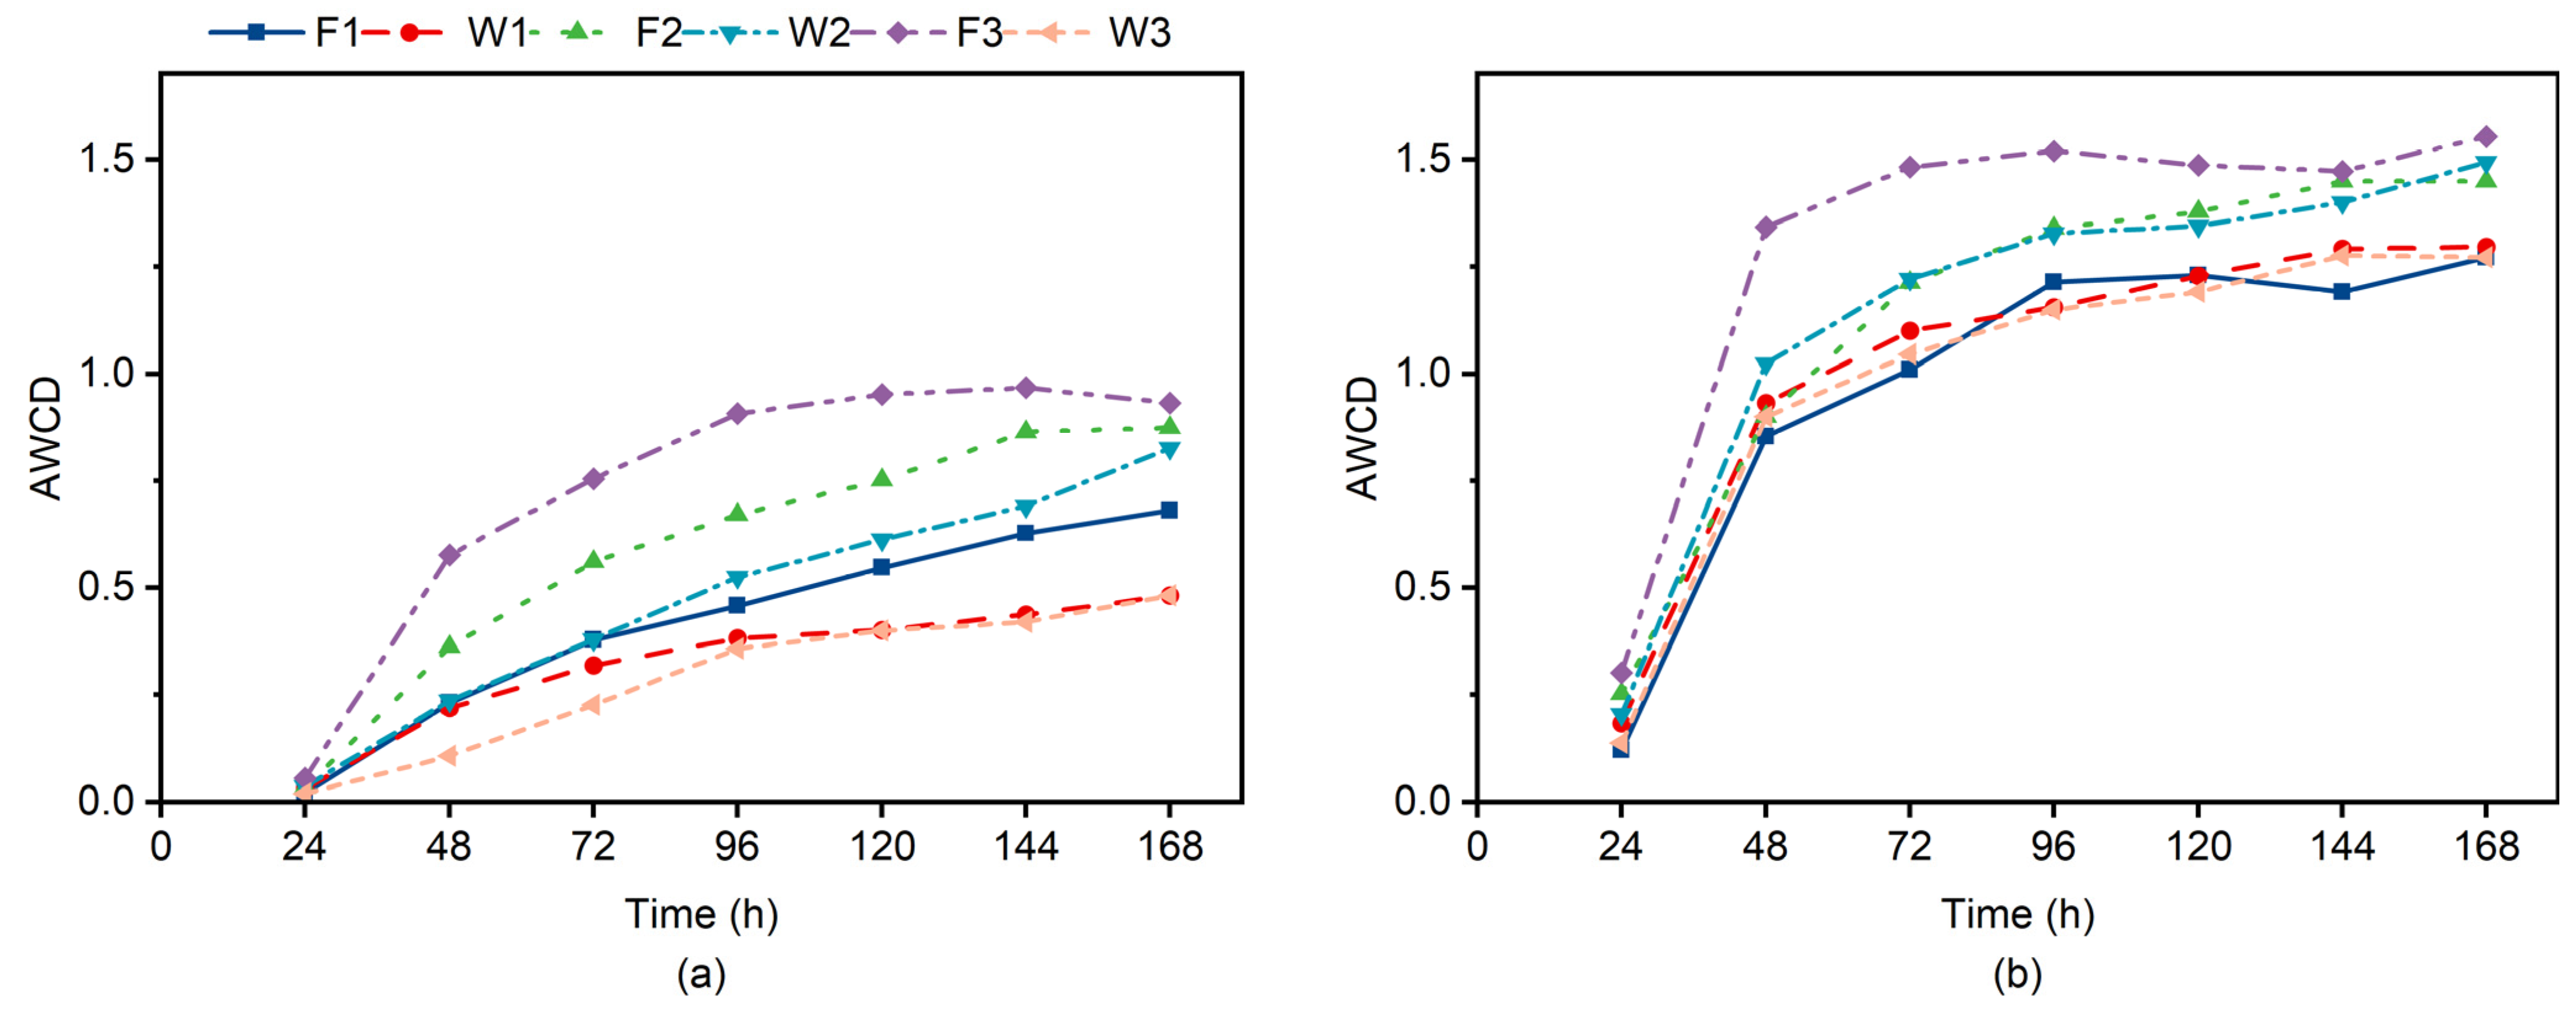
Figure 3 depicts the changes in AWCD values under different treatments. From
Figure 3, it can be observed that the AWCD values gradually increase over time. Between 24 and 72 h of incubation, there is a noticeable growth surge followed by a slowdown after 72 h. This growth pattern is consistent with what is typically observed in microbial cultivation. At 24–72 h, the growth rate of sample II exceeded that of sample I. This indicates that the AWCD values at the stalk composite pipe wall grew faster than those of the 20 cm subsoil layer. The AWCD values of sample II were all higher than those of sample I.
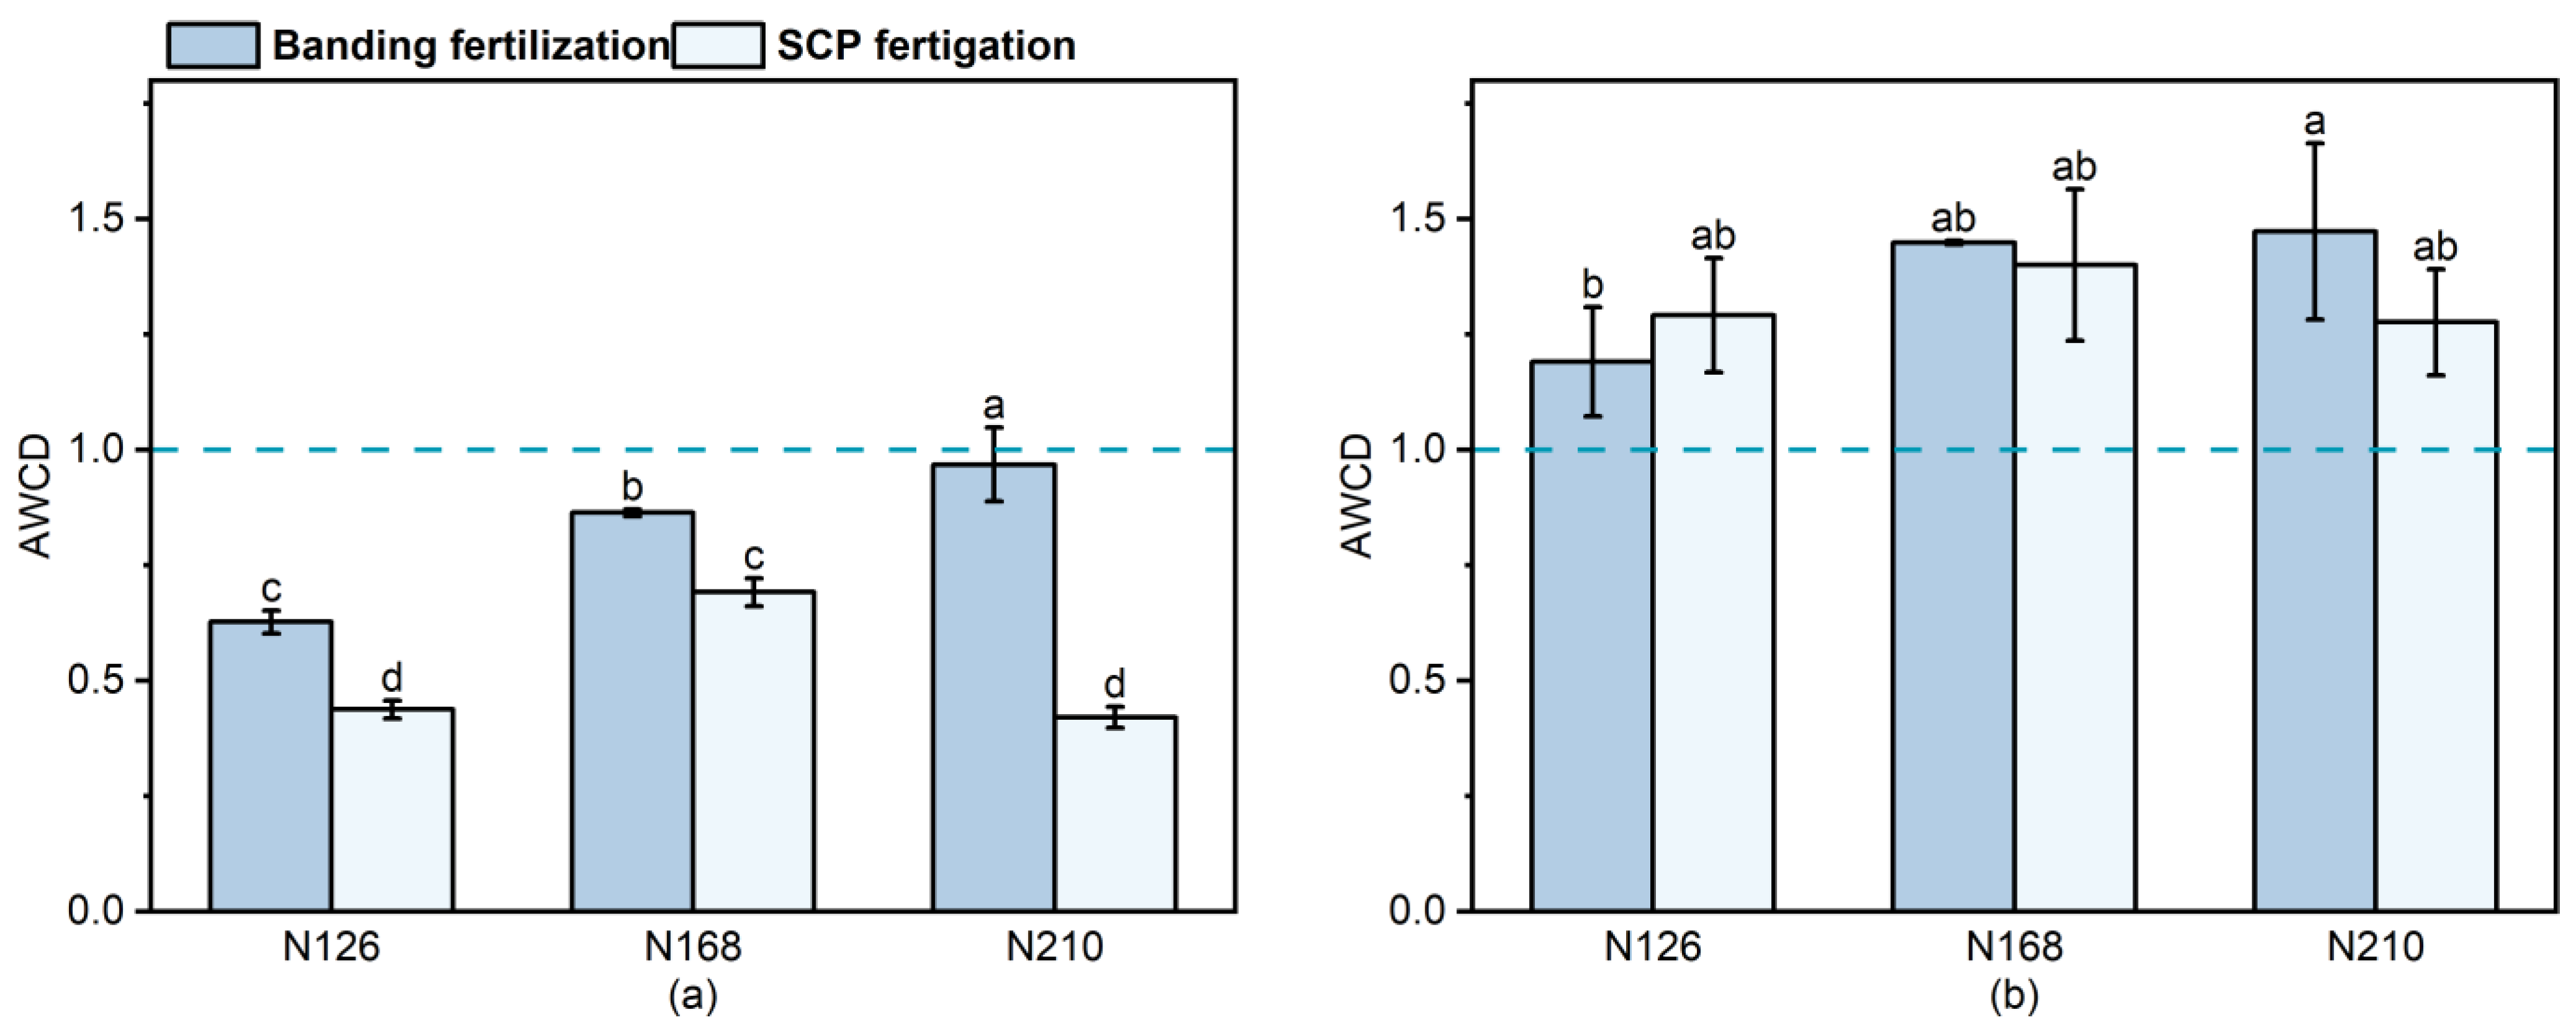
Figure 4 represents the AWCD values after 144 h of incubation under different treatments. Banding fertilization resulted in significant increases in F2 and F3 in both sample I (37.6% and 54.3%, respectively) and sample II (21.5% and 23.7%, respectively) compared to F1. The AWCD values gradually increased as the amount of fertilizer applied during banding fertilization increased, indicating the soil microbial activity. Applying SCP fertigation resulted in a 58% increase in W2 and a −3.9% decrease in W3 compared to W1 in sample I. In sample II, SCP fertigation led to an 8.4% increase in W2 and a −1.2% decrease in W3 compared to W1. When SCP fertigation was used, the AWCD value of sample I showed a trend of initially increasing and then decreasing with the increase in fertilizer. However, there was no significant difference between the various fertilizer application rates of sample II. The AWCD value of F3 for sample I was significantly higher than the other treatments (
p < 0.05). There was no significant difference (
p < 0.05) between the treatments for sample II, except for the F3 treatment, which had a significantly greater AWCD value than F1. The AWCD values of sample II consistently surpassed those of sample I. When the nitrogen application was the same, there was no significant difference between banding fertilization and SCP fertigation for Sample II.
3.2. Soil Microbial Community Diversity
Table 2 summarizes the impact of fertilization methods and nitrogen levels on the soil microbial functional diversity indexes. The method of fertilizer application significantly influenced the Evenness Index (
E) in sample I. The nitrogen application rate, the method of fertilizer application, and their interaction all significantly impacted the Shannon Index (
H′), Simpson Index (
D), and Evenness Index (
E). Conversely, only the interaction between nitrogen application and the fertilizer method notably affected the McIntosh Index (
U) in sample I (
p < 0.01).
Table 3 presents the diverse functional diversity indexes of soil microbial communities under different treatments. The
E index of sample I exhibited a significantly greater value with SCP fertigation compared to banding fertilization at the same N application rate, as indicated in
Table 3. Upon analyzing treatments using the same fertilization method but varying nitrogen application levels, the results are as follows. In banding fertilization, the
H′,
D, and
E index values demonstrated an increase with higher nitrogen application rates. For sample I, the
H′,
D, and
E index values of F2 and F3 were 4.7% to 6.8%, 1.5% to 1.9%, 0.9% to 2.0%, and 22.4% to 32% higher than those of F1. For sample II, F2 and F3 showed increases of 2.2% to 2.8%, 0.45 to 0.55%, and 1.2% to 2.0% in the
H′,
D, and
E index values compared to F1, respectively.
When SCP fertigation was applied to sample I, there were no significant differences in the H′ and D index between W1 and W3. The values for H′ were 17% to 17.7% lower than that of W2, while the values for D were 4.5% to 4.8% lower than that of W2. Moreover, the E index showed no significant difference between W1 and W2, but it was 3.7% to 4.2% lower compared to W3. For sample II, there were no significant differences between the three treatments in terms of the E and U index. Additionally, the H′ indexes of W1 and W2 were not significantly different from each other. However, they were slightly lower (0.17% to 0.24%) compared to that of W3. The D indexes of W1 and W3 were not significantly different and were 0.07% lower than W2.
The combined analysis of the six treatments, considering the interaction between nitrogen application and the fertilizer method, yielded the following results. In sample I, F2 and F3 had the most significant impacts on the H′, D, and U indexes, while W3 had a pronounced effect on the E index. For sample II, F3 demonstrated substantial influences on the H′ and D indexes, whereas F3, W1, and W2 exerted notable effects on the E index.
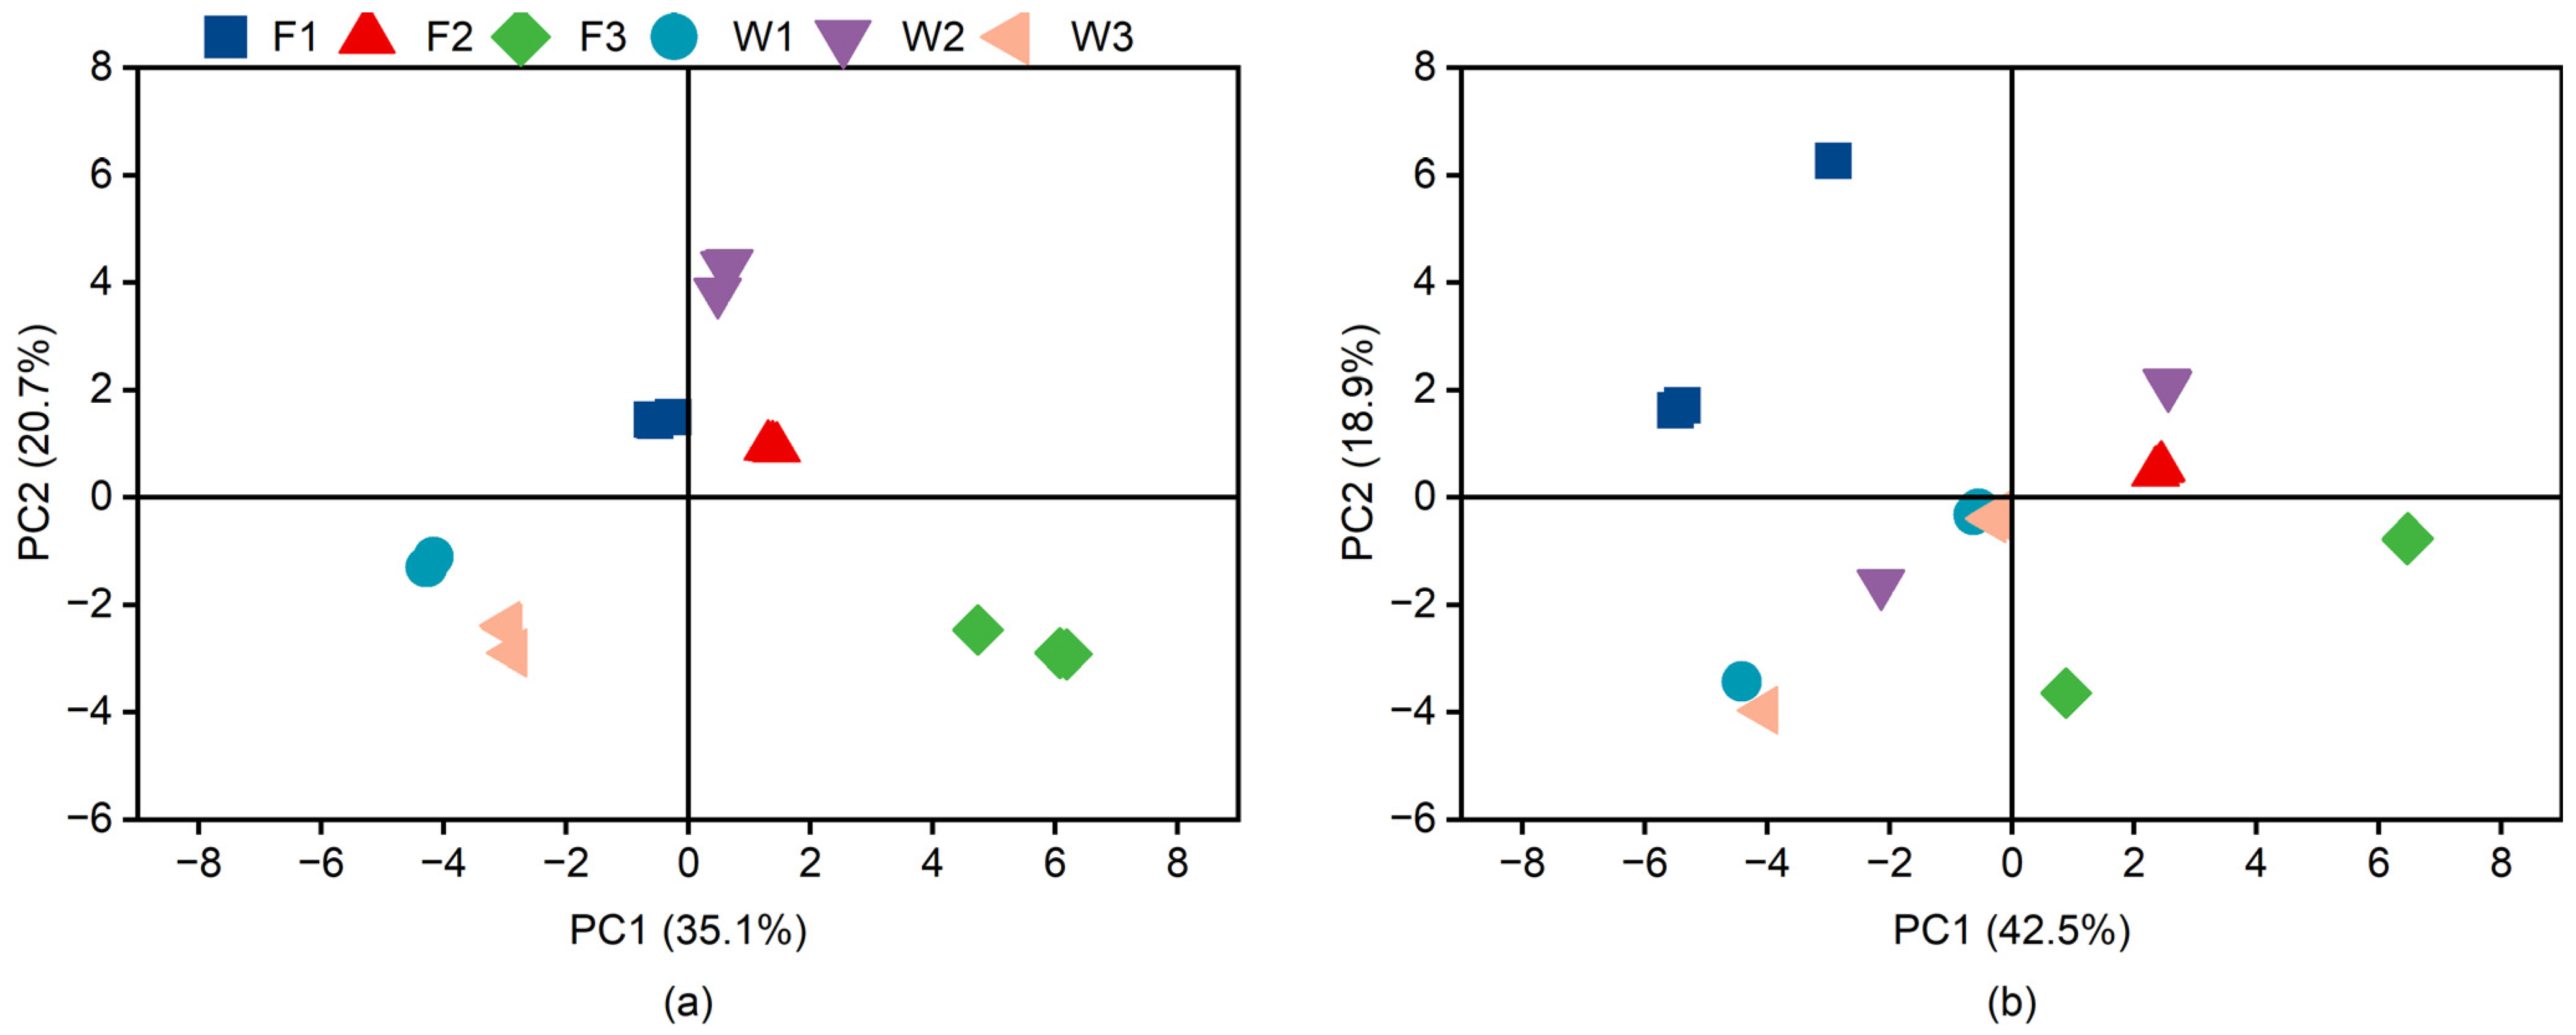
3.3. Principal Component Analysis of Carbon Source Utilization by Soil Microbial Communities
To delve into the variations in functional diversity of the soil microbial communities across the distinct fertilization regimes, principal component analysis (PCA) was employed to examine the microbial utilization of 31 carbon sources. Principal component analysis is a statistical method that reduces data volume while retaining all the captured information [
34]. Utilizing AWCD values at 144 h of incubation, principal component analysis facilitated the exploration and subsequent elucidation of these variations. A scatter plot, generated from the score coefficients of the treatments on the first two principal components (PC1 and PC2), positioned PC1 on the
x-axis and PC2 on the
y-axis (referenced in
Figure 5). In the principal component analysis context, the proximity between sample points indicates lesser differentiation in the metabolic capabilities of microbial communities. According to
Figure 5, sample I, representing soil microorganisms, exhibited minimal variation across the fertilization treatments. This suggests a more uniform microbial metabolic function. Conversely, sample II displayed marked spatial segregation and a pronounced divergence in microbial community structure among the fertilization treatments. This suggests that the microbial ecosystem is less stable. Thus, the microbial communities in sample I, subjected to various fertilization treatments, showcased higher resilience and uniformity in metabolic function compared to those in sample II. This suggests that the microbial ecosystem in the 20 cm subsoil layer is more stable than that on the stalk composite pipe wall under different fertilization conditions.
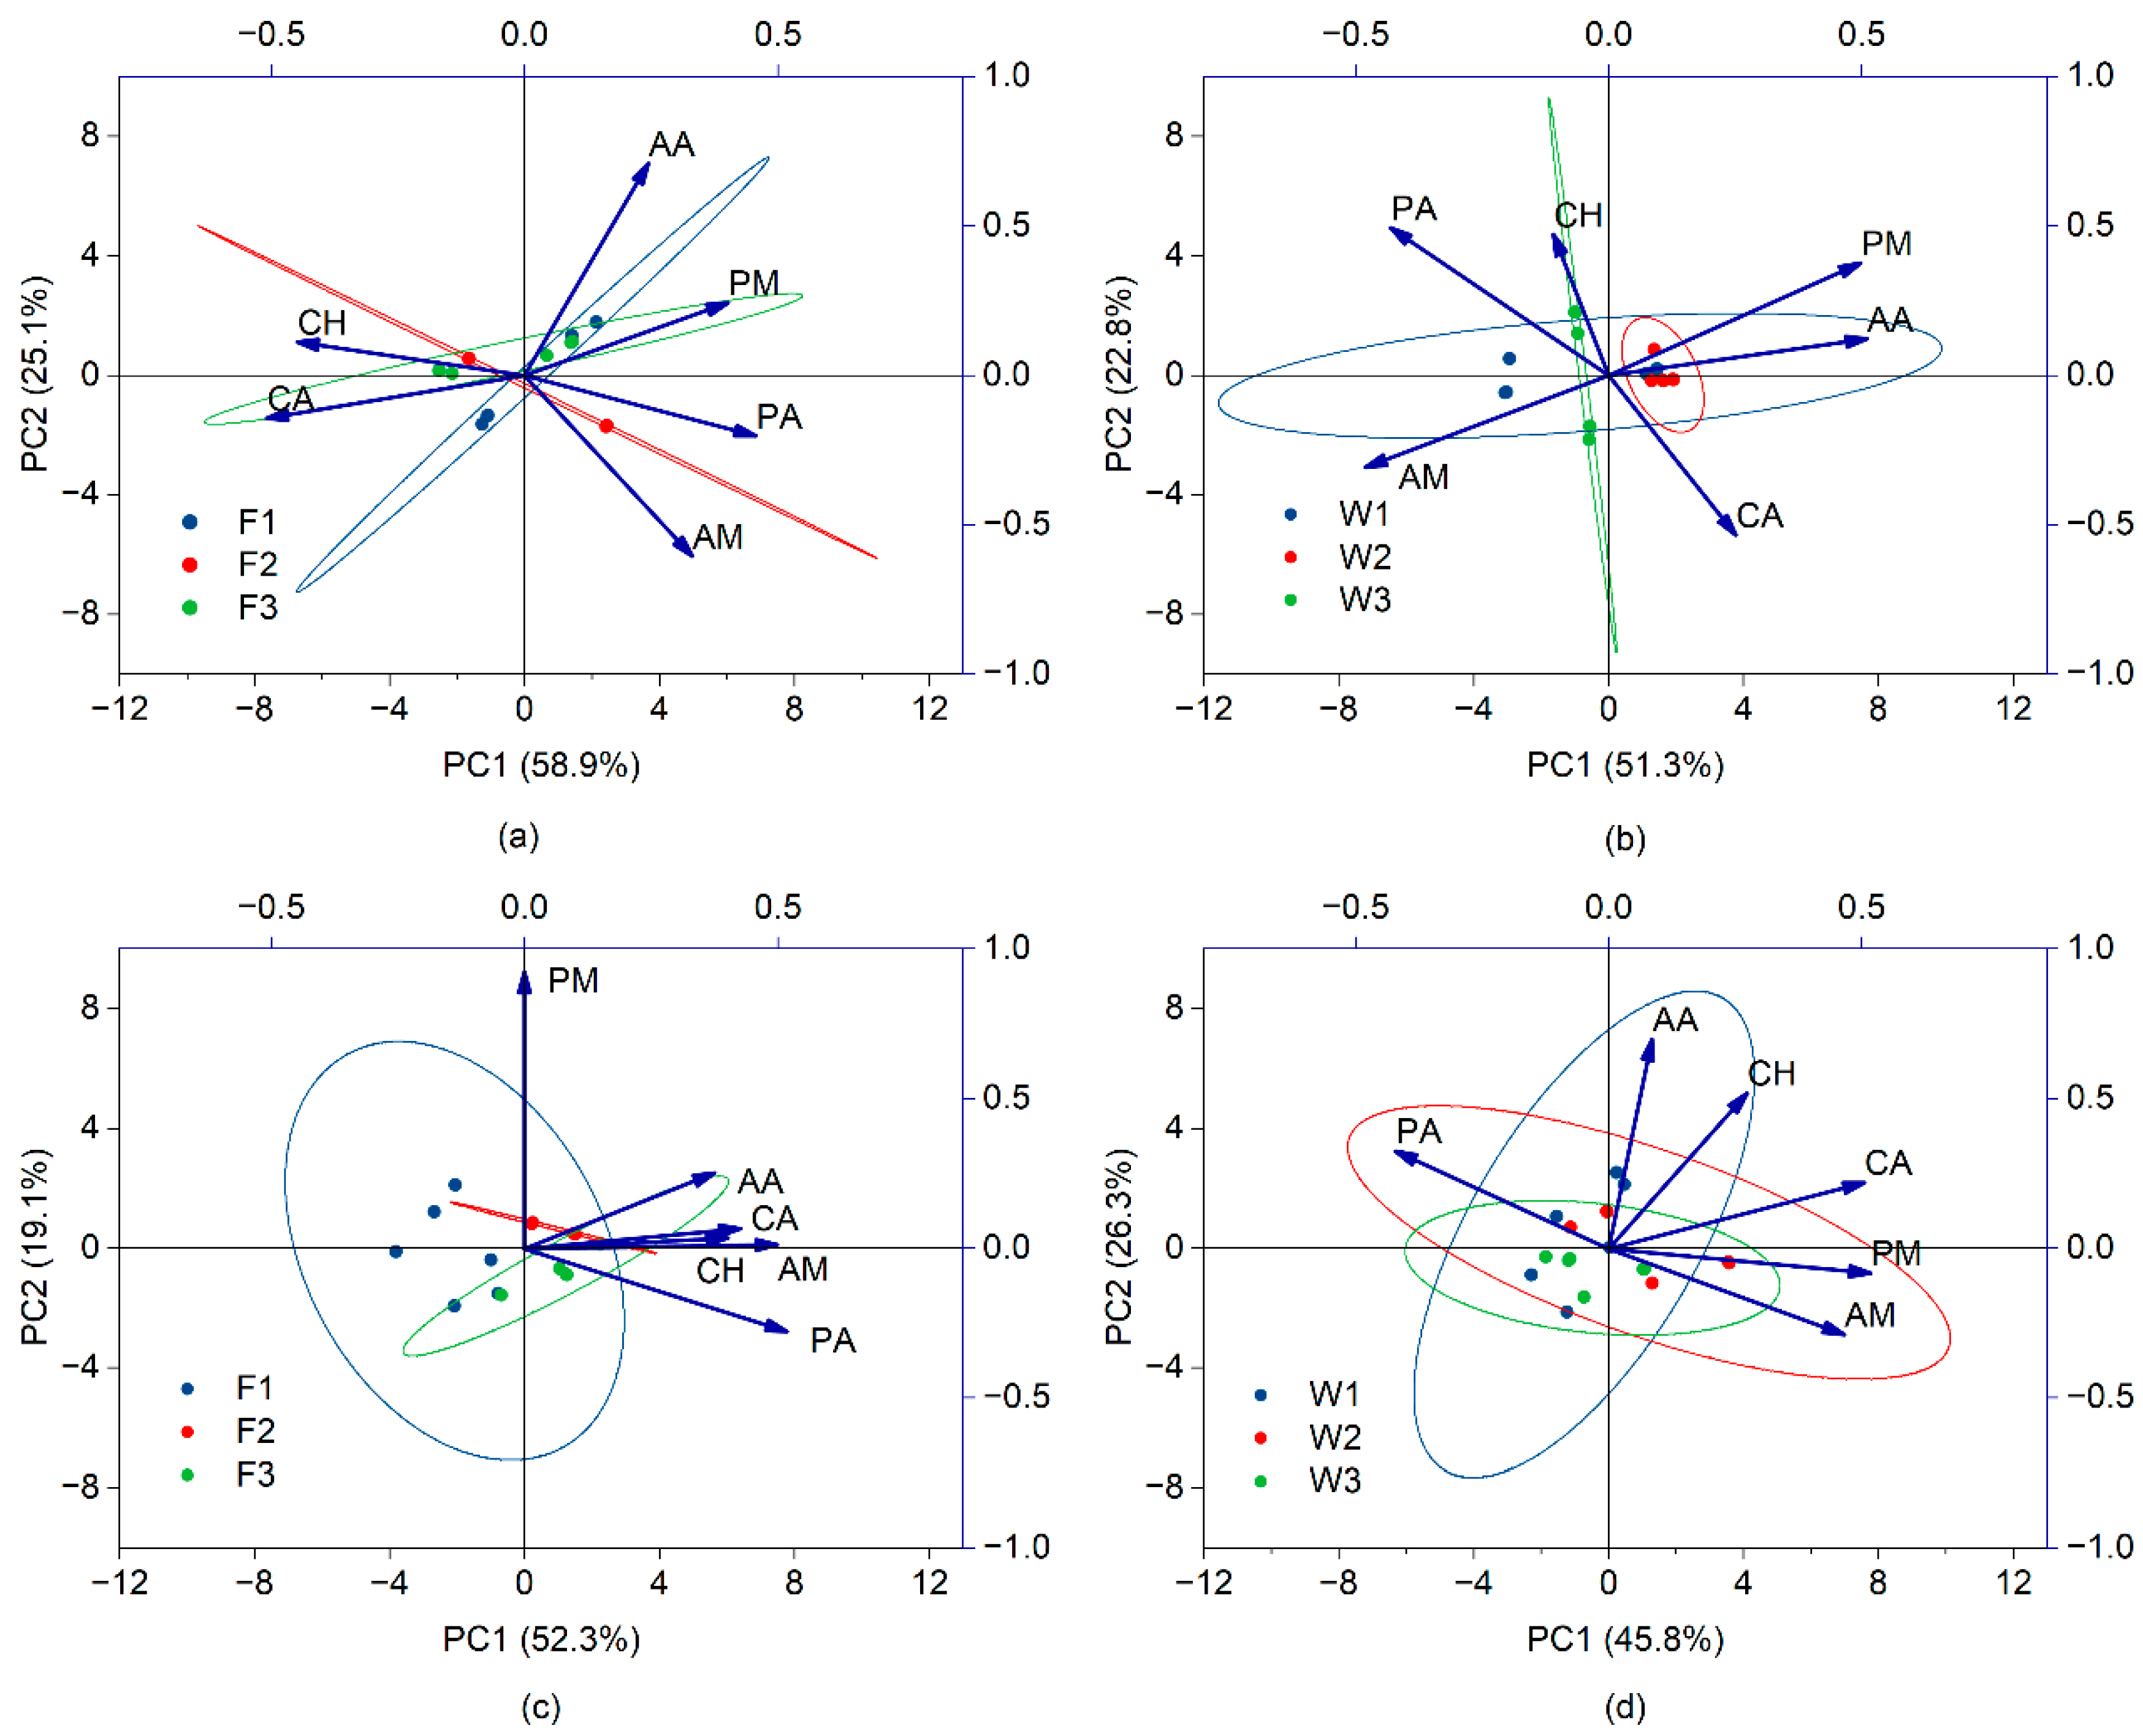
The Biolog Ecoplate™ sorts carbon sources into six categories based on the chemical characteristics of organic compounds, microorganism metabolic pathways, and their ecological functions. These categories include carbohydrates (CH), amino acids (AA), carboxylic acids (CA), amines (AM), phenolic acids (PA), and polymers (PM) [
35]. The consumption of these varied carbon sources by soil microbes may reflect their metabolic capabilities. The 31 carbon sources were grouped into six principal carbon categories for principal component analysis. The significance of each carbon source’s substrate on the principal component analysis is denoted by the magnitude of its loading factor; a larger factor indicates a higher influence [
36]. According to
Figure 6 in sample I with banding fertilization, carboxylic acids predominantly influence PC1 (with a coefficient exceeding 0.50), whereas amino acids and amines are key contributors to PC2. In the context of SCP fertigation for sample I, amino acids significantly impact PC1, while carboxylic acids are major contributors to PC2. For sample II under banding fertilization, phenolic acids notably affect PC1, with polymers playing a significant role in PC2. With SCP fertigation in sample II, carboxylic acids and polymers are substantial contributors to PC1, whereas carbohydrates and amino acids greatly influence PC2. This illustrates that the utilization of the six major carbon groups varies not only by fertilization method at the same location, but also by location for a given fertilization approach.
3.4. Effect of Fertilization Practices on the Utilization of the Six Major Carbon Groups by Soil Microorganisms
Table 4 details the impact of the fertilization methods and nitrogen levels on the utilization of these six carbon groups. The fertilizer application method notably influenced the uptake of CH, AA, and CA in sample I, and PA and PM in sample II. Nitrogen levels significantly affected the consumption of CH, CA, and PM in sample I, and AA, CA, AM, and PM in sample II. Furthermore, the interaction between the fertilization method and nitrogen application was found to significantly impact the utilization of CH, AA, and AM in sample I, and all the carbon sources except CH in sample II. Thus, both the method of fertilizer application and the level of nitrogen application, along with their interaction, exert significant effects on the consumption patterns of the six primary carbon groups by the soil microbial communities.
Based on the two-way ANOVA outcomes, further analysis on the microbial consumption of the six carbon sources was conducted.
Table 5 presents the AWCD values for the six primary carbon groups by soil microbes under varied treatments. When applying identical nitrogen amounts and comparing fertilization methods, the following was noted: in sample I, amino acid utilization under F1 exceeded W1 by 172%. Similarly, the utilization of carbohydrates under F2 was 75% higher than under W2. In addition, the utilization rates for carbohydrates, amino acids, and carboxylic acids under F3 were 220%, 218%, and 116% greater than W3, respectively. In sample II, F1’s polymer utilization was 22.3% above W1, F2’s phenolic acids were 150% more than W2, and F3’s phenolic acids were 96.9% higher than W3. Hence, banding fertilization enhanced the microbial consumption of the six carbon groups more effectively than SCP fertigation at equivalent nitrogen levels.
When fertilization was consistent, varying nitrogen levels yielded the following: with banding in sample I, polymer utilization differences across the nitrogen levels were minimal, while carbohydrates and carboxylic acids saw a progressive increase with nitrogen augmentation. Carbohydrate consumption by F3 was 106% and 33.9% higher than F1 and F2, respectively. F3’s carboxylic acids were 89.6% and 90% above F1 and F2. In sample II, no significant differences were found between F2 and F3 in consuming AA, CA, and AM. However, F2 outperformed F3 in PM utilization. In sample I, carbohydrate or carboxylic acid markers could distinguish treatments. It was observed that greater nitrogen levels led to increased consumption of the six carbon groups. For sample II, F2 showed the highest utilization.
Under SCP fertigation in sample I, no significant differences were found in carboxylates and polymers across nitrogen levels. Carboxylic acids’ utilization first rose and then fell with increased nitrogen, with W2 being 138% and 74.8% above W1 and W3, respectively. In sample II, carboxylic acids and amines showed similar patterns. There was no marked difference in amino acid utilization between W1 and W2, nor in polymer consumption between W3, W1, and W2. Moreover, W2 exhibited a 16.0% and 57.6% higher amino acid utilization, 14.7% and 18% more carboxylic acids, 16.6% and 10.4% greater amines, and 18.6% and 7.2% more polymers than W1 and W3, respectively. Thus, with SCP fertigation, the utilization of the six carbon groups peaked and then diminished with nitrogen increments, with W2 achieving the highest utilization.
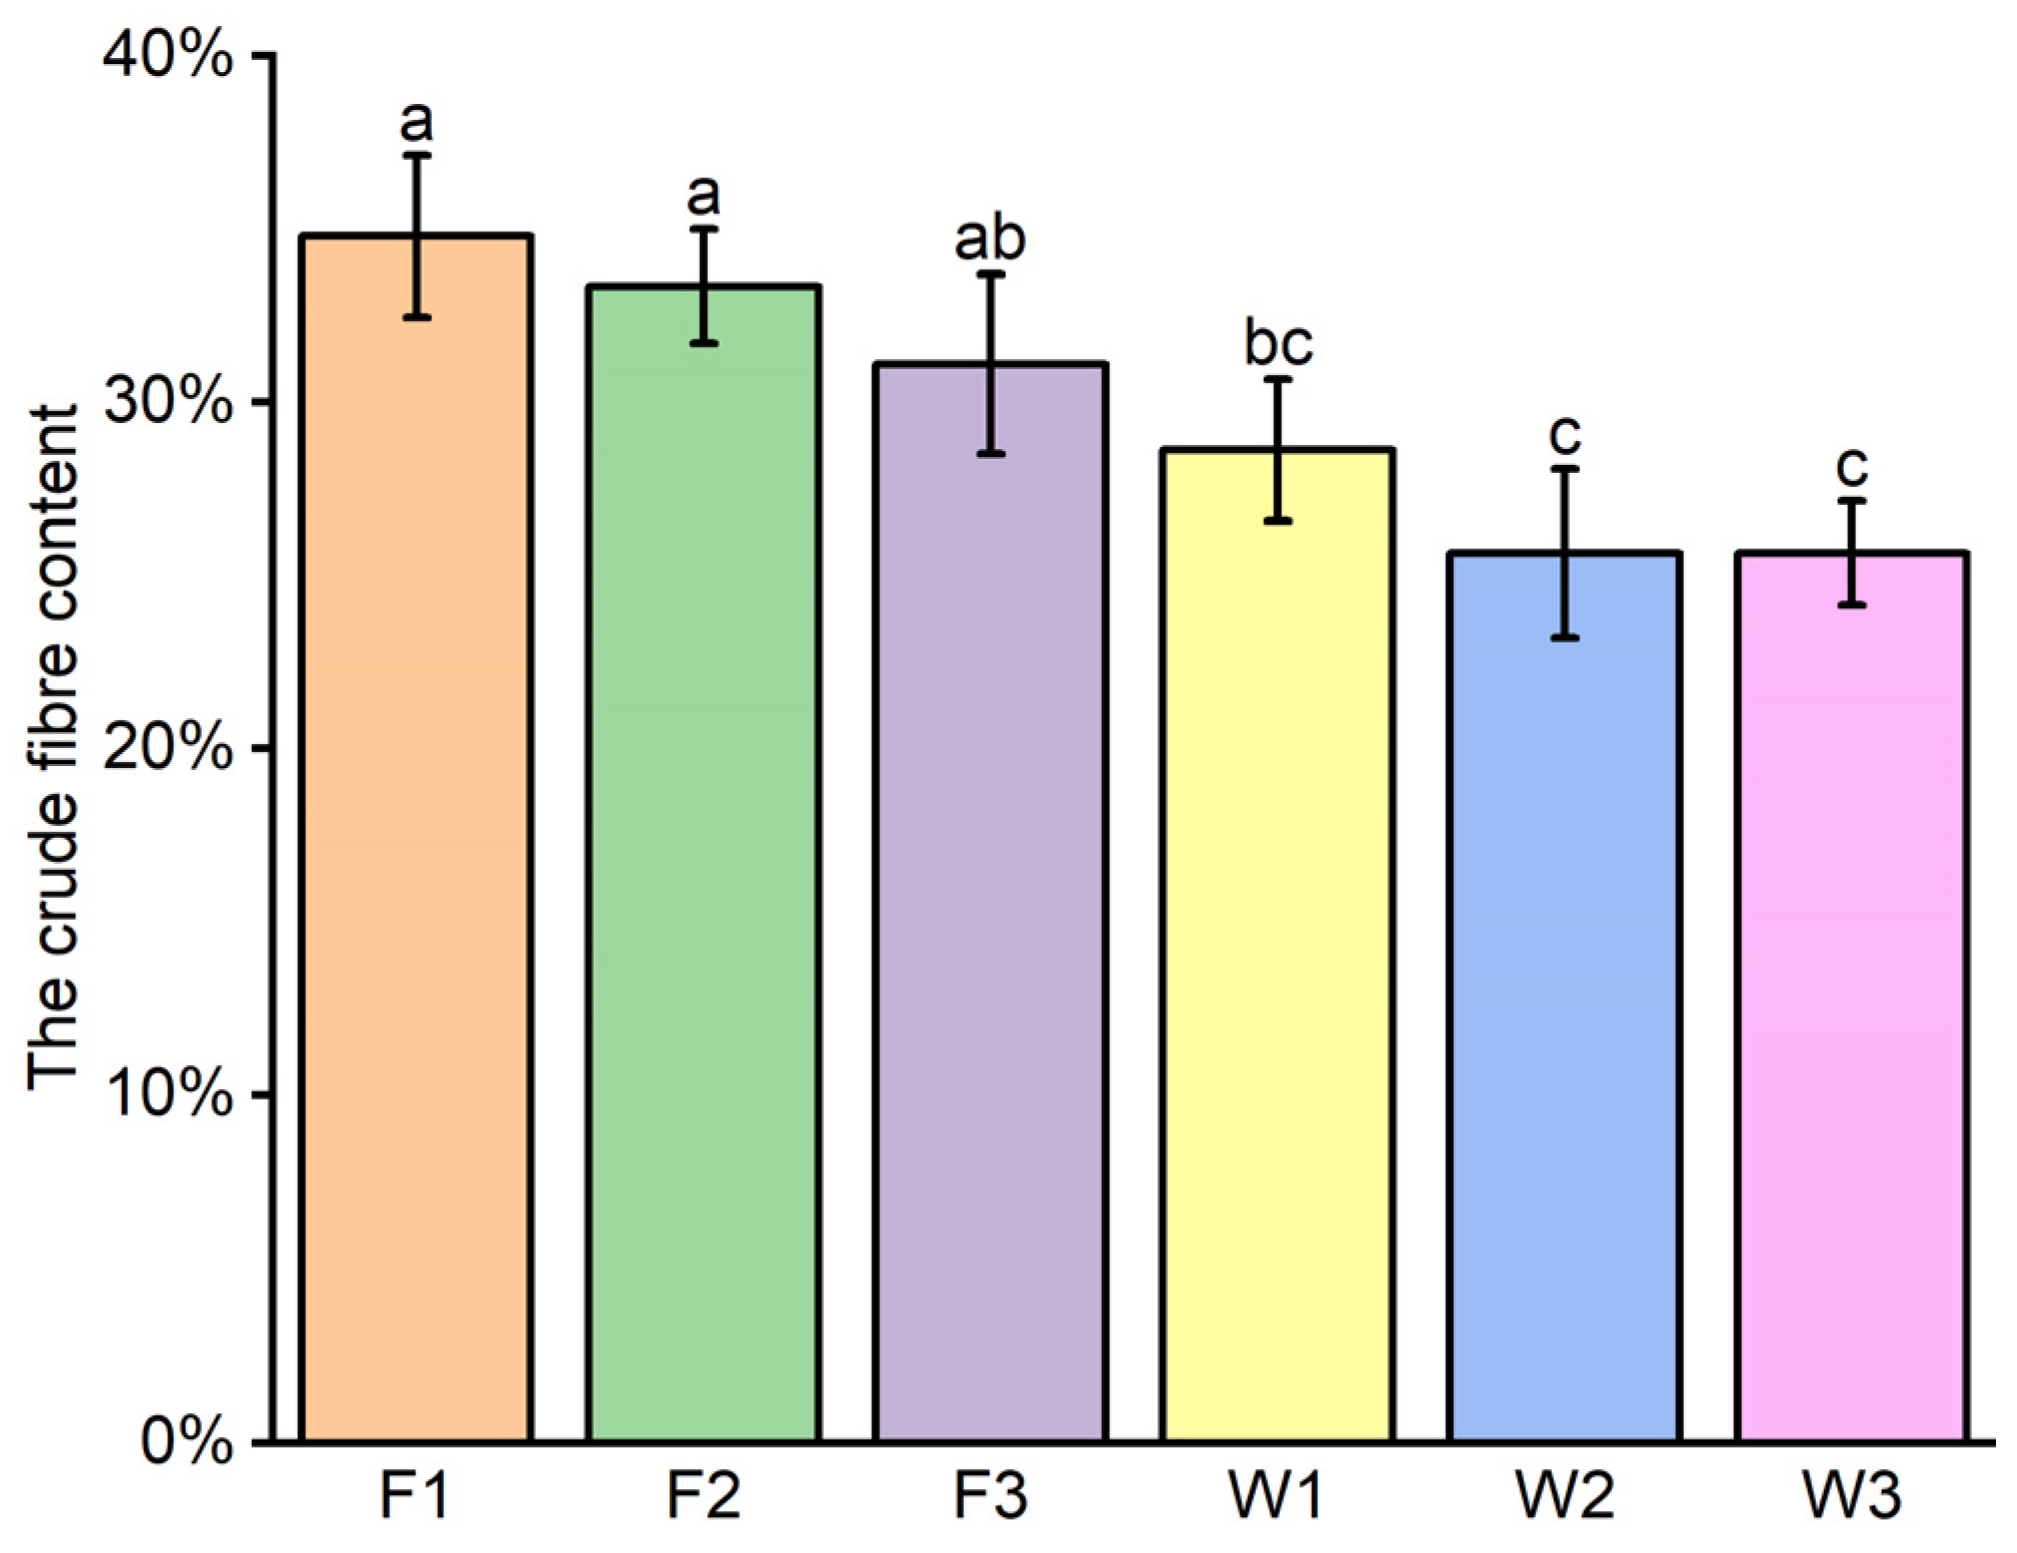
3.5. Crude Fiber Content
Figure 7 illustrates the crude fiber content in the straw at the stalk composite pipe wall under varied treatments. It reveals no significant disparity in the straw’s crude fiber content across different nitrogen levels for the same fertilization approach. Moreover, no marked difference was observed between the F3 and W1 treatments. The accompanying
Table 6 shows a highly significant correlation between crude fiber content and the method of fertilization in a two-way ANOVA. However, there is no significant correlation with the level of nitrogen application nor with the interaction between the nitrogen level and fertilization method. The crude fiber content in SCP fertigation was found to be 17.6% to 26.3% lower than in banding fertilization, thereby enhancing the rate of straw decomposition.
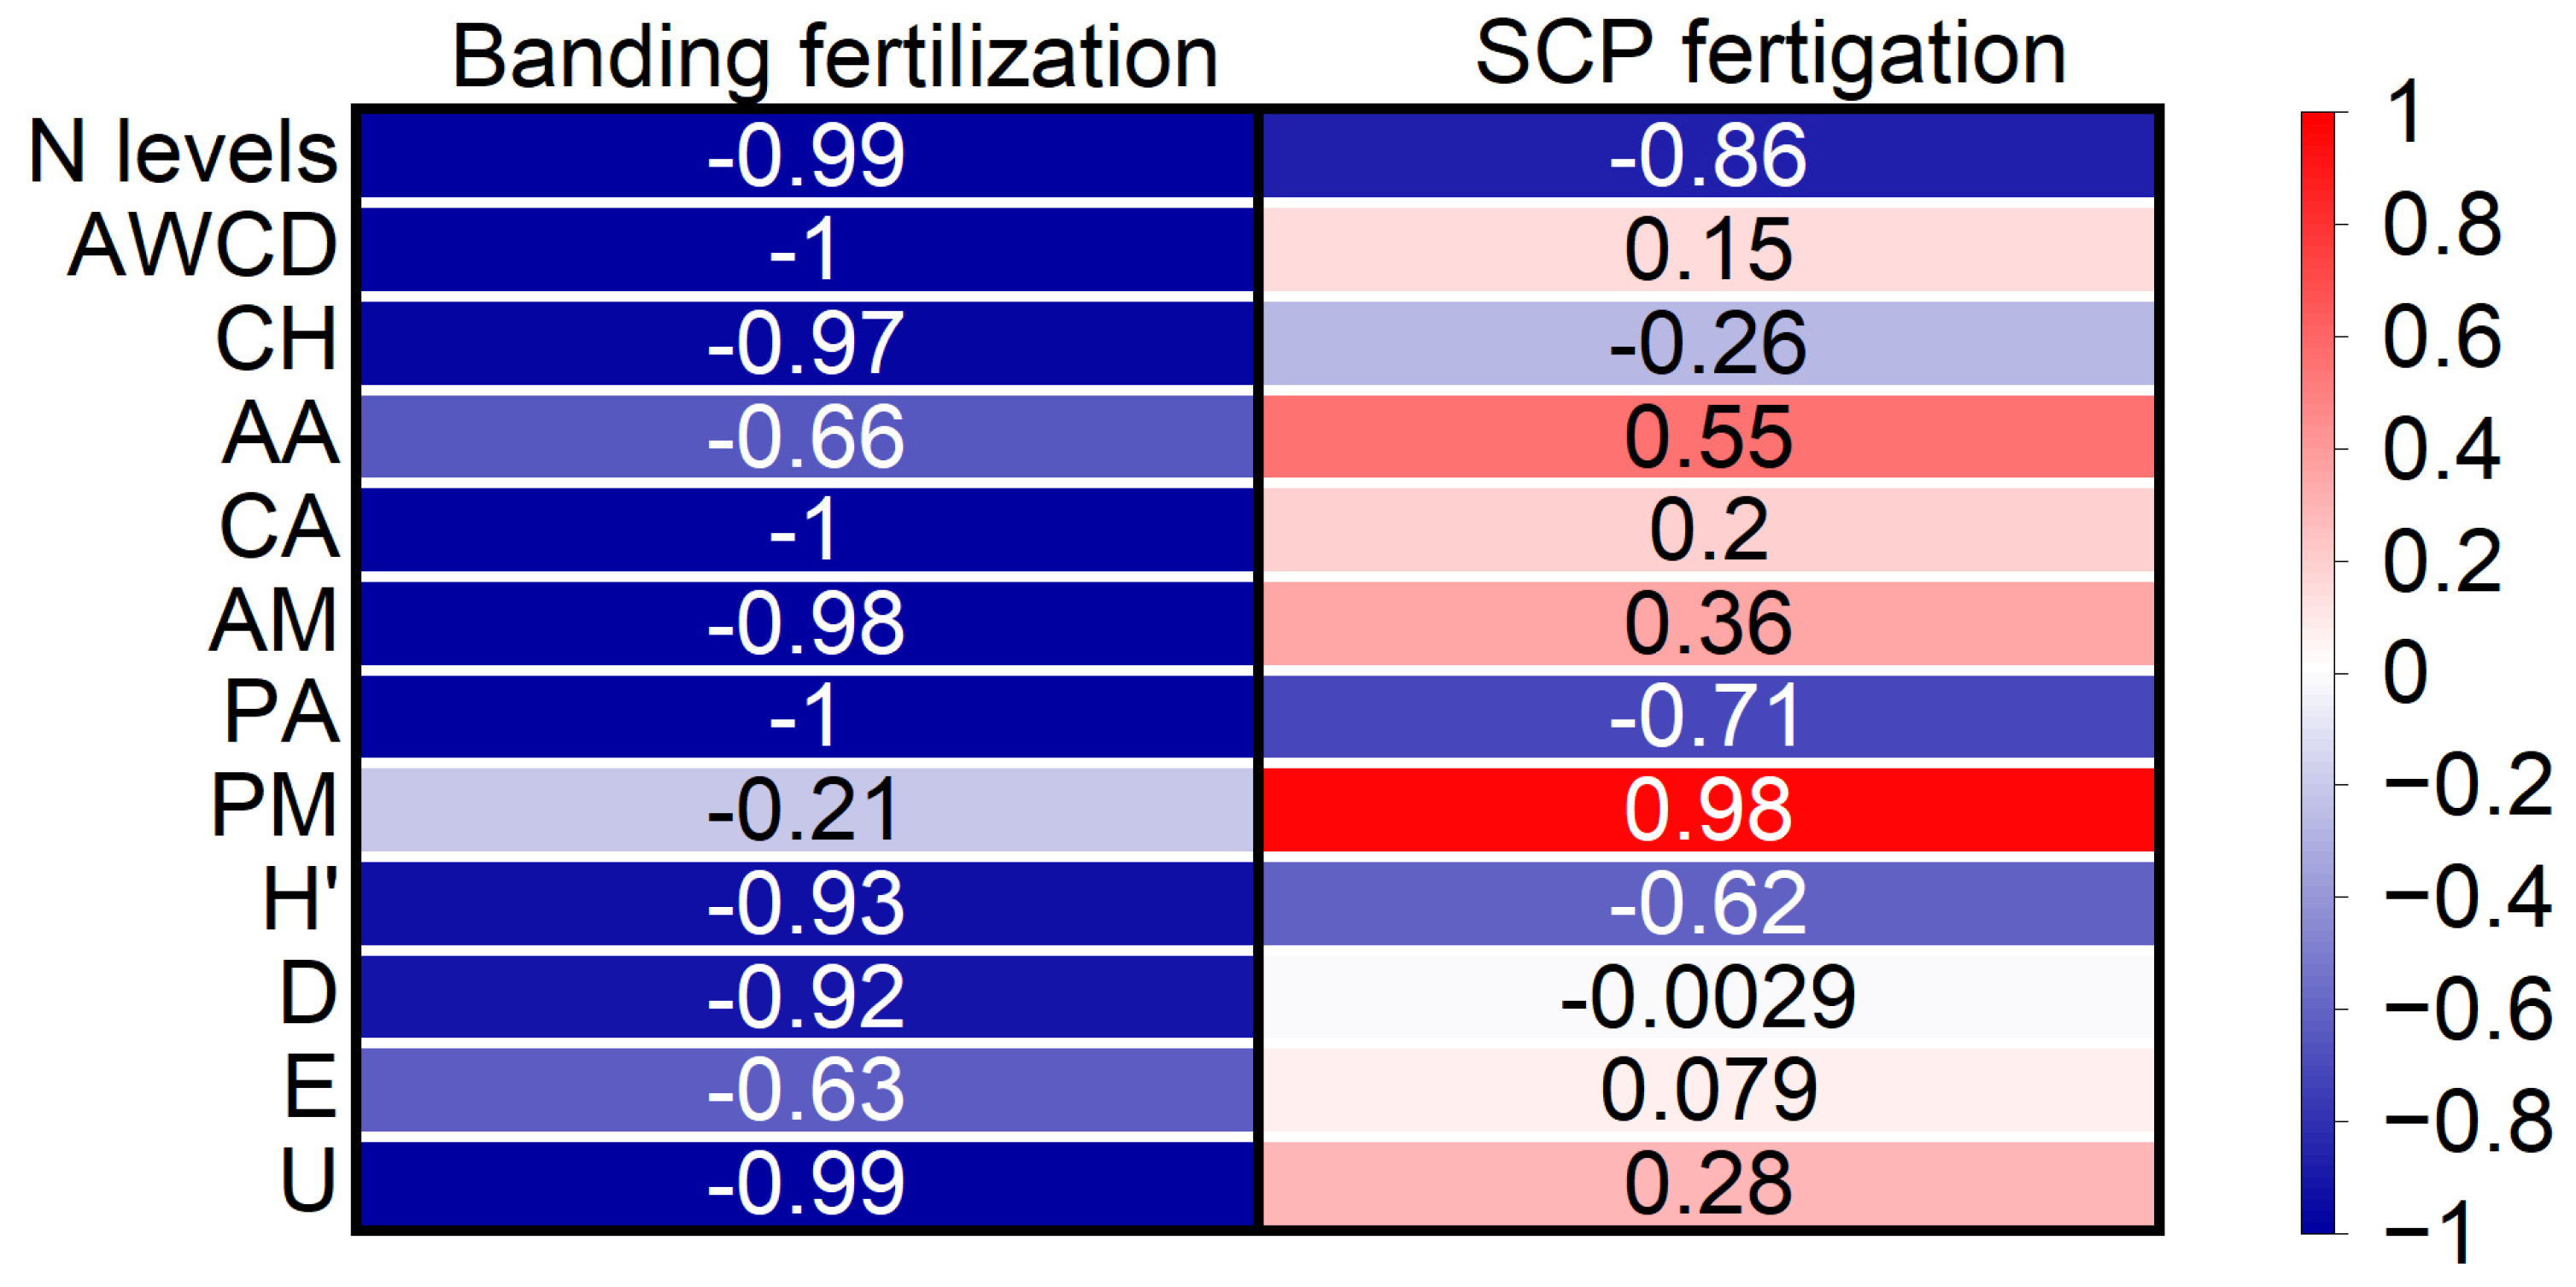
Correlation analysis, presented in
Figure 8, examined the relationship between the various indexes and the crude fiber content in the straw. Under banding fertilization, a negative correlation was noted between the crude fiber content and all the indexes. Conversely, with SCP fertigation, the crude fiber content exhibited a negative correlation with nitrogen application and the utilization of carbohydrates and phenolic acids, as well as with the
H′ index. On the other hand, it exhibited a positive correlation with the AWCD value, and the utilization of amino acids, carboxylic acids, amines, and polymers, alongside the
D index.
When considering the effect of nitrogen application on the indexes, it can be seen that within the banding fertilization scenarios, the most pronounced acceleration of straw decomposition was observed in F2, while F1 had the least accelerating effect. With SCP fertigation, W3 led to the most accelerated straw decomposition, whereas W2 had the least accelerating effect. Overall, the quickest straw decomposition under SSI was achieved with SCP fertigation at 210 kg/ha N fertilizer, while the slowest was with banding fertilization at 126 kg/ha N fertilizer.


