Article

Fine-Mapping Analysis of the Genes Associated with Pre-Harvest Sprouting Tolerance in Rice (Oryza sativa L.)

1
Department of Plant Bioscience, Pusan National University, Miryang 50463, Republic of Korea
2
Life and Industry Convergence Research Institute, Pusan National University, Miryang 50463, Republic of Korea
3
Department of Crop Science, Konkuk University, Seoul 05029, Republic of Korea
4
Department of Agricultural Science, Korea National Open University, Seoul 03087, Republic of Korea
*
Author to whom correspondence should be addressed.
Agronomy 2023, 13(3), 818; https://doi.org/10.3390/agronomy13030818
Submission received: 15 February 2023 / Revised: 9 March 2023 / Accepted: 9 March 2023 / Published: 10 March 2023

Abstract

:
Pre-harvest sprouting (PHS) of rice (Oryza sativa L.) causes severe economic problems due to reduced grain quality and yield. Fine mapping was carried out to identify genes associated with PHS; the detected quantitative trait locus (QTL) was narrowed down to 50 Kbp using F3:4 populations, four polymorphic insertion and deletion (InDel) markers, and two cleaved amplified polymorphic sequence (CAPS) markers. In one region, five candidate genes were detected, and the SNP and InDel in each gene (Os01g0111400 and Os01g0111600) were confirmed to show the differences and resulting amino acid changes between parent plants. Based on haplotype, expression, and co-segregation analysis, the InDel in Os01g0111600 was confirmed to be associated with the PHS trait. The results of this study could be applied to improve the PHS tolerance of Japonica rice varieties, and they also improved our understanding of the genetic basis underlying PHS tolerance.

1. Introduction

Rice (Oryza sativa L.) is the most important staple cereal crop for more than half of the world’s population [1]. However, the security of the rice supply is threatened by climate change, including events such as typhoons, high temperatures, and other extreme weather conditions [2].
PHS is one of the most important adverse processes in rice because of the severe economic consequences of the markedly reduced grain quality and yield [3]. This occurs when seeds germinate during the maturing stage, before the harvest. Under normal seed dormancy (SD), maturation of the seed is arrested for various periods of time to allow it to germinate under favorable conditions. A lack of SD causes PHS in cereal crops [4]. In wild plant species, SD prevents germination of the panicle or grain under inopportune conditions. When matured rice panicles are not harvested in time or the harvested rice grains are not dried immediately after harvesting, rice cultivars with high PHS may exhibit germination when exposed to frequent rainfall and high temperatures [5,6,7,8]. SD is an adaptive trait that helps plants survive in harsh environments. However, PHS can break SD and promote seed germination under unfavorable conditions, which is also a crucial trait for plant survival [5,9].
Traits associated with seed germination, such as PHS, SD, and low-temperature germination (LTG), are highly complex, involving various physical and biochemical quality factors. They are quantitative traits subject to complex genetic control mechanisms, and germination-associated genes have been reported to be affected by auxin, abscisic acid (ABA), and gibberellin (GA) levels, which are major signaling molecules involved in germination induction [10].
Auxin is a phytohormone that is involved in various physiological processes, including phototropism, cell differentiation, cell expansion, floral opening, organ abscission, and seed germination [11]. Endospermic sugars are an essential energy source for seed germination and determine SD and germination by affecting ABA signaling [12]. GA promotes germination, which requires not only initiating embryo metabolic activity, but also breaking the physical barrier of the seed coat surrounding the embryo [13]. Several studies have proposed SD regulation as the predominant factor affecting PHS [4,14,15,16,17,18].
Many QTLs with these traits have been reported in different subspecies and ecotypes [15,19,20,21]. Fourteen QTLs related to SD were identified using recombinant inbred line (RIL) and restriction fragment length polymorphism markers [22], and qSD-3, -5, -6, and -11 were detected using a double-haploid population [23]. qPHS-11 was identified under field and greenhouse conditions through whole-genome resequencing [24]. qSDR9.1 and qSDR9.2 were identified on chromosome 9 using chromosome segment substitution lines and simple sequence repeat markers [25]. Only a few genes (SD1-2 and Sdr4) have been identified through map-based cloning [26,27]. Using a genome-wide association study (GWAS), 10 loci associated with PHS were reported on chromosomes 1 and 4 based on a subset of SNPs, with 277 accessions from the 3000 Rice Genomes Project [28].
Improving PHS tolerance in rice is a major breeding objective [29]. To overcome PHS in rice under unpredictable weather conditions, genes and alleles associated with PHS must be identified. To address the incorporation of PHS tolerance into commercial rice cultivars, we conducted QTL and fine-mapping analysis with a mapping population derived from crossing high-quality Japonica varieties. We propose that the QTLs and candidate genes detected in this study could be used in commercial rice breeding programs.

2. Materials and Methods

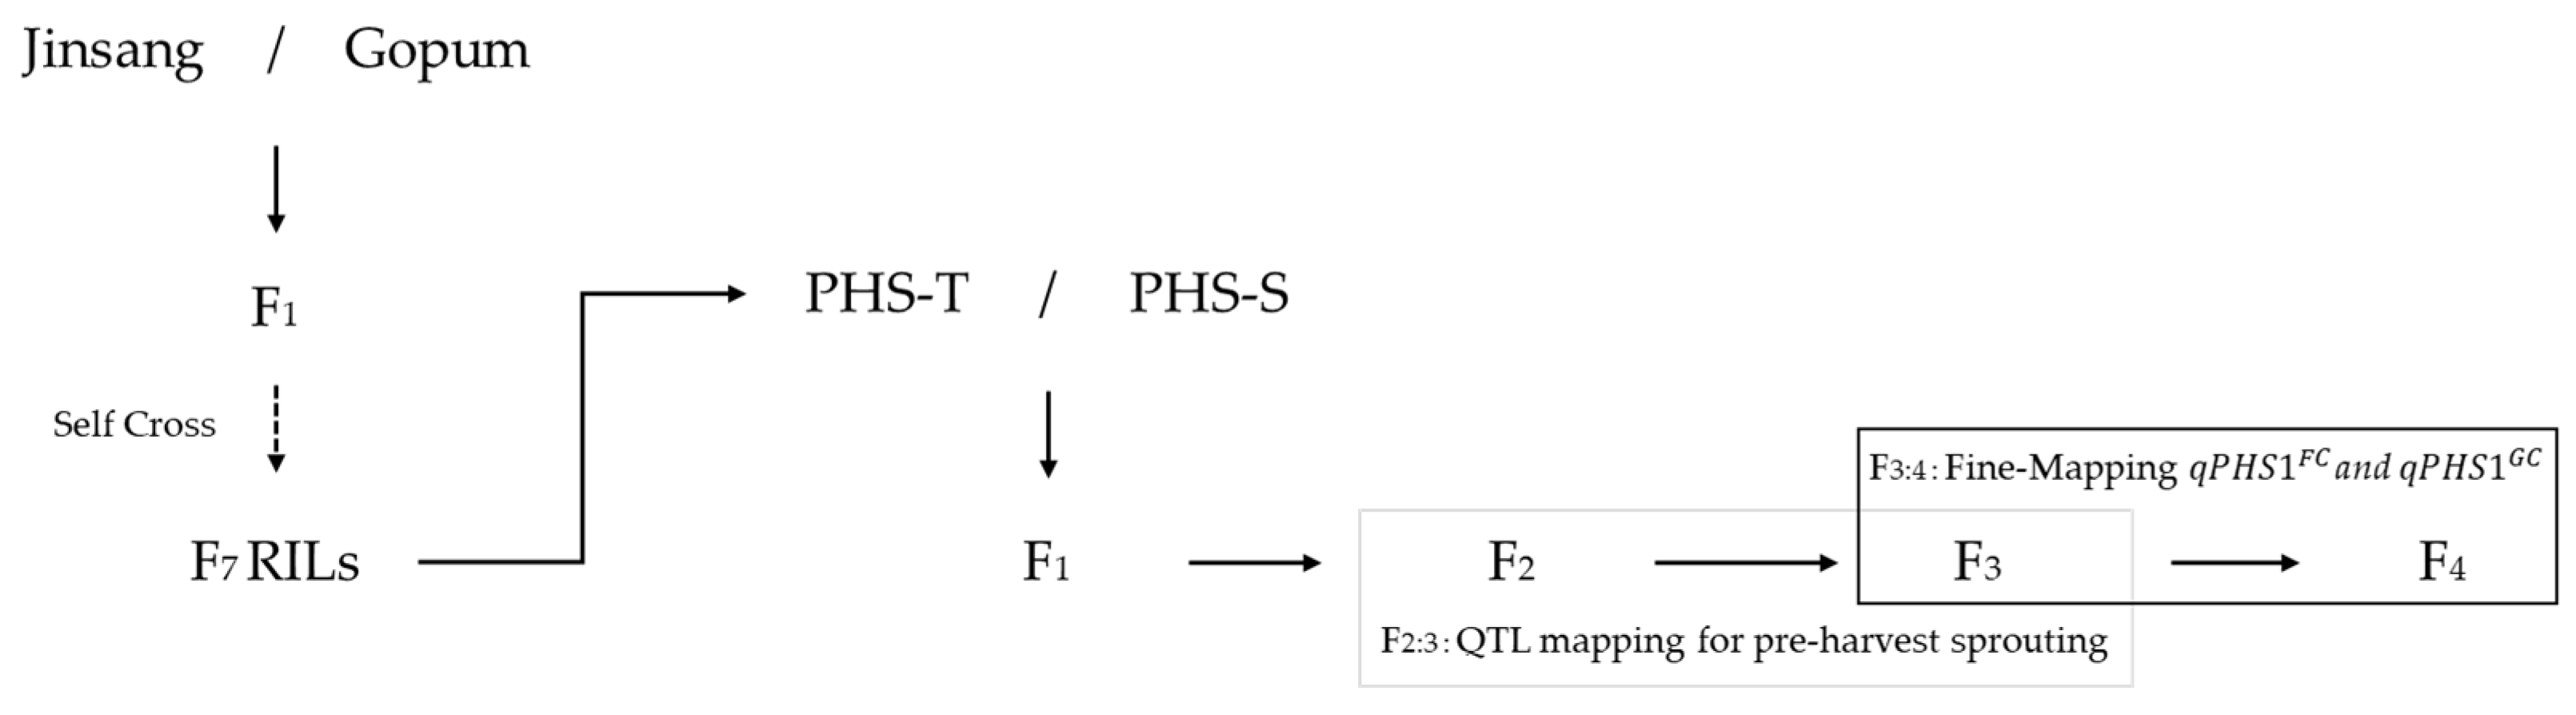
2.1. Plant Materials

A PHS tolerance line (PHS-T) and a PHS susceptible line (PHS-S) were selected from a RIL population generated through crossing ‘Jinsang’, a parent producing high-quality rice, with ‘Gopum’, which also produces high-quality rice but is susceptible to PHS [30,31]. In the RIL population, parent plants were selected with similar agricultural traits, except for the PHS trait; as a result, the F2 and F3 populations showed pronounced segregation of tolerance and susceptibility, whereas traits such as plant height, heading date, culm length, and panicle length were uniform. In the previous study, 88 F2 from a cross between PHS-T and PHS-S were used for QTL analysis to identify candidate regions [32]. The heterozygous plant was selected from the F2 population to generate F3 plants for further fine-mapping (Figure 1). PHS-T, PHS-S, and 241 F3 plants were grown in the experimental field at Pusan National University in 2018 and 2020.

2.2. Phenotypic Evaluation of Pre-Harvest Sprouting

At forty-five days after flowering (DAF), three panicles from each parent and the 241 F3 plants were evaluated for PHS rates under growth chamber (GC) conditions. Panicles were wrapped in paper towels and placed in water (100% relative humidity). Materials were incubated at 20 °C for seven days in a growth chamber [19]. For haplotype analysis, 93 Korean-bred varieties were also evaluated for PHS tolerance using 45 DAF panicles under growth chamber conditions. All statistical analyses were conducted using R software version 4.1.3 for Windows.

2.3. Fine-Mapping of qPHS1GC and qPHS1FC

To conduct a fine-mapping analysis, four InDel markers and two CAPS markers were designed from the variations between PHS-T and PHS-S at the detected QTL region reported in the previous study. Genotype data of PHS-T and PHS-S were acquired through whole-genome resequencing using an MGISEQ-2000 platform (MGI, Shenzhen, China) [32]. Genomic DNA was extracted from fresh rice leaves according to a modified CTAB protocol [33]. Polymerase chain reaction (PCR) was performed as follows: 95 °C for 5 min, followed by 35 cycles of 95 °C for 30 s, 55–58 °C for 30 s, 72 °C for 30 s, and a final elongation step at 72 °C for 7 min. PCR products were analyzed using a Fragment Analyzer TM (Agilent, Santa Clara, CA, USA).

2.4. RNA Extraction and qRT-PCR

RNA was isolated from 45 DAF rice grains of PHS-T and PHS-S using an RNeasy Plant Mini Kit (QIAGEN, Hilden, Germany), and samples were treated with RNase-Free DNase (QIAGEN, Hilden, Germany) to remove genomic DNA. Complementary DNA (cDNA) was synthesized using a SuperScript III Kit (Thermo Fisher Scientific, Boston, MA, USA), with primers for target genes designed using Primer 3 [34]. Reactions were performed in triplicate, and actin expression was used as an internal baseline control. The samples were kept on ice until immediately before qRT-PCR analysis using QuantStudio 1 (Thermo Fisher Scientific, Boston, MA, USA). The run parameters followed a standard PCR protocol, beginning with reverse transcription at 50 °C for 15 min, denaturation at 95 °C for 2 min, followed by 50 amplification cycles consisting of a denaturation step at 95 °C for 15 s and annealing and extension at 60 °C for 1 min, with fluorescence acquisition in the annealing/extension phase. QuantStudio Software version 1.5.2 (Thermo Fisher Scientific, Boston, MA, USA) was used to analyze the data. The cycle threshold was set to 0.05, and the baseline was chosen automatically. Two-tailed t-tests were performed using GraphPad software to compare samples. Statistical significance was reported at p < 0.01.

2.5. Genome Sequence Data for Korean-Bred Rice Varieties

A total of 93 Korean-bred rice varieties from the national agrobiodiversity center of the Rural Development Administration (RDA, Wanju, Republic of Korea) were used to detect variations of PHS (Table S1). Genomic data of the 93 varieties were produced with an approximately eight-fold mean coverage using an Illumina HiSeq 2500 Sequencing Systems Platform (Illumina Inc., San Diego, CA, USA). Raw reads were aligned against the rice reference genome (IRGSP 1.0) for genotype calling. To generate a genotype dataset, the following parameters were used for haplotype analysis: missing value < 1%, minor allele frequency > 5%, and heterozygosis ratio < 5%, as implemented in PLINK software [35].

2.6. Haplotype Analysis for Korean-Bred Varieties

SNPs and InDel regions were used for haplotype analysis, excluding missing and heterozygote regions. The average score and variety count were determined from phenotype data for each variety, and haplotypes that were significantly associated with the phenotype were identified. The online tool Gene Structure Display Server 2.0 was used for the visualization of gene structures and SNP and InDel positions [36].

2.7. Seed Germination Assay and ABA Treatment

To evaluate the effects of ABA on seed germination, grains were harvested at 45 DAF and were dehulled. To determine the ABA sensitivity regarding post-gemination growth, husked seeds were sterilized using 0.15% HgCl2 and were washed in sterilized water. Then, the seeds were spread for germination on micro agar. Three days after incubation, seedlings with the same growth vigor were transferred onto untreated micro agar and 2 µM ABA-treated micro agar, respectively. Seeds and seedlings were grown in a growth chamber under a 14/10 h light/h dark cycle at 28 °C. Photos were taken, and shoot length was measured seven days after transplanting [37].

3. Results

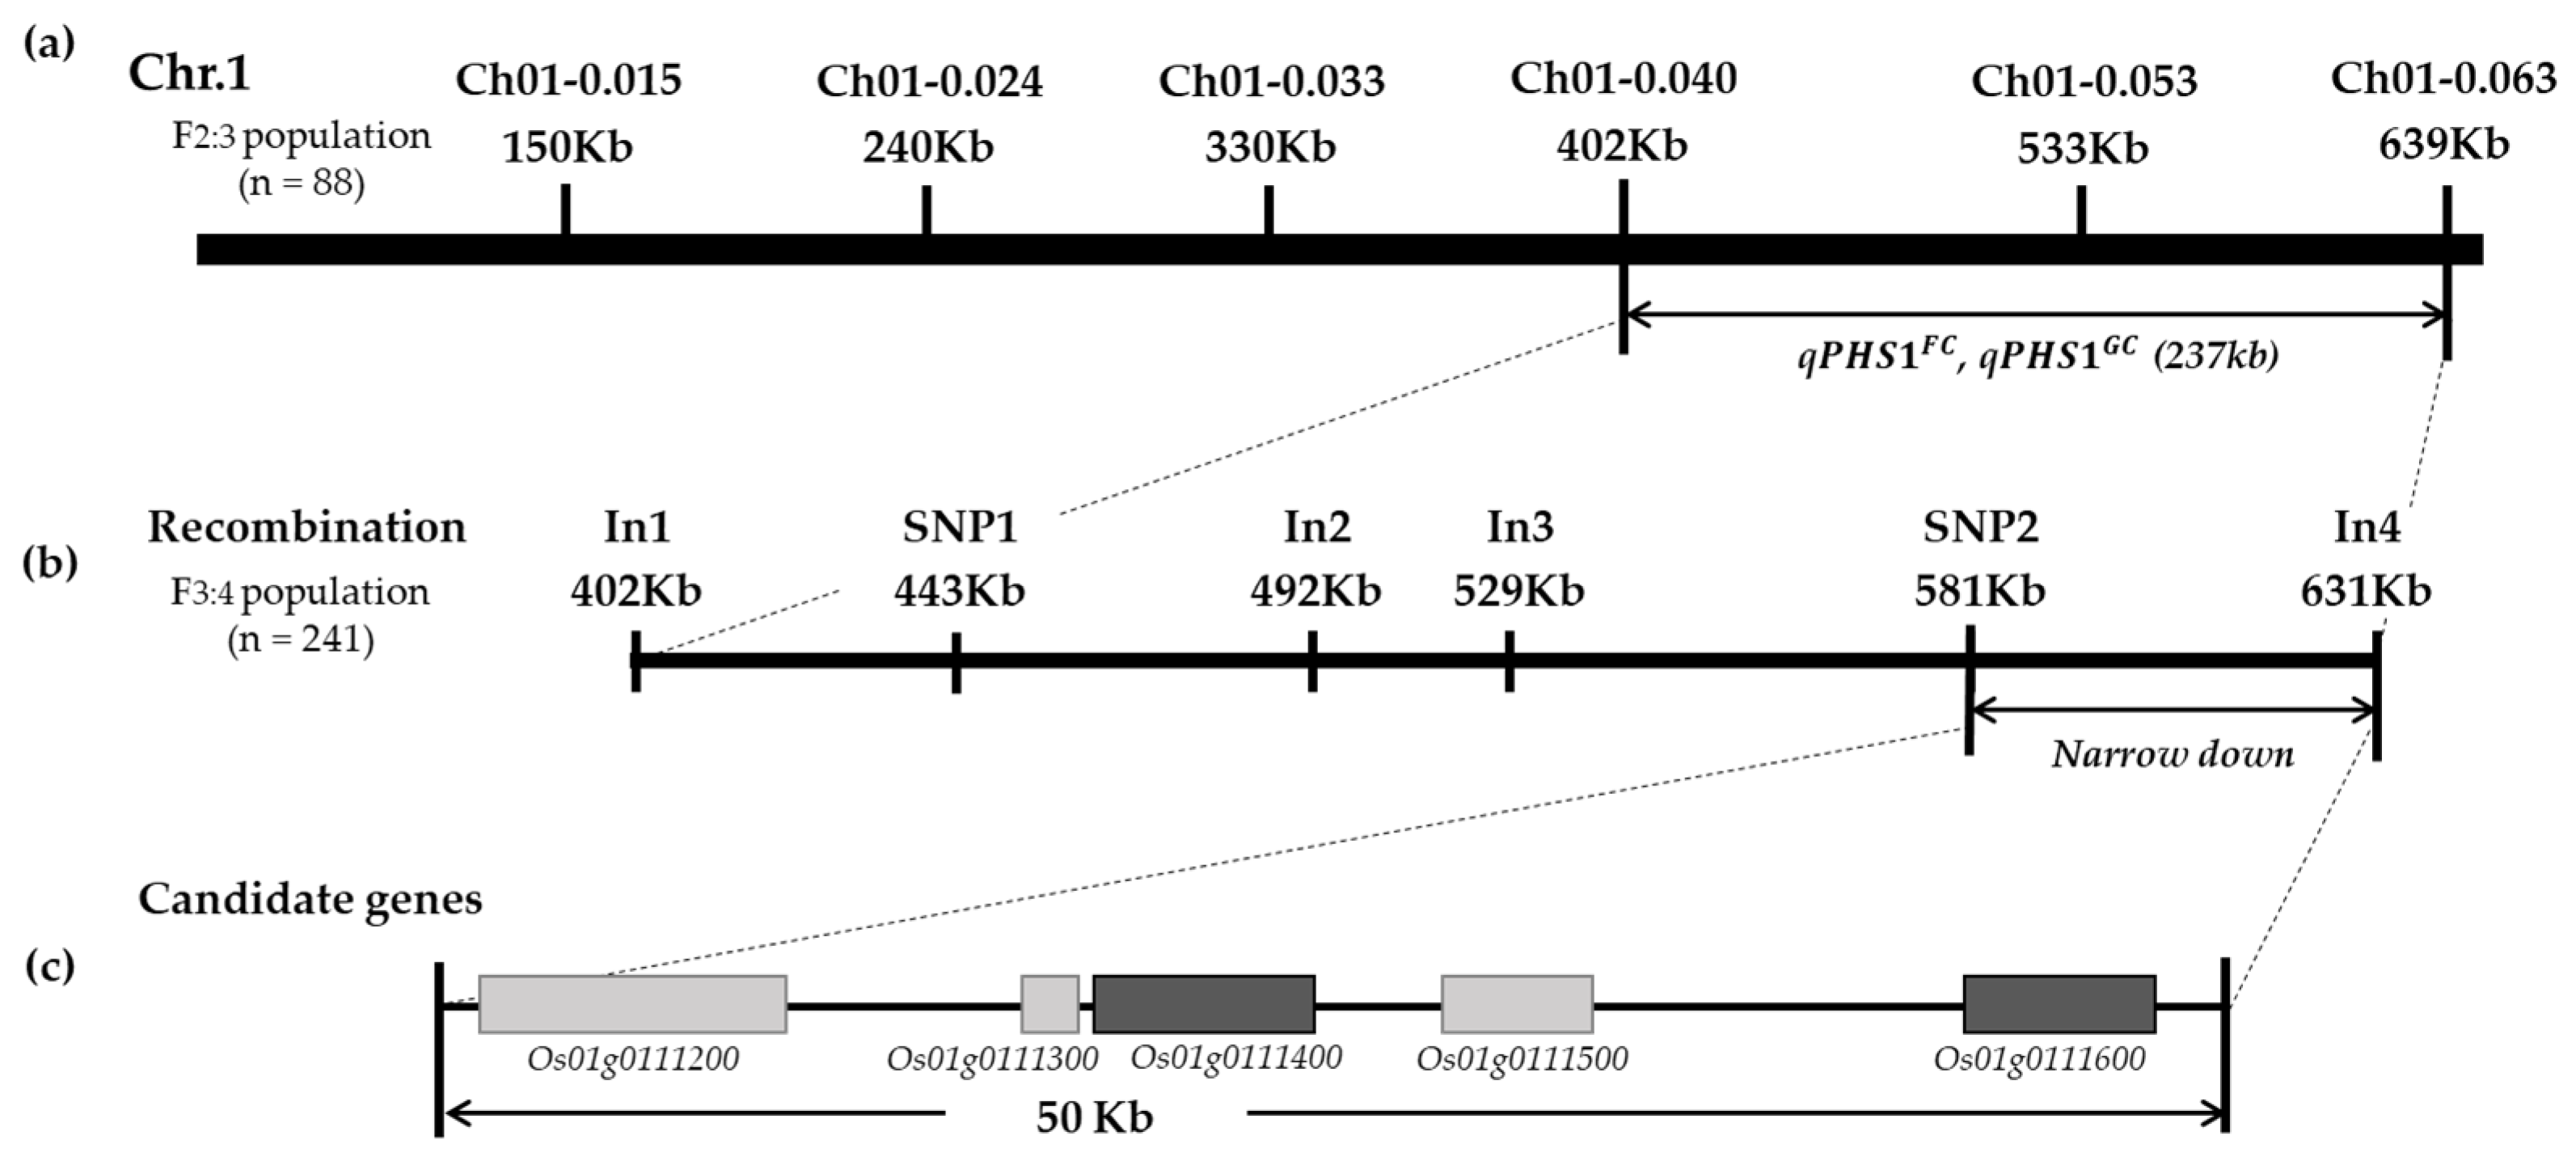
3.1. Fine-Mapping of qPHS1FC and qPHS1GC

In the previous study, the 17 linkage groups were constructed by filtering 376 SNPs from 12,737 SNPs between PHS-T and PHS-S. Under two different conditions, field condition (FC) and GC, two QTLs, i.e., qPHS1FC and qPHS1GC, were detected in the same position under each condition, and this QTL was identified between ch01-0.040 and ch01-0.063 (Figure 2a) [32]. In this QTL, new polymorphic InDel markers and CAPS markers were developed for fine mapping of qPHS1FC and qPHS1GC. To identify the specific genomic regions associated with PHS, the heterozygous F2 plant was selfed to produce a subsequent F3 population. A total of 241 F3 plants were genotyped using InDel (In1–In4) and CAPS (SNP1 and SNP2) markers (Figure 2b and Table S2). Homozygous recombinants in the F3 population were identified using markers and evaluated for PHS resistance. Based on the genotypes and tolerance phenotypes of the homozygous recombinants, a high-resolution map of the qPHS1FC and qPHS1GC locus was established. Through the procedure described above, a candidate region was detected and narrowed down that could be confined between markers SNP2 and In4 (Figure S1). Based on the results of genotype and phenotype assays, narrowed-down regions of qPHS1FC and qPHS1GC were found to be located in the interval between the SNP2 and In4markers, which spanned a 50 Kbp region in the genome sequence. This region contained five predicted genes (Figure 2c).

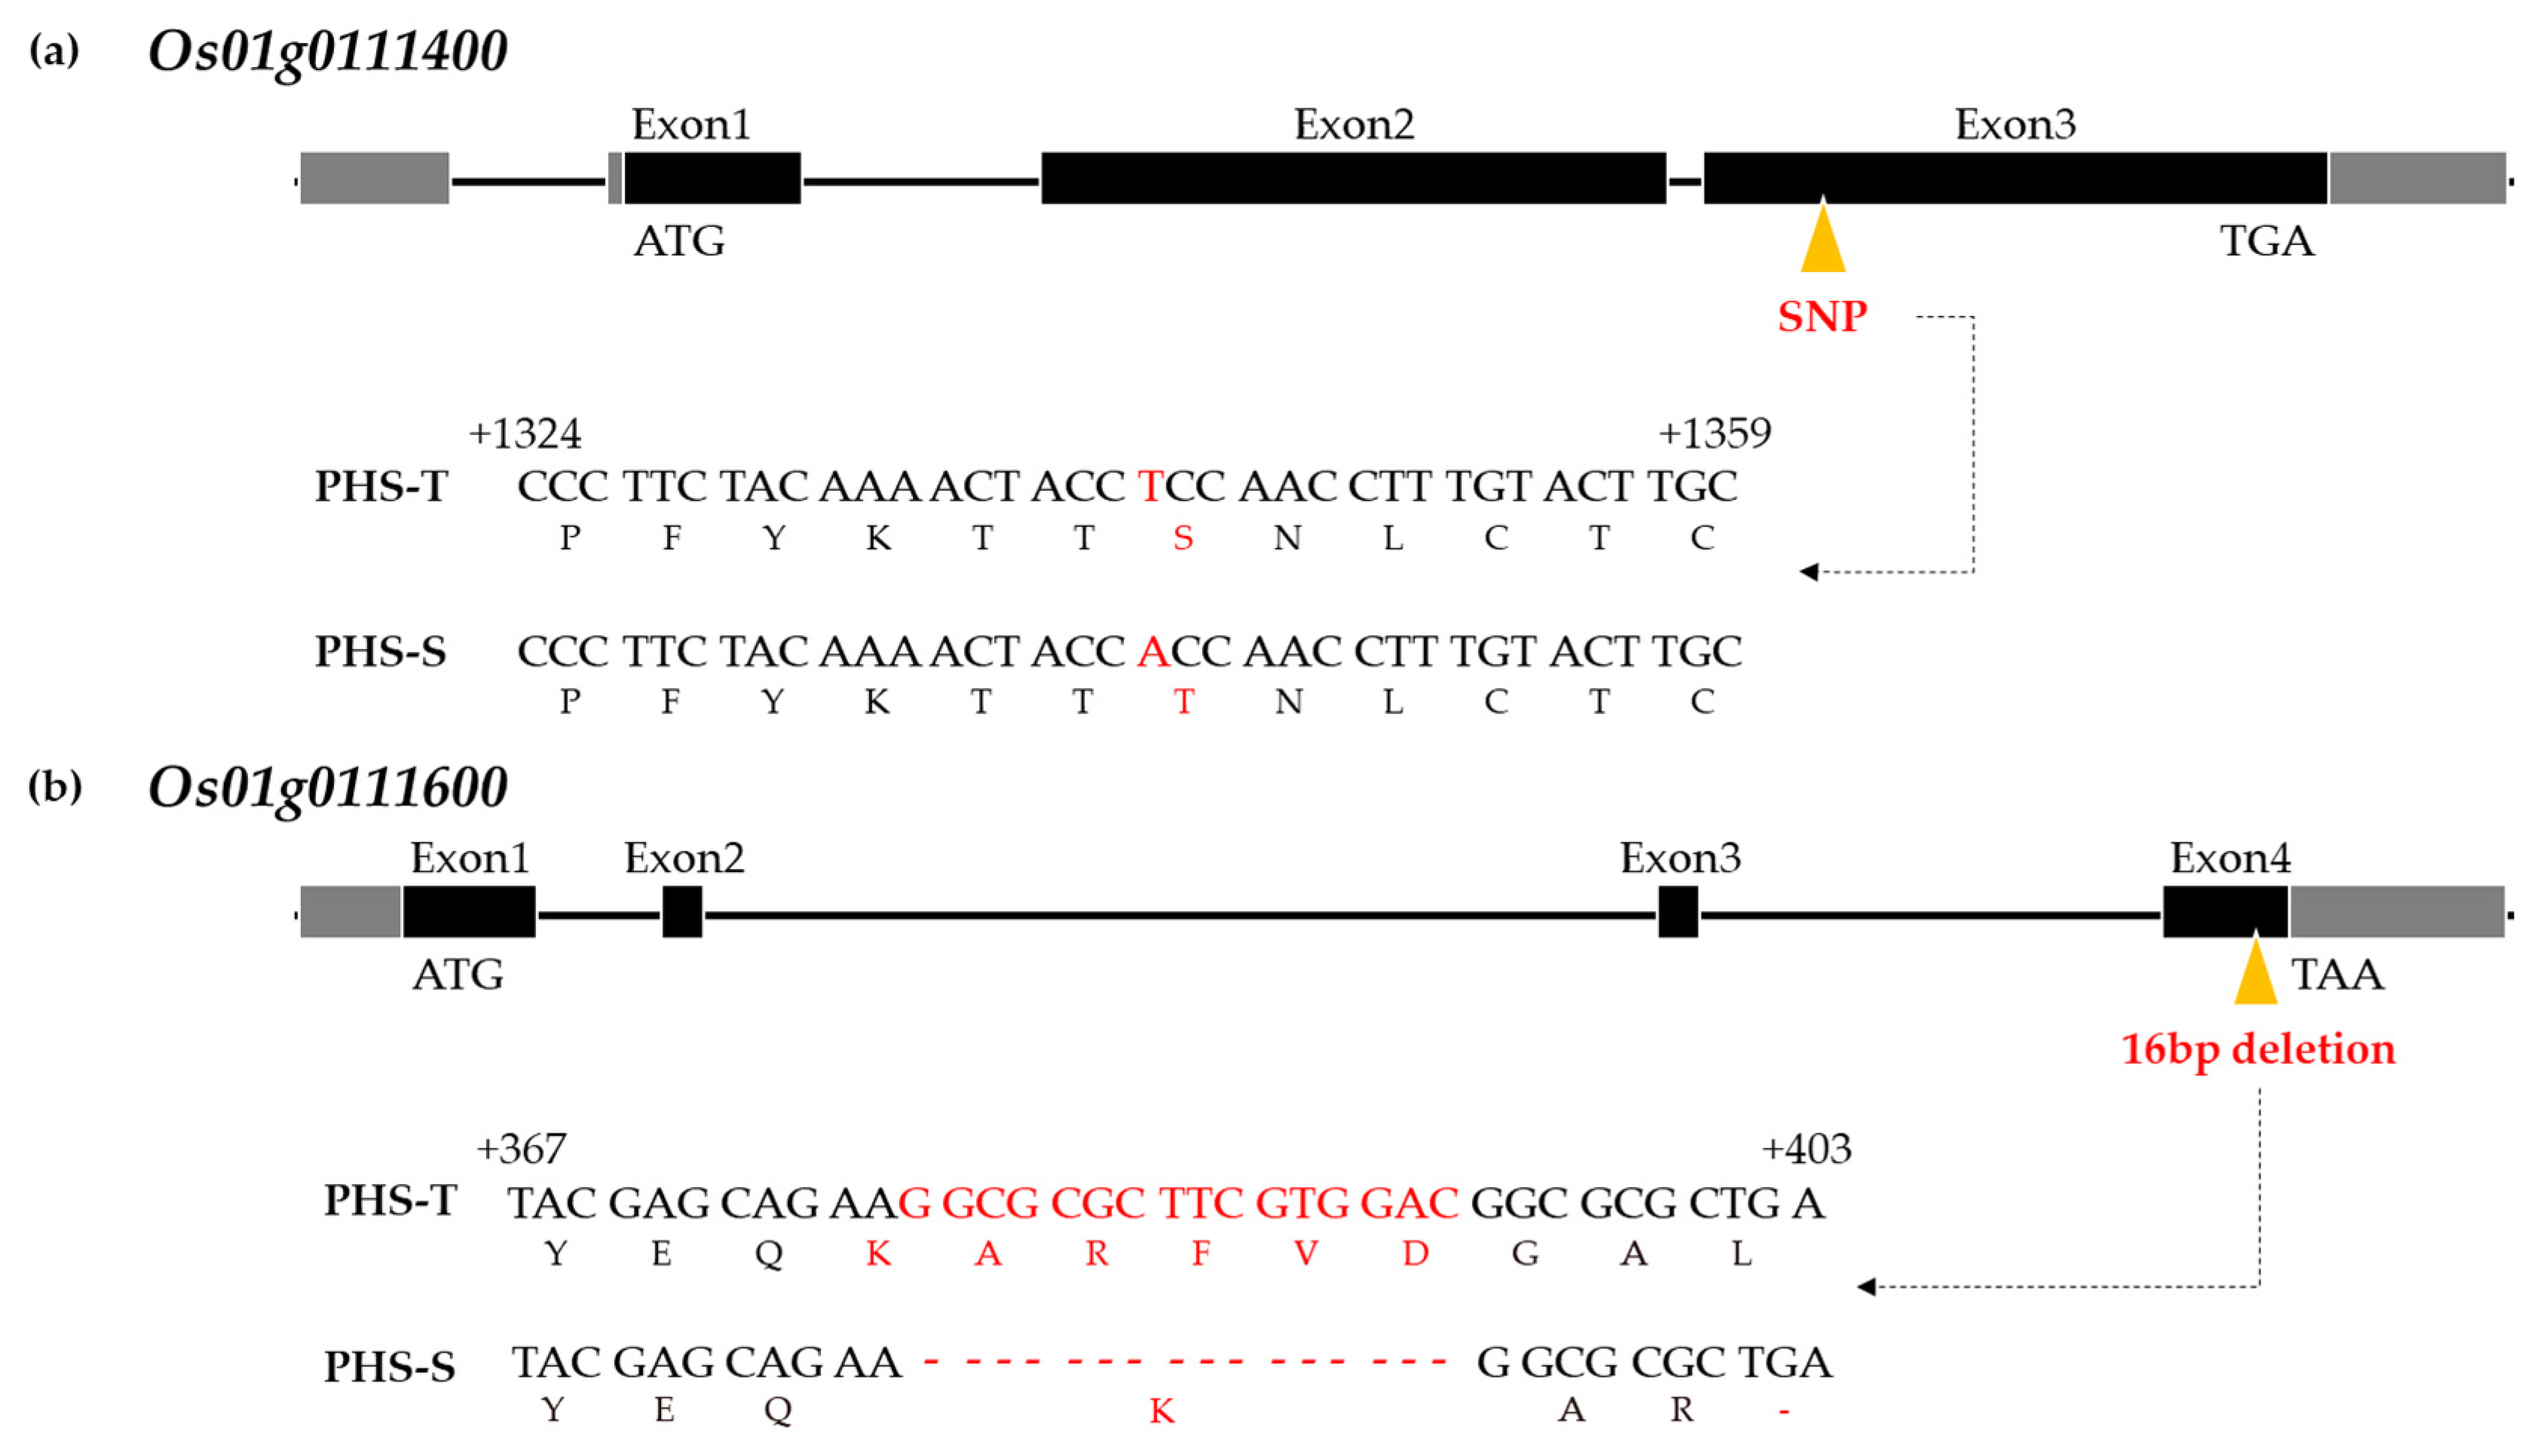
3.2. qPHS1FC and qPHS1GC Candidate Gene Prediction

Among five candidate genes of qPHS1FC and qPHS1GC, three candidate genes, Os01g0111200, Os01g0111300, and Os01g0111500, were monomorphic between PHS-S and PHS-T (Table 1). Therefore, the remaining two genes (Os01g0111400 and Os01g0111600) were cloned and sequenced to detect the respective regions. Os01g0111400 had one SNP between the parents. One SNP in Os01g0111400 was detected in the third exon; the SNP was a T and an A in the PHS-T and PHS-S lines, respectively, and caused an amino acid change from serine to threonine (Figure 3a and Table 1). Os01g0111600 showed a 16 bp deletion region in the fourth exon of PHS-S, giving rise to a stop codon-type of amino acid (Table 1 and Figure 3b).

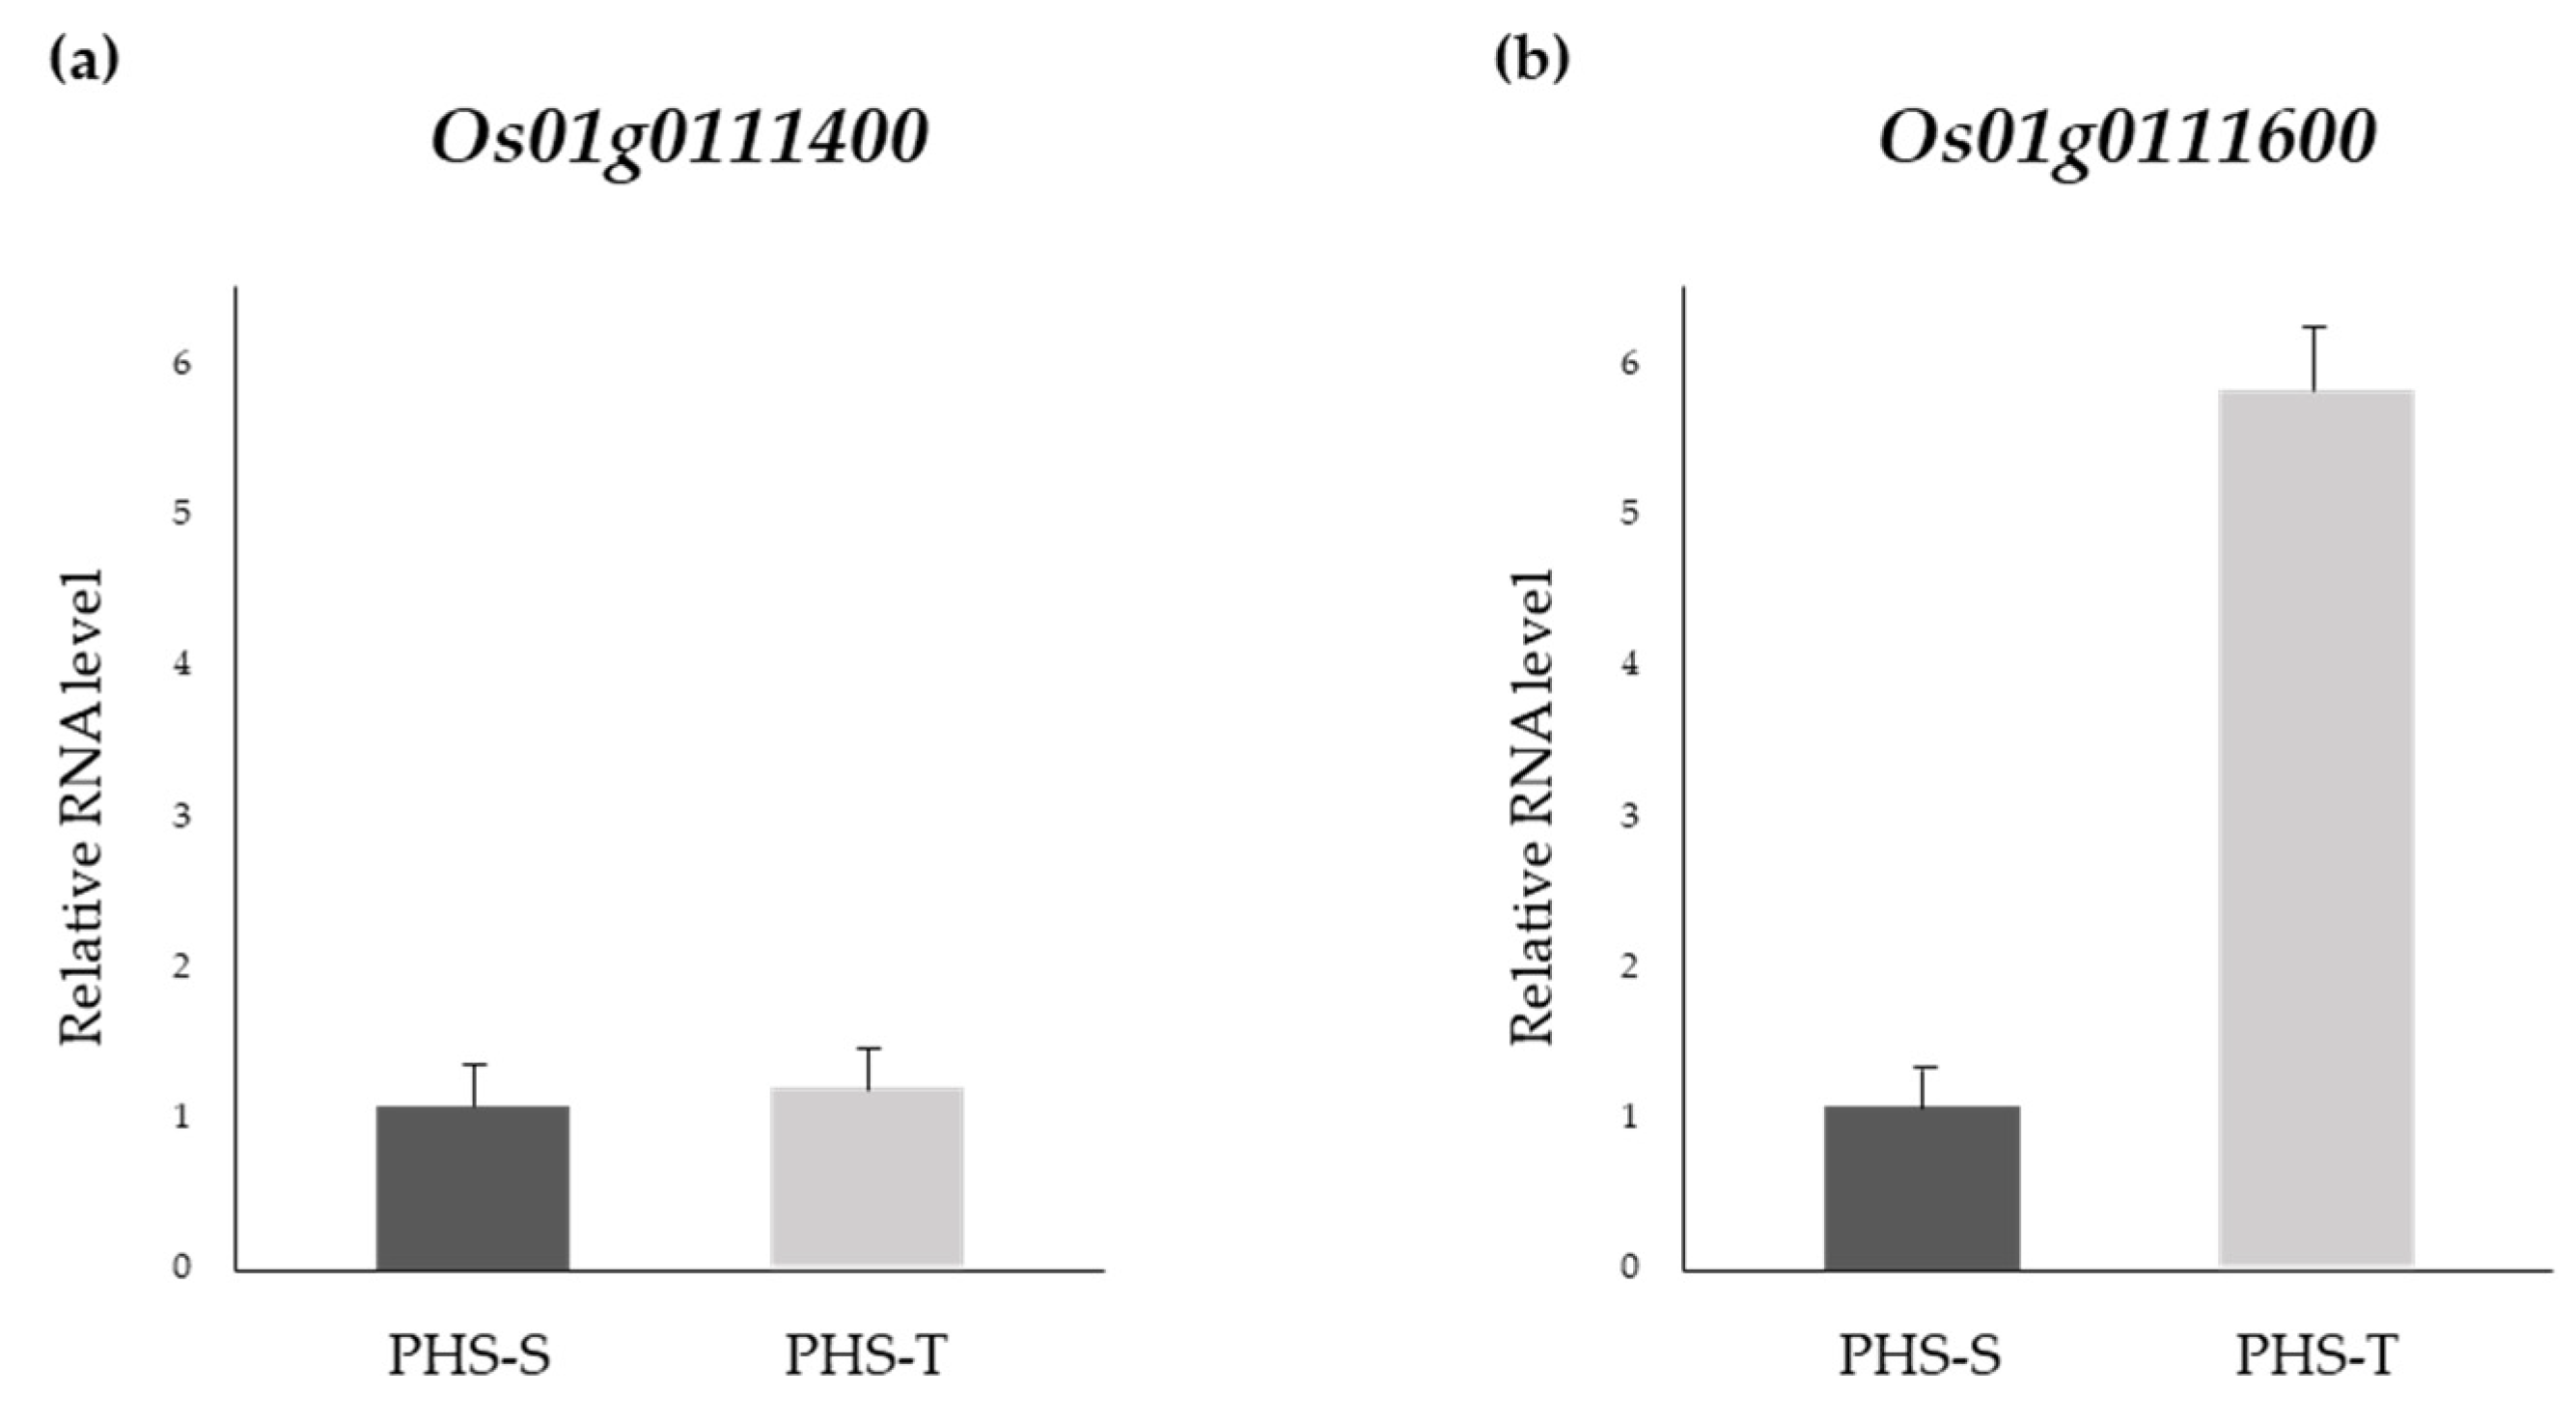
3.3. Expression Patterns of Os01g0111400 and Os01g0111600

Expression analysis was performed to investigate the transcript type of Os01g0111400 and Os01g0111600 in PHS-S and PHS-T during the grain-filling stage. For expression analysis, primers of target genes (Os01g0111400 and Os01g0111600) were designed for qRT-PCR (Table S3). The relative expression level of Os01g0111400 was similar between the two parents (Figure 4a), whereas the relative expression of Os01g0111600 was markedly higher in PHS-T than in PHS-S, and the 16 bp deletion type exhibited reduced expression (Figure 4b). These results suggest that Os01g0111600 acts as a positive regulator of PHS during seed germination rather than Os01g0111400, and the deletion region leads to PHS sensitivity.

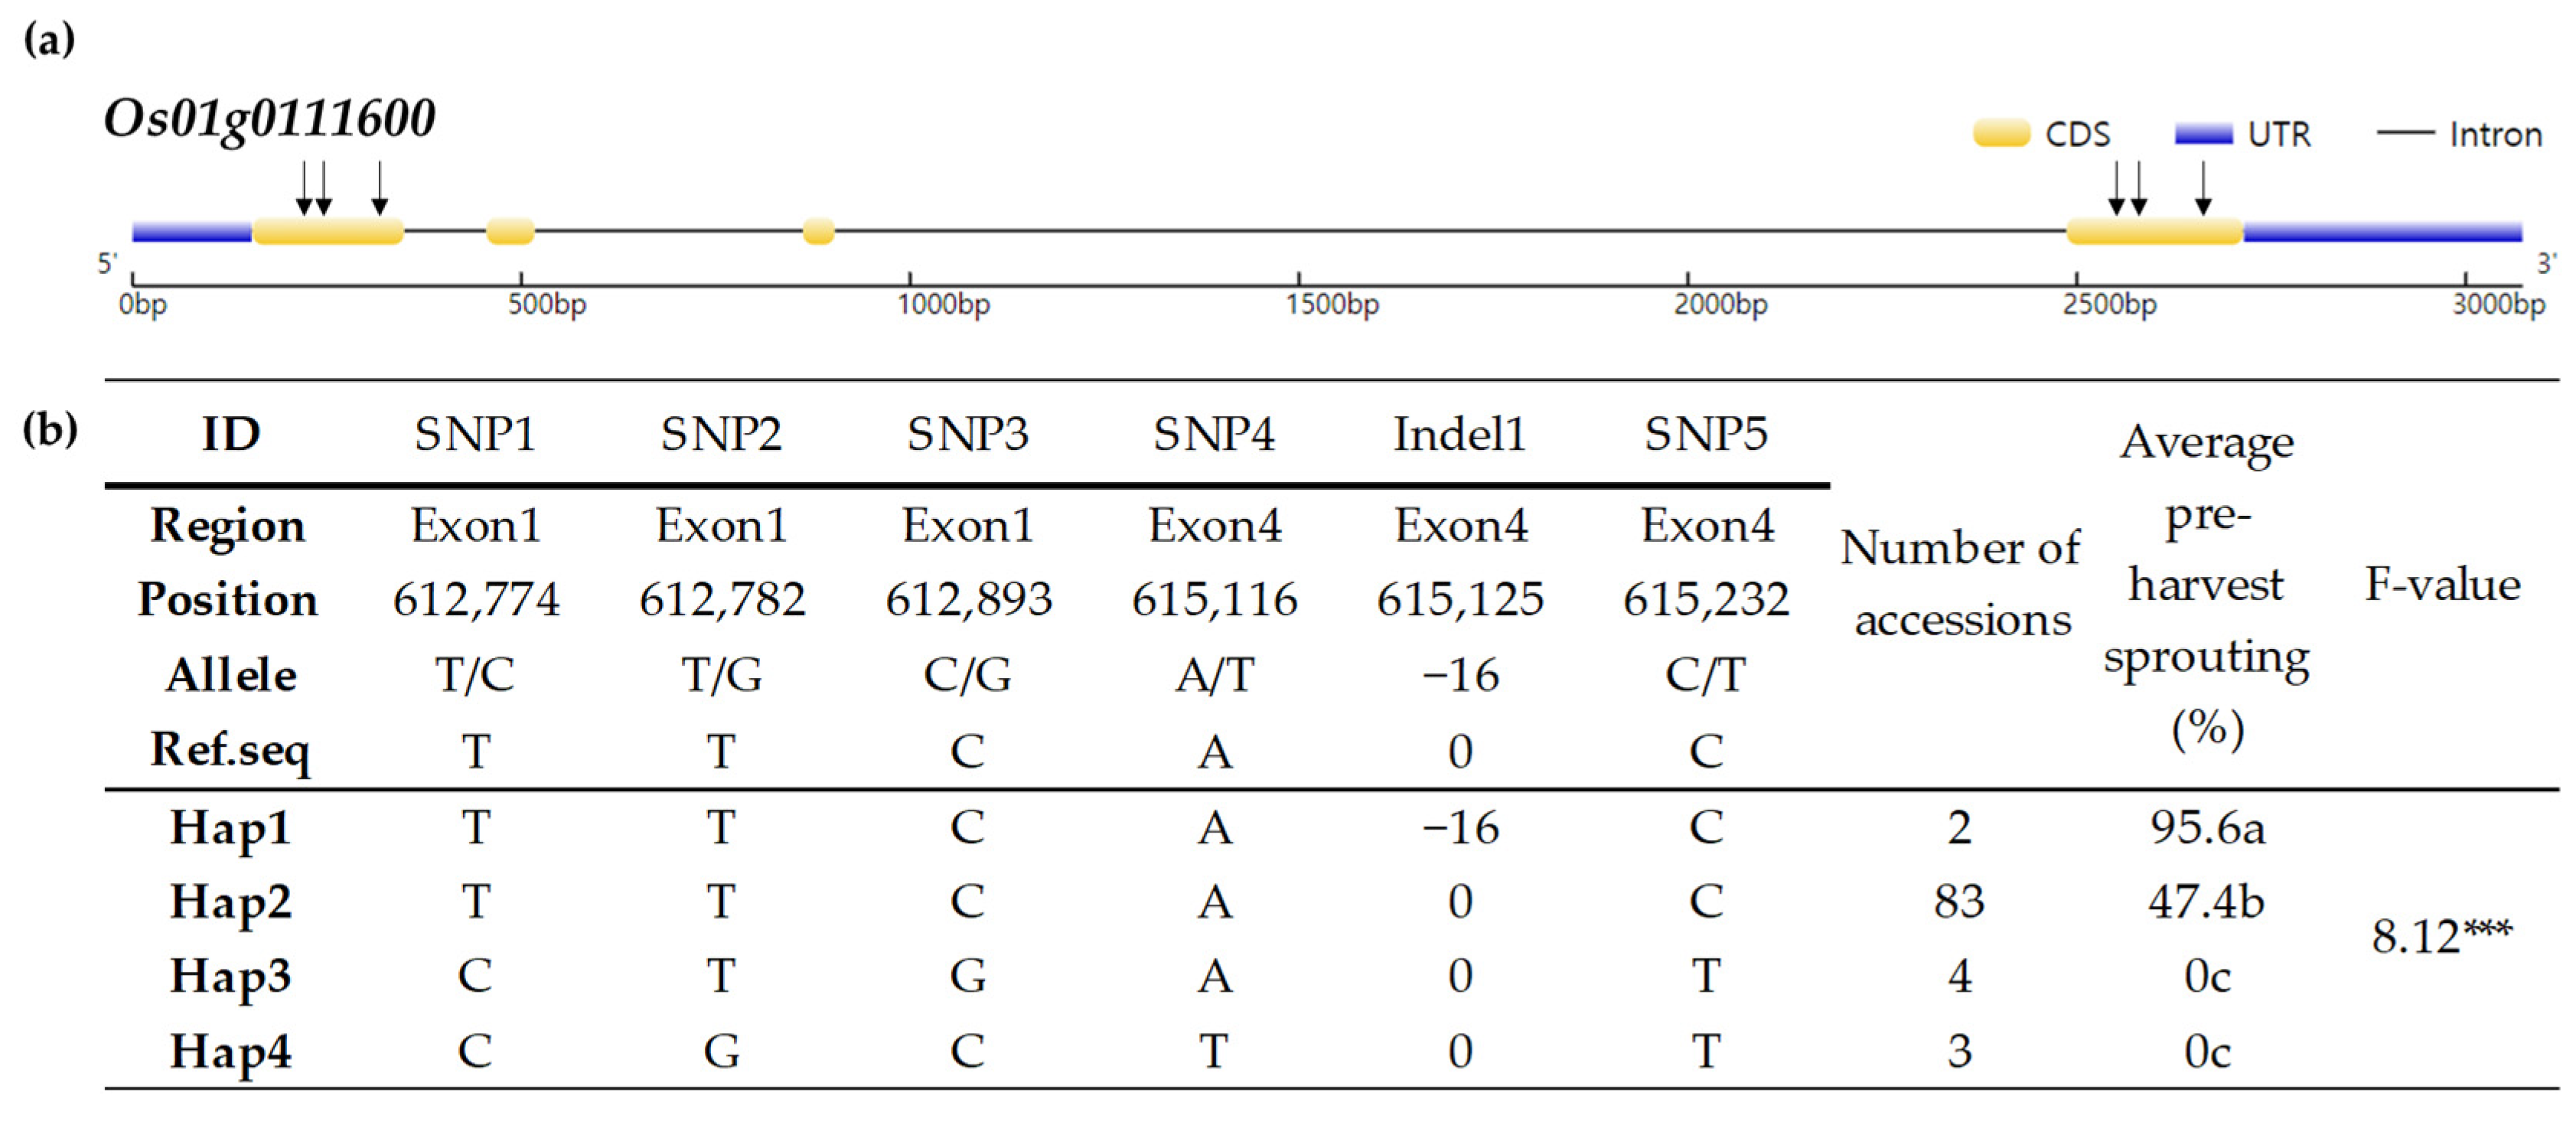
3.4. Haplotype Analysis of Os01g0111600 in Korean-Bred Varieties

Haplotype analysis was performed using genotype data of 92 Korean-bred varieties. The haplotype analysis of Os01g0111400 separated three haplotypes, and the Korean-bred rice varieties with a haplotype with polymorphic SNP had a decreased PHS rate; however, it was not statistically significant (Figure S2). The other candidate gene, Os01g0111600, contained three SNPs in exon 1 and two SNPs and one InDel in exon 4 (Figure 5a). PHS-T and PHS-S were also confirmed to belong to Hap 2 and Hap 1 in Os01g0111600, respectively. Five SNPs and one InDel were divided into four haplotypes, with a maximum phenotypic variation of 95.6% for PHS between Hap 1, Hap 3, and Hap 4 (Figure 5b). In conclusion, InDel 1 in exon 4 caused amino acid changes, which showed significant differences regarding PHS. This gene was identified as a candidate gene for PHS tolerance in Korean-bred varieties (Figure 5b).

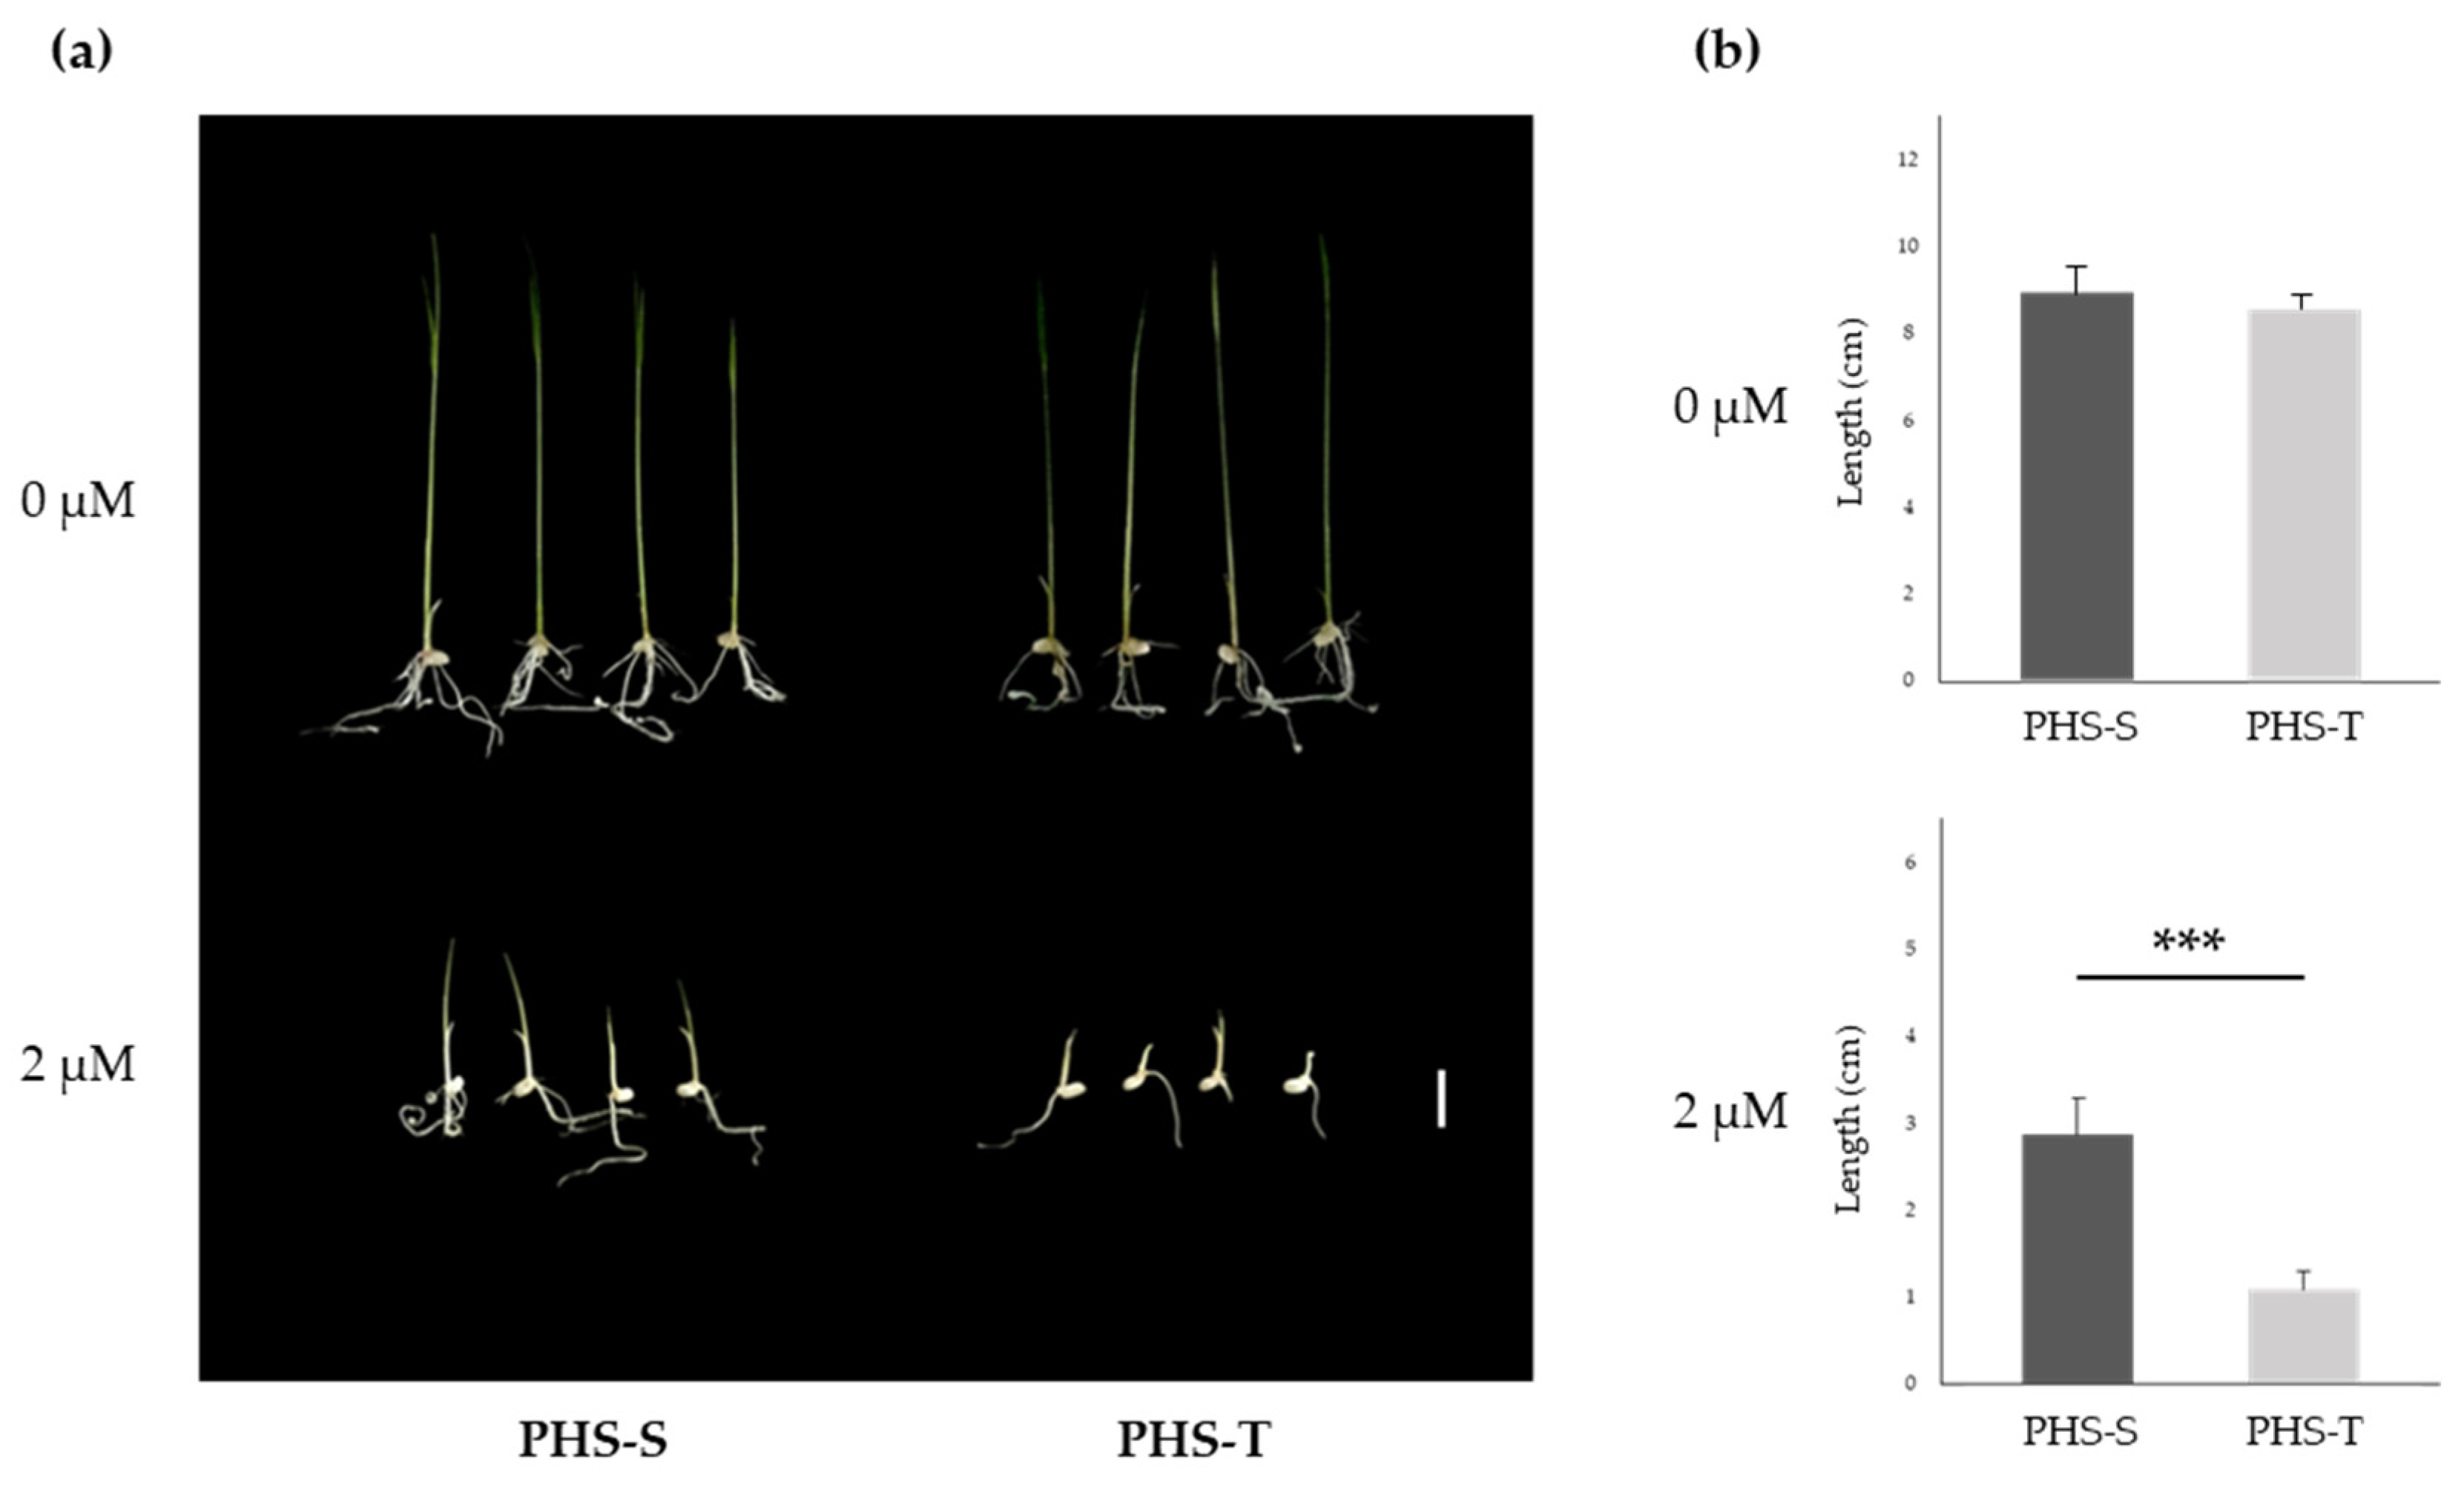
3.5. Response to ABA Treatment of PHS-S and PHS-T

To investigate the effects of ABA on the germination performance of PHS-S and PHS-T, the germination rate under ABA treatment and normal conditions was evaluated using husked full seeds freshly harvested 45 DAF. Under ABA treatment conditions, seeds revealed some delay in germination; among them, the PHS-T showed higher sensitivity to ABA than PHS-S (Figure 6a). Shoot lengths of PHS-S and PHS-T controls (0 µM ABA) were 8.5 and 8.3 cm, respectively, whereas shoot lengths were 2.9 and 0.8 cm, respectively, with 2 µM ABA (Figure 6b). Thus, PHS-T exhibited some delay in germination under ABA treatment conditions, whereas PHS-S showed a relatively lower sensitivity as compared with PHS-T (Figure 6).

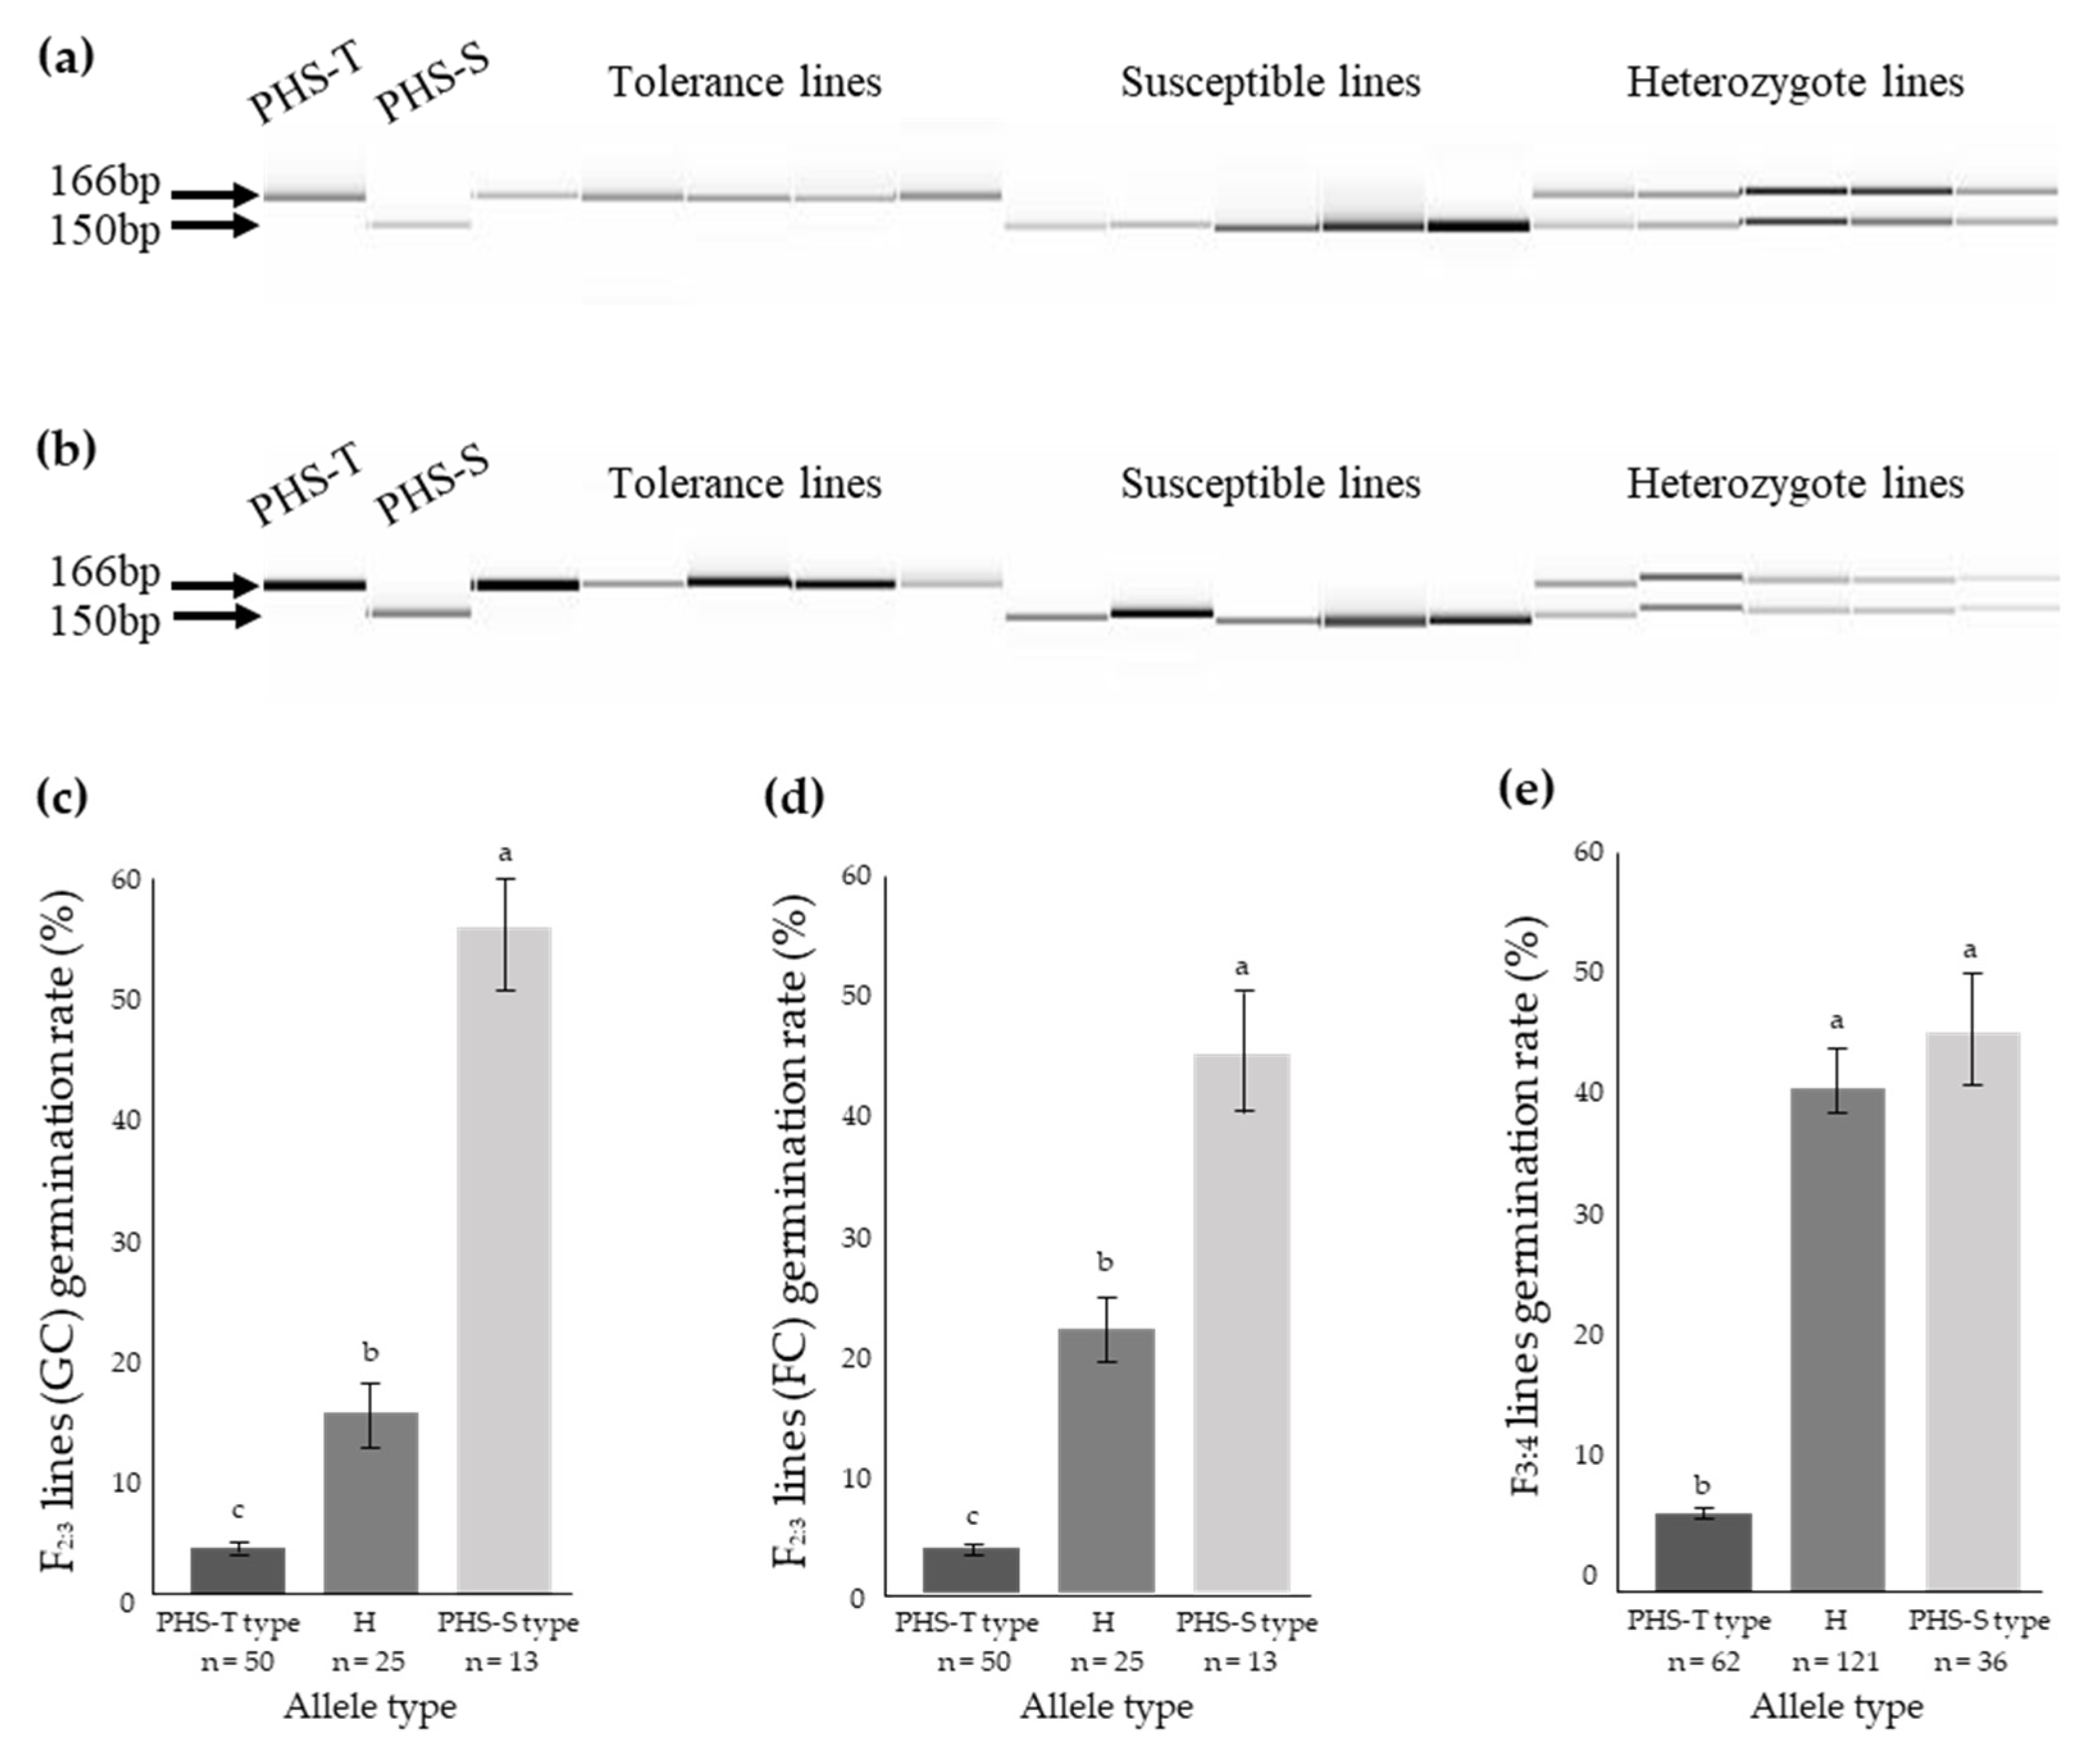
3.6. Co-Segregation between Indel Markers of Os01g0111600 and the PHS Trait

Co-segregation analysis was conducted. The genotypes of the 16bp deletion region of Os01g0111600 and the germination rate under PHS conditions were examined using panicles of F2:3 and F3:4 populations 45 DAF and a 16bp deletion detection marker (Table 2 and Figure 7a,b). The distribution of F2:3 populations under growth chamber conditions showed that most plants were of the PHS-T type, and fewer were of the PHS-S type (Figure 7c). Among F2:3 individuals under growth chamber conditions, the PHS-T type had a lower germination rate than the PHS-S type (Figure 7c). Additionally, F2:3 populations under field conditions showed similar results to the growth chamber conditions (Figure 7d). The F3:4 populations contained more PHS-T type than PHS-S type individuals, and the PHS-T type had a lower germination rate than the PHS-S type (Figure 7e).

4. Discussion

PHS is one of the most important processes regarding rice yield and quality, and it is closely associated with SD, which inhibits seed germination under high humidity and temperature conditions [38]. Regarding traits associated with seed germination, the effects of PHS, SD, and LTG are extremely complex, involving various physical and biochemical factors. These are quantitative traits subject to complex genetic control mechanisms, and germination-associated genes have been reported to be affected by auxin, ABA, and GA levels, which are major signaling molecules involved in germination induction [10].
In order to identify candidate genes associated with the genetic regulation of PHS tolerance, we chose two inbred lines (PHS-T and PHS-S) from F7 RIL and generated a population using PHS-T and PHS-S for analyses. The population in this study was derived from the same parental lines (‘Jingsang’ and ‘Gopum’), and PHS-T and PHS-S were selected to have the same agronomy trait except for the PHS trait in the F7 RIL population. Therefore, we used genotype resequencing because most nucleotide regions showed monomorphic SNPs and InDel regions in PHS-T and PHS-S. Through resequencing analysis, polymorphic SNPs were detected between PHS-T and PHS-S, and filtered SNPs were used to construct the genetic map for the QTL analysis in the previous study [32]. These materials were derived to elaborate mapping and narrow down the QTL region from the fine-mapping analysis in this study.
Os01g0111600 was reported to regulate ABA signaling genes and ABA levels in seed germination [39,40]. The Arabidopsis cytochrome P450 CYP707A gene codes enzymes involved in ABA catabolism. Overexpression of the CYP707A gene resulted in reduced ABA levels and decreased seed dormancy, while knockdown of the gene resulted in increased ABA levels and enhanced seed dormancy. Their findings suggest that the CYP707A gene plays a key role in ABA catabolism and seed dormancy regulation [39]. The NCED5 gene encodes an enzyme involved in ABA biosynthesis in rice seed dormancy. Overexpression of the NCED5 gene led to increased ABA levels and enhanced seed dormancy, while knockout of the gene resulted in decreased ABA levels and reduced seed dormancy. It was also suggested that other members of the NCED gene family also contributed to ABA accumulation and seed dormancy regulation in rice [40]. In a related study, OsMFT2 knockout lines exhibited pre-harvest sprouting, whereas OsMFT2 overexpression lines showed delayed germination [37]. ABA was demonstrated to be highly associated with seed germination, as well as low-temperature germination and dormancy, and the ABA level was determined to be related to delayed or exhibited germination [10,12]. To confirm the functions of candidate genes identified in this study, we evaluated the responses of ABA treatment in each parent plant. After broken seed dormancy of PHS-T and PHS-S, the growing degree of these seeds was compared in the normal micro agar condition and ABA treatment micro agar condition, respectively. PHS-S exhibited reduced ABA sensitivity in seed and post-germination, and PHS-T showed hypersensitivity to ABA in both germination steps, indicating the function of PHS-T in ABA signaling (Figure 6).
For co-segregation analysis, the Os01g0111600-16bp marker was developed to distinguish the 16bp InDel region in the Os01g0111600 from the population in this study. PHS-S type varieties in the population showed an increasing rate of PHS, and PHS-T type varieties showed a decreased tendency compared to the PHS-S type (Figure 7). In the group of Korean-bred rice varieties, those classified as PHS-S types showed an increase in PHS rates (Figure 5). Therefore, using a developed marker from polymorphic InDel regions that affect variance is expected to help to identify PHS tolerance.
In this study, we identified candidate genes that are associated with PHS in the developed populations. A QTL region identified in a previous study was utilized to execute fine-mapping analysis, the Os01g0111600 gene was considered the final candidate gene, and we inferred that a 16bp deletion was the core mutation site associated with PHS rate differences in the two Japonica parents. PHS leads to reduced rice grain quality and yield. We propose that the results of this study constitute an important resource for molecular breeding and for furthering the understanding of rice trait genetics.

5. Conclusions

In this study, PHS was surveyed using PHS-T, PHS-S, and developed populations to identify candidate genes associated with PHS tolerance. New polymorphic InDel markers and CAPS markers were developed for fine mapping, and five candidate genes significantly associated with PHS were identified on chromosome 1. Among these genes, in Os01g0111600, the 16 bp deletion in the fourth exon of PHS-S was detected; it resulted in a premature stop codon. Haplotype analysis revealed that InDel caused significant differences in PHS, and co-segregation analysis indicated that the 16 bp deletion region of Os01g0111600 was significantly correlated with the PHS germination rate. We also observed that PHS-T exhibited higher sensitivity to ABA than PHS-S. Based on our findings, we provided a selection marker associated with PHS in Os01g0111600. This result will enable us to identify the specific genetic variants responsible for the observed differences and enhance our understanding of the genetic basis of the trait, ultimately aiding the development of improved crop yield and quality strategies.

Supplementary Materials

The following supporting information can be downloaded at https://www.mdpi.com/article/10.3390/agronomy13030818/s1. Figure S1. Recombination events and their effects on tolerance phenotypes in qPHS1FC and qPHS1GC genotypes. Figure S2: Haplotype analysis of candidate genes. (a) Schematic representation of the gene structure and SNP positions in Os01g0111400. (b) Results of haplotype analysis of Os01g0111400. Table S1: List of Korean-bred lines for this study. Table S2: Primers used for fine mapping of qPHS1FC and qPHS1GC. Table S3: Primers used for qRT-PCR of candidate genes.

Author Contributions

Conceptualization, S.-W.K.; methodology, T.-H.H., J.L. and I.C.; validation, S.-G.J., B.K. and T.-H.H.; formal analysis, S.-G.J.; investigation, S.-G.J. and B.K.; resources, S.-W.K. and J.L.; data curation and writing—original draft preparation, S.-G.J.; writing—review and editing, B.K., J.L. and I.C.; supervision, project administration, and funding acquisition, S.-W.K. All authors have read and agreed to the published version of the manuscript.

Funding

This research was funded by the Ministry of Agriculture, Food and Rural Affairs (MAFRA), Grant Number 320105-3; and the National Research Foundation of Korea (NRF) funded by Ministry of Education, Science, and Technology, Grant Numbers 2021K1A3A1A61003041 and 2018R1D1A1B07051390.

Institutional Review Board Statement

Not applicable.

Informed Consent Statement

Not applicable.

Data Availability Statement

The data supporting the reported results can be found in the main text and the Supplementary Materials.

Conflicts of Interest

The authors declare no conflict of interest.

References

  1. Gnanamanickam, S.S. Rice and its importance to human life. In Biological Control of Rice Diseases; Progress in Biological Control; Springer Science & Business Media: New York, NY, USA, 2009; Volume 8, pp. 1–11. [Google Scholar]
  2. Lenaerts, B.; Collard, B.C.; Mey, Y.; Demont, M. Global survey data on rice breeders’ characteristics and willingness to adopt alternative breeding methods. Data Brief 2019, 23, 103782. [Google Scholar]
  3. Miao, X.L.; Zhang, Y.J.; Xia, X.C.; He, Z.H.; Zhang, Y.; Yan, J.; Chen, X.M. Mapping quantitative trait loci for pre-harvest sprouting resistance in white-grained winter wheat line CA 0431. Crop Pasture Sci. 2013, 64, 573–579. [Google Scholar]
  4. Fang, J.; Chu, C. Abscisic acid and the pre-harvest sprouting in cereals. Plant Signal. Behav. 2008, 3, 1046–1048. [Google Scholar] [PubMed] [Green Version]
  5. Gubler, F.; Millar, A.A.; Jacobsen, J.V. Dormancy release ABA and pre-harvest sprouting. Curr. Opin. Plant Biol. 2005, 8, 183–187. [Google Scholar] [PubMed]
  6. Chono, M.; Honda, I.; Shinoda, S.; Kushiro, T.; Kamiya, Y.; Nambara, E.; Kawakami, N.; Kaneko, S.; Watanabe, Y. Field studies on the regulation of abscisic acid content and germinability during grain development of barley: Molecular and chemical analysis of pre-harvest sprouting. J. Exp. Bot. 2006, 57, 2421–2434. [Google Scholar] [CrossRef]
  7. Wan, J.M.; Jiang, L.; Tang, J.Y.; Wang, C.M.; Hou, M.Y.; Jing, W.; Zhang, L.X. Genetic dissection of the seed dormancy trait in cultivated rice (Oryza sativa L.). Plant Sci. 2006, 170, 786–792. [Google Scholar]
  8. Tejakhod, S.; Ellis, R.H. Effect of simulated flooding during rice seed development and maturation on subsequent seed quality. Seed Sci. Res. 2008, 28, 72–81. [Google Scholar]
  9. Xu, F.; Tang, J.; Gao, S.; Cheng, X.; Du, L.; Chu, C. Control of rice pre-harvest sprouting by glutaredoxin-mediated abscisic acid signaling. Plant J. 2019, 100, 1036–1051. [Google Scholar]
  10. Sohn, S.I.; Pandian, S.; Kumar, T.S.; Zoclanclounon, Y.A.B.; Muthuramalingam, P.; Shilpha, J.; Satish, L.; Ramesh, M. Seed Dormancy and Pre-Harvest Sprouting in Rice—An Updated Overview. Int. J. Mol. Sci. 2021, 22, 11804. [Google Scholar]
  11. Wu, M.; Wu, J.; Gan, Y. The new insight of auxin functions: Transition from seed dormancy to germination and floral opening in plants. Plant Growth Regul. 2020, 91, 169–174. [Google Scholar]
  12. Du, L.; Xu, F.; Fang, J.; Gao, S.P.; Tang, J.Y.; Fang, S.; Wang, H.; Tong, H.; Zhang, F.; Chu, J.; et al. Endosperm sugar accumulation caused by mutation of PHS8/ISA1 leads to pre-harvest sprouting in rice. Plant J. 2018, 95, 545–556. [Google Scholar] [PubMed] [Green Version]
  13. Debeaujon, I.; Koornneef, M. Gibberellin requirement for Arabidopsis seed germination is determined both by testa characteristics and embryonic abscisic acid. Plant Physiol. 2000, 122, 415–424. [Google Scholar] [PubMed] [Green Version]
  14. Li, B.; Foley, M.E. Genetic and molecular control of seed dormancy. Trends Plant Sci. 1997, 2, 384–389. [Google Scholar]
  15. Gu, X.Y.; Chen, Z.X.; Foley, M.E. Inheritance of seed dormancy in weedy rice. Crop Sci. 2003, 43, 835–843. [Google Scholar]
  16. Chen, C.X.; Cai, S.B.; Bai, G.H. A major QTL controlling seed dormancy and pre-harvest sprouting resistance on chromosome 4A in a Chinese wheat landrace. Mol. Breed. 2008, 21, 351–358. [Google Scholar]
  17. Gu, X.Y.; Foley, M.E.; Horvath, D.P.; Anderson, J.V.; Feng, J.; Zhang, L.; Mowry, C.R.; Ye, H.; Suttle, J.C.; Kadowaki, K.I.; et al. Association between seed dormancy and pericarp color is controlled by a pleiotropic gene that regulates abscisic acid and flavonoid synthesis in weedy red rice. Genetics 2011, 189, 1515–1524. [Google Scholar]
  18. Graeber, K.; Nakabayashi, K.; Miatton, E.; Leubner-Metzger, G.; Soppe, W.J. Molecular mechanisms of seed dormancy. Plant Cell Environ. 2012, 35, 1769–1786. [Google Scholar]
  19. Gao, F.Y.; Ren, G.J.; Lu, X.J.; Sun, S.X.; Li, H.J.; Gao, Y.M.; Luo, H.; Yan, W.G.; Zhang, Y.Z. QTL analysis for resistance to preharvest sprouting in rice (Oryza sativa). Plant Breed. 2008, 127, 268–273. [Google Scholar]
  20. Hori, K.; Sugimoto, K.; Nonoue, Y.; Ono, N.; Matsubara, K.; Yamanouchi, U.; Abe, A.; Takeuchi, Y.; Yano, M. Detection of quantitative trait loci controlling pre-harvest sprouting resistance by using backcrossed populations of japonica rice cultivars. Theor. Appl. Genet. 2010, 120, 1547–1557. [Google Scholar]
  21. Li, W.; Xu, L.; Bai, X.; Xing, Y. Quantitative trait loci for seed dormancy in rice. Euphytica 2011, 178, 427–435. [Google Scholar]
  22. Cai, H.W.; Morishima, H. Genomic regions affecting seed shattering and seed dormancy in rice. Theor. Appl. Genet. 2000, 100, 840–846. [Google Scholar]
  23. Gu, X.Y.; Kianian, S.F.; Foley, M.E. Multiple loci and epistases control genetic variation for seed dormancy in weedy rice (Oryza sativa). Genetics 2004, 66, 1503–1516. [Google Scholar]
  24. Cheon, K.S.; Won, Y.J.; Jeong, Y.M.; Lee, Y.Y.; Kang, D.Y.; Oh, J.; Oh, H.; Kim, S.L.; Kim, N.; Lee, E.; et al. QTL mapping for pre-harvest sprouting resistance in japonica rice varieties utilizing genome resequencing. Mol Genet Genom. 2020, 295, 1129–1140. [Google Scholar]
  25. Mizuno, Y.; Yamanouchi, U.; Hoshino, T.; Nonoue, Y.; Nagata, K.; Fukuoka, S.; Ando, T.; Yano, M.; Sugimoto, K. Genetic dissection of pre-harvest sprouting resistance in an upland rice cultivar. Breed Sci. 2018, 68, 200–209. [Google Scholar] [PubMed] [Green Version]
  26. Sugimoto, K.; Takeuchi, Y.; Ebana, K.; Miyao, A.; Hirochika, H.; Hara, N.; Ishiyama, K.; Kobayashi, M.; Ban, Y.; Hattori, T.; et al. Molecular cloning of Sdr4 a regulator involved in seed dormancy and domestication of rice. Proc Natl Acad Sci. USA 2010, 107, 5792–5797. [Google Scholar]
  27. Ye, H.; Feng, J.; Zhang, L.; Zhang, J.; Mispan, M.S.; Cao, Z.; Beighley, D.H.; Yang, J.; Gu, X.Y. Map-based cloning of seed dormancy1-2 identified a gibberellin synthesis gene regulating the development of endosperm-imposed dormancy in rice. Plant Physiol. 2015, 169, 2152–2165. [Google Scholar]
  28. Lee, J.S.; Chebotarov, D.; McNally, K.L.; Pede, V.; Setiyono, T.D.; Raquid, R.; Hyun, W.J.; Jeung, J.U.; Kohil, A.; Mo, Y. Novel sources of pre-harvest sprouting resistance for japonica rice improvement. Plants 2021, 10, 1709. [Google Scholar]
  29. Zhang, Y.; Miao, X.; Xia, X.; He, Z. Cloning of seed dormancy genes (TaSdr) associated with tolerance to pre-harvest sprouting in common wheat and development of a functional marker. Theor. Appl. Genet. 2014, 127, 855–866. [Google Scholar]
  30. Hong, W.J.; Yoon, M.Y.; Ra, W.H.; Park, J.W.; Min, S.K.; Kwon, S.W.; Cho, Y.H.; Park, Y.A. New variety ‘Jinsang’ with lodging tolerant and low amylose content. Korean J. Breed. Sci. 2014, 46, 103–107. [Google Scholar]
  31. Kang, S.; Shon, J.; Kim, H.S.; Kim, S.J.; Choi, J.S.; Park, J.H.; Yun, Y.H.; Sim, J.; Yang, W. Analysis of genetic variation in pre-harvest sprouting at different cumulative temperatures after heading of rice. Korean J. Crop Sci. 2018, 63, 8–17. [Google Scholar]
  32. Jang, S.G.; Zhang, H.; Lee, A.R.; Lee, J.H.; Kim, N.E.; Park, S.Y.; Lee, J.; Ham, T.H.; Kwon, S.W. Detection of Whole-Genome Resequencing-Based QTLs Associated with Pre-Harvest Sprouting in Rice (Oryza sativa L). Plant Breed. Biotechnol. 2020, 8, 396–404. [Google Scholar] [CrossRef]
  33. Porebski, S.; Bailey, L.G.; Baum, B.R. Modification of a CTAB DNA extraction protocol for plants containing high polysaccharide and polyphenol components. Plant. Mol. Biol. Rep. 1997, 15, 8–15. [Google Scholar] [CrossRef]
  34. Untergasser, A.; Cutcutache, I.; Koressaar, T.; Ye, J.; Faircloth, B.C.; Remm, M.; Rozen, S.G. Primer3—New capabilities and interfaces. Nucleic Acids Res. 2012, 40, 115. [Google Scholar]
  35. Purcell, S.; Neale, B.; Todd-Brown, K.; Thomas, L.; Ferreira, M.A.R.; Bender, D.; Maller, J.; Sklar, P.; Bakker, P.I.W.D.; Daly, M.J.; et al. PLINK: A tool set for whole-genome association and population-based linkage analyses. Am. J. Hum. Genet. 2007, 81, 559–575. [Google Scholar] [PubMed] [Green Version]
  36. Hu, B.; Jin, J.P.; Guo, A.Y.; Zhang, H.; Luo, J.C.; Gao, G. GSDS 20: An upgraded gene feature visualization server. Bioinformatics 2015, 31, 1296–1297. [Google Scholar] [PubMed] [Green Version]
  37. Song, S.; Wang, G.; Wu, H.; Fan, X.; Liang, L.; Zhao, H.; Li, S.; Hu, Y.; Liu, H.; Ayaad, M.; et al. OsMFT2 is involved in the regulation of ABA signaling-mediated seed germination through interacting with OsbZIP23/66/72 in rice. Plant J. 2020, 103, 532–546. [Google Scholar] [CrossRef] [PubMed]
  38. Rodríguez, M.; Barrero, J.M.; Corbineau, F.; Gubler, F.; BenechArnold, R.L. Dormancy in cereals (not too much not so little): About the mechanisms behind this trait. Seed Sci. Res. 2015, 25, 99–119. [Google Scholar]
  39. Kushiro, T.; Okamoto, M.; Nakabayashi, K.; Yamagishi, K.; Kitamura, S.; Asami, T.; Hirai, N.; Koshiba, T.; Kamiya, Y.; Nambara, E. The Arabidopsis cytochrome P450 CYP707A encodes ABA 8’-hydroxylases: Key enzymes in ABA catabolism. EMBO J. 2004, 23, 1647–1656. [Google Scholar] [CrossRef] [Green Version]
  40. Frey, A.; Effroy, D.; Lefebvre, V.; Seo, M.; Perreau, F.; Berger, A.; Sechet, J.; To, A.; North, H.M.; Marion-Poll, A. Epoxycarotenoid cleavage by NCED5 fine-tunes ABA accumulation and affects seed dormancy and drought tolerance with other NCED family members. Plant J. 2012, 70, 501–512. [Google Scholar]
Figure 1. Process of developing the plant material in this study.
Agronomy 13 00818 g001
Figure 2. Fine-mapping of qPHS1FC and qPHS1GC. (a) Physical map of the qPHS1FC and qPHS1GC locus using F2:3 plants. (b) High-resolution mapping of the qPHS1FC and qPHS1GC locus using F3:4 plants. (c) Candidate genes of qPHS1FC and qPHS1GC. Black blocks indicate candidate genes with SNPs or InDel polymorphisms.
Agronomy 13 00818 g002
Figure 3. Gene structure and cDNA sequence comparison. (a) Os01g0111400 structure and cDNA sequence comparison. (b) Os01g0111600 structure and cDNA sequence comparison. The black and grey block and yellow vertical lines indicate exons, untranslated regions, and SNPs, respectively.
Agronomy 13 00818 g003
Figure 4. Expression analysis of candidate genes. (a) Os01g0111400 expression in PHS-S and PHS-T 45 days after flowering. (b) Os01g0111600 expression in PHS-S and PHS-T at 45 days after flowering. Values were normalized against the level of OsAct1. Error bars represent standard deviations (n = 3).
Agronomy 13 00818 g004
Figure 5. Haplotype analysis of Os01g0111600. (a) Schematic representation of the gene structure and SNP positions in Os01g0111600. (b) Results of haplotype analysis of Os01g0111600. Yellow and blue blocks and gray lines indicate exons, untranslated regions, and intron regions, respectively. Black vertical bars represent SNPs and InDel regions. Hap: haplotype. Letters a, b, and c represent significant differences at *** p < 0.001 (Duncan’s test).
Agronomy 13 00818 g005
Figure 6. The response of PHS-S and PHS-T to ABA treatment during seed germination and post-germination stages. (a) Performance of PHS-T and PHS-S under untreated and 2 µM ABA treatment. Scale bars: 1 cm. (b) Shoot length of PHS-T and PHS-S under untreated and 2 µM ABA treatment. Error bars indicate standard deviations, n ≥ 10, *** p < 0.001 (Duncan’s test).
Agronomy 13 00818 g006
Figure 7. Co-segregation analysis of the Os01g0111600-16bp InDel marker using a fragment analyzer in F2:3 and F3:4 populations. Tolerance type: 166 bp; susceptible type: 150 bp. (a) Co-segregation analysis of the OS01g0111600-16bp InDel marker in the F2:3 population. (b) Co-segregation analysis of the OS01g0111600-16bp InDel marker in the F3:4 population. (c) Pre-harvest sprouting rate of the PHS-T type in the F2:3 populations under growth chamber conditions. (d) Pre-harvest sprouting rate of the PHS-T type in the F2:3 populations under field conditions. (e) Pre-harvest sprouting rate of the PHS-T type in the F3:4 populations under growth chamber conditions. PHS-T type, H, PHS-T type, and n indicate the reference type, heterozygote, 16bp deletion type, and number, respectively. GC and FC represent growth chamber and field conditions, respectively. Letters a, b, and c represent significant differences at p < 0.001 (Duncan’s test).
Agronomy 13 00818 g007
Table 1. Candidate genes for the qPHS1GC and qPHS1FC.
Gene NameLength of CDS (bp)Putative FunctionReported GeneSequence Variation
Os01g01112001863Expressed protein No variation
Os01g0111300162Expressed protein No variation
Os01g01114002106Transposon protein 1 SNP: T → A caused
Ser → Thr
Os01g0111500888Regulation of root hair developmentOsbHLH125
OsRSL1
No variation
Os01g0111600525Regulation of ABA signaling-mediated seed germinationOsMFT21 InDel: 16 bp deletion caused stop codon
Table 2. Primer used for co-segregation analysis of Os01g0111600.
Marker NameTypeForward Primer (5′-3′)Reverse Primer (5′-3′)PHS-T-Type (bp)PHS-S-Type (bp)
Os01g0111600-16bpInDelGGTGGGGATACACAGGTACGCCTCTGGGAGTTGAAGTGGA166150
Disclaimer/Publisher’s Note: The statements, opinions and data contained in all publications are solely those of the individual author(s) and contributor(s) and not of MDPI and/or the editor(s). MDPI and/or the editor(s) disclaim responsibility for any injury to people or property resulting from any ideas, methods, instructions or products referred to in the content.

