Article

Spatial Variation in Soil Base Saturation and Exchangeable Cations in Tropical and Subtropical China

1
State Key Laboratory of Soil and Sustainable Agriculture, Institute of Soil Science, Chinese Academy of Sciences, Nanjing 210008, China
2
University of Chinese Academy of Sciences, Beijing 100049, China
3
Cultivated Land Quality Monitoring and Protection Center, Ministry of Agriculture and Rural Affairs, Beijing 100125, China
*
Author to whom correspondence should be addressed.
Agronomy 2023, 13(3), 781; https://doi.org/10.3390/agronomy13030781
Submission received: 19 January 2023 / Revised: 28 February 2023 / Accepted: 2 March 2023 / Published: 8 March 2023
(This article belongs to the Special Issue Cultivated Land Sustainability in the Anthropocene)

Abstract

:
In the last 30 years, severe soil acidification has been found in China due to acid deposition and nitrogen fertilizer overuse. Understanding the spatial pattern and vertical variations in base saturation percentage (BSP) and exchangeable cations (Ca2+, Mg2+, K+, Na+, H+ and Al3+) can directly benefit fertilization management and ecological protection. Here, 1253 soil profiles were surveyed in tropical and subtropical regions in China to investigate the spatial variations in BSP and exchangeable cations at three soil depths of 0–20 cm, 20–50 cm and 50–100 cm. The spatial distributions were interpolated by using advanced machine learning techniques. We found that the exchangeable Ca2+ (Exch. Ca), Mg2+ (Exch. Mg) and BSP were significantly higher in paddy fields and uplands than in forests and gardens, regardless of soil depth, while the exchangeable K (Exch. K) did not significantly differ between various land-use types. The Exch. Ca and BSP in Anthrosols were significantly higher than those in Ferrosols, Argosols and Cambosols in the three soil layers. The spatial prediction results indicated that exchangeable cations and BSP were generally characterized by strong heterogeneity, and the Exch. Ca, Exch. K and exchangeable H+ (Exch. H) contents and BSP declined with increasing soil depth. This study helps us understand the spatial variation in BSP and exchangeable cations in the study area and benefits fertilization management and environmental protection.

1. Introduction

Base saturation percentage (BSP), which is the total of four exchangeable base cations (Ca2+, Mg2+, K+, and Na+) relative to cation exchange capacity (CEC), is a crucial chemical index for assessing soil fertility [1,2]. A higher BSP indicates better nutrient availability in the soil, while a lower BSP is an indication of soil acidification [1,3]. BSP is directly influenced by the concentrations of exchangeable Ca2+ (Exch. Ca), Mg2+ (Exch. Mg), K+ (Exch. K), Na+ (Exch. Na), H+ (Exch. H) and Al3+ (Exch. Al). Exchangeable base cations play an important role in maintaining soil nutrients, providing essential nutrients for plant growth [4,5,6] and buffering soil acidification [7]. Deficiencies in Ca, Mg and K inhibit crop growth and thus indirectly affect crop yield and food quality [8,9]. The sum of Exch. H and Exch. Al is referred to as the amount of exchangeable acid, and high concentrations of exchangeable acids act as an important indicator of soil acidification. Aluminum toxicity in acidic soils can prevent plants from absorbing nutrients and functioning properly, which can result in the decline of forests, subpar crop development, and even decreased harvests [10,11,12,13,14]. China’s total fertilizer application increased from 1.27 × 10¹⁰ kg to 5.25 × 10¹⁰ kg between 1980 and 2020 [15]. Long-term fertilizer application has greatly increased food production, but it has also caused environmental problems such as soil acidification [16] and soil salinization [17], changing the content and composition of exchangeable cations in the soil and affecting soil fertility. BSP and exchangeable cations are important indicators of soil fertility and soil buffering capacity, and it is necessary to study their spatial and vertical distribution characteristics.
Recent studies have shown that climatic conditions, soil conditions and human activities impact the amount and spatial distribution of BSP and exchangeable cations [18,19,20,21,22,23,24]. Base cation leaching and a decrease in BSP are caused by acid rain [19] and nitrogen deposition [25]. The distribution of BSP and exchangeable cations varies under different parent materials [24], land-use types, soil types and soil depths [18,23]. The excessive application of nitrogen fertilizers will accelerate the loss of base cations, leading to the acidification of agricultural soils [20,21,22]. Nevertheless, the reasonable application of inorganic fertilizer and organic fertilizer effectively promote the accumulation of exchangeable base cations in soil and the consumption of exchangeable acids, especially Exch. Ca and Exch. Al [26,27,28].
Compared with traditional soil mapping, digital soil mapping (DSM) is cost effective and less time consuming, and the generated soil map is expressed by raster data, which can more accurately express the spatial variation of soil properties [29,30]. DSM is a soil survey and mapping method based on the soil-landscape hypothesis and spatial analysis and mathematical modeling [30]. The soil-landscape model was first proposed by Jenny [31], and then McBratney et al. [32] summarized previous studies and proposed SCORPAN model (soil, climate, organisms, topography, parent material, age and space), which is widely used in DSM. In recent decades, statistical methods, geostatistical methods and machine learning have been the most widely used methods for the spatial interpolation of soil properties [30]. Nevertheless, little attention has been given to BSP or exchangeable cations, and thus, our understanding of the spatial variations in these critical soil properties remains limited. Hengl et al. [33] compared random forest (RF) with linear regression for producing soil maps of exchangeable cations in African soils, in which the cross-validation results showed that the RF model was better. Song et al. [34] analyzed the spatial variability of BSP with regard to land use and parent materials in southeastern China, and the geostatistical method was adopted to generate the soil maps of BSP at the 0–20 cm and 20–40 cm depths. The authors found that the BSP in paddy fields was significantly higher than that in forests and uplands at both depths (p < 0.001). At present, most of these studies have focused on topsoils [35,36,37,38], and little attention has been given to subsoils, which may be helpful for improving our understanding of the effect of long-term fertilization spatial variation in BSP and exchangeable cations by comparing the topsoil properties of interest with those of the weathered layer (C-horizon). Furthermore, producing three-dimensional (3D) digital soil maps of these soil properties can provide support for filling gaps in deep soil data.
A number of 3D digital soil mapping techniques have been proposed to predict the 3D spatial distribution of soil properties at fixed depths and vertically variable patterns [39,40,41,42,43,44,45]. Grimm et al. [39] used RF to predict the spatial distribution of soil organic carbon (SOC) at 0–10 cm, 10–20 cm, 20–30 cm, and 30–50 cm in Barro Colorado Island, Panama. Veronesi et al. [40] combined polynomial and ordinary kriging models to predict the 3D spatial distribution of soil compaction. Hengl et al. [41] used regression models to predict the 3D spatial distribution of soil properties such as SOC and pH at six standard depths at the global scale. Rentschler et al. [44] compared four depth functions using nonlinear machine learning techniques and concluded that the use of exponential depth functions and random forests are well suited for 3D SOC stock modeling. These studies have provided a wide range of depth functions for 3D digital soil mapping, and we can choose the appropriate functions in conjunction with our own research. In the tropical and subtropical regions of China, due to the unique monsoon climate and the large-scale application of nitrogen fertilizers, the leaching of soil is relatively strong. The loss of base cations and the high enrichment of Exch. H and Exch. Al in this area have significantly reduced the soil fertility and caused serious soil acidification [46]. BSP and exchangeable cations are important chemical indicators of soil fertility. Studying their spatial variability in this region and conducting 3D digital soil mapping are especially necessary for assessing current and potential soil productivity in acidified soils and improving the quality of agricultural products.
In this paper, the effects of environmental changes and long-term fertilization on the spatial variations in BSP and exchangeable cations were investigated in tropical and subtropical China. The main objectives of this study were to (1) investigate the differences in BSP and exchangeable cations regarding land use and soil types at soil depths of 0–20 cm, 20–50 cm and 50–100 cm and (2) evaluate the predictive performance of multiple linear regression (MLR), geographically weighted regression (GWR) and random forest (RF) for the soil mapping of these soil properties.

2. Materials and Methods
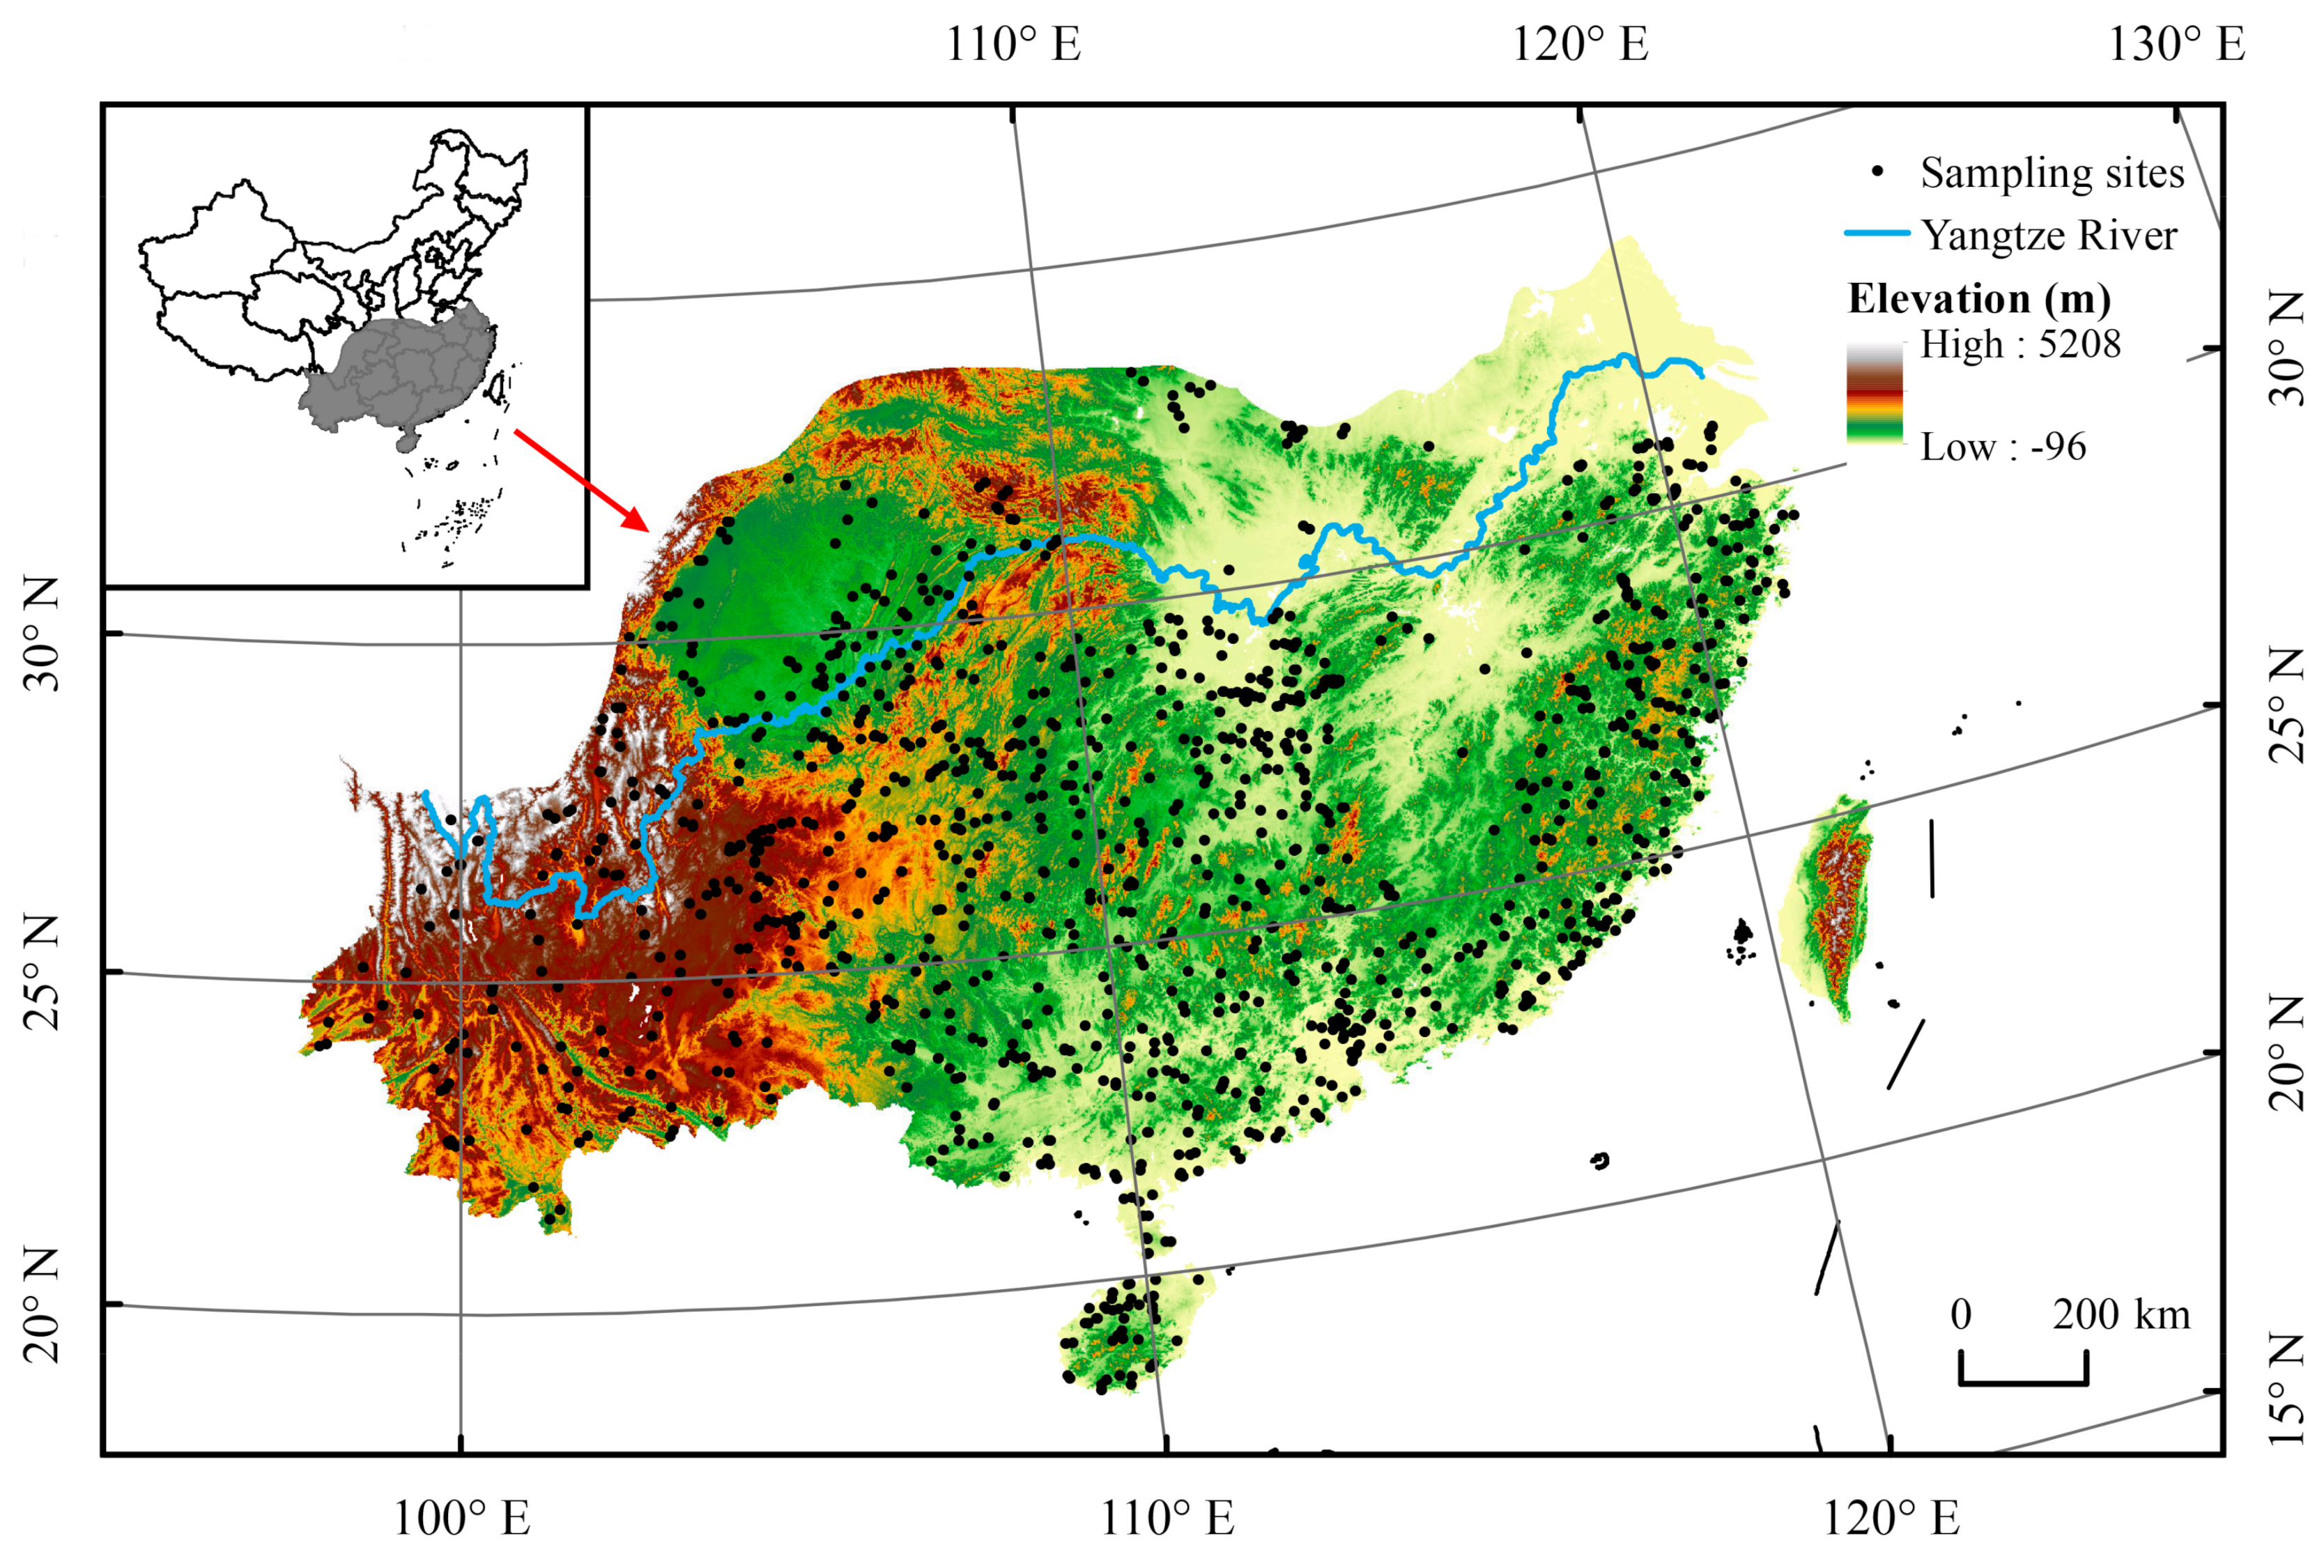
2.1. Study Area

The study was conducted in the subtropical and tropical region of China, which covers an area of approximately 2.38 × 10⁶ km2 and lies between latitudes 97°26′ and 122°22′E and longitudes 18°11′ and 34°0′N (Figure 1). The mean annual air temperature (MAAT) in the region ranges from 3.1 to 25.8 °C, and the mean annual precipitation (MAP) ranges from 489 to 2763 mm. This region’s elevation ranges from −96 to 5208 m, and its average slope is 8.8%. The northern subtropical zone is located north of the Yangtze River and south of the Qinling-Huaihe line, with a wide distribution of plains and low hills. The range of the middle subtropical zone is very large and the topography is relatively diverse, with the plateaux, mountains, hills and basins being staggered throughout. The region includes the Yunnan Plateau and the Guizhou Plateau, and the largest plain is that of Sichuan Basin. Mountains and hills are widely distributed in the southern subtropics, while the plain area is less so, with the largest plain area being the Pearl River Delta. The tropical region, which is dominated by islands, covers a small area, accounting for only 1% of the total area of China. The main land-use types in this area include forest, garden, grassland, paddy field and upland, and the main soil types are Anthrosols, Ferrosols, Argosols, Cambosols and Primosols, according to Chinese Soil Taxonomy [47]. Supplementary Table S1 indicates how the classes in the World Reference Base for Soil Resources (WRB) [48] roughly match.
In addition, the study area is a significant agricultural production region in China. The study area’s irrigated arable land made up about 40% of China’s total irrigated arable land in 2020, and its application of agricultural fertilizer made up about 44% of China’s total agricultural fertilizer use [15]. Fertilizer application in the region has shown an increasing trend for more than 30 of the last 40 years (Figure 2). Paddy fields and uplands are used for crops such as food crops and are the main objects of long-term fertilization in the area.

2.2. Soil Data

In this study, 1253 soil profiles were used (Figure 1), and 4761 soil samples were collected from genetic horizons. The soil data were from the National Soil Series Survey (2009–2019). Soil-forming factors such as climate, parent material, topography, vegetation and human activity were fully considered in the National Soil Series Survey. Typical soil profiles were collected and classified according to the soil-forming process and diagnostic basis. Soil pits were typically dug to a depth of 1 m or to bedrock, and soil samples were obtained from the divided soil layers for experimental purposes [49]. Air-dried soil samples were sieved through a 2-mm mesh in the laboratory, and soil properties such as soil texture, SOC, pH, CEC and exchangeable cations were measured. The exchangeable cations measured included soil Exch. Ca, Exch. Mg, Exch. K and Exch. Na by displacement with 1 mol/L NH4OAc (pH 7.0) and measurement by EDTA complexometric titration (Ca2+ and Mg2+) and by flame photometry (K+ and Na+), and Exch. H and Exch. Al were measured by displacement by 1 mol/L KCl [2]. In addition, the CEC was measured using the 1 mol/L NH4OAc (pH 7.0) exchange method, and BSP was obtained by calculating the total amount of the four exchangeable base cations (Ca2+, Mg2+, K+, and Na+) relative to the CEC [50].
Soil depths generally vary across genetic horizons, and thus, these soil data should be fitted to fixed soil depth increments to ensure the consistency of the comparison. We used equal-area quadratic splines to fix the soil sample depths to 0–20 cm, 20–50 cm and 50–100 cm, and the spline smoothing parameter lambda (λ) was 0.1 by default [51].

2.3. Environmental Covariates

The selection of environmental covariates was based on the concepts of SCORPAN (soil, climate, organisms, topography, parent material, age and space) [32]. A total of 18 covariates for soil attribute prediction were collected (Table 1). Nine terrain variables were extracted from the Shuttle Radar Topography Mission digital elevation model [52] using SAGA GIS (http://www.saga-gis.org/, accessed on 6 April 2021): elevation, slope, plan curvature (PlanCur), profile curvature (ProCur), channel network base level (Channel level), vertical distance to channel network (DisToChann), topographic wetness index (TWI), multiresolution index of valley bottom flatness (MRVBF) and multiresolution index of ridge top flatness (MRRTF). The normalized difference vegetation index (NDVI) products were obtained from https://www.vito-eodata.be (accessed on 8 April 2021). Fractional vegetation cover (FVC) [53], leaf area index (LAI) [54] and evapotranspiration (ET) [55] for 2010 were derived from the 8-day Global LAnd Surface Satellite (GLASS) products and were calculated using data from the Moderate Resolution Imaging Spectroradiometer (https://ladsweb.modaps.eosdis.nasa.gov, accessed on 9 April 2021). MAAT, MAP, sunshine duration (Solar), aridity index (Aridity) and annual soil temperature at a depth of 0–50 cm (SoilTemp) were collected from the Resource and Environmental Science and Data Center (RESDC) (https://www.resdc.cn/, accessed on 9 April 2021), Chinese Academy of Sciences. All environmental covariates were resampled to a spatial resolution of 1 km in ArcGIS 10.7 using the bilinear interpolation algorithm. We selected covariates with a variance inflation factor (VIF) < 10 for each model as the best predictor sets to avoid multicollinearity between environmental variables [56].

2.4. Data Processing and Modeling

One-way analysis of variance (ANOVA) (p < 0.05) and Duncan’s multiple range test were used to examine the differences in exchangeable cations or BSP under treatments of soil types and land use. Logarithmic (log) and Box-Cox transformations were performed to transform the data distribution close to a normal distribution for further analysis. The number of samples with grassland or Primosols in exchangeable base cations were limited for analysis, and thus, these samples were not included in variance analysis. Three MLR, GWR and RF models were considered, and the best model was selected for mapping.
MLR is a linear regression technique that is very beneficial for predicting the optimal relationship between a response variable and multiple independent variables, unlike simple linear regression [57]. Therefore, it is widely used in establishing the relationship between soil properties and various environmental variables. MLR is a global model whose parameters to be estimated do not change with changes in spatial location. The model can be expressed as [56]:
y ^ i = β ^ 0 + k = 1 K β ^ k x k i
where y ^ i is the predicted soil property at sample point i , β ^ 0 is the estimated intercept, β ^ k is the estimated regression coefficient for predictor k , which is estimated by ordinary least squares (OLS), and x k i is the value for the k th predictor at sample point i .
Different from MLR, GWR is a local regression model that embeds the spatial location of the sample points into the regression parameters. The model parameters to be estimated change with the spatial location of the sample points, thus obtaining the local relationship between soil properties and environmental variables. The parameters of the GWR model are estimated locally by the weighted least squares method [56]. The weight at each spatial position is a function of the observation position determined in the surrounding specific mode. Among them, the size of the weight represents the importance of the observation point position for parameter estimation. The functional form of GWR can be expressed as follows [58]:
y ^ i = β ^ 0 i + k = 1 K β ^ k i x k i
where y ^ i is the predicted soil property at sample point i , β ^ 0 i is the estimated intercept at sample point i , and β ^ k i and x k i are the estimated regression coefficient for predictor k and the value for the k th predictor at sample point i , respectively.
RF is a nonlinear machine learning model and an algorithm based on a classification tree [59]. Compared with most statistical modeling methods, it has the advantage of being insensitive to multicollinearity; additionally, RF reduces overfitting and improves the prediction accuracy of the model [39]. Therefore, RF is used extensively in the spatial prediction of soil properties. The number of variables used to grow each tree (mtry) and the number of trees to be grown in the forest (ntree) are two important parameters of RF. In this study, both parameters used default values of 5 for mtry and 500 for ntree. The statistical analysis of soil properties, as well as the modeling and mapping processes, were carried out using R software (version 4.1.2) with the packages “agricolae”, “car”, “caret”, “ggplot2”, “randomForest”, “raster”, “rgdal”, and “spgwr” and ArcGIS 10.7.

2.5. Model Validation and Prediction Variability Evaluation

In this study, a 10-fold cross-validation method was used to verify the accuracy of the three models, and the root mean square error (RMSE) and coefficient of determination (R2) were selected as two commonly used evaluation indexes [30,60]. Among them, R2 is used to evaluate the prediction accuracy and model generalization ability, and a smaller RMSE indicates lower model error. In addition, we used the quantile regression forest method [61] to evaluate the prediction variability of the predicted maps with “quantregForest” package in R software. The prediction variability was expressed as 5% lower and 95% upper prediction limits at a 90% prediction interval [62,63,64]. The two evaluation indexes were calculated as follows:
R M S E = 1 n i = 1 n P i O i 2
R 2 = 1 i = 1 n P i O i 2 i = 1 n O i O ¯ 2
where P i and O i represent the predicted and observed values of a soil property at sample point i , respectively, O ¯ is the average of the observed values, and n is the total number of sample points.

3. Results

3.1. Summary Statistics of Soil Properties

Table 2 lists the statistical analysis results of exchangeable cations and BSP at soil depths of 0–20 cm, 20–50 cm and 50–100 cm. Among the four exchangeable base cations, the content of Exch. Ca was the highest, followed by that of Exch. Mg, and the contents of Exch. K and Exch. Na were both lower. In exchangeable acidic cations, the Exch. Al content was much higher than the Exch. H content. The mean BSP values were below 50% at all three soil depths, indicating that the soil fertility in the study area was generally not very good [65]. The skewness values of exchangeable cations and BSP were greater than 0, showing a positive skewness distribution.

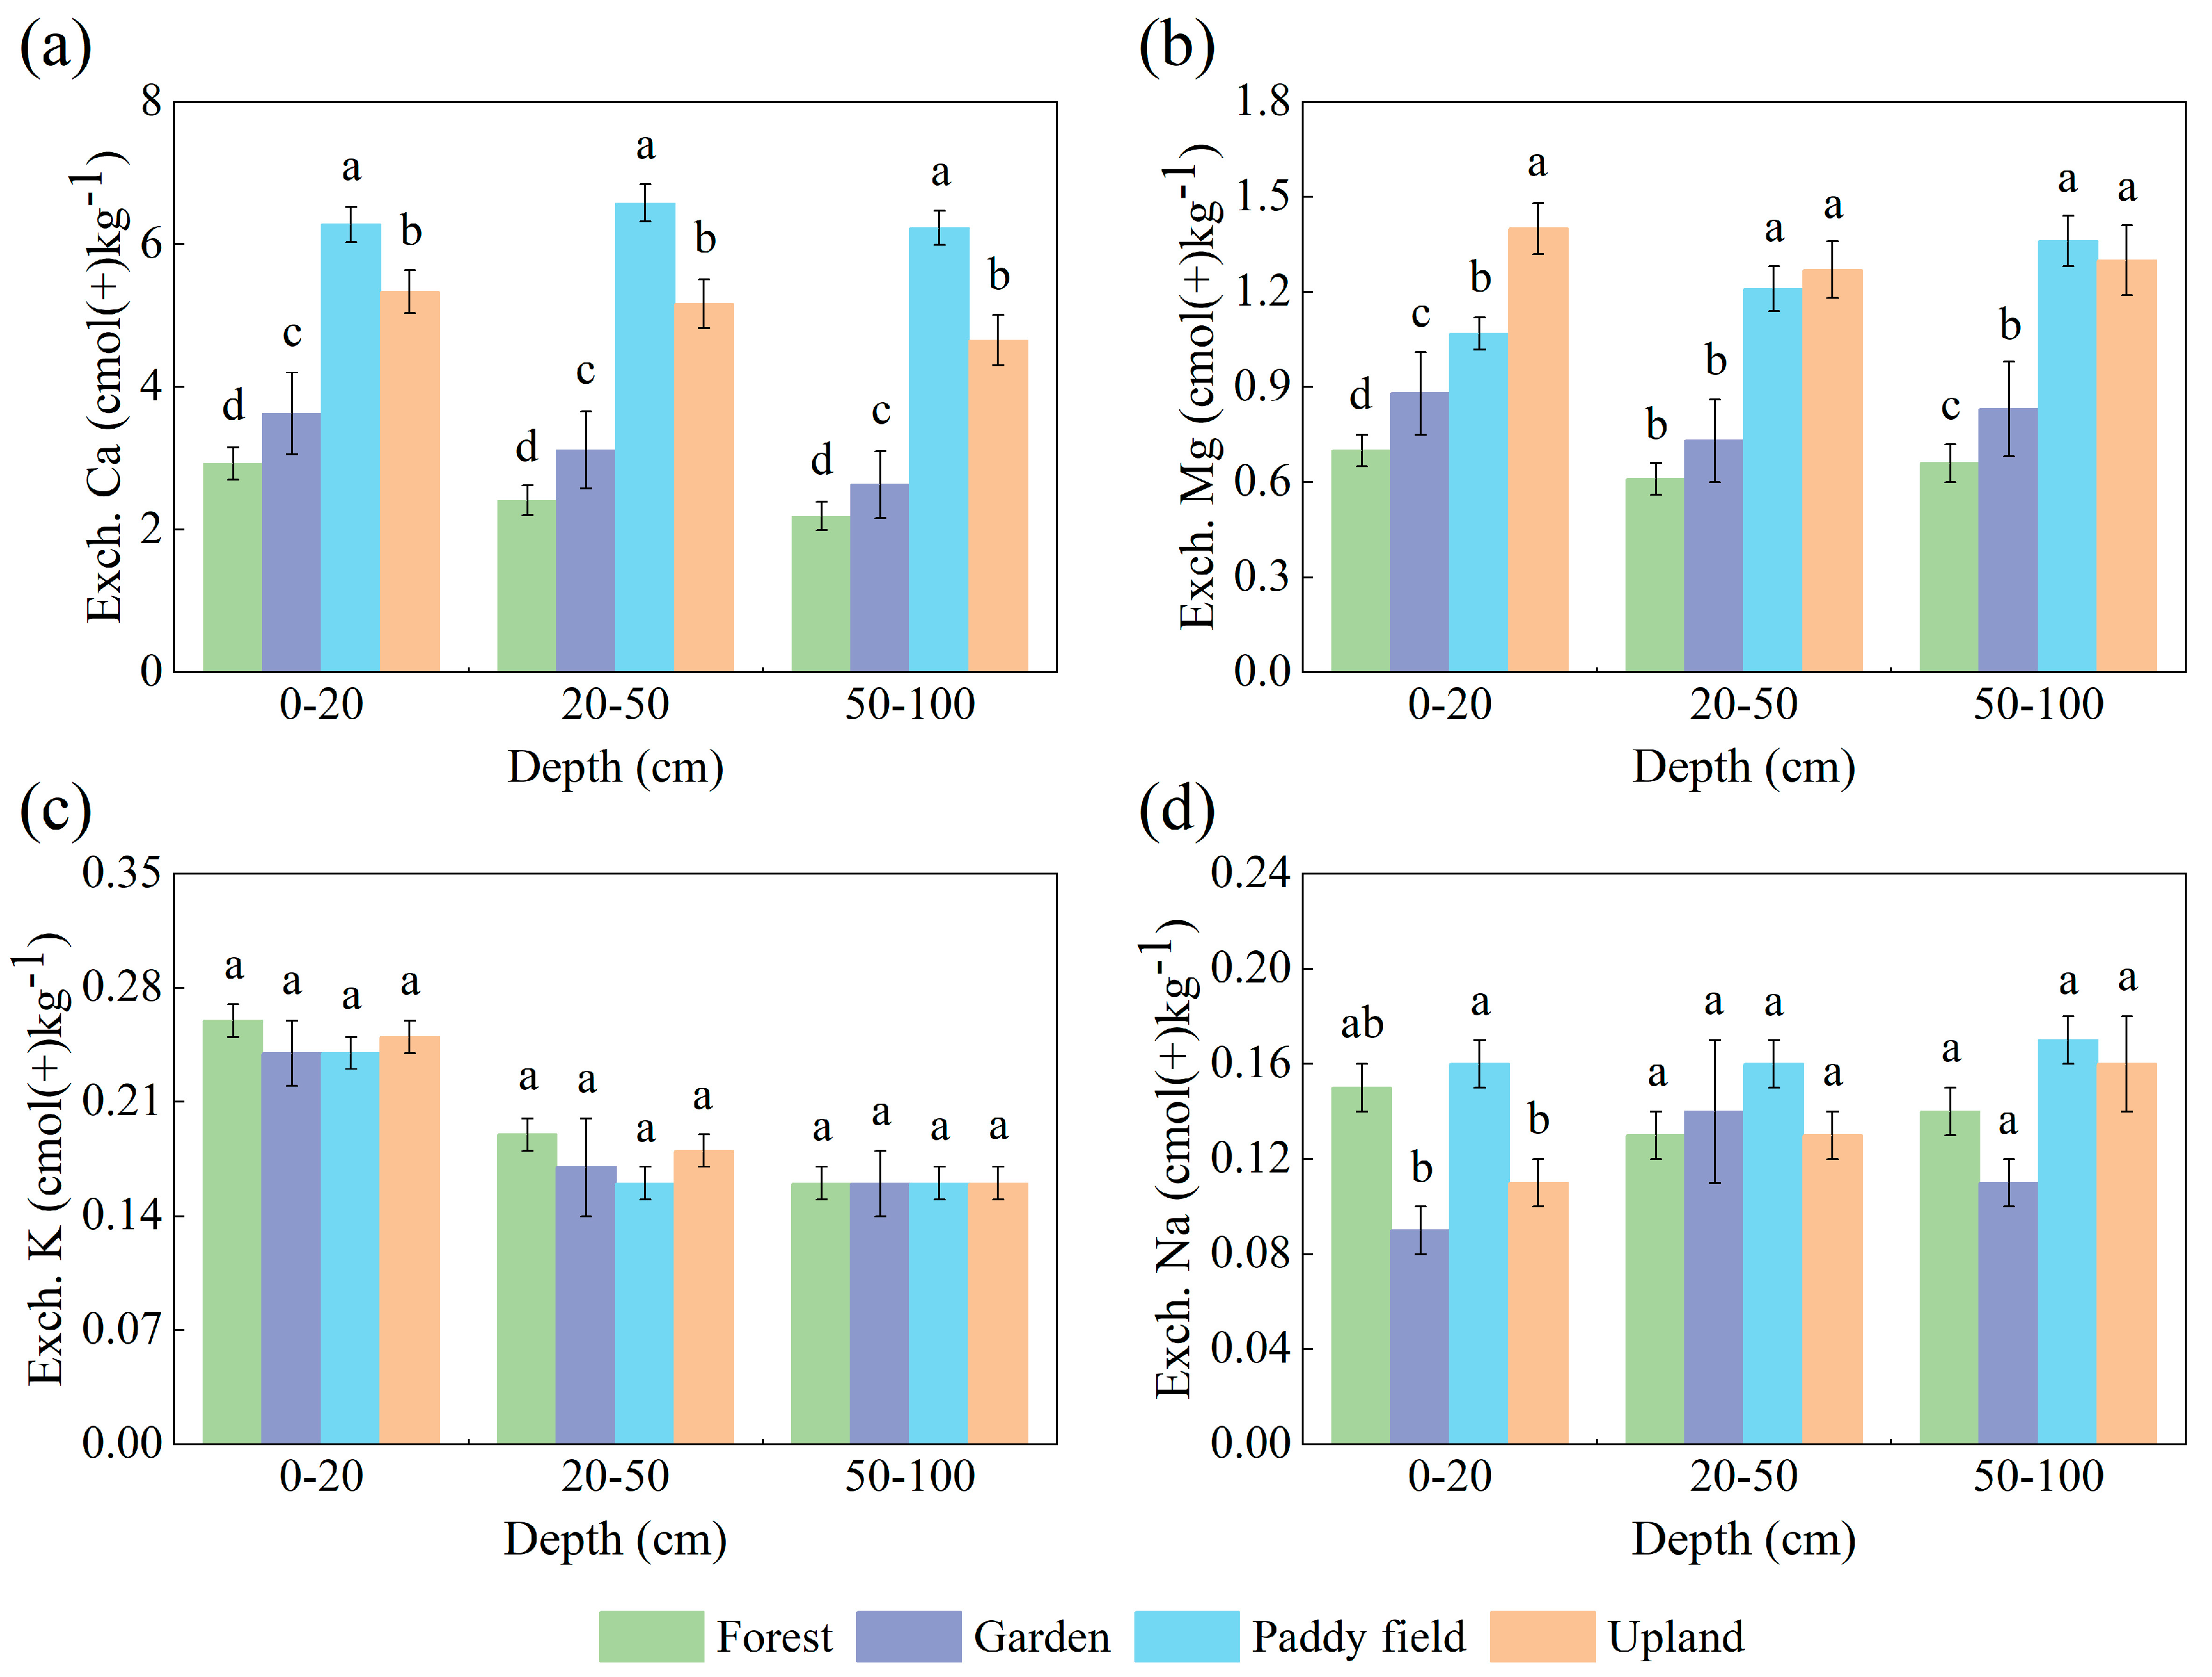
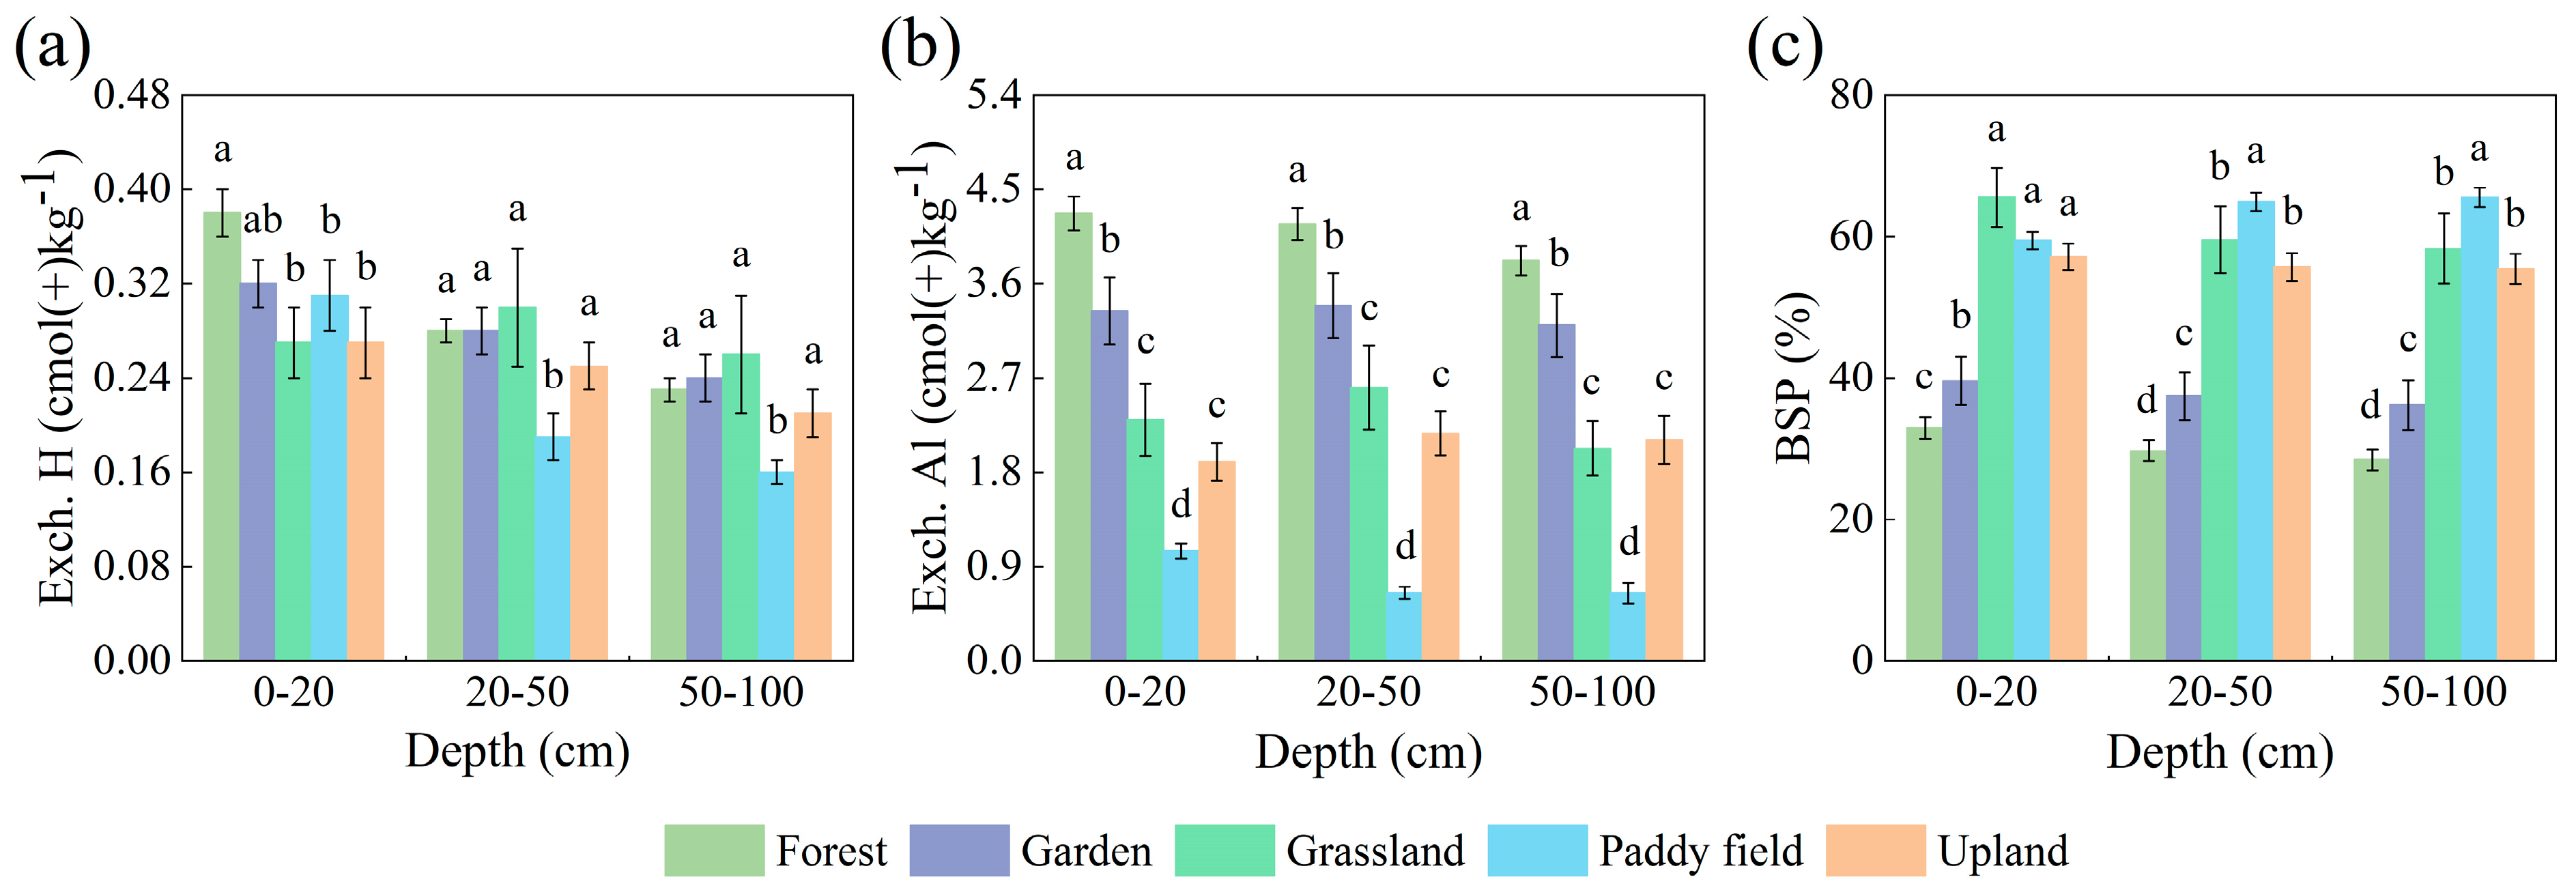
3.2. Effects of Different Land-Use Types on Soil Properties

The ANOVA results showed that there were significant differences in the Exch. Ca, Exch. Mg, Exch. H, Exch. Al and BSP among various land-use types, while there was no significant difference in Exch. K (Figure 3 and Figure 4). Additionally, Exch. Na showed a significant difference only in the 0–20 cm surface layer (p < 0.05). The numbers of corresponding sampling points are shown in Tables S2 and S3.
The Exch. Ca content in paddy fields was significantly higher than that in forests, gardens and uplands, regardless of the soil layer (p < 0.05) (Figure 3a), while the Exch. Al content was the lowest in paddy fields and the highest in forests (Figure 4c). The Exch. Mg content and BSP in paddy fields and uplands were significantly higher than those in forests and gardens (p < 0.05) (Figure 3b and Figure 4c). The Exch. Ca content of the paddy fields was highest in the 20–50 cm layer and the Exch. Mg content was highest in the 50–100 cm layer. The Exch. Ca2+, Exch. Mg2+, Exch. K+ and BSP were higher in the uplands and gardens in the 0–20 cm layer than in the 20–50 cm and 50–100 cm layers. The Exch. Na content was higher in the 50–100 cm layer than in the 0–20 cm layer in both paddy fields and uplands. Specifically, the highest Exch. K content was found in the 0–20 cm layer for all land-use types. The content of Exch. H under different land-use types (except grassland) decreased with increasing soil depth.

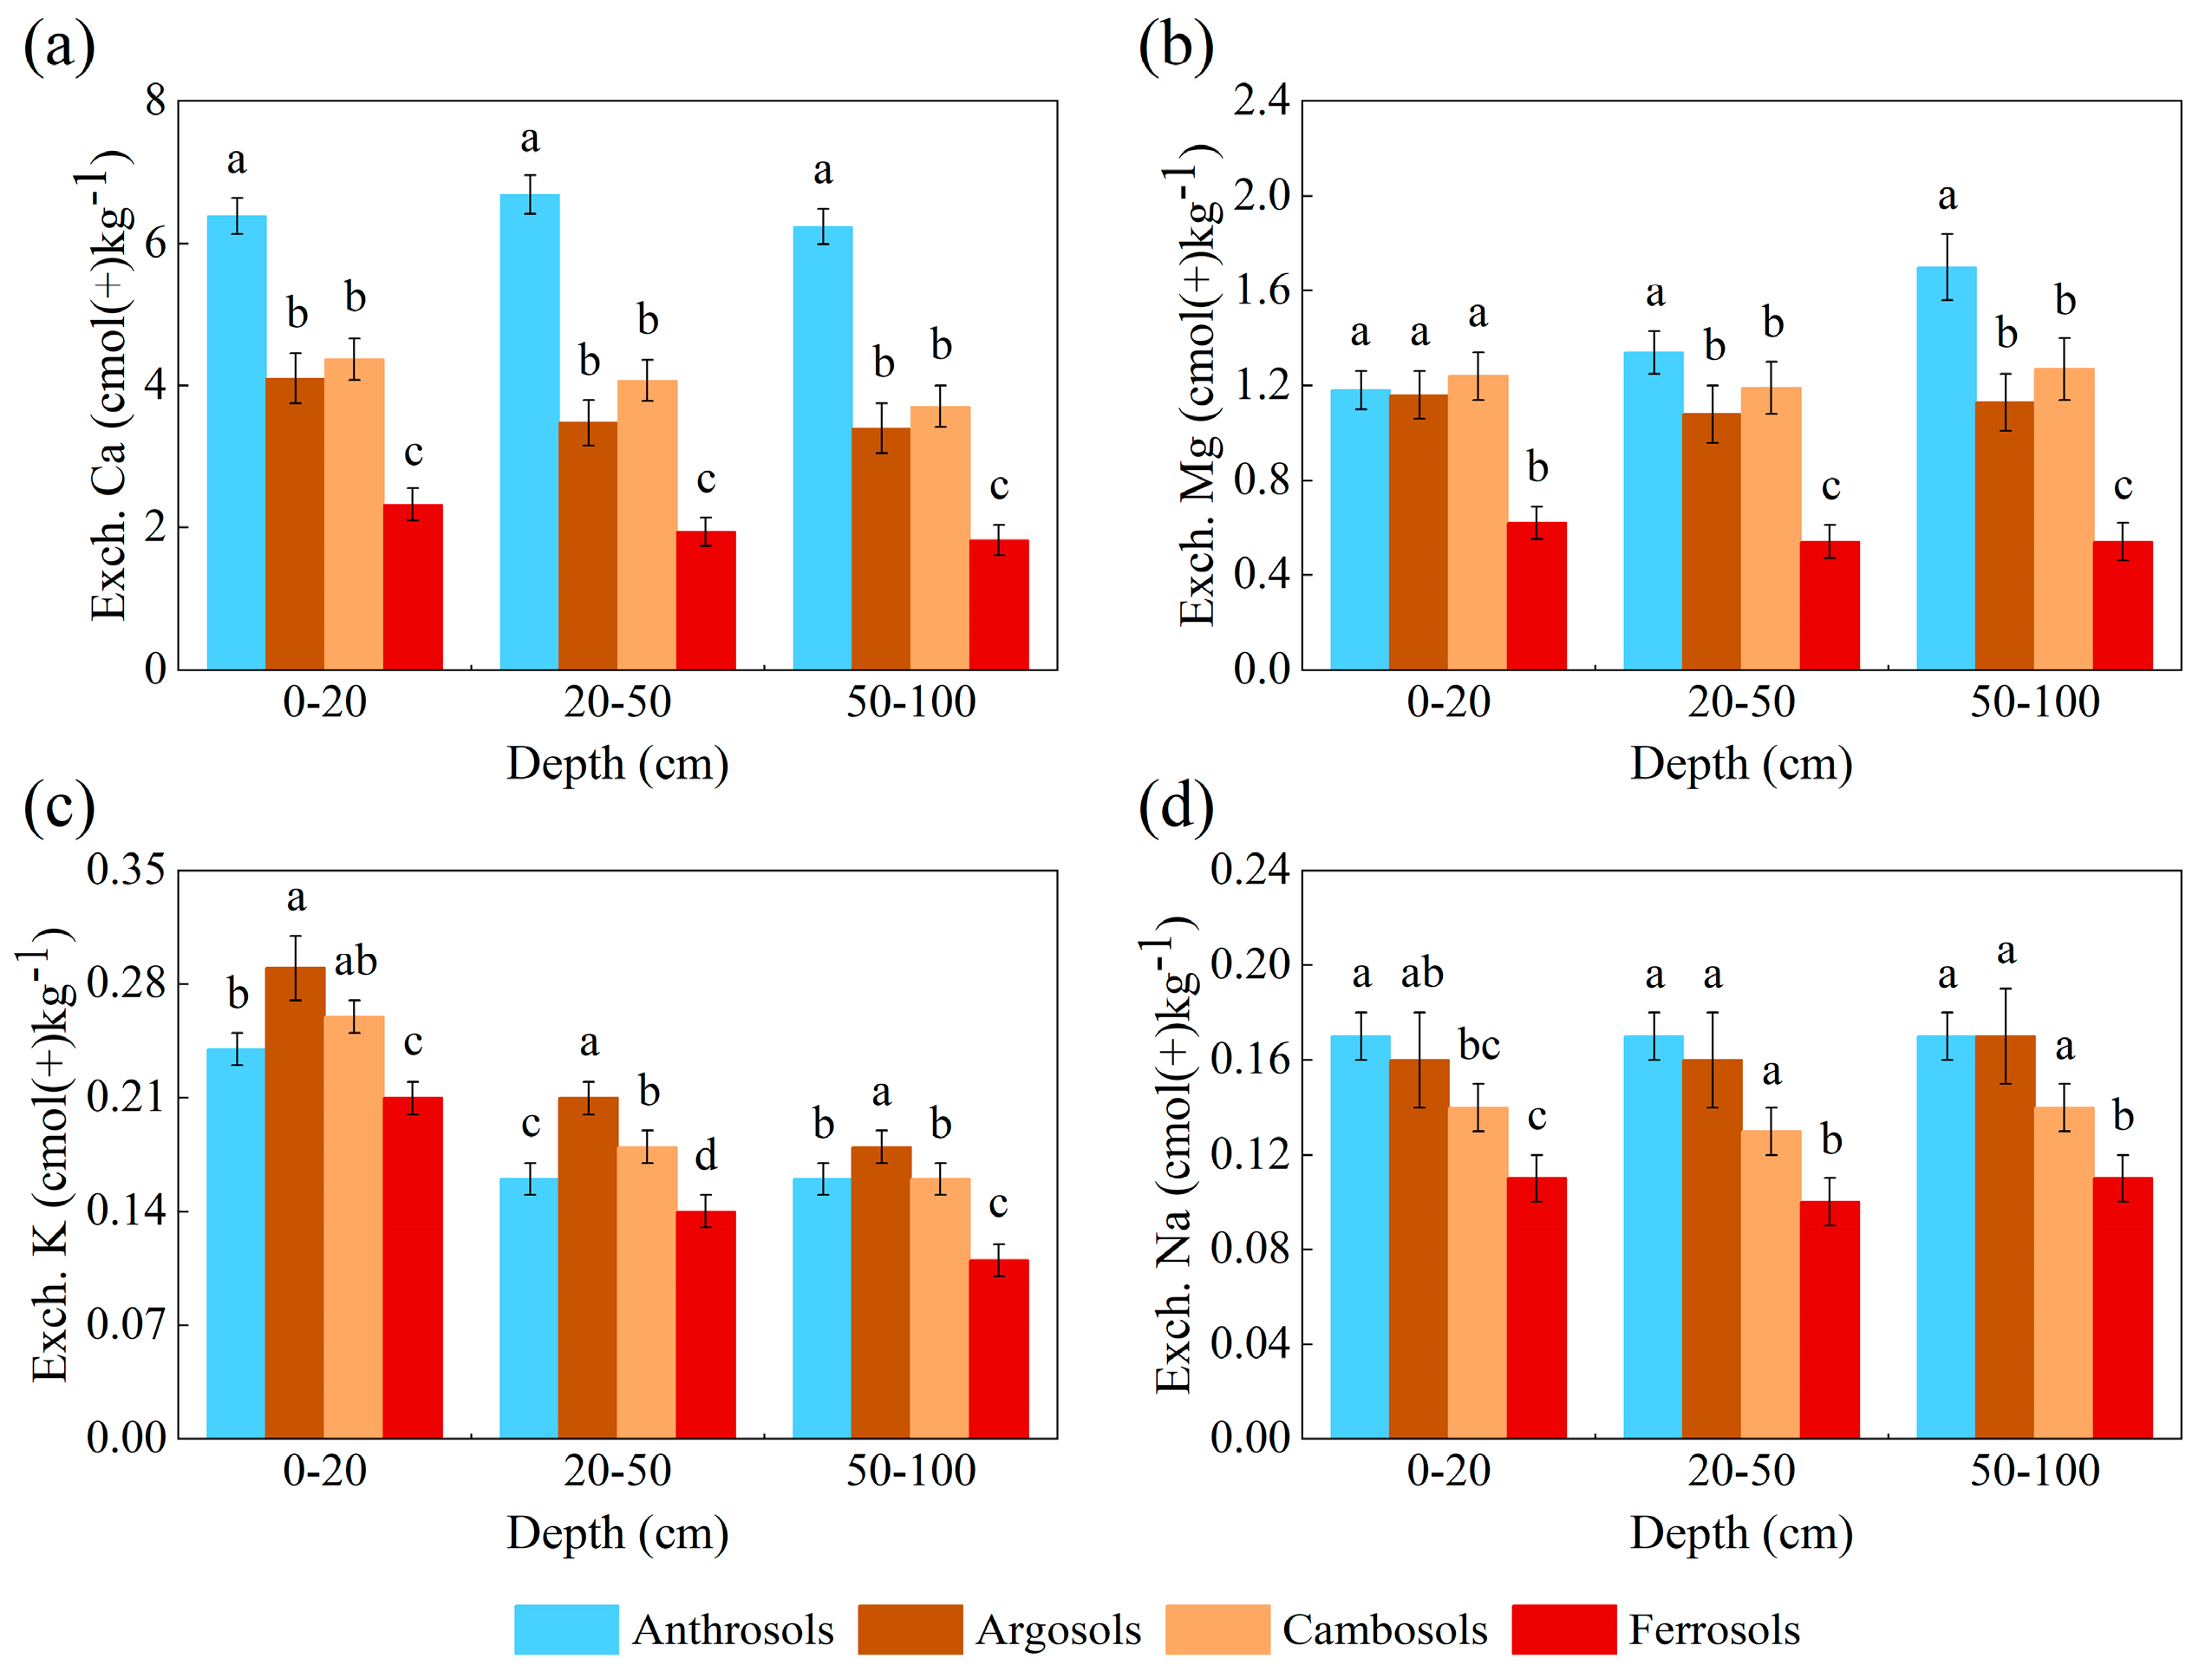
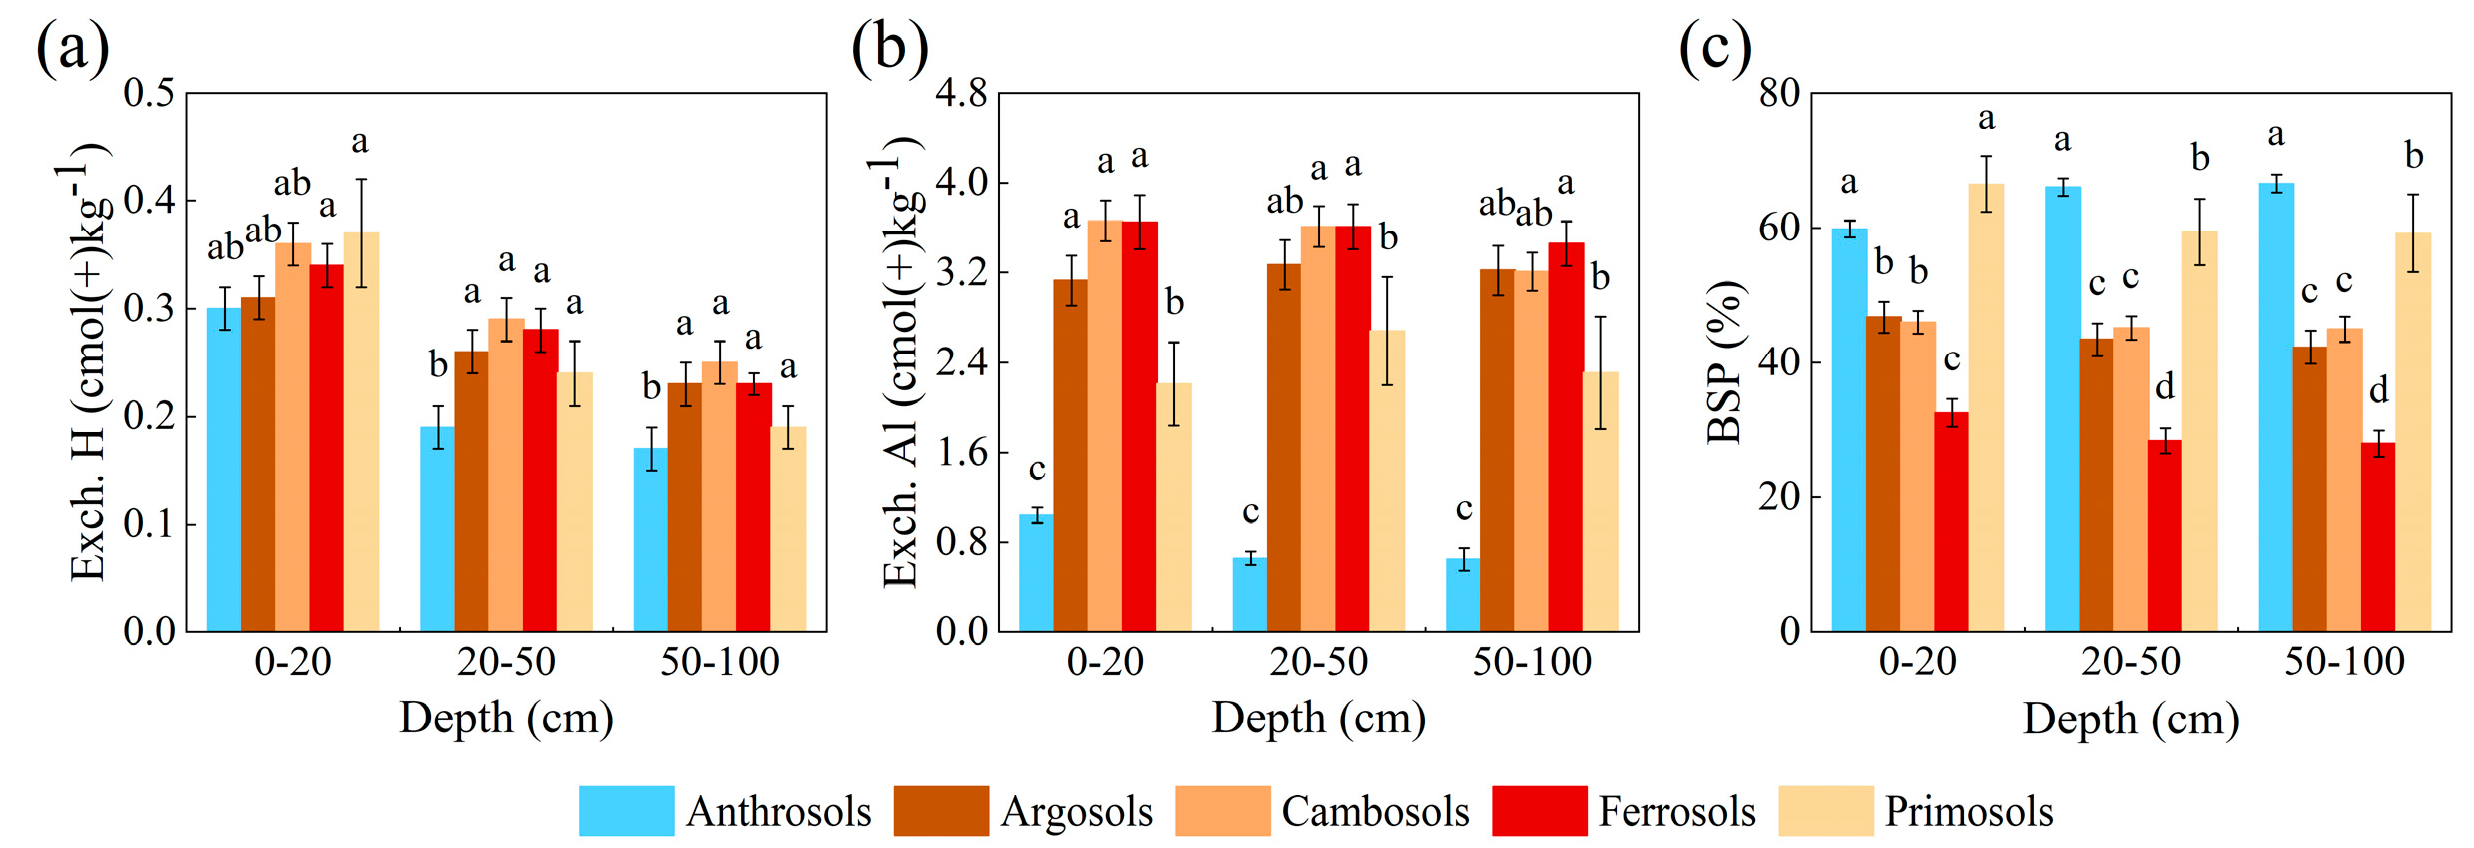
3.3. Effects of Different Soil Types on Soil Properties

The ANOVA results for the exchangeable cations and BSP among different soil types under the three soil layers are shown in Figure 5 and Figure 6, and the numbers of corresponding sampling points are shown in Tables S4 and S5. Exchangeable cations and BSP were significantly different in different soil types except for Exch. H in the 0–20 cm layer.
The Exch. Ca content and BSP in Anthrosols were significantly higher than those in Ferrosols, Argosols and Cambosols in all three soil layers (p < 0.05) (Figure 5a and Figure 6c), while the contents of Exch. H and Exch. Al were the lowest under all five soil types. The Exch. Ca, Exch. Mg, Exch. K and Exch. Na contents and BSP in the Ferrosols were the lowest in the various soil types, while the Exch. H and Exch. Al contents were greater among the five soil types. The highest Exch. K content was found in the 0–20 cm layer in all soil types. With increasing soil depth, the Exch. H content decreased in the different soil types, while the Exch. Mg content increased in Anthrosols.

3.4. Performance of Model Prediction

The predictive performance of the MLR, GWR and RF models on exchangeable cations and BSP after natural log transformation is shown in Table 3. The results suggested that RF generally had the best predictive performance on all soil properties, followed by GWR, and MLR had the worst predictive performance; thus, RF was used for subsequent spatial mapping. Among these soil properties, RF had the best modeling effect on Exch. Na, whose mean R2 values at the three soil depth intervals were approximately 0.5. In the three soil depth intervals, the R2 values of Exch. Ca, Exch. Mg and BSP modeled by RF were higher than 0.3, while the R2 values of Exch. K, Exch. H and Exch. Al were lower. With increasing soil depth, the R2 values of Exch. Ca, Exch. H, Exch. Al and BSP decreased after RF modeling, while the RMSE values increased.

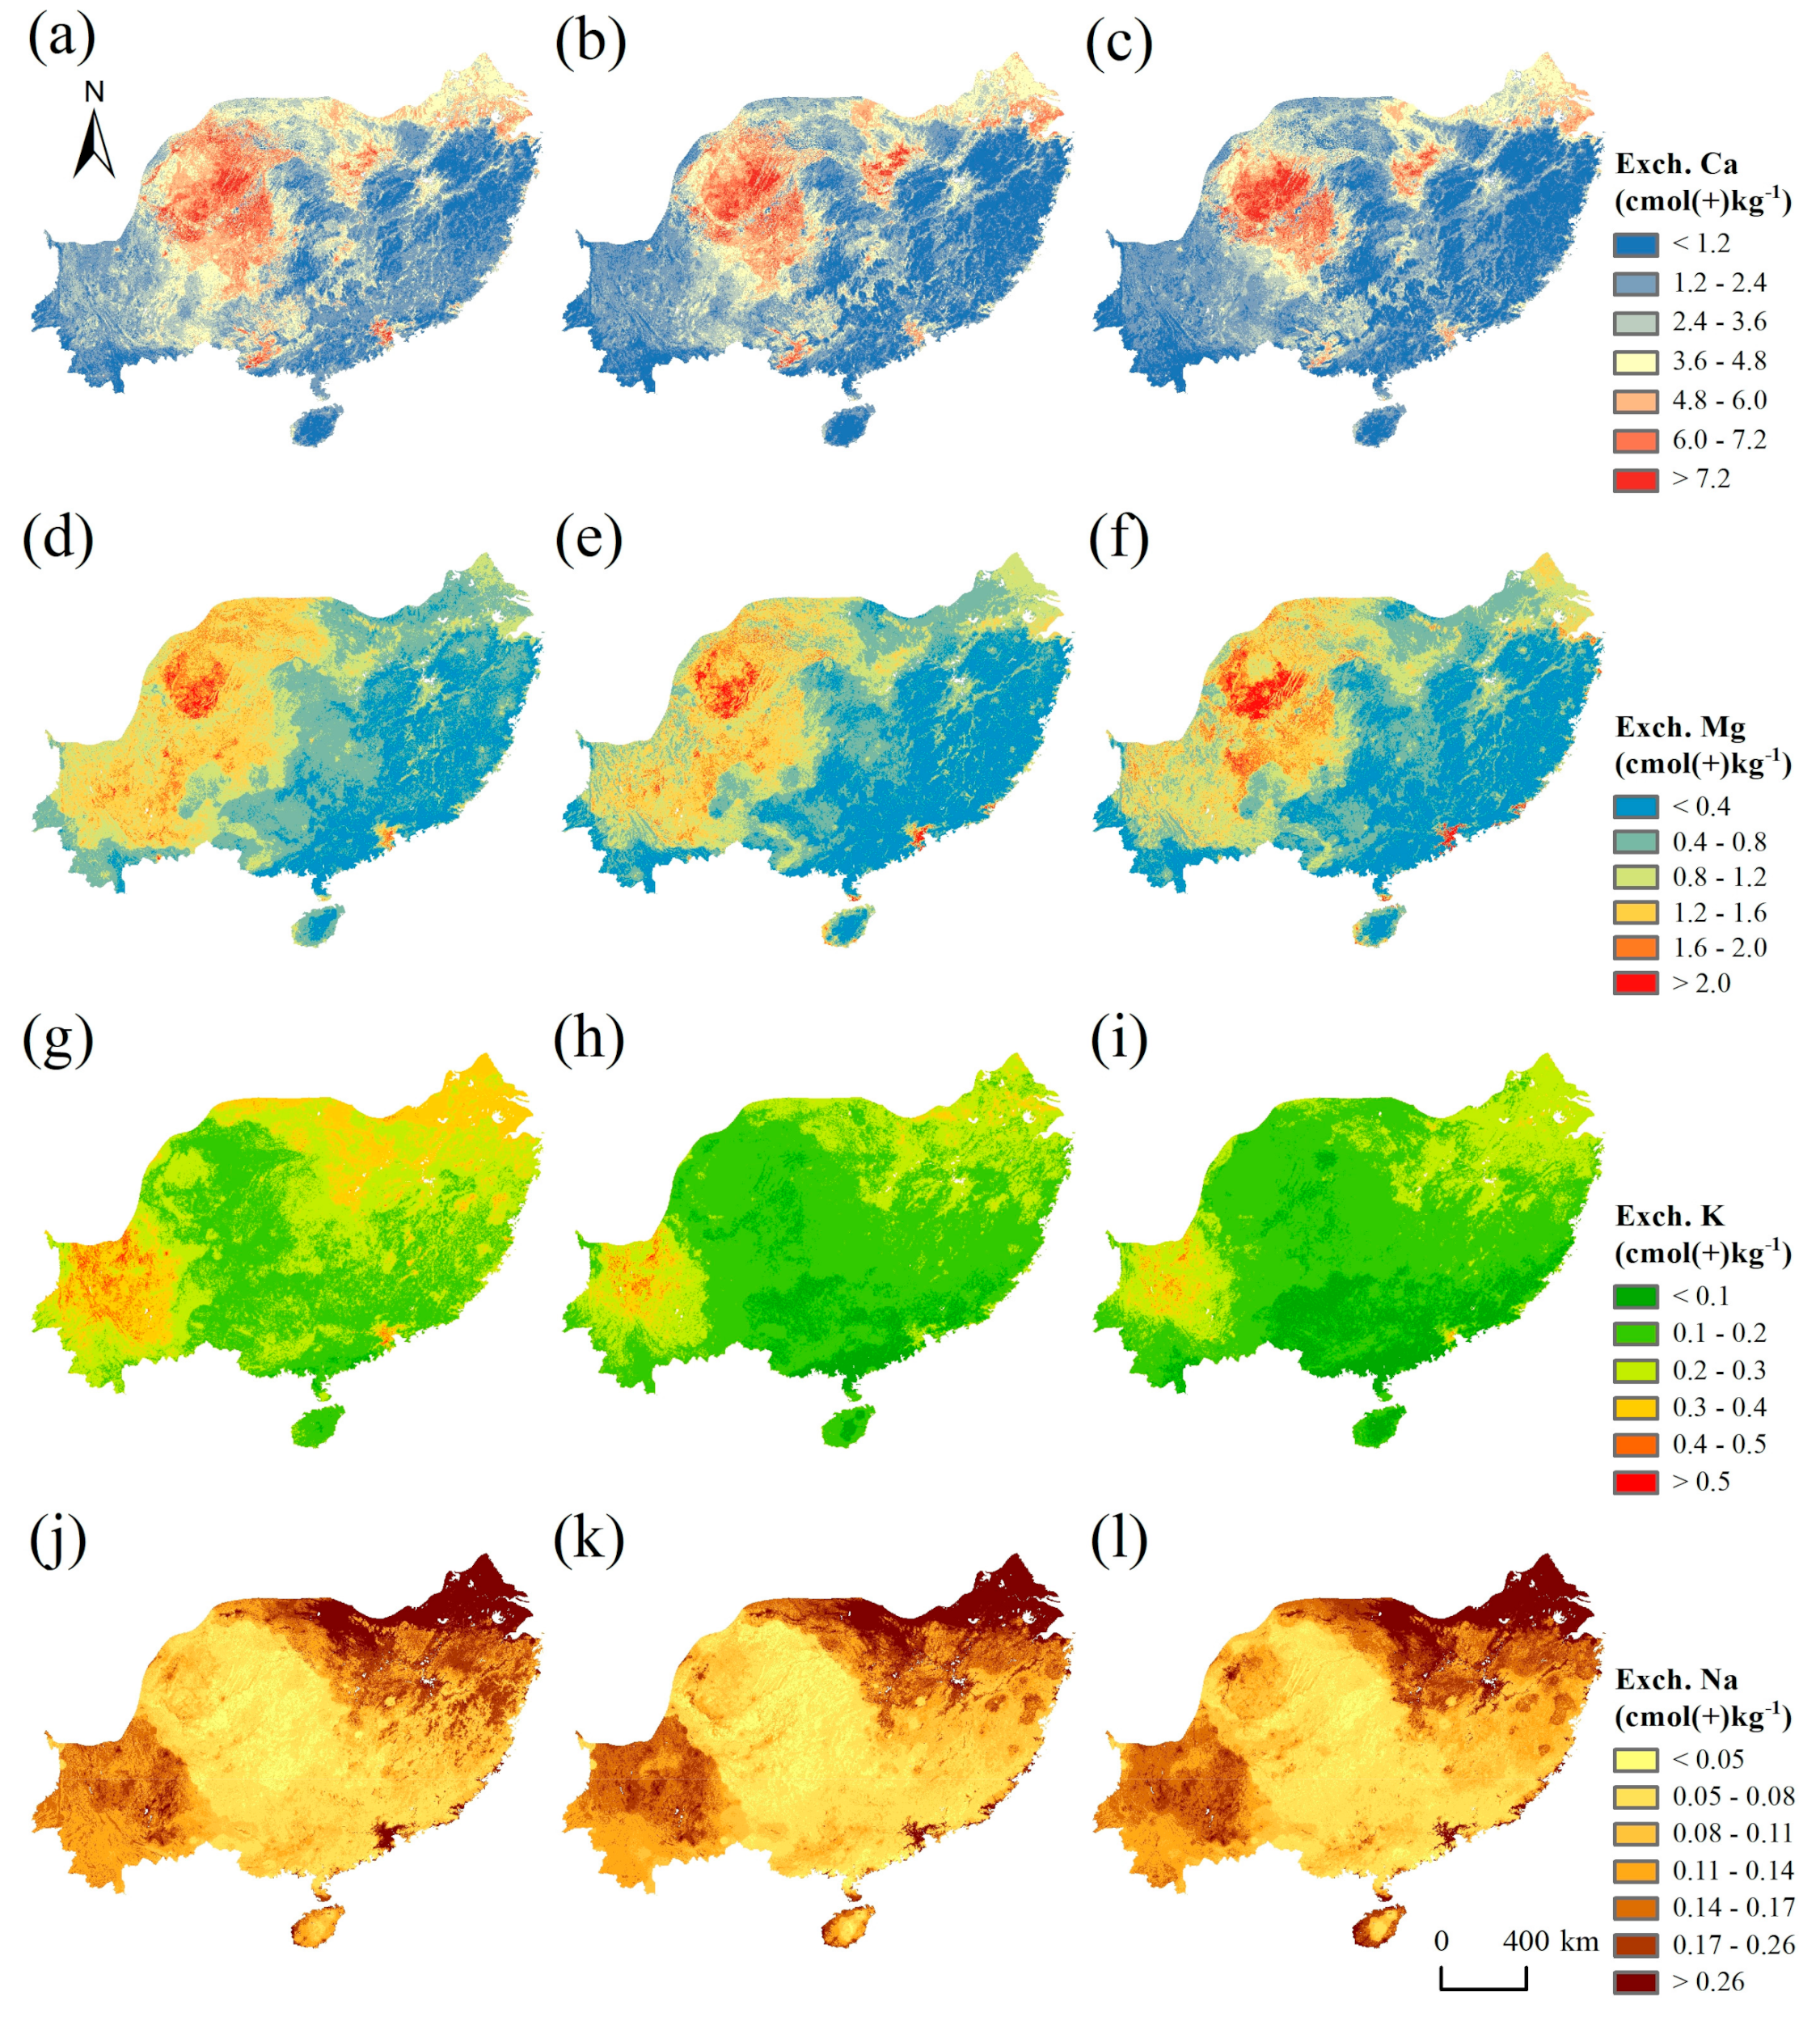
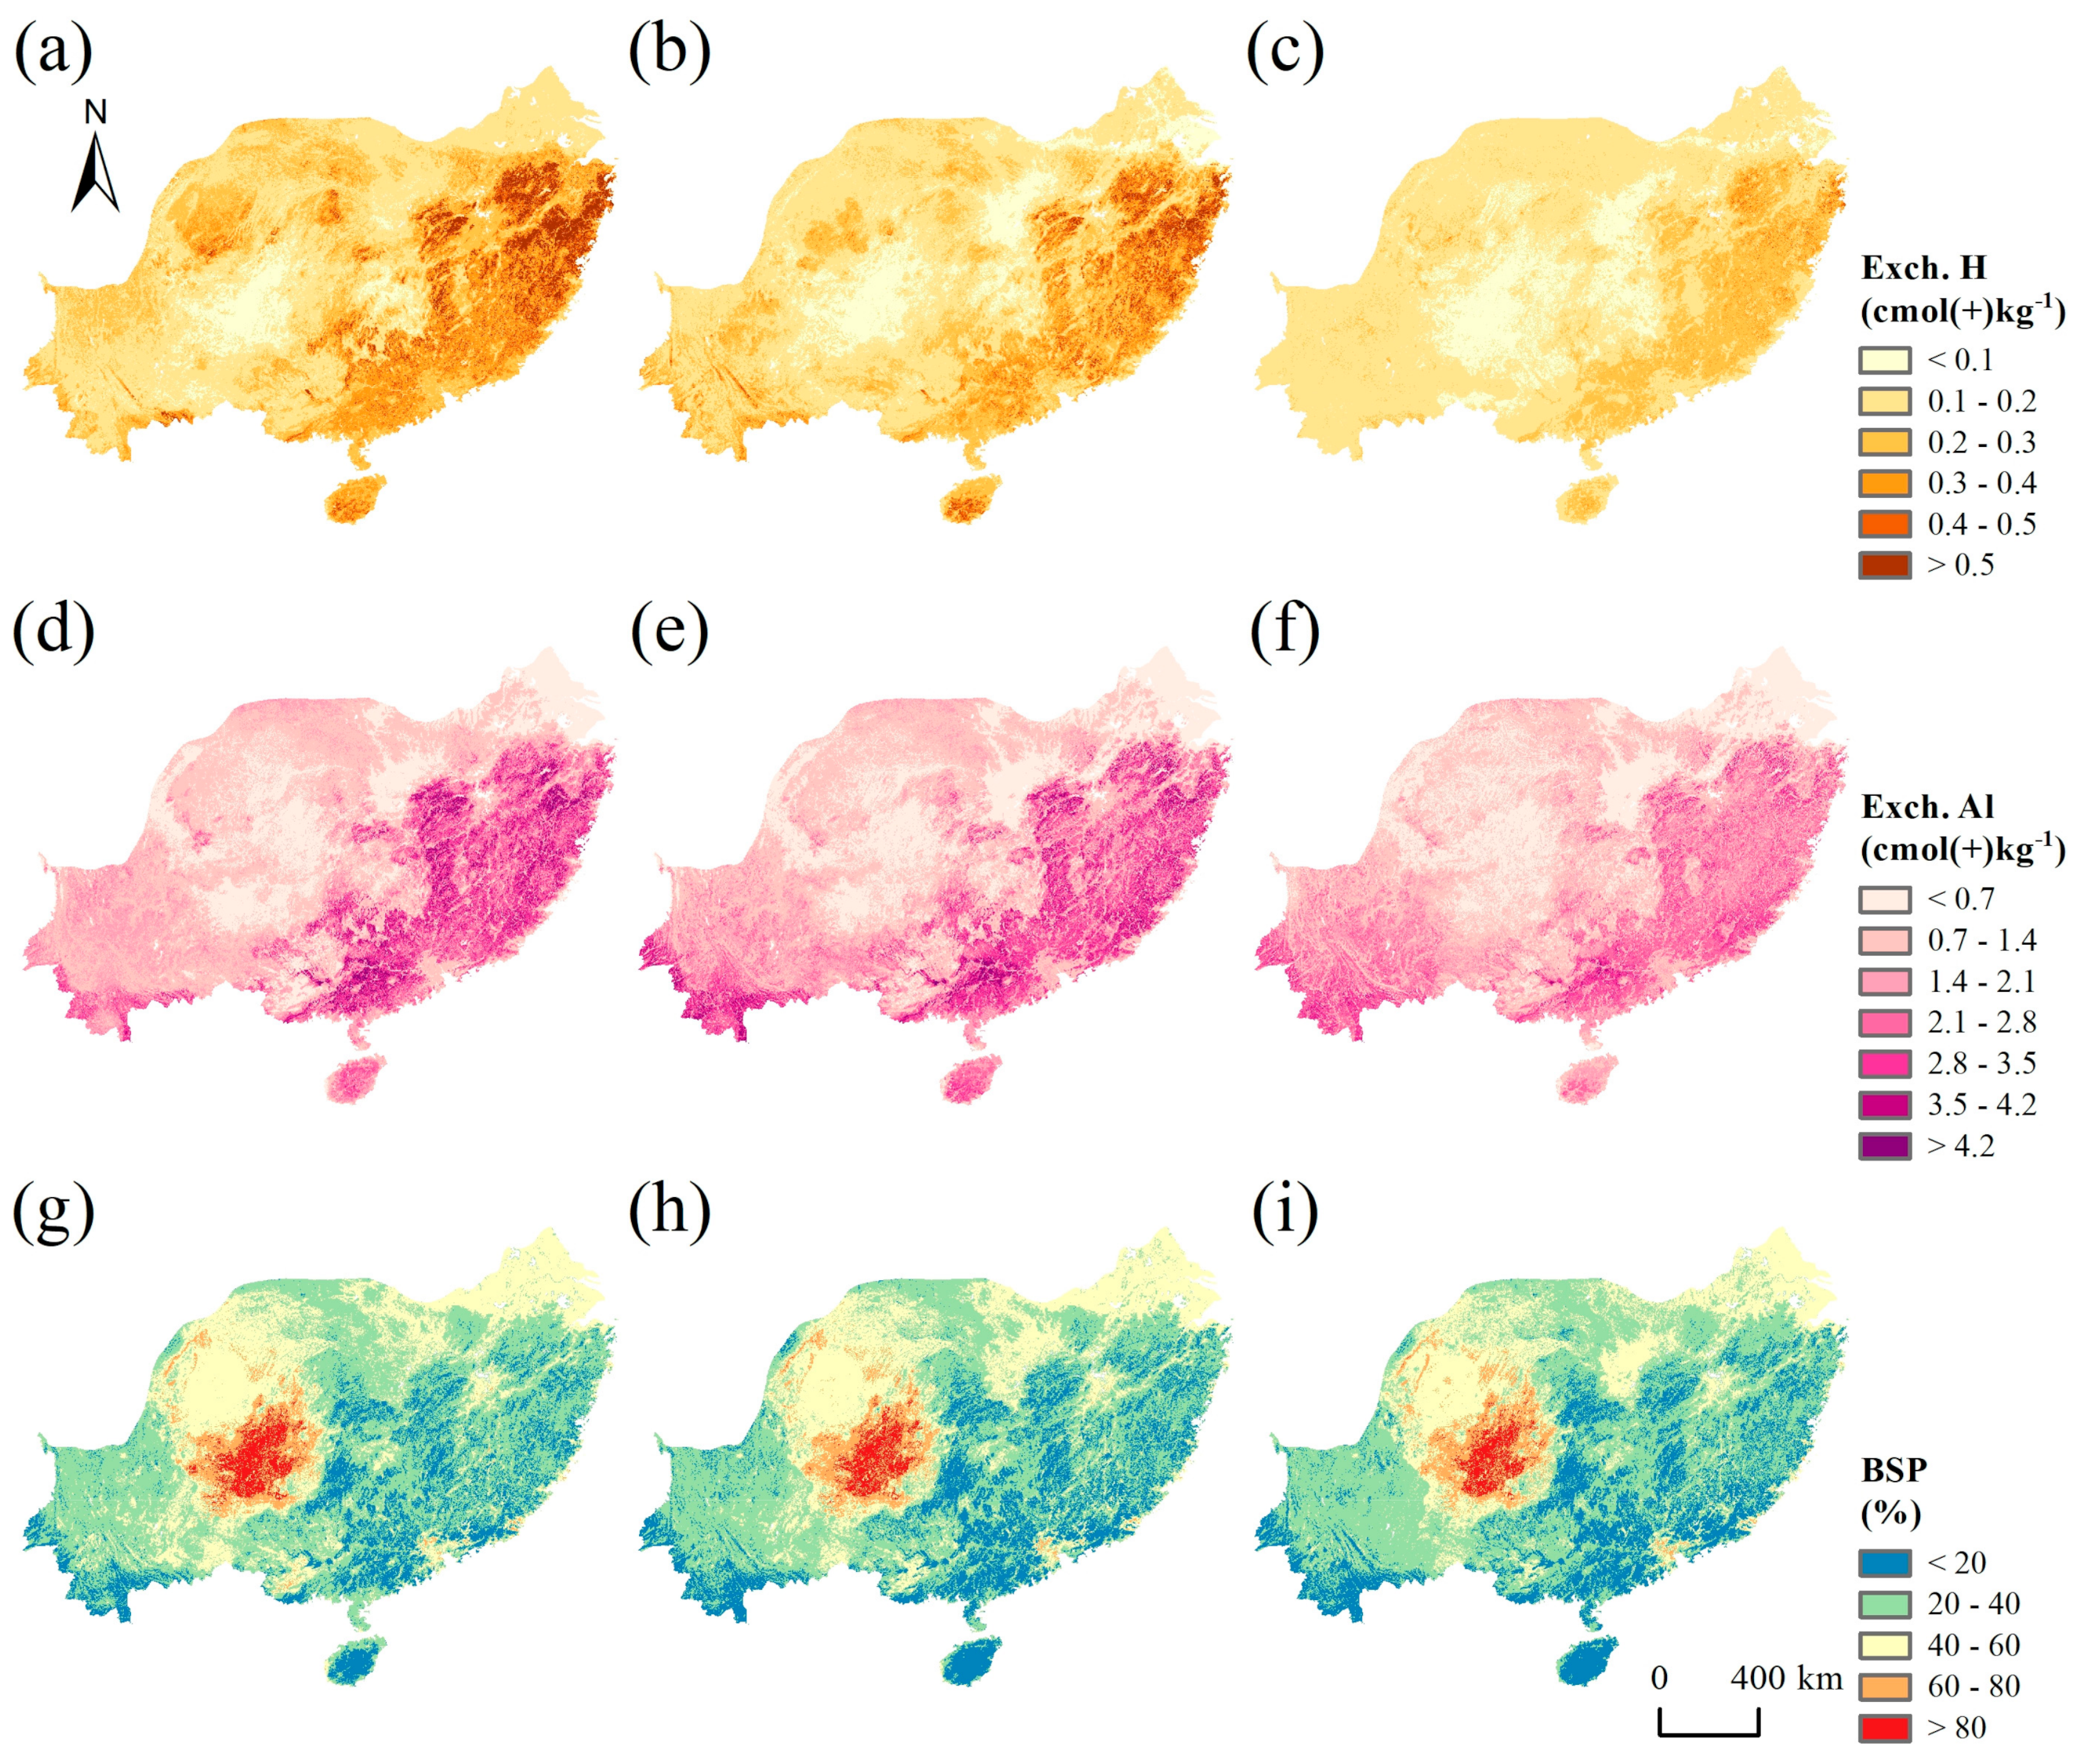
3.5. Spatial Patterns of Soil Properties

The prediction maps of exchangeable cations and BSP in the study area at the three soil depths of 0–20 cm, 20–50 cm, and 50–100 cm are shown in Figure 7 and Figure 8. For Exch. Ca, the Sichuan Basin, the mountainous area around the Sichuan Basin and Guizhou Plateau in the northwest of the study area, and the Jianghan Plain and the Dongting Lake Plain in the north of the study area had the highest predicted Exch. Ca content; the Jianghuai Hilly Plain and lower Yangtze River Plain in the northeast of the study area and the Pearl River Delta in the southeast coastal area were higher, while other areas had lower Exch. Ca content. Moreover, the Exch. Ca content decreased with increasing soil depth. The content of Exch. Mg increased gradually from east to west in the study area. The predicted Exch. Mg content was the highest in the Sichuan Basin and Chengdu Plain located in the northwestern part of the study area; higher in the Guizhou Plateau and Pearl River Delta; and lower in southern Yunnan located in the southwestern part of the study area and in most areas located in the eastern and southeastern parts of the study area.
Exch. K was highest in the Yunnan Plateau located in the southwest part of the study area; higher in the Jianghuai Hilly Plain, lower Yangtze River Plain and Pearl River Delta; and lowest in southern China. The Exch. K content in the study area generally decreased with increasing soil depth. The Exch. Na content was predicted to be the highest in the Nanxiang Basin in the northern part of the study area, Jianghuai Hilly Plain and lower Yangtze River Plain; higher in the Jianghan Plain, Yunnan Plateau and Pearl River Delta; and lower in other regions.
The spatial distribution patterns of Exch. H and Exch. Al were similar. In general, the contents of Exch. H and Exch. Al were higher in most coastal areas located in the eastern and southeastern parts of the study area and in southern Yunnan, and they were lower in the Guizhou Plateau. Furthermore, the Exch. H content decreased with increasing soil depth. For BSP, it was highest in the Guizhou Plateau and lowest in southern Yunnan and most of the eastern and southeastern coastal areas of the study area. Additionally, BSP decreased slightly with increasing soil depth.
The prediction variability assessment results of exchangeable cations and BSP based on the quantile regression forest method are shown in Figures S1–S7. The results showed that different soil properties had various spatial patterns of prediction variability, but the same property at different depths had similar patterns. The corresponding prediction variability was generally high where the predicted value of Exch. K and Exch. Na was high. However, for all soil properties, this 90% prediction range is quite wide, which indicates that there is still room for improvement.

4. Discussion

4.1. Variations in Exchangeable Cations and BSP

The Exch. Ca and Exch. Mg contents and BSP in paddy fields and uplands were significantly higher than those in forests and gardens regardless of soil depth (p < 0.05), while the Exch. Al content in forest and garden soils was significantly higher than that in paddy field and upland soils (p < 0.05), probably indicating base cation leaching in forest and garden soils and the complex impact of long-term fertilization on agricultural soils (Figure 2). The intense influence of atmospheric acid deposition on forests and the consumption of large amounts of base cations by forest trees during growth were the main causes of base cation leaching from forest soils [66,67]. The low base cations in gardens may be attributed to the heavy application of nitrogen fertilizers (Figure 2) and the harvesting of fruits [68,69]. The Exch. Ca and Exch. Mg contents and BSP were high and soil acidity was low in paddy fields and uplands, which is consistent with the findings of Li et al. [70]. Long-term application of phosphorus fertilizer as well as organic fertilizer in the study area replenished the base cations in the agricultural soils and increased the Exch. Ca and Exch. Mg contents [70]. The Exch. Ca content in paddy fields was significantly greater than that in uplands in the three soil layers, which may originate from the prolonged flooding of paddy fields. The reduction of Fe-Mn oxides in paddy soils consuming protons to reduce the H+ concentration in solution [71] and the higher organic matter content [72] may both promote the adsorption of base cations by soil colloids.
The profile distribution characteristics of Exch. Ca and Exch. Mg in paddy soils (Figure 3a,b) may be related to the leaching and sedimentation of both on different profile levels of paddy soils under flooding and fertilization conditions [71]. The Exch. Ca, Exch. Mg and Exch. K contents and BSP were higher in uplands and gardens at the 0–20 cm depth than at the 20–50 cm and 50–100 cm depths, mainly because the effect of fertilizer application on exchangeable base cations and BSP decreased with increasing soil depth [73,74,75]. However, the Exch. Na content was higher in the 50–100 cm depth of paddy and upland soils than in the 0–20 cm depth (Figure 3d), probably due to the stronger leaching of Exch. Na under rainy and fertilized conditions [71]. There was no significant difference between Exch. K under different land-use types (Figure 3c), as most applied fertilizer K in cropland was transferred to unexchangeable K or absorbed by crops due to the higher fertilizer efficiency than that of N and P fertilizer [76,77]. In addition, the high crop uptake and leaching rates due to the hot and rainy monsoon climate jointly resulted in a low Exch. K content [78].
The high Exch. Ca content and high BSP in Anthrosols may also be influenced by management measures such as artificial fertilization. There were no significant differences in exchangeable cation contents (except Exch. K) and BSP between Argosols and Cambosols at the three soil depths, indicating that the soil fertility of the two soil types was similar. The four exchangeable base cation contents and BSP in Ferrosols were the lowest in different soil types regardless of soil depth, while the contents of Exch. H and Exch. Al were higher. This result was mainly due to the influence of tropical and subtropical monsoon climate with a relatively high degree of mineral weathering, which led to the strong leaching of base cations and enhanced soil acidity [79]. Furthermore, Exch. K content was the highest in the topsoil (0–20 cm) due to surface aggregation (Figure 3c and Figure 5c). The uptake of K by plants, biological restitution of dead leaves and long-term fertilization all contributed to the accumulation of Exch. K in the topsoil [49,80]. Except for grassland, the Exch. H content decreased with increasing soil depth under different land-use types and soil types (Figure 4a and Figure 6a), which mainly stemmed from the fact that the Exch. H content of the topsoil was more influenced by acid deposition and nitrogen fertilization [81].

4.2. Spatial Variations in Exchangeable Cations and BSP

Both exchangeable cations and BSP exhibit strong spatial heterogeneity. The high content of both Exch. Ca and Exch. Mg in the Sichuan Basin (Figure 7) were related to the specific soil type of the Sichuan Basin. The main soil type in this region is purple soil (Entisols in the US Soil Taxonomy system) [82], which has a short soil formation time and is rich in mineral components [83]. Minerals release large amounts of base cations during weathering, resulting in high levels of exchangeable base cations in purple soil [84]. The high Exch. Ca content and BSP and the low contents of Exch. H and Exch. Al in the Guizhou Plateau were associated with its widely distributed karst landscape. Karst soils in karst regions have very high Ca2+ contents owing to their special geological topography [85]. The adsorption of Exch. Ca, Exch. H and Exch. Al by soil colloids is competitive [46], so the contents of Exch. H and Exch. Al were low in this region. According to the definition of BSP, the value of BSP is larger when the total content of exchangeable base cations is high and the content of exchangeable acid is low. In contrast, the soil Exch. Ca and Exch. Mg contents and BSP in southern Yunnan and most of the eastern and southeastern coastal areas located in the study area were low, and supplementation with calcium and magnesium fertilizer is urgently needed.
Even if the overall Exch. K did not significantly differ in regard to land use, long-term fertilization and topography jointly resulted in a heterogeneous pattern of Exch. K. The highest Exch. K content was found in the Yunnan Plateau, probably due to the relatively abundant K resources and the high application of K fertilizer and organic fertilizers [86]. The contents of the four exchangeable base cations in the lower Yangtze River Plain and Pearl River Delta were high, especially Exch. Na, probably because climate change has led to sea level rise [87], which has affected the horizontal movement of soil salts and is detrimental to the export of salts in the region [88], resulting in saline soils. The spatial distribution pattern of Exch. H and Exch. Al were basically consistent with the spatial distribution trend of pH in the study of Liu et al. [81]. This result confirmed the higher soil acidity in southern Yunnan and southeastern coastal areas, which may be related to the increased acid deposition and unreasonable use of chemical fertilizers [89]. In addition, the Exch. Ca, Exch. K and Exch. H contents and BSP in the study area decreased with increasing soil depth. This result was associated with the restitution effect of accumulation and the decomposition of biological residues with higher Ca and K contents and in the topsoil [80] and the influence of acid rain and nitrogen fertilizer input in the shallow layer in the south [81].

5. Conclusions

Based on the national soil survey down to the 1 m soil depth, we found that long-term fertilization led to greater Exch. Ca and Exch. Mg contents and BSP in both paddy fields and uplands than in natural ecosystems irrespective of soil depth. However, long-term fertilization did not result in a greater Exch. K in cropland than in natural soils, possibly due to the fixation processes of soil K and the high efficiency of K fertilizer. The Exch. Ca content and BSP in Anthrosols were significantly higher than those in Ferrosols, Argosols and Cambosols in the three soil layers (p < 0.05). From the perspective of vertical variation, we found that the Exch. Ca, Exch. K and Exch. H contents and BSP decreased with increasing soil depth. RF was the best predictor of all dependent variables, and the most accurate prediction was for Exch. Na, with an R2 of 0.479–0.536. The prediction results indicated that exchangeable cations and BSP were generally characterized by strong heterogeneity. These results might help us to better understand the spatial variation in exchangeable cations and BSP in tropical and subtropical China and are also useful for precision agriculture and environmental protection.

Supplementary Materials

The following supporting information can be downloaded at: https://www.mdpi.com/article/10.3390/agronomy13030781/s1, Table S1: The Chinese Soil Taxonomy’s classifications of soil and roughly equal WRB classifications; Table S2: The number of sampling points for exchangeable base cations under different land-use types; Table S3: The number of sampling points for exchangeable acidic cations and BSP under different land-use types; Table S4: The number of sampling points for exchangeable base cations under different soil types; Table S5: The number of sampling points for exchangeable acidic cations and BSP under different soil types; Figure S1: Maps of lower and upper limits of 90% prediction interval of Exch. Ca at soil depths of 0–20 cm, 20–50 cm and 50–100 cm; Figure S2: Maps of lower and upper limits of 90% prediction interval of Exch. Mg at soil depths of 0–20 cm, 20–50 cm and 50–100 cm; Figure S3: Maps of lower and upper limits of 90% prediction interval of Exch. K at soil depths of 0–20 cm, 20–50 cm and 50–100 cm; Figure S4: Maps of lower and upper limits of 90% prediction interval of Exch. Na at soil depths of 0–20 cm, 20–50 cm and 50–100 cm; Figure S5: Maps of lower and upper limits of 90% prediction interval of Exch. H at soil depths of 0–20 cm, 20–50 cm and 50–100 cm; Figure S6: Maps of lower and upper limits of 90% prediction interval of Exch. Al at soil depths of 0–20 cm, 20–50 cm and 50–100 cm; Figure S7: Maps of lower and upper limits of 90% prediction interval of BSP at soil depths of 0–20 cm, 20–50 cm and 50–100 cm.

Author Contributions

Conceptualization, J.Z. and X.S.; formal analysis, J.Z., X.Q. and A.W.; investigation, J.Z., Y.X. and D.L.; writing—original draft preparation, J.Z. and X.S.; writing—review and editing, J.Z., X.Q. and X.S.; supervision, J.Z. and X.S.; project administration, X.S.; funding acquisition, X.S. and D.L. All authors have read and agreed to the published version of the manuscript.

Funding

The research was funded by the Natural Science Foundation of Jiangsu Province (No. BK20220093), the National Natural Science Foundation of China (Nos. 4213000544 and 42271058), the Second Tibetan Plateau Scientific Expedition and Research Program (No. 2019QZKK0306) and the Youth Innovation Promotion Association of CAS (2021310).

Institutional Review Board Statement

Not applicable.

Informed Consent Statement

Not applicable.

Data Availability Statement

Not applicable.

Conflicts of Interest

The authors declare no conflict of interest.

References

  1. Rawal, A.; Chakraborty, S.; Li, B.; Lewis, K.; Godoy, M.; Paulette, L.; Weindorf, D.C. Determination of base saturation percentage in agricultural soils via portable X-ray fluorescence spectrometer. Geoderma 2019, 338, 375–382. [Google Scholar] [CrossRef]
  2. Zhang, G.-L.; Gong, Z.-T. Soil Survery Laboratory Methods; Science Press: Beijing, China, 2012. (In Chinese) [Google Scholar]
  3. Richter, A.K.; Hirano, Y.; Luster, J.; Frossard, E.; Brunner, I. Soil base saturation affects root growth of European beech seedlings. J. Plant Nutr. Soil Sci. 2011, 174, 408–419. [Google Scholar] [CrossRef]
  4. Ouimet, R.; Camire, C.; Furlan, V. Effect of soil K, Ca and Mg saturation and endomycorrhization on growth and nutrient uptake of sugar maple seedlings. Plant Soil 1996, 179, 207–216. [Google Scholar] [CrossRef]
  5. Collignon, C.; Calvaruso, C.; Turpault, M.P. Temporal dynamics of exchangeable K, Ca and Mg in acidic bulk soil and rhizosphere under Norway spruce (Picea abies Karst.) and beech (Fagus sylvatica L.) stands. Plant Soil 2011, 349, 355–366. [Google Scholar] [CrossRef]
  6. Luo, X.X.; Liu, G.C.; Xia, Y.; Chen, L.; Jiang, Z.X.; Zheng, H.; Wang, Z.Y. Use of biochar-compost to improve properties and productivity of the degraded coastal soil in the Yellow River Delta, China. J. Soils Sediments 2017, 17, 780–789. [Google Scholar] [CrossRef]
  7. Lucas, R.W.; Klaminder, J.; Futter, M.N.; Bishop, K.H.; Egnell, G.; Laudon, H.; Hogberg, P. A meta-analysis of the effects of nitrogen additions on base cations: Implications for plants, soils, and streams. For. Ecol. Manag. 2011, 262, 95–104. [Google Scholar] [CrossRef]
  8. Dordas, C. Foliar application of calcium and magnesium improves growth, yield, and essential oil yield of oregano (Origanum vulgare ssp hirtum). Ind. Crops Prod. 2009, 29, 599–608. [Google Scholar] [CrossRef]
  9. Li, S.T.; Duan, Y.; Guo, T.W.; Zhang, P.L.; He, P.; Johnston, A.; Shcherbakov, A. Potassium management in potato production in Northwest region of China. Field Crops Res. 2015, 174, 48–54. [Google Scholar] [CrossRef]
  10. Cakmak, I.; Horst, W.J. Effect of aluminium on lipid peroxidation, superoxide dismutase, catalase, and peroxidase activities in root tips of soybean (Glycine max). Physiol. Plant. 1991, 83, 463–468. [Google Scholar] [CrossRef]
  11. Delhaize, E.; Ryan, P.R. Aluminum Toxicity and Tolerance in Plants. Plant Physiol. 1995, 107, 315–321. [Google Scholar] [CrossRef] [Green Version]
  12. Kochian, L.V. Cellular Mechanisms of Aluminum Toxicity and Resistance in Plants. Annu. Rev. Plant Physiol. Plant Mol. Biol. 1995, 46, 237–260. [Google Scholar] [CrossRef]
  13. Kinraide, T.B. Toxicity factors in acidic forest soils: Attempts to evaluate separately the toxic effects of excessive Al3+ and H+ and insufficient Ca2+ and Mg2+ upon root elongation. Eur. J. Soil Sci. 2003, 54, 323–333. [Google Scholar] [CrossRef]
  14. Kobayashi, Y.; Kobayashi, Y.; Watanabe, T.; Shaff, J.E.; Ohta, H.; Kochian, L.V.; Wagatsuma, T.; Kinraide, T.B.; Koyama, H. Molecular and Physiological Analysis of Al3+ and H+ Rhizotoxicities at Moderately Acidic Conditions. Plant Physiol. 2013, 163, 180–192. [Google Scholar] [CrossRef] [PubMed] [Green Version]
  15. National Bureau of Statistics of China. China Statistical Yearbook; China Statistical Publishing House: Beijing, China, 2021.
  16. Huang, P.; Zhang, J.B.; Xin, X.L.; Zhu, A.N.; Zhang, C.Z.; Ma, D.H.; Zhu, Q.G.; Yang, S.; Wu, S.J. Proton accumulation accelerated by heavy chemical nitrogen fertilization and its long-term impact on acidifying rate in a typical arable soil in the Huang-Huai-Hai Plain. J. Integr. Agric. 2015, 14, 148–157. [Google Scholar] [CrossRef]
  17. Han, J.P.; Shi, J.C.; Zeng, L.Z.; Xu, J.M.; Wu, L.S. Effects of nitrogen fertilization on the acidity and salinity of greenhouse soils. Environ. Sci. Pollut. Res. 2015, 22, 2976–2986. [Google Scholar] [CrossRef] [PubMed]
  18. Yimer, F.; Ledin, S.; Abdelkadir, A. Concentrations of exchangeable bases and cation exchange capacity in soils of cropland, grazing and forest in the Bale Mountains, Ethiopia. For. Ecol. Manag. 2008, 256, 1298–1302. [Google Scholar] [CrossRef]
  19. Nawaz, R.; Parkpian, P.; Garivait, H.; Anurakpongsatorn, P.; DeLaune, R.D.; Jugsujinda, A. Impacts of Acid Rain on Base Cations, Aluminum, and Acidity Development in Highly Weathered Soils of Thailand. Commun. Soil Sci. Plant Anal. 2012, 43, 1382–1400. [Google Scholar] [CrossRef]
  20. Rice, K.C.; Herman, J.S. Acidification of Earth: An assessment across mechanisms and scales. Appl. Geochem. 2012, 27, 1–14. [Google Scholar] [CrossRef]
  21. Zhou, J.; Xia, F.; Liu, X.M.; He, Y.; Xu, J.M.; Brookes, P.C. Effects of nitrogen fertilizer on the acidification of two typical acid soils in South China. J. Soils Sediments 2014, 14, 415–422. [Google Scholar] [CrossRef]
  22. Zeng, M.F.; de Vries, W.; Bonten, L.T.C.; Zhu, Q.C.; Hao, T.X.; Liu, X.J.; Xu, M.G.; Shi, X.J.; Zhang, F.S.; Shen, J.B. Model-Based Analysis of the Long-Term Effects of Fertilization Management on Cropland Soil Acidification. Environ. Sci. Technol. 2017, 51, 3843–3851. [Google Scholar] [CrossRef] [PubMed]
  23. Zhu, D.D.; Zhan, L.P.; Cong, R.H.; Li, X.K. Effects of rice (Oryza sativa L.) cultivation and soil type on potassium mobilization and transformation behavior. Can. J. Soil Sci. 2018, 98, 500–507. [Google Scholar] [CrossRef]
  24. Leitgeb, E.; Ghosh, S.; Dobbs, M.; Englisch, M.; Michel, K. Distribution of nutrients and trace elements in forest soils of Singapore. Chemosphere 2019, 222, 62–70. [Google Scholar] [CrossRef] [PubMed]
  25. Lu, X.K.; Mao, Q.G.; Gilliam, F.S.; Luo, Y.Q.; Mo, J.M. Nitrogen deposition contributes to soil acidification in tropical ecosystems. Glob. Change Biol. 2014, 20, 3790–3801. [Google Scholar] [CrossRef] [Green Version]
  26. Martinsen, V.; Alling, V.; Nurida, N.L.; Mulder, J.; Hale, S.E.; Ritz, C.; Rutherford, D.W.; Heikens, A.; Breedveld, G.D.; Cornelissen, G. pH effects of the addition of three biochars to acidic Indonesian mineral soils. Soil Sci. Plant Nutr. 2015, 61, 821–834. [Google Scholar] [CrossRef] [Green Version]
  27. Moreira, A.; Sfredo, G.J.; Moraes, L.A.C.; Fageria, N.K. Lime and Cattle Manure in Soil Fertility and Soybean Grain Yield Cultivated in Tropical Soil. Commun. Soil Sci. Plant Anal. 2015, 46, 1157–1169. [Google Scholar] [CrossRef]
  28. Agegnehu, G.; Bass, A.M.; Nelson, P.N.; Bird, M.I. Benefits of biochar, compost and biochar-compost for soil quality, maize yield and greenhouse gas emissions in a tropical agricultural soil. Sci. Total Environ. 2016, 543, 295–306. [Google Scholar] [CrossRef]
  29. Yang, L.; Jiao, Y.; Fahmy, S.; Zhu, A.X.; Hann, S.; Burt, J.E.; Qi, F. Updating Conventional Soil Maps through Digital Soil Mapping. Soil Sci. Soc. Am. J. 2011, 75, 1044–1053. [Google Scholar] [CrossRef] [Green Version]
  30. Zhu, A.; Yang, L.; Fan, N.; Zeng, C.; Zhang, G. The review and outlook of digital soil mapping. Prog. Geogr. 2018, 37, 66–78. (In Chinese) [Google Scholar]
  31. Jenny, H. Factors of Soil Formation: A System of Quantitative Pedology; McGraw Hill: New York, NY, USA, 1941. [Google Scholar]
  32. McBratney, A.B.; Santos, M.L.M.; Minasny, B. On digital soil mapping. Geoderma 2003, 117, 3–52. [Google Scholar] [CrossRef]
  33. Hengl, T.; Heuvelink, G.B.M.; Kempen, B.; Leenaars, J.G.B.; Walsh, M.G.; Shepherd, K.D.; Sila, A.; MacMillan, R.A.; de Jesus, J.M.; Tamene, L.; et al. Mapping Soil Properties of Africa at 250 m Resolution: Random Forests Significantly Improve Current Predictions. PLoS ONE 2015, 10, e0125814. [Google Scholar] [CrossRef]
  34. Song, F.-F.; Xu, M.-G.; Duan, Y.-H.; Cai, Z.-J.; Wen, S.-L.; Chen, X.-N.; Shi, W.-Q.; Colinet, G. Spatial variability of soil properties in red soil and its implications for site-specific fertilizer management. J. Integr. Agric. 2020, 19, 2313–2325. [Google Scholar] [CrossRef]
  35. Tesfahunegn, G.B.; Tamene, L.; Vlek, P.L.G. Catchment-scale spatial variability of soil properties and implications on site-specific soil management in northern Ethiopia. Soil Tillage Res. 2011, 117, 124–139. [Google Scholar] [CrossRef]
  36. Hou, E.; Wen, D.; Li, J.; Zuo, W.; Zhang, L.; Kuang, Y.; Li, J. Soil acidity and exchangeable cations in remnant natural and plantation forests in the urbanised Pearl River Delta, China. Soil Res. 2012, 50, 207–215. [Google Scholar] [CrossRef]
  37. Behera, S.K.; Mathur, R.K.; Shukla, A.K.; Suresh, K.; Prakash, C. Spatial variability of soil properties and delineation of soil management zones of oil palm plantations grown in a hot and humid tropical region of southern India. Catena 2018, 165, 251–259. [Google Scholar] [CrossRef]
  38. Li, T.; Liang, J.; Chen, X.; Wang, H.; Zhang, S.; Pu, Y.; Xu, X.; Li, H.; Xu, J.; Wu, X.; et al. The interacting roles and relative importance of climate, topography, soil properties and mineralogical composition on soil potassium variations at a national scale in China. Catena 2021, 196, 104875. [Google Scholar] [CrossRef]
  39. Grimm, R.; Behrens, T.; Maerker, M.; Elsenbeer, H. Soil organic carbon concentrations and stocks on Barro Colorado Island—Digital soil mapping using Random Forests analysis. Geoderma 2008, 146, 102–113. [Google Scholar] [CrossRef]
  40. Veronesi, F.; Corstanje, R.; Mayr, T. Mapping soil compaction in 3D with depth functions. Soil Tillage Res. 2012, 124, 111–118. [Google Scholar] [CrossRef]
  41. Hengl, T.; de Jesus, J.M.; MacMillan, R.A.; Batjes, N.H.; Heuvelink, G.B.M.; Ribeiro, E.; Samuel-Rosa, A.; Kempen, B.; Leenaars, J.G.B.; Walsh, M.G.; et al. SoilGrids1km—Global Soil Information Based on Automated Mapping. PLoS ONE 2014, 9, e105992. [Google Scholar] [CrossRef] [PubMed] [Green Version]
  42. Veronesi, F.; Corstanje, R.; Mayr, T. Landscape scale estimation of soil carbon stock using 3D modelling. Sci. Total Environ. 2014, 487, 578–586. [Google Scholar] [CrossRef] [PubMed]
  43. Aldana-Jague, E.; Heckrath, G.; Macdonald, A.; van Wesemael, B.; Van Oost, K. UAS-based soil carbon mapping using VIS-NIR (480–1000 nm) multi-spectral imaging: Potential and limitations. Geoderma 2016, 275, 55–66. [Google Scholar] [CrossRef]
  44. Rentschler, T.; Gries, P.; Behrens, T.; Bruelheide, H.; Kuehn, P.; Seitz, S.; Shi, X.; Trogisch, S.; Scholten, T.; Schmidt, K. Comparison of catchment scale 3D and 2.5D modelling of soil organic carbon stocks in Jiangxi Province, PR China. PLoS ONE 2019, 14, e0220881. [Google Scholar] [CrossRef]
  45. Rentschler, T.; Bartelheim, M.; Behrens, T.; Bonilla, M.D.-Z.; Teuber, S.; Scholten, T.; Schmidt, K. Contextual spatial modelling in the horizontal and vertical domains. Sci. Rep. 2022, 12, 9496. [Google Scholar] [CrossRef]
  46. Xu, R. Research Progresses in Soil Acidification and Its Control. Soils 2015, 47, 238–244. (In Chinese) [Google Scholar]
  47. Gong, Z.-T. Theory, Methodology and Application of Chinese Soil Taxonomy, 1st ed.; Science Press: Beijing, China, 1999. (In Chinese) [Google Scholar]
  48. IUSS Working Group WRB. World Reference Base for Soil Resources. International Soil Classification System for Naming Soils and Creating Legends for Soil Maps; FAO: Rome, Italy, 2014. [Google Scholar]
  49. Song, X.-D.; Liu, F.; Wu, H.-Y.; Cao, Q.; Zhong, C.; Yang, J.-L.; Li, D.-C.; Zhao, Y.-G.; Zhang, G.-L. Effects of long-term K fertilization on soil available potassium in East China. Catena 2020, 188, 104412. [Google Scholar] [CrossRef]
  50. Barak, P.; Jobe, B.O.; Krueger, A.R.; Peterson, L.A.; Laird, D.A. Effects of long-term soil acidification due to nitrogen fertilizer inputs in Wisconsin. Plant Soil 1997, 197, 61–69. [Google Scholar] [CrossRef]
  51. Bishop, T.F.A.; McBratney, A.B.; Laslett, G.M. Modelling soil attribute depth functions with equal-area quadratic smoothing splines. Geoderma 1999, 91, 27–45. [Google Scholar] [CrossRef]
  52. Jarvis, A.; Reuter, H.I.; Nelson, A.; Guevara, E. Hole-filled SRTM for the globe Version 4. 2008. Available online: https://srtm.csi.cgiar.org/ (accessed on 8 April 2021).
  53. Yang, L.; Jia, K.; Liang, S.; Liu, J.; Wang, X. Comparison of Four Machine Learning Methods for Generating the GLASS Fractional Vegetation Cover Product from MODIS Data. Remote Sens. 2016, 8, 682. [Google Scholar] [CrossRef] [Green Version]
  54. Xiao, Z.; Liang, S.; Jiang, B. Evaluation of four long time-series global leaf area index products. Agric. For. Meteorol. 2017, 246, 218–230. [Google Scholar] [CrossRef]
  55. Yao, Y.; Liang, S.; Li, X.; Chen, J.; Wang, K.; Jia, K.; Cheng, J.; Jiang, B.; Fisher, J.B.; Mu, Q.; et al. A satellite-based hybrid algorithm to determine the Priestley-Taylor parameter for global terrestrial latent heat flux estimation across multiple biomes. Remote Sens. Environ. 2015, 165, 216–233. [Google Scholar] [CrossRef] [Green Version]
  56. Song, X.-D.; Brus, D.J.; Liu, F.; Li, D.-C.; Zhao, Y.-G.; Yang, J.-L.; Zhang, G.-L. Mapping soil organic carbon content by geographically weighted regression: A case study in the Heihe River Basin, China. Geoderma 2016, 261, 11–22. [Google Scholar] [CrossRef]
  57. Williams, C.G.; Ojuri, O.O. Predictive modelling of soils’ hydraulic conductivity using artificial neural network and multiple linear regression. SN Appl. Sci. 2021, 3, 152. [Google Scholar] [CrossRef]
  58. Fotheringham, A.; Brunsdon, C.; Charlton, M. Geographically Weighted Regression With a Non-Euclidean Distance Metric: A Case Study Using Hedonic House Price Data. Int. J. Geogr. Inf. Sci. 2014, 28, 660–681. [Google Scholar] [CrossRef]
  59. Breiman, L. Random Forests. Mach. Learn. 2001, 45, 5–32. [Google Scholar] [CrossRef] [Green Version]
  60. Song, X.; Zhang, G.; Liu, F.; Li, D.; Zhao, Y.; Yang, J. Modeling spatio-temporal distribution of soil moisture by deep learning-based cellular automata model. J. Arid Land 2016, 8, 734–748. [Google Scholar] [CrossRef] [Green Version]
  61. Meinshausen, N. Quantile regression forests. J. Mach. Learn. Res. 2006, 7, 983–999. [Google Scholar]
  62. Minasny, B.; Setiawan, B.I.; Arif, C.; Saptomo, S.K.; Chadirin, Y. Digital mapping for cost-effective and accurate prediction of the depth and carbon stocks in Indonesian peatlands. Geoderma 2016, 272, 20–31. [Google Scholar] [CrossRef]
  63. Loiseau, T.; Chen, S.; Mulder, V.L.; Dobarco, M.R.; Richer-de-Forges, A.C.; Lehmann, S.; Bourennane, H.; Saby, N.P.A.; Martin, M.P.; Vaudour, E.; et al. Satellite data integration for soil clay content modelling at a national scale. Int. J. Appl. Earth Obs. Geoinform. 2019, 82, 101905. [Google Scholar] [CrossRef]
  64. Liu, F.; Zhang, G.-L.; Song, X.; Li, D.; Zhao, Y.; Yang, J.; Wu, H.; Yang, F. High-resolution and three-dimensional mapping of soil texture of China. Geoderma 2020, 361, 114061. [Google Scholar] [CrossRef]
  65. Wang, W.; Wang, Z.; Gao, M.; Huang, L. Effects of Nitrogen Application on Exchangeable Acidity and Base Saturation in Purple Soil. J. Soil Water Conserv. 2014, 28, 138–142. [Google Scholar]
  66. Zhu, Q.; De Vries, W.; Liu, X.; Zeng, M.; Hao, T.; Du, E.; Zhang, F.; Shen, J. The contribution of atmospheric deposition and forest harvesting to forest soil acidification in China since 1980. Atmos. Environ. 2016, 146, 215–222. [Google Scholar] [CrossRef] [Green Version]
  67. Yu, Z.; Chen, H.Y.H.; Searle, E.B.; Sardans, J.; Ciais, P.; Penuelas, J.; Huang, Z. Whole soil acidification and base cation reduction across subtropical China. Geoderma 2020, 361, 114107. [Google Scholar] [CrossRef]
  68. Tong, D.; Xu, R. Effects of urea and (NH4)(2)SO4 on nitrification and acidification of Ultisols from Southern China. J. Environ. Sci. 2012, 24, 682–689. [Google Scholar] [CrossRef]
  69. Chen, X.H.; Yu, W.H.; Cai, Y.Y.; Zhang, S.W.; Muneer, M.A.; Zhu, Q.C.; Xu, D.H.; Ma, C.C.; Yan, X.J.; Li, Y.; et al. How to identify and adopt cleaner strategies to improve the continuous acidification in orchard soils? J. Clean. Prod. 2022, 330, 129826. [Google Scholar] [CrossRef]
  70. Li, B.; Zhao, Q.; Mao, B.; Sun, Q.-Y. Factors influencing acid buffering capacity of main soil types in eastern China. Shengtaixue Zazhi 2021, 40, 3901–3910. (In Chinese) [Google Scholar] [CrossRef]
  71. Tang, X.; Cai, Z.; Xu, M.; Liang, F.; Wen, S.; Gao, Q. Acidity characteristics of red soil profile under different land use patterns. J. Plant Nutr. Fert. 2018, 24, 1704–1712. (In Chinese) [Google Scholar]
  72. Chen, X.B.; Wang, A.H.; Li, Y.; Hu, L.N.; Zheng, H.; He, X.Y.; Ge, T.D.; Wu, J.S.; Kuzyakov, Y.; Su, Y.R. Fate of C-14-labeled dissolved organic matter in paddy and upland soils in responding to moisture. Sci. Total Environ. 2014, 488, 268–274. [Google Scholar] [CrossRef]
  73. Habib, F.; Javid, S.; Saleem, I.; Ehsan, S.; Ahmad, Z.A. Potassium dynamics in soil under long term regimes of organic and inorganic fertilizer application. Soil Environ. 2014, 33, 110–115. [Google Scholar]
  74. Lima, C.; Pereira, L.D.; Santos, T.O.D.; Pinto, S.N.; Rodrigues, A.C.; Nunes, L. Soil changes and yield of maize fertilized with swine wastewater. Rev. Caatinga 2019, 32, 167–178. [Google Scholar] [CrossRef]
  75. Hou, L.Y.; Liu, Z.J.; Zhao, J.R.; Ma, P.Y.; Xu, X.P. Comprehensive assessment of fertilization, spatial variability of soil chemical properties, and relationships among nutrients, apple yield and orchard age: A case study in Luochuan County, China. Ecol. Indic. 2021, 122, 107285. [Google Scholar] [CrossRef]
  76. Xiaokun, L.; Jianwei, L.; Lishu, W. Advance on Mechanisms of Soil Potassium Fixation and Release. Hubei Agric. Sci. 2008, 47, 473–477. [Google Scholar]
  77. Zhang, F.; Wang, J.; Zhang, W.; Cui, Z.; Ma, W.; Chen, X.; Jiang, R. Nutrient use efficiencies of major cereal crops in China and measures for improvemennt. Acta Pedol. Sin. 2008, 45, 915–924. (In Chinese) [Google Scholar]
  78. He, P.; Yang, L.; Xu, X.; Zhao, S.; Chen, F.; Li, S.; Tu, S.; Jin, J.; Johnston, A.M. Temporal and spatial variation of soil available potassium in China (1990–2012). Field Crops Res. 2015, 173, 49–56. [Google Scholar] [CrossRef]
  79. Su, X.; Huang, B.; Wang, H.; Zhao, Y.; Hu, W.; Sun, W.; Yang, H. Evolution of Soil Properties and Soil Limitation Factors in Different Soil Use and Genetic Conditions in South China. Soils 2013, 45, 135–142. (In Chinese) [Google Scholar]
  80. Jobbagy, E.G.; Jackson, R.B. The distribution of soil nutrients with depth: Global patterns and the imprint of plants. Biogeochemistry 2001, 53, 51–77. [Google Scholar] [CrossRef]
  81. Liu, F.; Wu, H.; Zhao, Y.; Li, D.; Yang, J.-L.; Song, X.; Shi, Z.; Zhu, A.X.; Zhang, G.-L. Mapping high resolution National Soil Information Grids of China. Sci. Bull. 2022, 67, 328–340. [Google Scholar] [CrossRef]
  82. Zhu, X.L.; Fu, S.H.; Wu, Q.Y.; Wang, A.J. Soil detachment capacity of shallow overland flow in Earth-Rocky Mountain Area of Southwest China. Geoderma 2020, 361, 114021. [Google Scholar] [CrossRef]
  83. Zhu, B.; Wang, T.; You, X.; Gao, M.-R. Nutrient release from weathering of purplish rocks in the Sichuan Basin, China. Pedosphere 2008, 18, 257–264. [Google Scholar] [CrossRef]
  84. Zhong, S.Q.; Han, Z.; Duo, J.; Ci, E.; Ni, J.P.; Xie, D.T.; Wei, C.F. Relationships between the lithology of purple rocks and the pedogenesis of purple soils in the Sichuan Basin, China. Sci. Rep. 2019, 9, 13272. [Google Scholar] [CrossRef] [Green Version]
  85. Zhang, C.L.; Zou, X.; Yang, H.; Liang, J.H.; Zhu, T.B. Bioaccumulation and Risk Assessment of Potentially Toxic Elements in Soil-Rice System in Karst Area, Southwest China. Front. Environ. Sci. 2022, 10, 866427. [Google Scholar] [CrossRef]
  86. Li, S.; Jin, J. Characteristics of Nutrient Input/Output and Nutrient Balance in Different Regions of China. Sci. Agric. Sin. 2011, 44, 4207–4229. (In Chinese) [Google Scholar]
  87. Chen, Z.Y.; Stanley, D.J. Sea-level rise on eastern China’s Yangtze delta. J. Coast. Res. 1998, 14, 360–366. [Google Scholar]
  88. Yang, Y.; Chui, T.F.M. Aquatic environmental changes and ecological implications from the combined effects of sea-level rise and land reclamation in Deep Bay, Pearl River Estuary, China. Ecol. Eng. 2017, 108, 30–39. [Google Scholar] [CrossRef]
  89. Dong, Y.; Yang, J.L.; Zhao, X.R.; Yang, S.H.; Zhang, G.L. Contribution of different proton sources to the acidification of red soil with maize cropping in subtropical China. Geoderma 2021, 392, 114995. [Google Scholar] [CrossRef]
Figure 1. Spatial distribution of sampling sites.
Agronomy 13 00781 g001
Figure 2. Changes in the trends of N fertilizer (N), P fertilizer (P2O5), K fertilizer (K2O) and compound fertilizer in the study area. Note that the amount of fertilizer applied here refers to the discounted amount, which is the amount of N fertilizer, P fertilizer, and K fertilizer after converting them to N, P2O5, and K2O as 100 percent of their compositions, respectively. Compound fertilizers are discounted according to the main components they contain. Data in 2006 and before 1999 were obtained by fitting known data.
Agronomy 13 00781 g002
Figure 3. Effects of different land-use types on (a) Exch. Ca, (b) Exch. Mg, (c) Exch. K and (d) Exch. Na in different soil layers. Note: Values are mean with standard error (SE). Different lowercase letters above bars indicate significant differences in the same treatment among different land-use types at the p < 0.05 level. Exch. Ca, exchangeable Ca2+; Exch. Mg, exchangeable Mg2+; Exch. K, exchangeable K+; Exch. Na, exchangeable Na+.
Agronomy 13 00781 g003
Figure 4. Effects of different land-use types on (a) Exch. H, (b) Exch. Al and (c) BSP in different soil layers. Different lowercase letters above bars indicate significant differences in the same treatment among different land-use types at the p < 0.05 level. Exch. H, exchangeable H+; Exch. Al, exchangeable Al3+; BSP, base saturation percentage.
Agronomy 13 00781 g004
Figure 5. Effects of different soil types on (a) Exch. Ca, (b) Exch. Mg, (c) Exch. K and (d) Exch. Na in differ-ent soil layers. Different lowercase letters above bars indicate significant differences in the same treatment among different soil types at the p < 0.05 level.
Agronomy 13 00781 g005
Figure 6. Effects of different soil types on (a) Exch. H, (b) Exch. Al and (c) BSP in different soil layers. Dif-ferent lowercase letters above bars indicate significant differences in the same treatment among different soil types at the p < 0.05 level.
Agronomy 13 00781 g006
Figure 7. The predicted maps of exchangeable base cations at soil depths of 0–20 cm (a,d,g,j), 20–50 cm (b,e,h,k) and 50–100 cm (c,f,i,l).
Agronomy 13 00781 g007
Figure 8. The predicted maps of exchangeable acidic cations and BSP at soil depths of 0–20 cm (a,d,g), 20–50 cm (b,e,h) and 50–100 cm (c,f,i).
Agronomy 13 00781 g008
Table 1. Environmental variables used in this study.
CovariatesAbbr.Factors a)Resolution
ElevationDEMr90 m
SlopeSloper90 m
Plan curvaturePlanCurr90 m
Profile curvatureProCurr90 m
Channel network base levelChannel levelr90 m
Vertical distance to channel networkDisToChannr90 m
Topographic wetness indexTWIr90 m
Multiresolution index of valley bottom flatnessMRVBFr90 m
Multiresolution index of the ridge top flatnessMRRTFr90 m
Normalized difference vegetation indexNDVIo1 km
Fractional vegetation coverFVCo500 m
Leaf area indexLAIo1 km
Mean annual air temperatureMAATcl1 km
Mean annual precipitationMAPcl1 km
Sunshine durationSolarcl1 km
Aridity indexAriditycl1 km
Annual soil temperature at a depth of 0–50 cmSoilTempcl1 km
EvapotranspirationETcl1 km
a) r: terrain attributes; o: organisms; cl: climate.
Table 2. Descriptive statistics of exchangeable cations and base saturation percentage a).
Soil PropertiesDepthNMinMeanMedianMaxSTDSkewnessKurtosis
Exch. Ca0–20 cm7640.024.983.7442.104.952.178.22
(cmol(+)kg−1)20–50 cm7480.024.773.6036.444.891.643.83
50–100 cm7080.014.513.3733.504.791.794.47
Exch. Mg0–20 cm7790.021.140.7513.781.383.5718.66
(cmol(+)kg−1)20–50 cm7650.031.150.689.701.482.879.88
50–100 cm7230.021.280.6817.891.873.7319.44
Exch. K0–20 cm7790.030.270.222.410.223.7622.92
(cmol(+)kg−1)20–50 cm7650.010.190.142.580.185.2951.63
50–100 cm7220.000.180.132.350.174.9342.33
Exch. Na0–20 cm7770.000.220.116.860.486.6261.66
(cmol(+)kg−1)20–50 cm7630.000.220.103.690.454.5922.73
50–100 cm7210.000.240.115.750.525.4136.50
Exch. H0–20 cm8780.000.390.266.500.555.3841.76
(cmol(+)kg−1)20–50 cm8420.000.320.215.660.485.7045.59
50–100 cm7730.000.270.176.090.466.2253.29
Exch. Al0–20 cm8860.002.941.8022.203.031.422.67
(cmol(+)kg−1)20–50 cm8490.002.901.9720.022.981.342.13
50–100 cm7830.002.821.9417.993.021.533.00
BSP0–20 cm11030.4449.3647.87100.0030.650.18-1.19
(%)20–50 cm10670.6848.6747.33100.0031.910.14-1.32
50–100 cm10010.7248.0947.67100.0032.340.16-1.36
a) N: sample size; Min: minimum; Max: maximum; STD: standard deviation; Exch. Ca: exchangeable Ca2+; Exch. Mg: exchangeable Mg2+; Exch. K: exchangeable K+; Exch. Na: exchangeable Na+; Exch. H: exchangeable H+; Exch. Al: exchangeable Al3+; BSP: base saturation percentage.
Table 3. Validation indexes of soil exchangeable cations and BSP after natural log prediction by three methods a).
Soil PropertiesDepth R2 RMSE
MLRGWRRFMLRGWRRF
Exch. Ca0–20 cm0.2340.3210.355 b)1.1581.1051.040
(cmol(+)kg−1)20–50 cm0.2560.3330.3531.2711.2141.180
50–100 cm0.2270.3060.3471.3251.2581.219
Exch. Mg0–20 cm0.2350.2800.3190.9010.8760.849
(cmol(+)kg−1)20–50 cm0.2350.2600.3511.0060.9890.925
50–100 cm0.1700.2170.3381.1161.0860.994
Exch. K0–20 cm0.1120.1800.1880.6260.6020.596
(cmol(+)kg−1)20–50 cm0.2060.2680.2760.6420.6190.613
50–100 cm0.1940.2490.2760.6590.6390.627
Exch. Na0–20 cm0.2110.4040.4790.9640.8410.782
(cmol(+)kg−1)20–50 cm0.2590.4740.5360.9200.7720.727
50–100 cm0.2410.4210.4960.9320.8090.749
Exch. H0–20 cm0.1570.2100.2411.1001.0681.040
(cmol(+)kg−1)20–50 cm0.1630.2120.2081.0571.0331.026
50–100 cm0.0610.1000.1021.1471.1361.125
Exch. Al0–20 cm0.0940.1080.1441.5301.5241.487
(cmol(+)kg−1)20–50 cm0.0780.0860.1301.6201.6181.583
50–100 cm0.0680.0690.0751.6621.6611.670
BSP0–20 cm0.2000.3190.3520.8130.7460.726
(%)20–50 cm0.2060.2730.3240.8810.8500.808
50–100 cm0.1780.2210.3100.9330.9000.824
a) R2: coefficient of determination; RMSE: root mean square error.; b) Bold refers to the best prediction for each scenario.
Disclaimer/Publisher’s Note: The statements, opinions and data contained in all publications are solely those of the individual author(s) and contributor(s) and not of MDPI and/or the editor(s). MDPI and/or the editor(s) disclaim responsibility for any injury to people or property resulting from any ideas, methods, instructions or products referred to in the content.

