Article

A New Idea to Improve the Test Method of Soil Aggregate Stability for Soils with a Texture Gradient

1
College of Resources and Environment/Key Laboratory of Eco-Environments in Three Gorges Region (Ministry of Education), Southwest University, Chongqing 400715, China
2
Key Laboratory of Arable Land Conservation (Southwestern China), Ministry of Agriculture, Chongqing 400715, China
3
State Cultivation Base of Eco-Agriculture for Southwest Mountainous Land, Southwest University, Chongqing 400715, China
*
Author to whom correspondence should be addressed.
Agronomy 2023, 13(5), 1192; https://doi.org/10.3390/agronomy13051192
Submission received: 10 March 2023 / Revised: 14 April 2023 / Accepted: 21 April 2023 / Published: 23 April 2023
(This article belongs to the Special Issue Cultivated Land Sustainability in the Anthropocene)

Abstract

:
It is of great significance to determine soil aggregate stability in predicting agricultural production conditions and soil erosion risk. However, the problem exposed in the process of evaluating soil aggregate stability cannot be ignored: Can the effects of different mechanisms on the degree of soil aggregate breakdown be distinguished by selecting ethanol and water as dispersion media? Based on this question, natural soils with a gradient in soil textures of silty loam to loamy clay were used as the test materials. Deionized water, ethanol and hexane were employed as soaking solutions to quantitatively analyze the extent to which the aggregates were dispersed in static disintegration experiments. The results suggested that the soil hydrophilicity (SH) of six soils with a texture gradient were >1 by comparing the aggregate breakdown index (ABI) of soils undergoing ethanol and hexane dispersion. This indicated that the hydrophilic group (-OH) contained in ethanol interacted with the hydrophilic surfaces of the soil particles. Therefore, the soil hydrophilicity (hydration) should be determined by comparing the ABI values undergoing hexane and water dispersion. From silty loam to loamy clay, the average contribution of hydration to aggregate fragmentation decreases, and the process of aggregate breakdown with different textures is characterized by size selectivity. When the soil aggregates were fragmented into 2–0.25 mm aggregate fractions, for silty loam and sandy clay loam, 0.002–0.02 mm and <0.002 mm particles were preferentially moved; for clay loam and loamy clay, >0.002 mm particles were preferentially moved. When the soil aggregates were fragmented into <0.25 mm aggregate fractions for soils with different textures, the 0.002–0.02 mm and <0.002 mm particles all exhibited preferential migration characteristics. This work provides an idea for improving the methods of aggregate stability measurements in the future.

1. Introduction

Soil aggregate stability is a significant index used to reflect the stabilities of soil structures, and it determines the resistance to soil breakdown resulting from the action of mechanical wheels, raindrop impact, mechanical alimentary action of soil fauna and other external actions [1,2,3]. At present, researchers have mainly focused on the effect of four mechanisms (slaking, differential swelling, raindrop mechanical impact and physicochemical dispersion) for soil aggregate breakdown, especially slaking and raindrop mechanical impact mechanisms [3,4,5,6]. Slaking is generated by the escape of air trapped inside aggregate pore during wetting, and raindrop mechanical impact is mainly generated by the combined effect of the escape of air trapped inside aggregate pore and mechanical impact. Although the above two mechanisms (slaking and raindrops mechanical impact) have different effects on soil aggregate fraction, there is a common overall characteristic, namely, the soil aggregates are wetted with water before dispersion [4,7]. This indicates that the interaction between soil particles and water is an important mechanism affecting soil aggregate breakdown, i.e., soil hydrophilicity [8,9,10]. Generally, soil particles interact with water in two main ways: (1) an interaction between the clay crystal lattice surface and water and (2) an interaction between the exchangeable cations on the clay surface and water [11,12,13,14]. The dry aggregate cannot be dispersed after wetting without this mechanism (soil hydrophilicity) [15]. If the soil is more hydrophilic, the affinity of particles with water will be greater, so as the hydration [9]. Therefore, during rainfall, the breakdown of soil aggregate is not only affected by the slaking caused by soil hydrophilicity but also by the mechanical impact caused by raindrops.
To distinguish the contributions of slaking and mechanical impact on soil aggregate breakdown during a rainfall, Xiao et al. [3], selected ethanol as the raindrop material to simulate the sole influence of mechanical impact on soil aggregate breakdown, and deionized water was selected as the raindrop material to simulate the combined effects of slaking and mechanical impact on soil aggregate breakdown. As we all know, ethanol is a special polar liquid with a hydrophilic group and hydrophobic group [16]. When ethanol contacts soil aggregates, the ethanol absorbed by the soil not only fills the pores of the aggregates but also interacts with the hydrophilic parts of the soil particle surfaces [9]. This process also occurs when water contacts the soil aggregates, and it is attributed to a thin water film that is usually adsorbed on the surfaces of soil particles. Both water and ethanol liquids can interact with the hydrophilic part of soil particle surfaces. This indicates that it is impossible to avoid the influence of slaking caused by soil hydrophilicity on aggregate breakdown by selecting ethanol as raindrops material to simulate sole mechanical impact. Thus, it may not be appropriate to select ethanol solution as raindrop material to compare with water. A nonpolar liquid should be selected, and this liquid should only interact with the hydrophobic part of the soil particle surface apart from filling the soil pores.
Soil internal factors (such as clay, soil organic matter (SOM), Fe/Al oxides, cation exchange capacity (CEC) and so on) influence the ability of aggregates to resist water dispersion [17,18]. Clay binds the particles in the aggregates together and thus protects the aggregates against the disruption caused by raindrops and rapid wetting [19]. During aggregation, because of the high specific surface area and negatively charged surfaces of the clay particles, it easily binds together by metal cations or organic molecules, thus affecting the surface adsorption of organic matter and the formation of microaggregates [20,21,22]. The stabilities of the soil microaggregates are higher than those of soil macroaggregates and are often regarded as a stable compound soil structure [23,24]. Meanwhile, clay has a positive effect on the stabilities of soil aggregates and is a key factor in stabilizing the larger aggregate structures and driving the arrangement and distribution of organic matter in aggregate fractions [25,26,27]. Wudivira et al. [28], found that clay had the greatest impact on the stabilities soil aggregates, followed by SOM, exchangeable sodium and CEC.
Based on this, soils with a clay content gradient (15–35%) were selected as test soils. The deionized water and ethanol were used as soaking solutions in our static disintegration experiments [29]. In addition to these two polar liquids (deionized water and ethanol), a nonpolar solution (hexane) with a hydrophobic group was selected as the other soaking solution to determine whether the hydrophilic groups contained in ethanol can interact with hydrophilic parts of soil particle surface. The properties of three soaking solutions are summarized in Table 1.
The aims of the present study were (i) to verify whether the hydrophilic groups contained in ethanol can interact with hydrophilic parts of the soil particle surface; (ii) to clarify hydrophilicity of soils with a texture gradient; and (iii) to clarify the factors affecting the contribution of soil hydrophilicity to the aggregate breakdown index (ABI).

2. Materials and Methods

2.1. Soil Sample Collection and Determination

Soils with a texture gradient were collected from the Beibei District, Chongqing, China. The experimental soils are attributed to Cambisols according to the World Reference Base (WRB) taxonomy. An X-ray diffraction revealed that the clay minerals of the test soils were mainly illite/smectite mixed-layer and illite [31]. The particle size distribution (PSD) was measured with a laser diffraction particle size analyzer (Malvern Mastersizer 2000). Before measuring the PSD, three optical parameter values of the laser diffraction particle size analyzer were set, namely the soil particle refractive index (1.555), the soil particle absorption index (0.01) and the obscuration range (20–30%). Then, the soil was digested (removal of organic matter and calcium carbonate) and subjected to a dispersion pretreatment (chemical dispersion with sodium hexametaphosphate and physical dispersion with ultrasound). The micromorphology of the soil aggregates was analyzed with scanning electron microscopy (SEM) (Phenom ProX); two parameters were set for the SEM study, namely, the acceleration voltage (10 kv) and the conductive coating (60 s). The SOM, pH, CEC, free Fe oxides (Feo) and bulk density (BD) were determined with conventional methods and are shown in Table 2 [32].

2.2. Soil Aggregate Fractionation

The collected soil was naturally air-dried in a ventilated environment after removing plant roots, animal residues and other impurities. The air-dried soils were dry-hand sieved to obtain 2–5 mm soil aggregates for the experiments. Before the aggregate stability experiments, the test soil aggregates were oven-dried at 40 °C (24 h) to ensure a constant matrix potential [33].

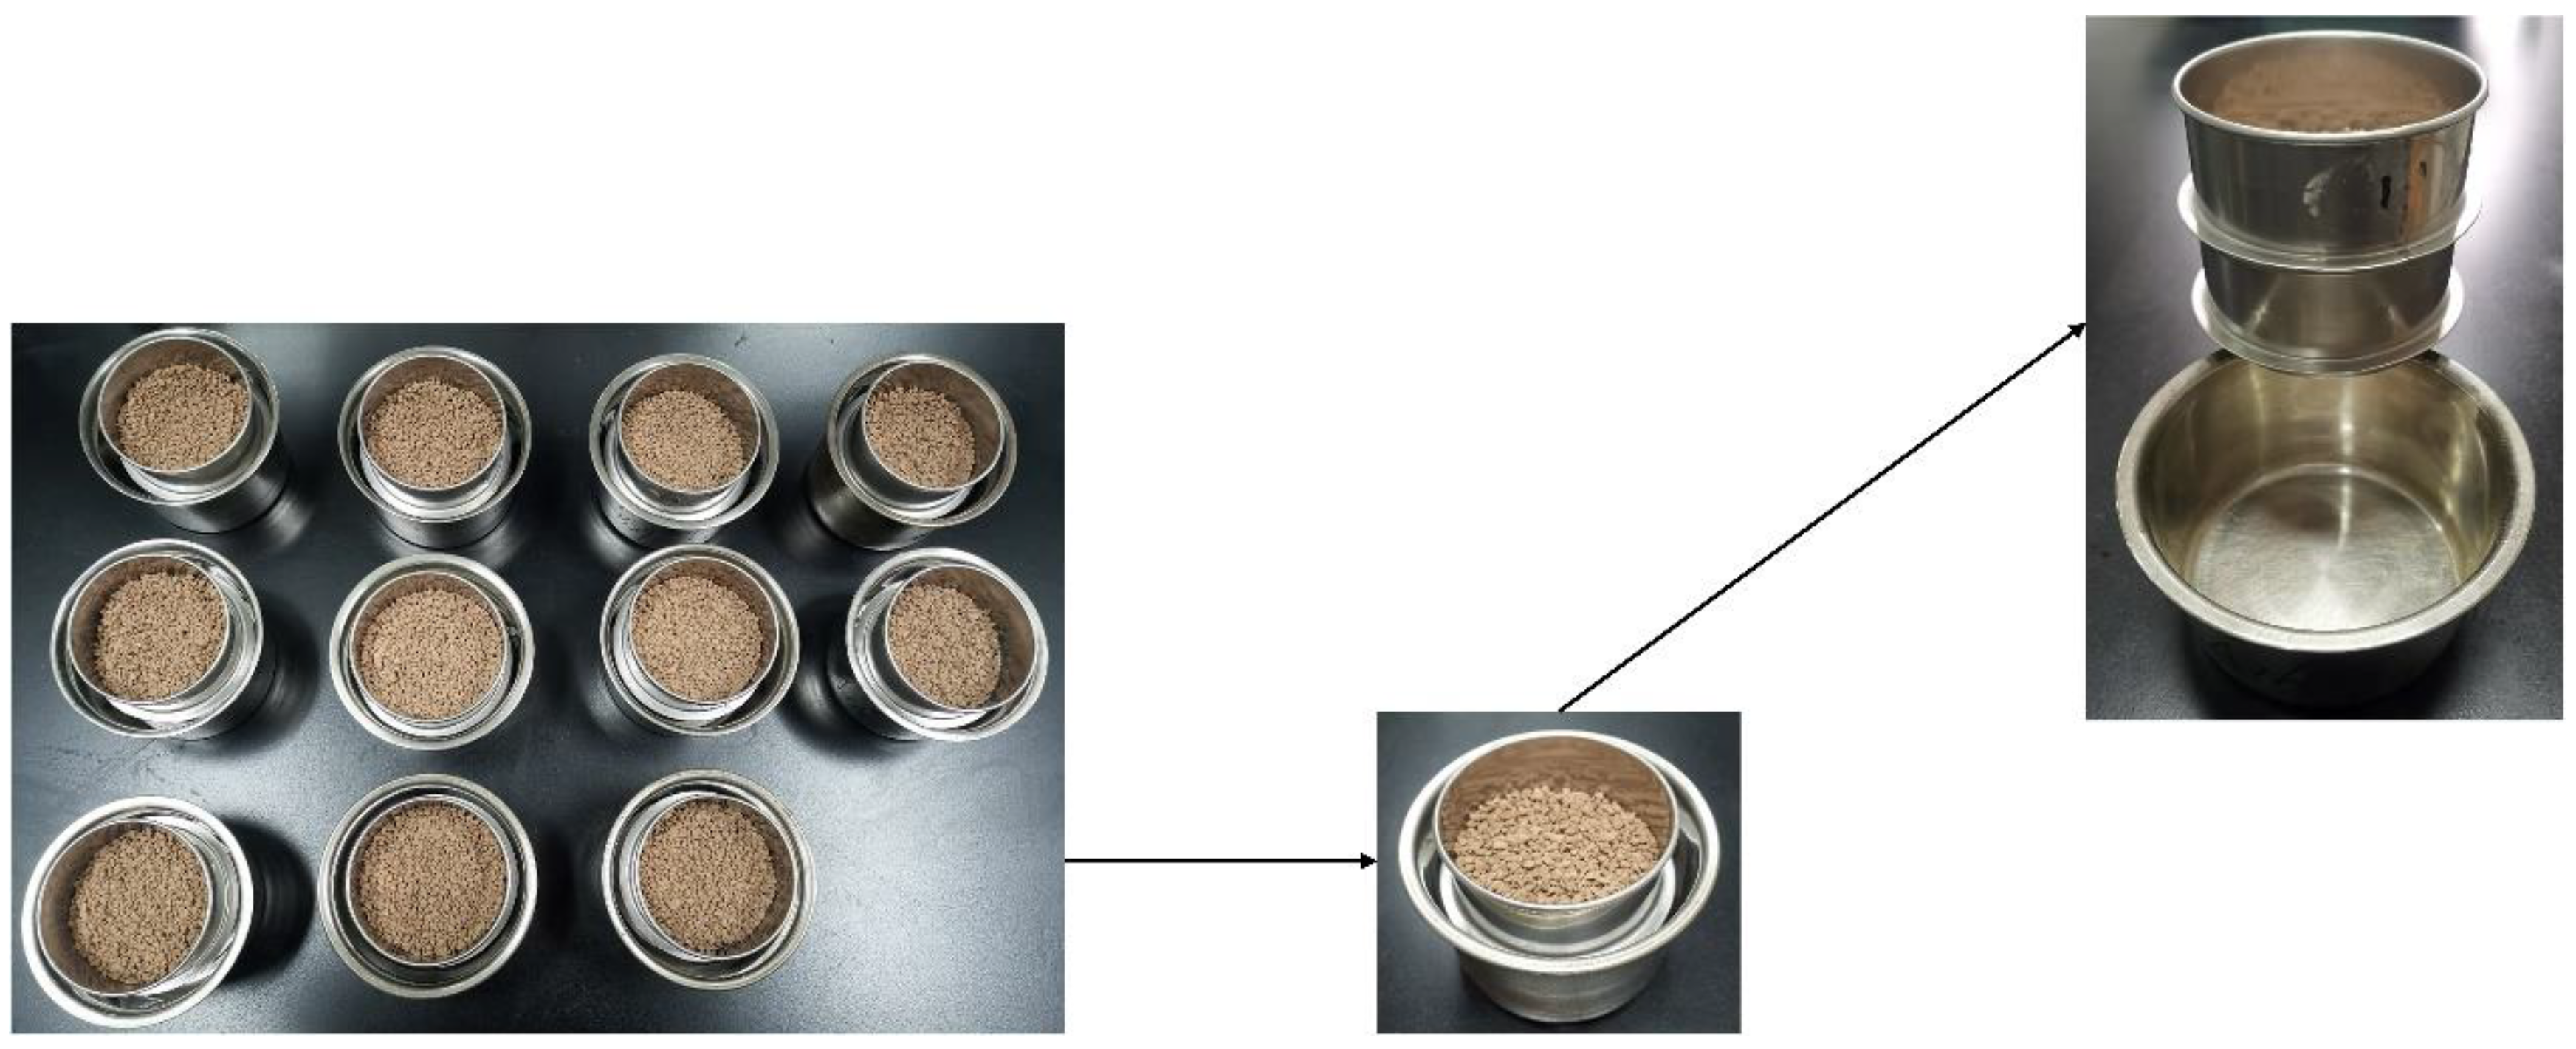
2.3. Experimental Methods

To verify our theoretical speculation in the Introduction, and to prevent disturbances caused by external forces, the stability of the soil aggregates was determined with the static disintegration method [31]. In this experiment, soil aggregates with a texture gradient were used as the research object, and deionized water, ethanol and hexane were selected as immersion solutions. As shown in Table A1, when deionized water was selected as immersion solution, there was no significant difference in the aggregate stability index (ASI) after 100 min, so the soaking times of the soil aggregates were set at 5, 10, 20, 30, 40, 50, 60, 70, 80, 90 and 100 min. Subsequently, 50 g of soil aggregates were placed in the top of each nested 2 and 0.25 mm sieves, respectively (Figure 1), and then they were thoroughly wetted by pouring deionized water around the inside wall of the aluminum box. Finally, the top opening of the box was sealed with fresh-keeping film. When the soaking period reached the specified immersion time, the aggregate fragments with the three grain size ranges (>2 mm, 2–0.25 mm and <0.25 mm) were collected and dried (50 °C) to obtain their masses and then used to determine their microaggregates and particle compositions.
As shown in Table A2, there was little change in the ASI value after various soaking times when ethanol and hexane were used as the soaking solutions, so the soaking times of the soil aggregates were set at 5, 60 and 100 min. An amount of 50 g of soil aggregates were placed in the top of each nested 2 and 0.25 mm sieves (Figure 1), and then they were thoroughly wetted by pouring the soaking solution around the inside wall of the aluminum box. Finally, the top opening of the box was sealed with fresh-keeping film. When the soaking period reached the specified immersion time, the aggregate fragments with three grain sizes were collected. When the soaking solution was ethanol, the aggregate fragments with the three grain size ranges were detached, and the soil particles of different sizes that contained ethanol were removed via frequent washing with deionized water and were then dried (50 °C) to obtain their masses. When the soaking solution was hexane, soil particles of different sizes were detached, and the soil particles of different sizes that contained hexane were washed away with ethanol. Subsequently, we repeated the above ethanol washing procedures and dried (50 °C) the samples to obtain their masses. Hexane is highly volatile, flammable and toxic. The soaking disintegration tests with hexane solution should be carried out in the fume hood. A gas mask, rubber gloves and safety goggles should be worn by the relevant operators. If hexane is dripped on the skin carelessly, it should be washed away with water promptly. Each treatment was repeated in triplicate.
The ASI and ABI values were calculated using (Equations (1) and (2)), respectively [31,34]:
ASI = m a M
ASI = m ( b   /   c ) M
where M (g) is the mass of the initial soil aggregates, and ma (g), mb (g) and mc (g) are the masses of the >2 mm, 2–0.25 mm and <0.25 mm aggregate fractions, respectively.
The degree of aggregation (DA) of <0.01 mm particles was calculated using Equation (3) [35]:
DA = A p P a P b × 100
where AP (%) is the percentage of >0.01 mm aggregate particles; Pa (%) is the percentage of >0.01 mm primary particles; and Pb (%) is the percentage of <0.01 mm primary particles.
The soil hydrophilicity (SH) was calculated with Equation (4) [9]:
SH = ABI p ABI np
where ABIp is the aggregate breakdown index in the polar solution (deionized water or ethanol), and ABInp is the aggregate breakdown index in the nonpolar solution (hexane). If SH > 1, the solution with hydrophilic groups interacts with the hydrophilic parts of soil particle surfaces. Otherwise, the solution with hydrophilic group cannot interact with hydrophilic parts of the soil particle surface.
The contribution of soil hydrophilicity (hydration) (CSH) to aggregate breakdown was calculated with Equation (5):
CSH = ABI w ABI w + ABI h
where ABIw is the aggregate breakdown index in deionized water solution, and ABIh is the aggregate breakdown index in hexane solution.
The enrichment ratio (ER) was used as an important index to evaluate particle sorting, and was calculated with Equation (6) [33]:
ER = proportion   of   effective   particles   in   a   certain   size   fraction   of   the   broken   particle proportion   of   effective   particles   in   a   certain   size   fraction   of   the   original   soil
If ER > 1 for a particular size fraction, the particles in that size fraction were preferentially moved; if ER < 1, the particles in that size fraction were not easily moved.

2.4. Statistical Analysis

The Origin 2021 software was used for data plotting. All statistical analyses were performed with SPSS 26 software and included one-way analysis of variance with least significant difference testing. Pearson correlation analyses were performed to analyse the relationships among the dependent variables (i.e., the ABI and soil physicochemical properties).

3. Results

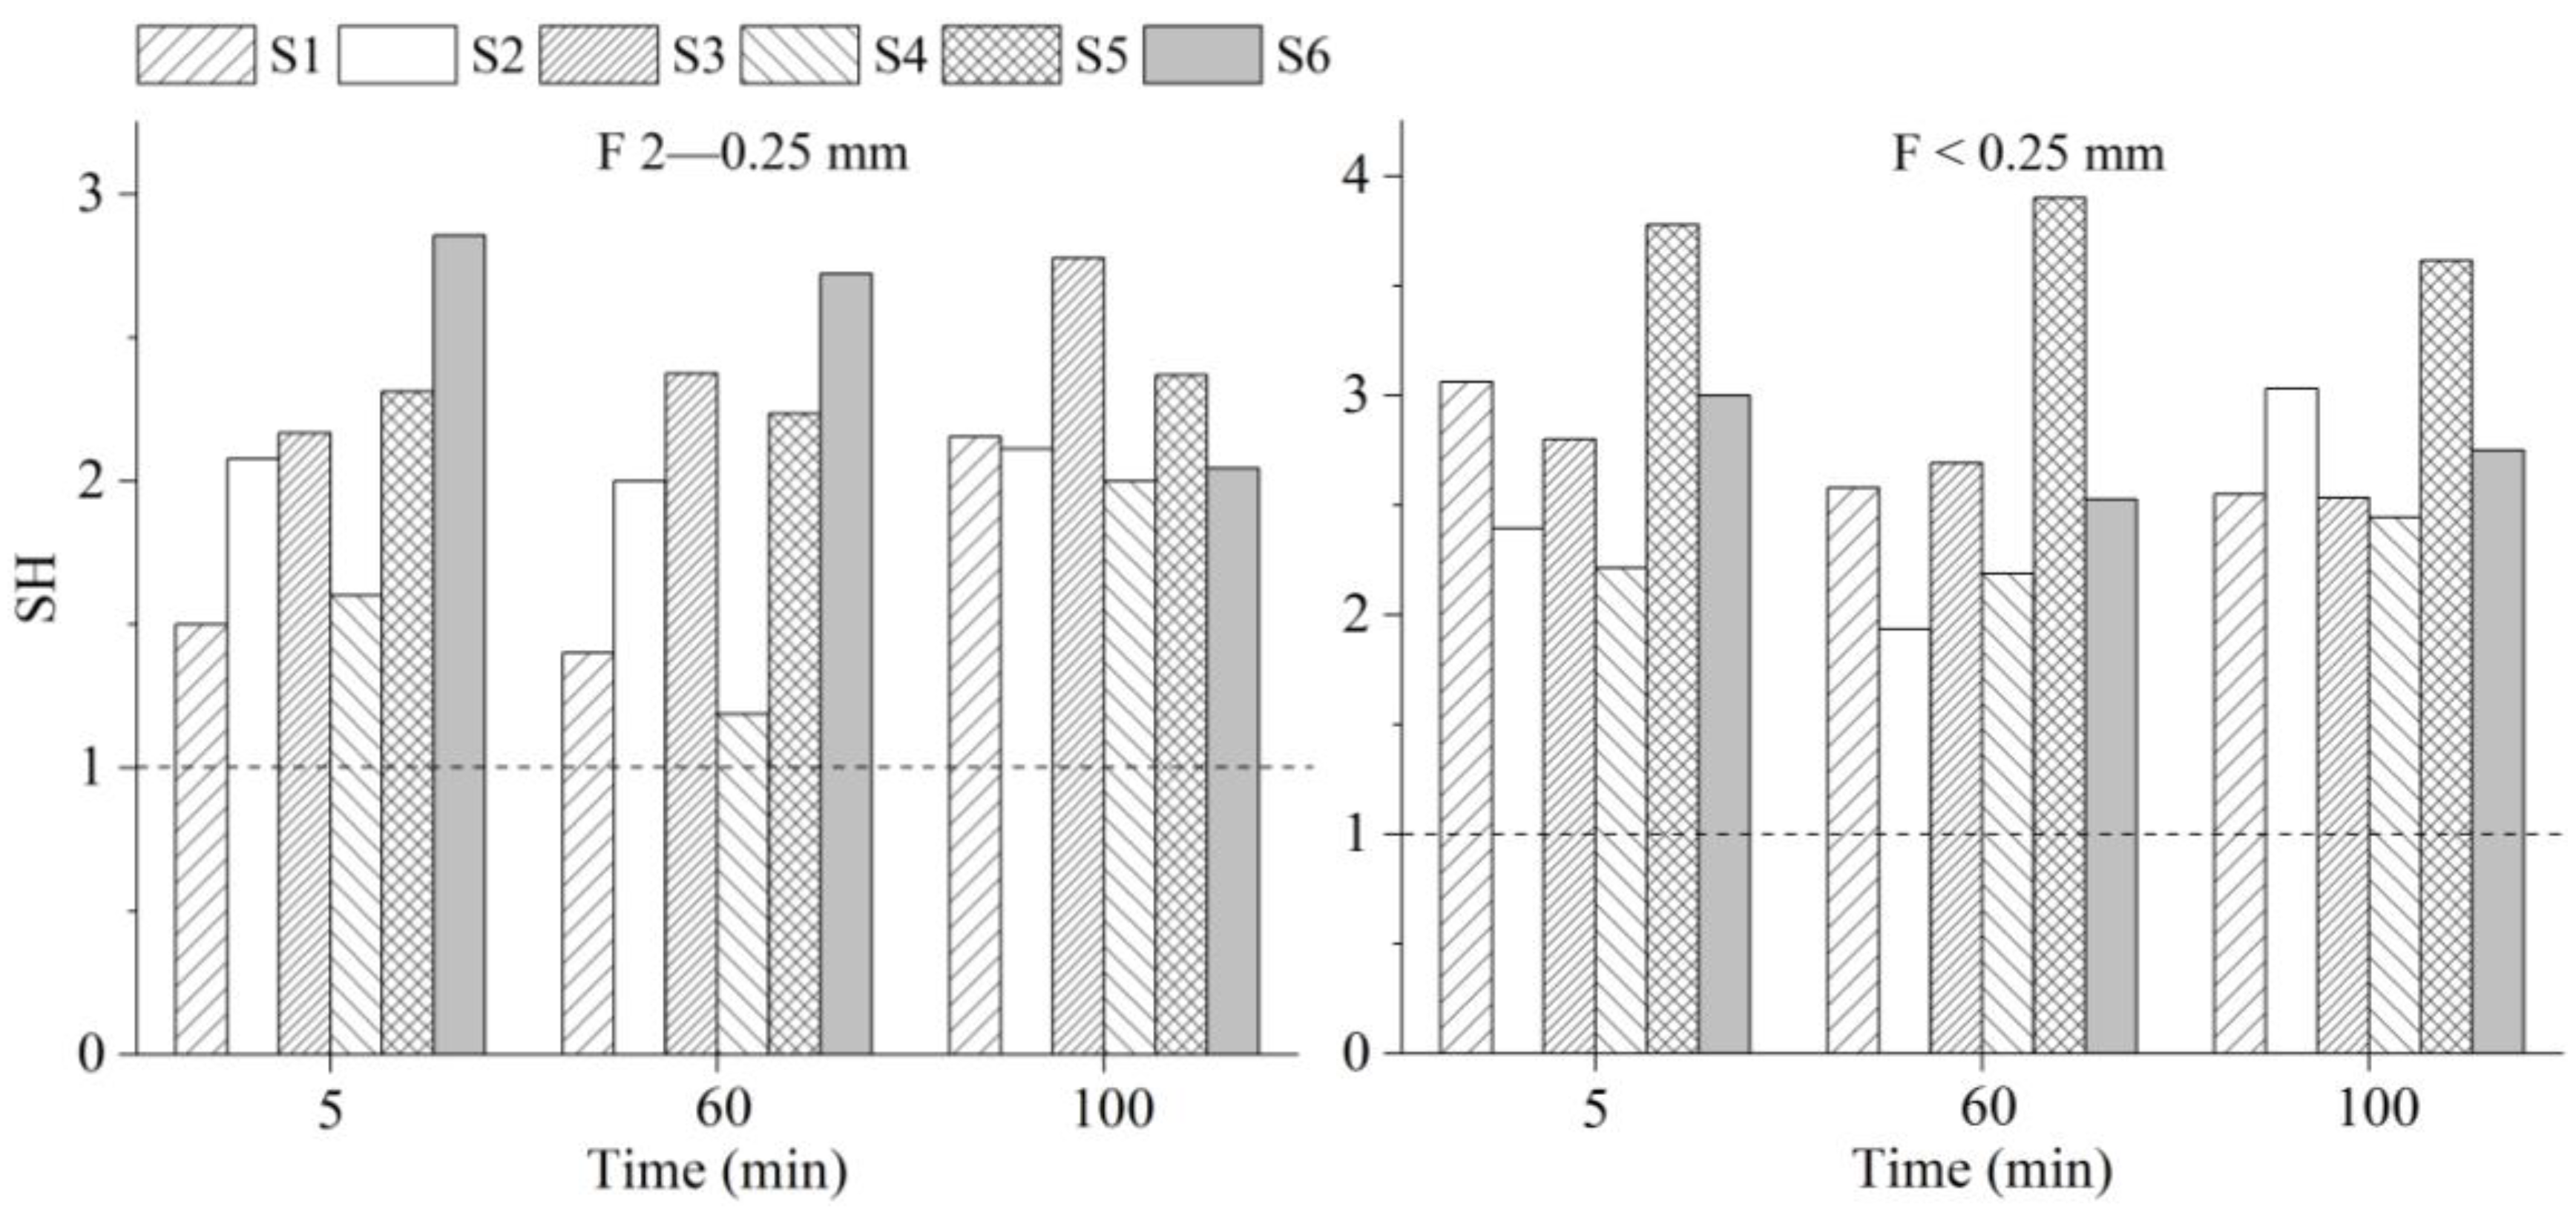
3.1. Soil Hydrophilicity

We found the SH of the six soils with a texture gradient were >1 by comparing the ABI values undergoing ethanol and hexane dispersion (Figure 2). This indicated that the ethanol with the hydrophilic group can interact with hydrophilic parts of the soil particle surfaces. The SH of the six soils with a texture gradient were also found to be >1 by comparing the ABI values undergoing hexane and deionized water dispersion. From Figure 3, it can be seen that soil hydrophilicity for the different texture soils followed the order of silty loam > clay loam > sandy clay loam > loamy clay. Meanwhile, we determined the contribution of soil hydrophilicity (hydration) on aggregate breakdown. When soil aggregates were fragmented into 2–0.25 mm aggregate fractions, the average contributions of hydration to aggregate breakdown for samples S1 to S6 were 99.85%, 99.32%, 99.73%, 98.68%, 97.48% and 96.45%, respectively (Figure 4). When soil aggregates were fragmented into <0.25 mm aggregate fractions, the average contributions of hydration to aggregate breakdown for samples S1 to S6 were 98.11%, 96.86%, 98.13%, 97.58%, 97.50% and 97.19%, respectively. In summary, clay is an important factor in reducing the fragmentation of soil aggregates caused by hydration.

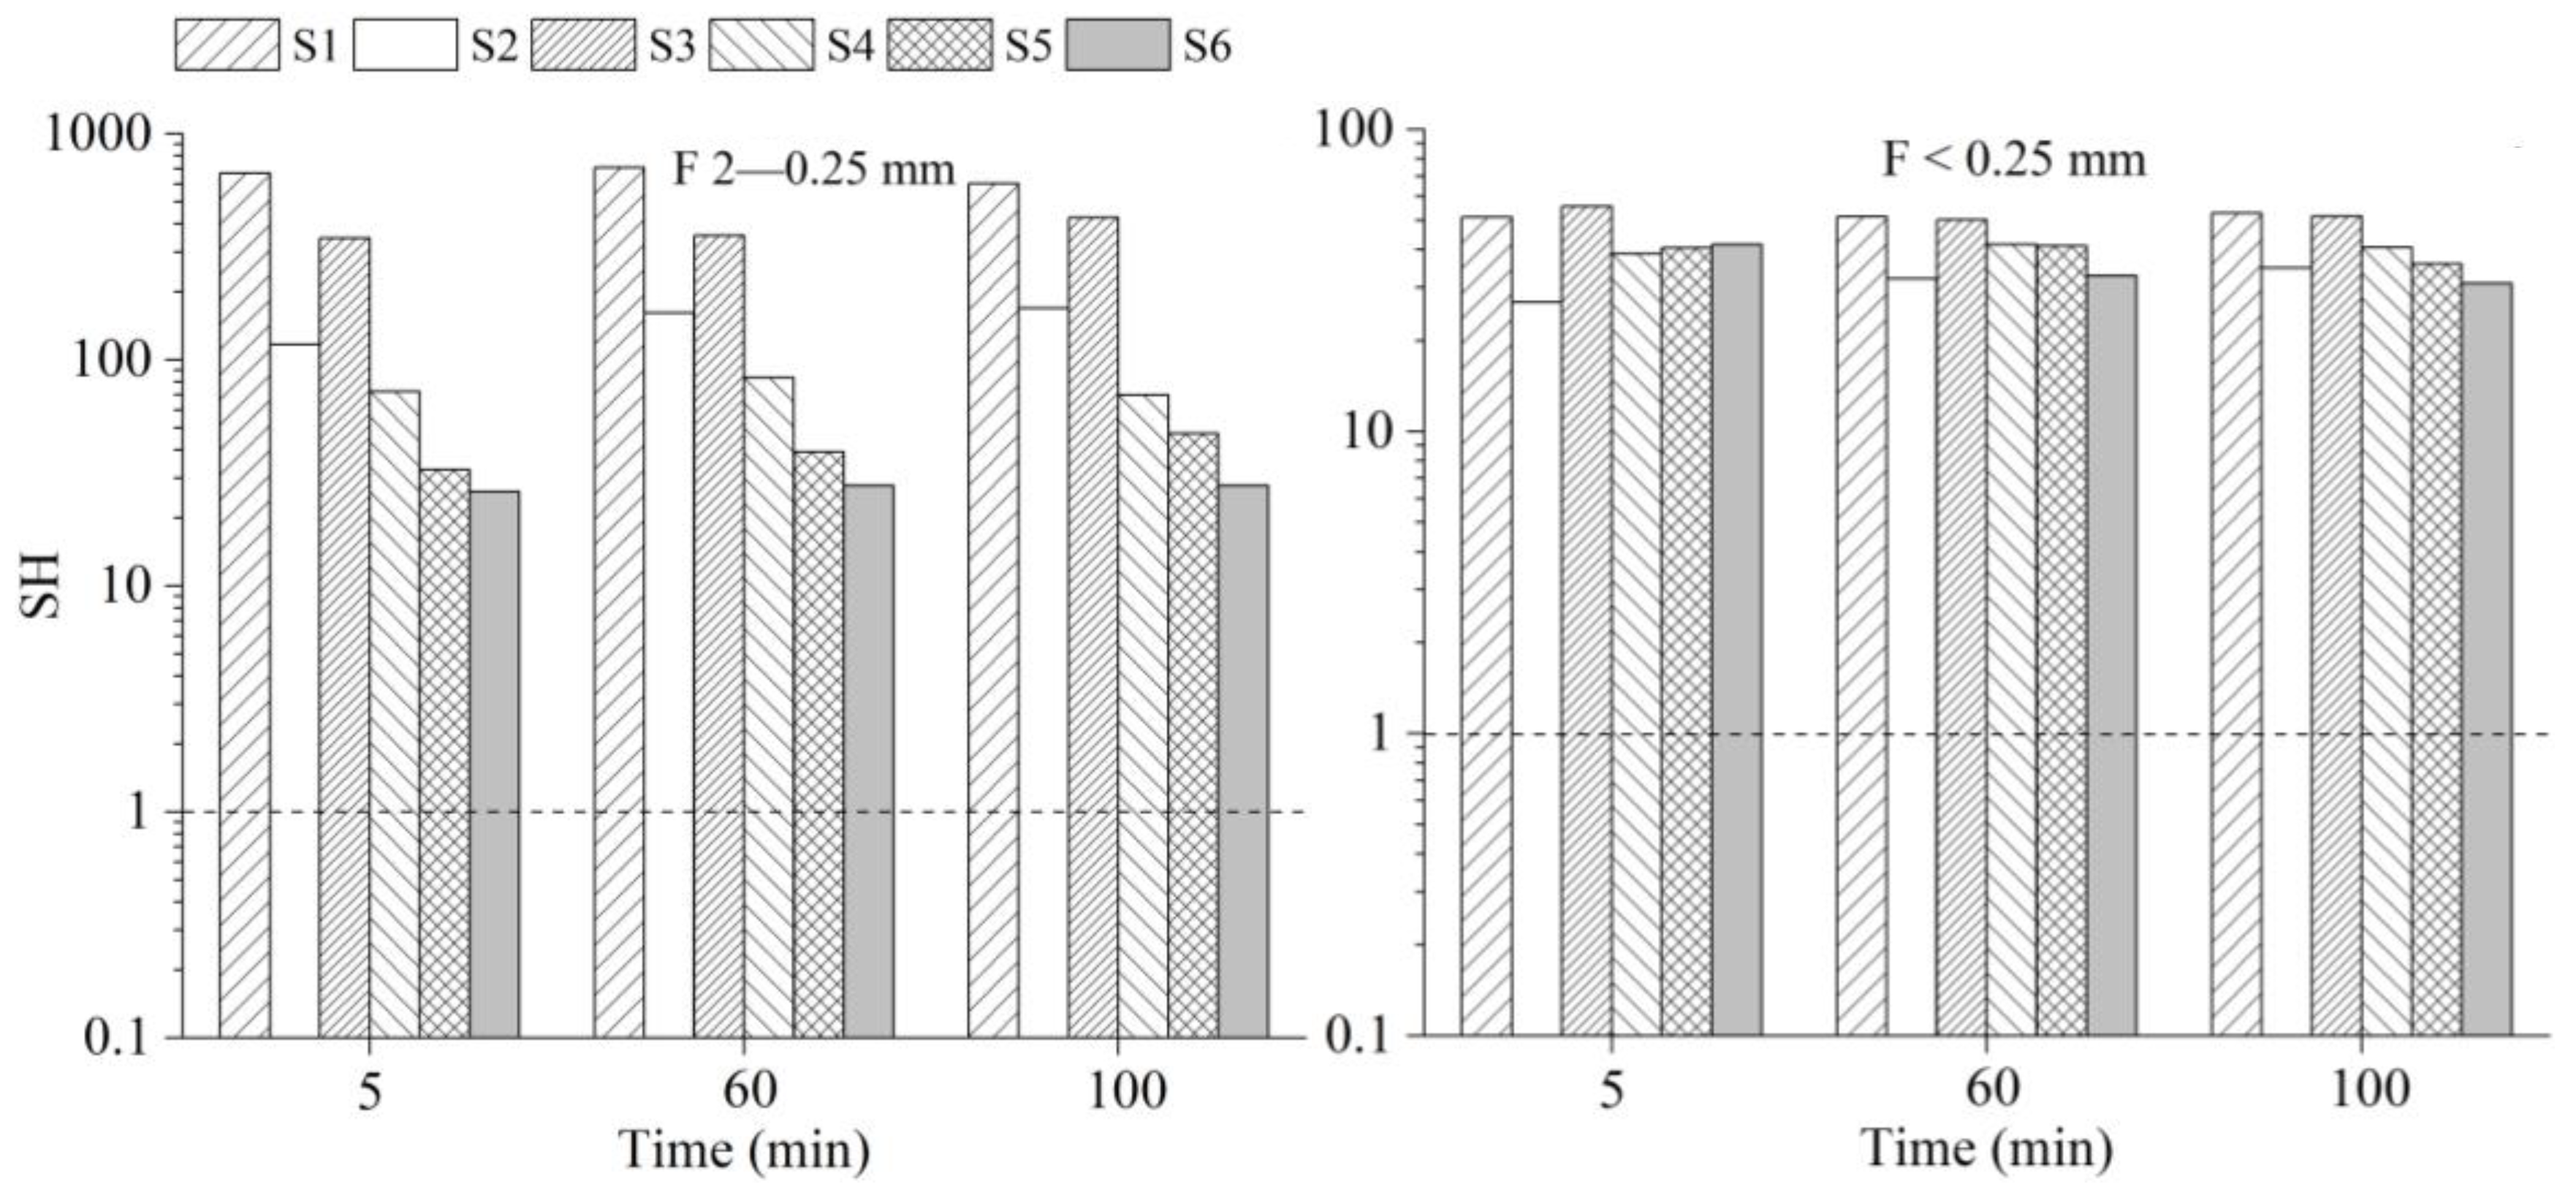
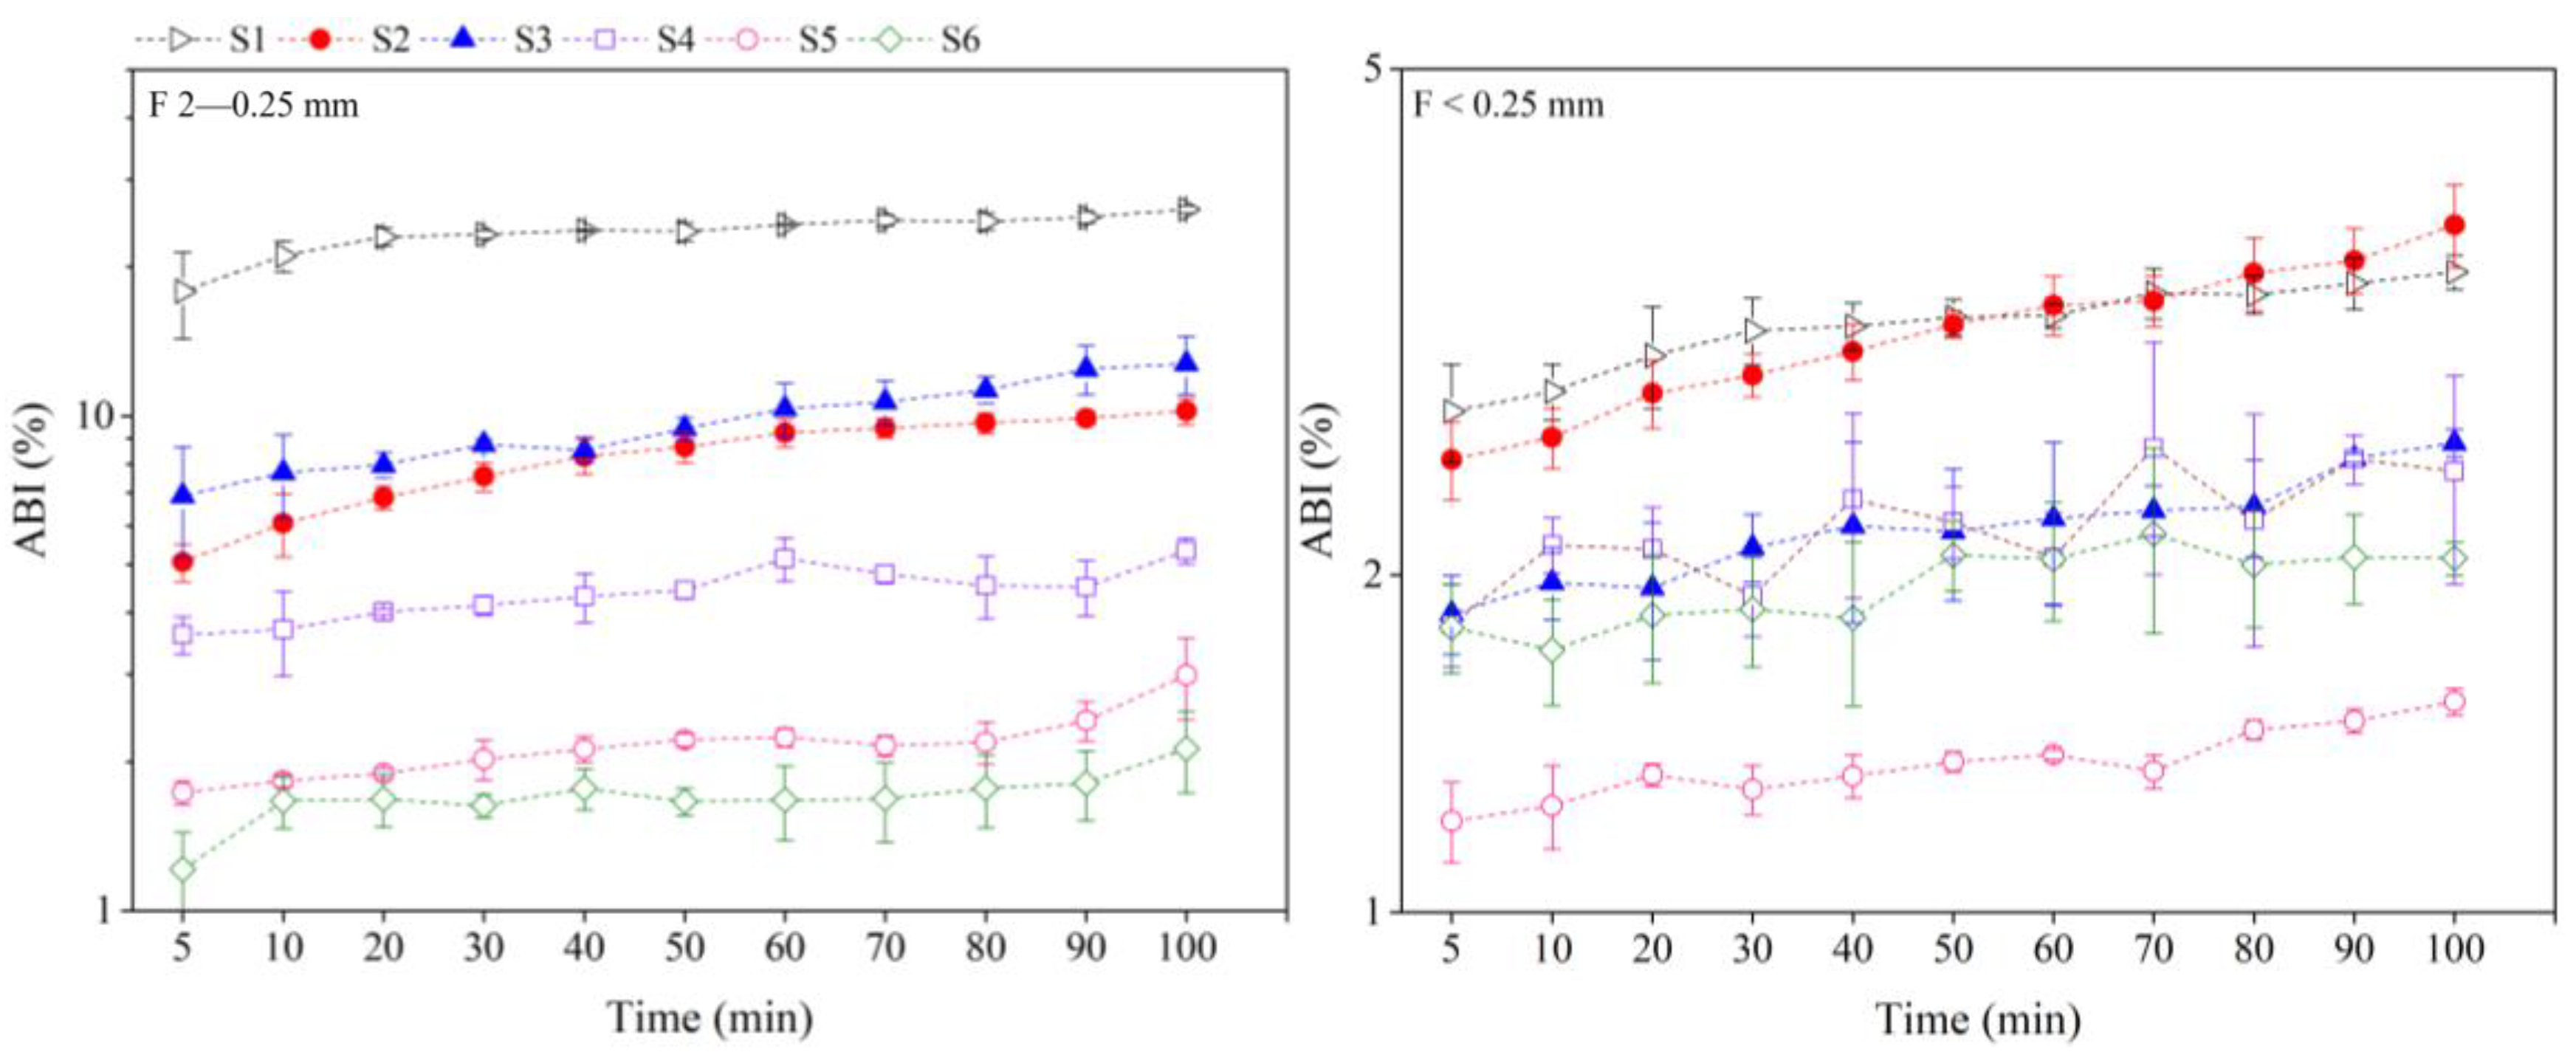
3.2. Soil Aggregates Breakdown Undergoing Water Dispersion

The ABI increased gradually as the immersion time was increased. However, for different texture soil, there were differences in the size fraction of aggregate fragments. When initial soil aggregates were fragmented into 2–0.25 mm aggregate fractions, the ABI differed among the six soils and followed the order of S1 > S3 > S2 > S4 > S5 > S6 (Figure 5). The ABI of S1 was significantly higher than that of the other soil texture (p < 0.05), whereas the difference in ABI among S2, S3, S4, S5 and S6 was affected by the immersion time (Table A3). When the soil aggregates were fragmented into <0.25 mm aggregate fractions, the ABI showed a trend of increasing fluctuation with increasing immersion time. However, the ABI followed the order of S2 > S1 > S3 > S4 > S6 > S5 once the aggregate breakdown process had basically stabilized (100 min) (Figure 5). The ABI of sample S5 was significantly lower than those of the other soils, whereas there was no significant difference between S1 and S2, S3 and S4 (Table A3). This indicated that the aggregate breakdown process exhibited size selectivity.

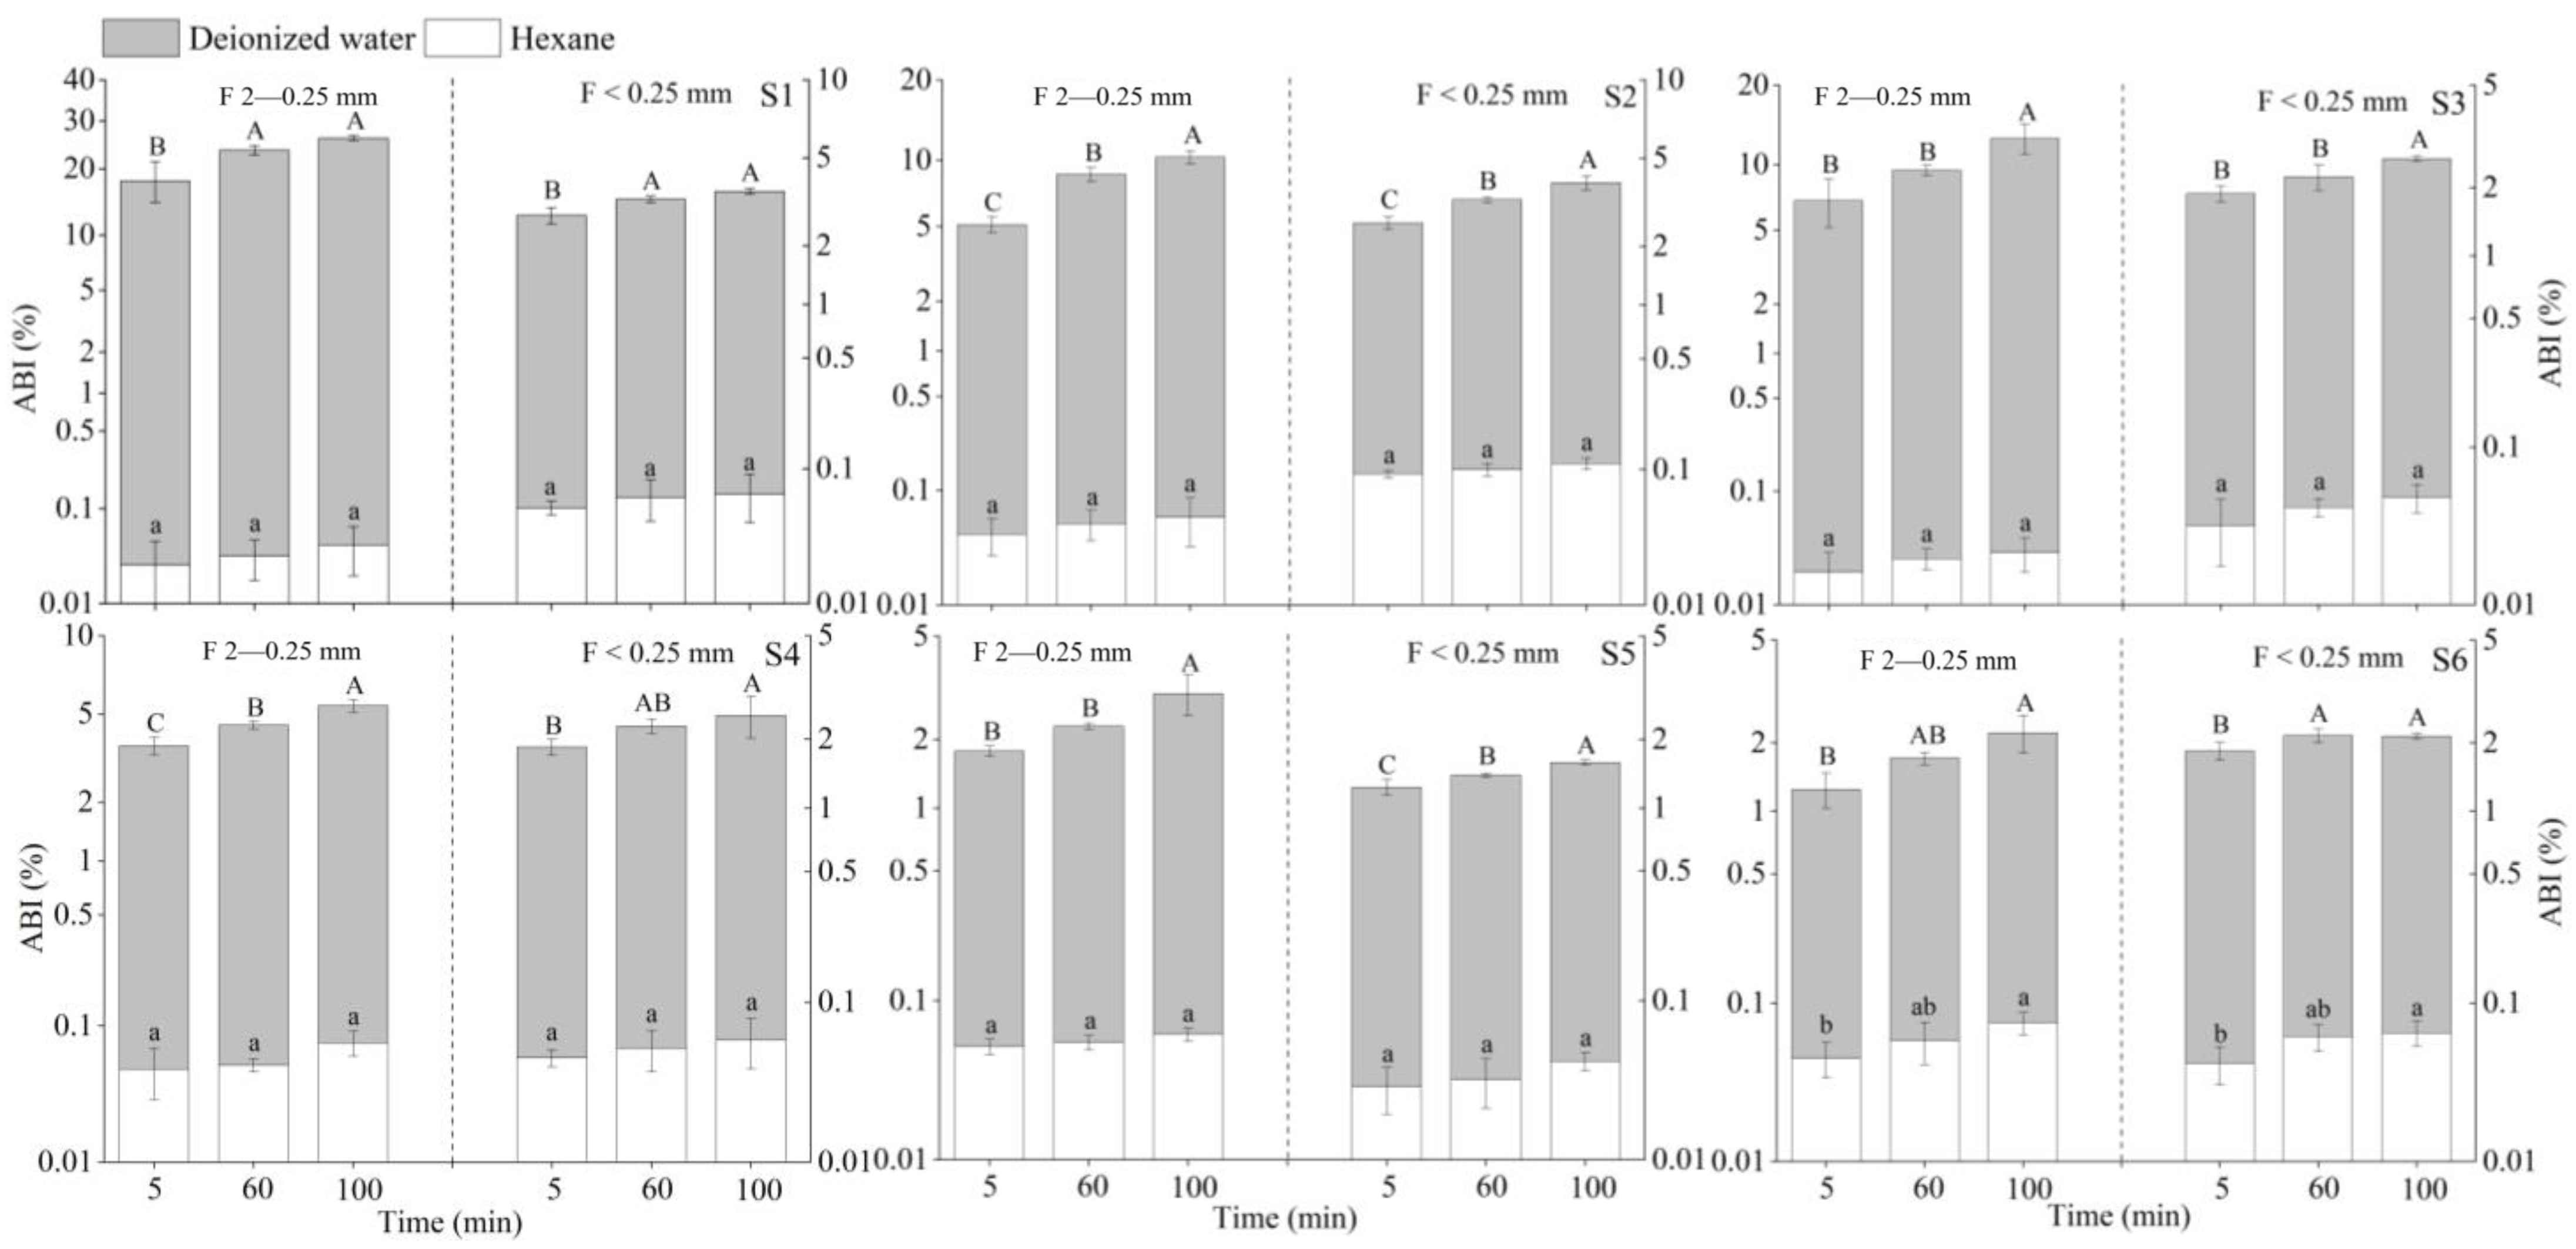
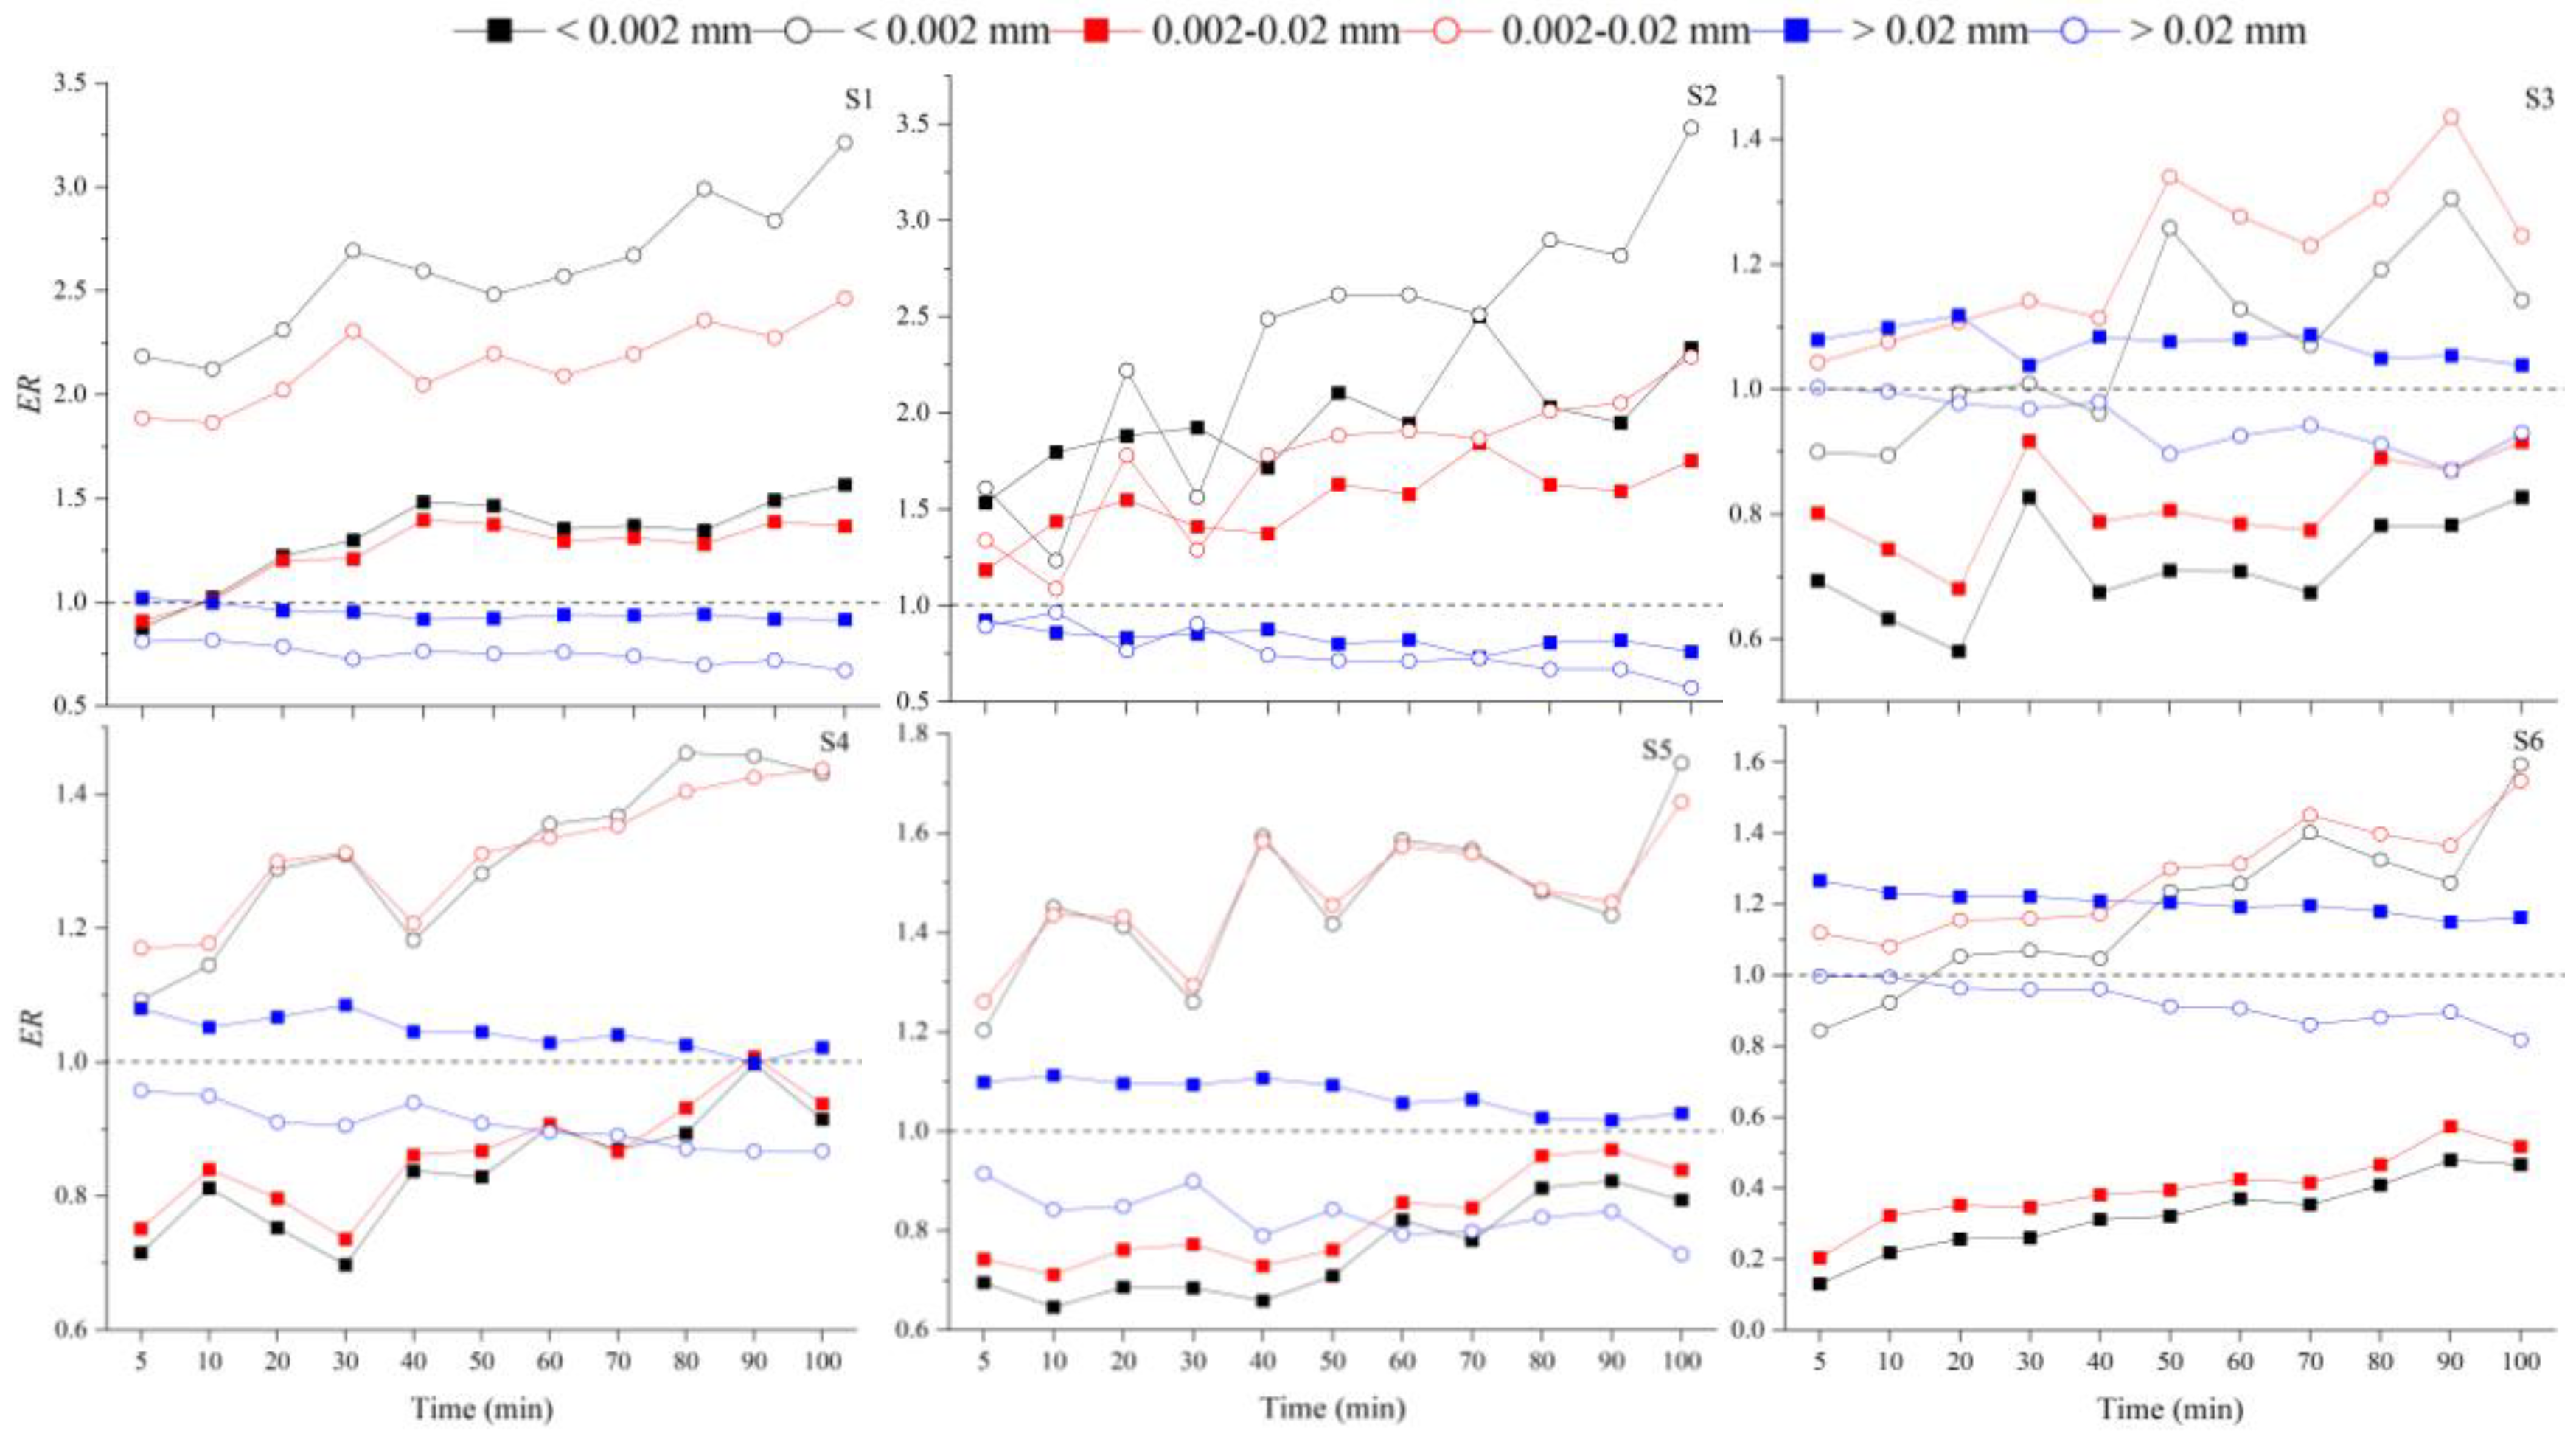
3.3. Selectivity Characteristics of Aggregate Fractions

The particles dispersed by hydration underwent a size selectivity process during soaking. When the soil aggregates were fragmented into 2–0.25 mm aggregate fractions, for S1 and S2, the particle of 0.002–0.02 mm and <0.002 mm was preferentially moved, and the ER increased gradually with increasing immersion time; for S3 and S4, S5 and S6, the particle of >0.002 mm was preferentially moved, and the ER decreased gradually with increasing immersion time (Figure 6). When the soil aggregates were fragmented into <0.25 mm aggregate fractions, for the soil of different texture, the particles of 0.002–0.02 mm and <0.002 mm all show preferential migration characteristics, and ER increases with increasing immersion time. Furthermore, during the process of aggregate breakdown, the DA of soil particles also changes. For silty loam, sandy clay loam, clay loam and loamy clay, when the aggregates were fragmented into 2–0.25 mm aggregate fractions, the DA of the <0.01 mm soil particles decreased from 36.04% to 8.33%, from 77.18% to 56.00%, from 76.84% to 66.87% and from 82.02% to 68.89% with increasing immersion time; when the aggregates were fragmented into <0.25 mm aggregate fractions, the DA of the <0.01 mm soil particles decreased from 44.98% to 9.78%, from 44.24% to 21.02%, from 67.21% to 55.41% and from 64.51% to 49.40% with increasing immersion time (Table 3). This indicated the extent to which clay loam and loamy clay are aggregated was higher than that of silty loam, sandy clay loam, and the extent to which soil particles of 2–0.25 mm fractions were aggregated was higher than that of <0.25 mm fractions.

4. Discussion

4.1. Assessing the Limitation of Ethanol in Distinguishing Aggregate Breakdown Mechanisms

Water is regarded as a key factor to induce soil aggregate breakdown in soil and aqueous systems [11,15,36]. In other words, the interaction between soil particles and water (soil hydrophilicity) is an important mechanism affecting soil aggregate breakdown [9], and it is also the essence that leads to the occurrence of four action mechanisms (slaking, differential swelling, raindrop mechanical impact, and physicochemical dispersion) [15]. Therefore, identifying soil hydrophilicity is the key step in analyzing the hydraulic stability of soil aggregates. As speculated in the Introduction, it may not be appropriate to distinguish the contribution of soil hydrophilicity and mechanical impact on aggregate breakdown by selecting water and ethanol as the dispersion media. If this speculation is correct, the ratio of the ABI values undergoing ethanol and hexane dispersion is greater than 1; otherwise, the speculation is wrong. As mentioned in the Results, the ratio of the ABI values undergoing ethanol and hexane dispersion was greater than 1 (Figure 2). This indicated that the hydrophilic groups contained in ethanol interacted with the hydrophilic surfaces of the soil particles. This finding shows that the ethanol has limitations in preventing interference among the different breakdown mechanisms for the soil aggregates. Especially during rainfall, the influence of soil hydrophilicity and mechanical impact on soil aggregate breakdown cannot be distinguished by selecting ethanol and water as the dispersion media, respectively. On the one hand, this is attributed to the swelling of soil [9]. Influenced by the hydroxylic surface of soil particles, water molecules are adsorbed on the surface of soil particles via molecular attraction, and a thin water film is formed around the soil particles [37,38,39]. Because the ethanol is characterized by hydrophilicity, when it contacts a soil particle, the surface of the soil particle shows swelling behavior, which in turn causes the breakdown of soil aggregates. The hydration energy of the surface of soil particles is the main driving force of aggregate breakdown at this stage. On the other hand, the formation of hydrogen bonds contributes to the dissolution of organic matter. The hydrophilic groups contained in ethanol can form hydrogen bonds with polar groups of organic molecules (such as -NH2, -OH and -COOH). This process weakens the hydrogen bonding between soil particles, and then promotes the dispersion of soil aggregates [40]. Therefore, the contribution of soil hydrophilicity to aggregate fragmentation can be better clarified by selecting hexane and water as dispersion media, respectively.

4.2. Assessing the Contribution of Clay and CEC to the ABI and Its Limitations

The soil aggregate, as a soil structure and functional unit, is an important factor in regulating soil properties, fertility and ecological functions [2,17,33]. The stability of aggregates and the pores between them affect the movement and storage of water, biological activities and crop growth [1,41]. Soil physicochemical properties are often considered important indicators reflecting the soil aggregate stability, mainly including the SOM, soil texture, CEC, clay mineral composition, Fe/Al oxides and other indicators [42,43,44]. The influence of physicochemical properties on the soil aggregate stability may be independent or synergistic [45]. Aggregate stability generally increases with increasing clay and SOM contents and CEC, and the SOM improves the stability of soil aggregates by reducing the aggregate wettability and thus increasing aggregate cohesion [17,41,46]. Six et al. [47], reported that the SOM did not exhibit a significant positive correlation with the soil aggregate stability in tropical and subtropical soils. Hence, the relationship between the soil aggregate stability and soil physicochemical properties is not always consistent, which makes the study of soil aggregate stability highly complex. In this study, when soil aggregates were immersed in deionized water, the total ABI (ABIt) and the ABI of 2–0.25 mm fractions (ABI2–0.25) was negatively correlated with the clay percentage and CEC, while the ABI of <0.25 mm (ABI<0.25) fractions were not only negatively correlated with the clay percentage and CEC but also with Feo (Table 4). This result is similar to those in previous reports [17,48]. The content of Fe/Al oxides is often adopted as an important indicator reflecting the aggregate stability of soils with a low SOM content [47,49]. Therefore, when the relationship between physicochemical properties and soil aggregate stability is analysed, it is not only necessary to consider the total amount of aggregate breakdown but also it is also necessary to consider the extent of aggregate breakdown in the different particle size ranges, otherwise the influence of certain physicochemical properties on the soil aggregate stability will be overlooked.
On the other hand, the percentage of clay also affects the micromorphology of soil aggregate. Since SEM provides a high magnification, high resolution and strong stereoscopic sense, it is usually applied to visually judge the surface characteristics of soil particles, pore distribution and the pattern of association between particles (surface-to-surface contacts, border-to-surface contacts or border-to-border contacts) [50,51]. The difference in micromorphology of soil with a gradient in soil textures can also determine different hydraulic stability of soil aggregates. From the sample sequence S1 to S6, the association patterns between particles were altered from border-to-surface contacts or border-to-border contacts to surface-to-surface contacts, and the degree of cementation between particles gradually increased (Figure 7). For S4, S5 and S6, the fine soil particles were cemented to coarse particles. This arrangement and the combination of soil particles enabled the formation of stable aggregates [52]. When the aggregates were soaked in water, the aggregate stability differed among different texture soil and followed the order of loamy clay > clay loam > sandy clay loam > silty loam. Therefore, it can provide theoretical support for evaluating the hydraulic stability of aggregates in the future by exploring soil physicochemical properties and aggregate micromorphology characteristics.

5. Conclusions

This study demonstrated that the hydrophilic groups contained in ethanol can interact with the hydrophilic surfaces of soil particles because of the water molecule layers on the surface of soil particles. This indicates that ethanol has limitations in preventing the interference among the different breakdown mechanisms for soil aggregates, and ethanol should be replaced by hexane. Especially during rainfall, deionized water and hexane are recommended as the dispersion media used to distinguish slaking and mechanical impact mechanisms, and then to clarify the contribution of soil hydrophilicity on soil aggregates breakdown. Meanwhile, we found that the clay, cation exchange capacity and free Fe oxides are important indicators of hydraulic stability for soil aggregates, and loamy clay has a relatively low hydrophilicity compared with other soil textures. Moreover, the particles dispersed by hydration are characterized by a size selectivity. For silty loam and sandy clay loam, the particle of 0.002–0.02 mm and <0.002 mm is preferentially moved; for clay loam and loamy clay, the particle of >0.002 mm shows preferential migration characteristics. Our results provide a basis for further research on the hydraulic stability of soil aggregate.

Author Contributions

Conceptualization: J.L., X.W. and S.Z.; Methodology: J.L., X.W. and S.Z.; Formal analysis and investigation: J.L., X.W. and S.Z.; Writing—original draft preparation: J.L. and S.Z.; Writing—review and editing: J.L., S.Z., E.C. and C.W.; Funding acquisition: J.L., C.W. and S.Z.; Resources: E.C., C.W. and S.Z.; Supervision: C.W. and S.Z. All authors have read and agreed to the published version of the manuscript.

Funding

This research was funded by the Fundamental Research Funds for the National Natural Science Foundation of China (No. 42077007), the Foundation of Graduate Research and Innovation in Chongqing under Project CYB21108, and the Foundation Research Funds for the Central Universities (SWU120065).

Data Availability Statement

All data are true, valid and can be available.

Conflicts of Interest

The authors declare no conflict of interest.

Appendix A

Table A1. The ASI of different immersion time with deionized water employed as the immersion solution.
TimeASI (%)
S4S6
5 min93.63 ± 0.11 a96.28 ± 0.53 a
10 min93.53 ± 0.50 ab96.09 ± 0.54 ab
20 min93.55 ± 0.06 ab95.77 ± 0.48 b
30 min93.52 ± 0.44 ab95.78 ± 0.27 b
40 min93.13 ± 0.09 b95.67 ± 0.24 b
50 min92.99 ± 0.25 b95.68 ± 0.06 b
60 min92.40 ± 0.37 c95.67 ± 0.14 b
70 min92.40 ± 0.44 c95.67 ± 0.14 b
80 min92.69 ± 0.21 bc95.46 ± 0.29 bc
90 min92.07 ± 0.28 cd95.44 ± 0.17 bc
100 min91.64% ± 0.30 d94.80 ± 0.22 c
1 d91.23 ± 0.05 d95.02 ± 0.09 c
3 d91.26 ± 0.05 d94.93 ± 0.10 c
5 d91.21 ± 0.11 d94.89 ± 0.04 c
10 d91.28 ± 0.23 d94.85 ± 0.05 c
Note: S4 and S6: loamy clay; different lowercase letters after values represent the obvious difference between immersion time at p < 0.05.
Table A2. The ASI of different immersion time with ethanol and hexane employed as soaking solutions, respectively.
Time (min)ASI (%)
EthanolHexane
S4S6S4S6
599.29 ± 0.13 a98.83 ± 0.05 a99.39 ± 0.04 a99.51 ± 0.11 a
1099.40 ± 0.21 a98.82 ± 0.10 a99.41 ± 0.07 a99.45 ± 0.09 a
2099.41 ± 0.21 a98.73 ± 0.09 a99.42 ± 0.09 a99.48 ± 0.06 a
3099.35 ± 0.12 a98.71 ± 0.17 a99.43 ± 0.10 a99.44 ± 0.04 a
4099.31 ± 0.14 a98.74 ± 0.03 a99.35 ± 0.13 a99.47 ± 0.07 a
5099.27 ± 0.12 a98.69 ± 0.06 a99.31 ± 0.14 a99.42 ± 0.04 a
6099.19 ± 0.11 a98.71 ± 0.15 a99.34 ± 0.08 a99.43 ± 0.05 a
7099.22 ± 0.05 a98.73 ± 0.11 a99.39 ± 0.08 a99.45 ± 0.06 a
8099.21 ± 0.11 a98.66 ± 0.05 a99.38 ± 0.04 a99.42 ± 0.03 a
9099.12 ± 0.15 a98.62 ± 0.08 a99.33 ± 0.07 a99.41 ± 0.04 a
10099.21 ± 0.06 a98.58 ± 0.25 a99.32 ± 0.02 a99.40 ± 0.03 a
Note: different lowercase letters after values represent the obvious difference between immersion time at p < 0.05.
Table A3. The ABI of different soils soaked in deionized water (%).
SizeTimeS1S2S3S4S5S6
(mm)(min)
2–0.25517.85 ± 3.54 Ad5.06 ± 0.44 BCe6.90 ± 1.77 Bc3.61 ± 0.32 Cc1.73 ± 0.09 Cc1.21 ± 0.23 Ca
1021.07 ± 1.52 Ac6.07 ± 0.88 Bd7.69 ± 1.46 Bc3.70 ± 0.72 Cc1.83 ± 0.05 Dc1.67 ± 0.20 Ea
2023.01 ± 0.94 Abc6.84 ± 0.36 Bd7.96 ± 0.46 Dc4.02 ± 0.06 Cbc1.89 ± 0.05 Fc1.68 ± 0.21 Ea
3023.26 ± 0.43 Abc7.55 ± 0.51 Ccd8.76 ± 0.21 Bbc4.14 ± 0.19 Dbc2.02 ± 0.19 Ec1.63 ± 0.09 Ea
4023.71 ± 0.08 Ab8.29 ± 0.67 Bc8.53 ± 0.51 Bc4.31 ± 0.49 Cbc2.12 ± 0.13 Dbc1.77 ± 0.17 Da
5023.57 ± 1.01 Ab8.66 ± 0.61 Bbc9.44 ± 0.50 Bbc4.44 ± 0.18 Cb2.21 ± 0.07 DEbc1.66 ± 0.11 Ea
6024.34 ± 0.19 Aab9.26 ± 0.59 Bb10.35 ± 1.27 Bbc5.15 ± 0.52 Cab2.24 ± 0.10 Dbc1.67 ± 0.29 Da
7024.87 ± 0.65 Aab9.45 ± 0.42 Cab10.67 ± 1.11 Bb4.79 ± 0.21 Dab2.15 ± 0.10 Ebc1.68 ± 0.31 Ea
8024.72 ± 0.92 Aab9.68 ± 0.46 Cab11.28 ± 0.71 Bab4.54 ± 0.65 Db2.19 ± 0.21 Ebc1.77 ± 0.30 Ea
9025.22 ± 0.71 Ab9.90 ± 0.32 Cab12.44 ± 1.41 Bab4.51 ± 0.58 Db2.42 ± 0.22 Eb1.81 ± 0.29 Ea
10026.12 ± 0.47 Aa10.24 ± 0.64 Ca12.75 ± 1.72 Ba5.34 ± 0.32 Da2.99 ± 0.56 Ea2.13 ± 0.39 Ea
<0.2552.73 ± 0.25 Ac2.50 ± 0.19 Ac1.85 ± 0.15 Bb1.81 ± 0.15 Ba1.21 ± 0.10 Cc1.80 ± 0.16 Ba
102.84 ± 0.15 Ac2.60 ± 0.15 Ac1.97 ± 0.14 BCb2.12 ± 0.11 Ba1.25 ± 0.11 Dc1.72 ± 0.18 Ca
203.03 ± 0.28 Abc2.83 ± 0.18 Abc1.95 ± 0.26 Bb2.10 ± 0.18 Ba1.34 ± 0.03 Cbc1.85 ± 0.23 Ba
303.17 ± 0.19 Ab2.92 ± 0.11 Ab2.11 ± 0.14 Bb1.92 ± 0.15 Ba1.30 ± 0.07 Cbc1.87 ± 0.20 Ba
403.20 ± 0.14 Ab3.05 ± 0.16 Ab2.20 ± 0.38 Bb2.32 ± 0.41 Ba1.33 ± 0.06 Cbc1.84 ± 0.30 Ba
503.25 ± 0.11 Aab3.21 ± 0.08 Aab2.18 ± 0.28 Bb2.22 ± 0.15 Ba1.37 ± 0.03 Cb2.08 ± 0.14 Ba
603.26 ± 0.07 Aab3.32 ± 0.18 Aab2.23 ± 0.35 Bab2.07 ± 0.19 Ba1.39 ± 0.02 Cb2.06 ± 0.24 Ba
703.39 ± 0.15 Aab3.35 ± 0.15 Aab2.27 ± 0.11 Bab2.55 ± 0.55 Ba1.35 ± 0.05 Cbc2.17 ± 0.39 Ba
803.38 ± 0.12 Aab3.52 ± 0.23 Aab2.28 ± 0.21 Bab2.23 ± 0.49 Ba1.47 ± 0.03 Cab2.04 ± 0.24 Ba
903.45 ± 0.16 Aab3.60 ± 0.21 Aab2.50 ± 0.02 Bab2.50 ± 0.12 Ba1.49 ± 0.04 Dab2.07 ± 0.18 Ca
1003.52 ± 0.11 Aa3.83 ± 0.28 Aa2.58 ± 0.07 Ba2.44 ± 0.48 BCa1.55 ± 0.04 Da2.07 ± 0.07 Ca
Note: S1, S2, S3, S4, S5 and S6 represent silty loam, sandy clay loam, clay loam, loamy clay, loamy clay and loamy clay, respectively. Different capital letters after the values represent significances difference between different soils at p < 0.05; different lowercase letters represent significances difference between immersion times at p < 0.05.

References

  1. Amezketa, E. Soil aggregate stability: A review. J. Sustain. Agric. 1999, 14, 83–151. [Google Scholar] [CrossRef]
  2. Rabot, E.; Wiesmeier, M.; Schlueter, S.; Vogel, H.J. Soil structure as an indicator of soil functions: A review. Geoderma 2018, 314, 122–137. [Google Scholar] [CrossRef]
  3. Xiao, H.; Liu, G.; Abd-Elbasit, M.A.M.; Zhang, X.C.; Liu, P.L.; Zheng, F.L.; Zhang, J.Q.; Hu, F.N. Effects of slaking and mechanical breakdown on disaggregation and splash erosion. Eur. J. Soil Sci. 2017, 68, 797–805. [Google Scholar] [CrossRef]
  4. Le Bissonnais, Y. Aggregate stability and assessment of soil crustability and erodibility: I. Theory and methodology. Eur. J. Soil Sci. 1996, 67, 11–21. [Google Scholar] [CrossRef]
  5. Francis, R.; Wuddivira, M.N.; Darsan, J.; Wilson, M. Soil slaking sensitivity as influenced by soil properties in alluvial and residual humid tropical soils. J. Soil. Sediment 2019, 19, 1937–1947. [Google Scholar] [CrossRef]
  6. Emerson, W.W. A classification of soil aggregates based on their coherence in water. Aust. J. Soil Res. 1967, 5, 47–57. [Google Scholar] [CrossRef]
  7. Hu, F.; Liu, J.; Xu, C.; Du, W.; Yang, Z.; Liu, X.; Liu, G.; Zhao, S. Soil internal forces contribute more than raindrop impact force to rainfall splash erosion. Geoderma 2018, 330, 91–98. [Google Scholar] [CrossRef]
  8. Shao, Z.C.; Chen, J.F. A primary study on the soil hydrophilicity. Acta Pedol. Sin. 1980, 17, 267–274. (In Chinese) [Google Scholar]
  9. Xiong, Y.; Chen, J.F. Properties of Soil Colloid; China Science Press: Beijing, China, 1990. (In Chinese) [Google Scholar]
  10. Heikkinen, J.; Keskinen, R.; Soinne, H.; Hyvaluoma, J.; Nikama, J.; Wikberg, H.; Kalli, A.; Siipola, V.; Melkior, T.; Dupont, C.; et al. Possibilities to improve soil aggregate stability using biochars derived from various biomasses through slow pyrolysis, hydrothermal carbonization, or torrefaction. Geoderma 2019, 344, 40–49. [Google Scholar] [CrossRef]
  11. Baver, L.D.; Gardner, W.H.; Gardner, W.R. Soil Physics, 4th ed.; Wiley: New York, NY, USA, 1972. [Google Scholar]
  12. Cevc, G. Hydration force and the interfacial structure of the polar surface. J. Chem. Soc. Faraday Trans. 1991, 87, 2733–2739. [Google Scholar] [CrossRef]
  13. Hurrass, J.; Schaumann, G.E. Hydration kinetics of wettable and water-repellent soils. Soil Sci. Soc. Am. J. 2007, 71, 280–288. [Google Scholar] [CrossRef]
  14. Low, P.F. Physical chemistry of clay-water interaction. Adv. Agron. 1961, 13, 269–327. [Google Scholar]
  15. Hu, F.; Xu, C.; Li, H.; Li, S.; Yu, Z.; Li, Y.; He, X. Particles interaction forces and their effects on soil aggregates breakdown. Soil Tillage Res. 2015, 147, 1–9. [Google Scholar] [CrossRef]
  16. Sun, Q. The Effects of Dissolved Hydrophobic and Hydrophilic Groups on Water Structure. J. Solut. Chem. 2020, 49, 1473–1484. [Google Scholar] [CrossRef]
  17. Peng, X.; Yan, X.; Zhou, H.; Zhang, Y.Z.; Sun, H. Assessing the contributions of sesquioxides and soil organic matter to aggregation in an Ultisol under long-term fertilization. Soil Tillage Res. 2015, 146, 89–98. [Google Scholar] [CrossRef]
  18. Schweizer, S.A.; Bucka, F.B.; Graf-Rosenfellner, M.; Koegel-Knabner, I. Soil microaggregate size composition and organic matter distribution as affected by clay content. Geoderma 2019, 355, 113901. [Google Scholar] [CrossRef]
  19. Wuddivira, M.N.; Stone, R.J.; Ekwue, E.I. Clay, Organic Matter, and Wetting Effects on Splash Detachment and Aggregate Breakdown under Intense Rainfall. Soil Sci. Soc. Am. J. 2009, 73, 226–232. [Google Scholar] [CrossRef]
  20. Almajmaie, A.; Hardie, M.; Doyle, R.; Birch, C.; Acuna, T. Influence of soil properties on the aggregate stability of cultivated sandy clay loams. J. Soil. Sediment 2017, 17, 800–809. [Google Scholar] [CrossRef]
  21. Baldock, J.A.; Skjemstad, J.O. Role of the soil matrix and minerals in protecting natural organic materials against biological attack. Org. Geochem. 2000, 31, 697–710. [Google Scholar] [CrossRef]
  22. Wagner, S.; Cattle, S.R.; Scholten, T. Soil-aggregate formation as influenced by clay content and organic-matter amendment. J. Plant Nutr. Soil Sci. 2007, 170, 173–180. [Google Scholar] [CrossRef]
  23. Totsche, K.U.; Amelung, W.; Gerzabek, M.H.; Guggenberger, G.; Klumpp, E.; Knief, C.; Lehndorff, E.; Mikutta, R.; Peth, S.; Prechtel, A.; et al. Microaggregates in soils. J. Plant Nutr. Soil Sci. 2018, 181, 104–136. [Google Scholar] [CrossRef]
  24. Trivedi, P.; Delgado-Baquerizo, M.; Jeffries, T.C.; Trivedi, C.; Anderson, I.C.; Lai, K.; McNee, M.; Flower, K.; Singh, B.P.; Minkey, D.; et al. Soil aggregation and associated microbial communities modify the impact of agricultural management on carbon content. Environ. Microbiol. 2017, 19, 3070–3086. [Google Scholar] [CrossRef] [PubMed]
  25. Koesters, R.; Preger, A.C.; Du Preez, C.C.; Amelung, W. Re-aggregation dynamics of degraded cropland soils with prolonged secondary pasture management in the South African Highveld. Geoderma 2013, 192, 173–181. [Google Scholar] [CrossRef]
  26. Krause, L.; Rodionov, A.; Schweizer, S.A.; Siebers, N.; Lehndorff, E.; Klumpp, E.; Amelung, W. Microaggregate stability and storage of organic carbon is affected by clay content in arable Luvisols. Soil Tillage Res. 2018, 182, 123–129. [Google Scholar] [CrossRef]
  27. Schjonning, P.; de Jonge, L.W.; Munkholm, L.J.; Moldrup, P.; Christensen, B.T.; Olesen, J.E. Clay Dispersibility and Soil Friability-Testing the Soil Clay-to-Carbon Saturation Concept. Vadose Zone J. 2012, 11. [Google Scholar] [CrossRef]
  28. Wuddivira, M.N.; Ekwue, E.I.; Stone, R.J. Modelling slaking sensitivity to assess the degradation potential of humid tropic soils under intense rainfall. Land Degrad. Dev. 2010, 21, 48–57. [Google Scholar] [CrossRef]
  29. Xiao, H.; Liu, G.; Zhang, Q.; Zheng, F.; Zhang, X.; Liu, P.; Zhang, J.; Hu, F.; Abd Elbasit, M.A.M. Quantifying contributions of slaking and mechanical breakdown of soil aggregates to splash erosion for different soils from the Loess plateau of China. Soil Tillage Res. 2018, 178, 150–158. [Google Scholar] [CrossRef]
  30. Cheng, N.L. Solvents Handbook, 5th ed.; Chemical Industry Press: Beijing, China, 2015. (In Chinese) [Google Scholar]
  31. Li, J.; Zhong, S.; Han, Z.; Gao, P.; Wei, C. The relative contributions of soil hydrophilicity and raindrop impact to soil aggregate breakdown for a series of textured soils. Int. Soil Water Conserv. Res. 2022, 10, 433–444. [Google Scholar] [CrossRef]
  32. Sparks, D.L.; Page, A.L.; Helmke, P.A.; Loeppert, R.H.; Soltanpour, P.N.; Tabatabai, M.A.; Johnston, C.T.; Sumner, M.E. Methods of Soil Analysis Part 3: Chemical Methods; Soil Science Society of America Inc.: Madison, WI, USA, 1996. [Google Scholar]
  33. Ma, R.M.; Li, Z.X.; Cai, C.F.; Wang, J.G. The dynamic response of splash erosion to aggregate mechanical breakdown through rainfall simulation events in Ultisols (subtropical China). Catena 2014, 121, 279–287. [Google Scholar] [CrossRef]
  34. Hou, T.Y.; Berry, T.D.; Singh, S.; Hughes, M.N.; Tong, Y.N.; Papanicolaou, A.N.T.; Wacha, K.M.; Wilson, C.G.; Chaubey, I.; Filley, T.R. Control of tillage disturbance on the chemistry and proportion of raindrop-liberated particles from soil aggregates. Geoderma 2018, 330, 19–29. [Google Scholar] [CrossRef]
  35. Wei, C.; Xie, D.; Yang, J.H. Characteristics of organo-mineral complexing of microaggregates in paddy soils developed from purple soils. Pedosphere 1996, 6, 365–372. [Google Scholar]
  36. Yu, L.; Tian, R.; Zhang, R.; Liu, X.; Li, R.; Li, H. Coupling effects of humus and 2:1 type electrolyte on soil water movement. Geoderma 2020, 375, 114482. [Google Scholar] [CrossRef]
  37. Daniels, L.W. The Nature and Properties of Soils, 15th ed.; Pearson Education, Inc.: London, UK, 2016. [Google Scholar]
  38. Lal, R.; Shukla, M.K. Principle of Soil Physics; Marcel Dekker, Inc.: New York, NY, USA, 2004. [Google Scholar]
  39. Zhan, W.; Yi, H.; Song, S.; Zhao, Y.; Rao, F. Hydrophobic agglomeration behaviors of clay minerals as affected by siloxane structure. Colloids Surf. A 2019, 568, 36–42. [Google Scholar] [CrossRef]
  40. Zhao, D.S.; Li, H.; Fu, L.L.; Zhang, J.; Ren, P.B. Progress of dissolution of cellulose with imidazolium ionic liquid. Chem. Eng. Prog. 2011, 30, 1529–1536. (In Chinese) [Google Scholar]
  41. Bronick, C.J.; Lal, R.J.G. Soil structure and management: A review. Geoderma 2005, 124, 3–22. [Google Scholar] [CrossRef]
  42. Kasmerchak, C.S.; Mason, J.A.; Liang, M. Laser diffraction analysis of aggregate stability and disintegration in forest and grassland soils of northern Minnesota, USA. Geoderma 2019, 338, 430–444. [Google Scholar] [CrossRef]
  43. Xue, B.; Huang, L.; Huang, Y.; Zhou, F.; Li, F.; Kubar, K.A.; Li, X.; Lu, J.; Zhu, J. Roles of soil organic carbon and iron oxides on aggregate formation and stability in two paddy soils. Soil Tillage Res. 2019, 187, 161–171. [Google Scholar] [CrossRef]
  44. Yu, Z.; Zhang, J.; Zhang, C.; Xin, X.; Li, H. The coupling effects of soil organic matter and particle interaction forces on soil aggregate stability. Soil Tillage Res. 2017, 174, 251–260. [Google Scholar] [CrossRef]
  45. Nciizah, A.D.; Wakindiki, I.I.C. Aggregate breakdown mechanisms as affected by soil texture and organic matter in soils dominated by primary minerals. S. Afr. J. Plant Soil. 2014, 31, 213–218. [Google Scholar] [CrossRef]
  46. Lu, S.G.; Sun, F.F.; Zong, Y.T. Effect of rice husk biochar and coal fly ash on some physical properties of expansive clayey soil (Vertisol). Catena 2014, 114, 37–44. [Google Scholar] [CrossRef]
  47. Six, J.; Feller, C.; Denef, K.; Ogle, S.M.; Sa, J.C.D.; Albrecht, A. Soil organic matter, biota and aggregation in temperate and tropical soils-Effects of no-tillage. Agronomie 2002, 22, 755–775. [Google Scholar] [CrossRef]
  48. Xue, B.; Huang, L.; Huang, Y.; Yin, Z.; Li, X.; Lu, J. Effects of organic carbon and iron oxides on soil aggregate stability under different tillage systems in a rice-rape cropping system. Catena 2019, 177, 1–12. [Google Scholar] [CrossRef]
  49. Barral, M.T.; Arias, M.; Guerif, J. Effects of iron and organic matter on the porosity and structural stability of soil aggregates. Soil Till. Res. 1998, 46, 261–272. [Google Scholar] [CrossRef]
  50. Liang, A.; Zhang, Y.; Zhang, X.; Yang, X.; McLaughlin, N.; Chen, X.; Guo, Y.; Jia, S.; Zhang, S.; Wang, L.; et al. Investigations of relationships among aggregate pore structure, microbial biomass, and soil organic carbon in a Mollisol using combined non-destructive measurements and phospholipid fatty acid analysis. Soil Tillage Res. 2019, 185, 94–101. [Google Scholar] [CrossRef]
  51. Xue, S.; Ye, Y.; Zhu, F.; Wang, Q.; Jiang, J.; Hartley, W. Changes in distribution and microstructure of bauxite residue aggregates following amendments addition. J. Environ. Sci. 2019, 78, 276–286. [Google Scholar] [CrossRef]
  52. Kubiena, W.J.A. Micropedology; Collegiate Press, Inc.: Ames, IA, USA, 1938. [Google Scholar]
Figure 1. Aggregate stability measurement.
Agronomy 13 01192 g001
Figure 2. The relationship between SH and immersion times with ethanol and hexane dispersion. S1, S2, S3, S4, S5 and S6 represent silty loam, sandy clay loam, clay loam, loamy clay, loamy clay and loamy clay, respectively. F 2–0.25 mm indicates the broken 2–0.25 mm aggregate fractions after the aggregate stability testing. F < 0.25 mm indicates the broken <0.25 mm aggregate fractions after the aggregate stability testing.
Agronomy 13 01192 g002
Figure 3. The relationship between SH and immersion times with deionized water and hexane dispersion.
Agronomy 13 01192 g003
Figure 4. Differences in ABI caused by the two solutions (deionized water and hexane) for different immersion times. Y axis (left) means the ABI of 2–0.25 mm fractions. Y axis (right) means the ABI of <0.25 mm fractions. Different capital letters after values represent a significant difference between different immersion times with deionized water dispersion at p < 0.05; different lowercase letters represent a significant difference between immersion times with hexane dispersion at p < 0.05.
Agronomy 13 01192 g004
Figure 5. The dynamic change of ABI for the 2–0.25 mm and <0.25 mm fractions with deionized water employed as the immersion solution.
Agronomy 13 01192 g005
Figure 6. The relationship between ER and immersion time with deionized water employed as the immersion solution. The solid indicates the 2–0.25 mm aggregate fractions; the open indicates the <0.25 mm aggregate fractions.
Agronomy 13 01192 g006
Figure 7. Micromorphology characteristics of different texture soil aggregates.
Agronomy 13 01192 g007
Table 1. Properties of the soaking solution [30].
Soaking SolutionBoiling Point
101.3 kPa (°C)
Density
4 °C (g cm−3)
Surface Tension
20 °C (N m−1)
PolarityViscosity
25 °C (mPa·s)
Dielectric Constant
20 °C (F m−1)
Water (H2O)10010.07310.20.894980.18
Ethanol (C2H6O)78.320.790.02234.31.0625.7
Hexane (C6H14)68.70.660.02030.060.3071.890
Table 2. Physicochemical properties of the test soils.
Soil TypesLongitude/Latitude/pHSOM
(g kg−1)
BD
(g cm−3)
CEC
(cmol(+) kg−1)
Feo
(g kg−1)
PSD
Sand
(%)
Silt
(%)
Clay
(%)
Silty loam (S1)106°24′31″ E, 29°47′38″ N6.844.821.3515.546.1328.3255.9815.70
Sandy clay loam (S2)106°24′34″ E, 29°48′51″ N7.964.421.3817.057.0060.3021.2518.45
Clay loam (S3)106°24′46″ E, 29°47′45″ N6.624.711.4419.8110.6447.3028.3224.38
Loamy clay (S4)106°24′30″ E, 29°49′8″ N8.374.831.5820.368.5845.2328.0526.72
Loamy clay (S5)106°24′45″ E, 29°47′44″ N7.105.711.5524.0410.9340.6328.2531.12
Loamy clay (S6)106°24′32″ E, 29°48′36″ N6.876.701.6024.418.6137.4227.7934.79
Table 3. The relationship between the DA of <0.01 mm particles and the immersion time when deionized water was selected as immersion solution (%).
Size
(mm)
Time
(min)
S1S2S3S4S5S6
2–0.25 536.0477.1875.3774.6377.4993.47
1032.8869.7376.8469.9877.9592.61
2032.7067.5774.4371.3476.1691.35
3029.4863.3772.6169.4477.1991.54
4028.7662.4572.2268.4376.5090.32
5027.1363.4169.3468.9176.0989.67
6023.4763.0170.5868.0572.4188.20
7017.3059.5670.3468.9771.9089.03
8018.9762.0969.3866.8570.6887.44
9017.8459.2867.6961.5566.4383.81
1008.3356.0066.8756.4268.4585.42
<0.25544.9844.2467.2161.2158.7372.42
1051.0145.9364.7659.1052.0668.87
2034.7835.3163.7862.3852.2069.45
3039.0932.4162.7154.1952.1966.70
4026.5030.0159.3057.9748.0367.05
5024.9137.4557.2057.1049.4262.34
6025.2630.6657.2551.1248.5961.63
7024.9728.5957.8048.0548.3359.51
8020.8327.9355.5649.0850.6564.16
9021.2421.7251.1748.5549.3261.89
1009.7821.0255.4148.6445.5554.60
Table 4. Correlation showing the relationships between the ABI for a soaking time of 100 min and the physicochemical properties.
SOMCECFeoClaySiltSandABItABI2–0.25 ABI<0.25
SOM1
CEC0.826 *1
Feo0.2940.7231
Clay0.840 *0.988 **0.6671
Silt0.1090.4970.4970.4941
Sand−0.447−0.104−0.114−0.115−0.8071
ABIt−0.585−0.886 *−0.630−0.887 *−0.7970.3071
ABI2–0.25−0.558−0.859 *−0.595−0.862 *−0.824 *0.3560.998 **1
ABI<0.25−0.697−0.932 **−0.818 *−0.907 **−0.301−0.2730.7510.7081
Note: ABIt, ABI2–0.25 and ABI<0.25 represent the total ABI, ABI of the 2–0.25 mm fragments and ABI of the <0.25 mm fragments, respectively. The ABIt is the ratio of the total mass of 2–0.25 mm broken aggregate fractions and <0.25 mm broken aggregate fractions to the mass of the initial soil aggregates. * significant at the 0.05 level; ** significant at the 0.01 level.
Disclaimer/Publisher’s Note: The statements, opinions and data contained in all publications are solely those of the individual author(s) and contributor(s) and not of MDPI and/or the editor(s). MDPI and/or the editor(s) disclaim responsibility for any injury to people or property resulting from any ideas, methods, instructions or products referred to in the content.

