Article

Cation Exchange Properties of Subsurface Soil in Mid-Subtropical China: Variations, Correlation with Soil-Forming Factors, and Prediction

1
School of Engineering Management, Hunan University of Finance and Economics, Changsha 410205, China
2
College of Resources and Environment, Hunan Agricultural University, Changsha 410128, China
3
Hunan Economic Geography Technology Development Co., Ltd., Changsha 410205, China
*
Authors to whom correspondence should be addressed.
These authors contributed equally to this work.
Agronomy 2023, 13(3), 741; https://doi.org/10.3390/agronomy13030741
Submission received: 7 February 2023 / Revised: 23 February 2023 / Accepted: 24 February 2023 / Published: 1 March 2023
(This article belongs to the Special Issue Cultivated Land Sustainability in the Anthropocene)

Abstract

:
Soil cation exchange property (SCEP) is important in soil development and environmental buffering. However, the variations in SCEP and its correlation with soil-forming factors in subsurface soil are not fully understood. In this study, we quantified the surface and subsurface SCEP variations as a function of parent material, vegetation, hillslope position, and soil type. Fifty upland soil profiles from mid-subtropical China were selected. The cation exchange capacity (CEC) and effective CEC (ECEC) of subsurface soil were significantly higher in soils derived from slate, Quaternary red clay (QRC), and limestone than in soils derived from granite and sandstone. The subsurface soils derived from limestone had the highest base saturation (BS) and the sum of base cations, and the lowest aluminum (Al) saturation. The SCEP in surface soil significantly varied with vegetation and hillslope position. The surface soil CEC was the highest in mixed-forest vegetation, whereas the ECEC and exchangeable acidity (EA) were the highest in arable vegetation. Exchangeable potassium (K+) was lowest and the EA was highest in soil orders at the strong development phase. Exchangeable calcium (Ca2+), magnesium (Mg2+), CEC, and BS were the highest in soil orders at the intermediate development phase. The prediction accuracy of soil CEC using the random forest model was higher than that obtained using multiple stepwise regression, with the best results (R2 = 0.92) obtained in the surface soil. Our study indicated that the SCEP in surface and subsurface soils was controlled by different soil-forming factors and could be effectively predicted by soil properties in subtropical China.

1. Introduction

Soil cation exchange property (SCEP) is essential in maintaining soil fertility (such as ionic adsorption, desorption, and buffering capacity), decontaminating pollutants, and understanding soil taxonomy [1,2]. The main indicators to characterize SCEP are exchangeable base, sum of base cations (SBC), exchangeable acidity (EA), cation exchange capacity (CEC), effective cation ex-change capacity (ECEC), and base saturation (BS). Soil cation exchange capacity (CEC) primarily results from the isomorphic substitution of coordinating cations (such as Mg2+ substitution for Al3+) in clay minerals and functional group dissociation (such as carboxyl and hydroxyl group protonation) from soil organic colloids [3]. Understanding variations in cation exchange property, and its correlations with parent materials, pedogenic environments, and soil development sequences, is useful for deciphering the soil pedogenesis processes.
The SCEP is primarily controlled by natural soil-forming factors (climate, hillslope position, parent material, organisms, and soil development), soil components (clay minerals, soil organic matter, and Fe fractions), and land management practices in temperate and alpine regions [4,5,6,7,8]. However, only a few studies have been conducted in tropical and subtropical hilly regions [9].
The leaching of base ions in tropical and subtropical soils is intense because of the humid and hot climate environment [9]. The soil CEC is low and the EA is high due to the highly weathered soil parent minerals [10]. The effect of single soil-forming factor on the cation exchange property of surface soil has been investigated [11,12,13]. However, the effect of multiple soil-forming factors on the cation exchange property in the subsurface soil remains unclear, especially in subtropical China.
Developing an effective and precise prediction model of CEC is important for soil health evaluation [14]. Many empirical and regression models have been developed. The k-nearest neighbor and general linear model were used to predict the CEC content of different soil types in the United States and Iran, respectively [15,16]. Adaptive network-based fuzzy input systems and artificial neural networks are used to predict India’s surface soil CEC content [17]. However, there are few studies on accurately predicting CEC in different soil horizons in the subtropical region.
Hunan Province, located in subtropical China, has diverse parent rocks/materials and soil types [18,19]. This provides an ideal series of soils within which the effect of different soil-forming factors on cation exchange property can be studied. Therefore, we selected 50 upland soil profiles derived from five parent materials, analyzed the variations in cation exchange property as well as its correlation with soil-forming factors, and predicted the CEC. The objectives of this study were to (i) investigate the surface and subsurface SCEP variation and its correlation with parent materials, vegetations, and hillslope positions; (ii) establish a conceptual model characterizing exchangeable cation transfer and redistribution during different soil types (pedogenic phases) in subtropical upland soils; and (iii) estimate the CEC perdition capability of MSR and RF models in different soil horizons.

2. Materials and Methods

2.1. Site Description and Soil Sampling

Soil sampling sites were in the Hunan Province, in the middle reach of the Yangtze River, central China. The Hunan Province covers a land area of 211,800 km2, 40% of which is occupied by plains and low hills with an altitude of <300 m a.s.l. It experiences a humid middle subtropical monsoon climate with mean annual air temperature of 16–18 °C and mean annual precipitation of 1200–1700 mm. Soil profiles are highly weathered, and generally developed at >1 m depth. The parent rocks or materials are diverse, and include five main categories: granite, slate, limestone, sandstone, and QRC deposits. The vegetation cover primarily consists of shrubs, such as Loropetalum chinense and Quercus fabri; mixed forests constituting Castanopsis eyrei, Fagus longipetiolata, Liquidambar acalycina, Quercus glandulifera, and Symplocos paniculate; and arable land populated primarily with Camellia oleifera and Citrus reticulate [20].
In total, 50 sampling sites on well-drained upland landforms (41–650 m) were selected (Figure S1). Ten soil profiles were excavated randomly for each of the above-mentioned parent materials. In total, 203 soil samples were collected. The master and transitional horizons were defined, described, and sampled according to the field book for describing and sampling soils [21]. Information on sampling sites, including geographical location, hillslope position, and vegetation type, has been comprehensively described in Table S1. According to the Field Book for Describing and Sampling Soils [22], the top of slope belongs to the summit, the up-slope, meso-slope, and lower-slope are classified as backslope, and the bottom-slope is classified as footslope.
Five types of diagnostic horizons–Umbric (15) and Ochric (35) epipedons, Cambic (21), Argic (15), and LAC-ferric (20)–were identified from 50 soil sampling sites [23]. The Umbric epipedon is a dark colored, or humic, epipedon, with high or relatively high organic-carbon content. It is similar to the Umbric horizon in WRB. The Ochric epipedon is a light colored, or thin, humic epipedon. It is similar to the Ochric qualifier in WRB. The LAC-ferric horizon is a subsurface horizon resulting from medium degree of ferrallitization; it has lower activity clays and is rich in free iron oxides. It is similar to the Ferralic horizon in WRB. The Cambic horizon is a B horizon, formed by weathering and soil forming processes, that has no or almost no materials illuviation and distinct argillification or clayification does not occur, but the horizon does have the development of soil structure. It is similar to the Cambic horizon in WRB. The Argic horizon is a subsurface horizon in which clay content is distinctly higher than in the overlying horizons. It is similar to the Argic horizon in WRB [24].
The soils were classified as the Ferrosol, Argosol, Cambosol, and Primosol soil order categories as per the Chinese Soil Taxonomy [23]. They can be primarily referred to as Ultisols, Alfisols, Inceptisols, and Entisols in Soil Taxonomy, or Acrisols, Lixisols, Alisols, Luvisols, Plinthosols, Umbrisols, Cambisols, and Leptosols in the World Reference Base for Soil Resources (WRB) (Table S1) [24,25].
Based on the space-for-time substitution theory, the soil orders were classified into four types with reference to the four phases of soil development according to theoretical soil order development pathways [2,26]. The four phases of soil development are: (i) primeval phase (Primosols/Entisols/Leptosols), (ii) slight phase (Cambosols/Inceptisols/Cambisols), (iii) intermediate phase (Argosols/Alfisols/Luvisols/Umbrisols), and (iv) strong phase (Ferrosols/Ultisols/Plinthosols/Acrisols).

2.2. Laboratory Analysis

Soil exchangeable property and other physiochemical properties were analyzed according to the Soil Survey Laboratory Methods [27]. Briefly, the CEC and exchangeable cations (Ca2+ex, Mg2+ex, K+ex, and Na+ex) were determined using 1 M NH4OAc at pH 7. The concentrations of Ca2+ex and Mg2+ex in the soil extracts were measured using an atomic absorption spectrometer (AA6880, Shimadzu Co., Kyoto, Japan), while K+ex and Na+ex was measured using a flame photometer (M410, Sherwood Co., Cambridge, UK). The EA was determined by titrating the leachate to the phenolphthalein endpoint with 0.02 M NaOH. ECEC was calculated as the sum of EA and SBC. The BS was calculated using the formula: BS% = SBC/CEC × 100% and the aluminum saturation (Alsat) was calculated using the formula: Alsat% = Al3+ex/ECEC × 100%.
The soil particle composition was determined using the pipette method, and the soil texture and particle size were determined according to the USDA standards [28]. The soil bulk density (BD) was calculated by dividing the oven-dried weight by the cutting ring volume. Soil pH (H2O and KCl) was measured by inserting a glass electrode (S40, Mettler Toledo, Columbus, USA) in a soil solution prepared in a 1:2.5 (soil/solution) ratio by using distilled water or 1 M KCl. Soil organic carbon (SOC) was measured using the K2Cr2O7 wet oxidation method. Total potassium was determined using an alkali fusion and flame photometer (M410, Sherwood Co., Cambridge, UK). Moreover, selective extraction techniques (citrate bicarbonate dithionite) were applied to determine the Fed [27].
The soil physicochemical properties differed between soils derived from diverse parent materials and are listed in Table 1.

2.3. Statistical Analysis

The average content of elements throughout the entire soil profile was calculated as follows:
X d = i = 1 n (   1   -   θ i %   )   X i   ×   T i /   H
where Xd is the average content of elements throughout the entire soil profile, θi is the volume (%) of gravel fragments (>2 mm) in the ith soil horizon, Xi is the content of elements in the ith soil horizon, Ti is the thickness (cm) of the ith soil horizon, H is the thickness (cm) of the whole soil profile, and n is the total horizon number of the whole soil profile.
All data were analyzed using SPSS (SPSS 22.0 version, SPSS Inc., Chicago, IL, USA). One–way analysis of variance and Duncan’s test were applied to compare mean differences in physical and chemical properties of soils derived from different parent materials. Both the multiple stepwise regression (MSR) and random forest (RF) analyses were applied to establish prediction models of CEC with soil properties. Statistical significance was established at the 5% level, unless otherwise mentioned.
The CEC prediction dataset was divided into three database groups (all horizons: 203 samples; surface soil: 68 samples; and subsurface soil: 135 samples). Data subsets were used to determine the performance of MSR and RF models. Software R was used to analyze RF and SPSS was used for MSR. The SOC, sand content, clay content, pH, and Fed were used to predict the soil CEC using MSR and RF models. All CEC predictive models were evaluated based on four different error criteria: coefficient of determination (R2), adjacent coefficient of determination (Adj. R2), root mean square error (RMSE), and normalized root mean square error (NRMSE).

3. Results

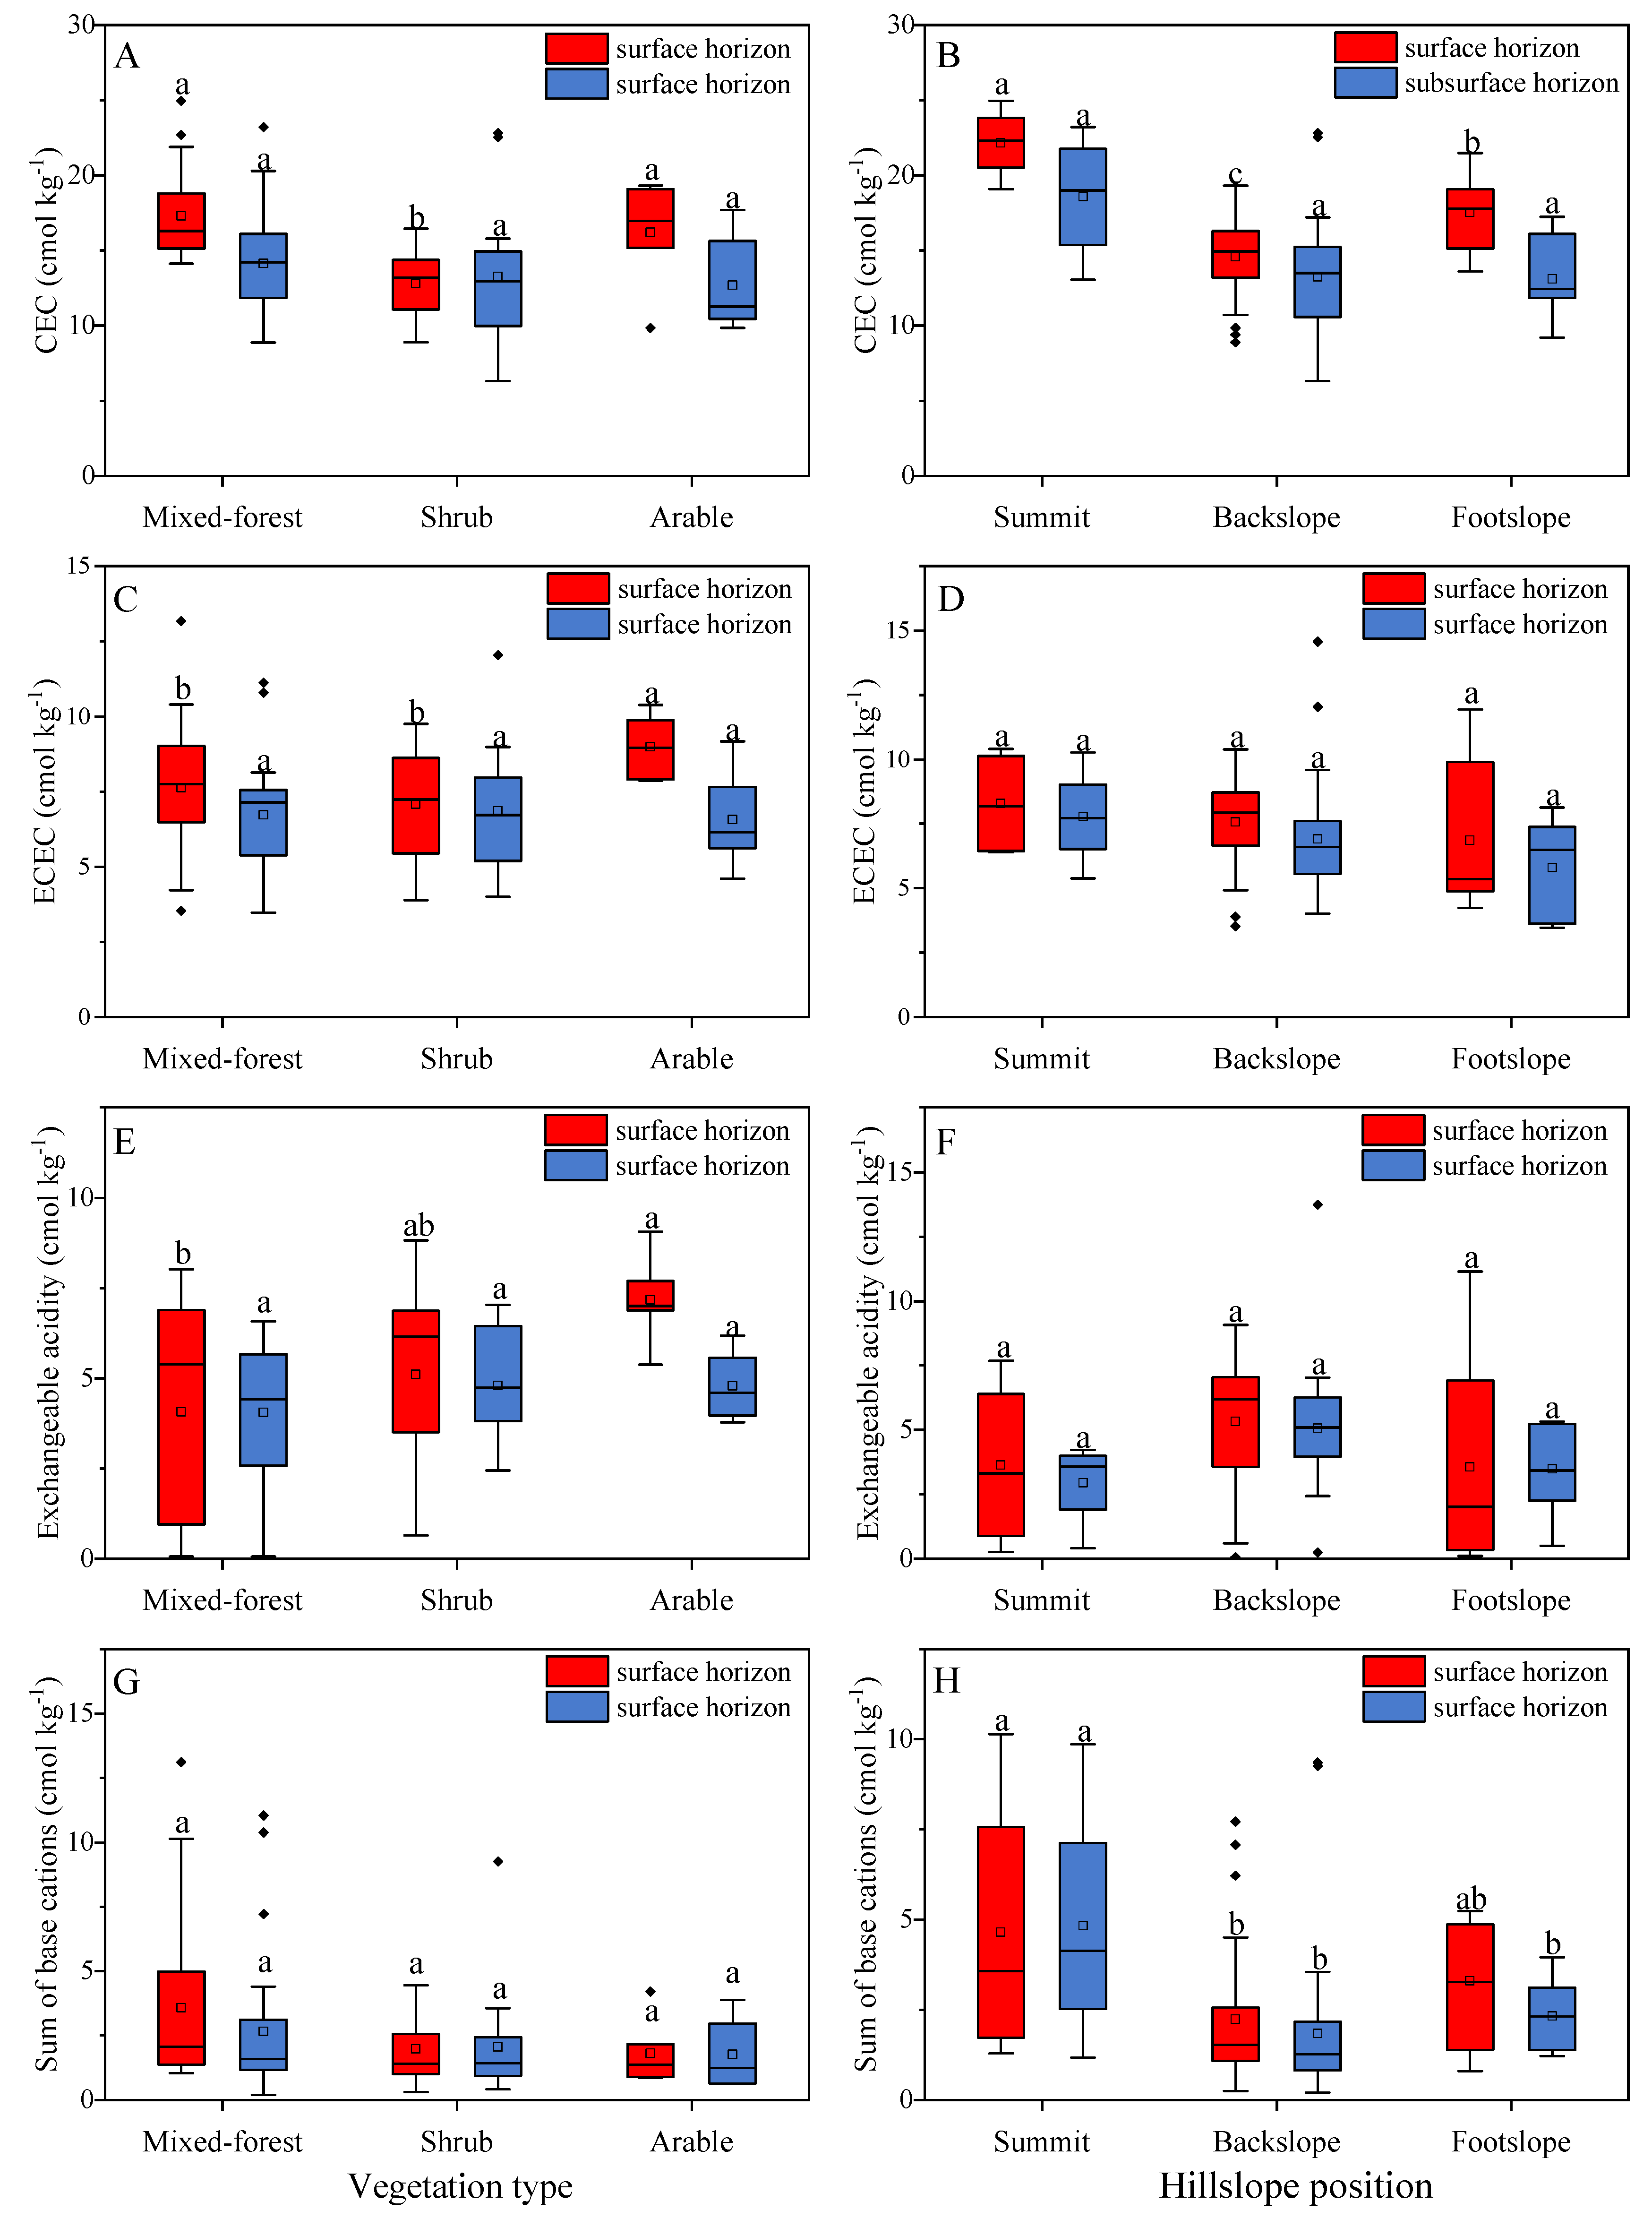
3.1. Variations in SCEP

Considering all horizons, the average CEC in soil was 14 ± 4 cmol kg−1 (3–27 cmol kg−1). This was twice the average soil ECEC of 7 ± 2 cmol kg−1 (3–15 cmol kg−1) (Table 2). The average SBC and EA was 2.5 ± 2.6 cmol kg−1 (0.2–14 cmol kg−1) and 4.7 ± 2.5 cmol kg−1 (0.01–14 cmol kg−1), accounting for 34% and 66% of the ECEC, respectively.
Specifically, the average Ca2+ex and Mg2+ex were 1.7 ± 2.4 cmol kg−1 and 0.5 ± 0.4 cmol kg−1, respectively. This decreased the average BS value (17 ± 16%). The sum of Ca2+ex and Mg2+ex accounted for 86% of the SBC, while the average Al3+ex was 4.4 ± 2.4 cmol kg−1, accounting for 94% of the EA. Thus, the average Alsat was relatively high (64 ± 27%).

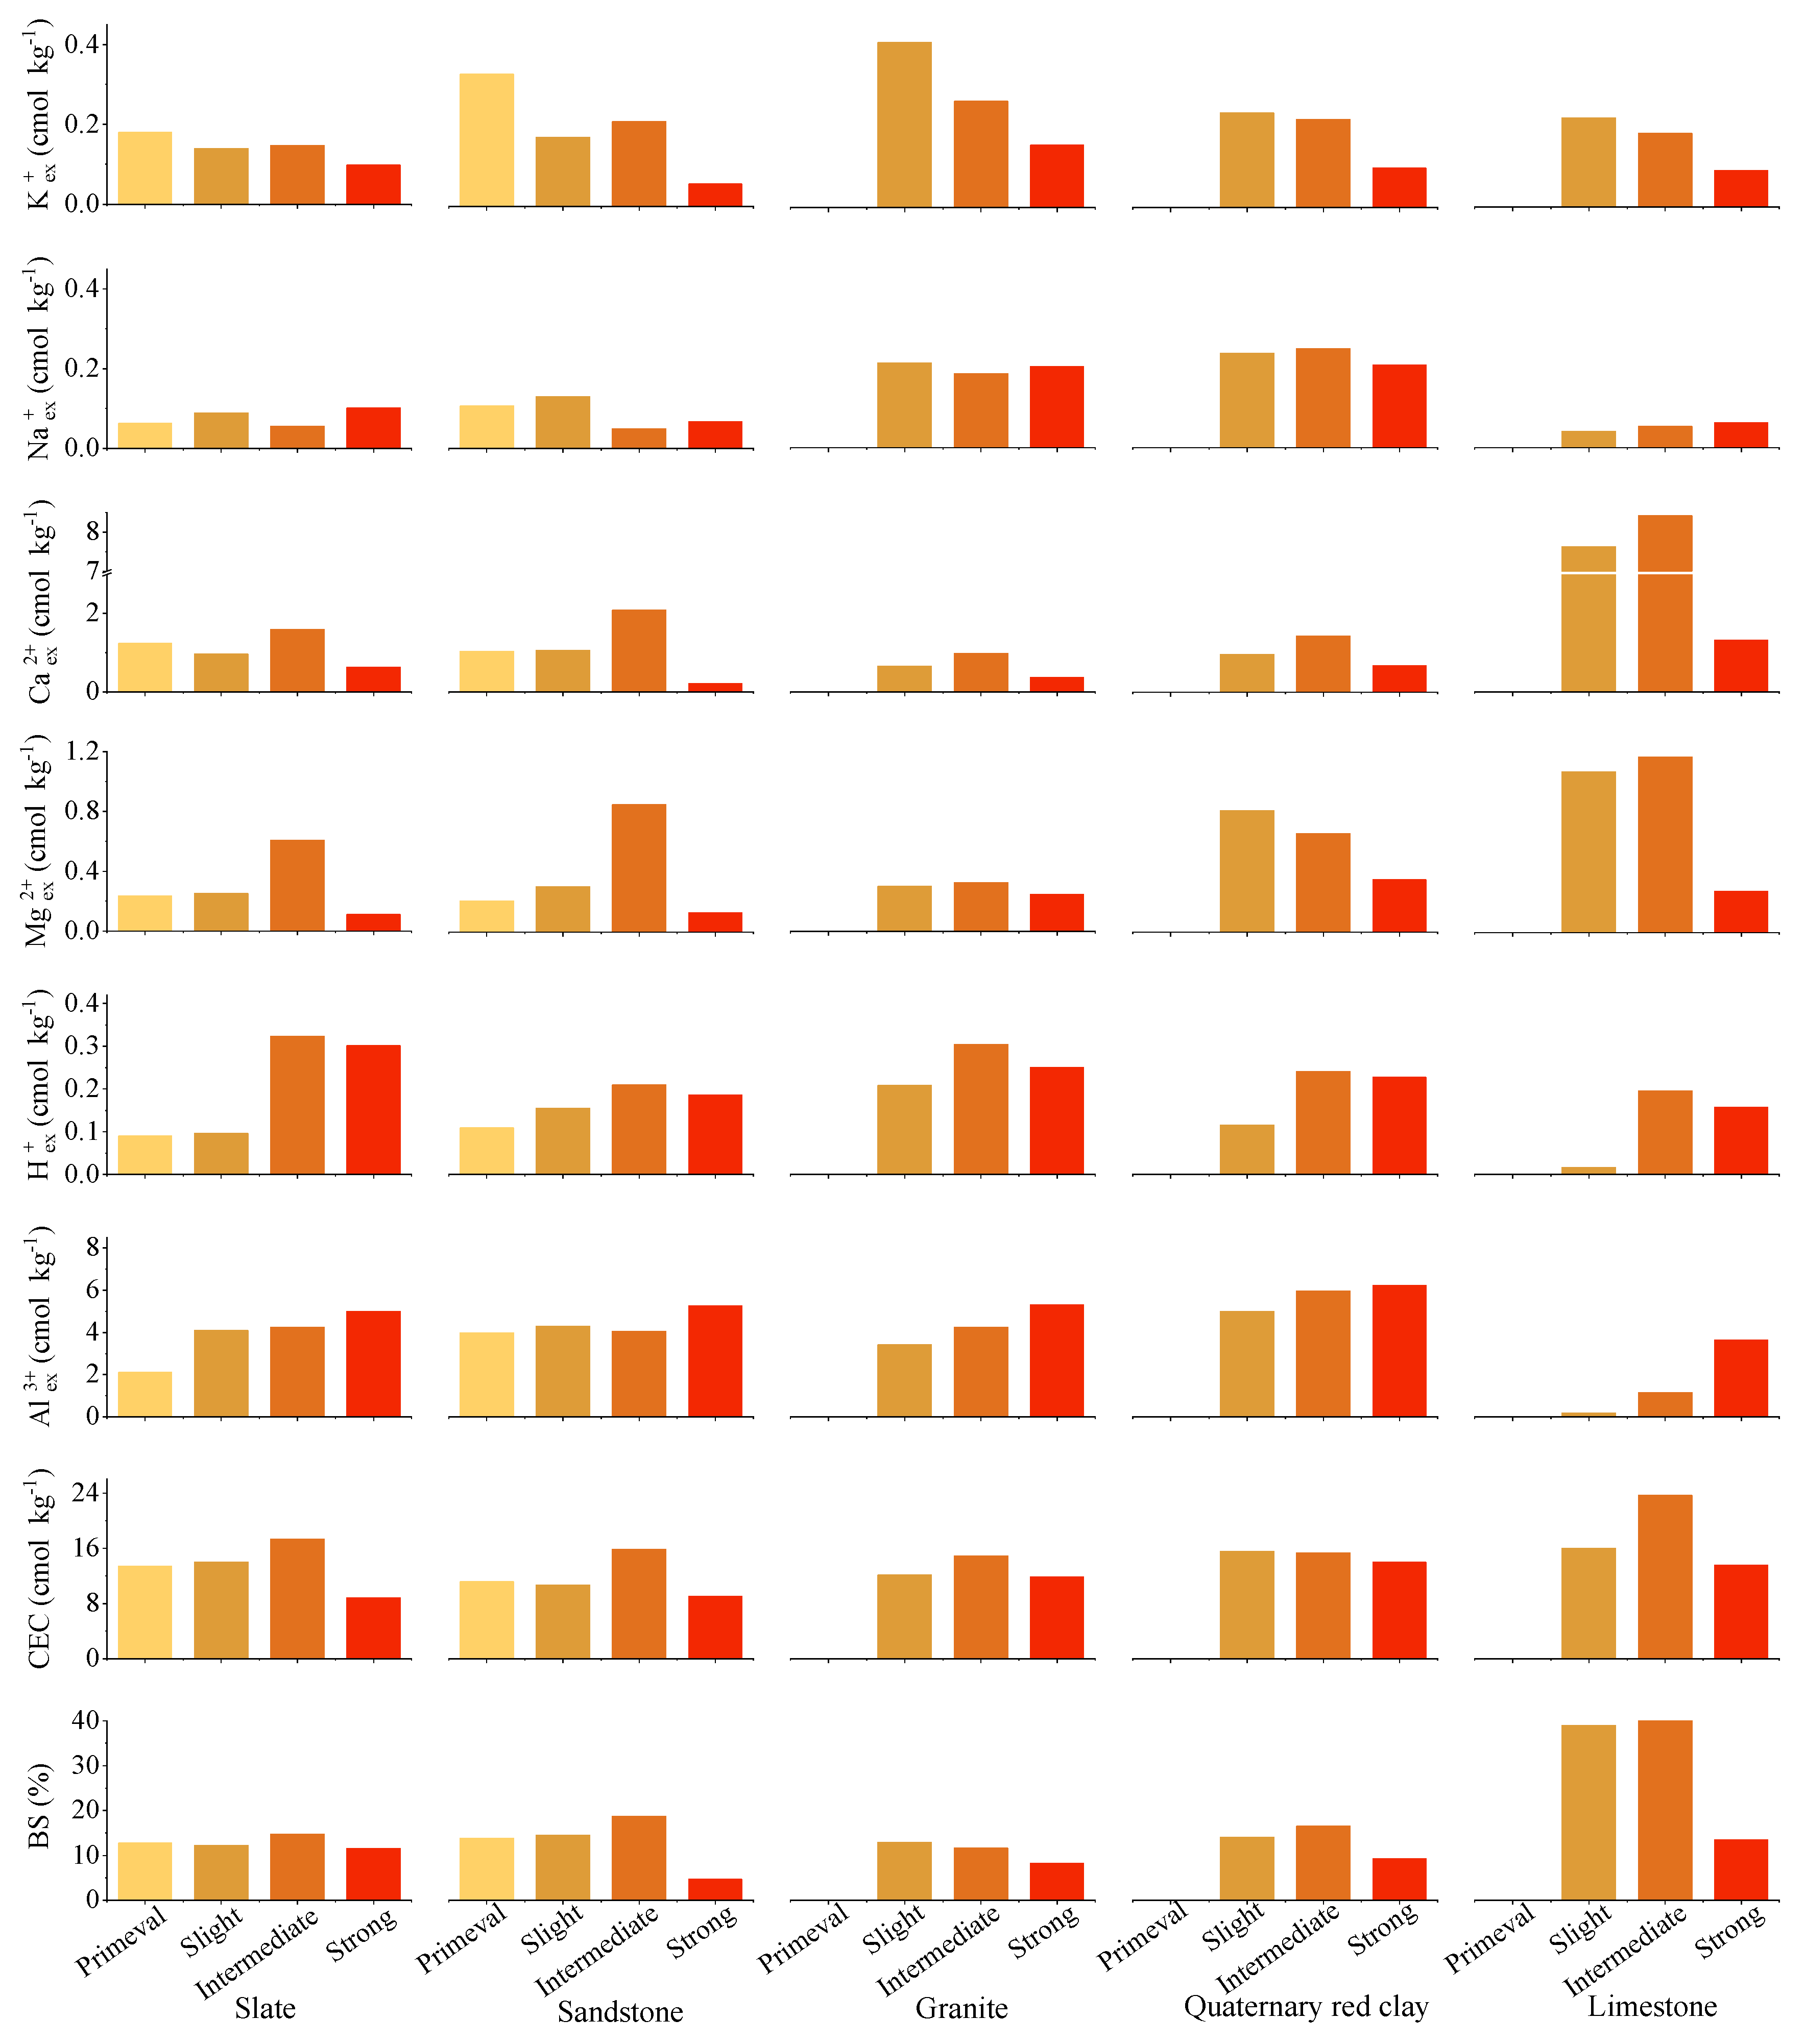
3.2. SCEP as a Function of Soil-Forming Factors

Parent materials significantly affect the SCEP, especially for the subsurface soil horizon (Table 2). The average Ca2+ex and the SBC was highest in soils derived from limestone, while the mean Mg2+ex in subsurface soil was highest in soils derived from both limestone and QRC; this was contrary to the average values of EA (H+ex and Al3+ex, respectively). Noticeably, the mean K+ex was highest and ECEC was lowest in subsurface soils derived from granite. Similarly, the CEC, ECEC, and BS values were the highest, and the Alsat was the lowest in subsurface soil derived from limestone.
Vegetation and hillslope position significantly influenced the cation exchange property in the surface soil (Figure 1). The average CEC was highest in surface soil covered by mixed forest, while ECEC and EA were highest in surface soil covered by arable vegetation. No significant differences in the SBC were found for different vegetation covers. Both CEC and SBC in surface soil were higher in the summit and the footslope than in the backslope. No significant differences in the ECEC and EA were found with changes in the hillslope position.

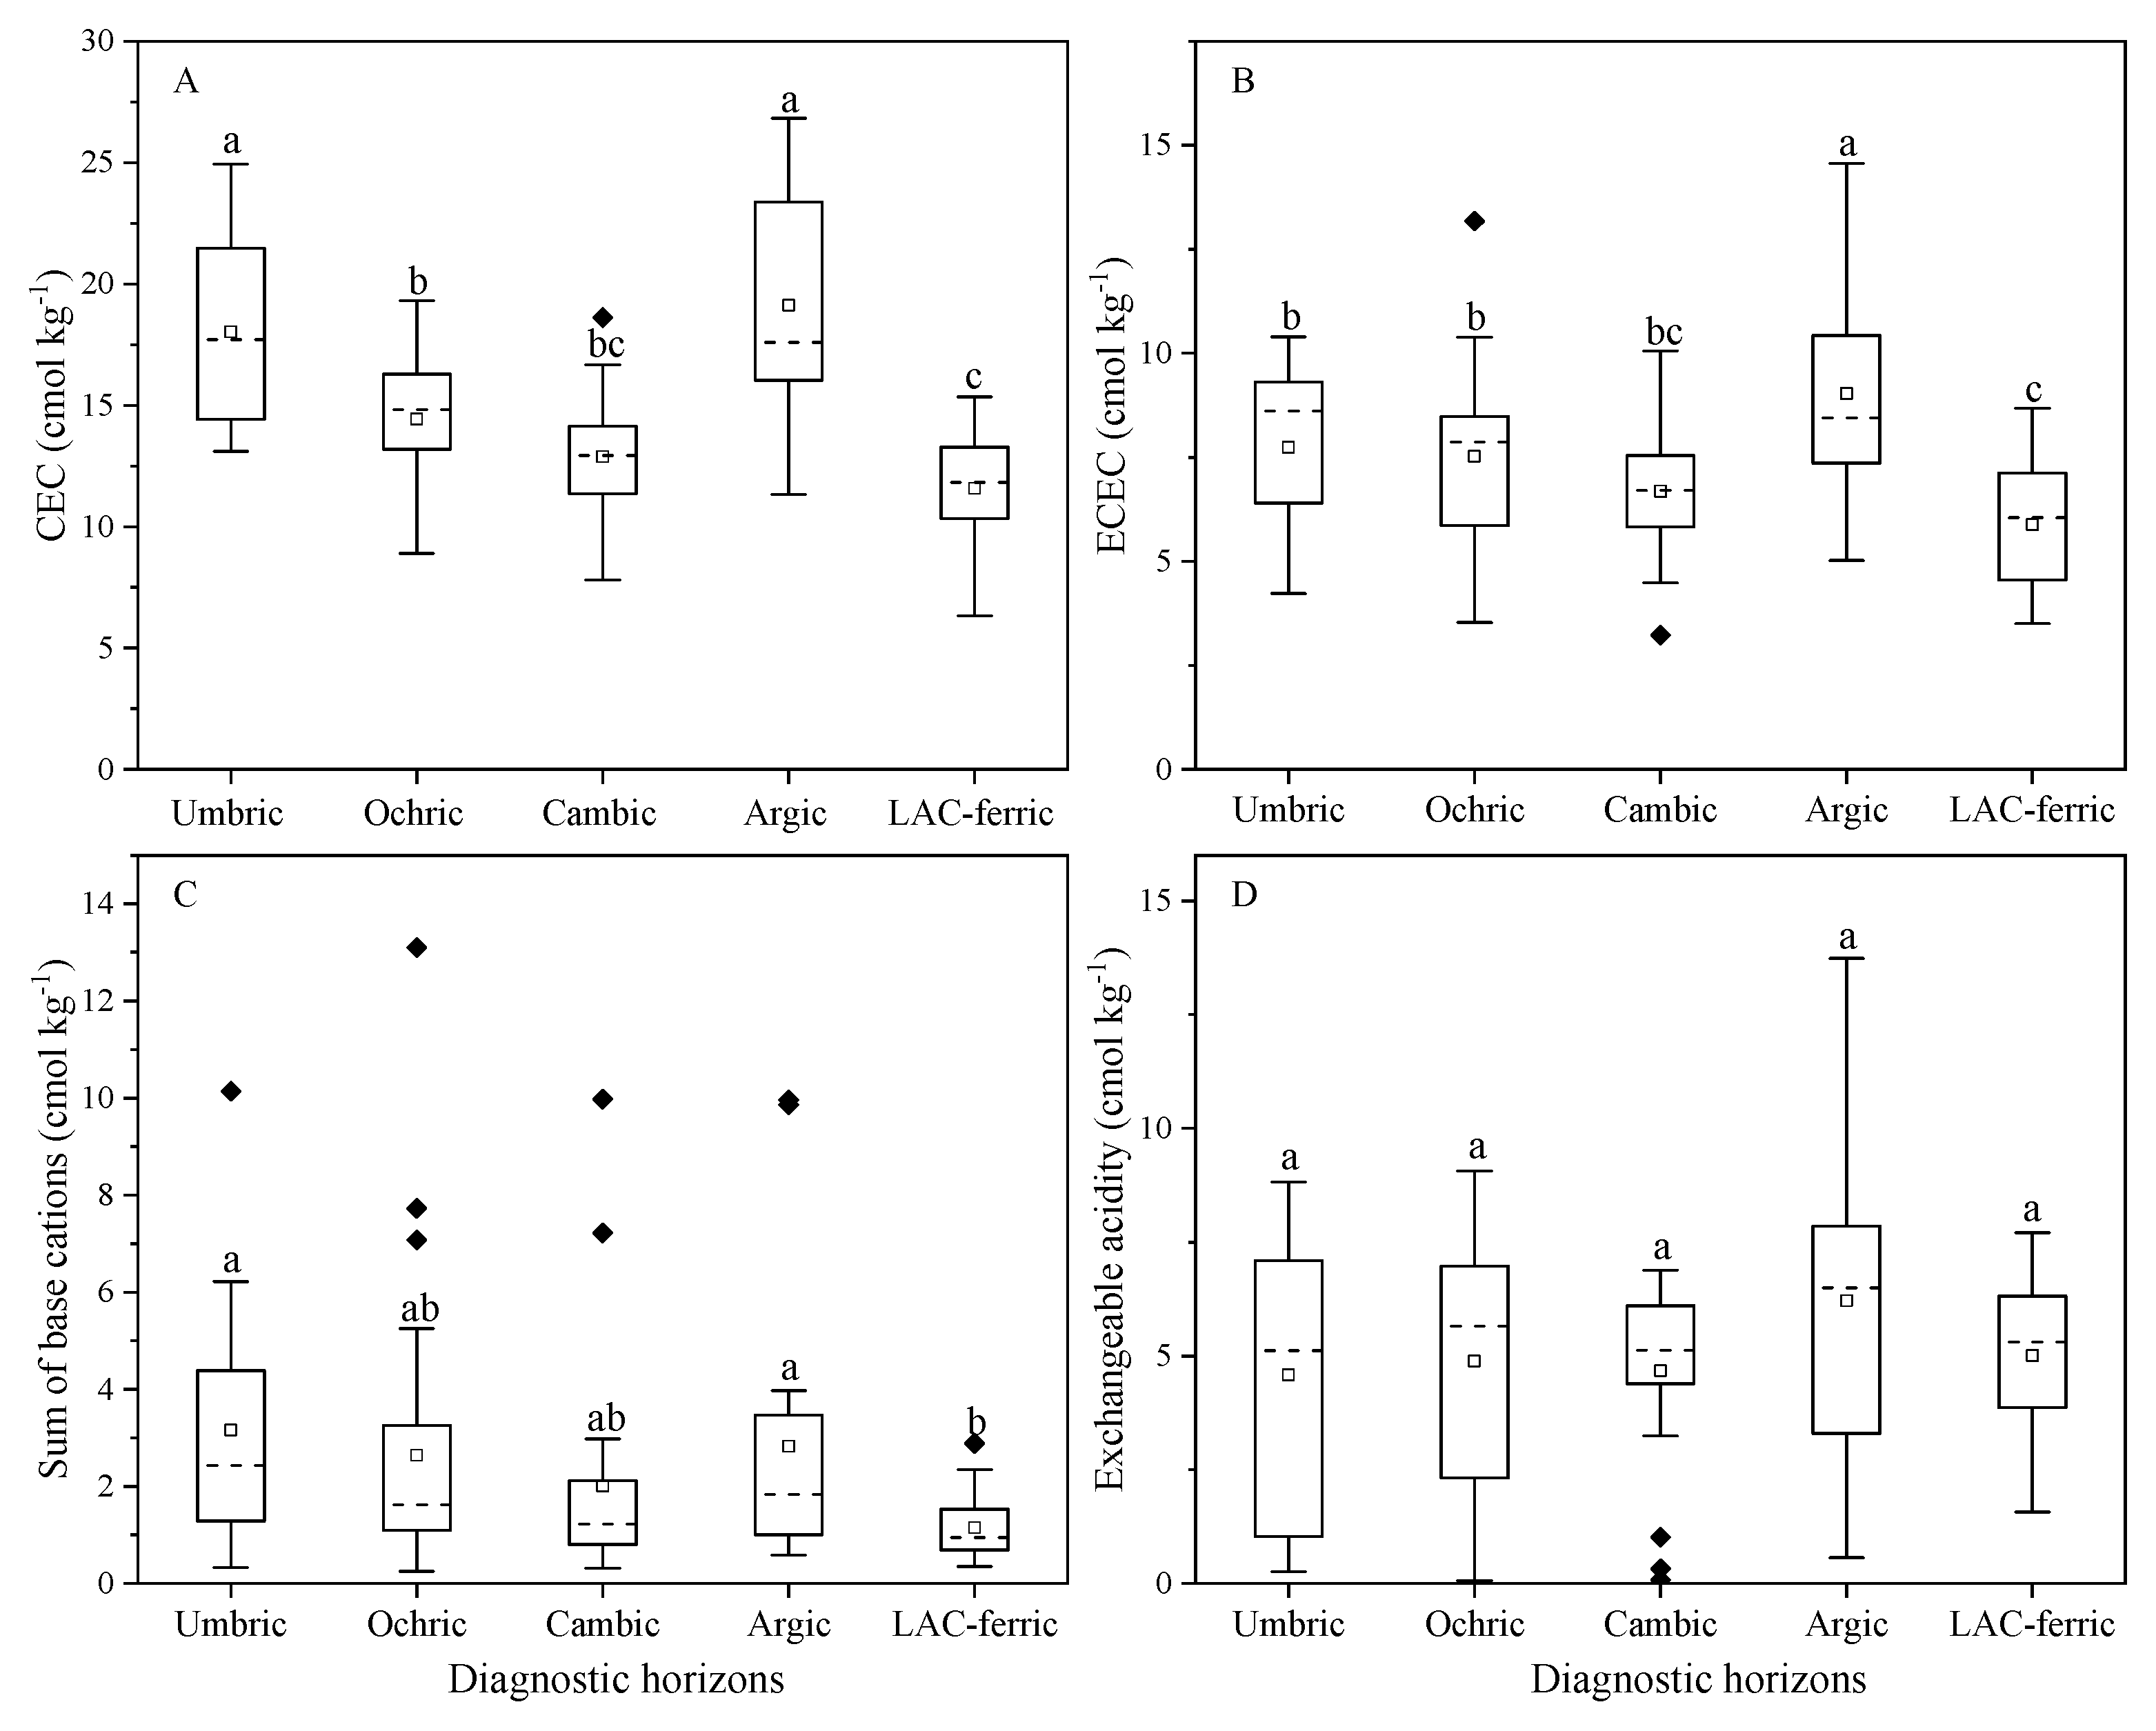
3.3. SCEP as a Function of Diagnostic Horizons and Soil Orders

The diagnostic horizons significantly influenced the soil cation exchange property (Figure 2). The CEC, ECEC, and the SBC in the Argic horizon and Umbric epipedon were higher than those in the LAC-ferric horizon. No significant differences in EA were found among the different diagnostic horizons.
The soil order, in reference to the four phases of soil development, affected the cation exchange property of subsurface soils derived from the similar parent material (Figure 3). K+ex was lowest and the EA (especially for Al3+ex) was highest in soil orders at the strong phase of soil development. However, Na+ex was lower and similar among soil orders. The Ca2+ex, Mg2+ex, CEC, and BS had the highest value in soil orders at the intermediate phase of soil development.

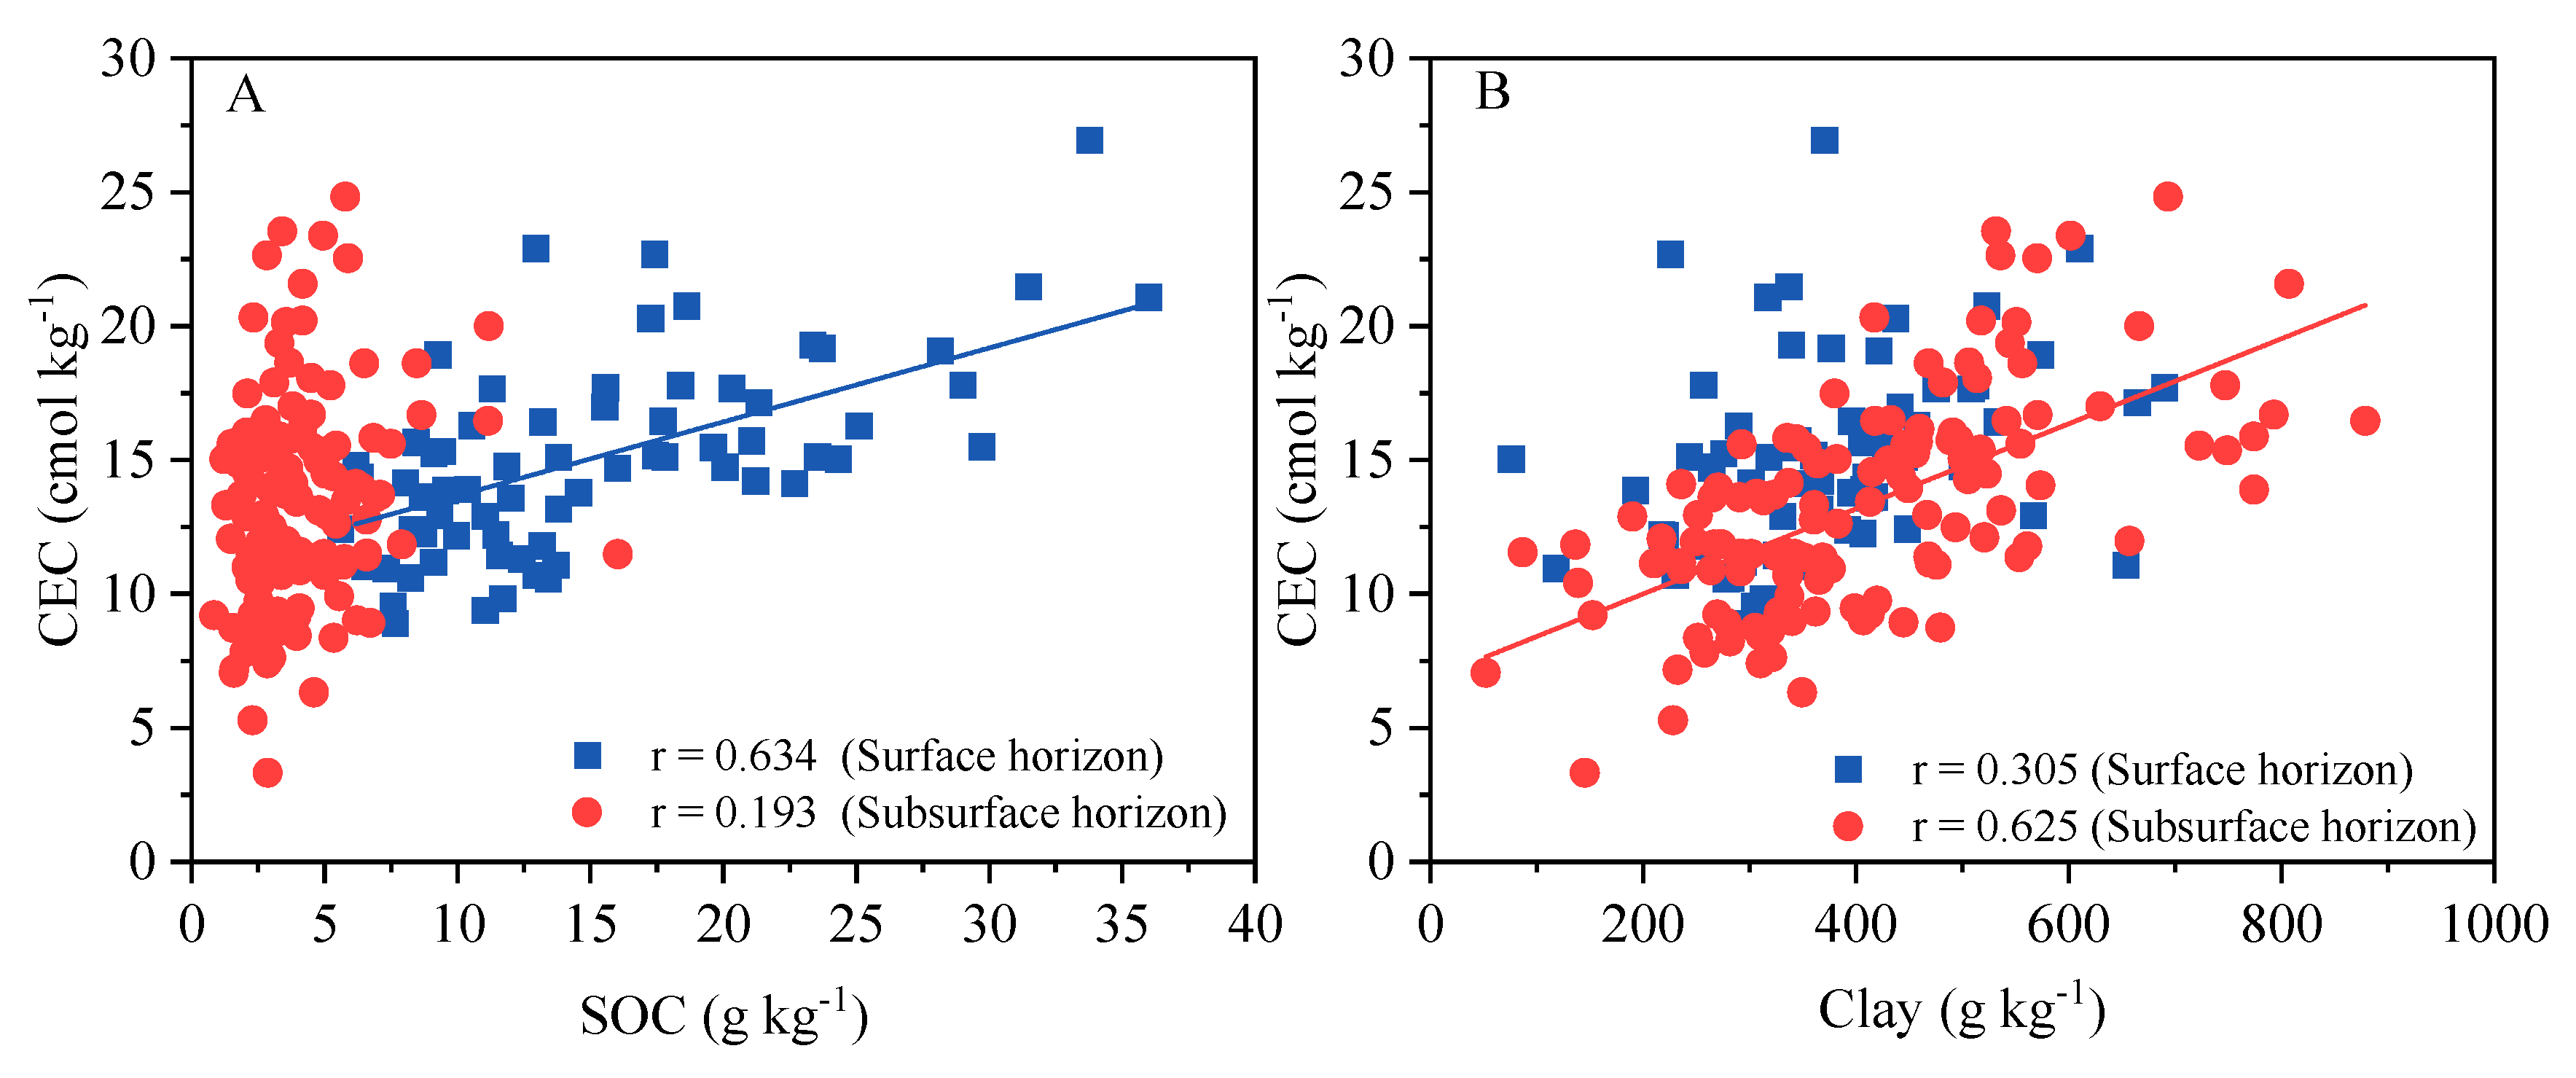
3.4. Correlation and Prediction Model of SCEP with Soil Properties

Indices of SCEP were found to be significantly correlated with soil physicochemical properties (Table 3). Specifically, the CEC was positively correlated with silt, clay, and SOC contents as well as pH, while it was negatively correlated with sand content and BD. The EA and the Al3+ex were negatively correlated with pH in soil. The BS was positively correlated with pH and negatively correlated with sand content.
Interestingly, clay and SOC had different roles in determining the CEC of surface and subsurface soils (Figure 4). In surface soils, the correlation coefficient (0.63) between CEC and SOC content was higher than that (0.31) between CEC and clay content. In subsurface soils, however, the correlation coefficient (0.19) between CEC and SOC content was lower than that (0.63) between CEC and clay content.
The CEC in surface and subsurface soils can be effectively predicted by multivariate regression functions (MRFs) and RF algorithms (Table 4). The CEC in surface soils was effectively predicted based on the contents of sand and SOC, pHKCl, and BD (R2 = 0.68), while the prediction variables of CEC were different in subsurface soils (clay content, Fed, and pHH2O); additionally, a modest prediction ability (R2 = 0.46) was recorded. The prediction ability of CEC was significantly improved using the RF model with the highest R2 of 0.92 for surface soils.

4. Discussion

4.1. SCEP as a Function of Soil-Forming Factors

Parent material type affects SCEP, with the main factors being mineral type and texture size [29]. In our study, the Ca2+ex, SBC, and BS in subsurface soils were highest in soils derived from limestone (Table 2). Limestone is primarily composed of marine sedimentary carbonate rock [18] and it can release base cations, especially Ca2+, during weathering and pedogenesis [30,31,32]. As abundant base cations can compete with H+ex and Al3+ex adsorbed on the colloid’s cation exchange sites [26], the EA and Alset contents of the subsurface soils from limestone were significantly lower than in the subsurface soils derived from other parent materials. Moreover, potentially dissociated functional groups were abundant on soil colloids derived from limestone and QRC due to their significantly higher clay contents compared to the other soils (Table 1). Therefore, the CEC of the subsurface soils from limestone and QRC was significantly higher than that from other parent materials (rclay = 0.50). Similar results have also been reported by Funakawa et al. and Nie et al. [33,34], who documented the high CEC of the soil derived from limestone (18.8 ± 1.03 cmol kg−1) and QRC (11.98 ± 1.48 cmol kg−1) in the subtropical region.
The CEC of the subsurface soils derived from granite and sandstone was significantly lower than that of the soils derived from QRC and limestone, owing to the sand contents of the former being higher (rsand = −0.54). Soil ECEC can reflect the actual negative charges, that are almost permanent negative charges [35]. In our study, the ECEC of the subsurface soils derived from granite was the lowest among the soils derived from all the other parent materials studied (Table 2). This was possibly due to the higher relative content of kaolinite in soil derived from granite (Figure S2). Our previous study showed that the relative content of kaolinite (72%) in soil derived from granite was higher than in the soil derived from other parent materials [19]. Kaolinite seldom shows isomorphous substitution in the structural layers due to its stable structure, small effective surface area, and hexa-coordinate number for Al3+ in the interlayer; thus, its permanent negative charges are less [36,37,38]. The K+ex content of the soil derived from granite was significantly higher than that of the soil derived from the other parent materials; this can be attributed to the soil derived from granite containing a large amount of K2O (Table 1).
Vegetation mediates the SCEP primarily through plant input [39,40]. The SOC stock in the surface soil has been reported to be higher in mixed forest than in the soils dominated by shrubs [41]. Humus colloids have many hydroxyl groups (carboxylic, phenolic, and alcoholic) that carry a high amount of negative charge owing to the dissociated H+ [42]. Brady and Weil [26] reported that approximately 75% of the CEC is sourced from the humus in clayey Ultisol (containing 2.5% humus and 30% kaolinite). In the current study, the effect of SOC (r = 0.63) on CEC was much greater than that of clay (r = 0.31) in the surface horizon (Figure 4). Therefore, the average CEC in the surface soil covered by mixed forest was highest (Figure 1). By contrast, the CEC in the surface soil covered by shrubs was lowest due to the low input of humus. The surface soil BS content in arable land was lowest, whereas the EA was highest compared to those in the soils covered by other vegetation types. This was attributable to the application of organic and chemical fertilizers during the cropping of Camellia oleifera and Citrus reticulate. Organic matter is a source of many negative charges; organic acids can be produced in increased quantities during microbial decomposition. These acids include both weak acids (e.g., citric and malic acids) with a low degree of dissociation, and strong acids (e.g., carboxylic and phenolic acids) with a high degree of dissociation [26]. Furthermore, extensive use of chemical fertilizers can promote the accumulation of H+ex and Al3+ex on soil colloids and reduce the BS through NH4+ oxidation in the soil by microbes [43].
Hillslope position can influence the SCEP via redistribution of precipitation, soil erosion, and deposition of exogenous materials [32,44]. In our study, the surface soil CEC at the backslope was significantly lower than that at the summit and footslope due to surface runoff erosion. However, the CEC, SBC, and BS of surface soil at the footslope were higher than at the backslope, and the variation in CEC was statistically significant (p < 0.05). The discrepancy may be due to the variance in the SOC contents of the soils at different hillslope positions. After the surface soil at the backslope was eroded, the SOC became insufficient, thereby decreasing the number of cation exchange sites, but the cation exchange sites of the surface soil in the footslope increased with the accumulation of organic matter from the backslope [12,45,46,47]. In our study, the CEC and SBC in the surface soil at the summit were the highest. This discrepancy can be ascribed to the abundant humus input in the surface soil, thus increasing the negative charges of soil colloids due to flat terrain, high vegetation coverage, and increased biomass at the summit [32,34,48,49].
The effect of altitude on the SCEP of upland soil in Hunan Province was not significant because the sampling sites were in hilly and lowland (<800 m a.s.l.) areas. This observation was not consistent with those in previous studies that focused on the alpine and subalpine belts (>1000 m a.s.l.) with a large altitude span [50]. These results indicated that the SCEP in subsurface soils was primarily affected by the parent material, while in upland surface soils at low elevations, the SCEP was primarily affected by vegetation type and hillslope position (Table 2 and Figure 1).

4.2. SCEP as an Indicator of Soil Development

During soil development, the mineral type and texture size change dramatically, which can substantially influence the surface area and charge density of soil colloids and eventually lead to significant differences in SCEP at different pedogenic phases [51,52]. In the current study, the CEC and SBC in Ochric epipedon were lower than those in Umbric epipedon, possibly due to low SOC in the Ochric epipedon that limited the cation exchange sites (Figure 2). In the diagnostic subsurface horizon with low SOC content, clay content was the primary factor affecting the CEC (Figure 4). Due to their small size (<2 μm), soil colloids are affected by gravity potential and readily migrate from the leached horizon to the lower horizons along with percolating water [53,54]. Soil colloids carry larger negative charges, allowing them to combine with exchangeable cations; moreover, neutralization by cations can promote the flocculation and aggregation of colloids [55]. As water percolation decreases with depth, the capillary attraction of the soil interface increases and the matric potential decreases. When the gravity and matric potential are balanced, the colloids and base cations adsorbed are deposited in the Agric horizon [56]. Therefore, the CEC, ECEC, and SBC of the Agric horizon were significantly higher than those of the Cambic and LAC-ferric horizons. The LAC-ferric horizon is often formed in tropical and subtropical humid and warm pedogenic environments. The decomposition of minerals and the leaching of the exchangeable base in the horizon is relatively strong, and the dominant clay mineral of the layer is kaolinite (Figure S3) [19,57]. Thus, the CEC, ECEC, and SBC in the LAC-ferric horizon were lowest (Figure 2).
Due to sialitization in the primeval phase of soil development (CST: Primosols, ST: Entisols, WRB: Leptosols), primary minerals in the parent rock were altered, following which, clay particles were gradually formed [2]. Sialitization promoted the weathered B horizon formation and resulted in soil development reaching the slight phase (CST: Cambosols, ST: Inceptisols, WRB: Cambisols). During these processes, the base ions previously immobilized by the mineral lattice were continuously released, and some monovalent base cations (Na+ and K+) were leached due to loose binding with colloids (Figure 3 and Figure 5). Our study found that Na+ex was lower and similar among all soil orders, but the K+ex was lowest in soil orders at the strong phase of soil development (Figure 3). This was possibly ascribed to the small hydrated ionic radius and weak hydration of K+ [3]; further, the amount of K+ in the diffusion layer is less than that of Na+, and most K+ are adsorbed in the Stern layer [58]. Therefore, Na+ leaching occurs earlier than that of K+ (Figure 3 and Figure 5). In our study, Ca2+ex, Mg2+ex, CEC, and BS had the highest value in soil orders (CST: Argosols, ST: Alfisols, WRB: Luvisols or Umbrisols) at the intermediate phase of soil development (Figure 3). This is due to the soil argillization that was highly strengthened, and the clay particles were continuously eluviated and illuviated in solum at the intermediate phase [57]. With the increase in the clay content, the specific surface area of soil colloids (R2 = 0.91) and CEC (R2 = 0.75) were higher [59]. Thus, the larger specific surface area of soil colloid can adsorb more Ca2+ex and Mg2+ex (Figure 3 and Figure 5). Paluszek et al. reported that the SBC, CEC, and BS of the Bt horizon in Luvisols developed from loss were higher than in other horizons [60].
However, Ca2+ex, Mg2+ex, CEC, and BS were dramatically decreased and the EA (especially for Al3+ex) was increased in the soil orders (CST: Ferrosols, ST: Ultisols, WRB: Plinthosols or Acrisols) at the strong phase of soil development (Figure 3). This may be related to the transformation of clay mineral types (Figure S4). During the strong phase of soil development, soil fersiallitisation increased and 2:1-type clay minerals were gradually transformed into 1:1-type kaolinite [57]. Our previous study found the relative content of kaolinite (51–63%) in soil orders (CST: Ferrosols, ST: Ultisols, WRB: Plinthosols or Acrisols) at the strong phase of soil development [19]. Due to the degradational transformation of secondary aluminosilicate minerals, several Al3+ ions were released. The 2:1-type clay minerals gradually transformed into 1:1-type clay minerals and their surface area constantly decreased; moreover, the base cations adsorbed on the colloid surfaces were gradually replaced by Al3+ due to the strong binding forces between the latter and the colloid surfaces compared to those between the base cations and the colloid surfaces [57,61]. Therefore, in the strong phase, Ca2+ex, Mg2+ex, CEC, and BS decreased dramatically while EA (especially for Al3+ex) constantly increased (Figure 3 and Figure 5).

4.3. CEC Prediction Model

The prediction model of CEC is affected by soil physicochemical factors (pH, SOC, and clay and sand contents) [14,62]. Khaledian et al. and Ulusoy et al. observed that CEC is mainly controlled by SOC content [61,63]. However, Khaledian et al. reported that CEC is primarily affected by the amounts of clay and sand as well as pH value [14]. In this study, the influence of soil physicochemical factors on CEC varied in different soil horizons (Figure 4). Further, the CEC of the surface soil was found to be primarily affected by SOC, while the subsurface soil was influenced more by the amount of clay than by the content of SOC (Figure 4). The content of SOC (>6.0 g kg−1, mostly) in surface soil was significantly higher than that in the subsurface soil due to the surface soil receiving large amounts of humus, and SOC contributing to abundant negative charges. Therefore, the contribution of SOC in the surface soil was higher in terms of affecting the CEC. However, the effect of clay on CEC was stronger than that of SOC in the subsurface soil, due to the low content of the latter (<6.0 g kg−1).
This indicated that the accuracies of the CEC prediction model in different soil horizons (especially for surface soil) were higher than that for all soil horizons (Table 4). The accuracy indicator (R2 = 0.92) of the RF model for the surface soil was superior to that reported in other studies that predicted CEC using various models, such as general linear models (R2 = 0.43–0.78) [15] and multiple linear regression models (R2 = 0.57) [64]. Notably, Table 4 presents the results of the CEC prediction model for the soil in the subtropical region. In contrast, the prediction model of soil CEC in other climate areas and under different land-use types need further investigation.

5. Conclusions

CEC, ECEC, SBC, and BS of upland soils in subtropical Hunan Province were low, but EA and Alsat were high due to intense eluviation and weathering under the warm and humid subtropical climate. However, differences in parent materials, regional environment (vegetation type and hillslope position), and pedogenic processes resulted in significant variations in SCEP. Parent materials primarily controlled the cation exchange property of the subsurface soil. In the low altitude areas (<800 m a.s.l.), vegetation type and hillslope position were the main environmental factors that regulated the cation exchange property of the surface soil. In the soil orders at the strong phase of soil development, average K+ex was lowest and the EA (especially for Al3+ex) was highest. Ca2+ex, Mg2+ex, CEC, and BS were highest in soil orders at the intermediate phase of soil development. The accuracy of the CEC prediction model varied in different soil horizons, and the result of RF model for the surface soil was the best. These results are potentially useful for understanding pedogenesis and managing upland soil in subtropical regions of China.

Supplementary Materials

The following supporting information can be downloaded at: https://www.mdpi.com/article/10.3390/agronomy13030741/s1, Table S1: Fundamental information about study sites and soil classification; Figure S1: The study area and geographic distribution of sampling sites; Figure S2: X-ray diffraction patterns of the representative upland soil profiles derived from different parent materials; Figure S3: Relative content of clay minerals of different diagnostic horizons; Figure S4: Relative contents of clay minerals of different soil types (i.e., soil orders)

Author Contributions

Conceptualization: N.O., P.Z., Y.Z. and H.S.; Methodology: N.O., P.Z., Y.Z. and H.S.; Formal analysis and investigation: N.O., Y.Z., H.S., Q.Z., Y.H., Z.Y. and P.Z.; Writing—original draft preparation: N.O., P.Z., Y.Z. and H.S.; Writing—review and editing: N.O., P.Z., Y.Z. and H.S.; Funding acquisition: P.Z., Y.Z., H.S. and Z.Y.; Resources: Y.Z., H.S., Z.Y. and P.Z.; Supervision: Y.Z. and H.S. All authors have read and agreed to the published version of the manuscript.

Funding

This study was financially supported by the National Key Basic Research Special Foundation of China (No. 2014FY110200A15), the Natural Science Foundation of China (No. 41571234), the Scientific Research Foundation of Hunan Provincial Education Department of China (No. 20A234), and Hunan Provincial Base for Scientific and Technological Innovation Cooperation, China (No. 2018WK4013).

Institutional Review Board Statement

Not applicable.

Informed Consent Statement

Not applicable.

Data Availability Statement

All data are true, valid and can be available.

Conflicts of Interest

The authors declare no conflict of interest.

References

  1. Brevik, E.C. Soil health and productivity. In Soils, Plant Growth and Crop Production; Verheye, W., Ed.; EOLSS Publishers: Oxford, UK, 2009; pp. 106–137. [Google Scholar]
  2. Schaetzl, R.J.; Thompson, M.L. Soil Genesis and Geomorphology, 2nd ed.; Cambridge University Press: Cambridge, UK, 2015. [Google Scholar]
  3. Evangelou, V.P.; Phillips, R.E. Cation exchange in soils. In Chemical Processes in Soils; Tabatabai, M.A., Sparks, D.L., Eds.; Soil Science Society of America: Madison, WI, USA, 2005; Volume 8, pp. 343–410. [Google Scholar]
  4. Caravaca, F.; Lax, A.; Albaladejo, J. Organic matter, nutrient contents and cation exchange capacity in fine fractions from semiarid calcareous soils. Geoderma 1999, 93, 161–176. [Google Scholar] [CrossRef]
  5. Ata Rezaei, S.A.; Gilkes, R.J. The effects of landscape attributes and plant community on soil chemical properties in rangelands. Geoderma 2005, 125, 167–176. [Google Scholar] [CrossRef]
  6. Yimer, F.; Ledin, S.; Abdelkadir, A. Concentrations of exchangeable bases and cation exchange capacity in soils of cropland, grazing and forest in the Bale Mountains, Ethiopia. For. Ecol. Manag. 2008, 256, 1298–1302. [Google Scholar] [CrossRef]
  7. Iturri, L.A.; Buschiazzo, D.E. Cation exchange capacity and mineralogy of loess soils with different amounts of volcanic ashes. Catena 2014, 121, 81–87. [Google Scholar] [CrossRef]
  8. Bojko, O.; Kabala, C. Transformation of physicochemical soil properties along a mountain slope due to land management and climate changes—A case study from the Karkonosze Mountains, SW Poland. Catena 2016, 140, 43–54. [Google Scholar] [CrossRef]
  9. Yu, Z.; Chen, Y.H.; Searle, E.B.; Sardans, J.; Ciais, P.; Peñuelas, J.; Huang, Z. Whole soil acidification and base cation reduction across subtropical China. Geoderma 2020, 361, 114107. [Google Scholar] [CrossRef]
  10. Ludwig, B.; Khanna, P.K.; Anurugsa, B.; Fölster, H. Assessment of cation and anion exchange and pH buffering in an Amazonian ultisol. Geoderma 2001, 102, 27–40. [Google Scholar] [CrossRef]
  11. Thomas, G.A.; Dalal, R.C.; Standley, J. No-till effects on organic matter, pH, cation exchange capacity and nutrient distribution in a luvisol in the semi-arid subtropics. Soil Tillage Res. 2007, 94, 295–304. [Google Scholar] [CrossRef]
  12. Cheng, C.; Hsiao, S.; Huang, Y.; Hung, C.; Pai, C.; Chen, C.; Menyailo, O.V. Landslide-induced changes of soil physicochemical properties in Xitou, Central Taiwan. Geoderma 2016, 265, 187–195. [Google Scholar] [CrossRef]
  13. Liu, J.; Wang, Z.; Hu, F.; Xu, C.; Ma, R.; Zhao, S. Soil organic matter and silt contents determine soil particle surface electrochemical properties across a long-term natural restoration grassland. Catena 2020, 190, 104526. [Google Scholar] [CrossRef]
  14. Khaledian, Y.; Brevik, E.C.; Pereira, P.; Cerdà, A.; Fattah, M.A.; Tazikeh, H. Modeling soil cation exchange capacity in multiple countries. Catena 2017, 158, 194–200. [Google Scholar] [CrossRef] [Green Version]
  15. Seybold, C.A.; Grossman, R.B.; Reinsch, T.G. Predicting cation exchange capacity for soil survey using linear models. Soil Sci. Soc. Am. J. 2005, 69, 856–863. [Google Scholar] [CrossRef] [Green Version]
  16. Zolfaghari, A.A.; Taghizadeh-Mehrjardi, R.; Moshki, A.R.; Malone, B.P.; Weldeyohannes, A.O.; Sarmadian, F.; Yazdani, M.R. Using the nonparametric k-nearest neighbor approach for predicting cation exchange capacity. Geoderma 2016, 265, 111–119. [Google Scholar] [CrossRef]
  17. Ghorbani, H.; Kashi, H.; Hafezi Moghadas, N.; Emamgholizadeh, S. Estimation of soil cation exchange capacity using multiple regression, artificial neural networks, and adaptive neuro-fuzzy inference system models in Golestan Province, Iran. Commun. Soil Sci. Plant Anal. 2015, 46, 763–780. [Google Scholar] [CrossRef]
  18. Hunan Department of Agriculture. Hunan Soil; China Agriculture Press: Beijing, China, 1989. (In Chinese) [Google Scholar]
  19. Ouyang, N.; Zhang, Y.; Sheng, H.; Zhou, Q.; Huang, Y.; Yu, Z. Clay mineral composition of upland soils and its implication for pedogenesis and soil taxonomy in subtropical China. Sci. Rep. 2021, 11, 9707. [Google Scholar] [CrossRef]
  20. Qi, C.J.; Peng, D.C.; Tang, D.P. Hunan Vegetation; Hunan Science and Technology Press: Changsha, China, 1990. (In Chinese) [Google Scholar]
  21. Jahn, R.; Blume, H.P.; Asio, V.B.; Spaargaren, O.; Schad, P. Guidelines for Soil Description, 4th ed.; Food and Agriculture Organization of the United Nations: Rome, Italy, 2006; ISBN 978-92-5-105521-2. [Google Scholar]
  22. Schoeneberger, P.J.; Wysocki, D.A.; Benham, E.C.; Broderson, W.D. Field Book for Describing and Sampling Soils, Version 3.0; Natural Resources Conservation Service, USDA, National Soil Survey Center: Lincoln, NE, USA, 2012. [Google Scholar]
  23. CRGCST (Cooperative Research Group on Chinese Soil Taxonomy). Chinese Soil Taxonomy; Science Press: Beijing, China, 2001. [Google Scholar]
  24. United States Department of Agriculture-Natural Resources Conservation Service. Soil Survey Staff. Keys to Soil Taxonomy, 12th ed.; United States Department of Agriculture-Natural Resources Conservation Service: Washington, DC, USA, 2014. [Google Scholar]
  25. IUSS Working Group WRB. International soil classification system for naming soils and creating legends for soil maps. In World Reference Base for Soil Resources, 4th ed.; International Union of Soil Sciences (IUSS): Vienna, Austria, 2022. [Google Scholar]
  26. Brady, N.C.; Weil, R. The Nature and Properties of Soils, 15th ed.; Pearson Education: London, UK, 2017. [Google Scholar]
  27. Zhang, G.L.; Gong, Z.T. Soil Survey Laboratory Methods; Science Press: Beijing, China, 2012. (In Chinese) [Google Scholar]
  28. Gee, G.W.; Bauder, J.W. Particle-size analysis. In Methods of Soil Analysis, 2nd ed.; Klute, A., Ed.; Agronomy Monograph 9, ASA and SSSA; Madison Book Company: Seattle, WI, USA, 1986. [Google Scholar]
  29. Bockheim, J.G. Lithic Humicryods and Haplocryods: Disjunct alpine–subalpine soils of the Northern Hemisphere. Geoderma 2010, 159, 379–389. [Google Scholar] [CrossRef]
  30. Özler, H.M. Carbonate weathering and connate seawater influencing karst groundwaters in the Gevas–Gurpinar–Güzelsu basins, Turkey. Environ. Earth Sci. 2010, 61, 323–340. [Google Scholar] [CrossRef]
  31. Kurdi, M.; Hezarkhani, A.; Eslamkish, T. Assessment of chemical properties and hydro-geochemical coefficients at the Qareh Sou Basin, Golestan Province, Iran. Environ. Earth Sci. 2014, 72, 3243–3249. [Google Scholar] [CrossRef]
  32. Silva, M.B.; dos Anjos, L.H.C.; Pereira, M.G.; Schiavo, J.A.; Cooper, M.; de Souza Cavassani, R. Soils in the karst landscape of Bodoquena plateau in cerrado region of Brazil. Catena 2017, 154, 107–117. [Google Scholar] [CrossRef]
  33. Funakawa, S.; Watanabe, T.; Kosaki, T. Regional trends in the chemical and mineralogical properties of upland soils in humid Asia: With special reference to the WRB classification scheme. Soil Sci. Plant Nutr. 2008, 54, 751–760. [Google Scholar] [CrossRef] [Green Version]
  34. Nie, X.; Guo, W.; Huang, B.; Zhuo, M.; Li, D.; Li, Z.; Yuan, Z. Effects of soil properties, topography and landform on the understory biomass of a pine forest in a subtropical hilly region. Catena 2019, 176, 104–111. [Google Scholar] [CrossRef]
  35. Tessens, E.; Shamshuddin, J. Characteristics related to charges in oxisols of peninsular Malaysia. Pedologie 1982, 32, 85–105. [Google Scholar]
  36. Ma, C.; Eggleton, R.A. Cation exchange capacity of kaolinite. Clay Miner. 1999, 47, 174–180. [Google Scholar] [CrossRef]
  37. Khawmee, K.; Suddhiprakarn, A.; Kheoruenromne, I.; Singh, B. Surface charge properties of kaolinite from Thai soils. Geoderma 2013, 192, 120–131. [Google Scholar] [CrossRef]
  38. Ivanić, M.; Vdović, N.; Barreto, S.D.; Bermanec, V.; Sondi, I. Mineralogy, surface properties and electrokinetic behaviour of kaolin clays from the naturally occurring pegmatite deposits. Geol. Croat. 2015, 68, 139–145. [Google Scholar] [CrossRef] [Green Version]
  39. Vourlitis, G.L.; de Almeida Lobo, F.; Lawrence, S.; Codolo de Lucena, I.; Pinto, O.B.; Dalmagro, H.J.; Carmen, E.; Rodriguez, O.; de Souza Nogueira, J. Variations in stand structure and diversity along a soil fertility gradient in a Brazilian savanna (cerrado) in southern Mato Grosso. Soil Sci. Soc. Am. J. 2013, 77, 1370–1379. [Google Scholar] [CrossRef] [Green Version]
  40. Sherman, L.A.; Brye, K.R. Soil Chemical Property Changes in Response to Long-Term Pineapple Cultivation in Costa Rica. Agrosyst. Geosci. Environ. 2019, 2, 1–9. [Google Scholar] [CrossRef] [Green Version]
  41. Zhang, Y.; Duan, B.; Xian, J.; Korpelainen, H.; Li, C. Links between plant diversity, carbon stocks and environmental factors along a successional gradient in a subalpine coniferous forest in Southwest China. For. Ecol. Manag. 2011, 262, 361–369. [Google Scholar] [CrossRef]
  42. Oorts, K.; Vanlauwe, B.; Cofie, O.O.; Sanginga, N.; Merckx, R. Charge characteristics of soil organic matter fractions in a Ferric Lixisol under some multipurpose trees. Agrofor. Syst. 2000, 48, 169–188. [Google Scholar] [CrossRef]
  43. Bai, Y.C.; Chang, Y.Y.; Hussain, M.; Lu, B.; Zhang, J.P.; Song, X.B.; Lei, X.S.; Pei, D. Soil chemical and microbiological properties are changed by long-term chemical fertilizers that limit ecosystem functioning. Microorganisms 2020, 8, 694. [Google Scholar] [CrossRef]
  44. Osher, L.J.; Buol, S.W. Relationship of soil properties to parent material and landscape position in eastern Madre de Dios, Peru. Geoderma 1998, 83, 143–166. [Google Scholar] [CrossRef]
  45. Sparling, G.P.; Ross, D.J.; Trustrum, N.A.; Arnold, G.; West, A.W.; Speir, T.W.; Schipper, L.A. Recovery of topsoil characteristics after landslip erosion in dry hill country of New Zealand, and a test of the space-for-time hypothesis. Soil Biol. Biochem. 2003, 35, 1575–1586. [Google Scholar] [CrossRef]
  46. Wilcke, W.; Valladarez, H.; Stoyan, R.; Yasin, S.; Valarezo, C.; Zech, W. Soil properties on a chronosequence of landslides in montane rain forest, Ecuador. Catena 2003, 53, 79–95. [Google Scholar] [CrossRef]
  47. Nie, X.; Li, Z.; He, J.; Huang, J.; Zhang, Y.; Huang, B.; Ma, W.; Lu, Y.; Zeng, G. Enrichment of organic carbon in sediment under field simulated rainfall experiments. Environ. Earth Sci. 2015, 74, 5417–5425. [Google Scholar] [CrossRef]
  48. Lesoli, M.S.; Dube, S.; Fatunbi, A.O.; Moyo, B. Physicochemical characteristics of communal rangeland soils along two defined toposequences in the Eastern Cape, South Africa. Afr. J. Range. For. Sci. 2010, 27, 89–94. [Google Scholar] [CrossRef]
  49. Khormali, F.; Ajami, M. Pedogenetic investigation of soil degradation on a deforested loess hillslope of Golestan Province, Northern Iran. Geoderma 2011, 167, 274–283. [Google Scholar] [CrossRef]
  50. Schawe, M.; Glatzel, S.; Gerold, G. Soil development along an altitudinal transect in a Bolivian tropical montane rainforest: Podzolization vs. hydromorphy. Catena 2007, 69, 83–90. [Google Scholar] [CrossRef]
  51. Mareschal, L.; Nzila, J.D.D.; Turpault, M.P.; Thongo M’Bou, A.; Mazoumbou, J.C.; Bouillet, J.P.; Ranger, J.; Laclau, J.P. Mineralogical and physico-chemical properties of ferralic arenosols derived from unconsolidated Plio-Pleistocenic deposits in the coastal plains of Congo. Geoderma 2011, 162, 159–170. [Google Scholar] [CrossRef]
  52. Pincus, L.N.; Ryan, P.C.; Huertas, F.J.; Alvarado, G.E. The influence of soil age and regional climate on clay mineralogy and cation exchange capacity of moist tropical soils: A case study from Late Quaternary chronosequences in Costa Rica. Geoderma 2017, 308, 130–148. [Google Scholar] [CrossRef]
  53. DeNovio, N.M.; Saiers, J.E.; Ryan, J.N. Colloid movement in unsaturated porous media: Recent Advances and Future Directions. Vadose Zone J. 2004, 3, 338–351. [Google Scholar] [CrossRef]
  54. Ranville, J.F.; Chittleborough, D.J.; Beckett, R. Particle-size and element distributions of soil colloids. Soil Sci. Soc. Am. J. 2005, 69, 1173–1184. [Google Scholar] [CrossRef]
  55. Keren, R.; Sparks, D.L. The role of edge surfaces in flocculation of 2:1 clay minerals. Soil Sci. Soc. Am. J. 1995, 59, 430–435. [Google Scholar] [CrossRef] [Green Version]
  56. Lavkulich, L.M.; Arocena, J.M. Luvisolic soils of Canada: Genesis, distribution, and classification. Can. J. Soil. Sci. 2011, 91, 781–806. [Google Scholar] [CrossRef]
  57. Gong, Z.T.; Zhang, G.L.; Chen, Z.C. Pedogenesis and Soil Taxonomy; Science Press: Beijing, China, 2007. (In Chinese) [Google Scholar]
  58. Shainberg, I.; Kemper, W.D. Hydration status of adsorbed cations. Soil Sci. Soc. Am. J. 1966, 30, 707–713. [Google Scholar] [CrossRef]
  59. Petersen, L.W.; Moldrup, P.; Jacobsen, O.H.; Rolston, D.E. Relations between specific surface area and soil physical and chemical properties. Soil Sci. 1996, 161, 9–21. [Google Scholar] [CrossRef]
  60. Paluszek, J. Estimation of cation exchange capacity and cation saturation of Luvisols developed from loess. J. Entomol. 2014, 19, 1085–1098. [Google Scholar] [CrossRef]
  61. Uehara, G.; Gillman, G.P. The Mineralogy, Chemistry and Physics of Tropical Soils with Variable Charge Clays; Westview Press: Boulder, CO, USA, 1981. [Google Scholar]
  62. Ulusoy, Y.; Tekin, Y.; Tümsavas, Z.; Mouazen, A.M. Prediction of soil cation exchange capacity using visible and near infrared spectroscopy. Biosyst. Eng. 2016, 152, 79–93. [Google Scholar] [CrossRef]
  63. Khaledian, Y.; Kiani, F.; Ebrahimi, S.; Brevik, E.C.; Aitkenhead-Peterson, J. Assessment and monitoring of soil degradation during land use change using multivariate analysis. Land Degrad. Dev. 2017, 28, 128–141. [Google Scholar] [CrossRef]
  64. Shabani, A.; Norouzi, M. Predicting cation exchange capacity by artificial neural network and multiple linear regression using terrain and soil characteristics. Indian J. Sci. Technol. 2015, 8, 1–10. [Google Scholar] [CrossRef]
Figure 1. Cation exchange capacity (CEC, inserted figure (A,B)), effective cation exchangeable capacity (ECEC, inserted figure (C,D)), exchangeable acidity (inserted figure (E,F)) and sum of base cations (inserted figure (G,H)) in the soil profiles in relation to vegetation type and hillslope position. Different letters mean statistical difference between respective horizons s in compared vegetation types or hillslope positions (not between horizons s in the soil profile). The box plot edges represent the 25th and 75th percentiles; whiskers represent the range of data values; Center line represents the median value; The symbol (□) represents the mean value; The symbol (◆) represents an outlier value. Homogeneous groups were calculated using the Duncan post-hoc test.
Agronomy 13 00741 g001
Figure 2. Cation exchange capacity (CEC, inserted figure (A)), effective cation exchangeable capacity (ECEC, inserted figure (B)), sum of base cations (inserted figure (C)) and exchangeable acidity (inserted figure (D)) in different diagnostic horizons. Explanation of symbols in Figure 1.
Agronomy 13 00741 g002
Figure 3. Dynamic changes of exchangeable cations (Ca2+ex, Mg2+ex, K+ex, Na+ex, H+ex, Al3+ex), cation exchangebale capacity (CEC), and base saturation (BS) in different soil orders, in reference to the 4 phases of soil development. (primeval: Primosols/Entisols/Leptosols; slight: Cambosols/Inceptisols/Cambisols; intermediate: Argosols/Alfisols/Luvisols or Umbrisols; strong: Ferrosols/Ultisols/Plinthosols or Acrisols).
Agronomy 13 00741 g003
Figure 4. Relationships of CEC with SOC (A) and Clay (B) in different soil horizons.
Agronomy 13 00741 g004
Figure 5. Conceptual model of cation exchange reactions during upland soil development in Hunan Province. (Ca2+ex, Mg2+ex, K+ex, Na+ex, H+ex, Al3+ex: exchangeable Ca2+, Mg2+, K+, Na+, H+, Al3+, respectively; h: illuvial organic matter accumulation; t: illuvial accumulation of silicate clay; w: weak color or structure within B; s: illuvial accumulation of ferric oxide; CST: Chinese Soil Taxonomy; ST: Soil Taxonomy; WRB: World Reference Base for Soil Resources).
Agronomy 13 00741 g005
Table 1. Physicochemical properties of upland soils derived from different parent materials in Hunan Province, China.
Parent Rock/MaterialBulk Density
g cm−3
Particle Size Distribution (mm) g kg−1Soil Organic C
g kg−1
pHTotal Potassium
g kg−1
Sand
2.00–0.05
Silt
0.05–0.002
Clay
<0.002
H2OH2O
Granite (n = 42)1.4 ± 0.2 ab445 ± 126 a260 ± 60 d295 ± 113 c6.9 ± 6.7 ab4.8 ± 0.4 b3.8 ± 0.1 b28 ± 7 a
Quaternary red clay (n = 45)1.4 ± 0.2 a239 ± 134 c318 ± 103 c443 ± 68 b5.7 ± 5.3 b4.8 ± 0.3 b3.8 ± 0.1 b15 ± 4 c
Slate (n = 34)1.3 ± 0.2 ab241 ± 172 c432 ± 139 a327 ± 114 c9.8 ± 8.7 a4.8 ± 0.5 b3.7 ± 0.2 b19 ± 5 b
Limestone (n = 43)1.3 ± 0.2 ab110 ± 90 d324 ± 101 c566 ± 145 a7.7 ± 5.1 ab5.8 ± 0.6 a4.8 ± 1.1 a16 ± 6 c
Sandstone (n = 39)1.3 ± 0.2 b297 ± 88 b371 ± 75 b332 ± 60 c9.2 ± 8.3 a4.8 ± 0.5 b3.8 ± 0.2 b16 ± 6 c
Mean ± standard deviation. Means followed by different letters indicate the data were statistically different at p < 0.05 among different parent materials.
Table 2. Cation exchangeable properties of upland soil upland soils derived from different parent materials in Hunan Province, China †.
Soil HorizonsParent Rock/MaterialExchangeable Base (cmol kg−1)Exchangeable Acidity (cmol kg−1)CECECECBSξAlsat
Ca2+exMg2+exK+exNa+exSumH+exAl3+exSumcmol kg−1%
Surface horizonsGranite0.7 ± 0.7 b£0.27 ± 0.16 b0.35 ± 0.18 a0.24 ± 0.22 a1.6 ± 0.8 b0.38 ± 0.2 a4.5 ± 2.5 a5.0 ± 2.5 a14 ± 3 a6.6 ± 2.2 a12 ± 8 b66 ± 22 a
Quaternary red clay1.4 ± 1.4 b0.47 ± 0.36 b0.26 ± 0.14 ab0.22 ± 0.26 a2.3 ± 1.8 b0.29 ± 0.15 a6.1 ± 1.3 a6.4 ± 1.3 a15 ± 2 a8.7 ± 1.3 a15 ± 12 b72 ± 17 a
Slate1.4 ± 1.1 b0.37 ± 0.32 b0.22 ± 0.1 b0.10 ± 0.09 ab2.1 ± 1.4 b0.36 ± 0.13 a4.8 ± 2.4 a5.2 ± 2.4 a17 ± 5 a7.3 ± 1.7 a13 ± 8 b64 ± 24 a
Limestone5.3 ± 3.2 a0.79 ± 0.32 a0.21 ± 0.08 b0.04 ± 0.04 b6.3 ± 3.4 a0.11 ± 0.16 b1.5 ± 2.6 b1.7 ± 2.7 b16 ± 3 a8.0 ± 2.6 a40 ± 22 a18 ± 29 b
Sandstone1.1 ± 0.9 b0.42 ± 0.36 b0.23 ± 0.08 ab0.10 ± 0.09 ab1.9 ± 1.3 b0.32 ± 0.19 a5.5 ± 2.9 a5.8 ± 3.0 a16 ± 3 a7.7 ± 2.3 a12 ± 9 b67 ± 27 a
Subsurface horizonsGranite0.4 ± 0.4 b0.23 ± 0.16 b0.24 ± 0.14 a0.20 ± 0.14 a1.1 ± 0.6 b0.23 ± 0.1 ab4.5 ± 1.4 a4.7 ± 1.5 a12 ± 2 bc5.8 ± 1.4 c9 ± 6 b76 ± 12 a
Quaternary red clay1.0 ± 0.5 b0.65 ± 0.41 a0.19 ± 0.09 ab0.19 ± 0.13 a2.1 ± 0.9 b0.18 ± 0.07 ab5.6 ± 1.0 a5.8 ± 1.0 a15 ± 2 ab7.8 ± 1.0 ab13 ± 5 b72 ± 11 a
Slate1.2 ± 0.7 b0.39 ± 0.46 ab0.13 ± 0.04 b0.11 ± 0.11 ab1.8 ± 1.1 b0.24 ± 0.11 a4.2 ± 3.3 a4.5 ± 1.3 a13 ± 5 abc6.3 ± 1.5 bc14 ± 8 b68 ± 13 a
Limestone4.5 ± 3.8 a0.64 ± 0.45 a0.13 ± 0.06 b0.05 ± 0.06 b5.3 ± 4.2 a0.13 ± 0.13 b2.6 ± 2.0 b2.7 ± 2.1 b16 ± 4 a8.0 ± 2.8 a31 ± 23 a40 ± 32 b
Sandstone1.1 ± 0.9 b0.42 ± 0.42 ab0.15 ± 0.06 b0.08 ± 0.08 b1.7 ± 1.3 b0.16 ± 0.09 ab4.2 ± 1.7 a4.4 ± 1.7 a11 ± 2 c6.1 ± 1.5 c15 ± 10 b68 ± 28 a
M ± S1.7 ± 2.30.45 ± 0.390.19 ± 0.10.13 ± 0.152.5 ± 2.60.21 ± 0.144.4 ± 2.44.7 ± 2.514 ± 47.1 ± 2.217 ± 1664 ± 27
† Ca2+ex, Mg2+ex, K+ex, Na+ex: exchangeable Ca2+, exchangeable Mg2+, exchangeable K+, exchangeable Na+, respectively; H+ex, Al3+ex: exchangeable H+, exchangeable Al3+, respectively; CEC: cation exchangebale capacity; ECEC: effective cation exchangeable capacity; BS: base saturation; Alsat: aluminum saturation percentage; £ Mean ± standard deviation. Means followed by different letters indicate the data were statistically different at p < 0.05 among different parent materials.
Table 3. Correlation coefficients between the cation exchangeable properties and soil physicochemical properties †.
Ca2+exMg2+exK+exNa+exSBCH+exAl3+exEACECECECBSAlsat
pH (H2O)0.78 **0.64 ** −0.30 **0.79 **−0.46 **−0.70 **−0.71 **0.26 ** 0.76 **−0.80 **
pH (KCl)0.86 **0.52 ** −0.23 **0.84 **−0.44 **−0.67 **−0.64 **0.26 **0.25 **0.79 **−0.74 **
SOC 0.32 ** 0.37 ** 0.39 **0.16 *
Sand−0.27 **−0.24 ** 0.23 **−0.26 **0.16 * −0.54 **−0.29 **−0.15 *0.24 **
Silt 0.16 * −0.14 * 0.14 * −0.20 **
Clay0.22 **0.15 *−0.19 **−0.16 *0.21 ** 0.51 **0.29 **
BD −0.18 **0.18 * −0.15 * −0.32 **
† Ca2+ex, Mg2+ex, K+ex, Na+ex, H+ex, Al3+ex; exchangeable Ca2+, Mg2+, K+, Na+, H+, Al3+, respectively; SBC: sum of base cations; EA: exchangeable acidity CEC: cation exchangeable capacity; ECEC: effective cation exchangeable capacity; BS: base saturation percentage; Alsat: aluminum saturation percentage; SOC: soil organic carbon; BD: soil bulk density; * significant at the 0.05 level; ** significant at the 0.01 level.
Table 4. Performance indices (R2, Adj. R2, and RMSE) and the equations developed by the models tested †.
nR2Adj. R2RMSENRMSEFormula/Eigenvalues
MSR model
All horizons2030.490.482.800.22CEC = 3.961 − 0.004 × sand + 0.219 × SOC + 0.013 × clay + 1.165 × pH (H2O) − 0.055 × Fed
Surface horizon680.680.662.110.16CEC = 12.848 − 0.009 × sand + 0.279 × SOC + 1.055 × pH (KCl) − 3.361 × BD
Subsurface horizon1350.460.442.950.25CEC = 1.445 + 0.019 × clay − 0.087 × Fed + 1.32 × pH (H2O)
RF model
All horizons2030.730.472.050.16SOC, Clay
Surface horizon680.920.861.190.07pH(H2O), SOC, Clay
Subsurface horizon1350.600.584.690.31SOC, Clay
† R2: coefficient of determination; Adj. R2: adjacent coefficient of determination; RMSE: root mean square error; NRMSE: normalized root mean square error.
Disclaimer/Publisher’s Note: The statements, opinions and data contained in all publications are solely those of the individual author(s) and contributor(s) and not of MDPI and/or the editor(s). MDPI and/or the editor(s) disclaim responsibility for any injury to people or property resulting from any ideas, methods, instructions or products referred to in the content.

