
Leaf Nitrogen and Phosphorus Stoichiometry and Its Response to Geographical and Climatic Factors in a Tropical Region: Evidence from Hainan Island
Abstract
:1. Introduction
2. Materials and Methods
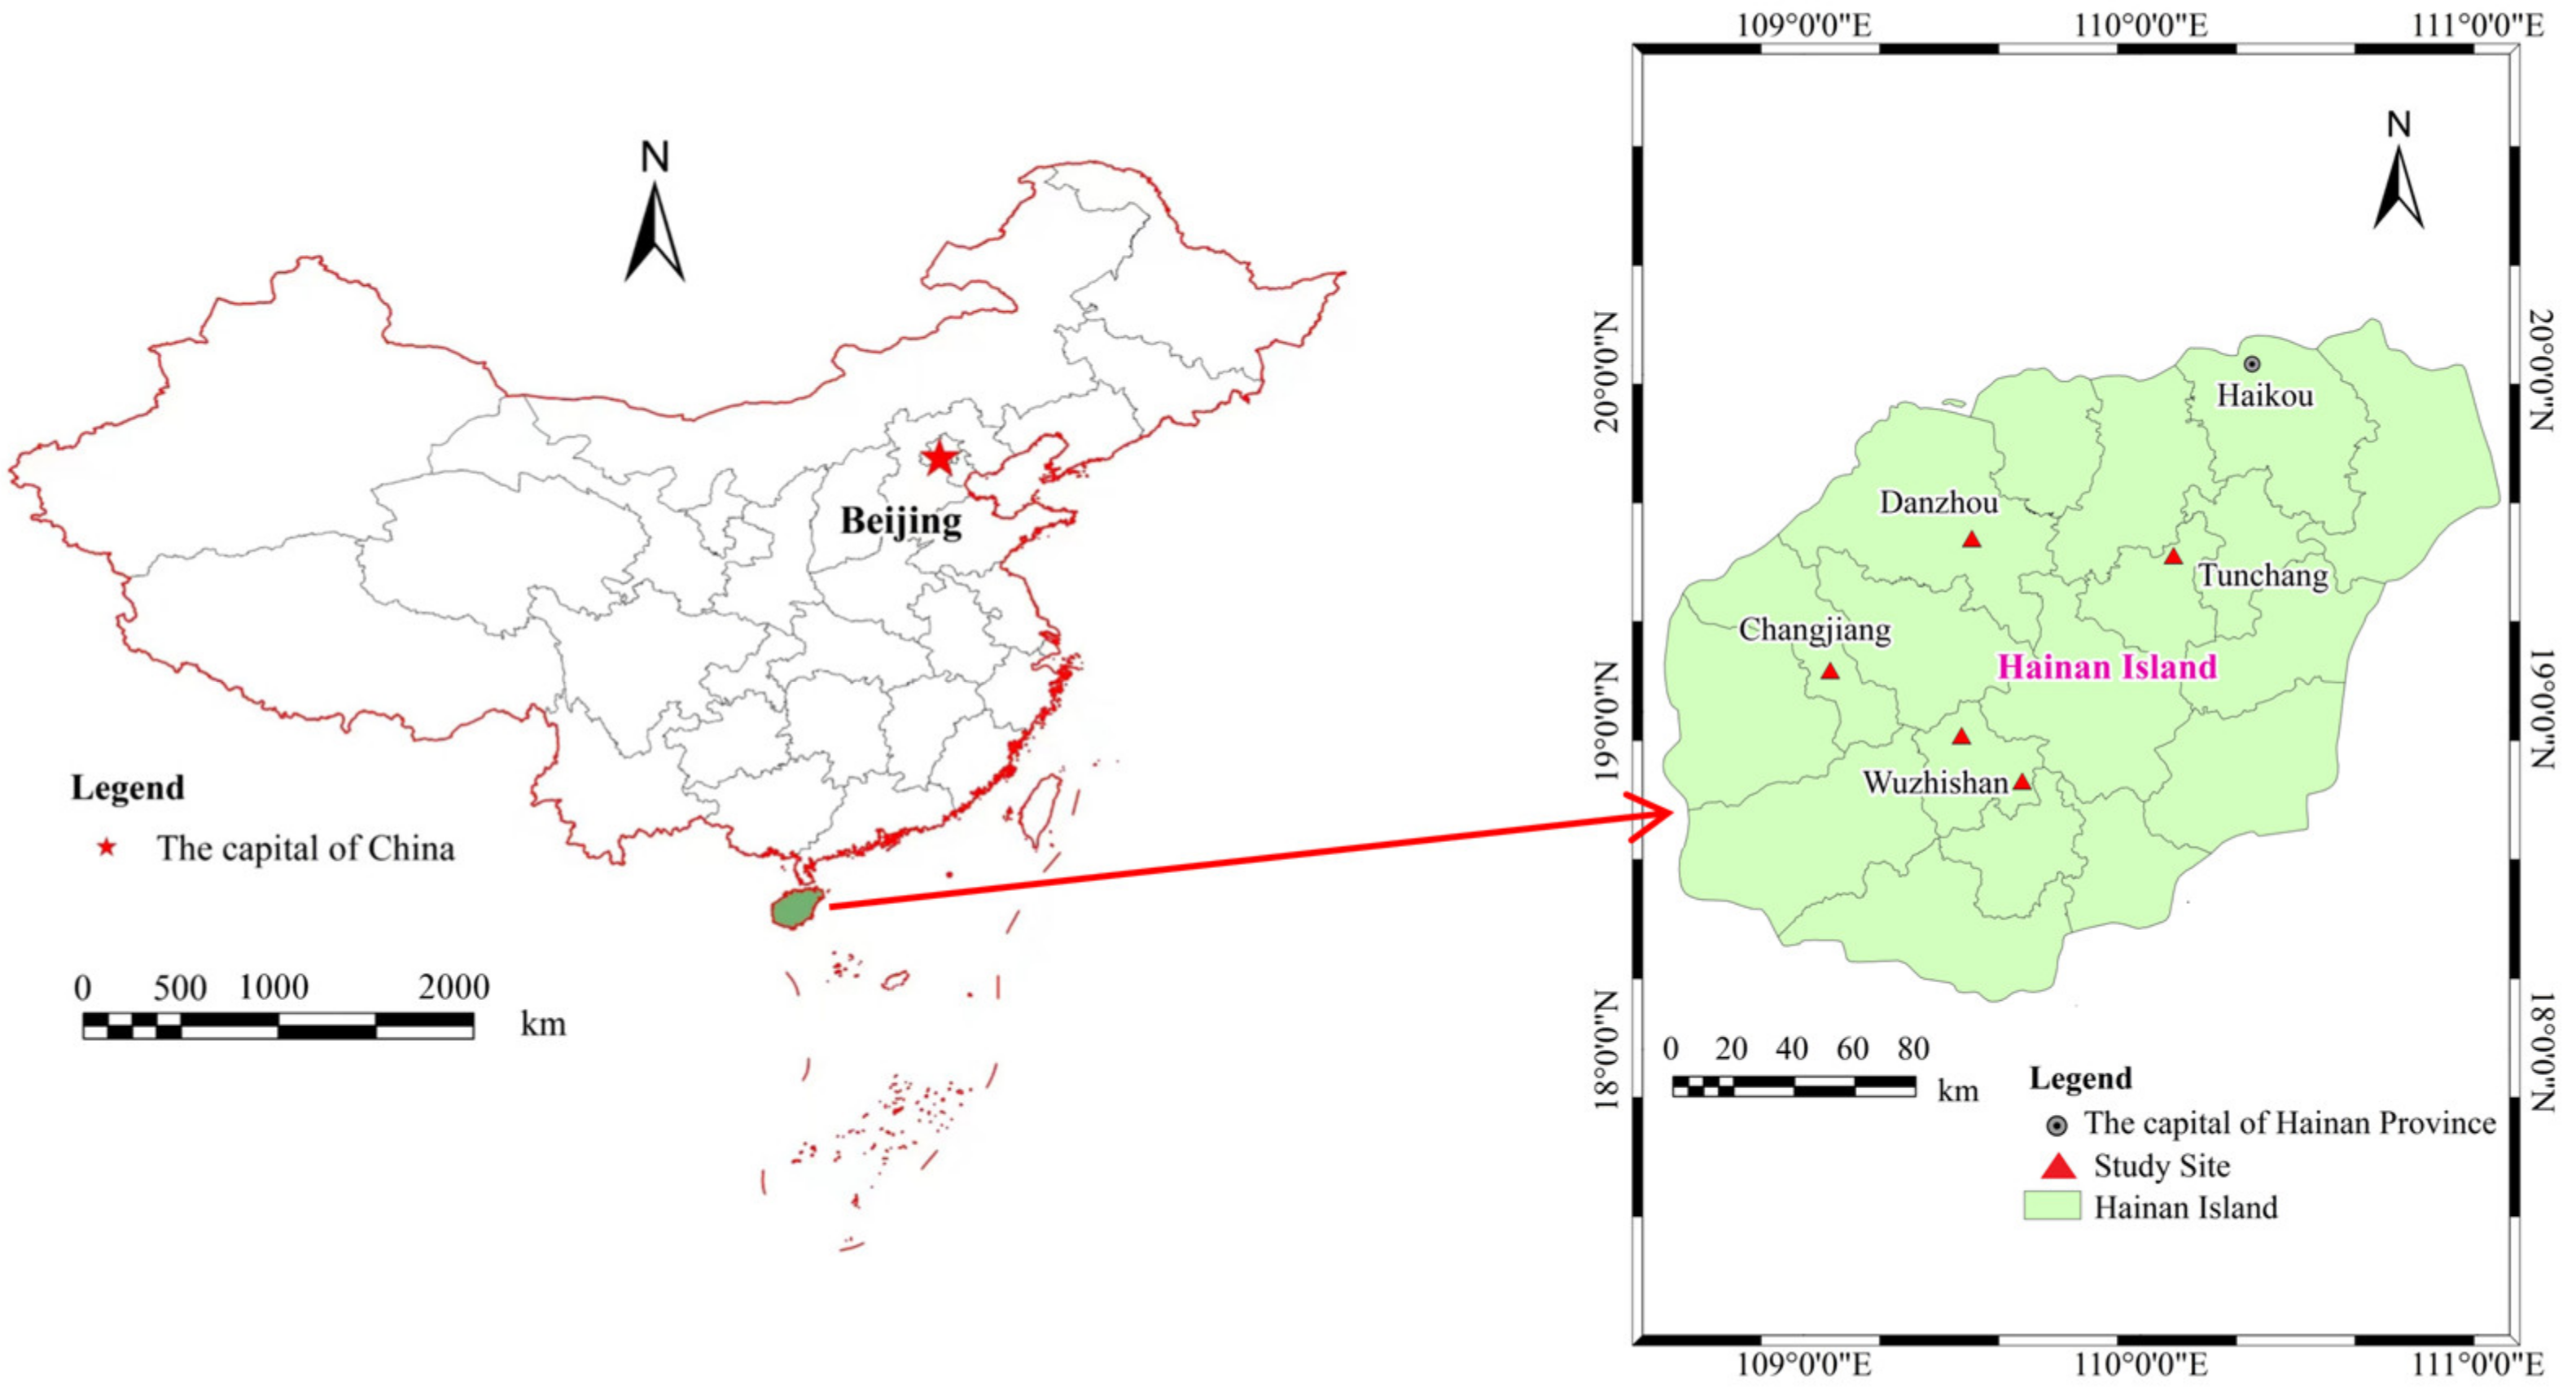
2.1. Site Description
2.2. Plant Sampling and Chemical Analysis
2.3. Accessing Data
2.4. Statistical Analysis
3. Results
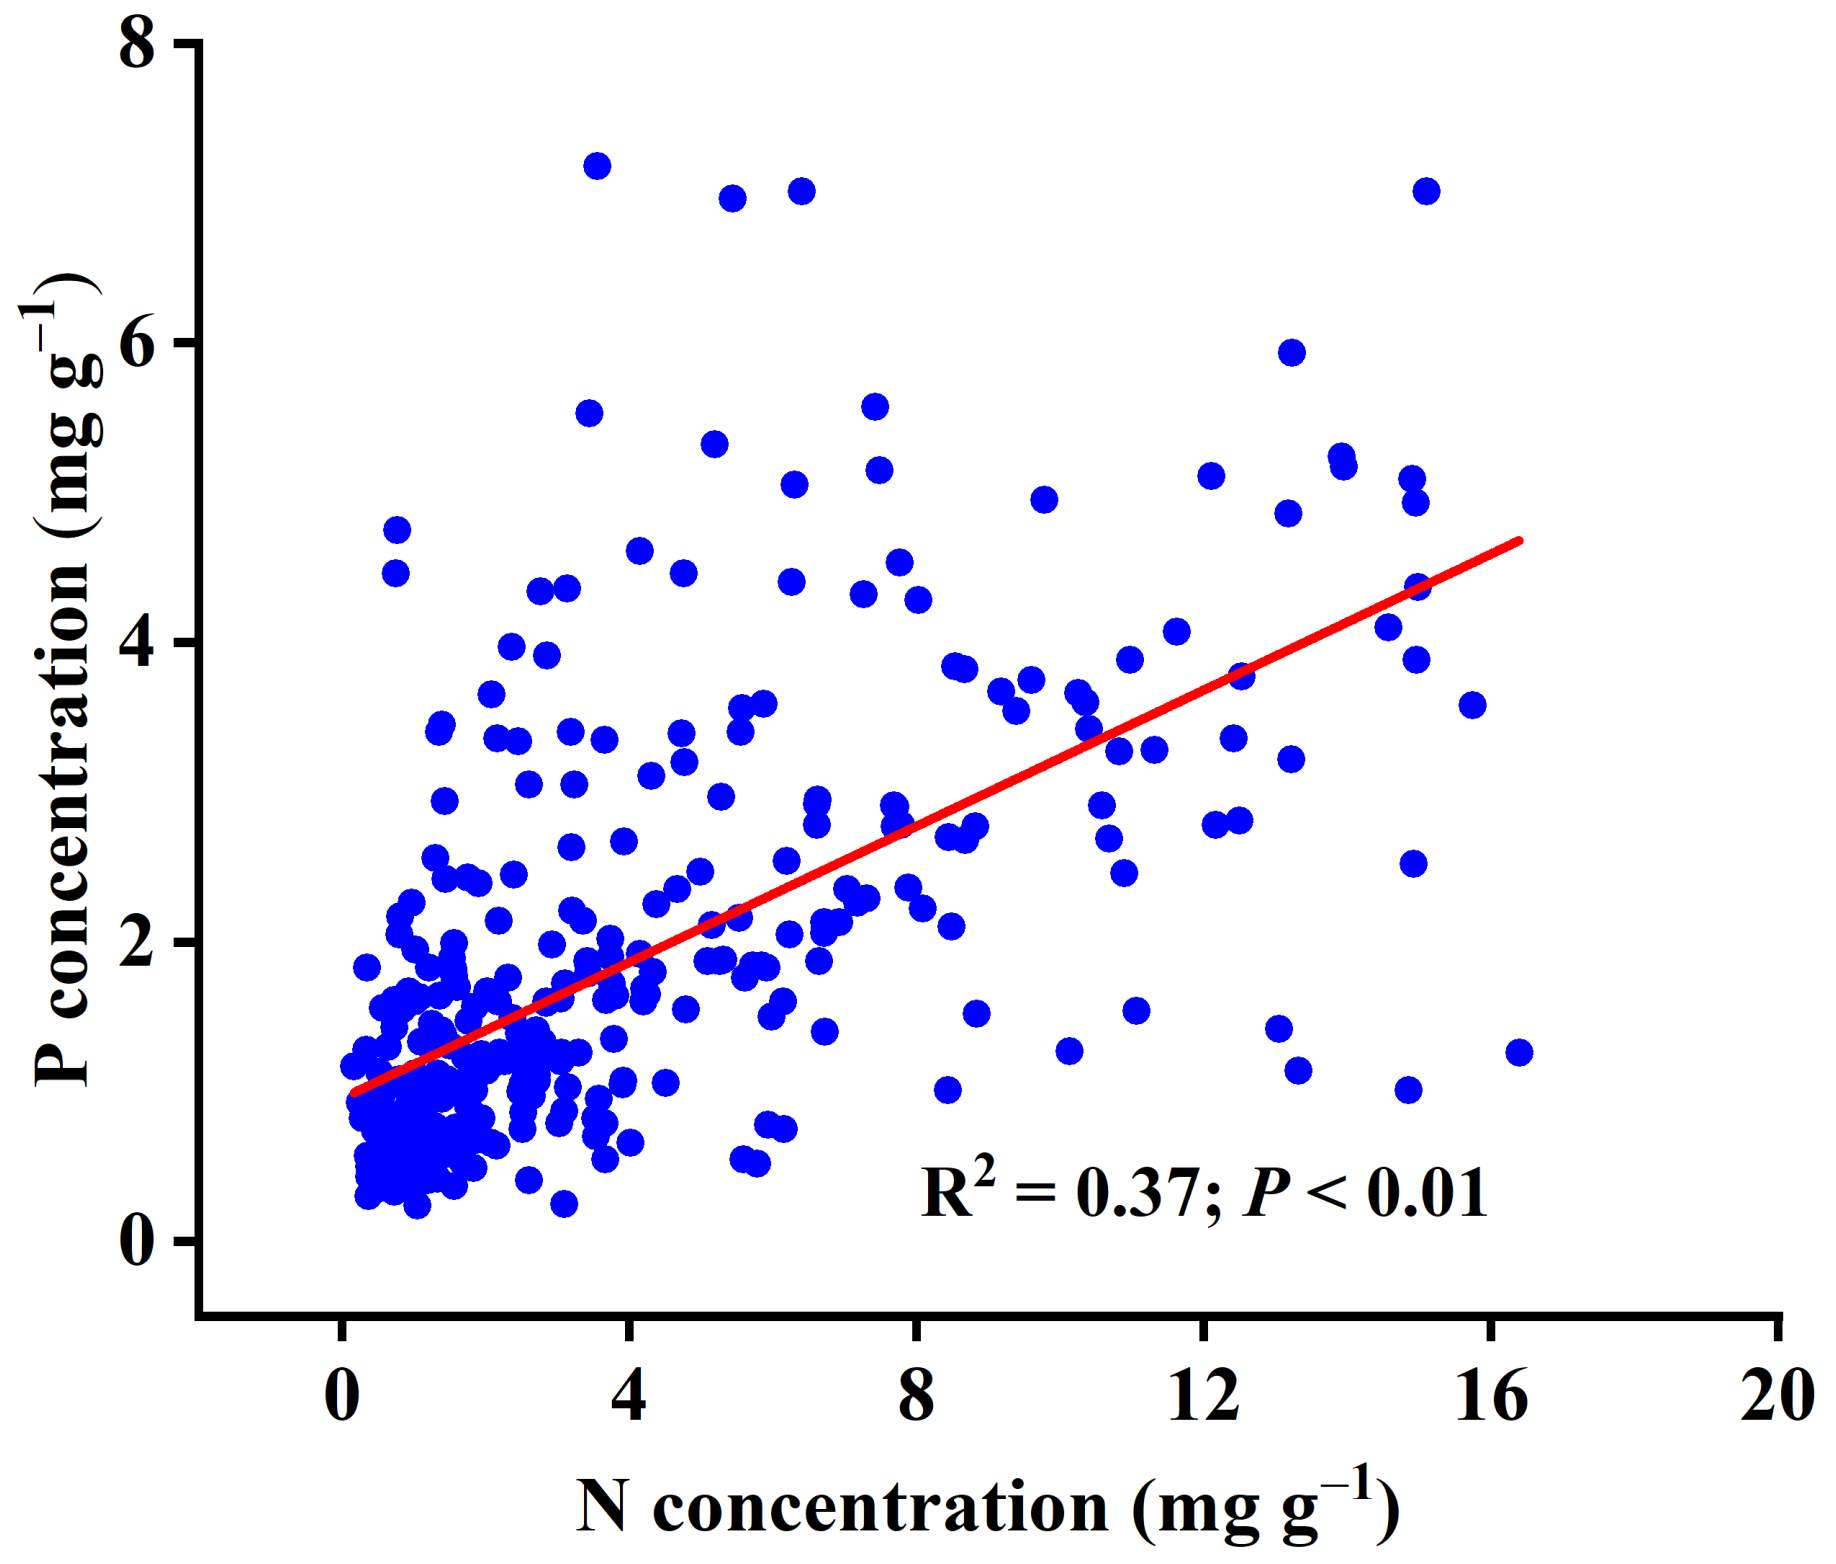
3.1. Leaf Stoichiometry Characteristics in Hainan Island
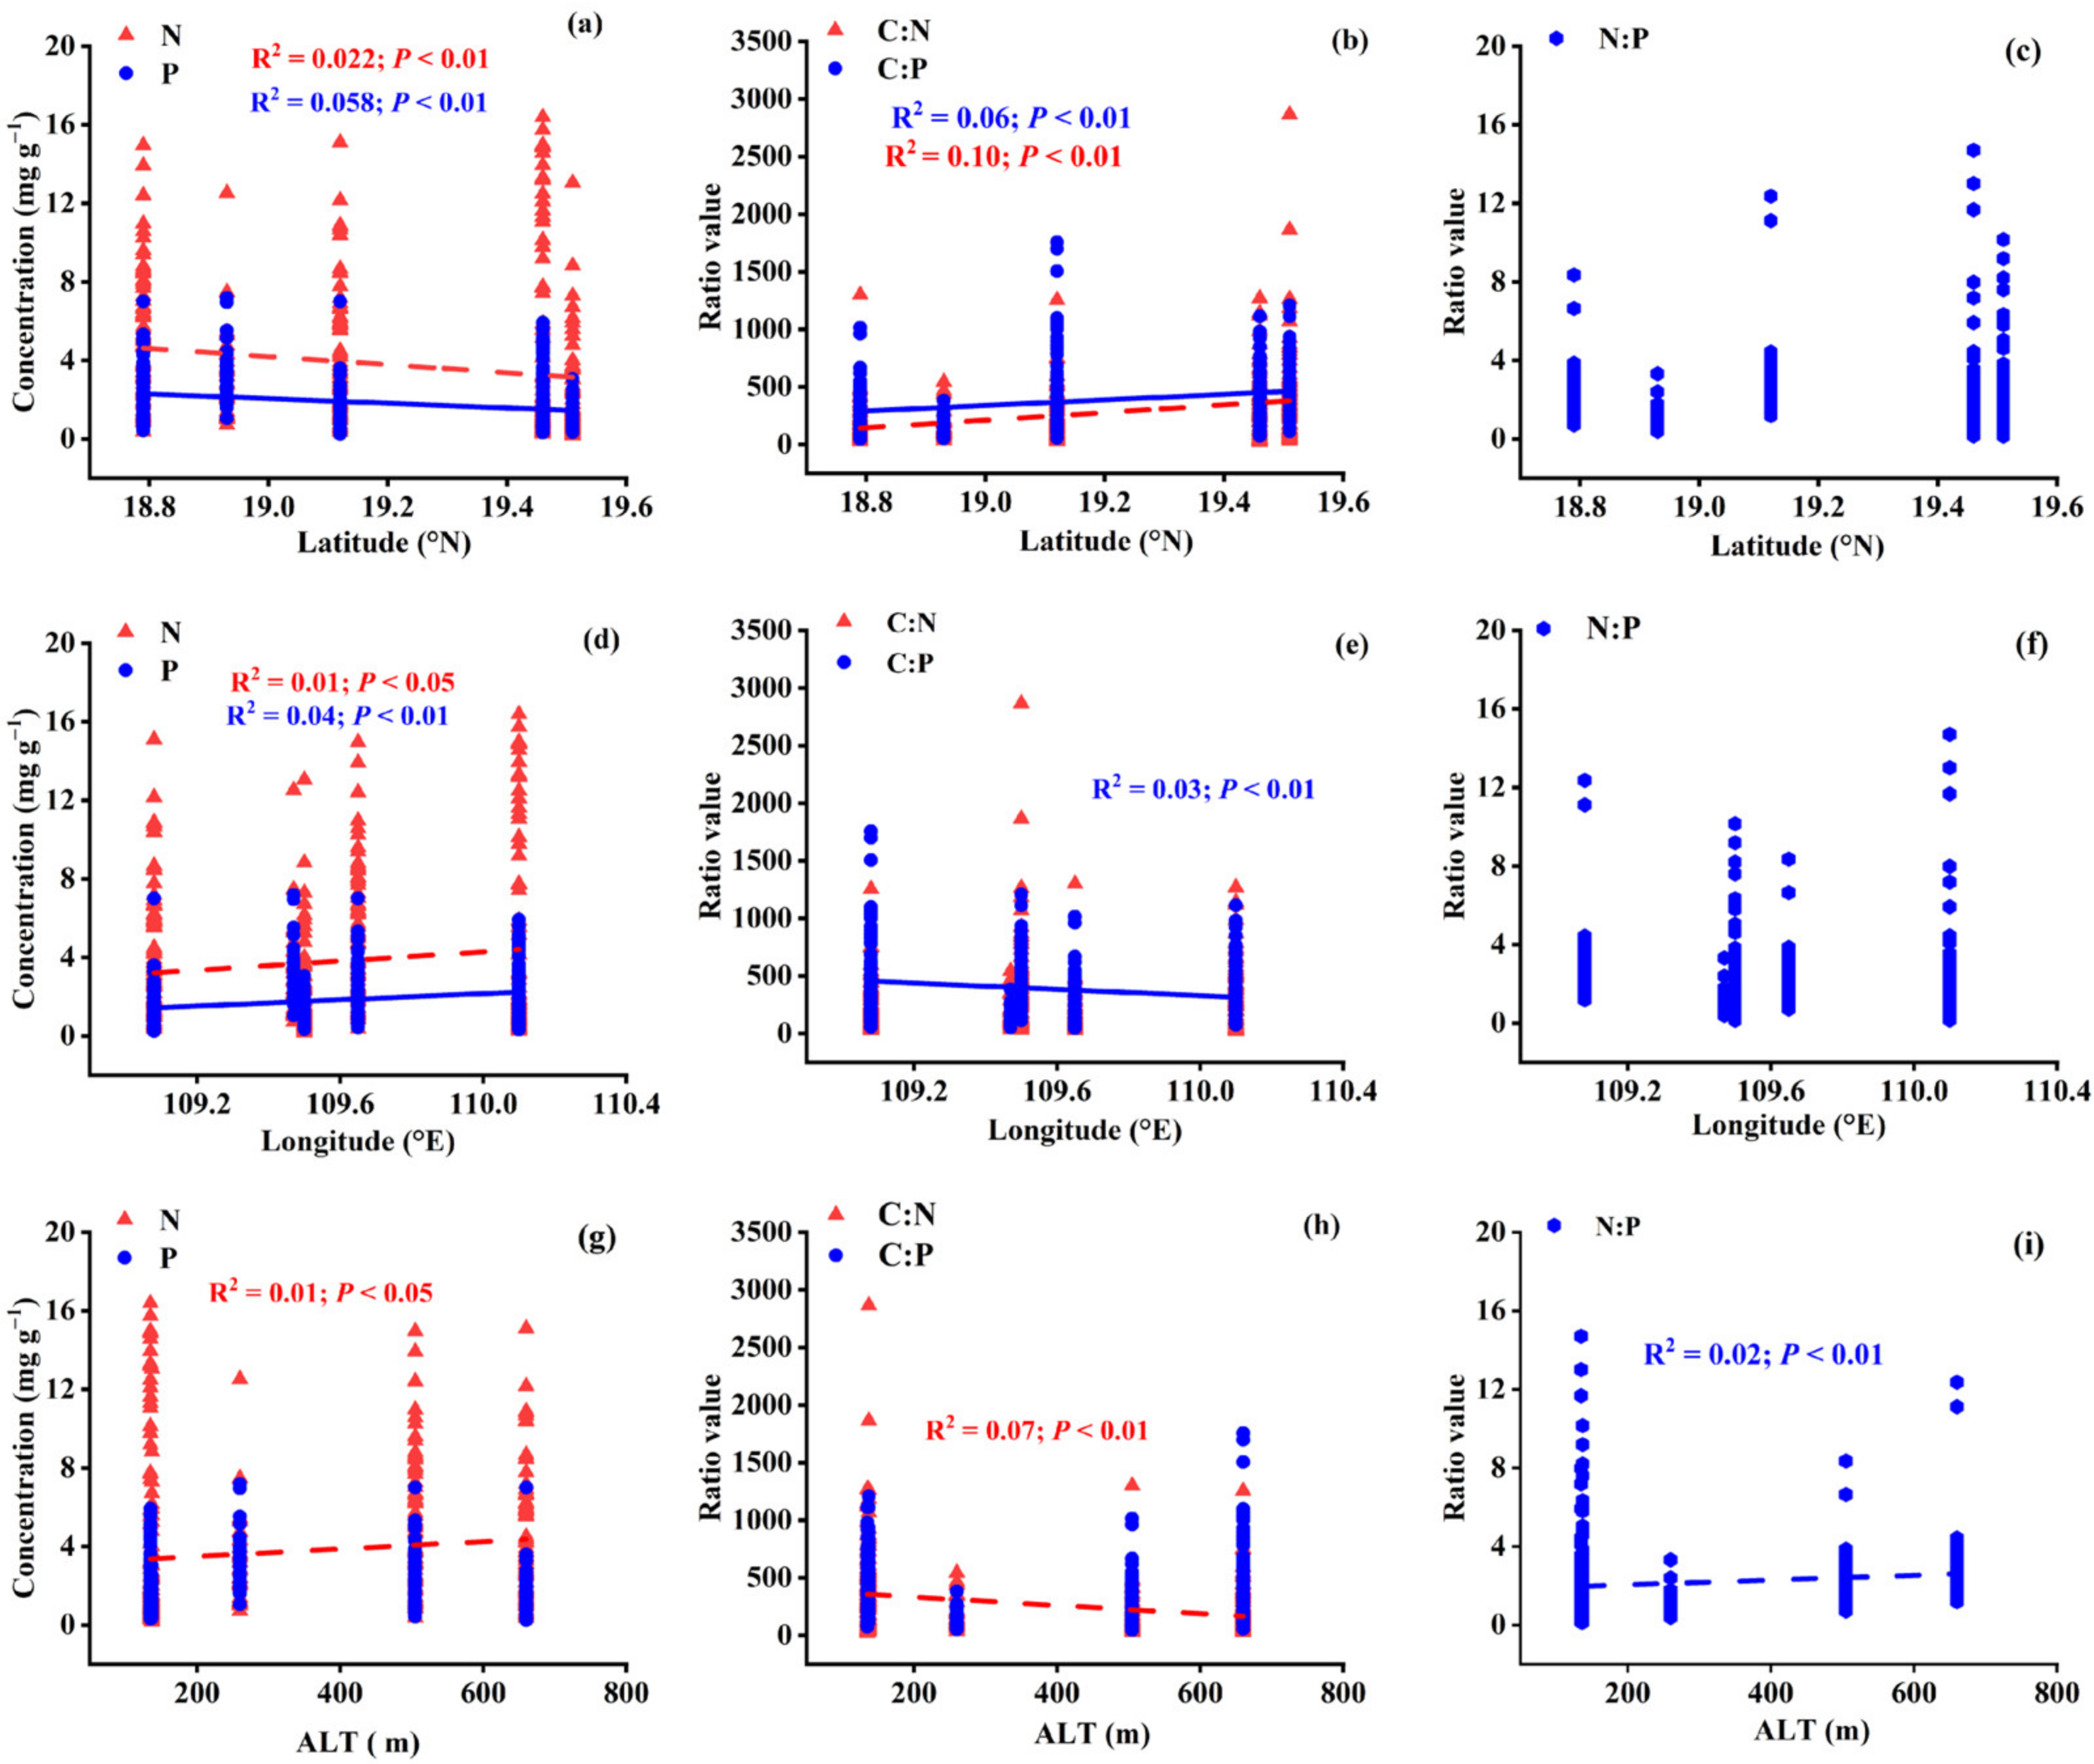
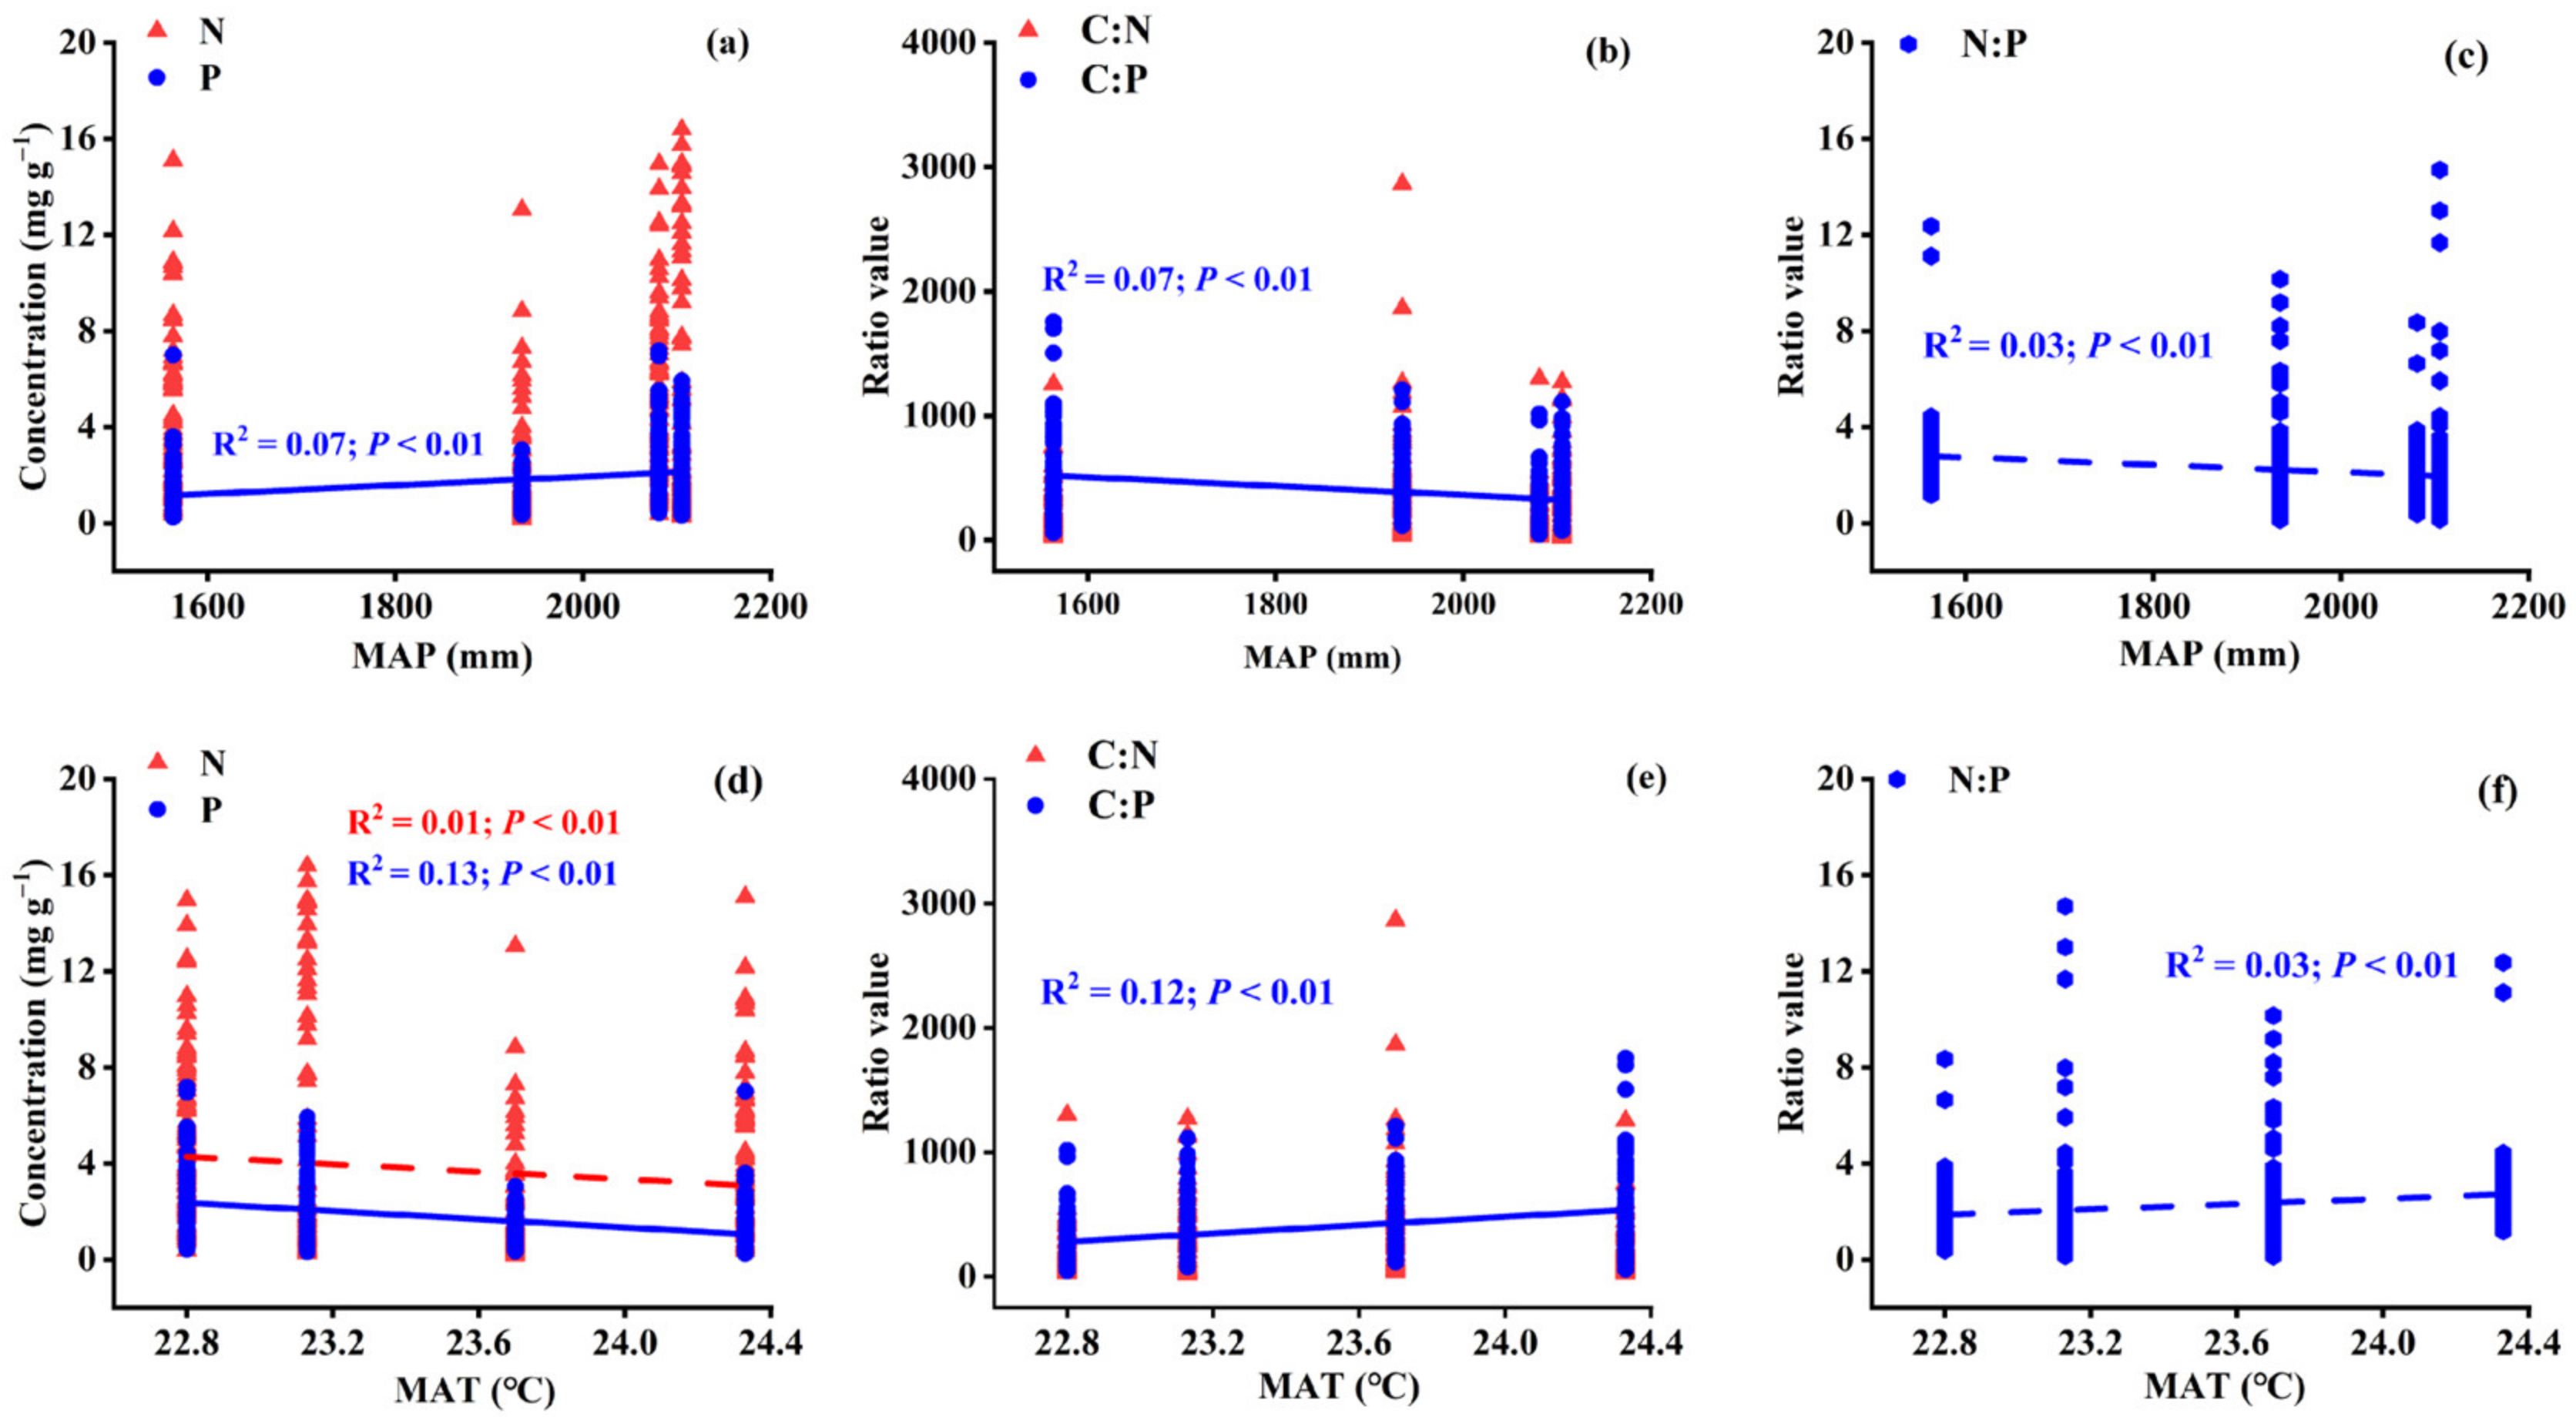
3.2. Variations in Leaf Stoichiometry alongside Geographical and Climatic Variables
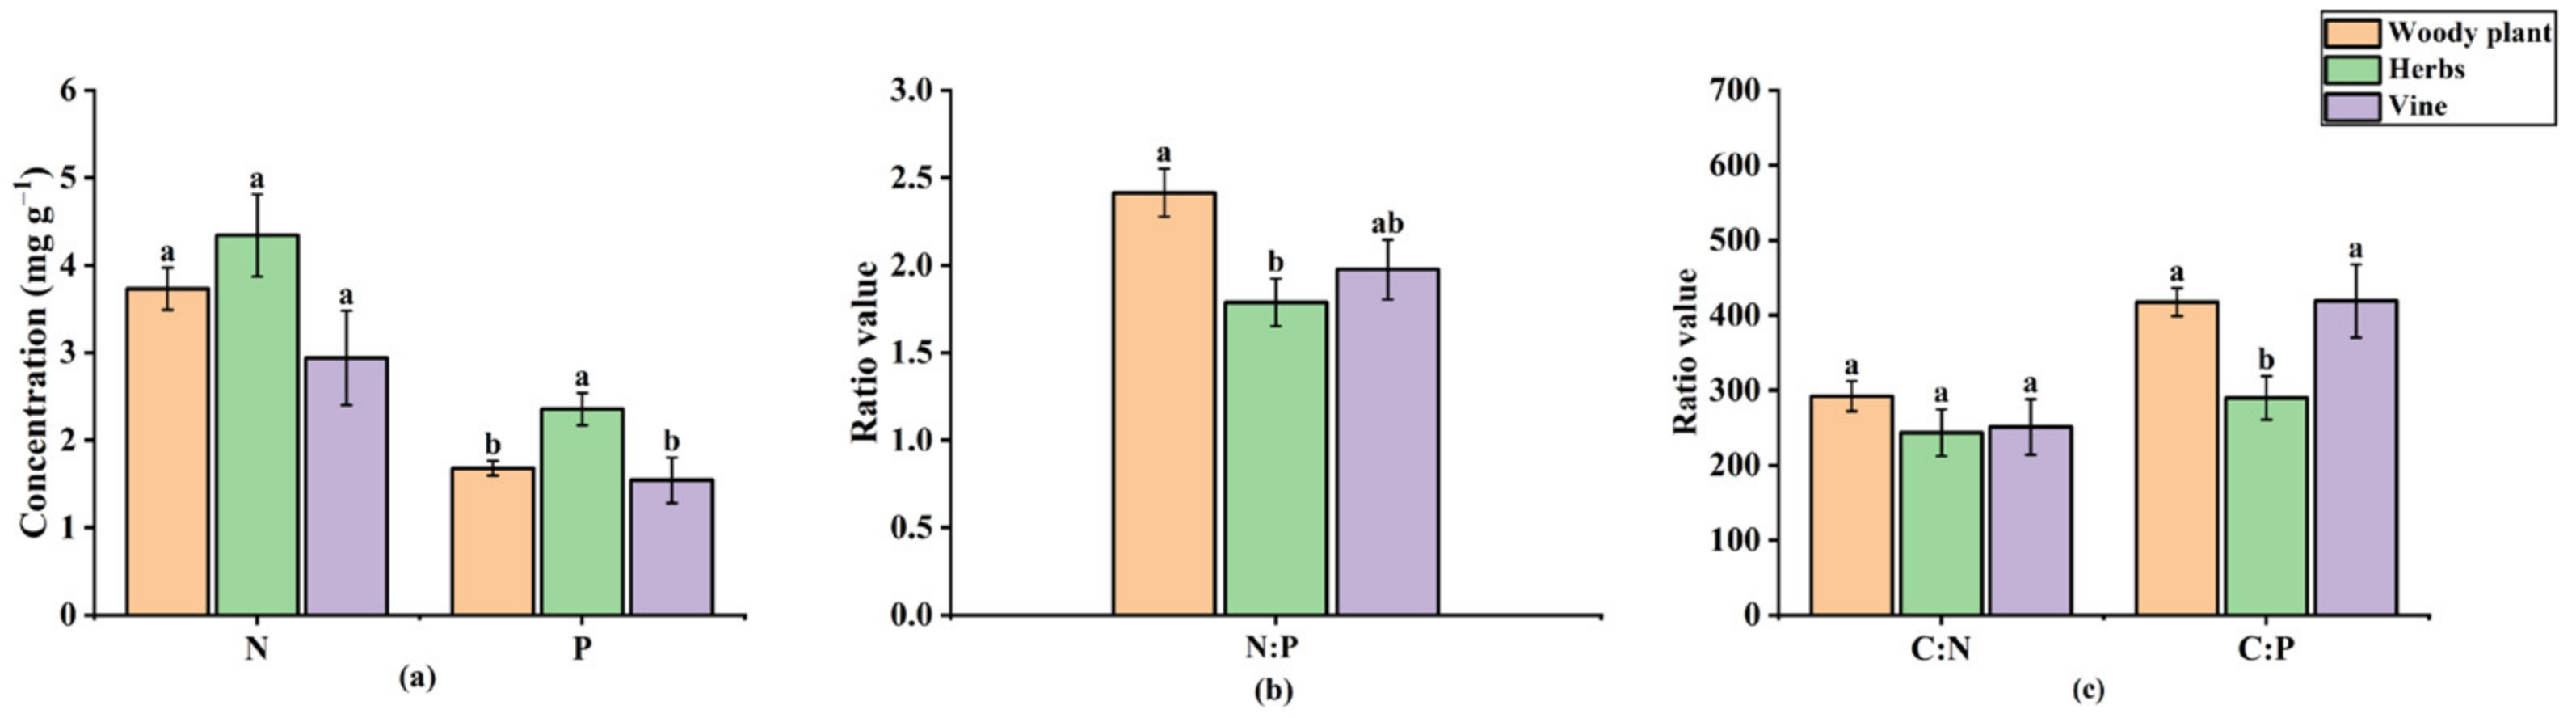
3.3. Characteristics of Leaf Stoichiometry among Different Life Forms
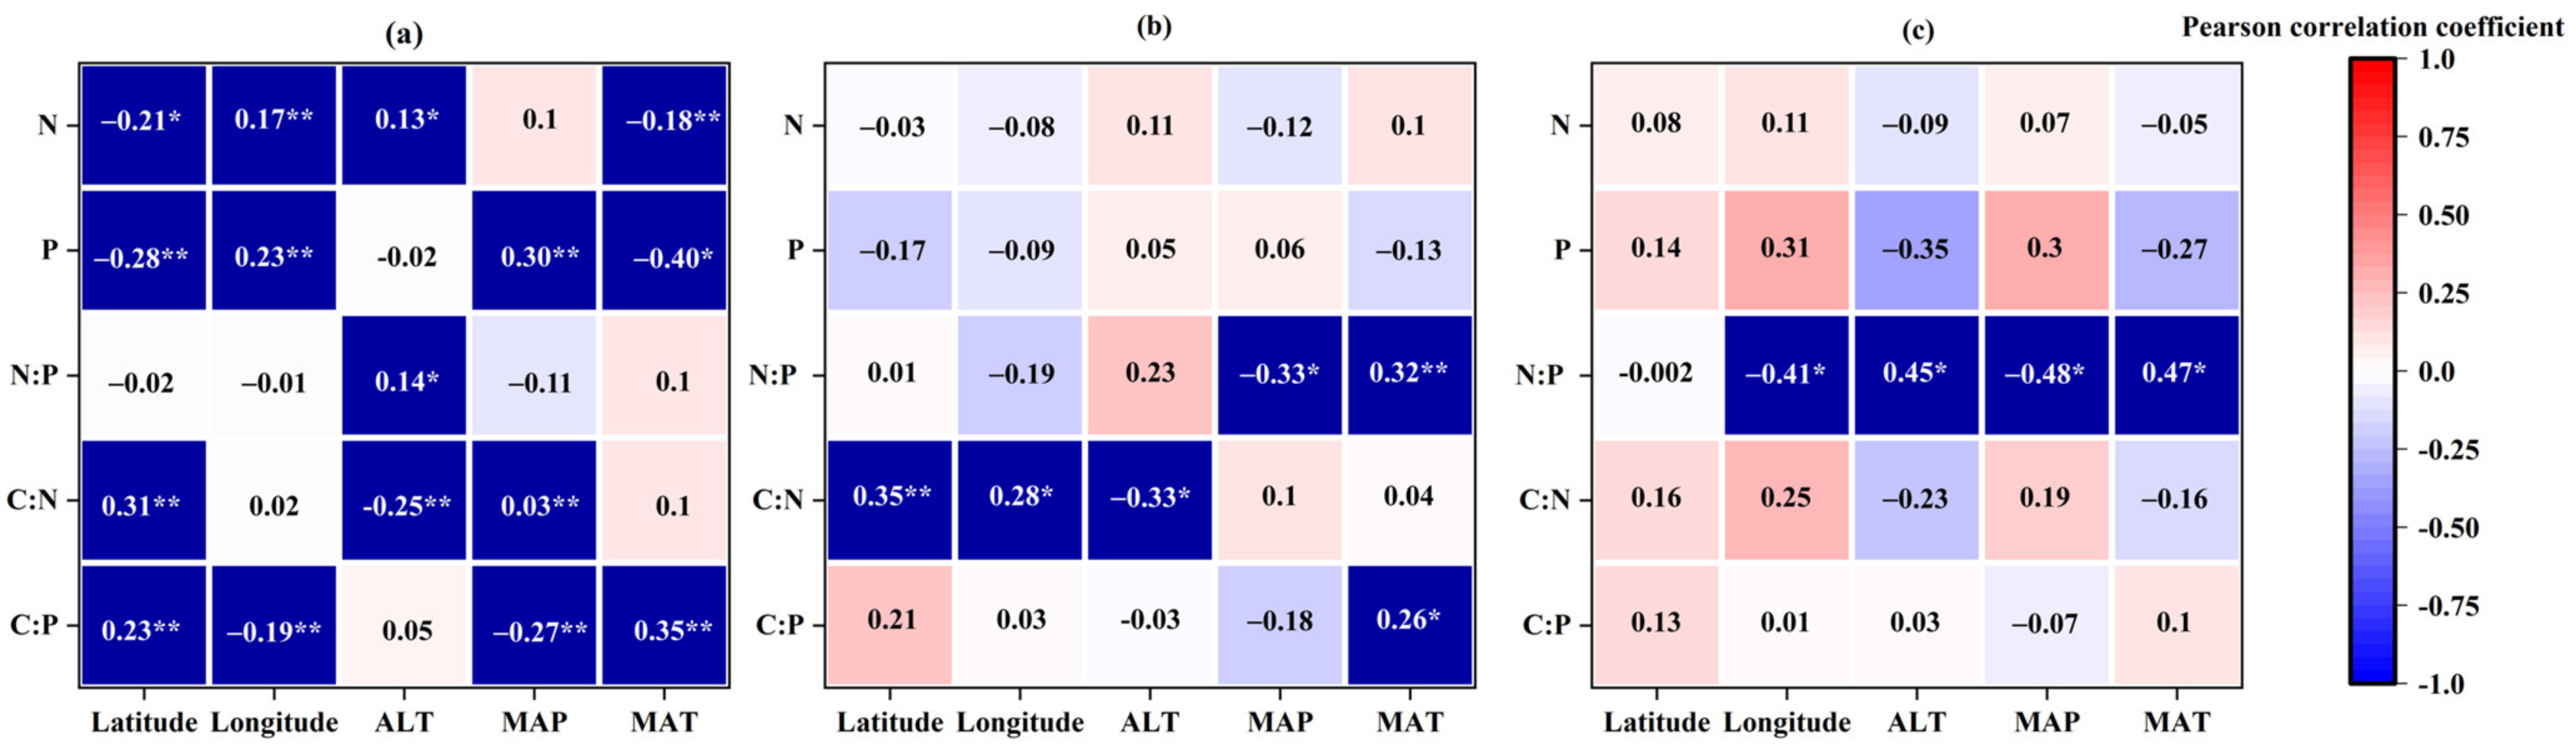
3.4. Leaf Stoichiometry in Different Life Forms Response to Environmental Factors
3.4.1. Variations in Leaf Stoichiometry in Different Life Forms: Geographical Variables
3.4.2. Variations in Leaf Stoichiometry in Different Life Forms: Climatic Variables
4. Discussion
4.1. Patterns of Leaf Stoichiometry in Hainan Island
4.2. Influence of Geographical and Climatic Factors on Leaf Stoichiometry
5. Conclusions
Author Contributions
Funding
Data Availability Statement
Conflicts of Interest
Appendix A

| Serial Number | Plant Name | Life Form | Evergreen/Deciduous Plant |
|---|---|---|---|
| 1 | Alangium chinense | Woody plant | Deciduous plant |
| 2 | Artocarpus hypargyreus | Woody plant | Evergreen |
| 3 | Abelmoschus esculentus | Herbs | / |
| 4 | Acacia confusa | Woody plant | Evergreen |
| 5 | Acalypha wikesiana | Woody plant | Evergreen |
| 6 | Acanthopanax senticosus | Woody plant | Evergreen |
| 7 | Acer buergerianum | Woody plant | Deciduous plant |
| 8 | Achyranthes bidentata | Herbs | / |
| 9 | Acmena acuminatissima | Woody plant | Evergreen |
| 10 | Acronychia pedunculata | Woody plant | Evergreen |
| 11 | Actinidia chinensis | Vine | Deciduous plant |
| 12 | Adenanthera pavonlna | Woody plant | Deciduous plant |
| 13 | Aeschynomene indica | Herbs | / |
| 14 | Aidia cochinchinensis | Woody plant | Evergreen |
| 15 | Alangium salviifolium | Woody plant | Deciduous plant |
| 16 | Albizia chinensis | Woody plant | Evergreen |
| 17 | Albizzia corniculata | Vine | Evergreen |
| 18 | Albizzia procera | Woody plant | Deciduous plant |
| 19 | Alchornea davidii | Woody plant | Deciduous plant |
| 20 | Alchornea trewioides | Woody plant | Evergreen |
| 21 | Aleurites moluccana | Woody plant | Evergreen |
| 22 | Allamanda cathartica | Woody plant | Evergreen |
| 23 | Alocasia macrorrhiza | Herbs | / |
| 24 | Alpinia japonica | Herbs | / |
| 25 | Alpinia zerumbet | Herbs | / |
| 26 | Alseodaphne rugosa | Woody plant | Evergreen |
| 27 | Alstonia scholaris | Woody plant | Evergreen |
| 28 | Annona glabra | Woody plant | Evergreen |
| 29 | Annona montana | Woody plant | Evergreen |
| 30 | Aphanamixis polystachya | Woody plant | Evergreen |
| 31 | Aporosa dioica | Woody plant | Evergreen |
| 32 | Aquilaria sinensis | Woody plant | Evergreen |
| 33 | Araucaria cunninghamii | Woody plant | Evergreen |
| 34 | Ardisia japonica | Woody plant | Evergreen |
| 35 | Areca catechu | Woody plant | Evergreen |
| 36 | Areca triandra | Woody plant | Evergreen |
| 37 | Arenga pinnata | Woody plant | Evergreen |
| 38 | Bambusa textilis | Herbs | / |
| 39 | Bidens pilosa | Herbs | / |
| 40 | Blastus cochinchinensis | Woody plant | Evergreen |
| 41 | Bombax malabaricum | Woody plant | Deciduous plant |
| 42 | Bowringia callicarpa | Woody plant | Evergreen |
| 43 | Brucea javanica | Woody plant | Evergreen |
| 44 | Buxus megistophylla | Woody plant | Evergreen |
| 45 | Byttneria aspere | Vine | Evergreen |
| 46 | Caesalpinia pulcherrima | Woody plant | Evergreen |
| 47 | Calliandra haematocephala | Woody plant | Deciduous plant |
| 48 | Callistemon rigidus | Woody plant | Evergreen |
| 49 | Camptotheca acuminata | Woody plant | Deciduous plant |
| 50 | Canarium pimela | Woody plant | Evergreen |
| 51 | Carica papaya | Herbs | / |
| 52 | Carmona microphylla | Woody plant | Evergreen |
| 53 | Carvota mitis | Woody plant | Evergreen |
| 54 | Caryota mitis | Woody plant | Evergreen |
| 55 | Caryota ochlandra | Woody plant | Evergreen |
| 56 | Cayratia japonica | Vine | Evergreen |
| 57 | Cecropia peltata | Woody plant | Evergreen |
| 58 | Ceiba pentandra | Woody plant | Deciduous plant |
| 59 | Ceiba speciosa | Woody plant | Deciduous plant |
| 60 | Celosia argentea | Herbs | / |
| 61 | Cerbera manghas | Woody plant | Evergreen |
| 62 | Chamaedorea erumpens | Woody plant | Evergreen |
| 63 | Choerospondias axillaris | Woody plant | Deciduous plant |
| 64 | Chromolaene odorata | Herbs | / |
| 65 | Chrysalidocarpus lutescens | Woody plant | Evergreen |
| 66 | Chukrasia tabularis | Woody plant | Evergreen |
| 67 | Cinnamomum bodinieri | Woody plant | Evergreen |
| 68 | Cinnamomum pedunculatum | Woody plant | Evergreen |
| 69 | Citrus maxima | Woody plant | Evergreen |
| 70 | Clerodendrum trichotomum | Woody plant | Evergreen |
| 71 | Cocos uncifera | Woody plant | Evergreen |
| 72 | Codiaeum variegatum | Woody plant | Evergreen |
| 73 | Cola acuminata | Woody plant | Evergreen |
| 74 | Conyza canadensis | Herbs | / |
| 75 | Cordyline fruticosa | Woody plant | Evergreen |
| 76 | Costus speciosus | Herbs | / |
| 77 | Crassocephalum crepidioides | Herbs | / |
| 78 | Cratoxylum cochin chinense | Woody plant | Deciduous plant |
| 79 | Croton laevigatus | Woody plant | Evergreen |
| 80 | Cudrania cochin chinensis | Woody plant | Evergreen |
| 81 | Curculigo orchioides | Herbs | / |
| 82 | Dalbergia hupeana | Woody plant | Evergreen |
| 83 | Delonix regia | Woody plant | Deciduous plant |
| 84 | Grona heterocarpos | Woody plant | Evergreen |
| 85 | Desmos chinensis | Woody plant | Evergreen |
| 86 | Dianella ensifolia | Herbs | / |
| 87 | Digitaria sanguinalis | Herbs | / |
| 88 | Dimocarpus longan | Woody plant | Evergreen |
| 89 | Dioscorea opposita | Vine | Evergreen |
| 90 | Diospyros ebenum | Woody plant | Evergreen |
| 91 | Dolichandrone stipulata | Woody plant | Evergreen |
| 92 | Dracaena angustifolia | Woody plant | Evergreen |
| 93 | Dracontomelon duperreanum | Woody plant | Evergreen |
| 94 | Duranta repens | Woody plant | Evergreen |
| 95 | Elaeagnus pungens | Woody plant | Evergreen |
| 96 | Elaeis guineensis | Woody plant | Evergreen |
| 97 | Elephantopus scaber | Herbs | / |
| 98 | Elephantopus tomentosus | Herbs | / |
| 99 | Eleusine indica | Herbs | / |
| 100 | Elsholtzia ciliata | Herbs | / |
| 101 | Engelhardtia roxburghiana | Woody plant | Evergreen |
| 102 | Erythrophleum fordii | Woody plant | Evergreen |
| 103 | Eugenia uniflora | Woody plant | Evergreen |
| 104 | Euphorbia humifusa | Herbs | / |
| 105 | Evodia glabrifolia | Woody plant | Evergreen |
| 106 | Evodia lepta | Woody plant | Evergreen |
| 107 | Fagraea ceilanica | Woody plant | Evergreen |
| 108 | Ficus altissima | Woody plant | Evergreen |
| 109 | Ficus auriculata | Woody plant | Evergreen |
| 110 | Ficus benjamina | Woody plant | Evergreen |
| 111 | Ficus fistulosa | Woody plant | Evergreen |
| 112 | Ficus hirta | Woody plant | Evergreen |
| 113 | Ficus hispida | Woody plant | Evergreen |
| 114 | Ficus microcarpa | Woody plant | Evergreen |
| 115 | Ficus subpisocarpa | Woody plant | Evergreen |
| 116 | Ficus tinctoria | Woody plant | Evergreen |
| 117 | Fissistigma oldhamii | Woody plant | Evergreen |
| 118 | Garcia nutans | Woody plant | Evergreen |
| 119 | Garcinia oblongifolia | Woody plant | Evergreen |
| 120 | Gardenia jasminoides | Woody plant | Evergreen |
| 121 | Gleditsia sinensis | Woody plant | Deciduous plant |
| 122 | Gleditsia vestita | Woody plant | Evergreen |
| 123 | Gmelina arborea | Woody plant | Evergreen |
| 124 | Gnetum parvifolium | Vine | Evergreen |
| 125 | Grevillea banksii | Woody plant | Evergreen |
| 126 | Gynura segetum | Herbs | / |
| 127 | Hamelia patens | Woody plant | Evergreen |
| 128 | Hedera nepalensis | Woody plant | Evergreen |
| 129 | Hedyotis auricularia | Herbs | / |
| 130 | Hedyotis hedyotidea | Vine | Evergreen |
| 131 | Heritiera angustata | Woody plant | Evergreen |
| 132 | Heritiera parvifolia | Woody plant | Evergreen |
| 133 | Hernandia sonora | Woody plant | Evergreen |
| 134 | Hevea brasiliensis | Woody plant | Deciduous plant |
| 135 | Hibiscus mutabilis | Woody plant | Deciduous plant |
| 136 | Hibiscus rosa-sinensis | Woody plant | Evergreen |
| 137 | Hibiscus schizopetalus | Woody plant | Evergreen |
| 138 | Holmskioldia sanguinea | Woody plant | Evergreen |
| 139 | Holarrhena antidysenterica | Woody plant | Evergreen |
| 140 | Homalium cochinchinense | Woody plant | Evergreen |
| 141 | Homalium hainanense | Woody plant | Evergreen |
| 142 | Hopea exalata | Woody plant | Evergreen |
| 143 | Hoya carnosa | Vine | Evergreen |
| 144 | Hymenaea courbaril | Woody plant | Evergreen |
| 145 | Ilex asprella | Woody plant | Deciduous plant |
| 146 | Ipomoea biflora | Herbs | / |
| 147 | Ixora chinensis | Woody plant | Evergreen |
| 148 | Jasminum lanceolarium | Woody plant | Evergreen |
| 149 | Juncellus serotinus | Herbs | / |
| 150 | Kigelia pinnata | Woody plant | Deciduous plant |
| 151 | Lantana camara | Herbs | / |
| 152 | Lasianthus chinensis | Woody plant | Evergreen |
| 153 | Lasianthus japonicus | Woody plant | Evergreen |
| 154 | Leptodermis parkeri | Woody plant | Evergreen |
| 155 | Ligustrum vicaryi | Woody plant | Deciduous plant |
| 156 | Litchi chinensis | Woody plant | Evergreen |
| 157 | Lithocarpus corneus | Woody plant | Evergreen |
| 158 | Litsea monopetala | Herbs | / |
| 159 | Litsea pungens | Woody plant | Deciduous plant |
| 160 | Lophatherum | Woody plant | Evergreen |
| 161 | Lucuma nervosa | Woody plant | Evergreen |
| 162 | Machilus salicina | Woody plant | Evergreen |
| 163 | Maesa japonica | Woody plant | Evergreen |
| 164 | Magnolia coco | Woody plant | Evergreen |
| 165 | Magnolia denudata | Woody plant | Deciduous plant |
| 166 | Magnolia liliflora | Woody plant | Evergreen |
| 167 | Mallotus apelta | Woody plant | Evergreen |
| 168 | Mallotus hookerianus | Woody plant | Evergreen |
| 169 | Malvastrum coromandelianum | Herbs | / |
| 170 | Manihot esculenta | Woody plant | Evergreen |
| 171 | Manilkara zapota | Woody plant | Evergreen |
| 172 | Melastoma candidum | Herbs | / |
| 173 | Melastoma sanguineum | Herbs | / |
| 174 | Mesua ferrea | Woody plant | Evergreen |
| 175 | Michelia odora | Woody plant | Evergreen |
| 176 | Mimosa pudica | Herbs | / |
| 177 | Mimosa sepiaria | Herbs | / |
| 178 | Mimusops elengi | Woody plant | Evergreen |
| 179 | Miscanthus sinensis | Herbs | / |
| 180 | Moghania macrophylla | Woody plant | Evergreen |
| 181 | Mucuna sempervirens | Vine | Evergreen |
| 182 | Muntingia calabura | Woody plant | Evergreen |
| 183 | Musa nana | Herbs | / |
| 184 | Nephelium lappceum | Woody plant | Evergreen |
| 185 | Pacrydium pierrei | Woody plant | Evergreen |
| 186 | Paederia scandens | Vine | Evergreen |
| 187 | Paeonia suffruticosa | Woody plant | Deciduous plant |
| 188 | Pandanus tectorius | Woody plant | Evergreen |
| 189 | Parakmeria lotungensis | Woody plant | Evergreen |
| 190 | Passiflora foetida | Vine | Evergreen |
| 191 | Pharbitis nil | Herbs | / |
| 192 | Photinia serrulata | Woody plant | Evergreen |
| 193 | Phragmites australias | Herbs | / |
| 194 | Phyllanthus emblica | Woody plant | Evergreen |
| 195 | Phyllanthus urinaria | Herbs | / |
| 196 | Pittosporum tobira | Woody plant | Evergreen |
| 197 | Platycladus orientalis | Woody plant | Evergreen |
| 198 | Plumeria rubra | Woody plant | Deciduous plant |
| 199 | Podocarpus imbricatus | Woody plant | Evergreen |
| 200 | Pollia japonica | Herbs | / |
| 201 | Polyalthia longifolia | Woody plant | Evergreen |
| 202 | Polyalthia rumphii | Woody plant | Evergreen |
| 203 | Polygala japonica | Herbs | / |
| 204 | Polygonatum odoratum | Herbs | / |
| 205 | Polygonatum sibiricum | Herbs | / |
| 206 | Pongamia pinnata | Woody plant | Evergreen |
| 207 | Portulaca grandiflora | Herbs | / |
| 208 | Pothos chinensis | Vine | Evergreen |
| 209 | Pouzolzia zeylanica | Herbs | / |
| 210 | Psychotria rubra | Woody plant | Evergreen |
| 211 | Pterocarpus marsupium | Woody plant | Evergreen |
| 212 | Pterolobium punctatum | Vine | Evergreen |
| 213 | Pterospermum heterophyllum | Woody plant | Evergreen |
| 214 | Ptychosperma macarthurii | Woody plant | Evergreen |
| 215 | Pueraria lobata | Vine | Evergreen |
| 216 | Quercus variabilis | Woody plant | Evergreen |
| 217 | Quisqualis indica | Woody plant | Evergreen |
| 218 | Rhaphidophora hongkongensis | Vine | Evergreen |
| 219 | Rhapis excelsa | Woody plant | Evergreen |
| 220 | Rhodomyrtus tomentosa | Woody plant | Evergreen |
| 221 | Rhopalostylis sapida | Woody plant | Evergreen |
| 222 | Richardia scabra | Herbs | / |
| 223 | Rourea microphylla | Woody plant | Evergreen |
| 224 | Rubus corchorifolius | Woody plant | Evergreen |
| 225 | Russelia equisetiformis | Woody plant | Evergreen |
| 226 | Schinus terebinthifolius | Woody plant | Evergreen |
| 227 | Sabal mauritiformis | Woody plant | Evergreen |
| 228 | Sanchezia speciosa | Woody plant | Evergreen |
| 229 | Sapium sebiferum | Woody plant | Deciduous plant |
| 230 | Sarcandra glabra | Herbs | / |
| 231 | Schefflera octophylla | Woody plant | Evergreen |
| 232 | Setaria viridis | Herbs | / |
| 233 | Sida acuta | Herbs | / |
| 234 | Sida rhombifolia | Woody plant | Evergreen |
| 235 | Sindora glabra | Woody plant | Evergreen |
| 236 | Sinomenium acutum | Vine | Evergreen |
| 237 | Sloanea hemsleyana | Woody plant | Evergreen |
| 238 | Smilax china | Vine | Evergreen |
| 239 | Spathodea campanulata | Woody plant | Deciduous plant |
| 240 | Spermacoce latifolia | Herbs | / |
| 241 | Spondias lakonensis | Woody plant | Evergreen |
| 242 | Styrax suberifolius | Woody plant | Evergreen |
| 243 | Swietenia macrophylla | Woody plant | Evergreen |
| 244 | Symplocos caudata | Woody plant | Evergreen |
| 245 | Symplocos congesta | Woody plant | Evergreen |
| 246 | Synedrellanodiflora | Herbs | / |
| 247 | Synsepalum dulcificum | Woody plant | Evergreen |
| 248 | Syzygium buxifolium | Woody plant | Evergreen |
| 249 | Syzyglum hancei | Woody plant | Evergreen |
| 250 | Tectona grandis | Woody plant | Evergreen |
| 251 | Terminalia arjuna | Woody plant | Evergreen |
| 252 | Terminalia catappa | Woody plant | Evergreen |
| 253 | Tetracera asiatica | Vine | Evergreen |
| 254 | Thunbergia erecta | Woody plant | Evergreen |
| 255 | Tithonia diversifolia | Herbs | / |
| 256 | Toddalia asiatica | Woody plant | Evergreen |
| 257 | Toona sinensis | Woody plant | Deciduous plant |
| 258 | Trachelospermum jasminoides | Vine | Evergreen |
| 259 | Triumfetta rhomboidea | Woody plant | Evergreen |
| 260 | Urena lobata | Herbs | / |
| 261 | Uvaria boniana | Woody plant | Evergreen |
| 262 | Veitchia merrillii | Woody plant | Evergreen |
| 263 | Viburnum odoratissimum | Woody plant | Evergreen |
| 264 | Vitex quinata | Woody plant | Evergreen |
| 265 | Wedelia chinensis | Herbs | / |
| 266 | Zanthoxylum avicennae | Woody plant | Deciduous plant |
| 267 | Zanthoxylum bungeanum | Woody plant | Deciduous plant |
| 268 | Zingiber zerumbet | Herbs | / |
References
- Sardans, J.; Rivas-Ubach, A.; Peñuelas, J. The C:N:P stoichiometry of organisms and ecosystems in a changing world: A review and perspectives. Perspect. Plant Ecol. Evol. Syst. 2012, 14, 33–47. [Google Scholar] [CrossRef]
- Zhang, J.H.; Zhao, N.; Liu, C.C.; Yang, M.; Li, M.L.; Yu, G.R.; Wilcox, K.; Yu, Q.; He, N.P. C:N:P stoichiometry in Chin’s forests: From organs to ecosystems. Funct. Ecol. 2018, 32, 50–60. [Google Scholar] [CrossRef] [Green Version]
- Chang, Y.N.; Zhong, Q.L.; Yang, H.; Xu, C.B.; Hua, W.P.; Li, B.Y. Patterns and driving factors of leaf C, N, and P stoichiometry in two forest types with different stand ages in a mid-subtropical zone. For. Ecosyst. 2022, 9, 100005. [Google Scholar] [CrossRef]
- Reich, P.B.; Oleksyn, J. Global patterns of plant leaf N and P in relation to temperature and latitude. PNAS 2004, 101, 11001–11006. [Google Scholar] [CrossRef] [PubMed] [Green Version]
- Han, W.X.; Wu, Y.; Tang, Y.L.; Chen, Y.H.; Li, L.P.; He, J.S.; Fang, J.Y. Leaf carbon, nitrogen and phosphorus stoichiometry across plant species in Beijing and its periphery. Acta Sci. Nat. Univ. Pekin. 2009, 45, 855–860. (In Chinese) [Google Scholar] [CrossRef]
- Liu, J.X.; Fang, X.; Tang, X.L.; Wang, W.T.; Zhou, G.Y.; Xu, S.; Huang, W.J.; Wang, G.X.; Yan, J.H.; Ma, K.P.; et al. Patterns and controlling factors of plant nitrogen and phosphorus stoichiometry across China’s forests. Biogeochemistry 2019, 143, 191–205. [Google Scholar] [CrossRef]
- Salazar, P.C.; Navarro-Cerrillo, R.M.; Cruz, G.; Villar, R. Intraspecific leaf functional trait variability of eight prosopis pallida tree populations along a climatic gradient of the dry forests of northern Peru. J. Arid Environ. 2018, 152, 12–20. [Google Scholar] [CrossRef]
- Hamann, E.; Kesselring, H.; Stcklin, J. Plant responses to simulated warming and drought:a comparative study of functional plasticity between congeneric mid and high elevation species. J. Plant Ecol. 2018, 11, 364–374. [Google Scholar] [CrossRef] [Green Version]
- Tong, R.; Zhou, B.; Jiang, L.; Ge, X.; Cao, Y. Spatial patterns of leaf carbon, nitrogen, and phosphorus stoichiometry and nutrient resorption in Chinese fir across subtropical China. Catena 2021, 201, 105221. [Google Scholar] [CrossRef]
- Li, C.H.; Yu, H.L.; Xu, Y.X.; Zhu, W.W.; Wang, P.; Huang, J.Y. Close linkages between leaf functional traits and soil and leaf C:N:P stoichiometry under altered precipitation in a desert steppe in northwestern China. Plant Ecol. 2022, 223, 407–421. [Google Scholar] [CrossRef]
- Lin, Y.T.; Lai, Y.; Tang, S.B.; Qin, Z.F.; Liu, J.F.; Kang, F.F.; Kuang, Y.W. Climatic and edaphic variables determine leaf C, N, P stoichiometry of deciduous Quercus species. Plant Soil 2022, 474, 383–394. [Google Scholar] [CrossRef]
- Minden, V.; Kleyer, M. Internal and external regulation of plant organ stoichiometry. Plant Biol. 2014, 16, 897–907. [Google Scholar] [CrossRef]
- Bai, Y.; Wu, J.; Clark, C.M.; Pan, Q.; Zhang, L.; Chen, S.; Wang, Q.B.; Han, X.G. Grazing alters ecosystem functioning and C:N:P stoichiometry of grasslands along a regional precipitation gradient. J. Appl. Ecol. 2012, 49, 1204–1215. [Google Scholar] [CrossRef]
- Yuan, Z.Y.; Chen, H. Decoupling of nitrogen and phosphorus in terrestrial plants associated with global changes. Nat. Clim. Chang. 2015, 5, 465–469. [Google Scholar] [CrossRef]
- Zeng, Z.Z.; Piao, S.L.; Li, L.Z.X.; Zhou, L.M.; Ciais, P.; Wang, T.; Wang, Y.P. Climate mitigation from vegetation biophysical feedbacks during the past three decades. Nat. Clim. Chang. 2017, 7, 432–436. [Google Scholar] [CrossRef]
- Gao, M.; Piao, S.; Chen, A.; Yang, H.; Liu, Q.; Fu, Y.H.; Janssens, I.A. Divergent changes in the elevational gradient of vegetation activities over the last 30 years. Nat. Commun. 2019, 10, 2970. [Google Scholar] [CrossRef] [Green Version]
- IPCC. Summary for Policymakers. In Climate Change 2021: The Physical Science Basis. Contribution of Working Group I to the Sixth Assessment Report of the Intergovernmental Panel on Climate Change; Masson-Delmotte, V., Zhai, P., Pirani, A., Connors, S.L., Péan, C., Berger, S., Caud, N., Chen, Y., Goldfarb, L., Gomis, M.I., et al., Eds.; Cambridge University Press: Cambridge, UK, in press.
- Hobbie, S.E.; Gough, L. Foliar and soil nutrients in tundra on glacial landscapes of contrasting ages in northern Alaska. Oecologia 2002, 131, 453–462. [Google Scholar] [CrossRef]
- Li, Y.; Mao, W.; Zhao, X.; Zhang, T. Leaf nitrogen and phosphorus stoichiometry in typical desert and desertified regions, North China. Environ. Sci. 2010, 31, 1716–1725. (In Chinese) [Google Scholar] [CrossRef]
- Chen, Y.H.; Han, W.X.; Tang, L.Y.; Tang, Z.Y.; Fang, J.Y. Leaf nitrogen and phosphorus concentrations of woody plants differ in responses to climate, soil and plant growth form. Ecography 2013, 36, 178–184. [Google Scholar] [CrossRef]
- Sun, J.N.; Gao, P.; Li, C.; Wang, R.J.; Niu, X.; Wang, B. Ecological stoichiometry characteristics of the leaf-litter-soil continuum of Quercus acutissima Carr. and Pinus densiflora Sieb. in Northern China. Environ. Earth Sci. 2019, 78, 20. [Google Scholar] [CrossRef]
- Zhang, S.; Zhang, J.; Slik, J.W.F.; Cao, K. Leaf element concentrations of terrestrial plants across China are influenced by taxonomy and the environment. Glob. Ecol. Biogeogr. 2012, 21, 809–818. [Google Scholar] [CrossRef]
- Li, Y.Q.; He, W.; Wu, J.; Zhao, Q.; Chen, T.; Zhu, L.W.; Ouyang, L.; Ni, G.Y.; Dirk Hölscher, D. Leaf stoichiometry is synergistically-driven by climate, site, soil characteristics and phylogeny in karst areas, Southwest China. Biogeochemistry 2021, 155, 283–301. [Google Scholar] [CrossRef]
- Xing, S.P.; Cheng, X.Q.; Kang, F.F.; Wang, J.R.; Yan, J.X.; Han, H.R. The patterns of N/P/K stoichiometry in the Quercus Wutaishanica community among different life forms and organs and their responses to environmental factors in northern China. Ecol. Indic. 2022, 137, 108783. [Google Scholar] [CrossRef]
- Han, W.X.; Fang, J.Y.; Guo, D.L.; Zhang, Y. Leaf nitrogen and phosphorus stoichiometry across 753 terrestrial plant species in China. New Phytol. 2005, 168, 377–385. [Google Scholar] [CrossRef]
- Han, W.X.; Fang, J.Y.; Reich, P.B.; Woodward, F.I.; Wang, Z.H. Biogeography and variability of eleven mineral elements in plant leaves across gradients of climate, soil and plant functional type in China. Ecol. Lett. 2011, 14, 788–796. [Google Scholar] [CrossRef]
- Esmeijer-Liu, A.J.; Aerts, R.; Kürschner, W.M.; Bobbink, R.; Lotter, A.F.; Verhoeven, J. Nitrogen enrichment lowers Betula pendula green and yellow leaf stoichiometry irrespective of effects of elevated carbon dioxide. Plant Soil 2009, 316, 311–322. [Google Scholar] [CrossRef] [Green Version]
- Qin, J.; Shangguan, Z.P.; Xi, W.M. Seasonal variations of leaf traits and drought adaptation strategies of four common woody species in South Texas, USA. J. For. Res. 2019, 5, 1715–1725. [Google Scholar] [CrossRef]
- Zheng, S.; Shangguan, Z. Spatial patterns of leaf nutrient traits of the plants in the Loess Plateau of China. Trees 2007, 21, 357–370. [Google Scholar] [CrossRef]
- Liu, J.T.; Gu, Z.J.; Shao, H.B.; Zhou, F.; Peng, S.Y. N-P stoichiometry in soil and leaves of pinus massoniana forest at different stand ages in the subtropical soil erosion area of China. Environ. Earth Sci. 2016, 75, 1091. [Google Scholar] [CrossRef]
- Cao, Y.; Chen, Y. Coupling of plant and soil C:N:P stoichiometry in black locust, (Robinia pseudoacacia) plantations on the Loess Plateau, China. Trees 2017, 31, 1559–1570. [Google Scholar] [CrossRef]
- Ma, X.X.; Hong, J.T.; Wang, X.D. C:N:P stoichiometry of perennial herbs’ organs in the alpine steppe of the northern Tibetan Plateau. J. Mt. Sci. 2019, 16, 2039–2047. [Google Scholar] [CrossRef]
- Sun, J.; Liu, B.; You, Y.; Li, W.; Liu, M.; Shang, H.; He, J. Solar radiation regulates the leaf nitrogen and phosphorus stoichiometry across alpine meadows of the Tibetan Plateau. Agric. For. Meteorol. 2019, 271, 92–101. [Google Scholar] [CrossRef]
- Wen, J.H.; Tao, H.M.; Du, B.M.; Hui, D.F.; Sun, N.X.; Umair, M.; Liu, C.J. Plantations modified leaf elemental stoichiometry compared to the native shrub community in karst areas, southwest of China. Trees 2021, 35, 987–999. [Google Scholar] [CrossRef]
- Liu, Y.J.; Li, G.; Wang, M.X.; Ma, C.Y.; De Boeck, H.J.; Hou, F.J.; Li, Z.Q. Effects of water supply on plant stoichiometry of C, N, P in inner Mongolia grasslands. Plant Soil 2022, 2022, 1–18. [Google Scholar] [CrossRef]
- Pan, Y.; Birdsey, R.A.; Fang, J.; Houghton, R.; Kauppi, P.E.; Kurz, W.A. A large and persistent carbon sink in the world’s forests. Science 2011, 333, 988–993. [Google Scholar] [CrossRef] [Green Version]
- Langenhove, L.V.; Verryckt, L.T.; Bréchet, L.; Courtois, E.A.; Stahl, C.; Hofhansl, F.; Bauters, M.; Sardans, J.; Boeckx, P.; Fransen, E.; et al. Atmospheric deposition of elements and its relevance for nutrient budgets of tropical forests. Biogeochemistry 2020, 149, 175–193. [Google Scholar] [CrossRef]
- Chen, X.H.; Chen, Z.Z.; Wu, T.T.; Le, J.R.; Li, Y.N. C, N and P stoichiometric characteristics of leaf and soil for two typical forest in Hainan Island. For. Environ. Sci. 2021, 37, 102–108. (In Chinese) [Google Scholar] [CrossRef]
- Baxter, I.; Dilkes, B.P. Elemental profiles reflect plant adaptations to the environment. Science 2012, 336, 1661–1663. [Google Scholar] [CrossRef] [Green Version]
- Du, B.M.; Ji, H.W.; Peng, C.; Liu, X.J.; Liu, C.J. Altitudinal patterns of leaf stoichiometry and nutrient resorption in Quercus variabilis in the Baotianman Mountains, China. Plant Soil 2017, 413, 193–202. [Google Scholar] [CrossRef]
- Ren, S.J.; Yu, G.R.; Tao, B.; Wang, S.Q. Leaf nitrogen and phosphorus stoichiometry across 654 terrestrial plant species in NSTEC. Environ. Sci. 2007, 28, 2665–2673. (In Chinese) [Google Scholar] [CrossRef]
- Zhang, Q.F.; Xie, J.S.; Lyu, M.K.; Xiong, D.C.; Wang, J.; Chen, Y.; Li, Y.Q.; Wang, M.K.; Yang, Y.S. Short-term effects of soil warming and nitrogen addition on the N:P stoichiometry of cunninghamia lanceolata in subtropical regions. Plant Soil 2017, 411, 395–407. [Google Scholar] [CrossRef]
- Athokpam, F.D.; Garkoti, S.C. Dynamics of foliar nitrogen of evergreen and deciduous plant species in a wet tropical forest, south assam, India. Plant Ecol. 2015, 216, 1117–1135. [Google Scholar] [CrossRef]
- Fan, H.B.; Wu, J.P.; Liu, W.F.; Yuan, Y.H.; Hu, L.; Cai, Q.K. Linkages of plant and soil C:N:P stoichiometry and their relationships to forest growth in subtropical plantations. Plant Soil 2015, 392, 127–138. [Google Scholar] [CrossRef]
- Lin, Y.Q.; Wang, A.W.; Su, P.; Fu, H.S. Distribution characteristics of soil nutrients in western Hainan: A case study of Baisha Li Autonomous County. China Trop. Agric. 2017, 1, 32–35. (In Chinese) [Google Scholar]
- Hedin, L.O. Global organization of terrestrial plant-nutrient interactions. PNAS 2004, 101, 10849–10850. [Google Scholar] [CrossRef] [Green Version]
- Gong, H.D.; Li, Y.Y.; Yu, T.; Zhang, S.H.; Gao, J.; Zhang, S.K.; Sun, D. Soil and climate effects on leaf nitrogen and phosphorus stoichiometry along elevational gradients. Glob. Ecol. Conserv. 2020, 23, e01138. [Google Scholar] [CrossRef]
- Tian, H.; Chen, G.; Zhang, C.; Melillo, J.M.; Hall, C. Pattern and variation of C:N:P ratios in China’s soils: A synthesis of observational data. Biogeochemistry 2010, 98, 139–151. [Google Scholar] [CrossRef]
- Li, D.; Niu, S.; Luo, Y. Global patterns of the dynamics of soil carbon and nitrogen stocks following afforestation: A meta-analysis. New Phytol. 2012, 195, 172–181. [Google Scholar] [CrossRef]
- Zheng, S.M.; Xia, Y.H.; Hu, Y.J.; Chen, X.B.; Rui, Y.C.; Gunina, A.; Kuzyakov, Y. Stoichiometry of carbon, nitrogen, and phosphorus in soil: Effects of agricultural land use and climate at a continental scale. Soil Till. Res. 2021, 209, 104903. [Google Scholar] [CrossRef]
- Hui, D.F.; Yang, X.T.; Deng, Q.; Liu, Q.; Wang, X.; Huai, Y.; Ren, H. Soil C:N:P stoichiometry in tropical forests on HaiNan Island of China: Spatial and vertical variations. Catena 2021, 201, 105228. [Google Scholar] [CrossRef]
- Menge, D.N.L.; Field, C.B. Simulated global changes alter phosphorus demand in annual grassland. Glob. Chang. Biol. 2007, 13, 2582–2591. [Google Scholar] [CrossRef]
- Elser, J.J.; Fagan, W.F.; Denno, R.F.; Dobberfuhl, D.R.; Folarin, A.; Huberty, A.; Interlandi, S.; Kilham, S.S.; McCauley, E.; Schulz, K.L.; et al. Nutritional constraints in terrestrial and freshwater food webs. Nature 2000, 408, 578–580. [Google Scholar] [CrossRef]
- Huang, D.; Wang, D.; Ren, Y. Using leaf nutrient stoichiometry as an indicator of flood tolerance and eutrophication in the riparian zone of the Lijang River. Ecol. Indic. 2019, 98, 821–829. [Google Scholar] [CrossRef]
- Elser, J.J.; Acharya, K.; Kyle, M.; Cotner, J.; Makino, W.; Markow, T.; Watts, T.; Hobbie, S.; Fagan, J.; Schade, J.; et al. Growth rate-stoichiometry couplings in diverse biota. Ecol. Lett. 2003, 6, 936–943. [Google Scholar] [CrossRef] [Green Version]
- Ågren, G.I. The C:N:P stoichiometry of autotrophs–-theory and observations. Ecol. Lett. 2004, 7, 185–191. [Google Scholar] [CrossRef]
- Niklas, K.J.; Cobb, E.D. Biomass partitioning and leaf N, P-stoichiometry: Comparisons between tree and herbaceous current-year shoots. Plant Cell Environ. 2006, 29, 2030–2042. [Google Scholar] [CrossRef]
- Rowe, E.C.; Toberman, H.; Adams, J.L.; Lawlor, A.J.; Thacker, S.A.; Patel, M.; Tipping, E. Productivity in a dominant herbaceous species is largely unrelated to soil macronutrient stocks. Sci. Total Environ. 2016, 572, 1636–1644. [Google Scholar] [CrossRef]
- Ågren, G.I.; Wetterstedt, J.A.M.; Billberger, M.F.K. Nutrient limitation on terrestrial plant growth-modeling the interaction between nitrogen and phosphorus. New Phytol. 2012, 194, 953–960. [Google Scholar] [CrossRef]
- Ågren, G.I.; Weih, M. Multi-dimensional plant element stoichiometry-looking beyond carbon, nitrogen, and phosphorus. Front. Plant Sci. 2020, 11, 23. [Google Scholar] [CrossRef] [Green Version]
- Luo, Y.; Peng, Q.W.; Li, K.H.; Gong, Y.M.; Liu, Y.Y.; Han, W.X. Patterns of nitrogen and phosphorus stoichiometry among leaf, stem and root of desert plants and responses to climate and soil factors in Xinjiang, China. Catena 2021, 199, 105100. [Google Scholar] [CrossRef]
- Verhoeven, J.T.A.; Koerselman, W.; Meuleman, A.F.M. Nitrogen-or phosphorus-limited growth in herbaceous, wet vegetation: Relations with atmospheric inputs and management regimes. Trends Ecol. Evol. 1996, 11, 494–497. [Google Scholar] [CrossRef] [PubMed]
- He, X.J.; Hou, E.Q.; Liu, Y.; Wen, D.Z. Altitudinal patterns and controls of plant and soil nutrient concentrations and stoichiometry in subtropical China. Sci. Rep. 2016, 6, 24261. [Google Scholar] [CrossRef] [PubMed] [Green Version]
- Lebauer, D.S.; Treseder, K.K. Nitrogen limitation of net primary productivity in terrestrial ecosystems is globally distributed. Ecology 2008, 89, 371–379. [Google Scholar] [CrossRef] [Green Version]
- Yuan, Z.Y.; Chen, H. Global trends in senesced-leaf nitrogen and phosphorus. Glob. Ecol. Biogeogr. 2009, 18, 532–542. [Google Scholar] [CrossRef]
- He, J.S.; Wang, L.; Flynn, D.F.B.; Wang, X.P.; Ma, W.H.; Fang, J.Y. Leaf nitrogen: Phosphorus stoichiometry across Chinese grassland biomes. Oecologia 2008, 155, 301–310. [Google Scholar] [CrossRef]
- Hu, Y.K.; Zhang, Y.L.; Liu, G.F.; Pan, X.; Yang, X.J.; Li, W.B.; Dai, W.H.; Tang, S.L.; Xiao, T.; Chen, L.Y.; et al. Intraspecific N and P stoichiometry of Phragmites australis: Geographic patterns and variation among climatic regions. Sci. Rep. 2017, 7, 43018. [Google Scholar] [CrossRef] [Green Version]
- Sun, X.; Kang, H.Z.; Kattge, J.; Gao, Y.; Liu, C.J. Biogeographic patterns of multi-element stoichiometry of Quercus variabilis leaves across China. Can. J. For. Res. 2015, 45, 1827–1834. [Google Scholar] [CrossRef]
- Frost, P.C.; Evans-White, M.A.; Finkel, Z.V.; Jensen, T.C.; Matzek, V. Are you what you eat? Physiological constraints on organismal stoichiometry in an elementally imbalanced world. Oikos 2005, 109, 18–28. [Google Scholar] [CrossRef]
- Wang, N.; Fu, F.Z.; Wang, B.T.; Wang, R.J. Carbon, nitrogen and phosphorus stoichiometry in Pinus tabulaeformis forest ecosystems in warm temperate Shanxi Province, north China. J. For. Res. 2018, 29, 1665–1673. [Google Scholar] [CrossRef]
- Guo, R.Q.; Sun, S.C.; Liu, B. Difference in leaf water use efficiency/photosynthetic nitrogen use efficiency of Bt-cotton and its conventional peer. Sci. Rep. 2016, 6, 33539. [Google Scholar] [CrossRef] [Green Version]
- Güsewell, S. N: P ratios in terrestrial plants: Variation and functional significance. New Phytol. 2004, 164, 243–266. [Google Scholar] [CrossRef]
- Sardans, J.; Rivas-Ubach, A.; Peñuelas, P. Factors affecting nutrient concentration and stoichiometry of forest trees in Catalonia (NE Spain). For. Ecol. Manag. 2011, 262, 2024–2034. [Google Scholar] [CrossRef]
- Huang, J.Y.; Yu, H.L.; Yuan, Z.Y.; Li, L.H. Effects of nitrogen, phosphorus and water supply on litter decomposition quality of senescing leaves of leymus Chinensis. Chin. J. Plant Ecol. 2011, 35, 808–815. [Google Scholar] [CrossRef]
- Huang, G.; Su, Y.G.; Mu, X.H.; Li, Y. Foliar nutrient resorption responses of three life-form plants to water and nitrogen additions in a temperate desert. Plant Soil 2018, 424, 479–489. [Google Scholar] [CrossRef]
- Zhang, L.; Liu, H.L.; Zhang, L.W.; Chen, Y.F.; Baskin, C.C. Effects of increased precipitation on C, N and P stoichiometry at different growth stages of a cold desert annual. Glob. Ecol. Conserv. 2022, 37, e02158. [Google Scholar] [CrossRef]
- Jia, Y.L.; Yu, G.R.; He, N.P.; Zhan, X.Y.; Fang, H.J.; Sheng, W.P.; Zuo, Y.; Zhang, D.Y.; Wang, Q.F. Spatial and decadal variations in inorganic nitrogen wet deposition in China induced by human activity. Sci. Rep. 2014, 4, 3763. [Google Scholar] [CrossRef] [Green Version]
- Liu, X.J.; Zhang, Y.; Han, W.X.; Tang, A.; Shen, J.L.; Cui, Z.L.; Zhang, F.S. Enhanced nitrogen deposition over China. Nature 2013, 494, 459–463. [Google Scholar] [CrossRef]
- Yu, Z.P.; Wang, M.H.; Huang, Z.Q.; Lin, T.C.; Vadeboncoeur, M.A.; Searle, E.B.; Chen, H. Temporal changes in soil C-N-P stoichiometry over the past 60 years across subtropical China. Global. Chang. Biol. 2018, 24, 1308–1320. [Google Scholar] [CrossRef]
- Gurmesa, G.A.; Lu, X.K.; Gundersen, P.; Mao, Q.G.; Zhou, K.J.; Fang, Y.T.; Mo, J.M. High retention of 15N-labeled nitrogen deposition in a nitrogen-saturated old-growth tropical forest. Glob. Chang. Biol. 2016, 22, 3608–3620. [Google Scholar] [CrossRef]
- Makino, W.; Cotner, J.B.; Sterner, R.W.; Elser, J.J. Are bacteria more like plants or animals? Growth rate and resource dependence of bacterial C:N: P stoichiometry. Funct. Ecol. 2003, 17, 121–130. [Google Scholar] [CrossRef] [Green Version]
- Lambers, H.; Poorter, H. Inherent variation in growth rate between higher plants: A search for physiological causes and ecological consequences. Ava. Ecol. Res. 2004, 34, 283–362. [Google Scholar] [CrossRef]
- Kerkhoff, A.J.; Fagan, W.F.; Elser, J.J.; Enquist, B.J. Phylogenetic and growthform variation in the scaling of nitrogen and phosphorus in the seed plants. Am. Nat. 2006, 168, e103–e122. [Google Scholar] [CrossRef] [PubMed] [Green Version]
- Körner, C.; Bannister, P.; Mark, A. Altitudinal variation in stomatal conductance, nitrogen content and leaf anatomy in different plant life forms in New Zealand. Oecologia 1986, 69, 577–588. [Google Scholar] [CrossRef]
- Morecroft, M.D.; Woodward, F. Experiments on the causes of altitudinal differences in the leaf nutrient contents, size and δ13C of Alchemilla alpina. New Phytol. 1996, 134, 471–479. [Google Scholar] [CrossRef]
- Yu, F.; Wang, D.X.; Shi, X.X.; Yi, X.F.; Huang, Q.P.; Hu, Y.N. Effects of Environmental Factors on Tree Seedling Regeneration in a Pine-oak Mixed Forest in the Qinling Mountains, China. J. Mt. Sci. 2013, 10, 845–853. [Google Scholar] [CrossRef]
- Sundqvist, M.K.; Sanders, N.J.; Wardle, D.A. Community and ecosystem responses to elevational gradients: Processes, mechanisms, and insights for global change. Annu. Rev. Ecol. Evol. Syst. 2013, 44, 261–280. [Google Scholar] [CrossRef] [Green Version]
- Fisher, J.B.; Malhi, Y.; Torres, I.C.; Metcalfe, D.B.; Weg, M.J.; Meir, P.; Silva-Espejo, J.E.; Huasco, W.H. Nutrient limitation in rainforests and cloud forests along a 3000-m elevation gradient in the peruvian andes. Oecologia 2013, 172, 889–902. [Google Scholar] [CrossRef]
- Soethe, N.; Lehmann, J.; Engels, C. Nutrient availability at different altitudes in a tropical montane forest in Ecuador. J. Trop. Ecol. 2008, 24, 397–406. [Google Scholar] [CrossRef] [Green Version]
- Zhao, N.; He, N.P.; Wang, Q.F.; Zhang, X.Y.; Wang, R.L.; Xu, Z.W.; Yu, G.R. The altitudinal patterns of leaf C:N:P stoichiometry are regulated by plant growth form, climate and soil on changbai mountain, China. PLoS ONE 2014, 9, e95196. [Google Scholar] [CrossRef]
- Zhao, H.; Xu, L.; Wang, Q.; Tian, J.; Tang, X.; Tang, Z.; Xie, Z.; He, N.; Yu, G. Spatial patterns and environmental factors influencing leaf carbon content in the forests and shrublands of China. J. Geogr. Sci. 2018, 28, 791–801. [Google Scholar] [CrossRef] [Green Version]
- Frenne, P.D.; Graae, B.J.; Rodríguez-Sánchez, F.; Kolb, A.; Chabrerie, O.; Decocq, G.; Kort, H.D.; Schrijver, A.D.; Diekmann, M.; Eriksson, O.; et al. Latitudinal gradients as natural laboratories to infer species’ responses to temperature. J. Ecol. 2013, 101, 784–795. [Google Scholar] [CrossRef]
- Schuur, E.A.G. The effect of water on decomposition dynamics in mesic to wet Hawaiian montane forests. Ecosystems 2001, 4, 259–273. [Google Scholar] [CrossRef]
- Zhang, Y.; Li, C.; Wang, M. Linkages of C: N: P stoichiometry between soil and leaf and their response to climatic factors along altitudinal gradients. J. Soils Sediment. 2019, 19, 1820–1829. [Google Scholar] [CrossRef]
- Wang, S.; Wang, W.; Gu, J.; Li, Z.; Wang, Y.; Yang, L. Lianas have a faster resource acquisition strategy than trees: Below-ground evidence from root traits, phylogeny and the root economics space. J. Ecol. 2022, 111, 436–448. [Google Scholar] [CrossRef]
- Kerkhoff, A.J.; Enquist, B.J.; Elser, J.J.; Fagan, W.F. Plant allometry, stoichiometry and the temperature-dependence of primary productivity. Glob. Ecol. Biogeogr. 2005, 14, 585–598. [Google Scholar] [CrossRef]


| Study Area | Wuzhishan | Danzhou | Changjiang | Tunchang | |
|---|---|---|---|---|---|
| Latitude | 18°55′45.46″ N | 18°47′40.22″ N | 19°30′50.94″ N | 19°07′21.87″ N | 19°27′48.29″ N |
| Longitude | 109°28′7.83″ E | 109°38′54.94″ E | 109°29′58.70″ E | 109°04′45.63″ E | 110°05′52.77″ E |
| Average Altitude (m) | 260 | 505 | 137 | 660 | 135 |
| MAT (°C) | 22.80 | 22.80 | 23.70 | 24.33 | 23.13 |
| MAP (mm) | 2080.95 | 2080.95 | 1934.99 | 1563.12 | 2105.15 |
| Average Sunshine Time (h) | 2000 | 1900 | 2300 | 2000 | |
| Soil Types | Yellow soil, Latosol | Latosol | |||
| Climate Type | Tropical alpine climate | Tropical monsoon climate | |||
| Study Area | Wuzhishan | Danzhou | Changjiang | Tunchang | |
|---|---|---|---|---|---|
| Life form | Woody plants | 58 | 83 | 62 | 44 |
| Herbs | 37 | 0 | 8 | 28 | |
| Vines | 7 | 0 | 13 | 5 | |
| Evergreen sample | 47 | 77 | 72 | 40 | |
| Deciduous plant sample | 18 | 6 | 3 | 9 | |
| Sample size | 102 | 83 | 83 | 77 | |
| Items | Mean | SD | Minimum | Maximum | CV (%) |
|---|---|---|---|---|---|
| N (mg g−1) | 3.80 | 0.20 | 0.16 | 16.39 | 5.26 |
| P (mg g−1) | 1.82 | 0.07 | 0.24 | 7.18 | 3.85 |
| C:N ratio (C:N) | 278.77 | 15.86 | 20.59 | 2865.25 | 5.69 |
| C:P ratio (C:P) | 390.69 | 15.15 | 47.47 | 1756.33 | 3.88 |
| N:P ratio (N:P) | 2.25 | 0.10 | 0.14 | 14.70 | 4.44 |
Disclaimer/Publisher’s Note: The statements, opinions and data contained in all publications are solely those of the individual author(s) and contributor(s) and not of MDPI and/or the editor(s). MDPI and/or the editor(s) disclaim responsibility for any injury to people or property resulting from any ideas, methods, instructions or products referred to in the content. |
© 2023 by the authors. Licensee MDPI, Basel, Switzerland. This article is an open access article distributed under the terms and conditions of the Creative Commons Attribution (CC BY) license (https://creativecommons.org/licenses/by/4.0/).
Share and Cite
Wang, J.; Liang, Y.; Wang, G.; Lin, X.; Liu, J.; Wang, H.; Chen, Z.; Wu, B. Leaf Nitrogen and Phosphorus Stoichiometry and Its Response to Geographical and Climatic Factors in a Tropical Region: Evidence from Hainan Island. Agronomy 2023, 13, 411. https://doi.org/10.3390/agronomy13020411
Wang J, Liang Y, Wang G, Lin X, Liu J, Wang H, Chen Z, Wu B. Leaf Nitrogen and Phosphorus Stoichiometry and Its Response to Geographical and Climatic Factors in a Tropical Region: Evidence from Hainan Island. Agronomy. 2023; 13(2):411. https://doi.org/10.3390/agronomy13020411
Chicago/Turabian StyleWang, Jingjing, Yongyi Liang, Guoan Wang, Xiaoyan Lin, Jiexi Liu, Hao Wang, Zixun Chen, and Bingsun Wu. 2023. "Leaf Nitrogen and Phosphorus Stoichiometry and Its Response to Geographical and Climatic Factors in a Tropical Region: Evidence from Hainan Island" Agronomy 13, no. 2: 411. https://doi.org/10.3390/agronomy13020411