Article

Extraction of Information on the Flooding Extent of Agricultural Land in Henan Province Based on Multi-Source Remote Sensing Images and Google Earth Engine

1
School of Resources and Environment, Henan Agricultural University, Zhengzhou 450002, China
2
Human Engineering Research Center of Land Consolidation and Ecological Restoration, Henan Agricultural University, Zhengzhou 450002, China
*
Author to whom correspondence should be addressed.
Agronomy 2023, 13(2), 355; https://doi.org/10.3390/agronomy13020355
Submission received: 28 December 2022 / Revised: 19 January 2023 / Accepted: 23 January 2023 / Published: 26 January 2023
(This article belongs to the Special Issue Cultivated Land Sustainability in the Anthropocene)

Abstract

:
Sudden flood disasters cause serious damage to agricultural production. Rapidly extracting information such as the flooding extent of agricultural land and capturing the influence of flooding on crops provides important guidelines for estimating the flood-affected area, promoting post-disaster farmland restoration, and providing an auxiliary decision-making basis for flood prevention and disaster relief departments. Taking the flood event in Henan and Shanxi Provinces as example, based on the characteristics of the variations in radar data and optical data before and after the disaster, we propose an extent information extraction method for the flood inundation area and the flood-affected area of agricultural land. This method consists of change detection, threshold extraction, and superposition analysis, which weakens the negative impact of the radar data speckle noise and cloud contamination of the optical data on the extraction of the agricultural land flooding to a certain extent. The method was developed based on a flood event in Henan Province and validated in Shanxi Province. The results show that the production of this method have a clear boundary and accurate extent, and the overall precisions of the flood inundation area and flood-affected area extraction are 0.87 and 0.92, respectively. The proposed method combines the advantages of both radar and optical remote sensing data in extracting the specific extents of the flood inundation area and the flood-affected area in large spatial scale. Finally, the impact of time window size to the performance of the method is further analyzed. In the application of the proposed method, the Google Earth Engine (GEE) platform provides a low-cost, fast, and convenient way to extract flood information from remote sensing data. The proposed scheme provides a scientific data basis for restoring production of agricultural land after a flood disaster, as well as for national post-disaster damage assessment and disaster relief decision making.

1. Introduction

In the context of global climate change, the increasing number of extreme weather events pose a serious threat to habitat functionality and human health [1]. Floods, account for 40% of annual global losses from natural disasters [2], are common in Asia because the growing season of main crops overlaps with the monsoon season [3]. Agricultural production is vulnerable to destructive flooding due to the monospecificity of the ecosystem and the large scale of agricultural production [4]. In the event of a flood, it is of great importance to extract the information about the water bodies quickly, dynamically, and accurately to determine the extent of the flood inundation and the degree of damage. These measures provide detailed and accurate information for governments at all levels and the relevant departments to take effective measures to carry out rescue work. They will also provide a scientific basis for after-flood scheduling and disaster mitigation decisions [5].
Traditional methods of collecting hydrological information are time consuming and labor intensive. This makes it difficult to meet the need of flood analysis and assessment [6]. With the development of satellite remote sensing technology, the cost of obtaining data has been significantly reduced, and remote sensing technology has become a commonly used flood monitoring method [7,8]. It provides a clear spatio-temporal framework for detecting the extent of flooding [9,10,11,12], measuring flood severity [13,14,15], and assessing flood damage [16,17,18,19,20,21,22,23,24,25,26,27].
Many flood extraction studies have been conducted by previous researchers using remote sensing technology and a number of research results have been achieved. The data sources for extracting flood information mainly include two types of satellite data: synthetic aperture radar (SAR) images [28,29,30,31,32,33] and optical images [34,35,36]. The main methods for extracting water body information based on SAR images are the threshold-based method [37], digital elevation model (DEM)-assisted extraction [38], and texture-based extraction [39], among which the threshold method is simple and easy to implement and has been widely used. For example, Guo et al. used image binarization to segment the time-series SAR data to achieve spatio-temporal distribution mapping of water bodies to extract their seasonal coverage and finally to achieve dynamic flood monitoring in the middle and lower reaches of the Yangtze River [40]. However, this method is suitable for images with a bimodal histogram, which is difficult for images that covering large areas. Radar image is also widely used in flood monitoring [41], for example by constructing disparity maps and classifying them to extract the extent of flood inundation [42,43]. This method is affected by the coherent noise of SAR images and has limited detection accuracy. The advantage of radar data is that it can penetrate clouds and capture high-precision images at all times, and over a wide area, in all weather conditions. However, radar data cause more speckle noise in the imaging, leading to information losses and distortions in its application [44]. In addition, radar data is good for extracting flooded areas, but it has a limited ability to extract silted areas where flooding has occurred [21]. The advantages of optical data are the intuitive imaging of the optical sensors, higher image quality and rich spectral information, highlighting the information about the inundated areas and silted areas of the flood transit through the spectral index. However, optical data require good weather conditions after heavy rains leads to missing data for some areas. Moreover, continuous cloud cover leads to larger errors in the extraction of the inundation duration in the covered area [45]. Therefore, a SAR-optical combined flood monitoring is in need.
In addition, previous studies have focused more on the extraction of flood-inundated areas [46,47]. Besides of that, flood-affected areas are also important information for cultivated land as a basis for an in-depth analysis of the growth status of crops that are affected by different levels of flooding. Therefore, a comprehensive study of simultaneously extraction of flood-inundated and flood-affected areas is required.
At the same time, it is also necessary to avoid problems such as untimely monitoring of floods due to different data sources and processing methods. The rapidly evolving cloud platforms such as Google Earth Engine (GEE), which provide powerful support for collecting, processing, computation, and analyzing massive remote sensing data, have become a powerful tool in geology-related research [48,49,50,51]. It provides strong support for large-scale remote sensing flood monitoring utilizing multi-source images.
Therefore, the objectives of this study were to (1) make full use of the respective advantages of radar and optical data to quickly extract the flood-affected area extent of agricultural land; (2) to determine the accuracy and applicability of the method; and (3) to determine the growth status of the crops affected by the floods. With a focus on these goals, we developed a framework for mapping flood-affected agricultural land using the GEE platform, imagery from Sentinel 1 and Moderate Resolution Imaging Spectroradiometer (MODIS) to determine the extent of the inundated agricultural land after a flood. The extraction method combines SAR and optical images, increasing the accuracy of the flood information extraction and reducing the errors caused by random errors and cloud contamination. The proposed method fully exploits the data from multi-source data in GEE to provide data support for post-disaster management of flooded agricultural land in a convenient and real-time manner.
The rest of this paper is organized as follows. Section 2 presents the materials and methods involved in this research. The method was established using flood events in Henan Province, and those in Shanxi Province are used as an independent data for validation. Section 3 shows the results of agricultural land flood inundation areas and flood-affected areas in Henan and Shanxi Provinces and their performance. Section 4 discusses the effect of time window size in the extraction of flood information, the growing condition of crops under the influence of floods, flood-induced late-sown of winter wheat, and the limitations and prospects of this research. Section 5 concludes this paper.

2. Materials and Methods
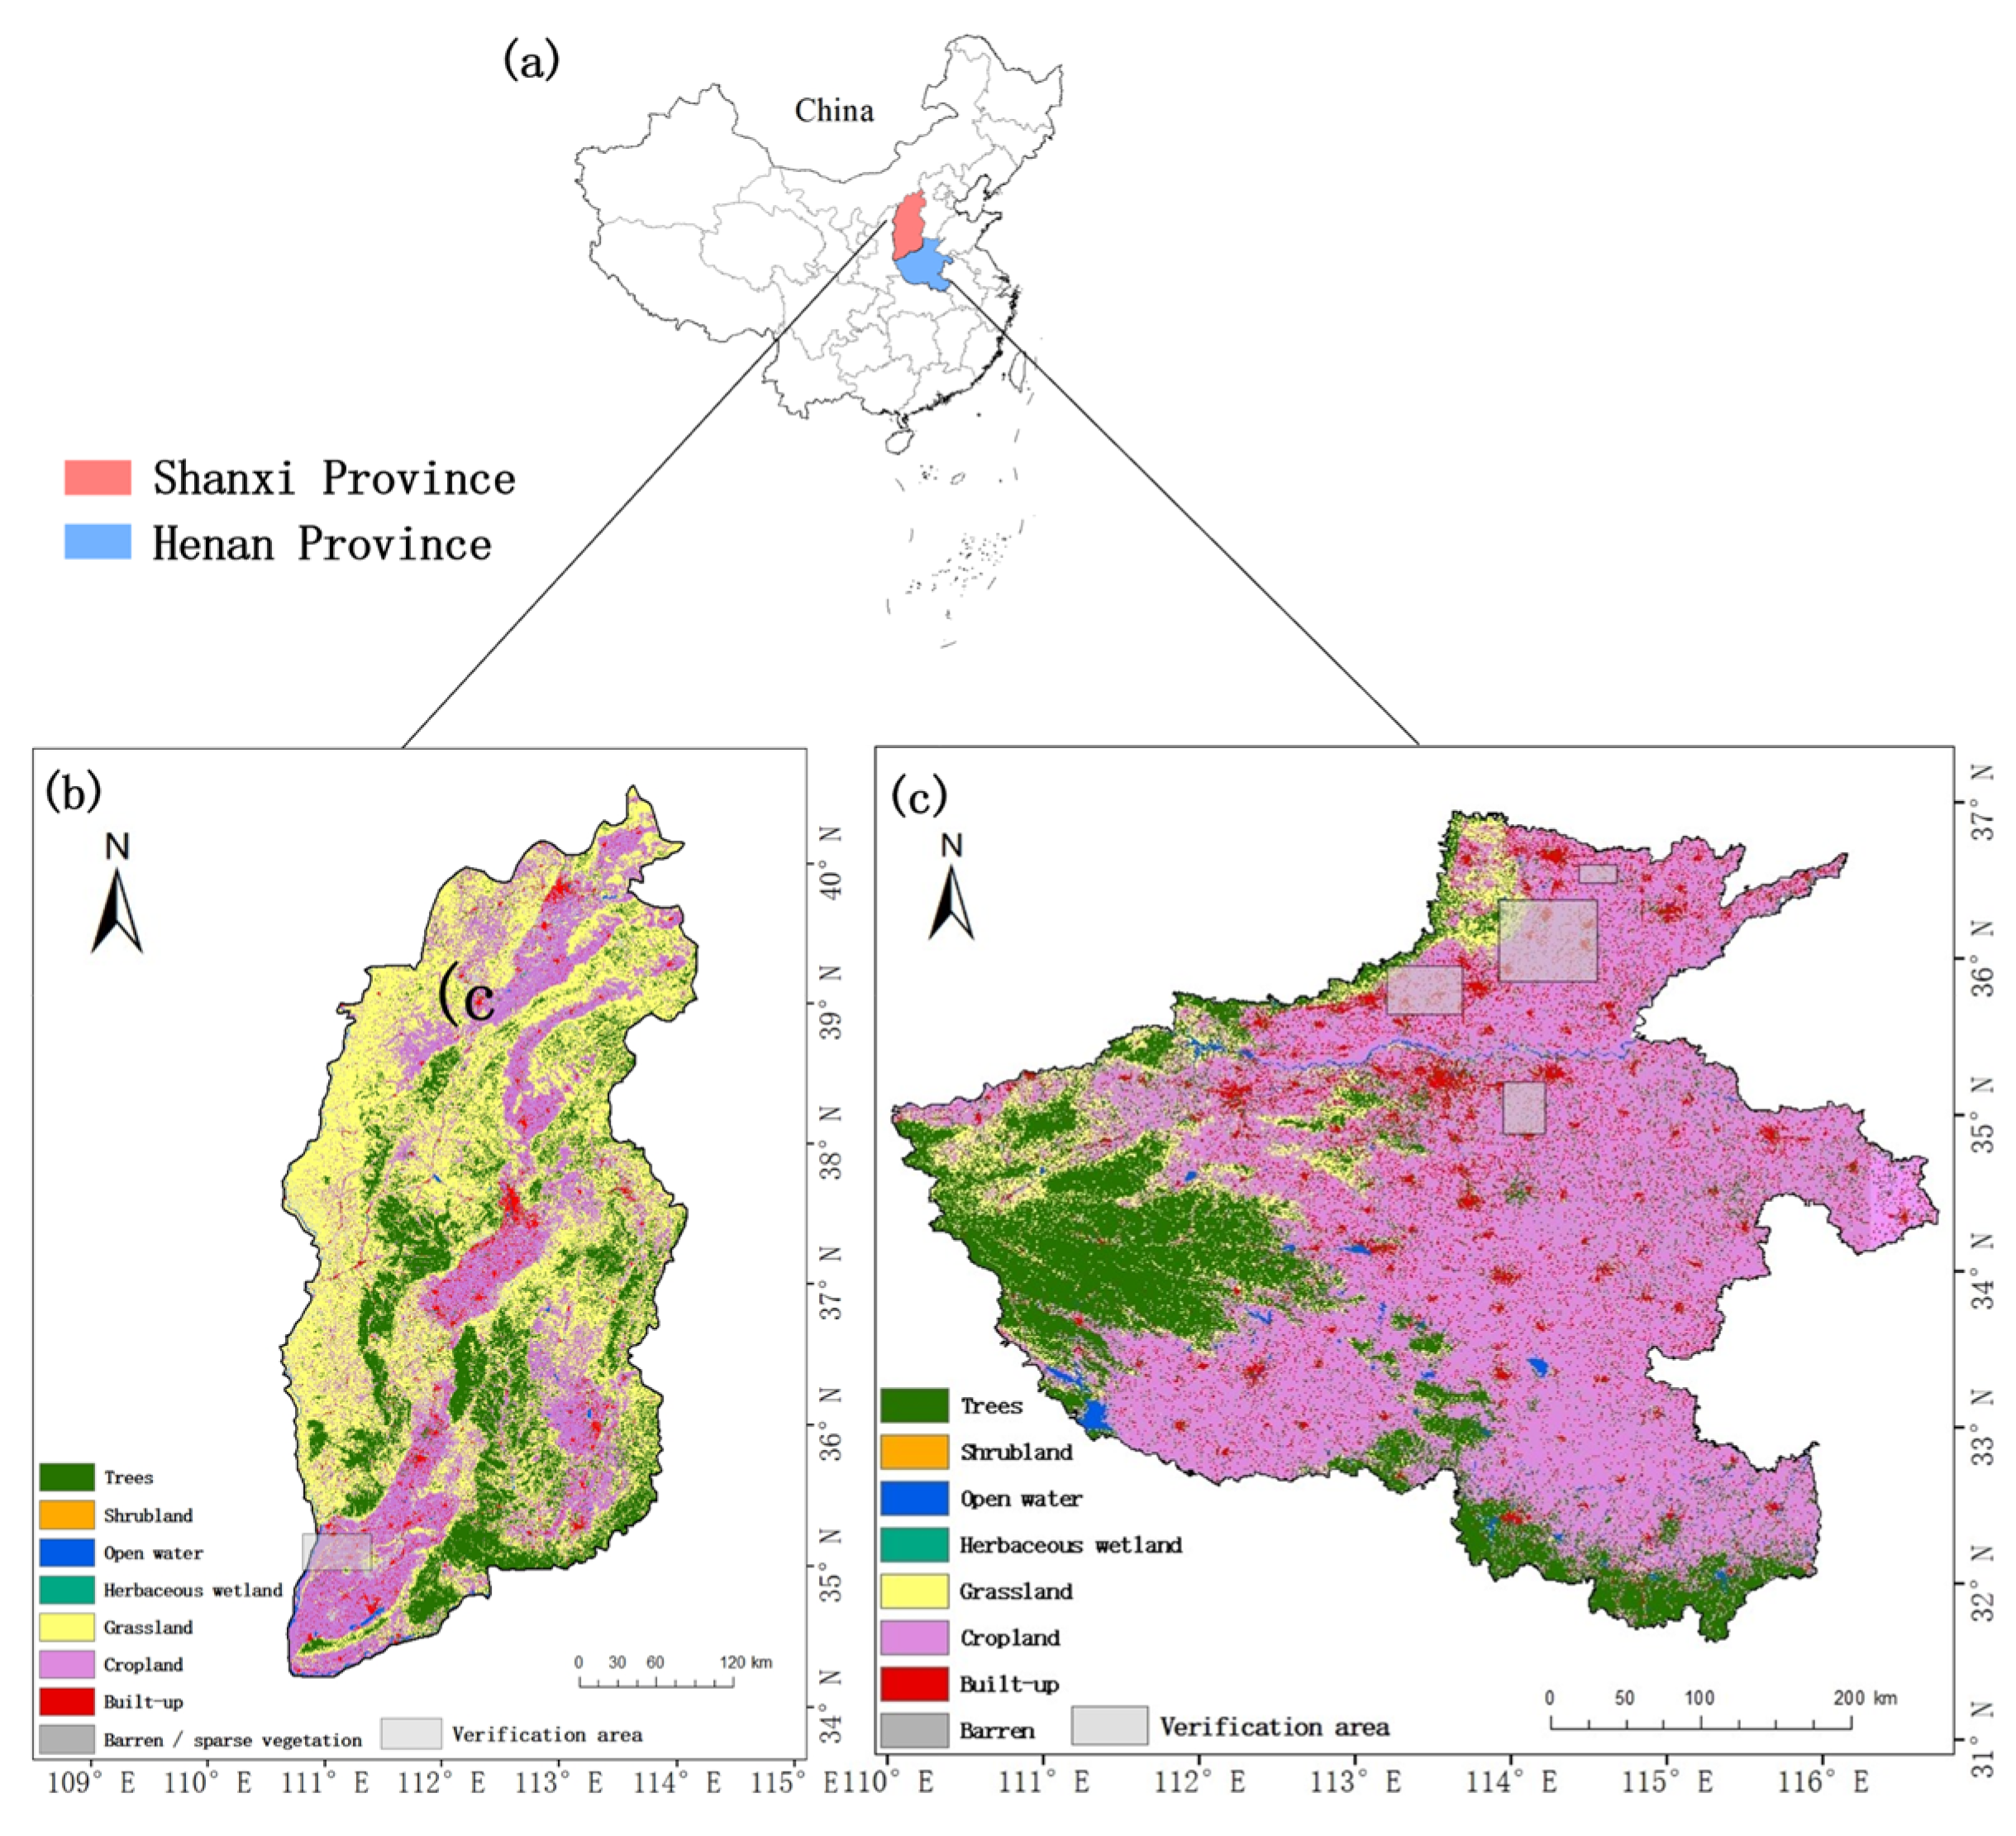
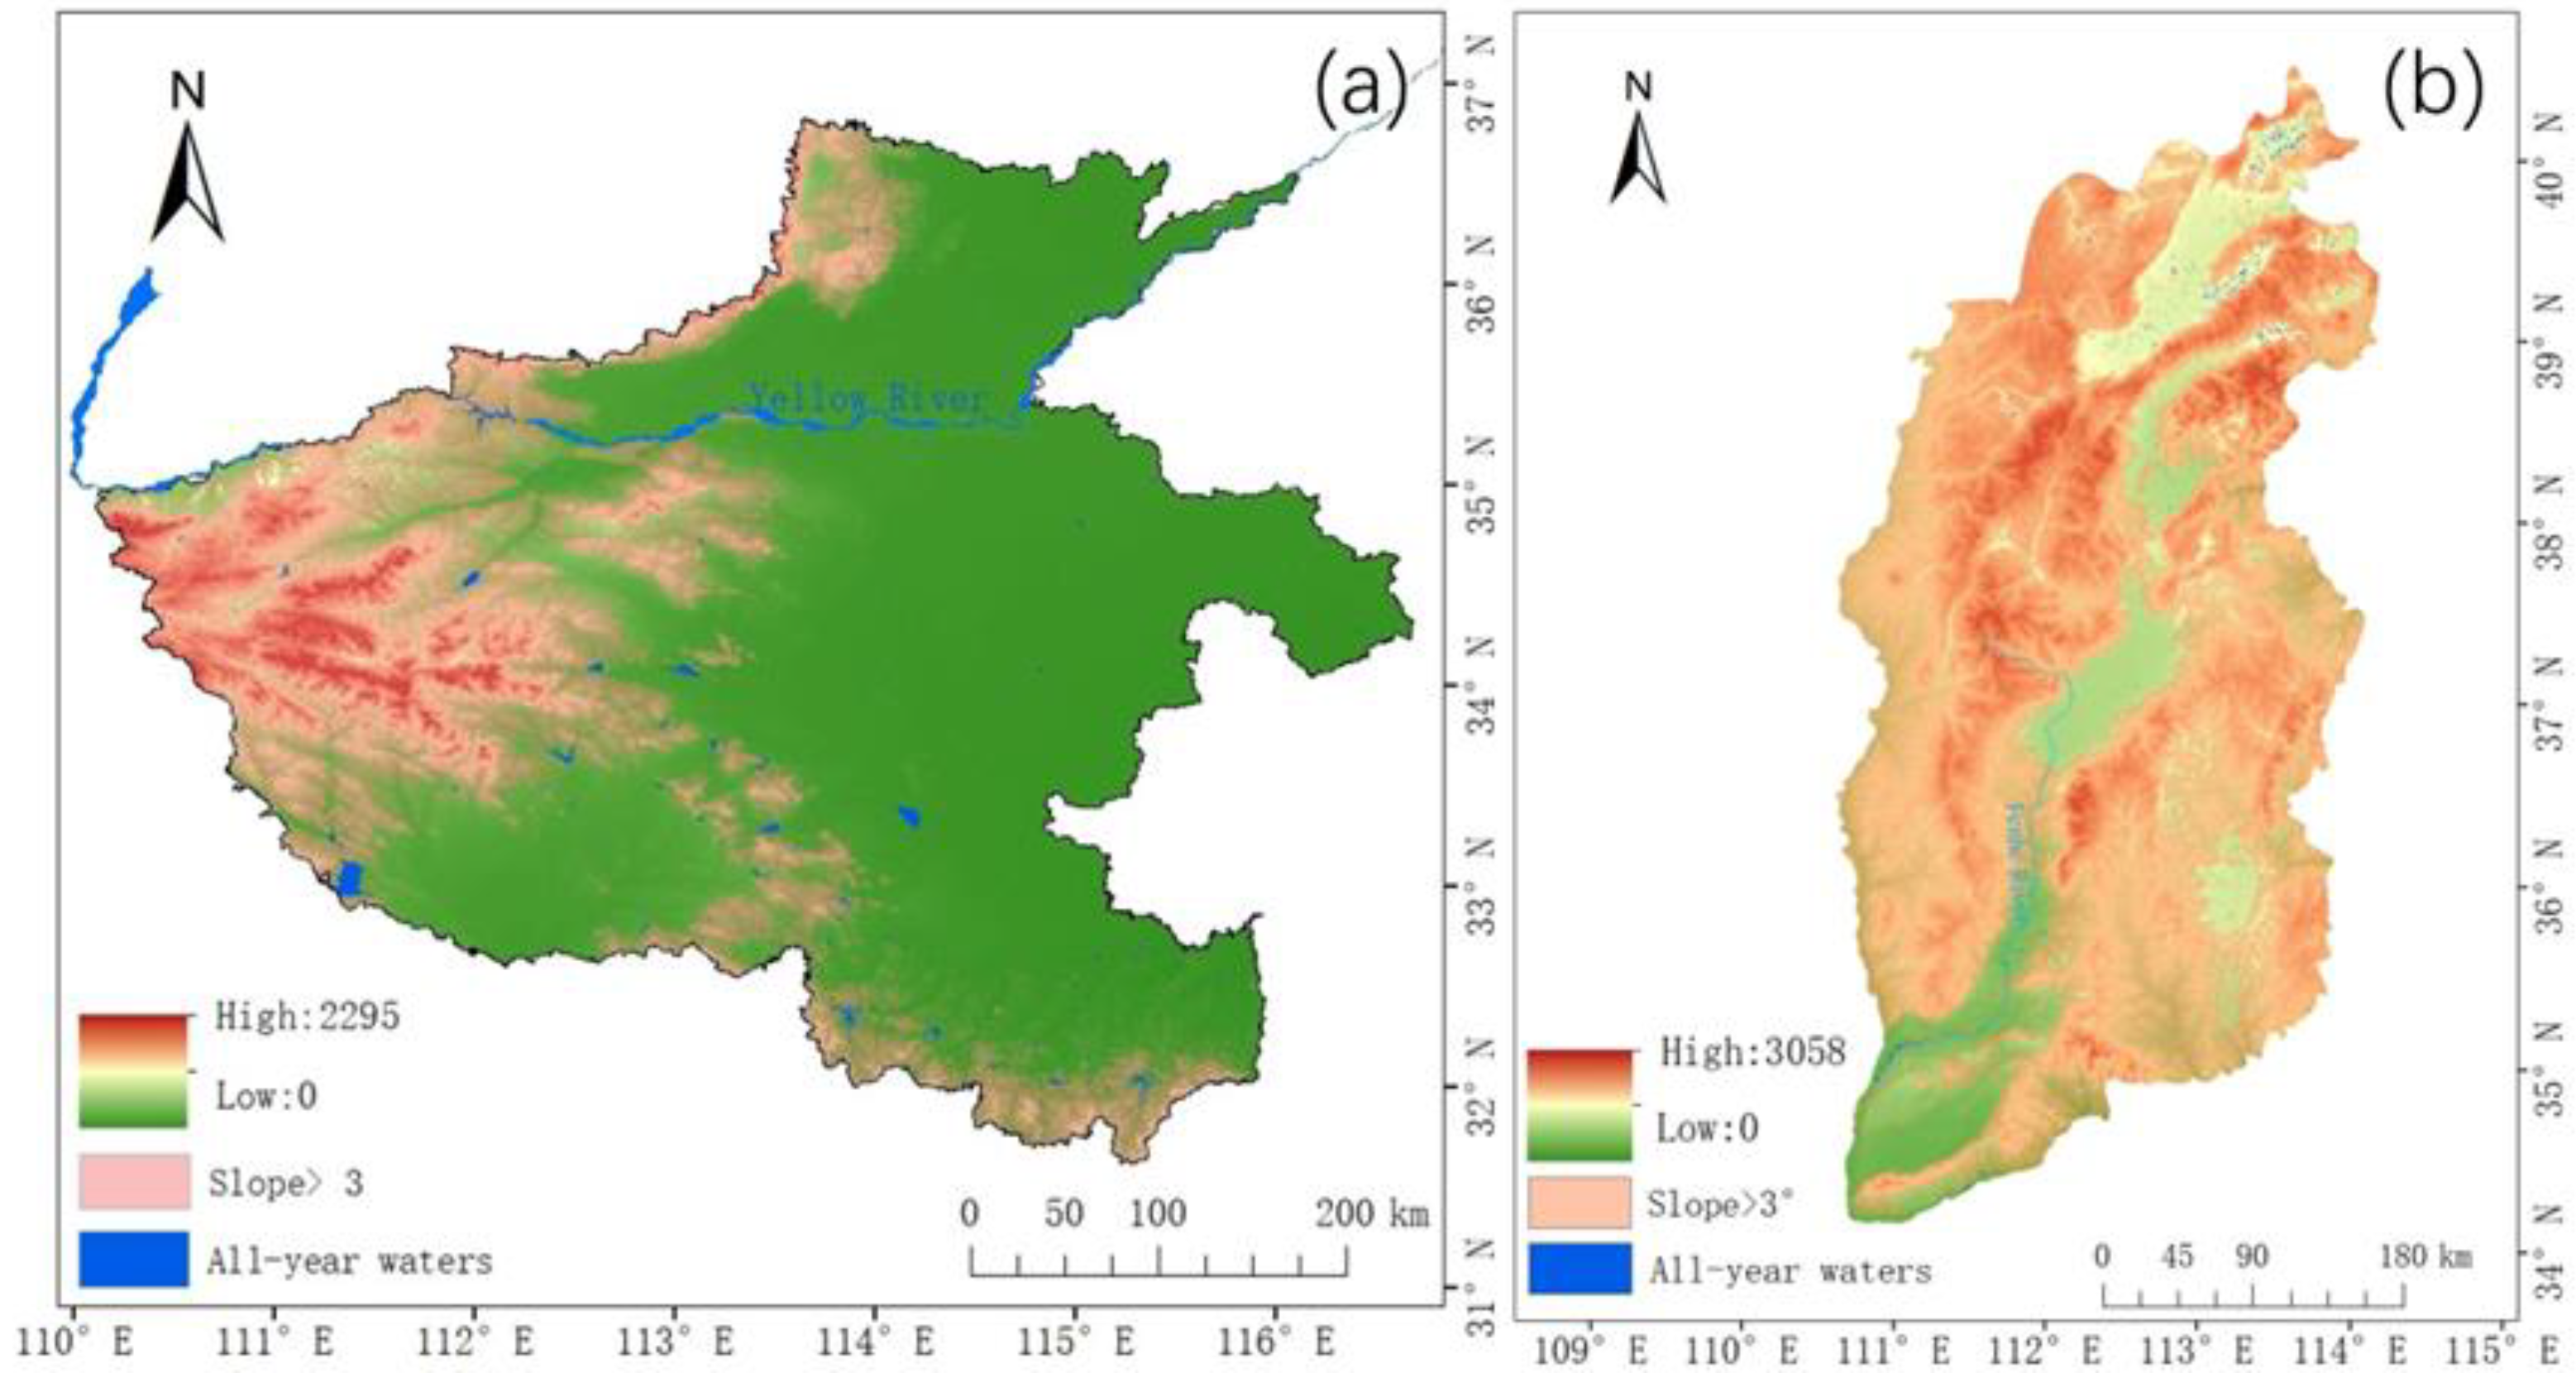
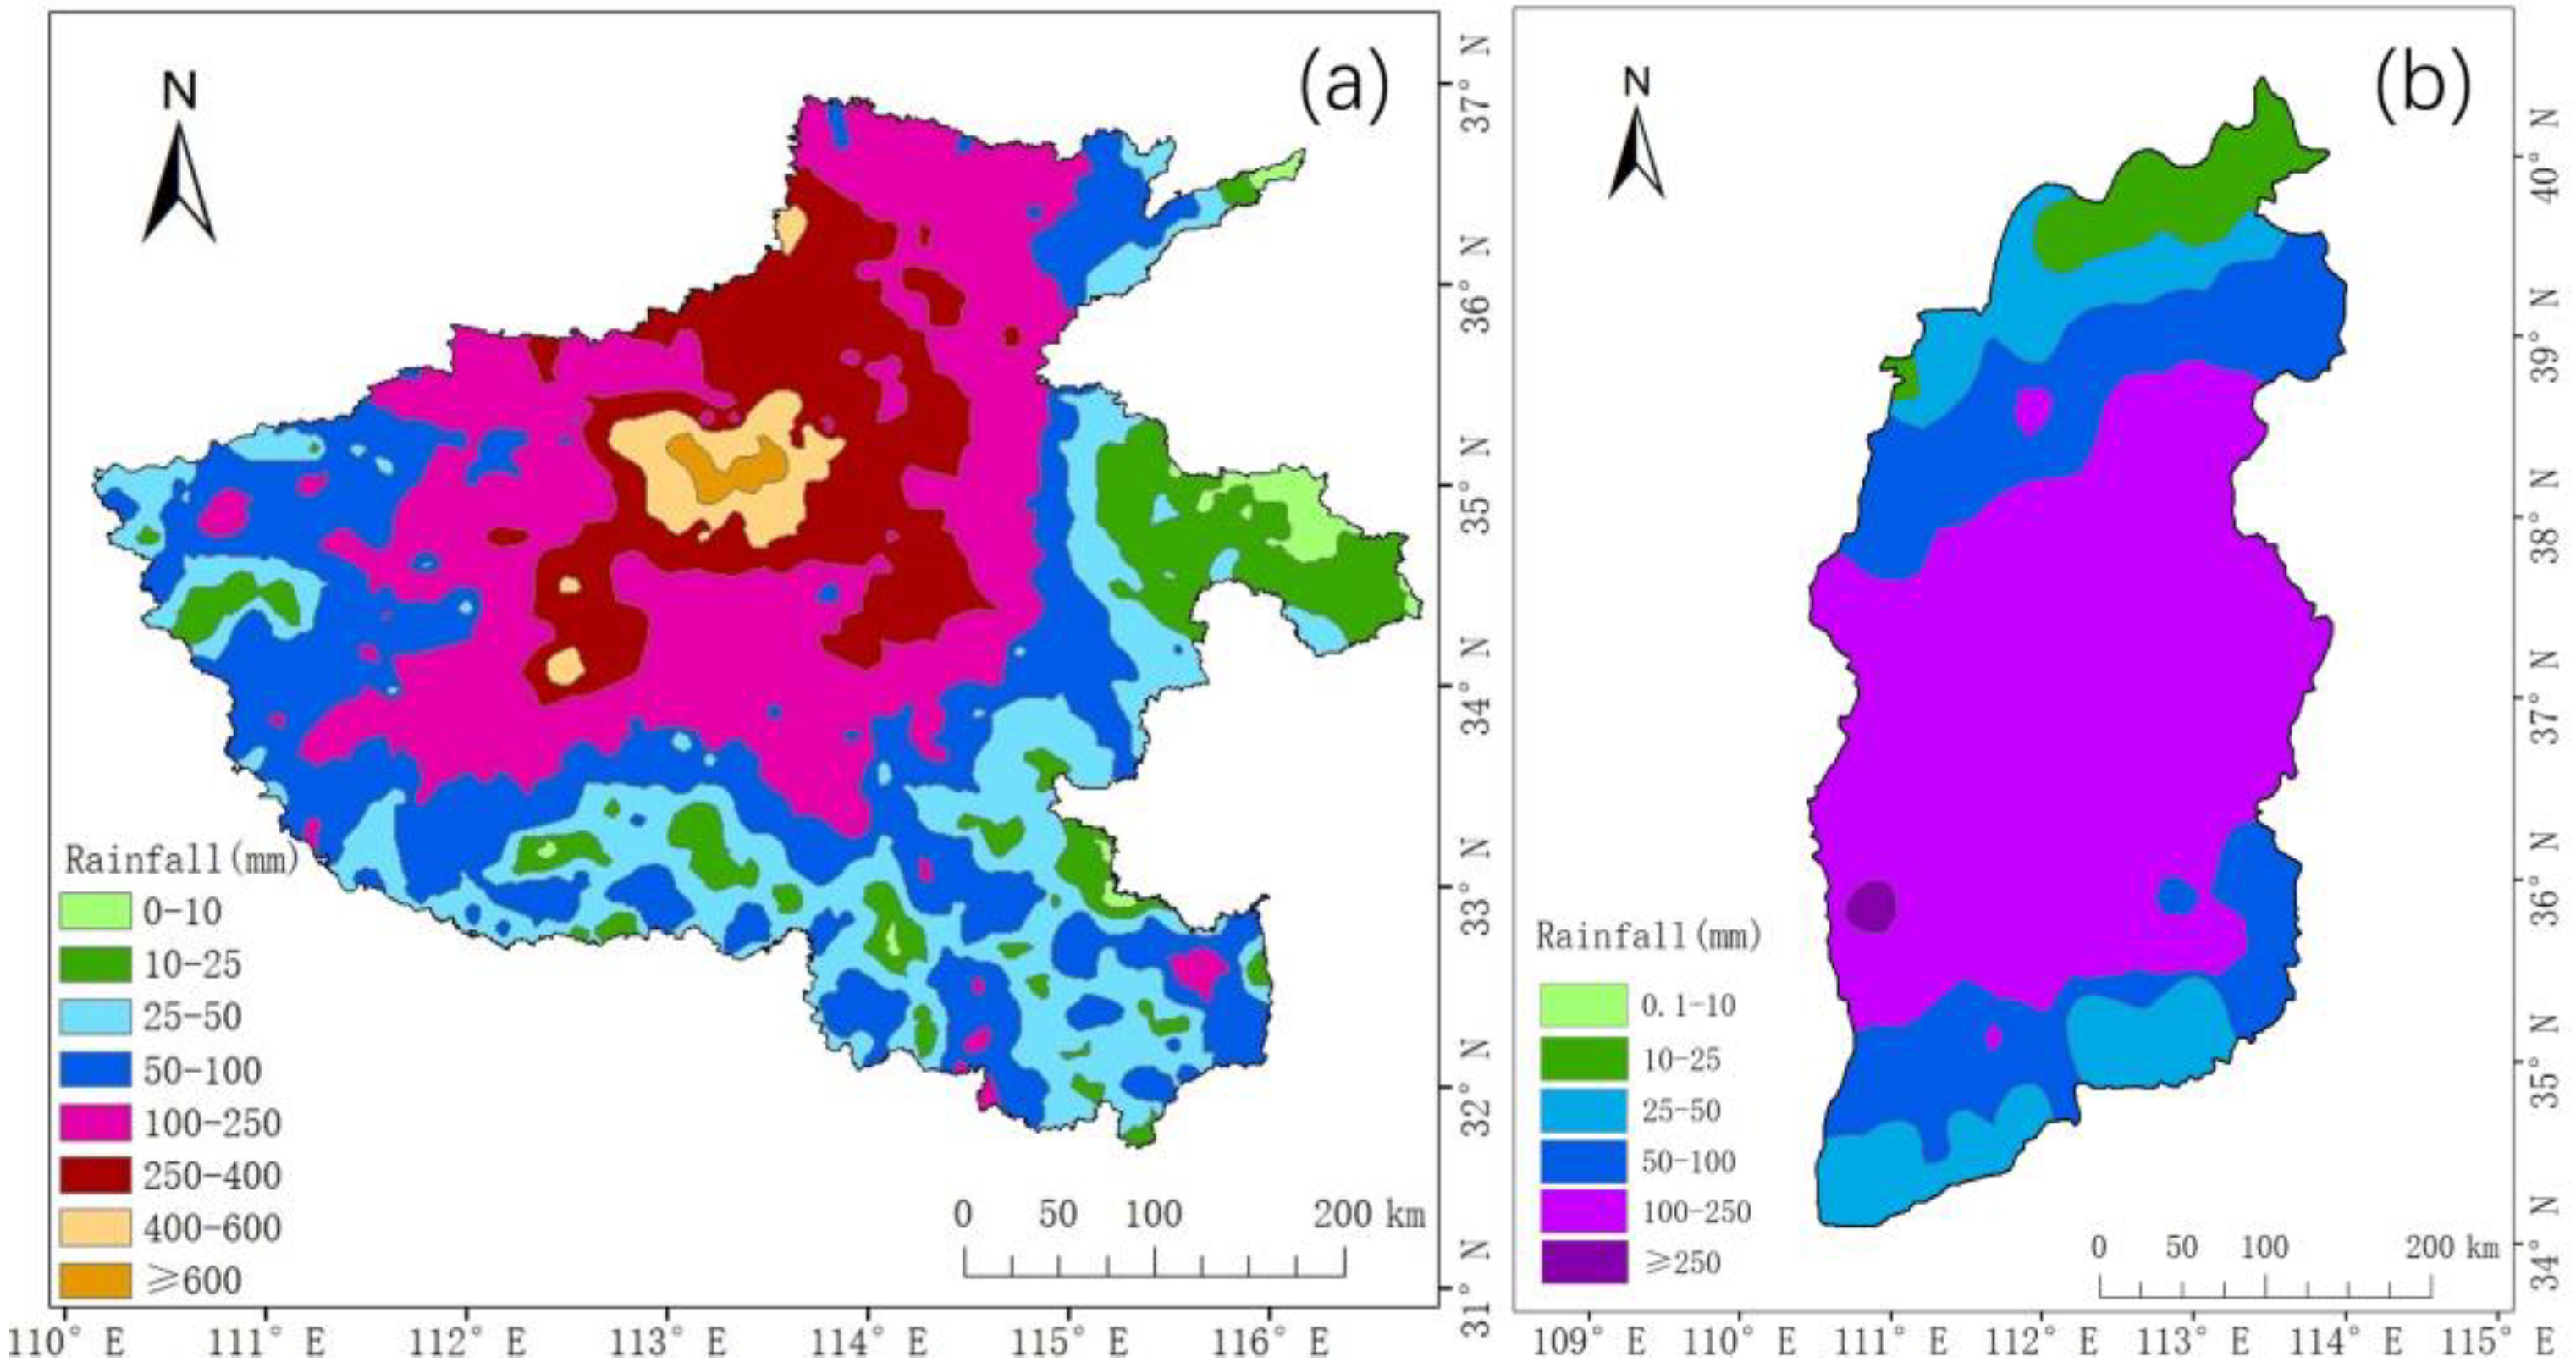
2.1. Study Area

In this study, Henan and Shanxi Provinces were selected as typical study areas. Henan is one of the most important agricultural provinces in central China. The agricultural area are concentrated in the central and eastern regions (Figure 1c) Overall, its topography is high in the west and low in the east (Figure 2a), as well as superior agricultural growing conditions. Most of Henan is in the warm temperate zone, and the southern part of the province is subtropical with four distinct seasons. Henan is an important agricultural food producing province in China, with 11,832,000 hectares of agricultural land in the province, accounting for 71.48% of the province’s total land area.
The topography of Shanxi Province is high in the northeast and low in the southwest (Figure 2b), with a parallelogram outline tilted slightly to the northeast (Figure 1b). The landscape is dominated by mountains and hills, and the eastern and western sides of Shanxi are mountainous, so the agricultural areas in Shanxi Province are mainly distributed in the central and southwestern valleys and plains.
From 17–27 July 2021, Henan Province experienced a rare heavy rainfall event with long duration, high cumulative precipitation, and concentrated and widespread heavy rain spells (Figure 3a, Figure S1). Data from national meteorological observation stations in several cities exceeded historical extreme daily precipitation values since those stations were established. The rains caused urban waterlogging and geological catastrophes from mountain streams, causing significant social impact and loss of life and property [52].
From 2–7 October 2021, Shanxi Province experienced large-scale heavy precipitation occurred in, with the province’s precipitation ranging from 15.4 mm to 285.2 mm (Figure 3b). The maximum precipitation occurred in Daning County, Linfen, with 18 of the province’s 117 counties (cities and districts) receiving more than 200 mm of precipitation. Most areas set records for cumulative rainfall in the first half of October.
Continuous heavy rains prevents rainwater from infiltrating in time to prevent surface runoff, forming rainwater collection in the areas of low terrain and topographical enclosures. This water cannot drain away and spread in a short time. Agricultural floods cause inundation of agricultural land and destruction of crops, resulting in reduction or even total loss of crops. Compared to the time before the flood, the flood leads to an expansion of the water bodies and inundation of the surface, i.e., the flood-inundated area (Figure 4a). Moreover, the area in which the additional soil moisture forms silt but no water collects on the surface is called the flood-affected area (Figure 4b).

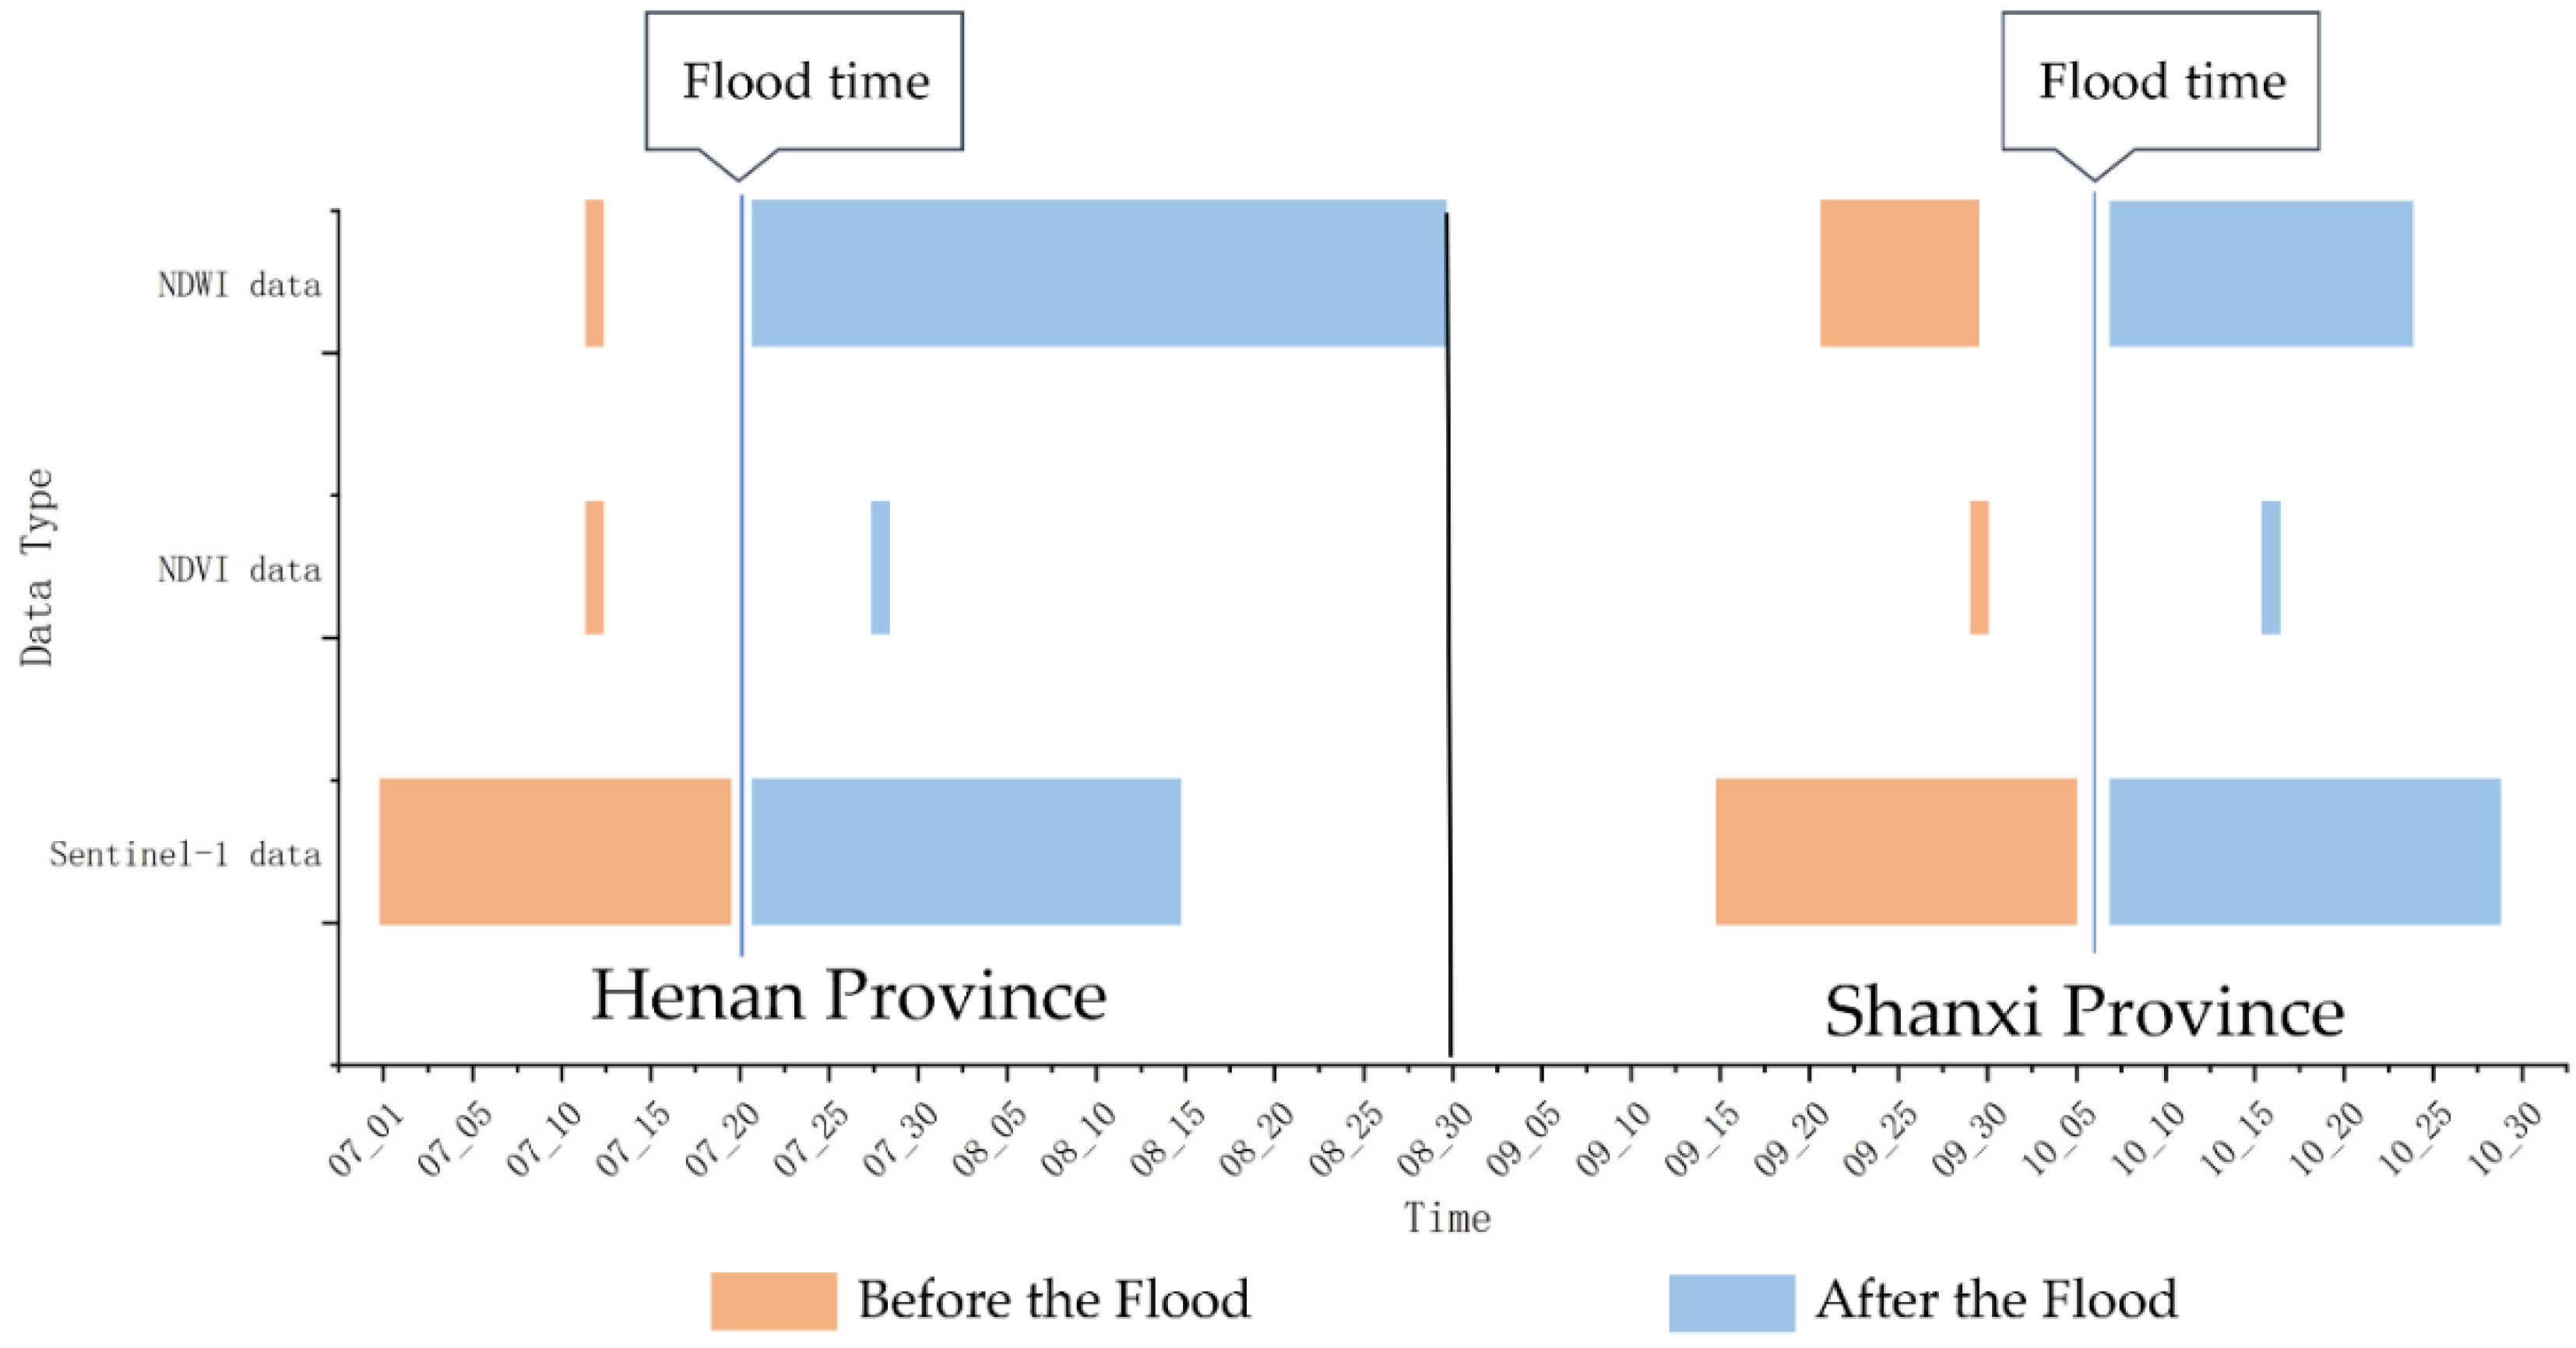
2.2. Data Sources and Processing

2.2.1. Sentinel-1 Images and Preprocessing

Sentinel-1, which was launched by the European Space Agency (ESA), is an imaging radar mission with a bipolar orbiting satellite with a spatial resolution of 10 m, an orbital altitude of approximately 700 km, and a revisit period of 12 days (Table 1). It provides c-band images with a combination of all-weather, day and night quad-modal data. Among them, the ground range detected (GRD) first-class product provides data from the dual-polarization c-band SAR instrument. According to previous studies, VV polarization image is better for flood monitoring due to the water bodies have a lower backscattering coefficient and appear dark black in single-polarized radar images, while land has a stronger backscattering coefficient and appears grayish white. The VV polarization is also more sensitive to surface roughness. This is very helpful for identifying semi-inundated agricultural fields during floods [53,54]. In this study, the VV single co-polarization of the Sentinel-1 data was used for the change detection to extract the flood inundation area.
Coherent speckle noise in the images, which due to the coherent wave characteristics in the advanced synthetic aperture radar (ASAR) imaging process, seriously degrades the image quality and reduces the target extraction ability [55]. In this study, refined-Lee filtering [56] was performed on the Sentinel-1 images to reduce noise.
In addition, in order to achieve enough spatial coverage, a specific period before and after the flood was selected as the time window. After that, the image maps of the entire study area before and after the flood were synthesized. When stitching the images, to further control the errors, a 0.9 quantile of all available data at each pixel was selected as the final result. In this study, a total of 21 images from 1 to 19 July 2021 were selected for the pre-flood data and a total of 29 images from 20 July to 15 August 2021 were selected as after-flood data (Figure 5). The detailed influence of time window size will be discussed in Section 4.2.

2.2.2. MODIS Images and Preprocessing

In this study, the normalized difference vegetation index (NDVI) product (MOD13Q1) and the surface reflectance product (MYD09A1) of MODIS were used to extract the flood information via change detection (Table 1), with a spatial resolution of 250 m. The NDVI product was used to highlight the vegetation growth, and the surface reflectance product was used to calculate the normalized difference water index (NDWI) to highlight the surface flood inundation information using the following equation.
NDWI = ρ Green ρ NIR ρ Green + ρ NIR
where: ρ Green and ρ NIR are the reflectance in the green band and near-infrared band, respectively.
In order to reduce the influence of the systematic bias on the results, the NDVI and NDWI index data were standardized to accommodate multi-temporal data as follows
X ij = X ij minX ij maxX ij minX ij
where: X ij denotes the original NDVI or NDWI value; X ij denotes the NDVI or NDWI value after standardization; minX ij denotes the minimum NDVI or NDWI value in the original dataset; and maxX ij denotes the maximum NDVI or NDWI value in the original dataset.
Similar to the Sentinel-1 images, cloud masking, stitching, and cropping were also performed on the MODIS images at different image time window in order to obtain an image with full coverage. For the NDVI images, Two MODIS product images for 12 July 2021 (before the flood), and 28 July 2021 (after the flood), were used as the database for extracting the NDVI values. For the NDWI images, five images from 12 July 2021 (before the flood), and from 20 July to 30 August 2021 (after the flood), were selected as the database for extracting the NDWI indexes, and the mean values of the three images taken after the flood were calculated to obtain the final NDWI index data (Figure 5). The detailed effect of the time window size to the extraction result is discussed in Section 4.1.

2.2.3. Other Supporting Data and Processing

The ESA World Cover product is the ESA’s 2020 global land cover map based on Sentinel-1 and Sentinel-2 data, with a 10-m resolution (Table 1). The World Cover product includes 11 land cover categories and was used in this study to extract the extent of the agricultural land.
The JRC/GSW1_0/Global Surface Water dataset contains maps of the spatial and temporal distributions of the global surface water and provides statistical data on the extent and variability of these water areas with a spatial resolution of 30 m (Table 1). In this study, the permanent water bodies were excluded using the monthly band data reflecting the presence of water. We treat the pixels whose water temporal coverage is greater than 10 months as permanent water pixels and excluded.
The Shuttle Radar Topography Mission (SRTM) digital elevation dataset, which was generated to provide consistent, high-quality elevation data on a global scale with a spatial resolution of 90 m (Table 1), was applied in this study to extract the regional extent of the area with large slopes. The slope was calculated as
  X = H L
where: X denotes the slope; H denotes difference in elevation; and L denotes the distance travelled. The slope calculation module was integrated in GEE platform and easy to be applied. Considering the topographic factors in the flooded area, because the method used to obtain radar images has the unique fore-shorting, layover, and shadow phenomenon [57] in some mountainous areas, according to the topographic characteristics of Henan Province, the areas with slopes of greater than 3° were excluded.
The Sentinel-2 multispectral data with a spatial resolution of 10 m were used for the precision validation (Table 1).

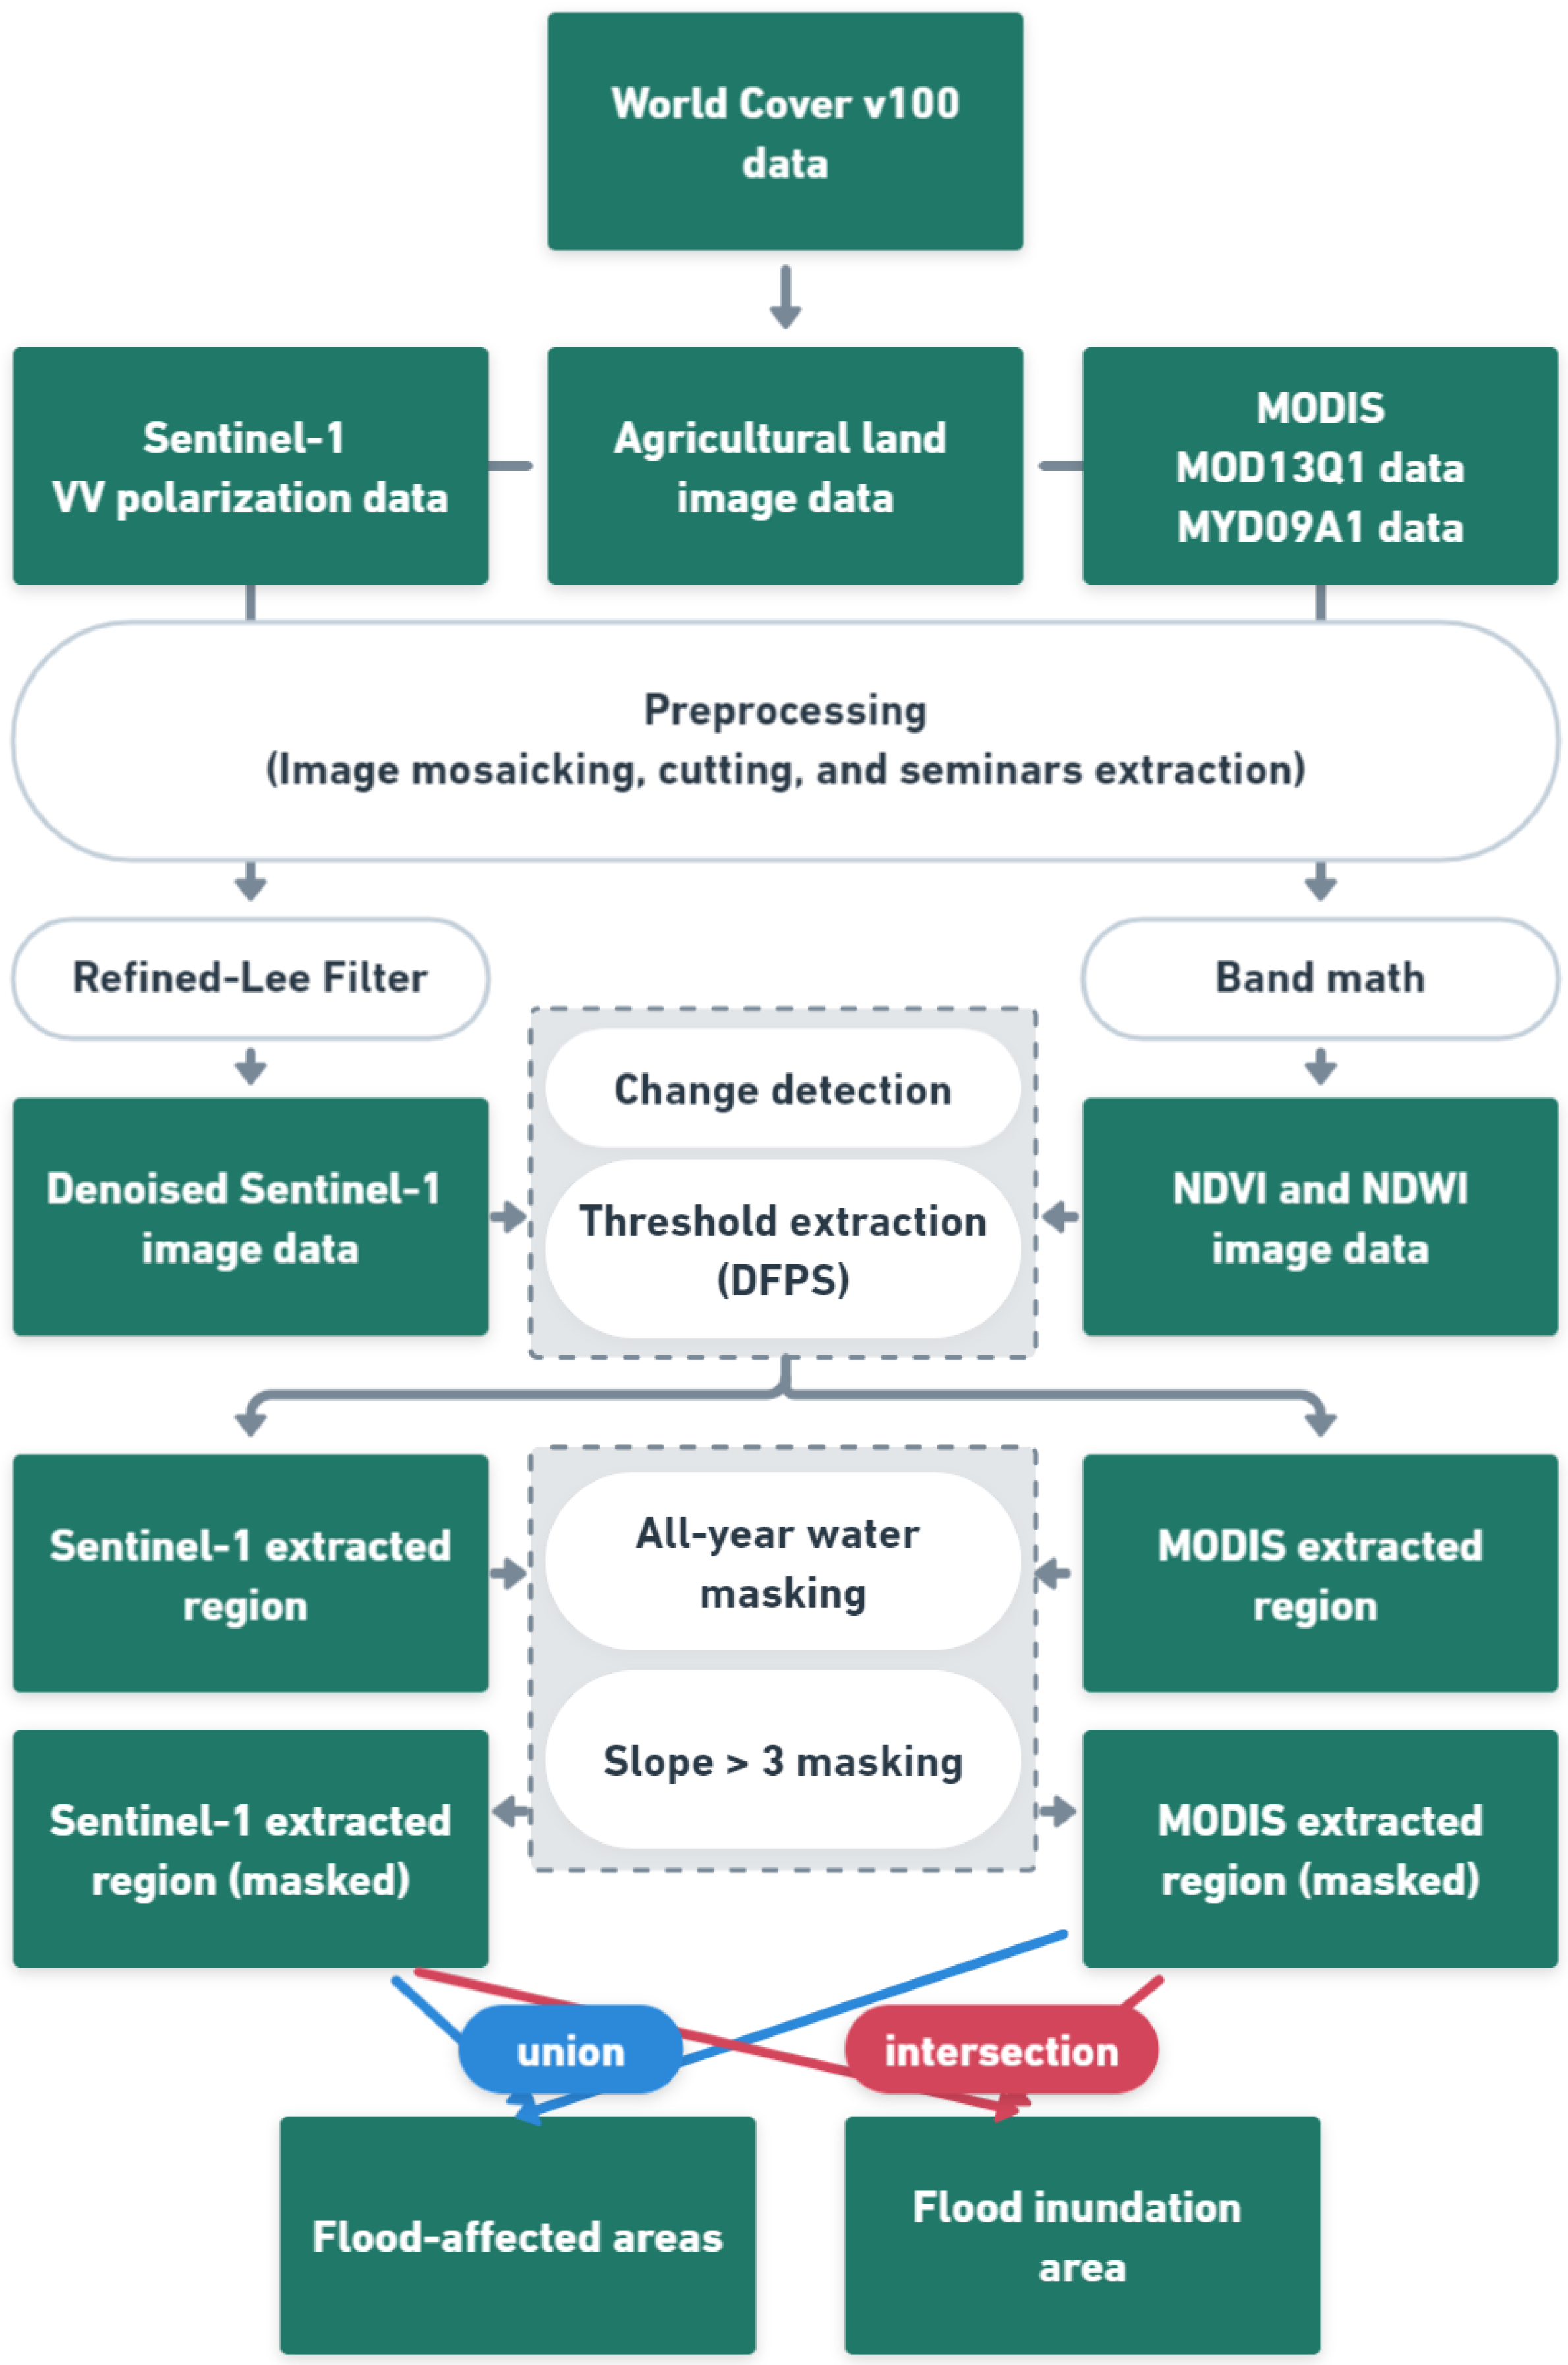
2.3. Flood Extraction Method

2.3.1. Technical Route

Figure 6 shows the technical workflow of this study. First, the Sentinel-1 and MODIS image data was acquired for preprocessing, including mosaicking and cutting. The preprocessed results were subsequently masked by all-year water and high slope (slope higher than 3°) regions. After that, the refined-Lee filter was applied on Sentinel-1 data for denoising, and band math was applied to MODIS data for generating NDVI and NDWI images. Then, change detection was performed on the multi-source images acquired before and after the flood to obtain the difference image. The optimal thresholds for each index were calculated using the Double-window Flexible Pace Search (DFPS) threshold determination method, and the flood extraction results of the radar data. We did not use the classic histogram-based extraction method mainly because of the area of flood regions are relatively small compared with the whole study area. The bimodal histogram is blurry and flood information is indistinguishable (Figure S2). Finally, the intersection image of the Sentinel-1 extraction results and the MODIS extraction results was the flood inundation area, and the combined image of them was the flood-affected area.
The core concept of flood inundation area and flood-affected area is as follows: For the areas that were severely affected by the flood process, the water surface signal is evident on both Sentinel-1 images before and after the flood. This means the regions were continually inundated and the crops growing will be surely influenced and captured by MODIS images. These areas were defined as flood inundation areas. The extraction rule of these region is an intersection of Sentinel-1 extracted and MODIS extracted results. For other slighter affected regions that became silt for the Sentinel-1 images in the after-flood scene, the crop growing might also be influenced by the laten broadcast. Combined with the first type of regions, these regions were defined as flood-affected area and their extraction rules are a union of Sentinel-1 and MODIS extracted results.
In order to verify the precision and portability of the developed method, four seriously flooded regions (Figure 1c), were selected to evaluate the precision of the extraction results. The flood events in Shanxi Province were used for testing.

2.3.2. Change Detection

Using a simple change detection method, we obtained the difference map by determining the difference between the two images before and after the flood. The calculation is as follows
        DI sub = I 1 I 2
where: DI sub is the difference image, and I 1 and I 2 denote the two images obtained in different time windows. In this study, the difference image calculations were performed on the NDVI, NDWI and radar images.

2.3.3. Threshold Extraction

Based on the difference images, the flood area extraction was completed by choosing an appropriate threshold. In this study, a two-window variable-step threshold search method was used to determine the flood extraction thresholds [58]. The basic assumption of this method is that if a certain threshold is determined to maximize the change detection precision for a typical change training sample area containing different change types, then this threshold can also maximize the detection precision for the entire-view in the image (Figure 7). With this method, the threshold value can be determine quickly and precisely using the prior knowledge of the interpreter.

2.3.4. Image Resampling

The study involves data with many different spatial resolutions. A proper way to unify spatial scales of multisource image data is needed for our method. The GEE platform-based method used in this study is the nearest neighbor assignment method. This method only changes the spatial scales of the pixels without changing their values and does not introduce extra errors into the method. The maximum spatial error is half the size of the image element.

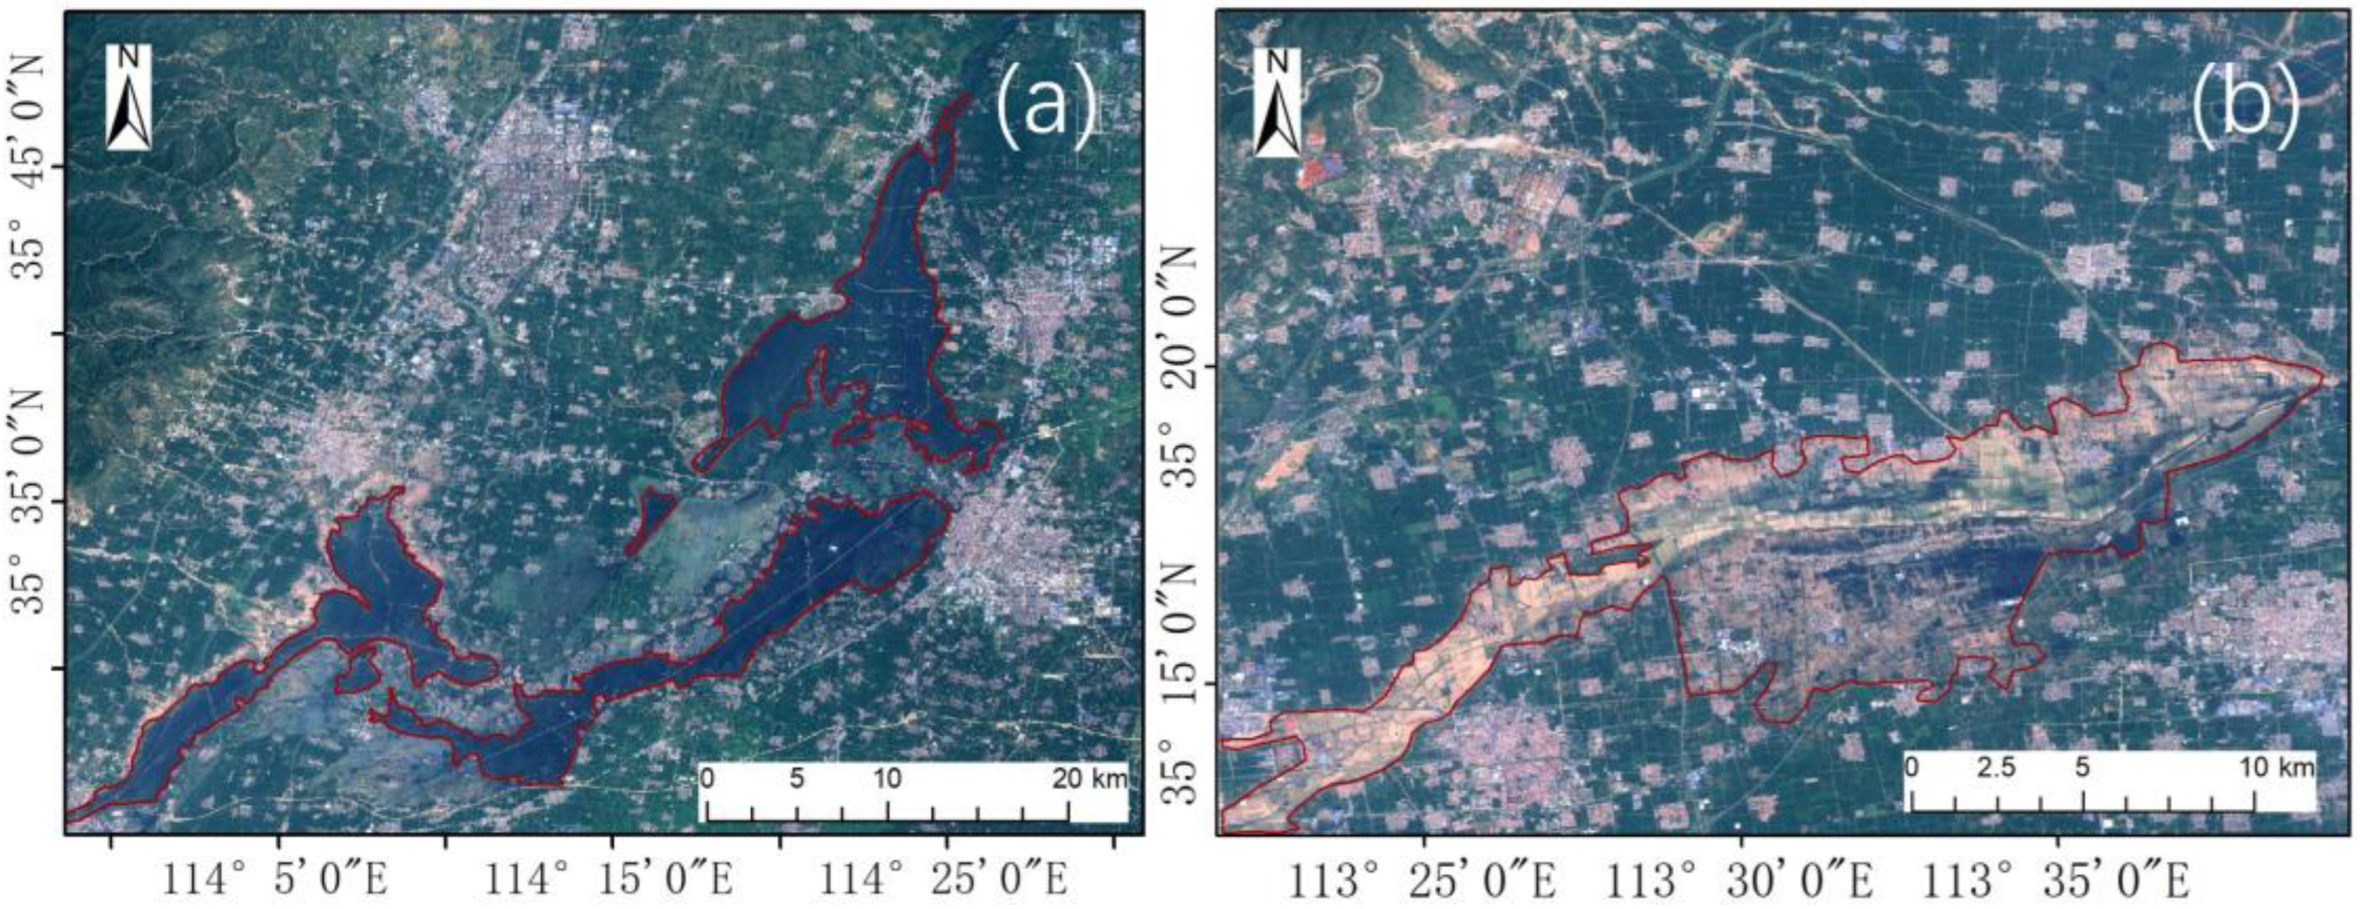
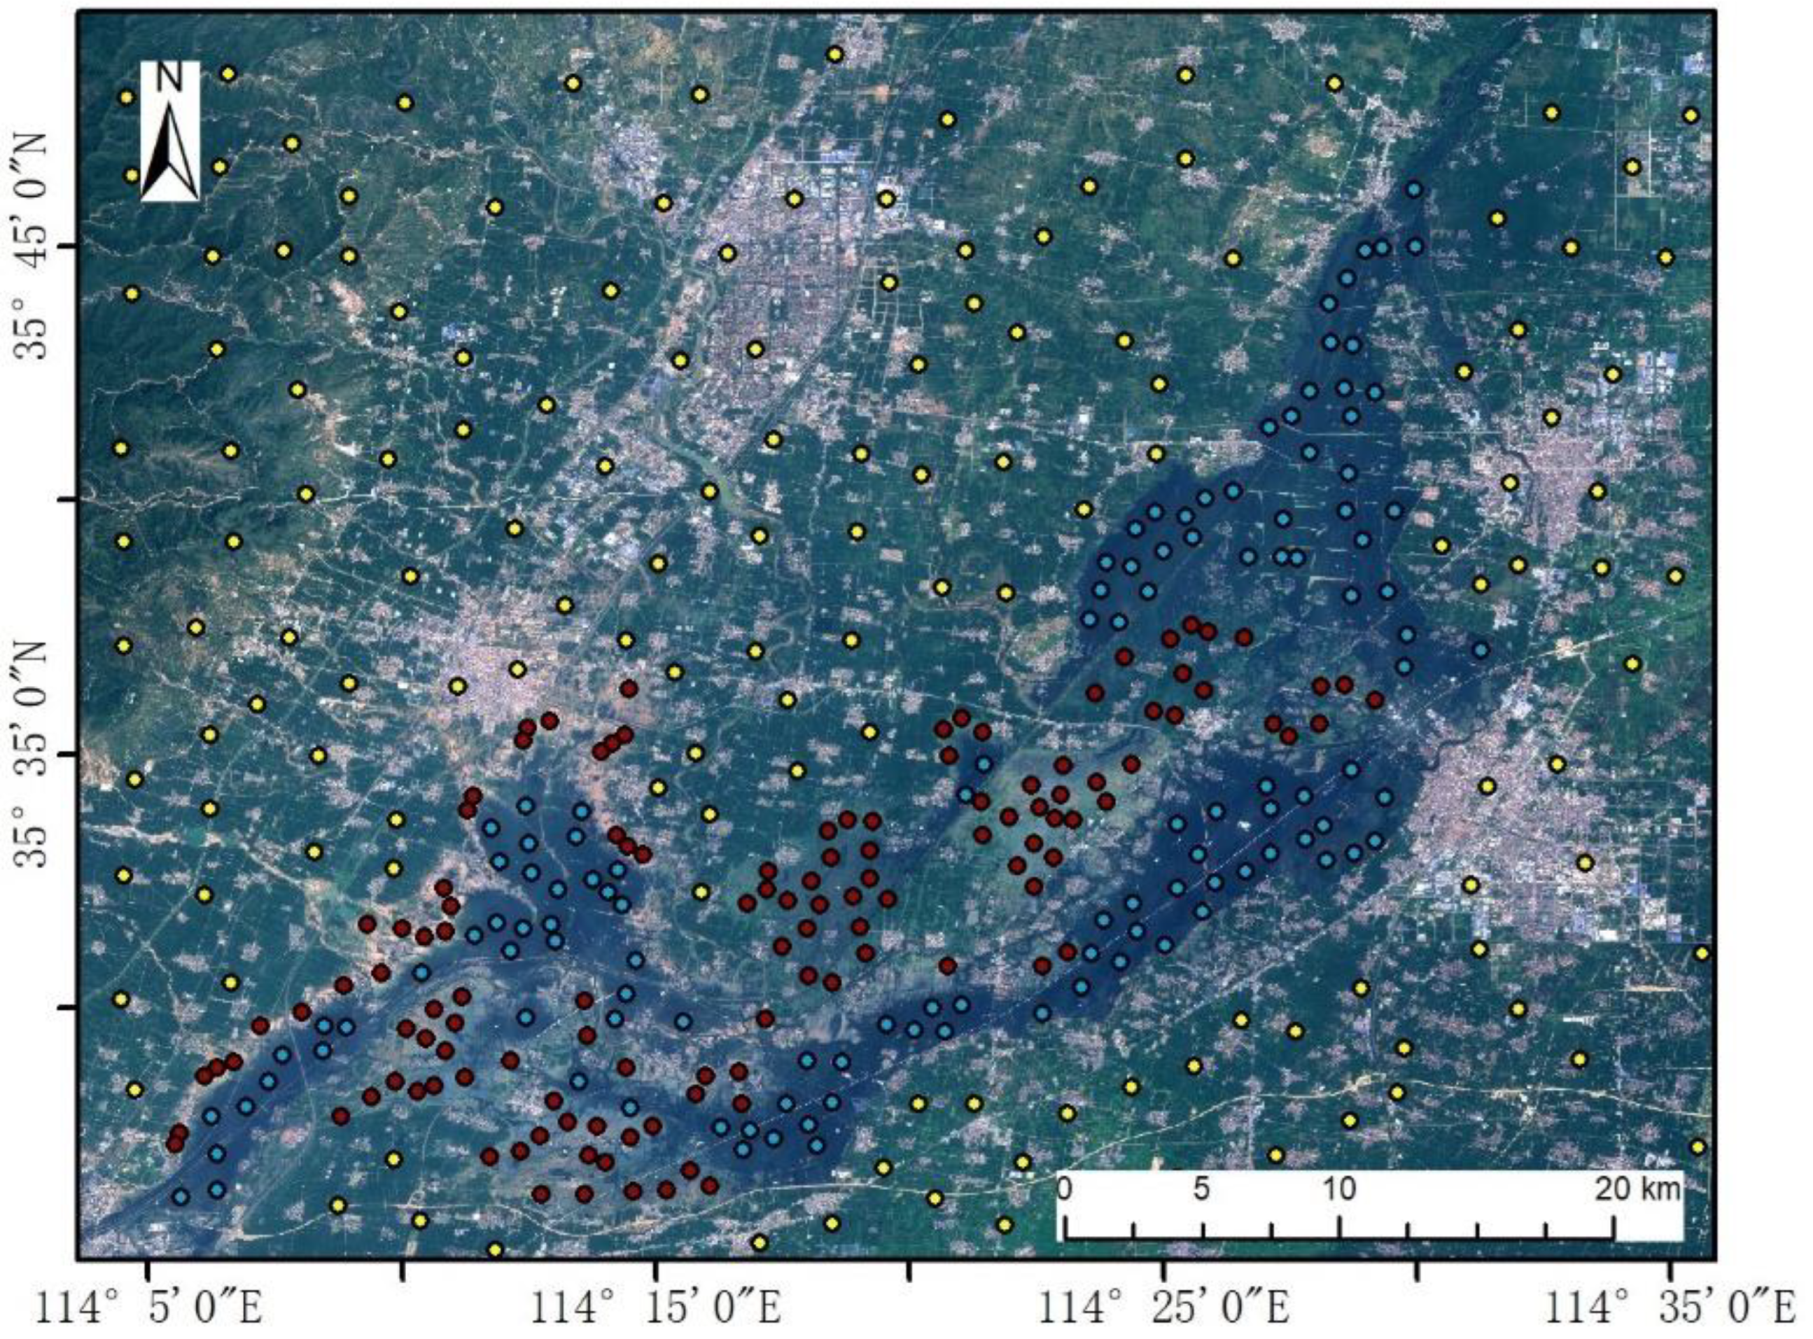
2.3.5. Result Verification

Verification based on reference sample data is one of the main means of precision verification, and it is also one of the indicators used to illustrate the precision of the extraction results. After completing the extraction, a confusion matrix was constructed based on randomly selected sample points. Then, the kappa coefficient, user precision, mapping precision, overall precision, and other validation indicators were used for the precision verification [59].
The overall precision was calculated as
  p 0 = TP + TN TP + TN + FP + FN
where: p 0 denotes the overall precision; TP denotes the true positive sample number; TN denotes the true negative sample number; FT denotes the false positive sample number; FN denotes the false negative sample number.
Kappa is another single-valued metric designed to evaluate the performance of a range of classifiers. kappa is designed to compare the performance of any classifier to a baseline of “random classifiers”. The Kappa was calculated as
k = p 0 p e 1 p e
where: p 0 denotes the overall precision; p e denotes the sum of the “product of actual and predicted quantities” for all categories, divided by the “square of the total number of samples”.

3. Results

3.1. Threshold Searching Results

In this study, the thresholds determined using the DFPS method were as follows: the detection precision was the highest (84%) when the threshold of the extracted flooding extent was −1.8 for the radar data. Table 2 shows the calculation process of the DFPS threshold determination method for Sentinel-1 data, including the threshold search extent, the step size, and the precision of the corresponding image.
For the MODIS yielded NDVI data, the detected precision was the highest (82%) when the threshold of the NDVI index was −0.08. Table 3 shows the calculation process of the DFPS threshold determination method for the NDVI index of the optical data.
The detection precision was the highest (88.6%) when the threshold of the NDWI index was 0.01. Table 4 shows the calculation process of the DFPS threshold determination method for the NDWI index of the optical data.

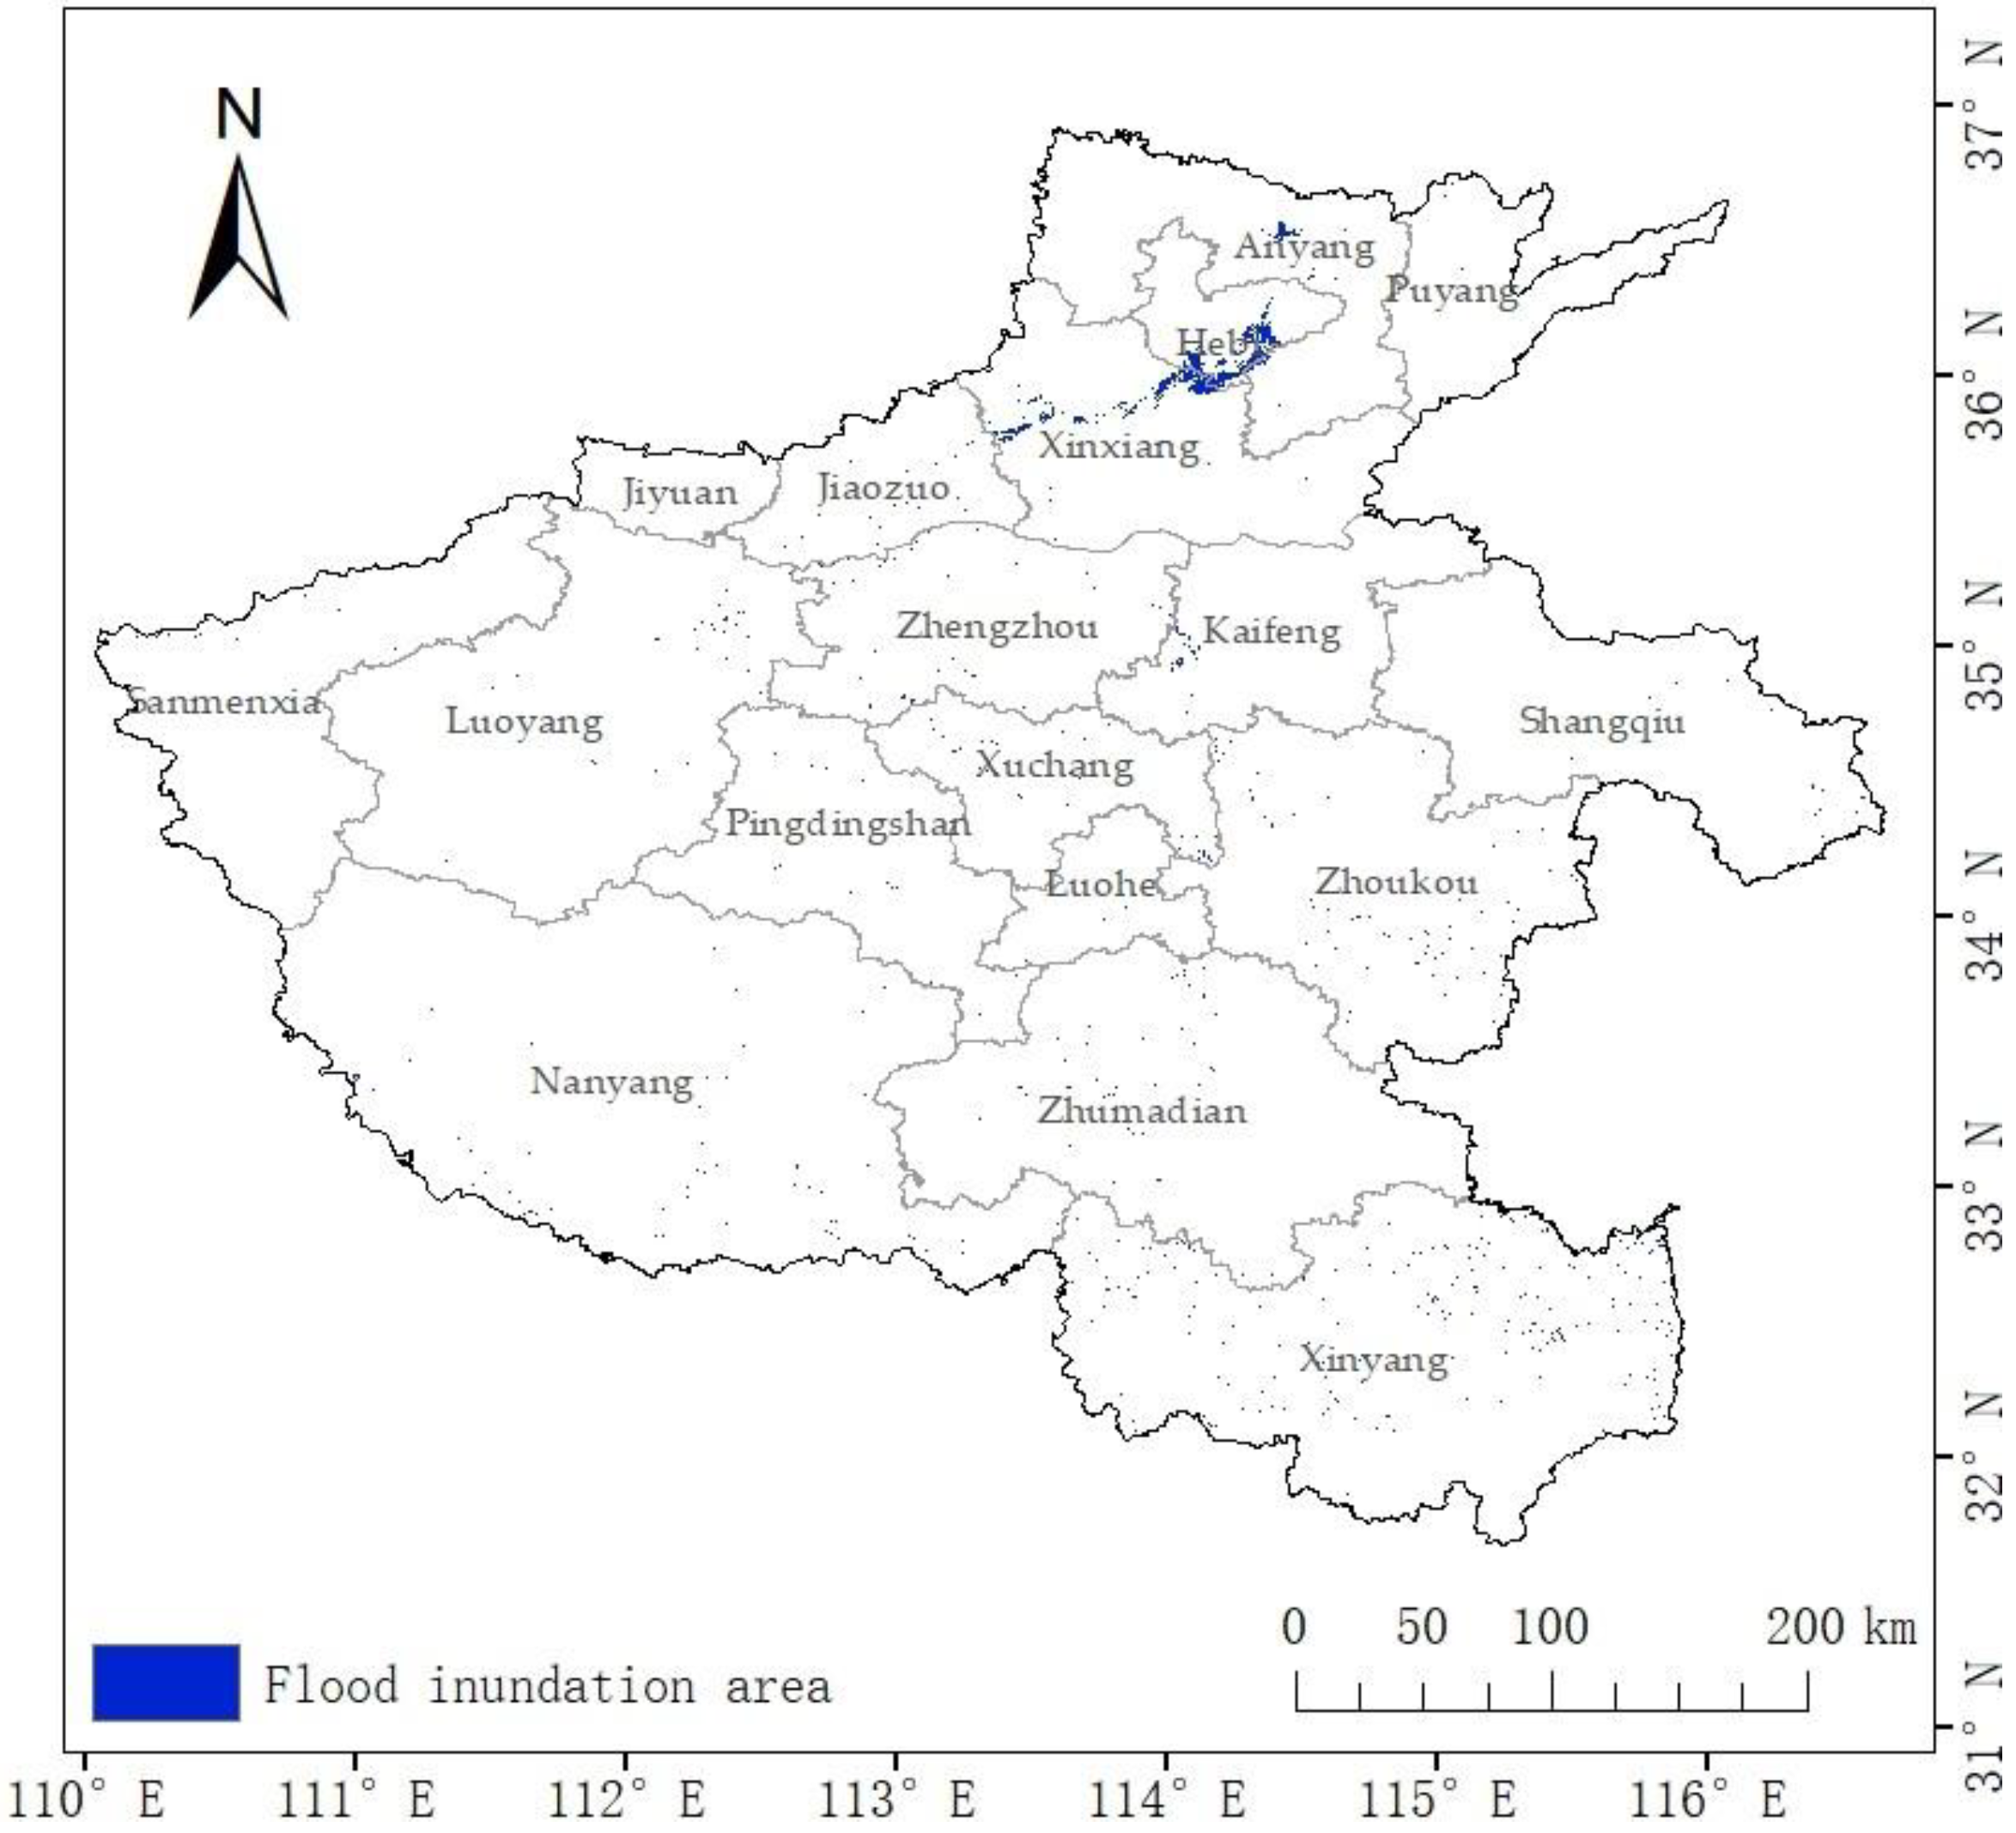
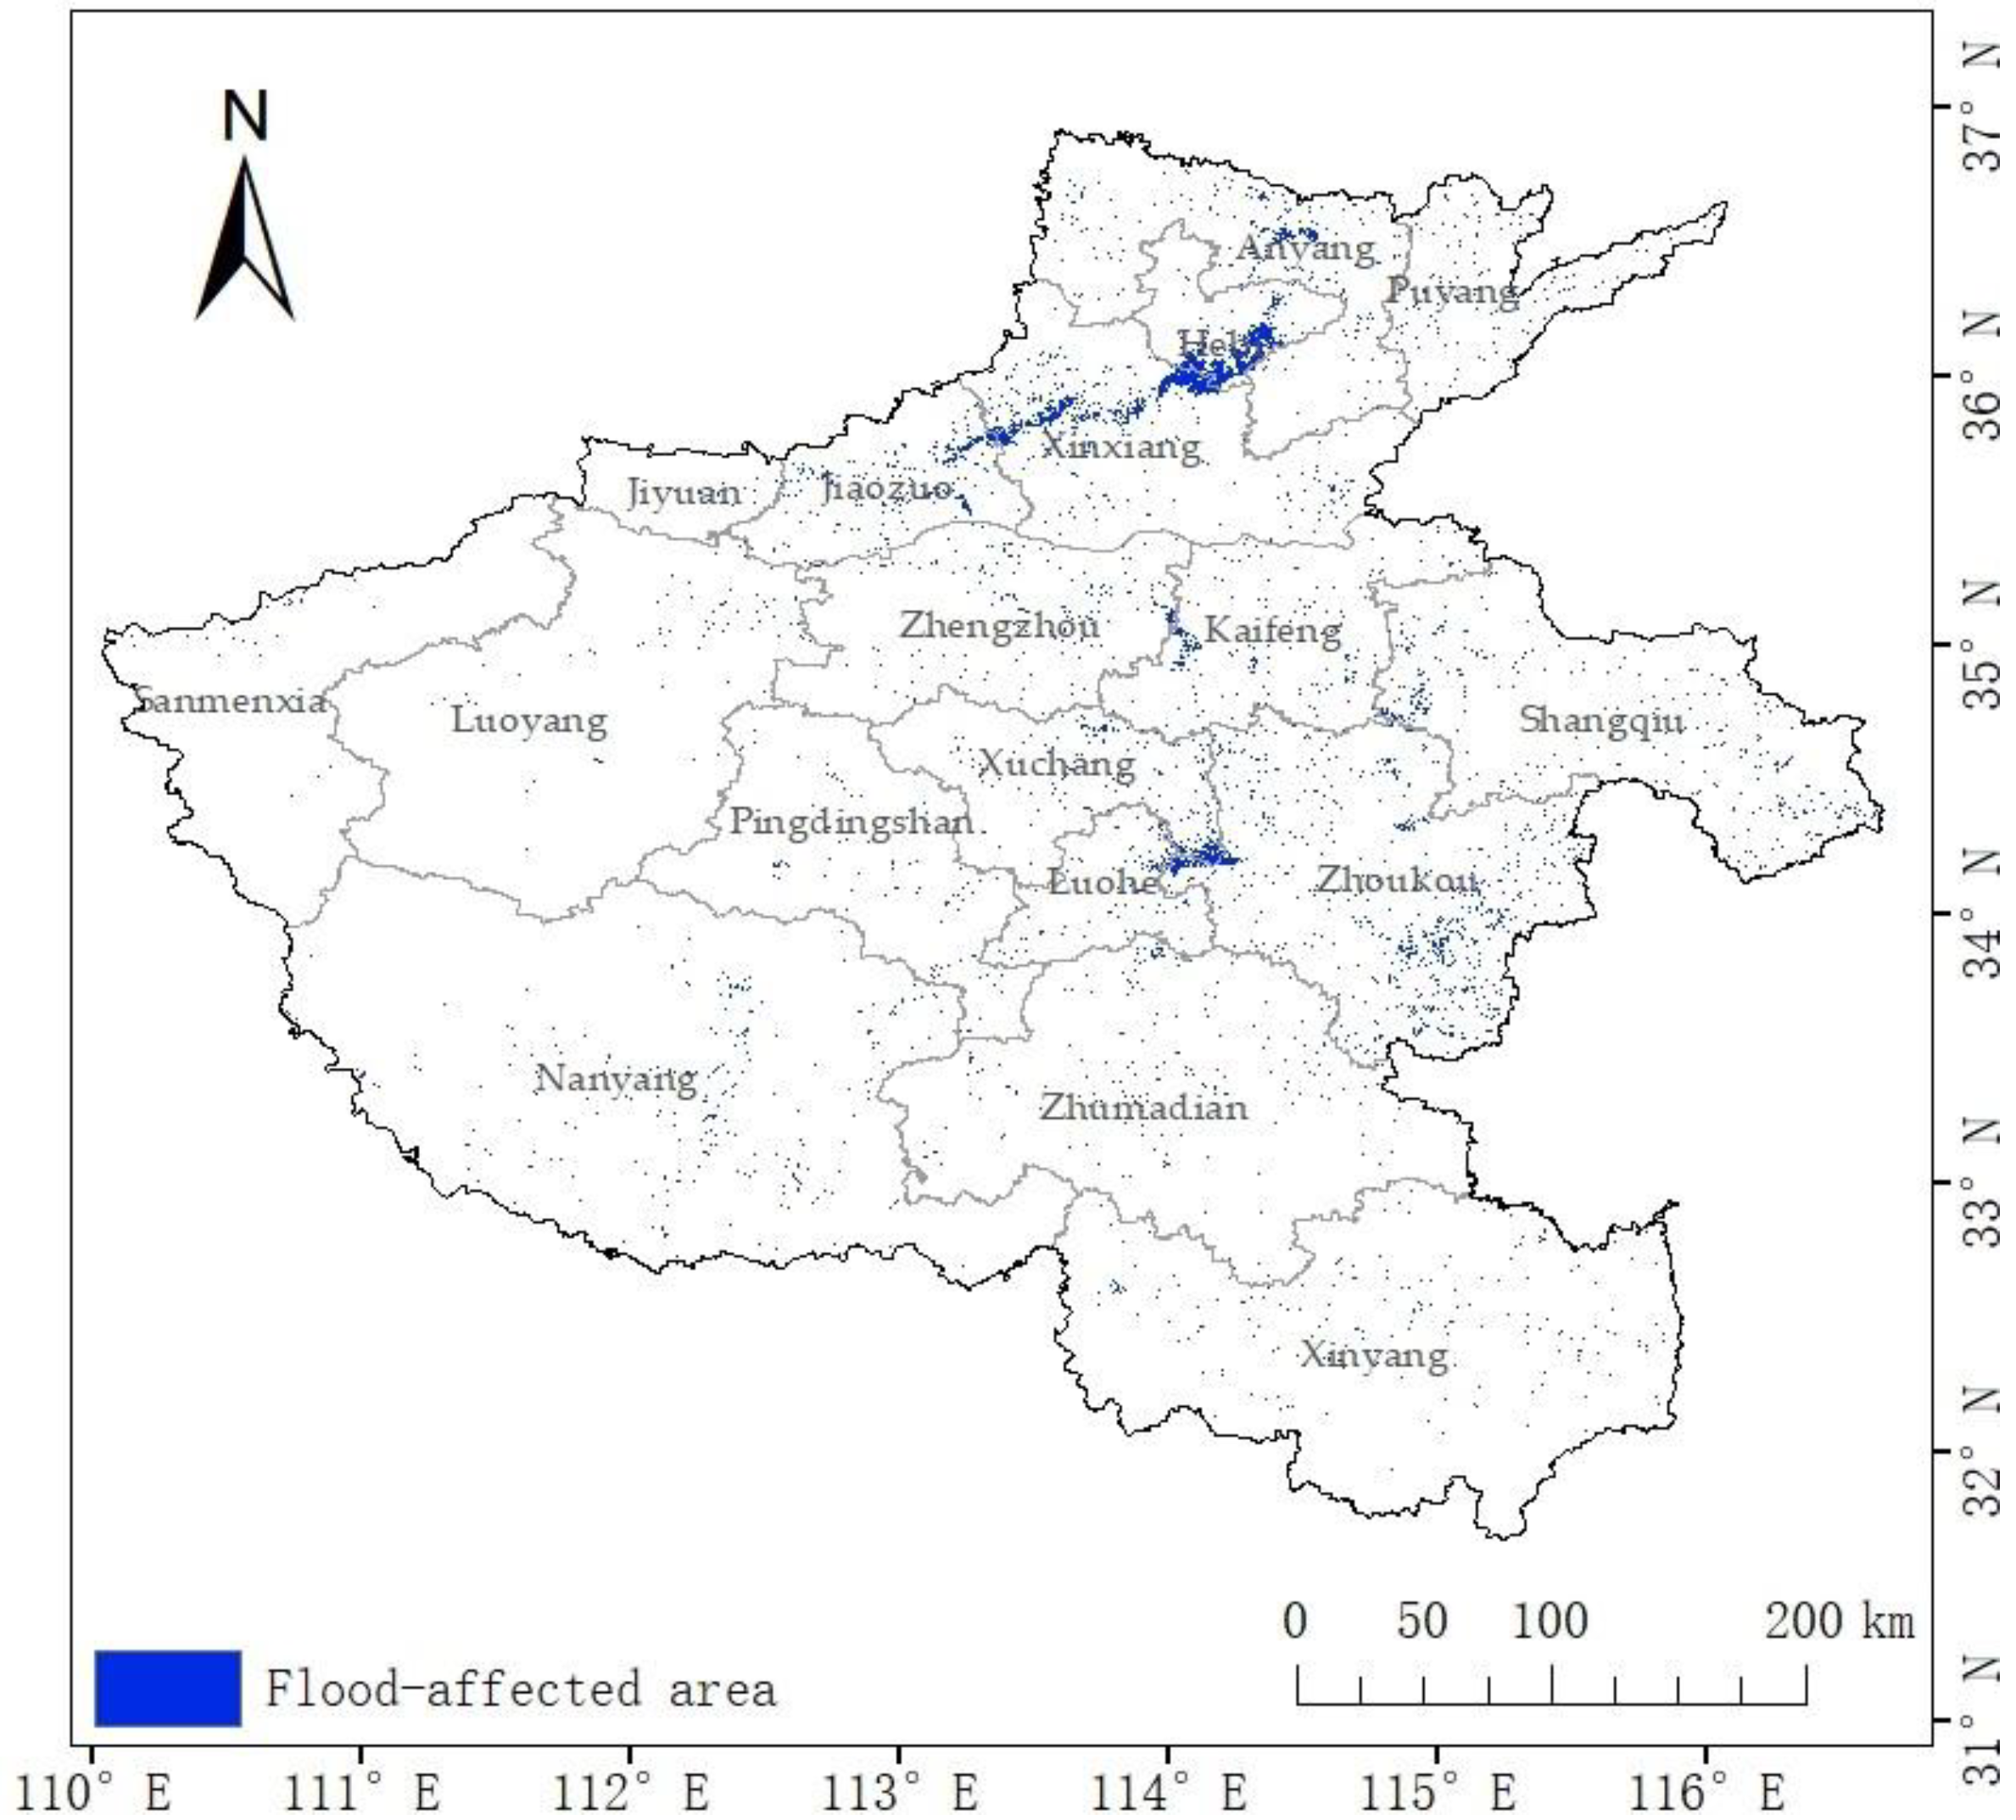
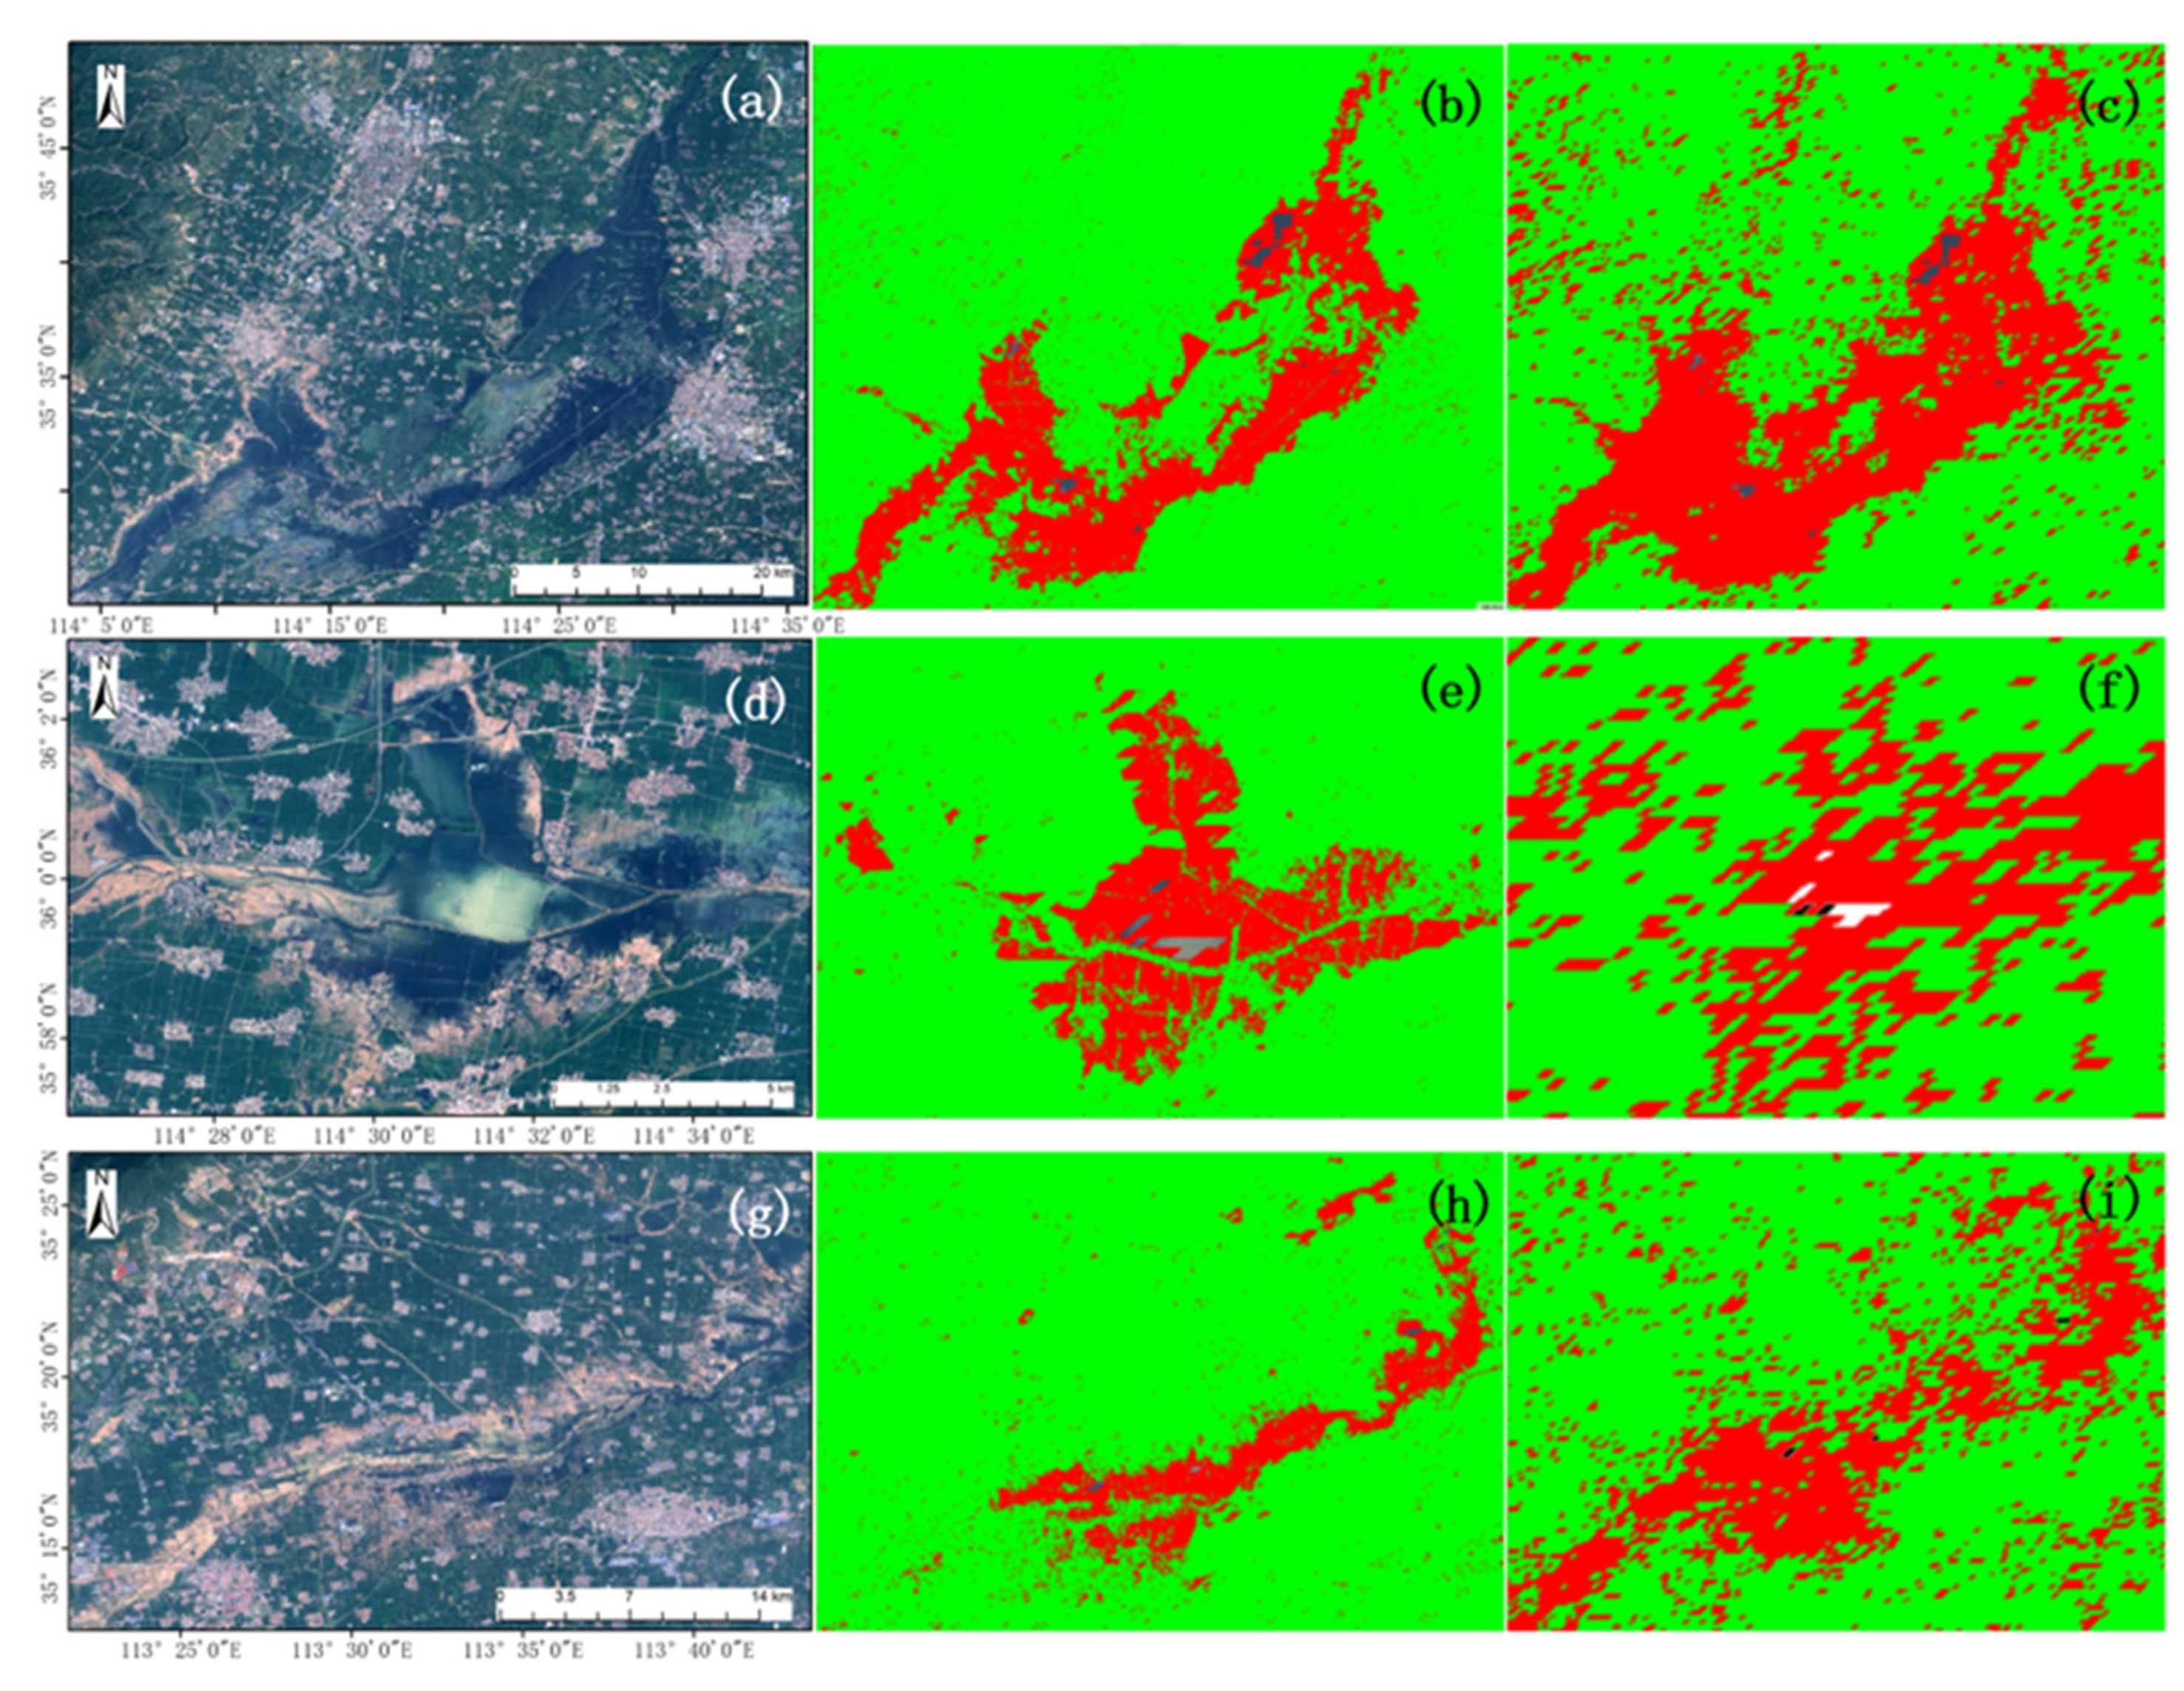
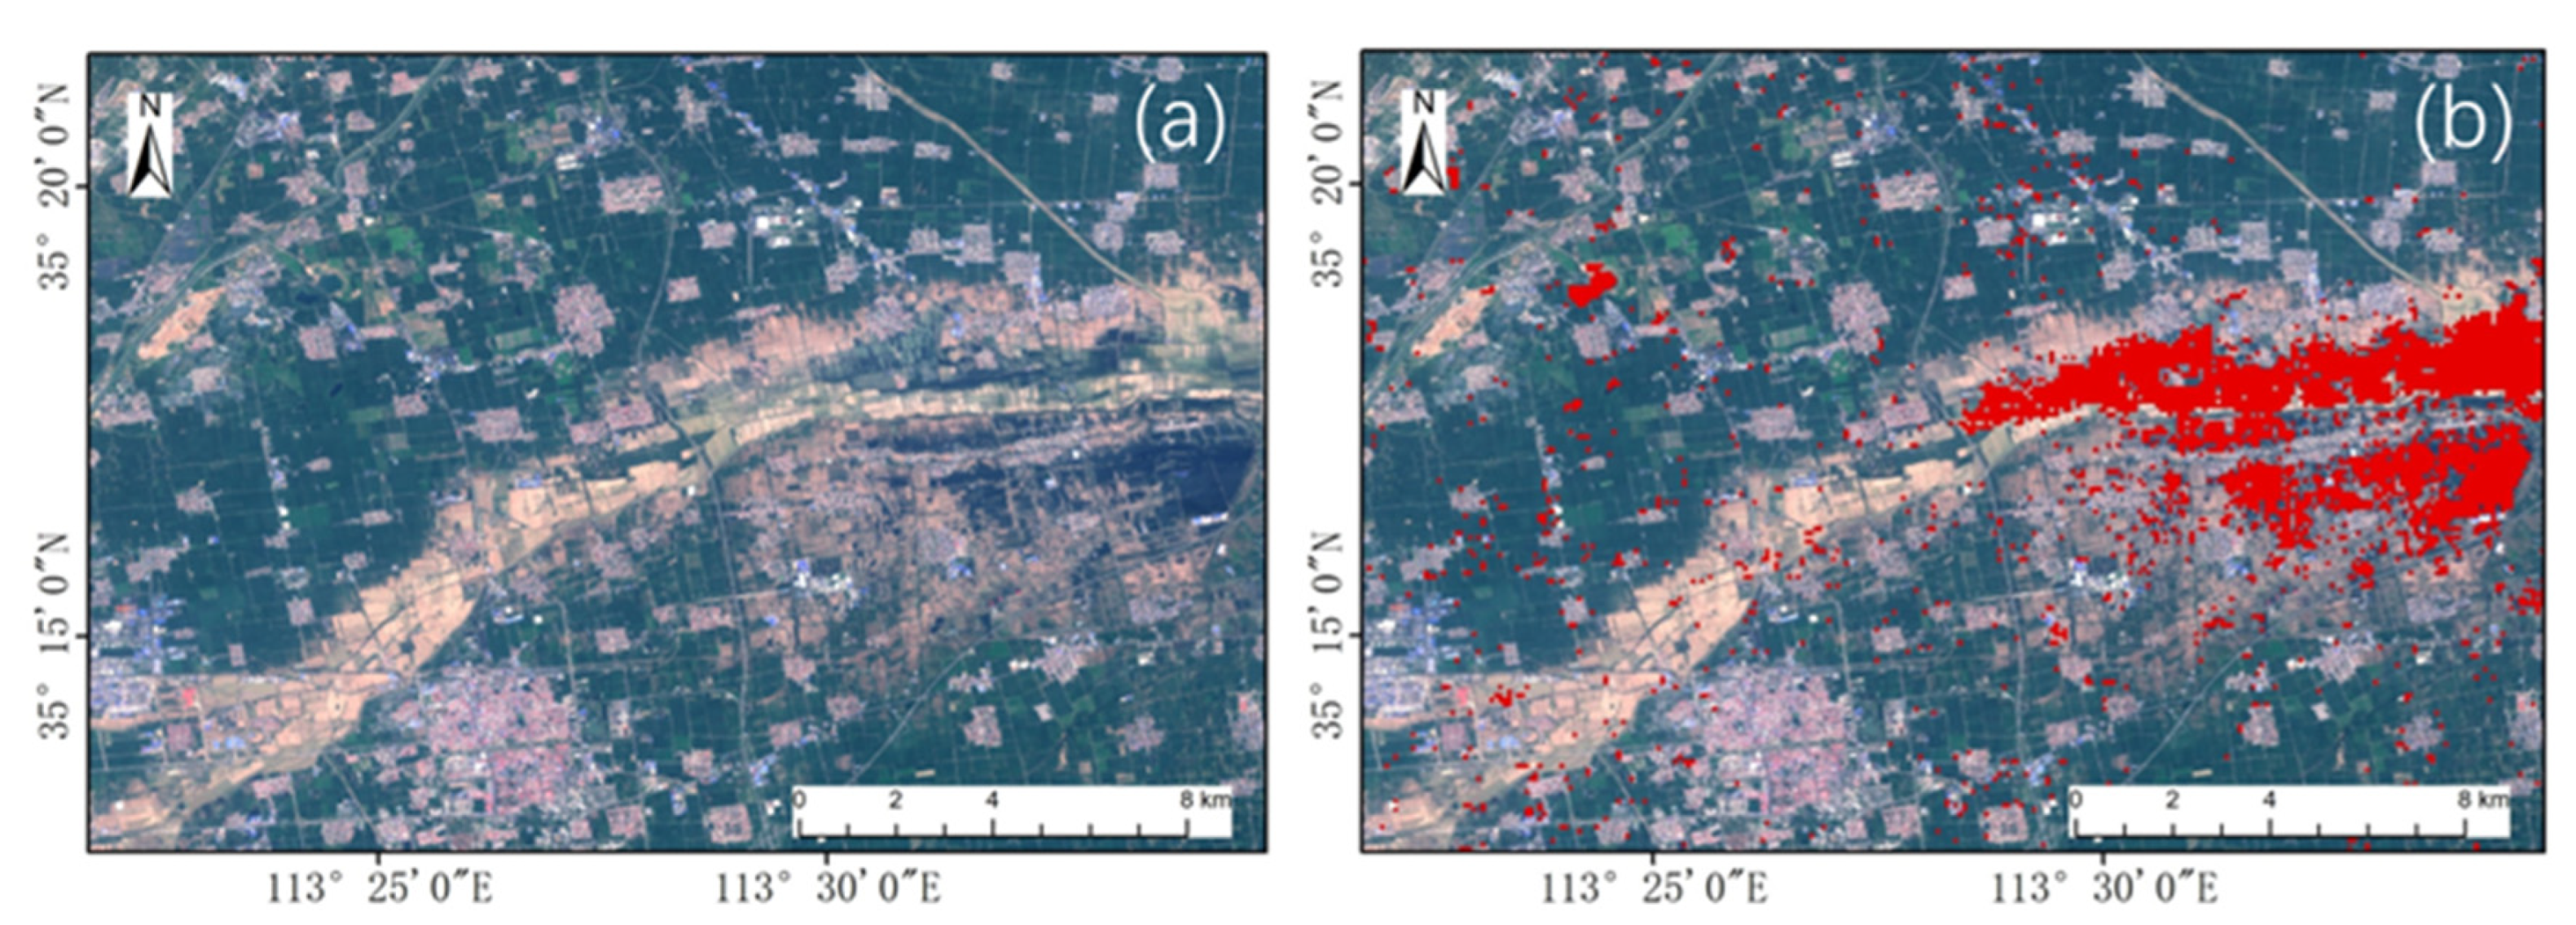
3.2. Flood Extraction Results

The method developed in this study was used to extract the flooding extent maps over the agricultural land in the study area (Figure 8 and Figure 9). Quantitatively, the flood inundation area of the crops throughout Henan Province was 1563.66 km2, and the flood-affected area of the crops in the entirety of Henan Province was 5441.73 km2.
Overall, the speckle noise (Figure S3) was well controlled due to the intersection operation of the radar and optical images in the flood inundation areas. Spatially, the flood-inundated areas were mainly concentrated in Hebi, central Xinxiang, eastern Anyang, western Kaifeng, northern Zhengzhou, and eastern Jiaozuo in Henan Province (Figure 9). The distribution of the main flood-affected areas was roughly the same as that of the inundated areas. Accordingly, Zhoukou, Xinxiang and Hebi in Henan Province were mainly affected by the flood, with larger areas and larger extents (Figure 10). Overall, the southern part of Henan (e.g., Zhumadian and Nanyang) and the western part of Henan (e.g., Zhoukou, Shangqiu, and Kaifeng) were less affected by the heavy rainfall. Hebi, Jiaozuo, Xinxiang, and other areas were mainly affected by this particular disaster. There was obvious waterlogging in some places, and the production loss of autumn harvest was relatively large, which not only led to a reduction in production but also to a total loss of in the harvest, which had a greater impact on later yields.
We picked out some typical extraction results and exhibited them in Figure 10. From this it can be concluded that the flood inundation area extracted by our method basically overlaps with the spatial distribution of the flooding in the Sentinel-2 images. Thus, our method successfully controls the speckle noise of the radar data while keeping the spatial details clear. However, due to the coarse spatial resolution of the MODIS data, we extracted the flood-affected area as the union of the inundation area and the optical index, so the contour line of the small validation area (Figure 10f) is relatively fuzzy.
Additionally, to exhibit the performance of Sentinel-1 images in post-flood siltation regions, we extraced flood affected area without MODIS images. The results (Figure 11) show that the data performs well for extracting the flooded area in the east-central part of the figure. But the silt zone at the periphery of the flooded area and the silt zone in the southwestern part of the figure were missed. This indicates the importance of combining MODIS data with Sentinel-1 data to obtain complete flood information.

3.3. Extraction Precision Verification

In this study, four areas where the flooding mainly occurred were selected as the verification areas (Figure 1c), and the verification method of visually marking verification points was carried out using Sentinel-2 image data with a resolution of 10 m. Among them, 827 flood inundation points and 778 non-inundation points were set in the extracted flood inundation area, and 677 flood-affected points and 778 non-flood-affected points were set in the extracted flood-affected area.
A confusion matrix was calculated using the sample points above. The overall precision of extracting flood inundation extent using the method developed in this study was 87% with a kappa coefficient of 0.73 (Table 5); and the overall precision of the extraction of the flood-affected area extent was 92%, with a kappa coefficient of 0.84 (Table 6).

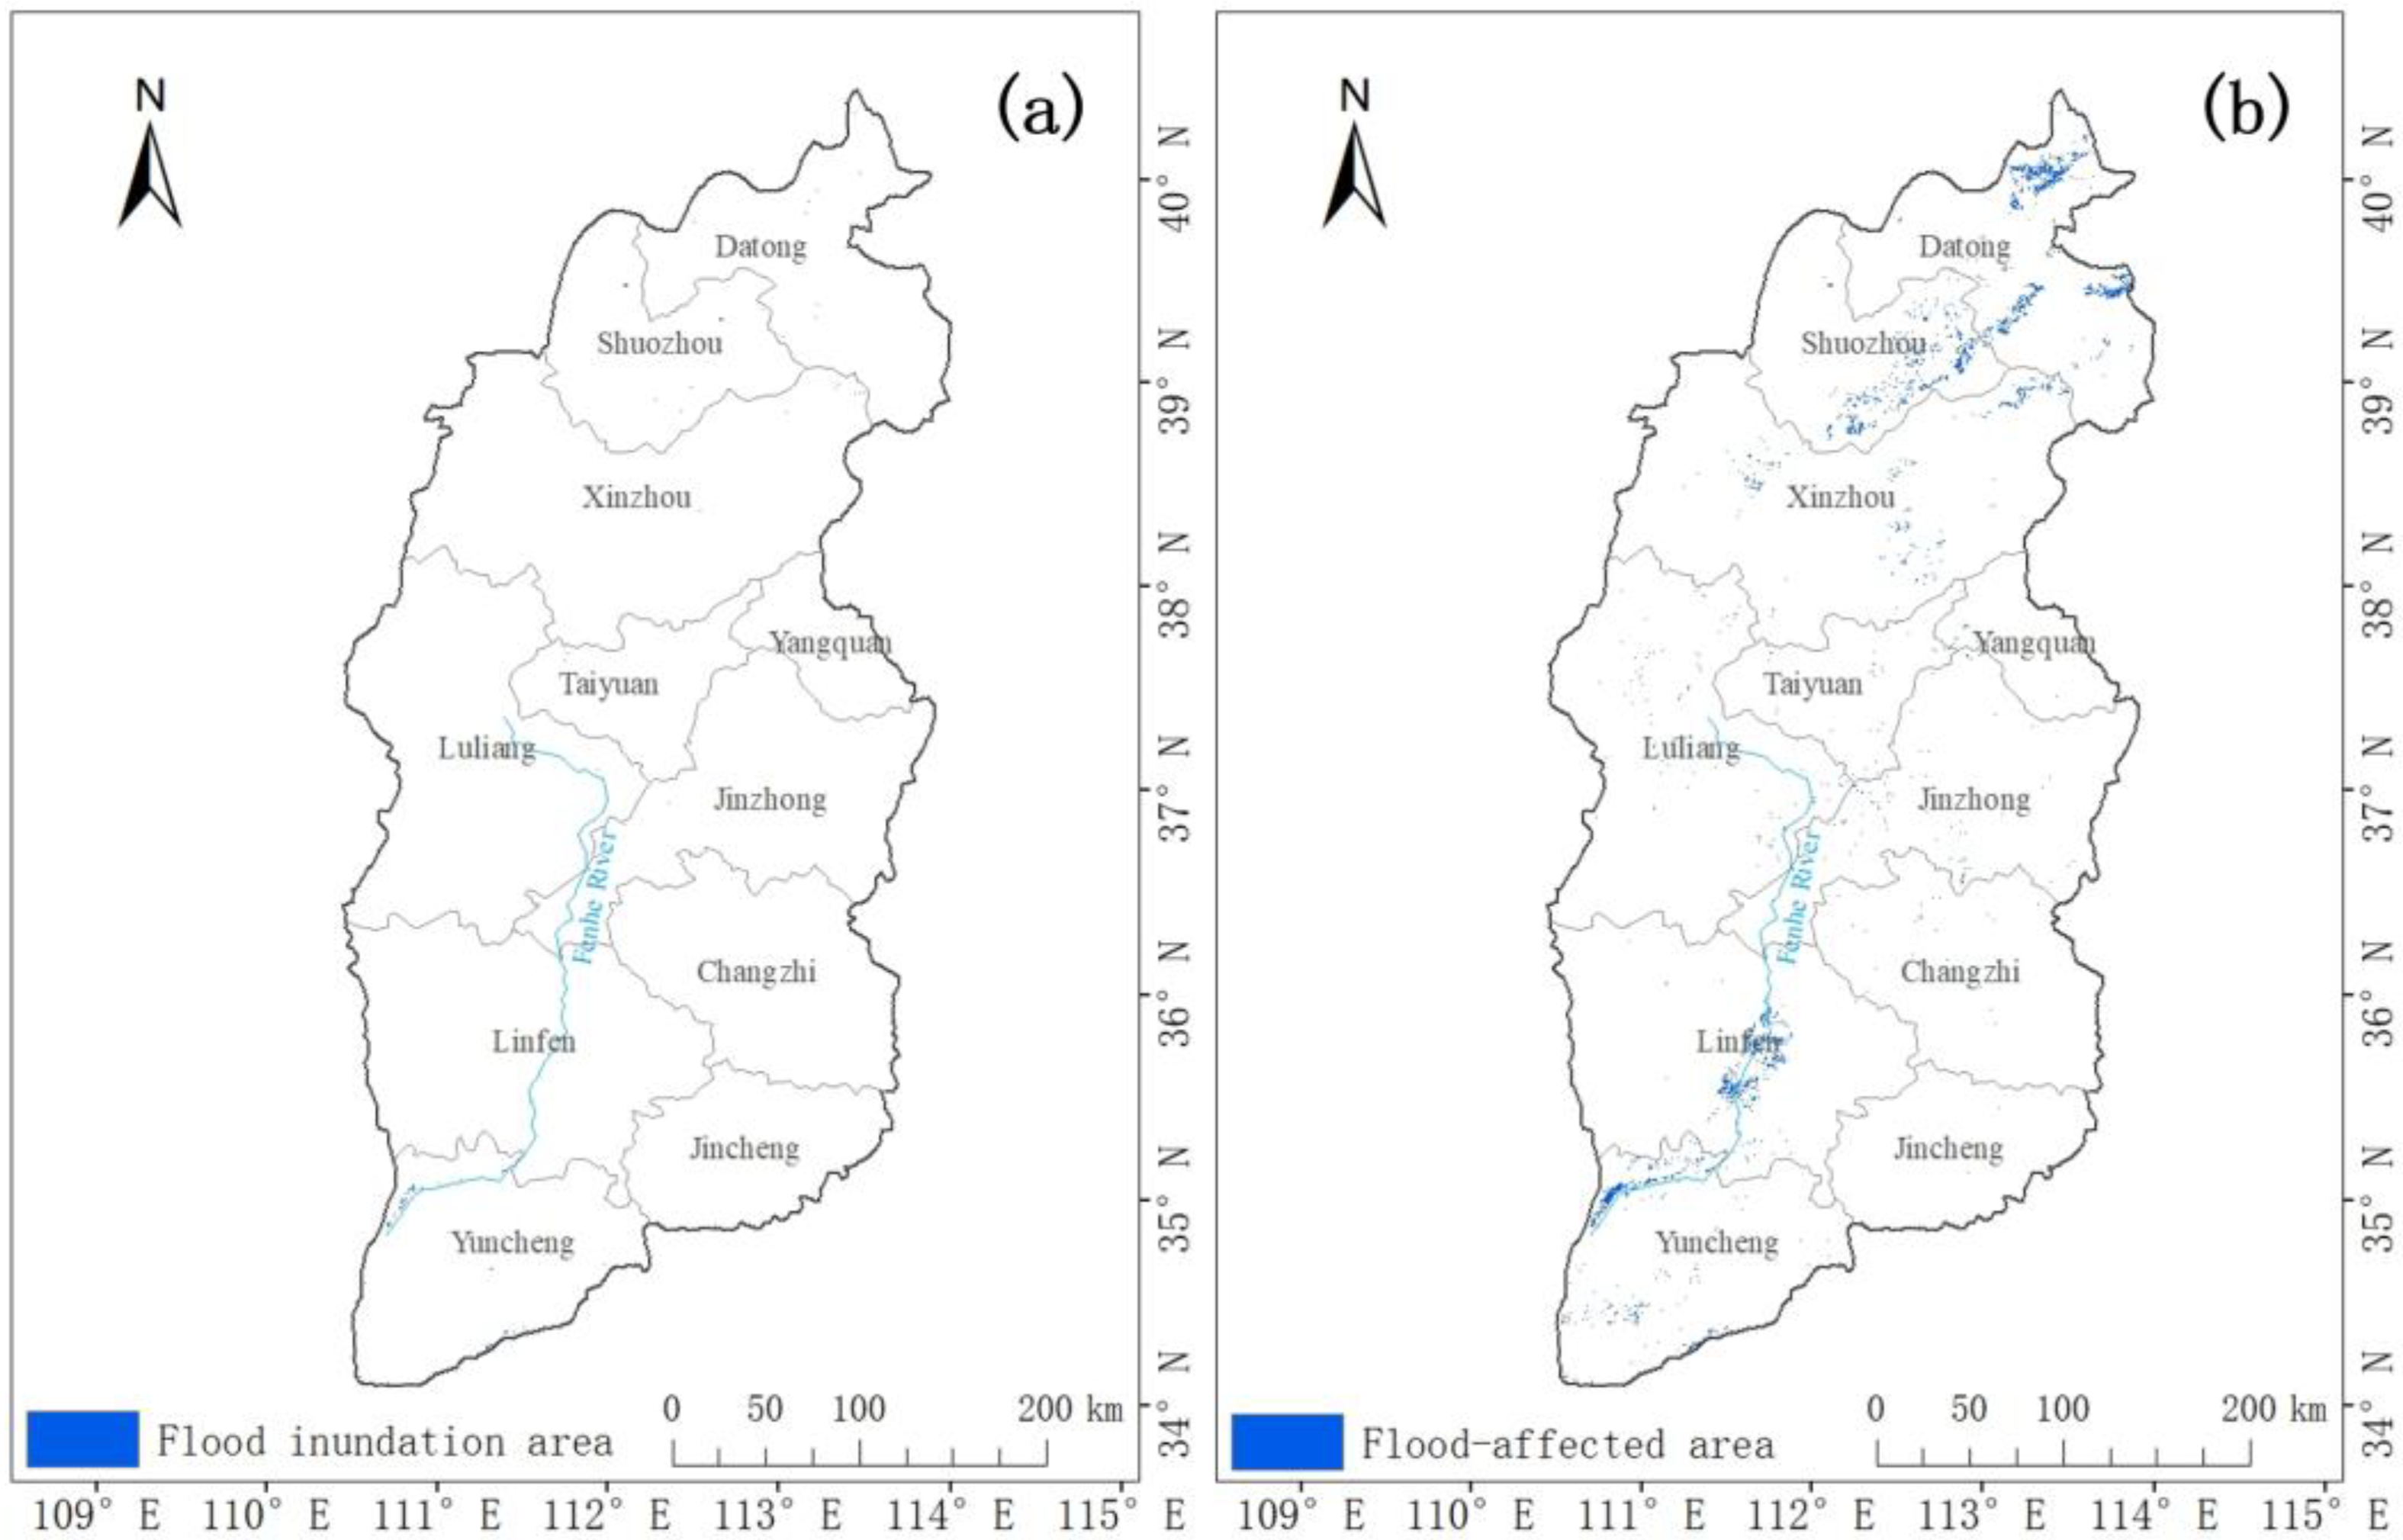
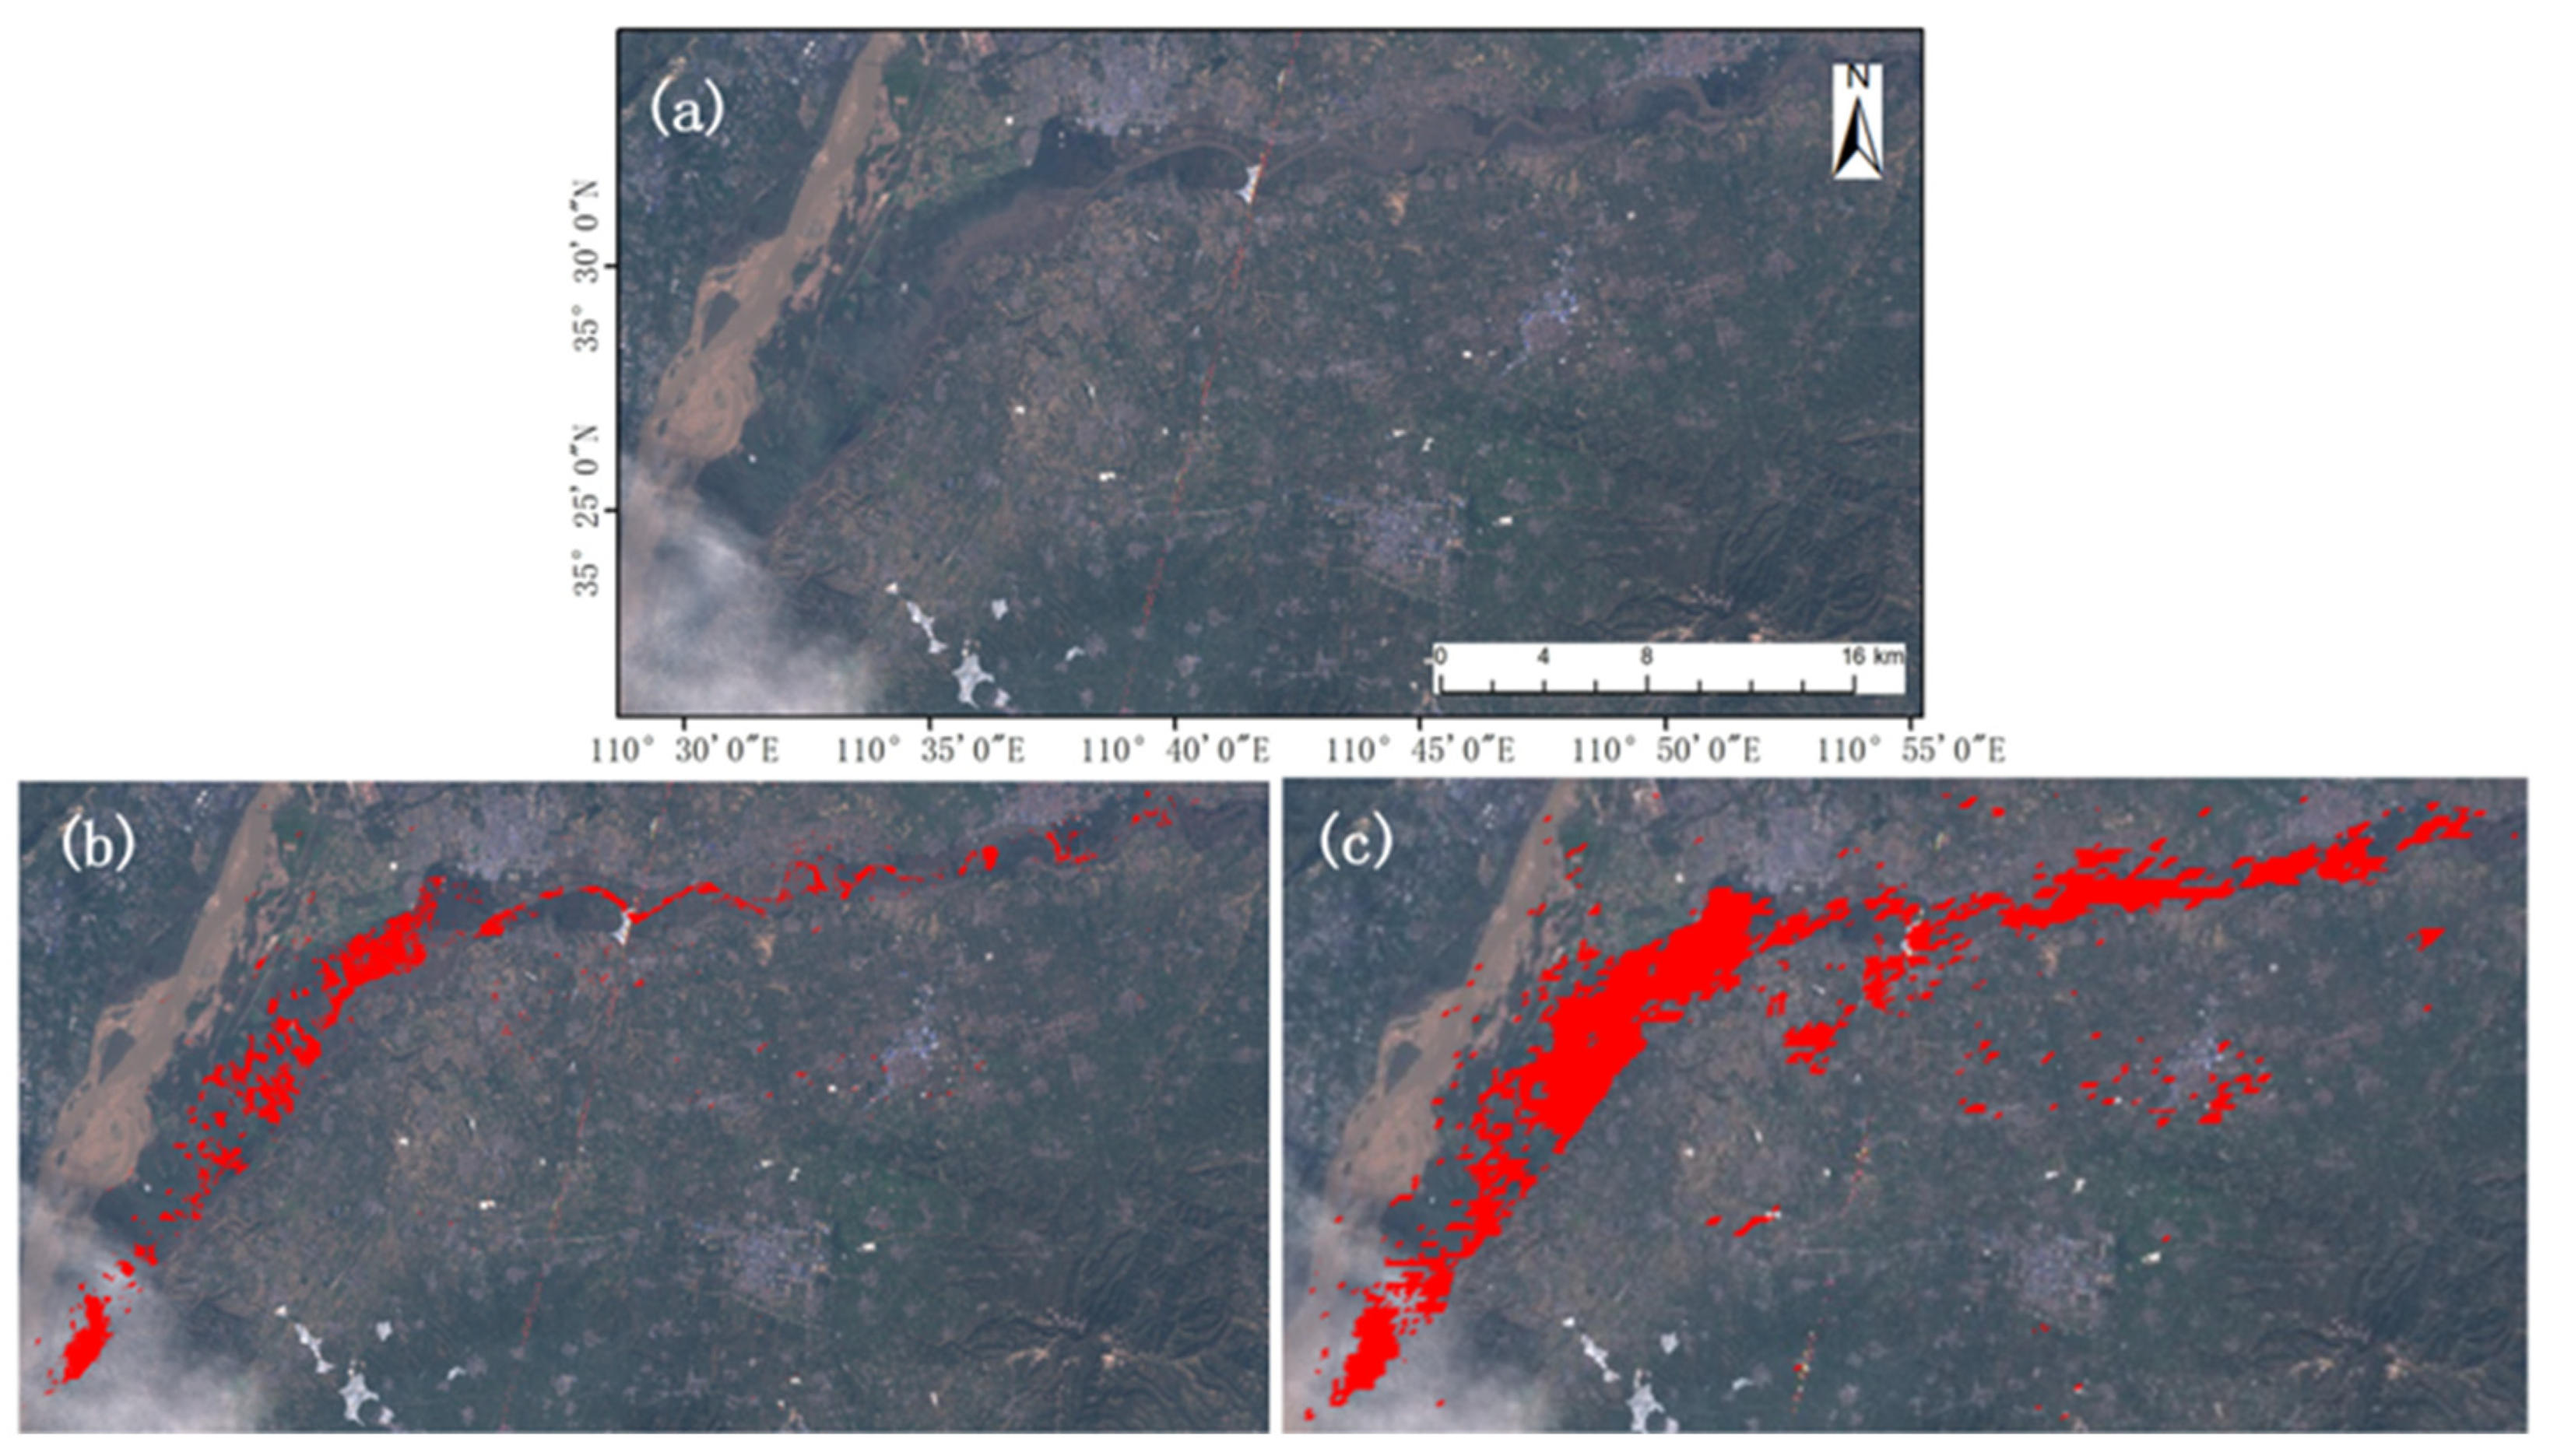
3.4. Flood Extraction Verification in Shanxi Province

We used the flood events in Shanxi Province to verify the applicability of the method to different areas. Among them, 21 Sentinel-1 images taken from 15 September to 5 October 2021 (pre-flood) and 27 images taken from 7–27 October 2021 (post-flood) were selected. One NDVI MODIS image acquired on 30 September (before the flood) and one NDVI MODIS image acquired on 16 October 2021 (after the flood); and two NDWI images acquired on 22 and 30 September (before the flood) and three NDWI images acquired on 8, 16, and 24 October (after the flood) were selected. Finally, we obtained the flood inundation area (Figure 12a) and the flood-affected area (Figure 12b).
The analysis of the amounts and spatial distributions of the extents of the flood inundation areas and affected areas of agricultural land were extracted using the method developed in this study. In terms of the quantity, the flood inundation area of the crops throughout Shanxi Province was 222.33 km2, and the flood-affected area of the crops throughout Shanxi Province was 2028.2 km2. In terms of the spatial distribution, the flood inundation areas were mainly distributed in the northern part of Yuncheng, mainly along the Fen River (Figure 12a); while the flood-affected areas were mainly distributed in the northern part of Shanxi Province (Figure 12b). Figure 13 shows a detailed comparison of the image of a verification area and the extraction results. It can be seen that the extents and boundaries of flood inundated areas (Figure 13b) and the flood-affected areas (Figure 13c) are relatively clear.
In terms of the precision verification, we selected 225 inundation sample points and 209 non-inundation sample points, as well as 247 flood-affected sample points and 214 non-flood-affected sample points in the study area. A confusion matrix was calculated using randomly selected verification sample points. The overall precision of the extraction of the flood inundation areas was 85%, with a kappa coefficient of 0.71 (Table 7); and the overall precision of the extraction of the flood-affected areas was 96%, with a kappa coefficient of 0.93 (Table 8).

4. Discussion

4.1. Effect of the Time Window Size

In establishing the flood information extraction method for Henan Province, we need to analyze the impact of sensitive factors of data selection on the accuracy of flood information extraction. The size of the time window directly determines the number of images involved in the method and affects the accuracy of flood information extraction. To make a comprehensive discussion on the impact of the time window size on the flood extraction result. We gradually changed the time window size of the after-flood images and calculate the detection accuracy. The time window size before the flood was not discussed here because the flood-sensitive information is concentrated in the post-flood images. The re-entry period of Sentinel-1 data is about six days. So we selected five days as the initial time window size and enlarged it gradually to 30 days. The accuracy under each time window size is exhibited in Table 8. The overall accuracy is the highest when the time window size is 25 days (Table 9). For this reason, we selected 20 July to 15 August after the flooding as the time window for extracting flood information from the Sentinel-1 data.
For MODIS data, the data products of are synthesized from high quality NDVI images every 16 days. This allows the two images with the closest date before and after the flood to be selected. The NDWI images are synthesized every 8 days, which is more affected by cloudy and rainy weather. The images are heavily contaminated by clouds after the flood. Therefore, we choose 10 days as the initial time window size for accuracy assessment. The overall accuracy is the highest when the time window size is 40 days (Table 10), so we choose 20 July to 30 August after the flood as the time window for extracting flood information from NDWI images.

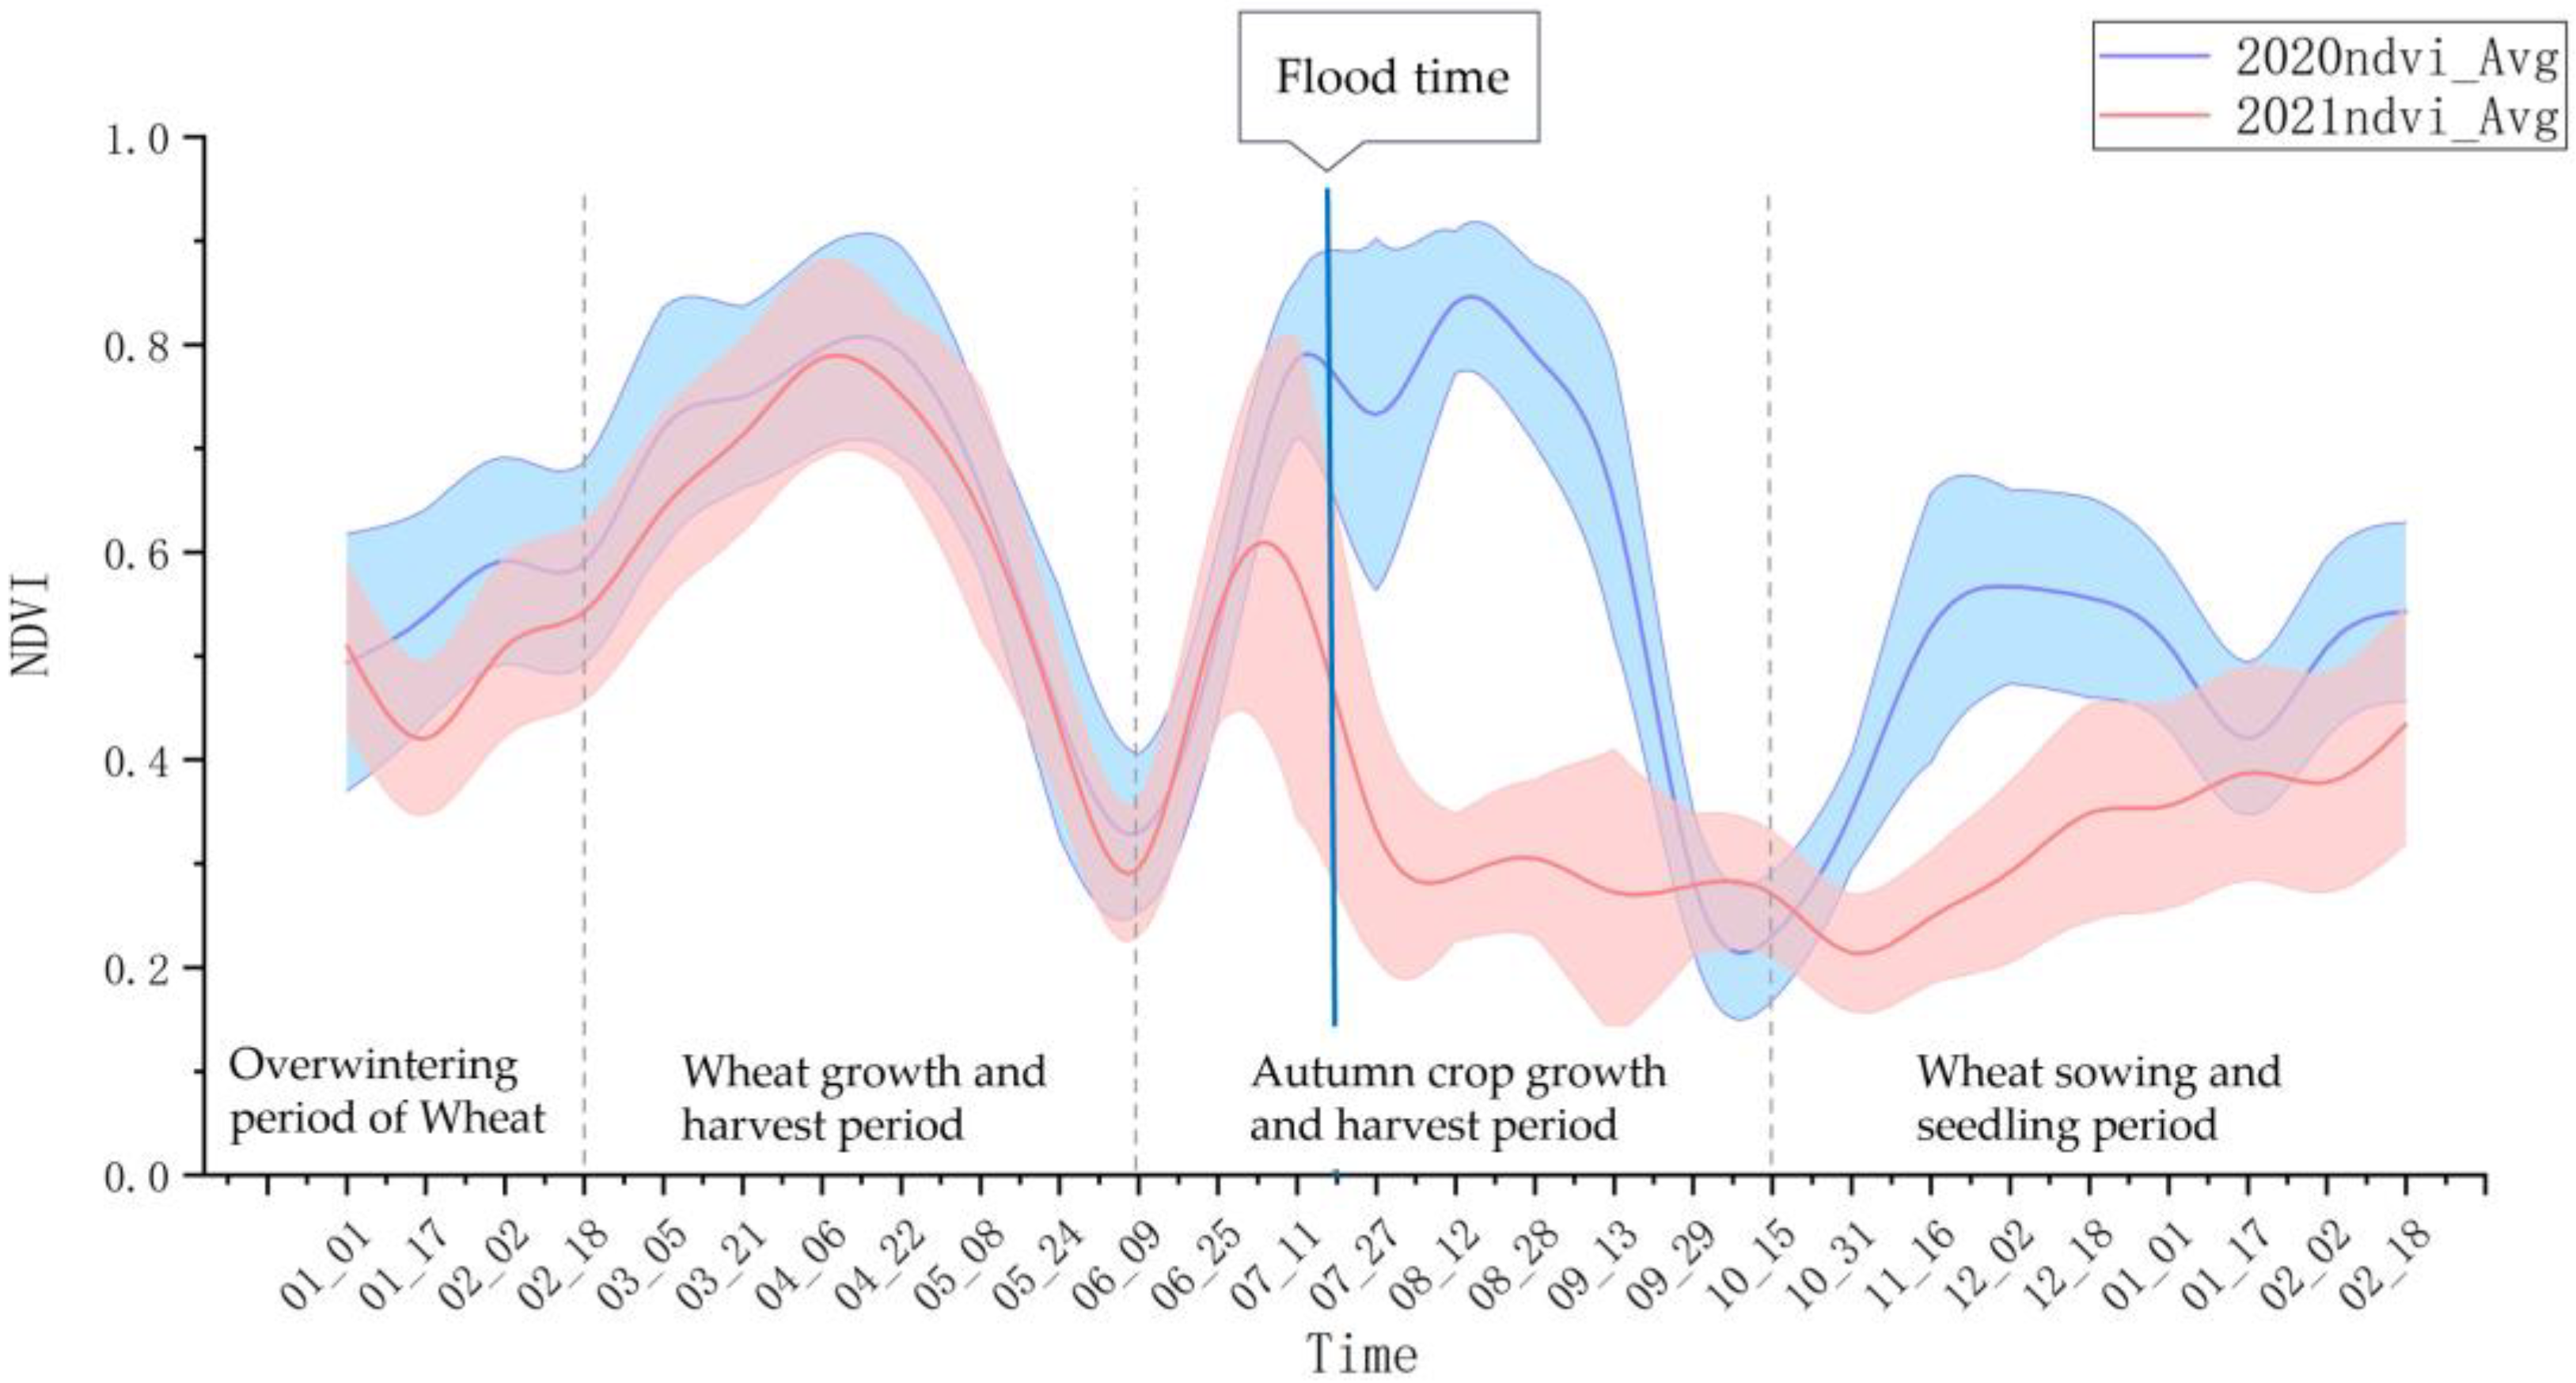
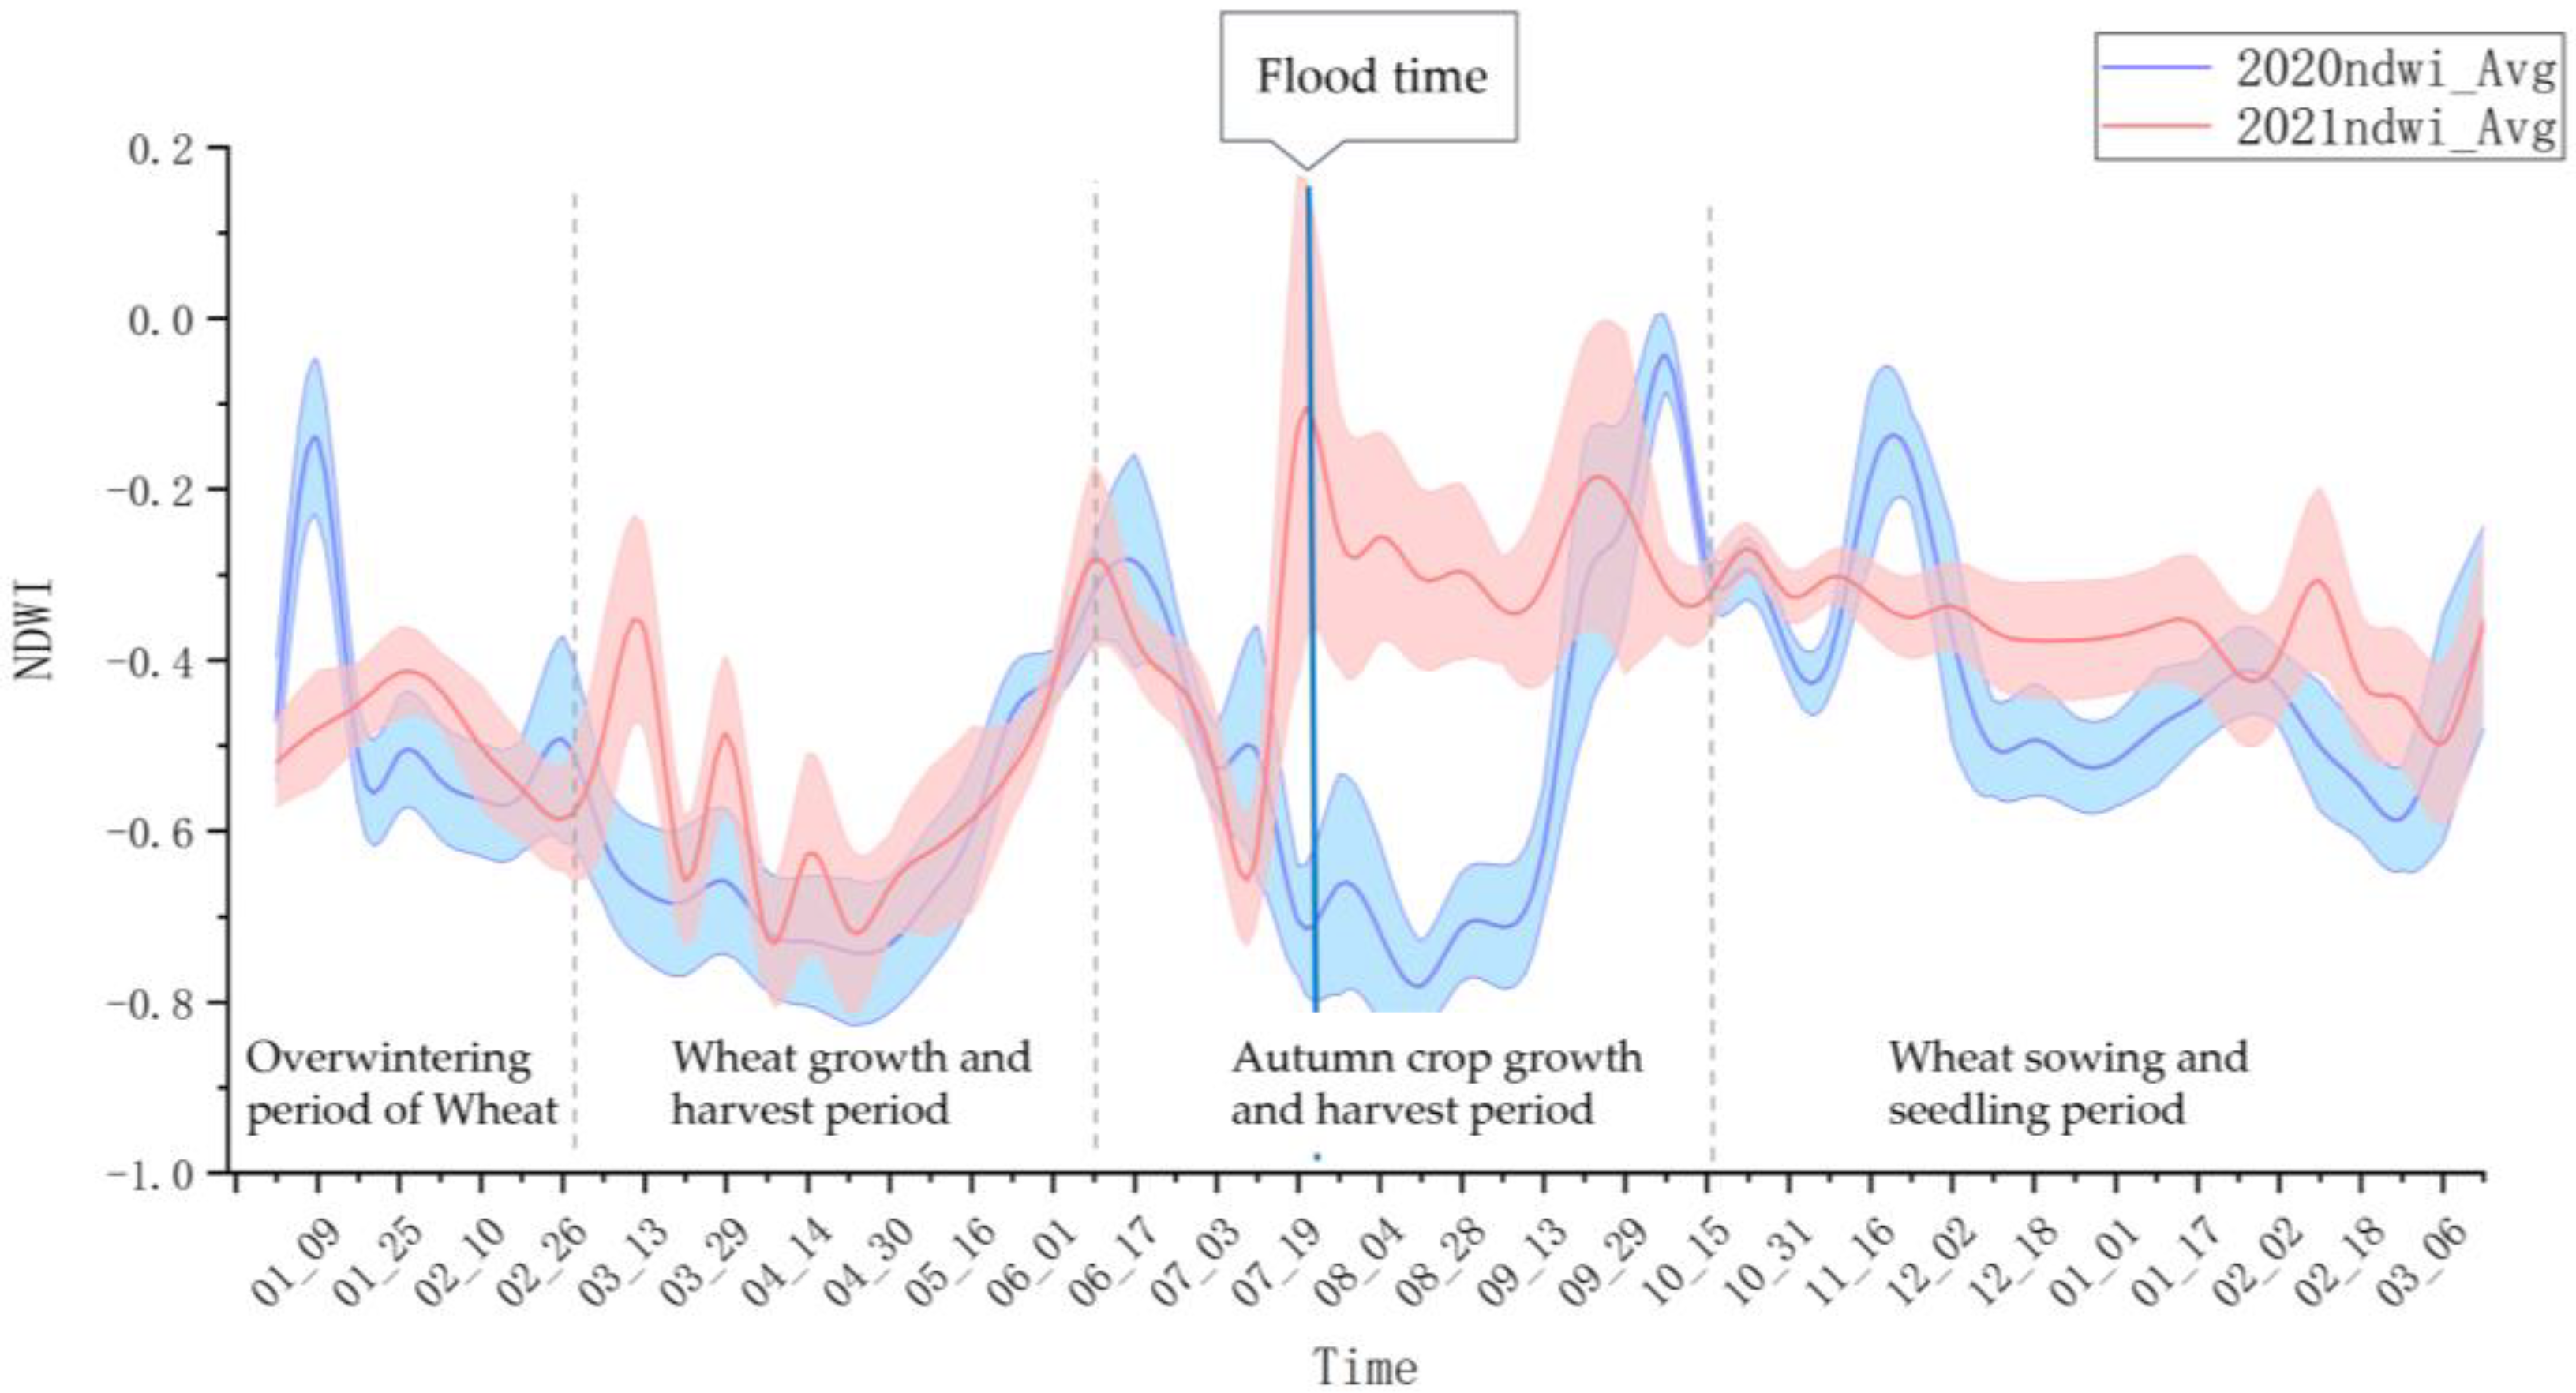
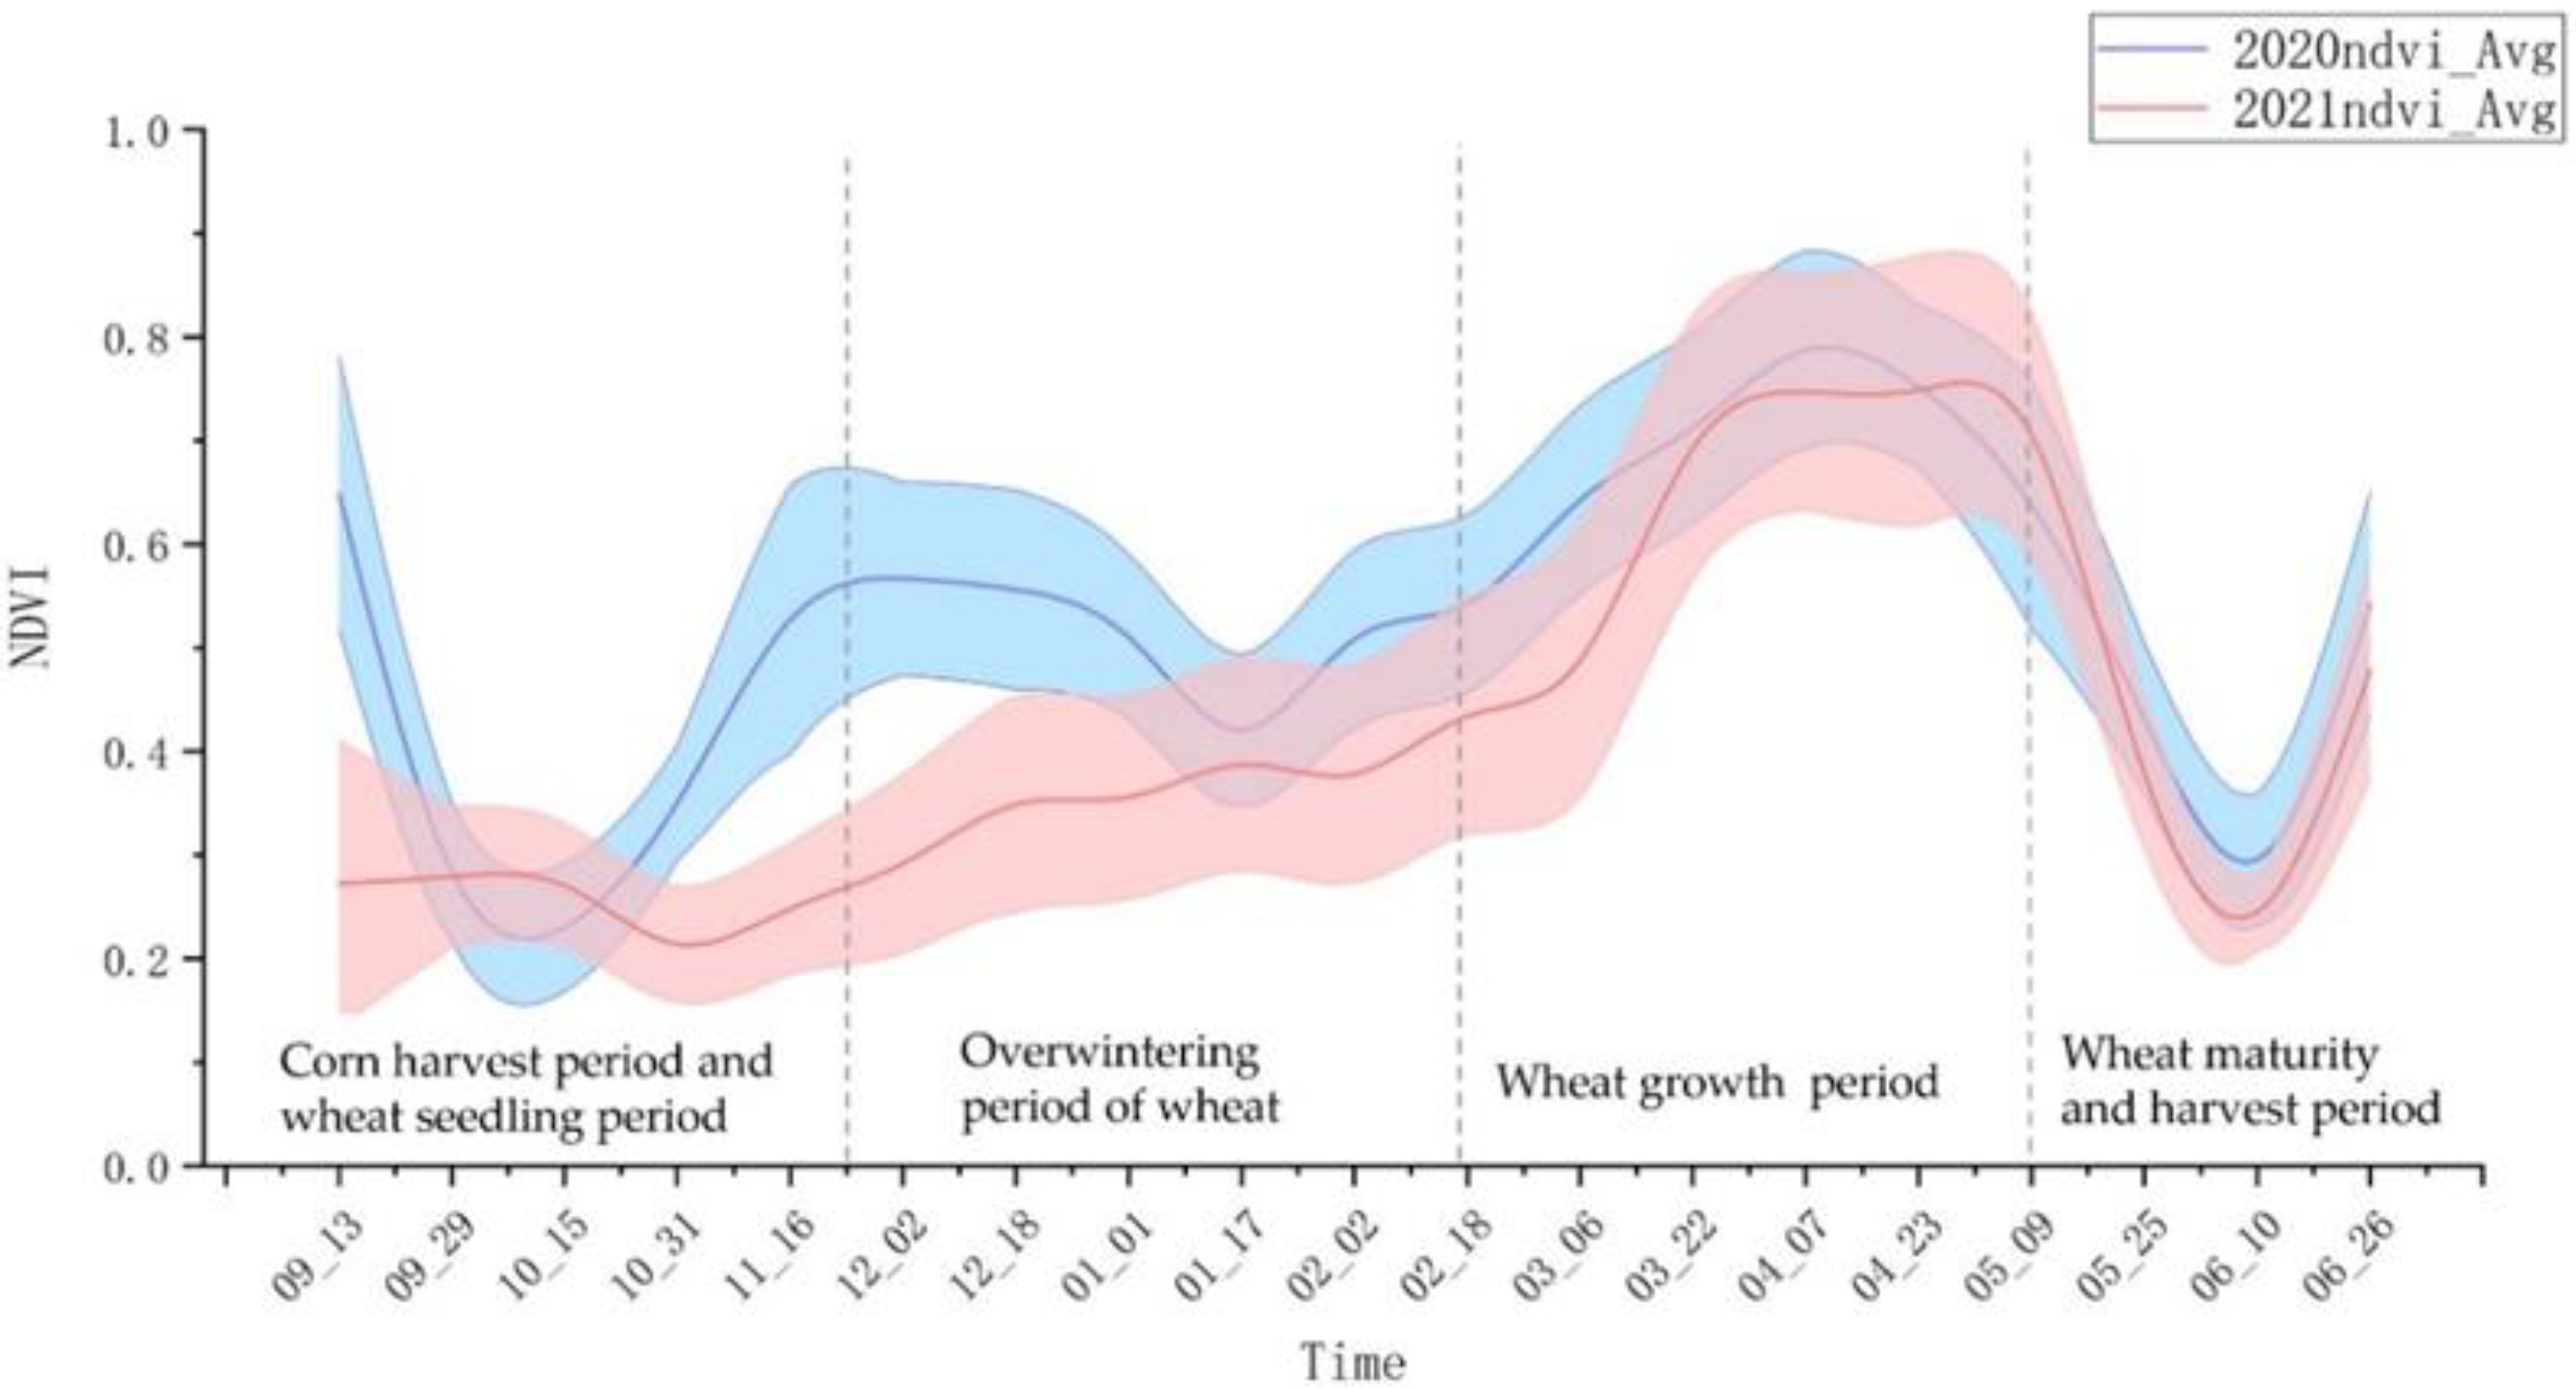
4.2. NDVI and NDWI Time Series of the Flood Year

An important basis of successful application of the proposed method is the sensitivity of NDVI and NDWI indices to the flood events: NDVI will capture vegetation growth status and NDWI reflects the moisture of the pixel. In this section, we illustrate the NDVI and NDWI series o the flood year and normal year to directly show the ability of the proposed method.
In the extraction results for the extent of the flood-affected areas in Henan Province (Figure 10), 152 sampling points were randomly selected and the NDVI time series change curves for sample points in 2020 and 2021 were extracted from the MODIS data (Figure 14). The autumn crops were sown in early June and harvested in late September and early October, with the NDVI values being the highest in August. However, after the NDVI values started to increase in June 2021, the NDVI values dropped abruptly to a low point in mid-late July when the floods occurred (Figure 14). Therefore, the difference between the NDVI values in August and June was used as an extraction feature. The NDVI values in the normal area in August were higher than those in June, and the difference was greater than 0, In addition, the difference in the NDVI in the total crop failure area was less than 0. After the flood, the crops in the total crop failure area stopped growing or the crop area became bare ground, while the crops in the normal area continued to grow until the crops were ripe for harvest.
From the same sample points, we extracted the time series change curves of NDWI for 2020 and 2021 (Figure 15). It can be seen that the NDWI value in 2021 reaches its highest value after the flood. Before the flood, the time series change curves of NDWI in 2020 and 2021 are roughly similar. Within two months after the flood, the NDWI values of 2021 are much higher than the same period in 2020 because of the high soil moisture content. Compared with NDVI series, the flood events affected the NDWI data in a relatively short period. After 13 September, the NDWI curves of normal year (2020) and flood year (2021) converged. Also, random vibrations appeared more frequently in NDWI curves than in NDVI series. These random changes are probably caused by rainfall events of different year.
In conclusion, NDVI and NDWI series are sensitive to vegetation growth and soil moisture, respectively. Both of them play important roles in flood information recognition, and they are effectively included in our method to ensure the effectiveness of the flood extraction.

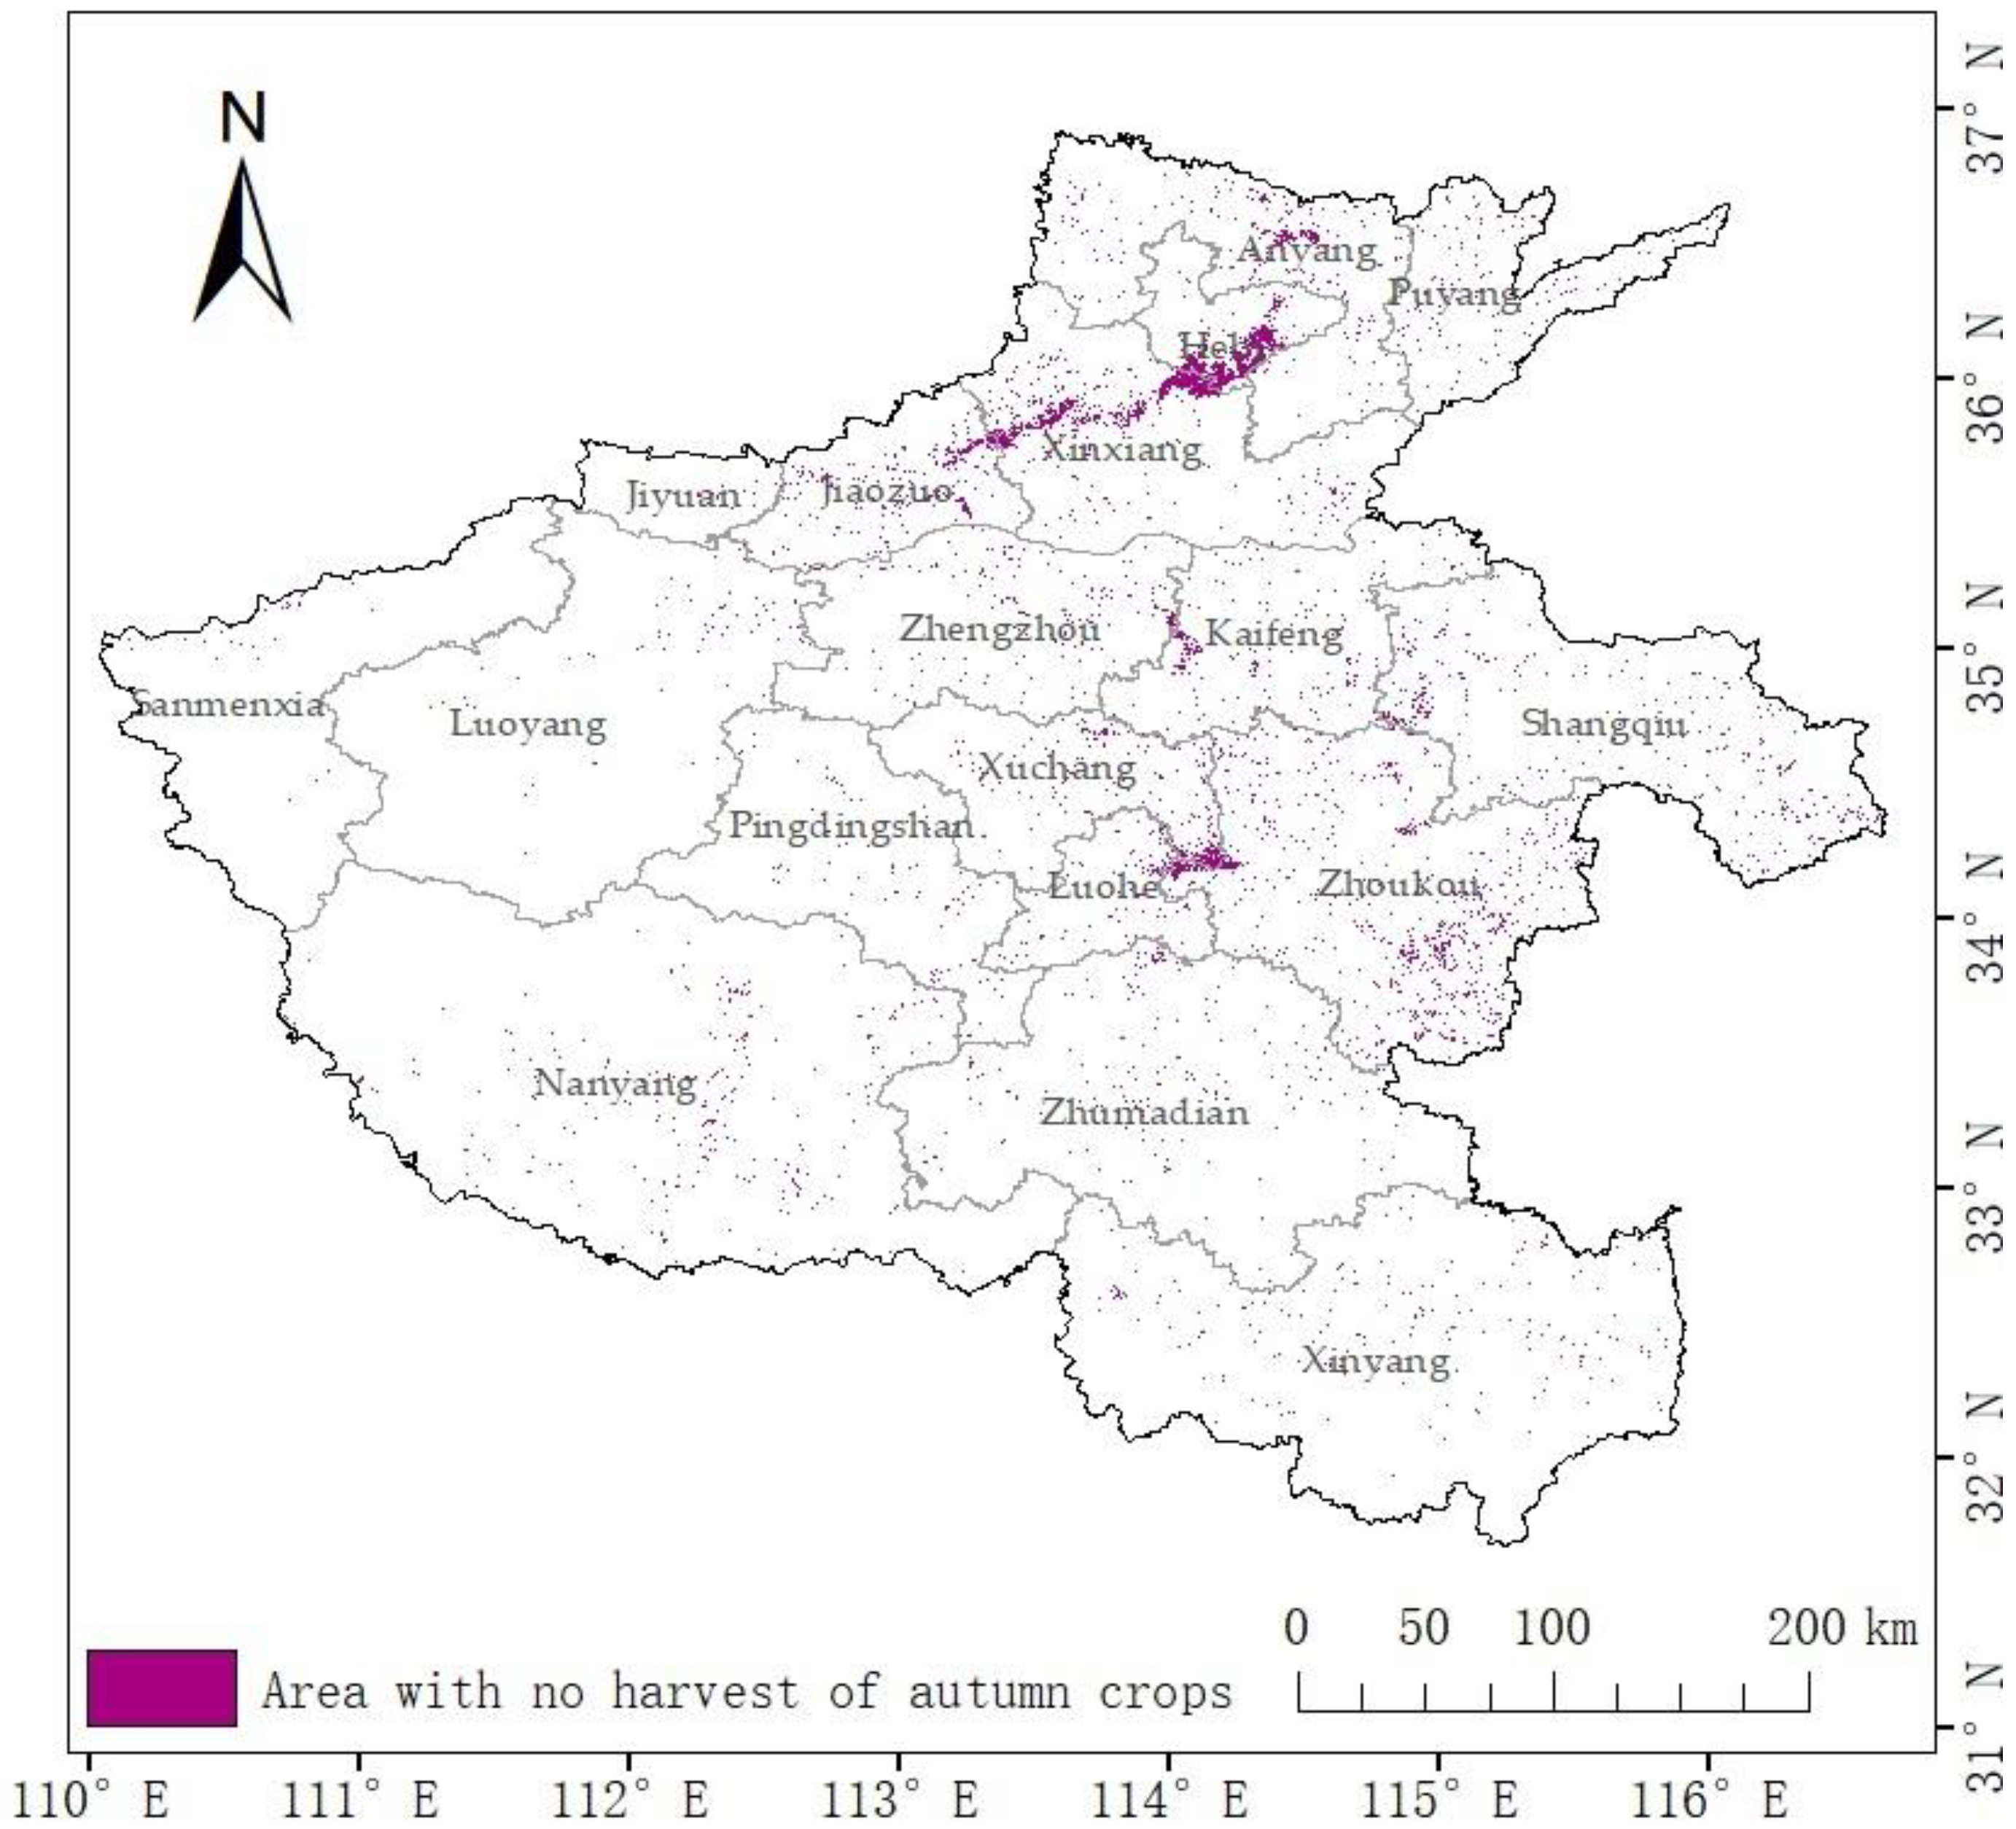
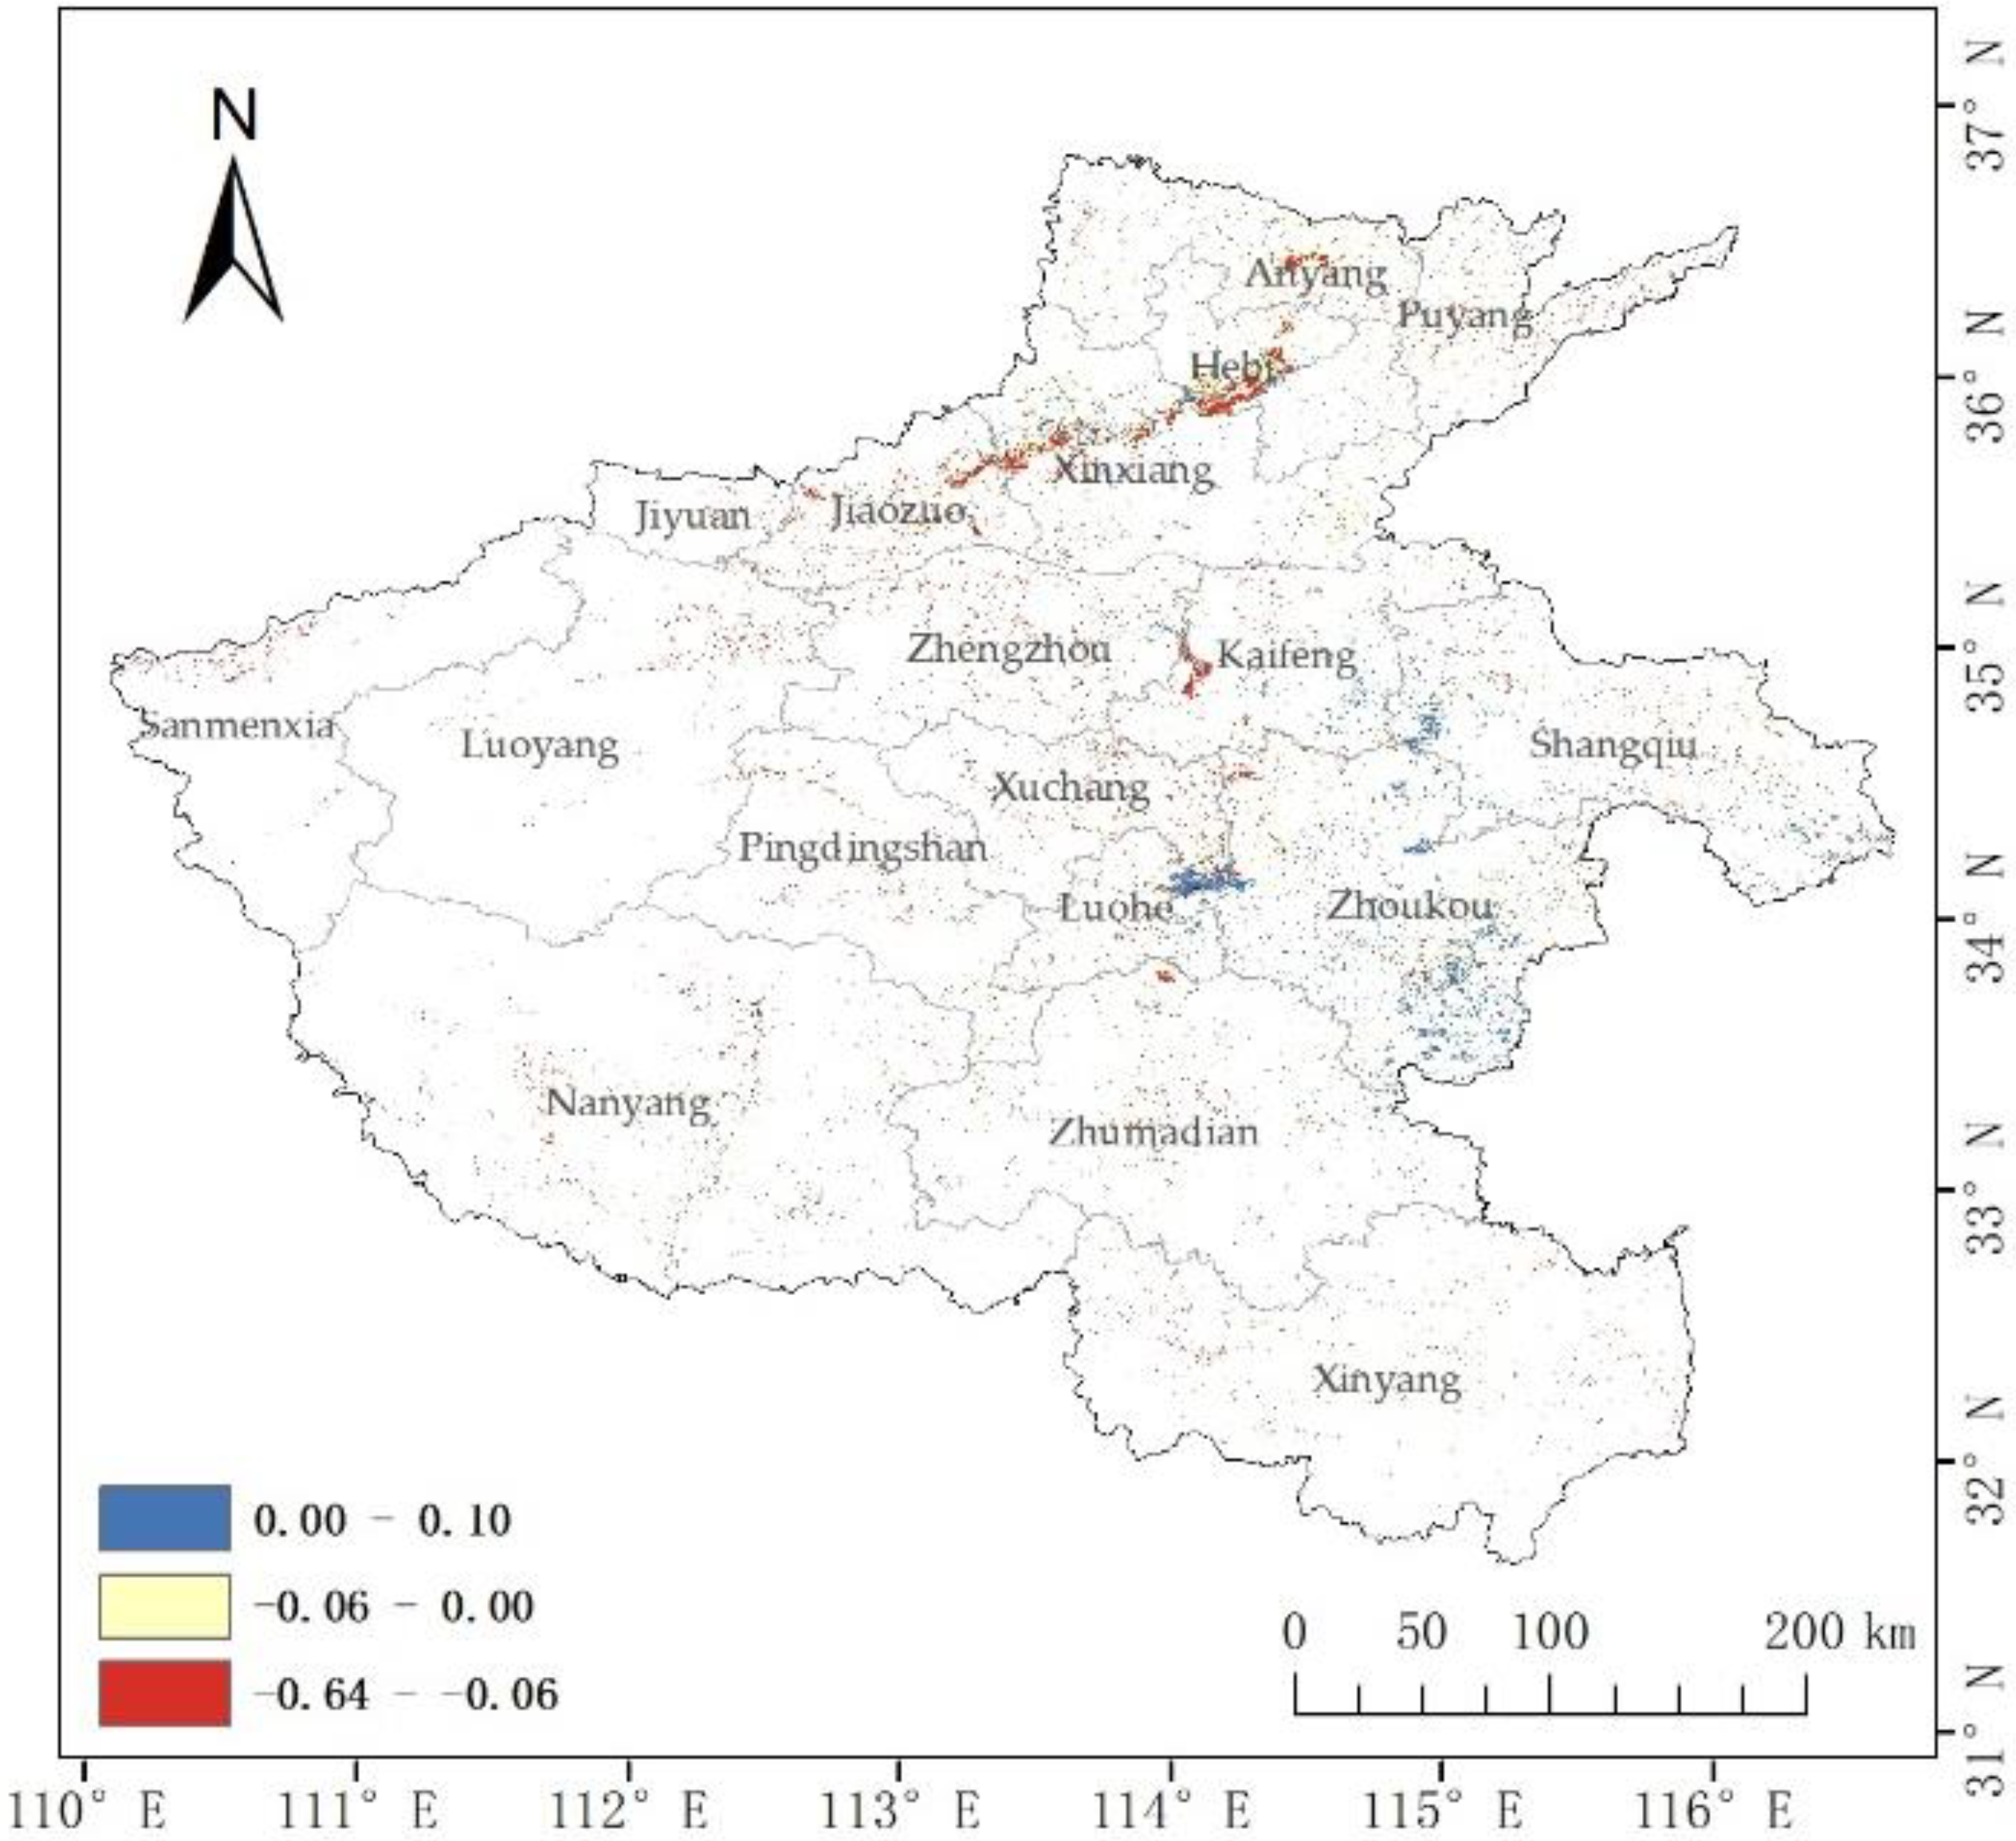
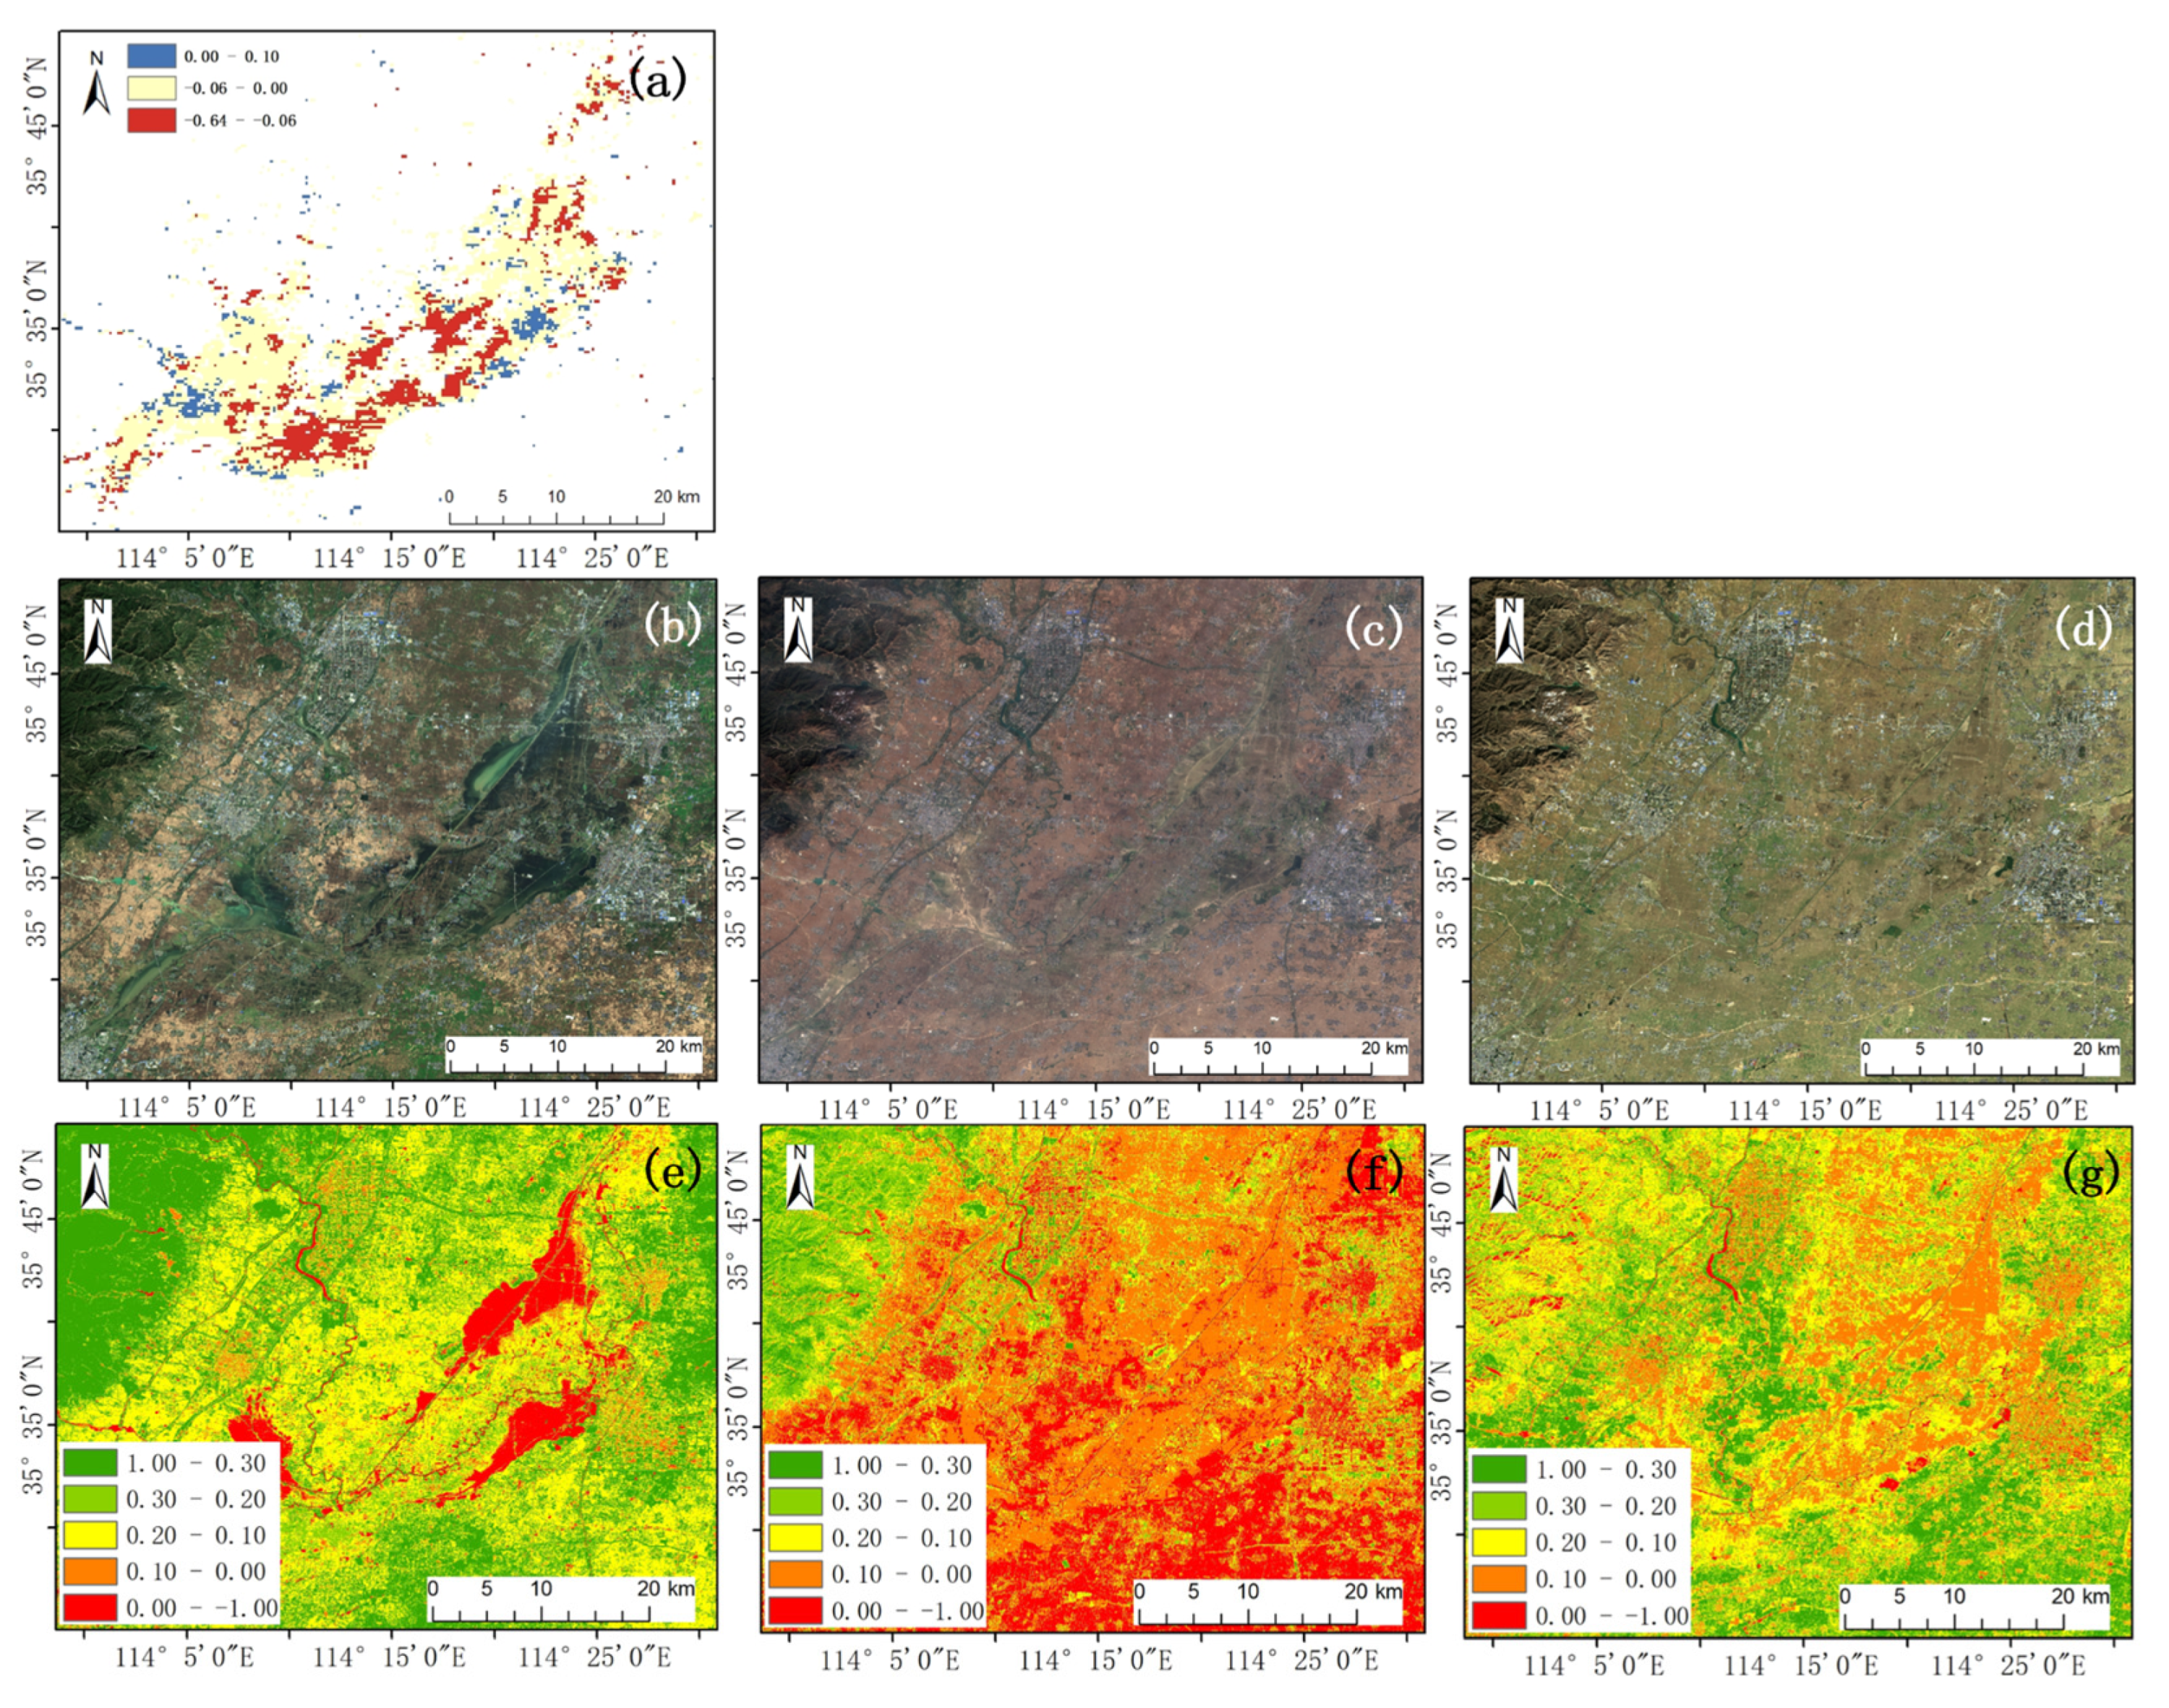
4.3. Total Crop Failure Area of Autumn Crops

The general idea of traditional methods of investigating crop losses due to flood disasters is to use historical statistical data and meteorological data to infer and predict the occurrence and loss due to floods. The main problem with this evaluation method is that its real-time performance is poor, and it cannot reflect the corresponding changes in farmland management and crop growth under floods [60]. This study is based on the GEE platform, which can be used to quickly obtain the affected area. We can easily extract the total crop failure area of the autumn crops and conduct NDVI time series analysis. The principle is as follows: after the crops are affected by floods, their normal growth process is inhibited, and the leaves turn yellow and wilt. Within the flood-affected areas extracted in this study, the NDVI data acquired before and after the flood were used to conduct comparative analysis and to derive the distribution of the total crop failure areas [61].
The main flood-affected areas were in the northern and eastern parts of Henan Province, where corn and peanuts were mainly cultivated. Corn is in the jointing period in July, which requires a lot of water but is not resistant to waterlogging. When the soil water content exceeds 90% of the maximum water holding capacity, corn will be stunted [62]. Severe floods cause the root system of corn to die due to a lack of oxygen, resulting in total corn crop failure. The peanuts in the flood were mainly affected by respiration. the presence of too much water in peanut fields directly drowns the roots in the soil, preventing them from absorbing outside air, thereby causing the plants to wither and die. Therefore, within the flood-affected area, the NDVI image difference changes between the two times were used to extract the total autumn crop failure distribution map.
To determine the specific timing for fall crop failure areas, we further carried out a one-way ANOVA analysis of the 2020 and 2021 NDVI series (Figure 15) to quantitatively compare the differences and derive the most sensitive time to separate flood affected regions and normal regions (Table 11). From the table, it is concluded that before the flood (07_11), for five in 11 time points, NDVI values from normal year and flood year do not differ significantly (p > 0.001). After the flood, NDVI values of 14 in 15 points of normal years and flood years are significantly different (p < 0.001). The largest F-value and the smallest p-value were found on 12 August, indicating the largest difference between groups, i.e., the most sensitive time point of extracting flood information, occurred then. On 25 June, the F value is 2.12, indicating that there is no significant difference (p < 0.001) between the two groups. Therefore, 25 June was taken as the pre-flood time point. Therefore, the difference between the two NDVI images on 25 June and 12 August was used to extract the total autumn crop failure distribution map (Figure 16).
Based on the results, the total area of total crop failure in autumn caused by this flood was 3792.8 km2, and the crop failure areas were mainly concentrated in the southern part of Hebi, the northern-central part of Xinxiang, and the eastern part of Anyang in the northern part of Henan Province, as well as the western part of Zhoukou and Kaifeng in the eastern part of Henan Province (Figure 16).

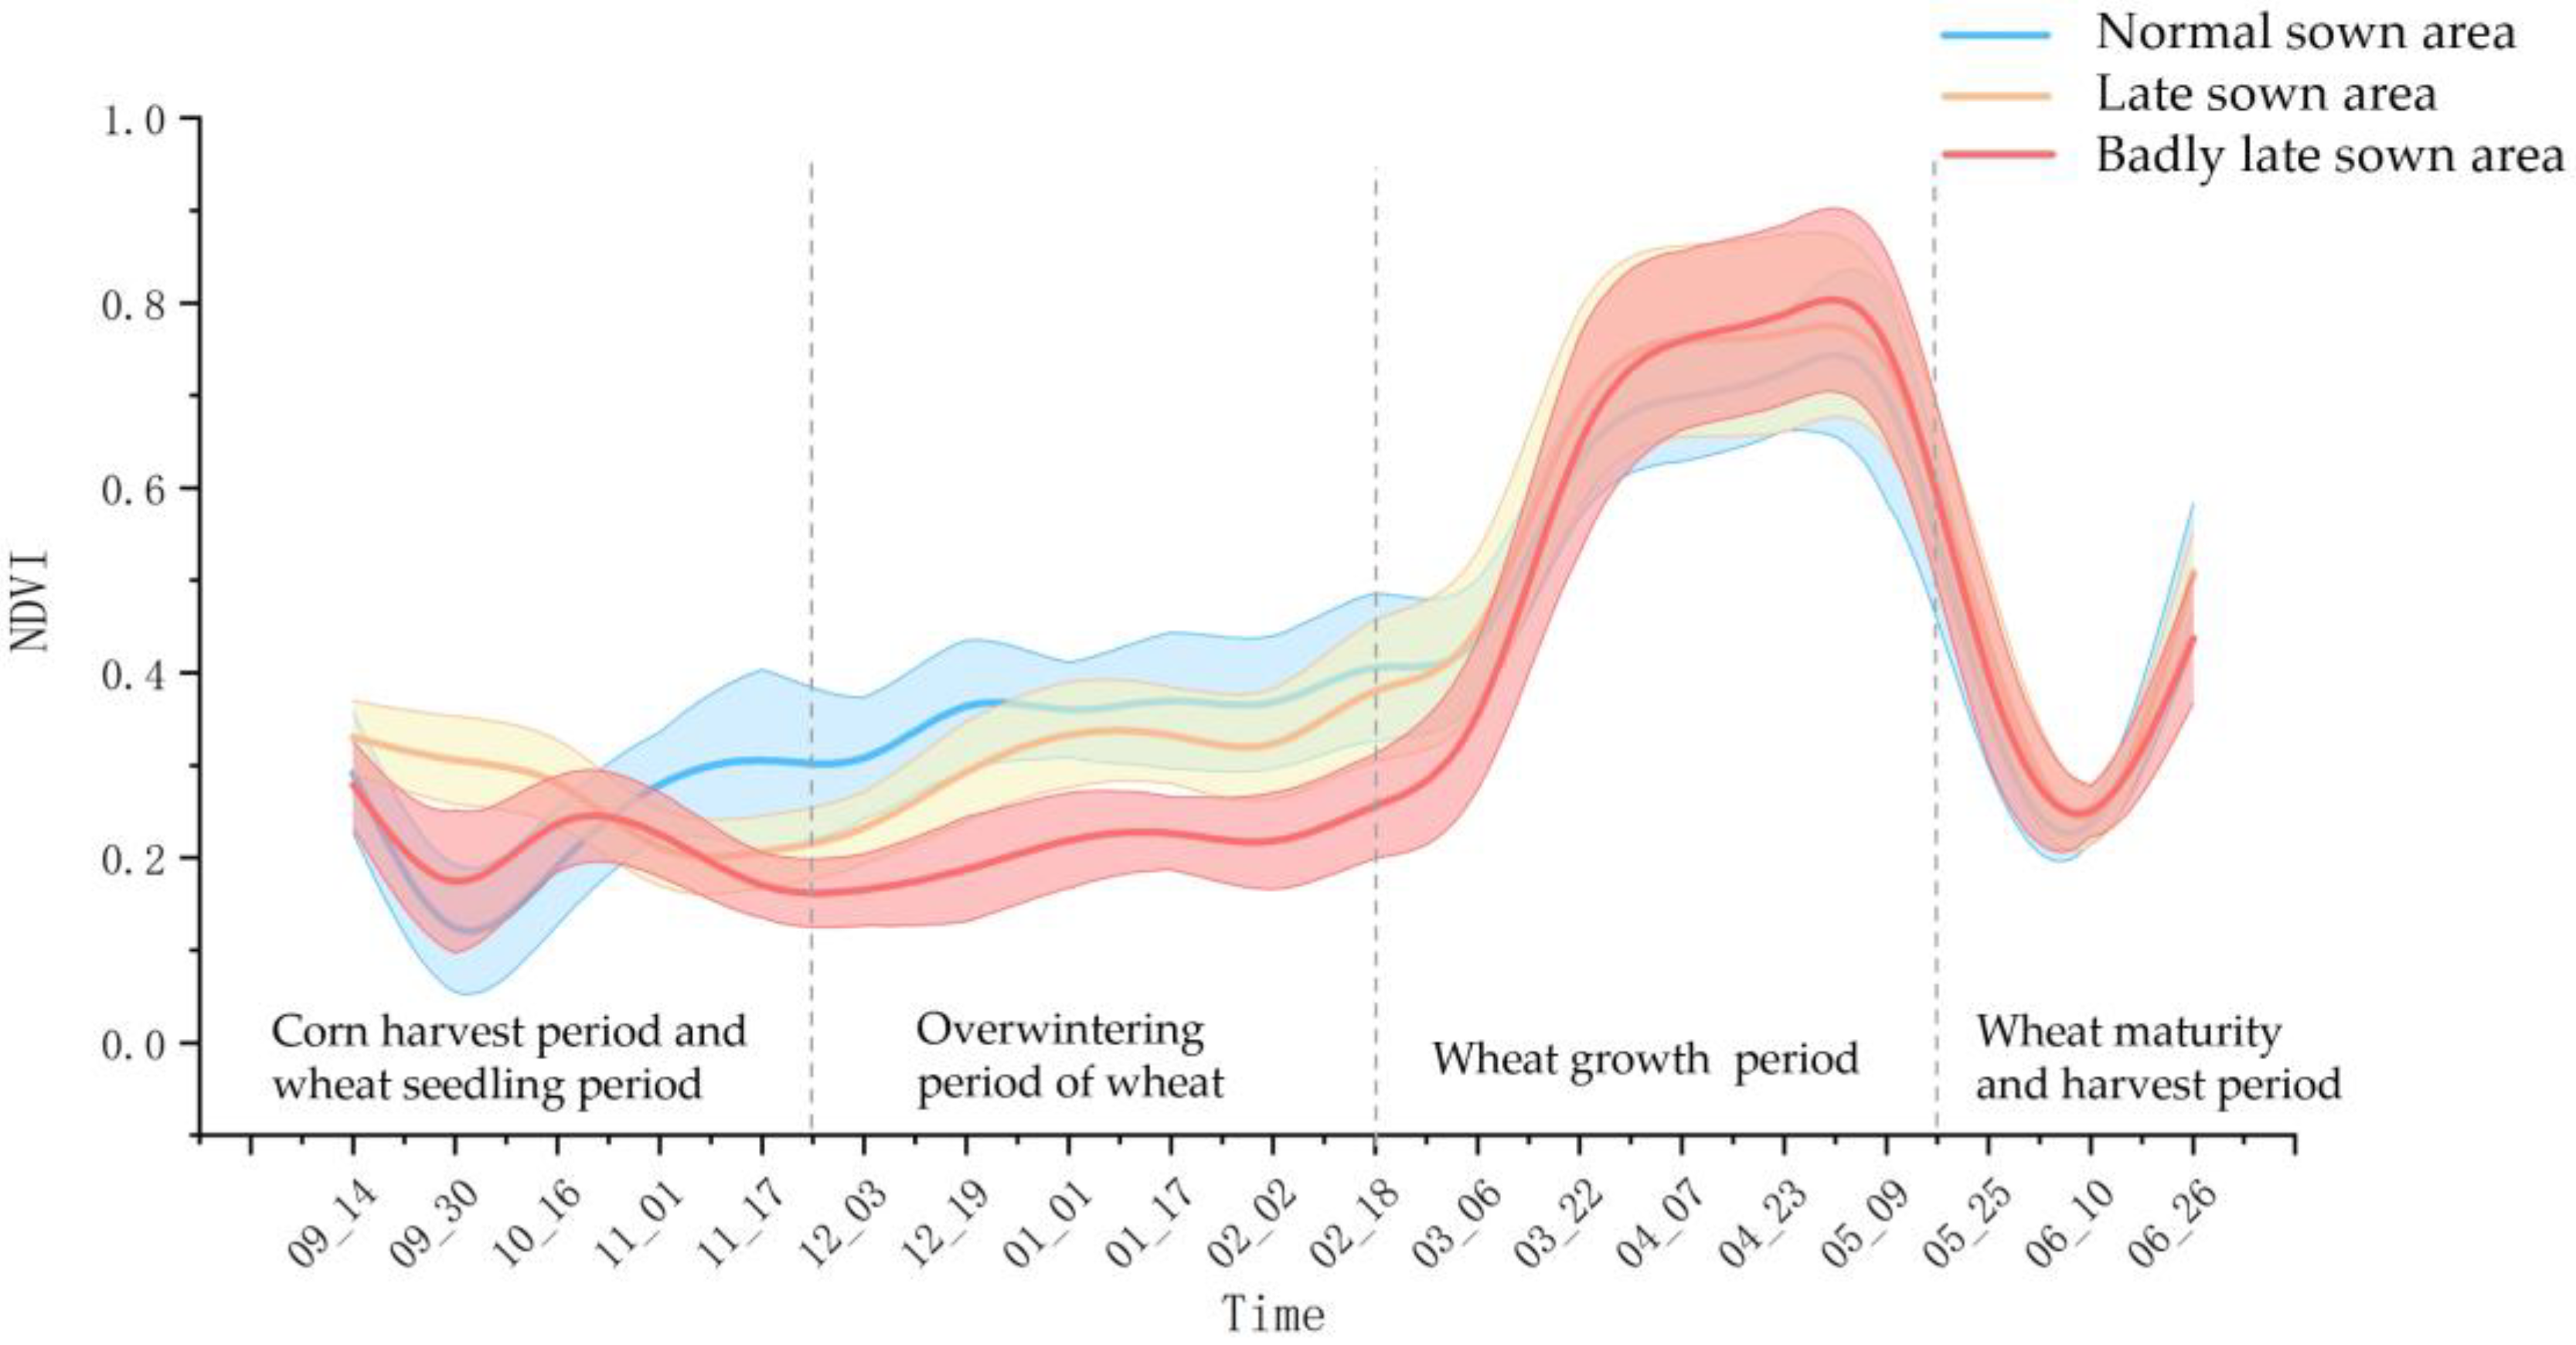
4.4. Late-Sown Winter Wheat Area

Affected by flood disasters, the wheat sowing was delayed by accumulated water in the fields in northern and eastern Henan. In this section, based on the flood affected areas, we analyzed the late sowing of winter wheat to provide scientific guidance for post-disaster wheat plant management and seed raising.
Rapid assessment of information on the area of farmland affected by flooding to different degrees, depending on the degree of late sowing, can help to reduce disaster risk. Vegetation index is a simple and effective metric parameter to characterize surface vegetation coverage in the field of remote sensing [63], and is widely used in studies such as vegetation growth monitoring [64] and vegetation cover monitoring [65,66]. NDVI has become the best remote sensing index to monitor the vegetation cover and growth status [67].
Winter wheat is sowing right after the summer crops have been harvested. After this farming activity, NDVI curves began to rise in early-mid October, 2020. However, in 2021, the rising point of NDVI curves has been shifted to 31 October (Figure 17), indicating a 15-day delaying wheat sowing. As a result of late sowing, the NDVI curves in 2021 are systematically lower compared with those in 2020 in the wheat seedling period, overwintering period, and part of the wheat growth period. This indicated that wheat growing was obviously influenced by late sowing. Interestingly, 2021 NDVI values are slightly higher than 2020 between late September and mid-October. One possible reason is that the heavy flood made the farmers abandon the corn plants in the fields.
Therefore, we calculated the NDVI difference between 1 November and 15 October as the sensitive factor for late sowing. According to this definition, the difference is greater than 0 in normal region. In the late-seeded region, the difference is smaller or close to 0. The smaller the difference value, the later the sowing was done. Based on this method, we calculated the NDVI difference map of the flood affected region (Figure 18). To evaluate late sowing degree, the difference map was divided into three categories according to the natural breakpoint method. The regions with a difference value greater than 0, less than −0.06, and in range of −0.06 and 0, were defined as the normal sown area, the badly late sown area, and the late sown area. Among them, the area of normal sown, late sown, and badly late sown in Henan Province are 960.43 km2, 1953.94 km2, and 855.81 km2, respectively. Spatially, the badly sown area is mainly distributed in the flood inundation area, where the farmland was seriously waterlogged and the terrain is flat and difficult to drain. The normal sowing areas were distributed in the flood-affected areas in central and eastern Henan Province, where the overall precipitation was less (Figure 3) and had less impact on wheat sowing, as well as a small number of late sowing areas (Figure 18).
To illustrate the late sowing regions in detail, we mapped a typical region in Hebi (Figure 19). As shown in Figure 19, the normal sown regions were sporadically distributed along the edges of the flood-affected areas. The badly late sown areas were mainly in the center of the flood-affected areas and the farmlands around the rivers. The area of late sown regions was the largest. At the end of September (Figure 19b), some regions were still inundated. For areas not affected by the floods, autumn crops were getting mature and would be harvested soon (Figure 19b,e). At the end of October (Figure 19c), surface water was vaporized or drained in the flood-affected areas. The NDVI values were slightly higher than those in the surrounding non-flooded areas (Figure 19f). This phenomenon corresponds to the October decreasing NDVI curves in Figure 12. It is because for normal regions, harvesting actives were successfully processed. But for flooded regions, the farmland was heavily silted up and large machinery could not enter the field. The harvesting of the autumn crop was then delayed. The following late sowing further influenced wheat growing in the overwintering period (Figure 17) and generated the NDVI depression at the end of November (Figure 19g).
To clearly judge the three late sowing degrees (Figure 19a), we selected and plotted some typical pixels from the NDVI time series images of these types (Figure 20). On the one hand, the sowing times of the three late sowing degrees are different. With the earliest sowing time in the normal sown area, the NDVI values kept increasing after 30 September. The late sown area started sowing on 1 November. Lastly, the badly late sown area started sowing in around 17 November, after which the NDVI values started to rise slowly. The time difference between the earliest and the latest sowing was about 46 days. On the other hand, the three late sowing levels differed in the NDVI values of wheat during the overwintering period, with the highest NDVI values and the best wheat growth in the normal sown area during the overwintering period. This was followed by the late sown area, where the overall NDVI values were slightly lower than those of the normal sown area. Finally, the overall NDVI values in the badly late sown areas were the lowest and grew slowly during the overwintering period.
In practical application, using the October difference map, it is possible to quickly derive a distribution map of different levels of late sowing. Combined with the guidance of agricultural experts, different measurements to avoid yield reduction could be taken for different regions, such as varied fertilizer application recommendations for different late sowing levels and precise management with the guidance of flood-affected region. These polices have the potential of protect real benefits of farmers and ensure food security.

4.5. Limitations and Prospects

Based on the GEE cloud platform and multi-source remote sensing images, we constructed a set of real-time flood extraction methods in this study, and we analyzed the impact of floods on two crops, corn and wheat. However, when using this research method to extract flood information in other regions, the following factors need to be considered. First, in this study, we used this method to extract flood information in Henan Province, and MODIS images were selected as a data source due to their spatial and temporal coverages, so the small-scale spatial extent could not be accurately extracted when extracting the flood-affected areas. Therefore, this method is more suitable for the extraction of flood information about large-scale agricultural land. If multispectral images with a higher spatial resolution such as Sentinel 2 images are used, the temporal resolution will not be sufficient to offset the thick cloud contamination and to obtain results over a large area. Thus, the data source is still an important limiting factor in this method. Second, the flood in Henan Province occurred in July, which is a period of relatively rapid crop growth and significant changes in NDVI values. However, if the flood occurs in the harvesting stage or the early sowing stage, the NDVI time series changes under the influence of the flood will not be significant, and it will be difficult to distinguish the agricultural land affected by the flood using the NDVI index, for example, the flood disaster in Shanxi Province in analyzed October in this study, in which the flood-affected area was larger than the actual situation. The reason is that the flooding in Shanxi occurred in October. The harvest was ongoing and the NDVI values decreased naturally. The NDVI curves cannot effectively distinguish harvesting and flooding. Finally, the study area was Henan Province, where the terrain is flat and open, the plots are relatively flat with large crop cultivation scale, and most of the flooded areas were in the plain in northern and eastern Henan. This area had a single crop cultivation structure, i.e., most of the fall crops were corn, peanuts, and other crops with similar sowing and harvesting periods. Therefore, the extraction method should be further demonstrated and tested in an area where the crop species in the study area are complex, with different sowing, development, and harvesting periods.
In the application of this research method, due to the low resolution of MODIS, the extraction accuracy is can be improved in small areas or fragmented agricultural land in the future; also, extracting flood in the harvesting period is challenging for our method.
In recent years, many researchers have achieved excellent results in crop structure extraction [68,69]. If they are combined with our proposed method, it will provide important information for the government to take specific relief measures for different types of agricultural land in the flood-affected areas. This could reduce the economic losses caused by flooding of agricultural land and enable scientific assessment and prediction of the amounts of various crop losses in flood-affected years.
For flood information extraction based on change detection, we used a single threshold segmentation method to divide the study area into flood inundation or flood-affected areas. After accumulating a large number of multi-temporal images of the study area, the classification precision could be improved through combination with higher precision deep learning methods. In addition, for flood information extraction based on multi-source data, climate data such as precipitation and evaporation; hydrological data such as the capacity and flow direction of reservoirs, lakes, and rivers can be added to extract flood information from various aspects in order to improve the precision of the flood extraction. Finally, the area of Henan Province is large. Due to the influences of temperature, soil, precipitation, and terrain, the crop species, growth, and development information vary with latitude and altitude, and whether these differences have an impact on the flood extraction is worth further investigation.
With the development of remote sensing technology, more and more sensors with high temporal and spatial resolutions are gradually being put into use, such as the CubeSat and high score series. In the future, based on high-resolution data, we can combine radar and optical multi-source satellite data to achieve real-time, dynamic monitoring of floods, and we can combine these data with ground station data, terrain data, and hydrological models to simultaneously perform multi-level monitoring and simulation and to achive monitoring and early warning.

5. Conclusions and Suggestions

In response to the demand for the development of wide-area, rapid, and precise flood remote sensing monitoring, in this study, a method of extracting the flood inundation area and flood-affected area of agricultural land was developed based on the joint support of radar images and optical images, and the method was tested using two typical flood events as examples. The conclusions of this study are as follows.
  • Dynamic and real-time identification of flood inundation areas and flood-affected areas were realized using the GEE cloud platform and multi-source image data;
  • In Henan Province, the overall precision and kappa coefficient of flood inundation area extraction were 87% and 0.73, respectively, and the overall precision and kappa coefficient of the flood-affected area were 92% and 0.84, respectively. In Shanxi Province, the overall precision and kappa coefficient of the flood inundation area extraction were 85% and 0.71, respectively, and the overall precision and kappa coefficient of the flood-affected area were 96% and 0.93, respectively;
  • Based on the distribution of the flood-affected areas, the total crop failure area was extracted easily and quickly, and the effect of the late sowing on the growth of the winter wheat was analyzed.
  • There are two main suggestions of the research results to practical policy: (1) The geographical location of flood-affected areas is mostly along rivers and low-lying areas, so we should strengthen the construction of high-standard farmland, build water conservancy facilities, improve the level of farmland improvement and river improvement projects, and actively defend against flooding. (2) The government should improve the agricultural insurance system, and provide economic subsidies and help according to the disasters to minimize the loss of farmers and promote the work of agricultural resumption.
The code of this algorithm on the GEE platform is available to the public at https://code.earthengine.google.com/561c41b41eec921df1eb6139386f5235 (accessed on 15 November 2022) and can be used for large-scale flood information extraction for flood scheduling and disaster prevention and mitigation provide scientific basis for decision making.

Supplementary Materials

The following supporting information can be downloaded at: https://www.mdpi.com/article/10.3390/agronomy13020355/s1, Figure S1: Field shot flood in crop lands of Henan Province after the “7.11” rainfall in 2021; Figure S2: Histogram of Sentinel-1 VV images after flooding in Henan Province; Figure S3: Flood region map that derived only from Sentinel-1 images.

Author Contributions

Conceptualization, L.L. and Y.G.; methodology, J.C., Q.X., and Y.G.; software, J.C. and L.S.; validation, J.C., G.J., and D.L.; formal analysis, Y.G., L.S., and W.C.; investigation, D.L. and Q.X.; data curation, J.C.; writing—original draft preparation, J.C. and Y.G.; writing—review and editing, Y.G. and L.L.; visualization, J.C. and Q.X.; supervision, L.L. and W.C.; project administration, L.L.; funding acquisition, L.L., W.C., and Y.G. All authors have read and agreed to the published version of the manuscript.

Funding

This research was funded by National Natural Science Foundation of China, grant number 42077004, 41701422; National Key R&D Program of China, grant number 2021YFD1700900.

Institutional Review Board Statement

Not applicable.

Informed Consent Statement

Informed consent was obtained from all subjects involved in the study.

Data Availability Statement

Data available on request from the authors.

Conflicts of Interest

The authors declare no conflict of interest.

References

  1. Field, C.B.; Barros, V.; Stocker, T.F.; Dahe, Q. Managing the Risks of Extreme Events and Disasters to Advance Climate Change Adaptation: Special Report of the Intergovernmental Panel on Climate Change; Cambridge University Press: Cambridge, UK, 2012. [Google Scholar]
  2. Li, X.; Chen, H.; Li, Y. A Review on Monitoring and Assessment of flood disaster by satellite remote sensing. Chin. J. Agrometeorol. 2009, 30, 102–108. [Google Scholar]
  3. Boschetti, M.; Nelson, A.; Nutini, F.; Manfron, G.; Busetto, L.; Barbieri, M.; Laborte, A.; Raviz, J.; Holecz, F.; Mabalay, M.; et al. Rapid Assessment of Crop Status: An Application of MODIS and SAR Data to Rice Areas in Leyte, Philippines Affected by Typhoon Haiyan. Remote Sens. 2015, 7, 6535–6557. [Google Scholar] [CrossRef] [Green Version]
  4. Li, M.; Zhang, T.; Tu, Y.; Ren, Z.; Xu, B. Monitoring Post-Flood Recovery of Croplands Using the Integrated Sentinel-1/2 Imagery in the Yangtze-Huai River Basin. Remote Sens. 2022, 14, 690. [Google Scholar] [CrossRef]
  5. Feng, R. Remote sensing monitoring of flood drowning range. Liaoning Meteorol. Q. 2002, 04, 26–27. [Google Scholar]
  6. Wang, S. Research on Flood Remote Sensing Monitoring of the Lower Reaches of the Yellow River Based on Modis Data; Hohai University: Nanjing, China, 2006. [Google Scholar]
  7. Yang, C.; Wei, Y.; Chen, D. Investigation on extracting the flow inundated area from Jers-1SAR data. J. Nat. Disasters 1998, 7, 46–51. [Google Scholar]
  8. Zhang, Y. Using LiDAR-DEM based rapid flood inundation modelling framework to map floodplain inundation extent and depth. J. Geogr. Sci. 2021, 30, 1649–1663. [Google Scholar] [CrossRef]
  9. Tong, X.; Luo, X.; Liu, S.; Xie, H.; Chao, W.; Liu, S.; Liu, S.; Makhinov, A.N.; Makhinova, A.F.; Jiang, Y. An approach for flood monitoring by the combined use of Landsat 8 optical imagery and COSMO-SkyMed radar imagery. ISPRS J. Photogramm. Remote Sens. 2018, 136, 144–153. [Google Scholar] [CrossRef]
  10. DeVries, B.; Huang, C.; Armston, J.; Huang, W.; Jones, J.W.; Lang, M.W. Rapid and robust monitoring of flood events using Sentinel-1 and Landsat data on the Google Earth Engine. Remote Sens. Environ. 2020, 240, 111664. [Google Scholar] [CrossRef]
  11. Chini, M.; Pelich, R.; Pulvirenti, L.; Pierdicca, N.; Hostache, R.; Matgen, P. Sentinel-1 InSAR Coherence to Detect Floodwater in Urban Areas: Houston and Hurricane Harvey as a Test Case. Remote Sens. 2019, 11, 107. [Google Scholar] [CrossRef] [Green Version]
  12. Shen, X.; Wang, D.; Mao, K.; Anagnostou, E.; Hong, Y. Inundation Extent Mapping by Synthetic Aperture Radar: A Review. Remote Sens. 2019, 11, 879. [Google Scholar] [CrossRef] [Green Version]
  13. Psomiadis, E.; Diakakis, M.; Soulis, K.X. Combining SAR and Optical Earth Observation with Hydraulic Simulation for Flood Mapping and Impact Assessment. Remote Sens. 2020, 12, 3980. [Google Scholar] [CrossRef]
  14. Rättich, M.; Martinis, S.; Wieland, M. Automatic Flood Duration Estimation Based on Multi-Sensor Satellite Data. Remote Sens. 2020, 12, 643. [Google Scholar] [CrossRef] [Green Version]
  15. Kotera, A.; Nagano, T.; Hanittinan, P.; Koontanakulvong, S. Assessing the degree of flood damage to rice crops in the Chao Phraya delta, Thailand, using MODIS satellite imaging. Paddy Water Environ. 2015, 14, 271–280. [Google Scholar] [CrossRef]
  16. Pérez, I.S.P.M.; Bances, K.E.B.; Zavaleta, L.J.T.; Cabrera, H.I.M.; Monteza, V.A.T. Systematic Review of the Study of Flood Risks using Remote Sensing. Int. J. Eng. Adv. Technol. 2021, 11, 96–103. [Google Scholar] [CrossRef]
  17. Jiménez-Jiménez, S.I.; Ojeda-Bustamante, W.; Ontiveros-Capurata, R.E.; Marcial-Pablo, M.d.J. Rapid urban flood damage assessment using high resolution remote sensing data and an object-based approach. Geomat. Nat. Hazards Risk 2020, 11, 906–927. [Google Scholar] [CrossRef]
  18. Sajjad, A.; Lu, J.; Chen, X.; Chisenga, C.; Saleem, N.; Hassan, H. Operational Monitoring and Damage Assessment of Riverine Flood-2014 in the Lower Chenab Plain, Punjab, Pakistan, Using Remote Sensing and GIS Techniques. Remote Sens. 2020, 12, 714. [Google Scholar] [CrossRef] [Green Version]
  19. Rahman, M.S.; Di, L.; Yu, E.; Lin, L.; Yu, Z. Remote Sensing Based Rapid Assessment of Flood Crop Damage Using Novel Disaster Vegetation Damage Index (DVDI). Int. J. Disaster Risk Sci. 2020, 12, 90–110. [Google Scholar] [CrossRef]
  20. Tay, C.W.J.; Yun, S.H.; Chin, S.T.; Bhardwaj, A.; Jung, J.; Hill, E.M. Rapid flood and damage mapping using synthetic aperture radar in response to Typhoon Hagibis, Japan. Sci. Data 2020, 7, 100. [Google Scholar] [CrossRef] [Green Version]
  21. Lin, Y.N.; Yun, S.H.; Bhardwaj, A.; Hill, E.M. Urban Flood Detection with Sentinel-1 Multi-Temporal Synthetic Aperture Radar (SAR) Observations in a Bayesian Framework: A Case Study for Hurricane Matthew. Remote Sens. 2019, 11, 1778. [Google Scholar] [CrossRef]
  22. Wagner, W.; Freeman, V.; Cao, S.; Matgen, P.; Chini, M.; Salamon, P.; McCormick, N.; Martinis, S.; Bauer-Marschallinger, B.; Navacchi, C.; et al. Data Processing Architectures for Monitoring Floods Using Sentinel-1. ISPRS Ann. Photogramm. Remote Sens. Spat. Inf. Sci. 2020, V-3-2020, 641–648. [Google Scholar] [CrossRef]
  23. Moya, L.; Mas, E.; Koshimura, S. Learning from the 2018 Western Japan Heavy Rains to Detect Floods during the 2019 Hagibis Typhoon. Remote Sens. 2020, 12, 2244. [Google Scholar] [CrossRef]
  24. Dasgupta, A.; Grimaldi, S.; Ramsankaran, R.; Pauwels, V.R.; Walker, J.P.; Chini, M.; Hostache, R. Flood Mapping Using Synthetic Aperture Radar Sensors from Local to Global Scales. In Global Flood Hazard: Applications in Modeling, Mapping, and Forecasting; John Wiley & Sons, Inc.: New York, NY, USA, 2018; pp. 55–77. [Google Scholar] [CrossRef]
  25. Musa, Z.N.; Popescu, I.; Mynett, A. A review of applications of satellite SAR, optical, altimetry and DEM data for surface water modelling, mapping and parameter estimation. Hydrol. Earth Syst. Sci. Discuss. 2015, 12, 4857–4878. [Google Scholar] [CrossRef] [Green Version]
  26. Jawak, S.D.; Kulkarni, K.; Luis, A.J. A Review on Extraction of Lakes from Remotely Sensed Optical Satellite Data with a Special Focus on Cryospheric Lakes. Adv. Remote Sens. 2015, 4, 196–213. [Google Scholar] [CrossRef] [Green Version]
  27. Malinowski, R.; Groom, G.B.; Heckrath, G.; Schwanghart, W. Do Remote Sensing Mapping Practices Adequately Address Localized Flooding? a Critical Overview. Springer Sci. Rev. 2017, 5, 1–17. [Google Scholar] [CrossRef]
  28. Canisius, F.; Brisco, B.; Murnaghan, K.; Van Der Kooij, M.; Keizer, E. SAR Backscatter and InSAR Coherence for Monitoring Wetland Extent, Flood Pulse and Vegetation: A Study of the Amazon Lowland. Remote Sens. 2019, 11, 720. [Google Scholar] [CrossRef] [Green Version]
  29. Tang, L.; Liu, W.; Yang, D.; Chen, L. Flooding monitoring application based on the object-oriented method and Sentinel-1A SAR data. J. Geo Inf. Sci. 2018, 20, 377–384. [Google Scholar]
  30. Long, S.; Fatoyinbo, T.E.; Policelli, F. Flood extent mapping for Namibia using change detection and thresholding with SAR. Environ. Res. Lett. 2014, 9, 035002. [Google Scholar] [CrossRef]
  31. Kundu, S.; Lakshmi, V.; Torres, R. Flood Depth Estimation during Hurricane Harvey Using Sentinel-1 and UAVSAR Data. Remote Sens. 2022, 14, 1450. [Google Scholar] [CrossRef]
  32. Tiampo, K.F.; Huang, L.; Simmons, C.; Woods, C.; Glasscoe, M.T. Detection of Flood Extent Using Sentinel-1A/B Synthetic Aperture Radar: An Application for Hurricane Harvey, Houston, TX. Remote Sens. 2022, 14, 2261. [Google Scholar] [CrossRef]
  33. Luan, Y.; Guo, J.; Gao, Y.; Liu, X. Remote sensing monitoring of flood and disaster analysis in Shouguang in 2018 from Sentinel-1B SAR data. J. Nat. Disasters 2021, 30, 168–175. [Google Scholar] [CrossRef]
  34. Su, Y. Study on Remote Sensing Monitoring Method of Multi-Source Satellite for Rainstorm and Flood in Farmland; Xi’an University of Science and Technology: Xi’an, China, 2018. [Google Scholar]
  35. Bryant, R.G.; Rainey, M.P. Investigation of flood inundation on playas within the Zone of Chotts, using a time-series of AVHRR. Remote Sens. Environ. 2002, 82, 360–375. [Google Scholar] [CrossRef]
  36. Jain, S.K.; Saraf, A.K.; Goswami, A.; Ahmad, T. Flood inundation mapping using NOAA AVHRR data. Water Resour. Manag. 2006, 20, 949–959. [Google Scholar] [CrossRef]
  37. Ulloa, N.I.; Yun, S.-H.; Chiang, S.-H.; Furuta, R. Sentinel-1 Spatiotemporal Simulation Using Convolutional LSTM for Flood Mapping. Remote Sens. 2022, 14, 246. [Google Scholar] [CrossRef]
  38. Ejikeme, J.O.; Igbokwe, J.I.; Ojiako, J.C.; Emengini, E.J.; Aweh, D.S. Modelling the Impact of Flooding Using Geographic Information System and Remote Sensing. Int. J. Tech. Res. Appl. 2015, 3, 67–72. [Google Scholar]
  39. Sghaier, M.O.; Hammami, I.; Foucher, S.; Lepage, R. Flood Extent Mapping from Time-Series SAR Images Based on Texture Analysis and Data Fusion. Remote Sens. 2018, 10, 237. [Google Scholar] [CrossRef] [Green Version]
  40. Guo, S.; Du, P.; Meng, Y.; Wang, X.; Tang, P. Dynamic monitoring on flooding situation in the Middle and Lower Reaches of the Yangtze River Region using Sentinel-1A time series. Natl. Remote Sens. Bull. 2021, 25, 2127–2141. [Google Scholar]
  41. Martinis, S.; Twele, A.; Voigt, S. Towards operational near real-time flood detection using a split-based automatic thresholding procedure on high resolution Terra SAR-X data. Nat. Hazards Earth Syst. Sci. 2009, 9, 303–314. [Google Scholar] [CrossRef]
  42. Ghofrani, Z.; Mokhtarzade, M.; Sahebi, M.R.; Beykikhoshk, A. Evaluating coverage changes in national parks using a hybrid change detection algorithm and remote sensing. J. Appl. Remote Sens. 2014, 8, 083646. [Google Scholar] [CrossRef]
  43. Du, P.; Wang, X.; Meng, Y.; Lin, C.; Zhang, P.; Lu, G. Effective change detection approaches for geographic national condition monitoring and land cover map updating. J. Geo Inf. Sci. 2020, 22, 857–866. [Google Scholar]
  44. Leng, Y.; Li, N. Improved change detection method for flood monitoring. J. Radars 2017, 6, 204–212. [Google Scholar]
  45. Tian, Y.; Liao, X.; Zhang, C. Method on crop inundated time extraction after rainstorm using time series MODIS images. Remote Sens. Technol. Appl. 2012, 27, 778–783. [Google Scholar]
  46. Gokon, H.; Endo, F.; Koshimura, S. Detecting Urban Floods with Small- and Large-Scale Analysis of ALOS-2/PALSAR-2 Data. Remote Sens. 2023, 15, 532. [Google Scholar] [CrossRef]
  47. Wei, H.; Yu, T.; Tu, J.; Ke, F. Detection and Evaluation of Flood Inundation Using CYGNSS Data during Extreme Precipitation in 2022 in Guangdong Province, China. Remote Sens. 2023, 15, 297. [Google Scholar] [CrossRef]
  48. Hao, B.; Han, X.; Ma, M.; Liu, Y.; Li, S. Research progresson the application of Google Earth Engine in geoscience and environmental sciences. Remote Sens. Technol. Appl. 2018, 33, 600–611. [Google Scholar]
  49. Xiao, W.; Xu, S.; He, T. Mapping Paddy Rice with Sentinel-1/2 and Phenology-, Object-Based Algorithm—A Implementation in Hangjiahu Plain in China Using GEE Platform. Remote Sens. 2021, 13, 990. [Google Scholar] [CrossRef]
  50. Yang, Y.; Yang, D.; Wang, X.; Zhang, Z.; Nawaz, Z. Testing Accuracy of Land Cover Classification Algorithms in the Qilian Mountains Based on GEE Cloud Platform. Remote Sens. 2021, 13, 5064. [Google Scholar] [CrossRef]
  51. Wang, Y.; Ma, J.; Xiao, X.; Wang, X.; Dai, S.; Zhao, B. Long-Term Dynamic of Poyang Lake Surface Water: A Mapping Work Based on the Google Earth Engine Cloud Platform. Remote Sens. 2019, 11, 313. [Google Scholar] [CrossRef] [Green Version]
  52. Liu, C.; Lu, J.; Zhai, X.; Li, Q.; Liu, R. Risk simulation and comparative analysis of “21·7” heavy rainfall and flood in Henan Province. Express Water Resour. Hydropower Inf. 2021, 42, 8–14. [Google Scholar] [CrossRef]
  53. Clement, M.A.; Kilsby, C.G.; Moore, P. Multi-temporal synthetic aperture radar flood mapping using change detection. J. Flood Risk Manag. 2018, 11, 152–168. [Google Scholar] [CrossRef] [Green Version]
  54. Chen, L.; Liu, Z.; Zhang, H. SAR Image Water Extraction based on Scattering Characteristics. Remote Sens. Technol. Appl. 2014, 29, 963–969. [Google Scholar]
  55. Li, J.; Huang, S.; Li, J. Remote sensing technology application center China institute of water resources and hydropower research. J. Nat. Disasters 2010, 19, 139–145. [Google Scholar] [CrossRef]
  56. Song, H.; Lu, Z.; Zhao, S. The accuracy effect assessment on the PolSAR images classification brought by the boxcar and Refined Lee filter. Image Technol. 2011, 23, 39–44+13. [Google Scholar]
  57. Li, X.; Zhan, N.; Lu, J.; Li, L. The application of the “Sentinel” series satellite data in the monitoring of flood disasters. Satell. Appl. 2019, 52, 48–51. [Google Scholar]
  58. Chen, J.; He, C.; Shi, P.; Chen, Y.; Ma, N. Land use/cover change detection with change vector analysis (CVA): Change magnitude threshold determination. J. Remote Sens. 2001, 5, 259–266. [Google Scholar]
  59. Banko, G. A Review of Assessing the Accuracy of Classifications of Remotely Sensed Data and of Methods Including Remote Sensing Data in Forest Inventory; Interim Report IT-98-081; International Institute for Applied Systems Analysis: Laxenburg, Austria, November 1998. [Google Scholar]
  60. Chen, Z. The Research of Monitoring and Assessment Technology on Flood Disaster of Maize Based on Remote Sensing Data; China University of Mining and Technology: Beijing, China, 2016. [Google Scholar]
  61. Yan, F.; Li, M.; Wang, Y.; Qin, Z. Application of remote sensing technique to monitor agricultural disasters. J. Nat. Disasters 2006, 15, 131–136. [Google Scholar]
  62. Yan, B.; Dai, Q.; Liu, X.; Huang, S.; Wang, Z. Flooding-induced membrane damage, lipid oxidation and activated oxygen generation in corn leaves. Plant Soil 1996, 179, 261–268. [Google Scholar] [CrossRef]
  63. Yang, J.; Guo, N.; Huang, L. Analyses on MODIS-NDVI index saturation in northwest China. Plateau Meteorol. 2008, 27, 896–903. [Google Scholar]
  64. Hou, X.; Sui, X.; Yao, H. Study of the growth condition of winter wheat Shandong Province based on penology. Remote Sens. Land Resour. 2018, 30, 171–177. [Google Scholar]
  65. Hu, Y.; Jiang, S.; Liu, Y. Temporal and spatial variation coverage on upper Anning river based on RS. Trans. Chin. Soc. Agric. Mach. 2014, 45, 205–215. [Google Scholar]
  66. Mao, Z.; Song, Y.; Li, M. Research of the desertification in Hetao Area based on MODIS inversion data. Acta Sci. Nat. Univ. Pekin. 2015, 51, 1102–1110. [Google Scholar]
  67. Lin, Y.; Hu, X.; Qiu, R. Responses Landsat-based NDVI to the interaction of vegetation and influencing factors. Trans. Chin. Soc. Agric. Mach. 2018, 49, 212–219. [Google Scholar]
  68. Jiao, S.; Hu, D.; Shen, Z.; Wang, H.; Dong, W.; Guo, Y.; Li, S.; Lei, Y.; Kou, W.; Wang, J.; et al. Parcel-Level Mapping of Horticultural Crop Orchards in Complex Mountain Areas Using VHR and Time-Series Images. Remote Sens. 2022, 14, 2015. [Google Scholar] [CrossRef]
  69. Huang, X.; Fu, Y.; Wang, J.; Dong, J.; Zheng, Y.; Pan, B.; Skakun, S.; Yuan, W. High-Resolution Mapping of Winter Cereals in Europe by Time Series Landsat and Sentinel Images for 2016–2020. Remote Sens. 2022, 14, 2120. [Google Scholar] [CrossRef]
Figure 1. Map of China (a) Land type coverage map of (b) Shanxi Province and (c) Henan Province in 2020.
Agronomy 13 00355 g001
Figure 2. Maps of the high slope (slope > 3°) regions and all-year water regions in (a) Henan and (b) Shanxi provinces.
Agronomy 13 00355 g002
Figure 3. Spatial distribution of rainfall of (a) Henan Province from 16–21 July 2021 and (b) Shanxi Province from 2–7 October 2021, respectively.
Agronomy 13 00355 g003
Figure 4. Image maps of the (a) flood inundation area and (b) flood-affected area.
Agronomy 13 00355 g004
Figure 5. The temporal ranges of the datasets that been involved in this study in both Henan and Shanxi Provinces.
Agronomy 13 00355 g005
Figure 6. Technical workflow.
Agronomy 13 00355 g006
Figure 7. Sample points for partial extraction threshold. The yellow sample points are unaffected areas, the blue sample points are flood inundation area and, and the red sample points are flood-affected area.
Agronomy 13 00355 g007
Figure 8. Extent of flood inundation areas.
Agronomy 13 00355 g008
Figure 9. Extent of flood-affected areas.
Agronomy 13 00355 g009
Figure 10. Results of Sentinel-2 true color synthetic images (a,d,g), flood inundation area (b,e,h), and flood-affected area (c,f,i).
Agronomy 13 00355 g010
Figure 11. Image maps of the (a) Sentinel-2 true color synthetic images and (b) Sentinel-1 data flood extraction results.
Agronomy 13 00355 g011
Figure 12. (a) flood-affected and (b) inundated areas of agricultural land due to the 10/2 rainstorm in Shanxi Province.
Agronomy 13 00355 g012
Figure 13. Comparison of a (a) Sentinel-2 image, (b) flood inundation areas, and (c) flood-affected areas in the verification areas.
Agronomy 13 00355 g013
Figure 14. NDVI time series change curves for 2020 and 2021.
Agronomy 13 00355 g014
Figure 15. NDWI time series change curves for 2020 and 2021.
Agronomy 13 00355 g015
Figure 16. The extent of the total autumn crop failure.
Agronomy 13 00355 g016
Figure 17. NDVI time series change curves of wheat growing season in 2020 and 2021.
Agronomy 13 00355 g017
Figure 18. The map of late sowing degree in the flood affected area.
Agronomy 13 00355 g018
Figure 19. The map of late sowing degree in the flood affected area in Hebi (a), Sentinel-2 true color synthetic images (bd) and NDVI values (eg) of 25 September, 24 October, and 23 November 2021, respectively.
Agronomy 13 00355 g019
Figure 20. NDVI time series variation curves of wheat at three late sowing levels in Hebi during the growing season.
Agronomy 13 00355 g020
Table 1. The parameters of the data involved in the study.
Name of Data
Products
Spatial ResolutionRevisit Time
Sentinel-1 SAR GRD10 m6 days
MOD13Q1 V6250 m16 days
MYD09A1 V6500 m8 days
ESA World Cover v10010 m-
JRC Global Surface Water30 m-
SRTM Digital Elevation90 m-
Sentinel-2 MSI10 m5 days
Table 2. Double-window flexible pace search threshold determination calculation process for Radar data.
Threshold Range −4 to 0
Step Size 0.5
Threshold Range −1.1 to −1.9
Step Size 0.1
ThresholdDetection Success Rate (%)ThresholdDetection Success Rate (%)
00.701−1.10.825
−0.50.782−1.20.83
−10.826−1.30.831
−1.50.838−1.40.832
−20.830−1.50.838
−2.50.812−1.60.837
−30.796−1.70.838
−3.50.780−1.80.840
−40.762−1.90.835
Table 3. Double-window flexible pace search threshold determination calculation process for NDVI index from optical data.
Threshold Range −0 to −0.35
Step Size 0.05
Threshold Range −0.06 to −0.13
Step Size 0.01
ThresholdDetection Success Rate (%)ThresholdDetection Success Rate (%)
00.718−0.060.814
−0.050.807−0.070.816
−0.10.814−0.080.820
−0.150.785−0.090.819
−0.20.744−0.10.814
−0.250.697−0.110.803
−0.30.655−0.120.801
−0.350.615−0.130.797
Table 4. Double-window flexible pace search threshold determination calculation process for NDWI index from optical data.
Threshold Range 0 to −0.08
Step Size 0.01
ThresholdDetection Success Rate (%)
00.882
0.010.886
0.020.856
0.030.833
0.040.817
0.050.798
0.060.785
0.070.754
0.080.738
Table 5. Verification precision table for the flood inundation areas.
Actual Value
Not FloodedFloodedTotalUser Precision
Predicted valueNot flooded77721599278%
Flooded161261399%
Total778827Overall precision: 87%
Producer precision99%74%Kappa coefficient: 0.73
Table 6. Verification precision table for the flood-affected areas.
Actual Value
Not AffectedAffectedTotalUser Precision
Predicted valueNot affected7145276693%
Affected6462568092%
Total778677Overall precision: 92%
Producer precision92%92%Kappa coefficient: 0.84
Table 7. Verification precision table for the flood inundation areas.
Actual Value
Not FloodedFloodedTotalUser Precision
Predicted valueNot flooded2086227077%
Flooded116316499%
Total209225Overall precision: 85%
Producer precision99%72%Kappa coefficient: 0.71
Table 8. Verification precision table for the flood-affected areas.
Actual Value
Not AffectedAffectedTotalUser Precision
Predicted valueNot affected2131622993%
Affected123123499%
Total214247Overall precision: 96%
Producer precision99%94%Kappa coefficient: 0.93
Table 9. The accuracy of Sentinel-1-based change detection accuracy under different time window sizes.
Time Windows SizeOverall PrecisionKappa Coefficient
five days81%0.63
ten days81%0.63
15 days83%0.66
20 days86%0.72
25 days87%0.73
30 days86%0.73
Table 10. The accuracy of NDWI change detection accuracy under different time window sizes.
Time Windows SizeOverall PrecisionKappa Coefficient
ten days85%0.71
20 days87%0.74
30 days84%0.68
40 days92%0.84
50 days91%0.84
60 days91%0.83
Table 11. Analysis of variance (ANOVA) between groups for NDVI values in 2020 and 2021 Table.
TimeFp-ValueRanking of Data Differences between Groups
01_011.94640.164024
01_17131.8473<0.00111
02_0259.8462<0.00114
02_1820.2092<0.00117
03_0540.7496<0.00115
03_2112.8644<0.00120
04_060.69030.406726
04_2215.4683<0.00119
05_083.89050.049422
05_241.23240.267825
06_0916.8823<0.00118
06_252.12670.145823
07_11114.0137<0.00112
07_27548.5804<0.0016
08_125510.5470<0.0011
08_282733.7900<0.0012
09_13586.0266<0.0014
09_290.363645<0.00127
10_1532.41033<0.00116
10_31447.1092<0.0017
11_16559.3606<0.0015
12_02701.6087<0.0013
12_18320.2398<0.0018
01_01224.5726<0.0019
01_1710.537340.00130121
02_02137.0491<0.00110
02_1887.34539<0.00113
Disclaimer/Publisher’s Note: The statements, opinions and data contained in all publications are solely those of the individual author(s) and contributor(s) and not of MDPI and/or the editor(s). MDPI and/or the editor(s) disclaim responsibility for any injury to people or property resulting from any ideas, methods, instructions or products referred to in the content.

