Communication

Short Communication: Spatial Dependence Analysis as a Tool to Detect the Hidden Heterogeneity in a Kenaf Field

1
Department of Biosystems and Biomaterials Engineering, Seoul National University, Seoul 08826, Republic of Korea
2
Integrated Major in Global Smart Farm, Seoul National University, Seoul 08826, Republic of Korea
3
Departement of Plant Resources and Environment, Jeju National University, Jeju 63243, Republic of Korea
*
Authors to whom correspondence should be addressed.
Agronomy 2023, 13(2), 428; https://doi.org/10.3390/agronomy13020428
Submission received: 2 January 2023 / Revised: 25 January 2023 / Accepted: 28 January 2023 / Published: 31 January 2023
(This article belongs to the Special Issue Precision Agriculture Monitoring Using Remote Sensing)

Abstract

:
Ever since research attention was first paid to phenomics, it has mainly focused on the use of high throughput phenotyping for characterizing traits in an accurate and fast manner. It was recently realized that its use has huge potential in precision agriculture. However, the focus so far has mainly been on ”obtain large data set”, not on “how to analyze them”. Here, the expanded application of high throughput phenotyping combined with special dependence analysis is demonstrated to reveal the hidden field heterogeneity, using a kenaf field. Based on the method used in the study, the results showed that the growth of kenaf in the field was grouped into two, which led to a large variation of sources among replications. This method has potential to be applied to detect hidden heterogeneity, to be utilized and applied in plant breeding not only for better analysis, but also for better management of fields in precision agriculture.

1. Introduction

Field heterogeneity is stochastic [1]. It can be caused by many factors such as sporadic diseases, uneven irrigation, etc. [2]. One of the major and common sources of field heterogeneity is soil, because soils are highly variable in their properties and rarely homogeneous [3]. This unpredictable feature of the field demands various statistical analysis methods to appropriately study it. Nonetheless, it is common to have high coefficient variance and high p-value among replications, which increases experimental error [4].
Phenomics is the systematic measurement and analysis of qualitative and quantitative traits to characterize a phenotype [5]. With advances in a wide range of technologies from sensors to information technologies, phenomics is combined with high throughput phenotyping [6]. Consequently, many high throughput phenotyping methods using various sensors have been developed, along with many analytic methods [7,8]. Among diverse research areas, one of the exciting groups to emerge in high throughput phenotyping is the area of plant breeding, since phenotyping has been a bottleneck for plant breeding [9,10]. Consequently, many high throughput phenotyping methods have been developed, mainly focusing on the plant breeding sector [11,12]. Recently, the very same methods for phenotyping crops were applied to a new study area, field management for precision agriculture [13,14,15]. Non-uniform growth in the field can be detected using various methods such as morphological traits (plant height, stem width, number of nodes, etc.), tagged positions based on ground-tracked mobile robots [16,17], and phenological traits (vegetation index) mapping based on a UAV platform [18,19]. However, these methods have mostly focused on “collecting large amount of data” as an advantage against manually collected data.
Here, we introduce an expanded application of high throughput phenotyping combined with special dependence analysis. This method can detect hidden field heterogeneity caused by many reasons such as slope of field terrain [20,21], inevitable uneven human factors [22,23] (non-uniform irrigation and fertilization system, tillage intensity, etc.), and soil properties such as organic matter, soil nutrition, etc. [21,24]. This method will provide a new dimension of high throughput phenotyping which can be applied not only for a shorter breeding cycle, but also for precision agriculture, by enabling breeders with uncovered heterogeneity in the field to handle their data more efficiently.

2. Materials and Methods

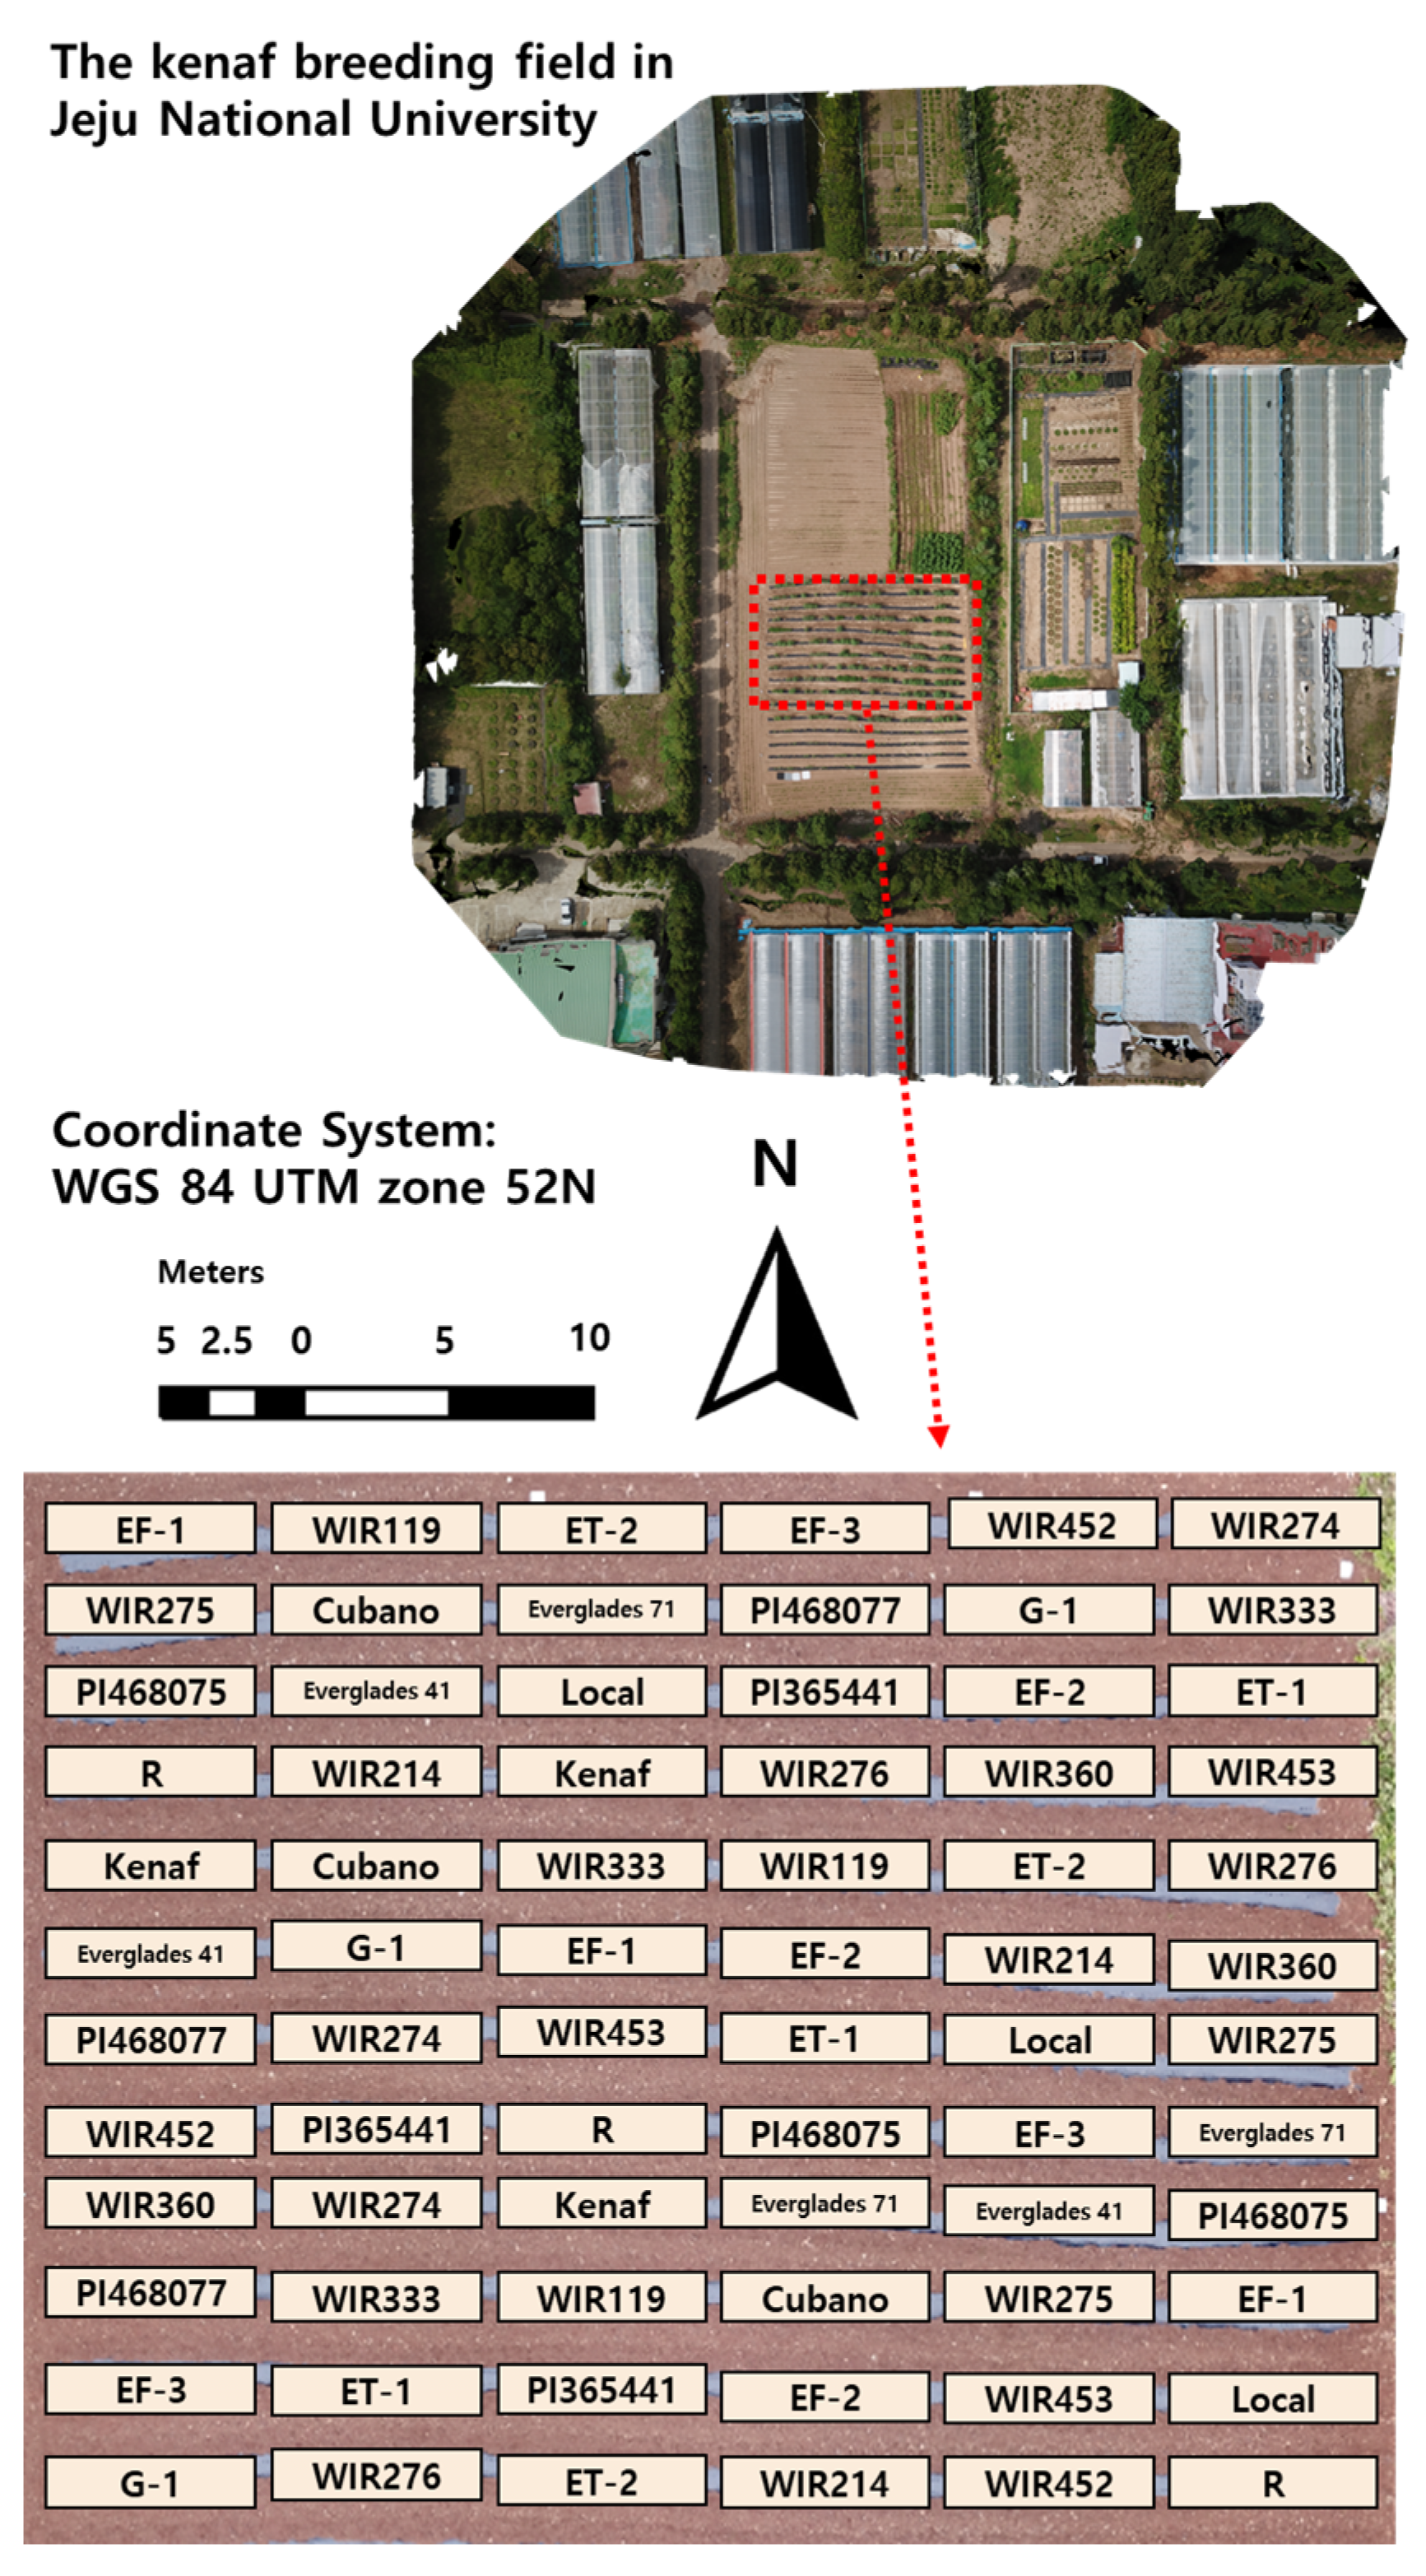
2.1. Study Field and Plant Materials

The study was conducted in the Jeju National University kenaf breeding field at 102, Jejudaehak-ro, Jeju-si, Jeju-do, Republic of Korea (33°27′35.7″ N 126°33′50.3″ E DMS) from May 2019 to September 2019. Twenty-four cultivars of kenaf provided by the Rural Development Administration (RDA, Republic of Korea) were planted in three replications including fifteen individuals based on a three-block random design (Figure 1). Irrigation was conducted using perforated hose once a day, and plastic mulch films covered the ridge on which seeds were sown. The soil texture of this field was “clay loam”, which was analyzed in a standard soil–water testing laboratory (National Instrumentation for Environment Management (NICEM), Seoul, Republic of Korea). As “EF-2” did not germinate, two cultivars were excluded, and only data from twenty-two cultivars were used for analysis.

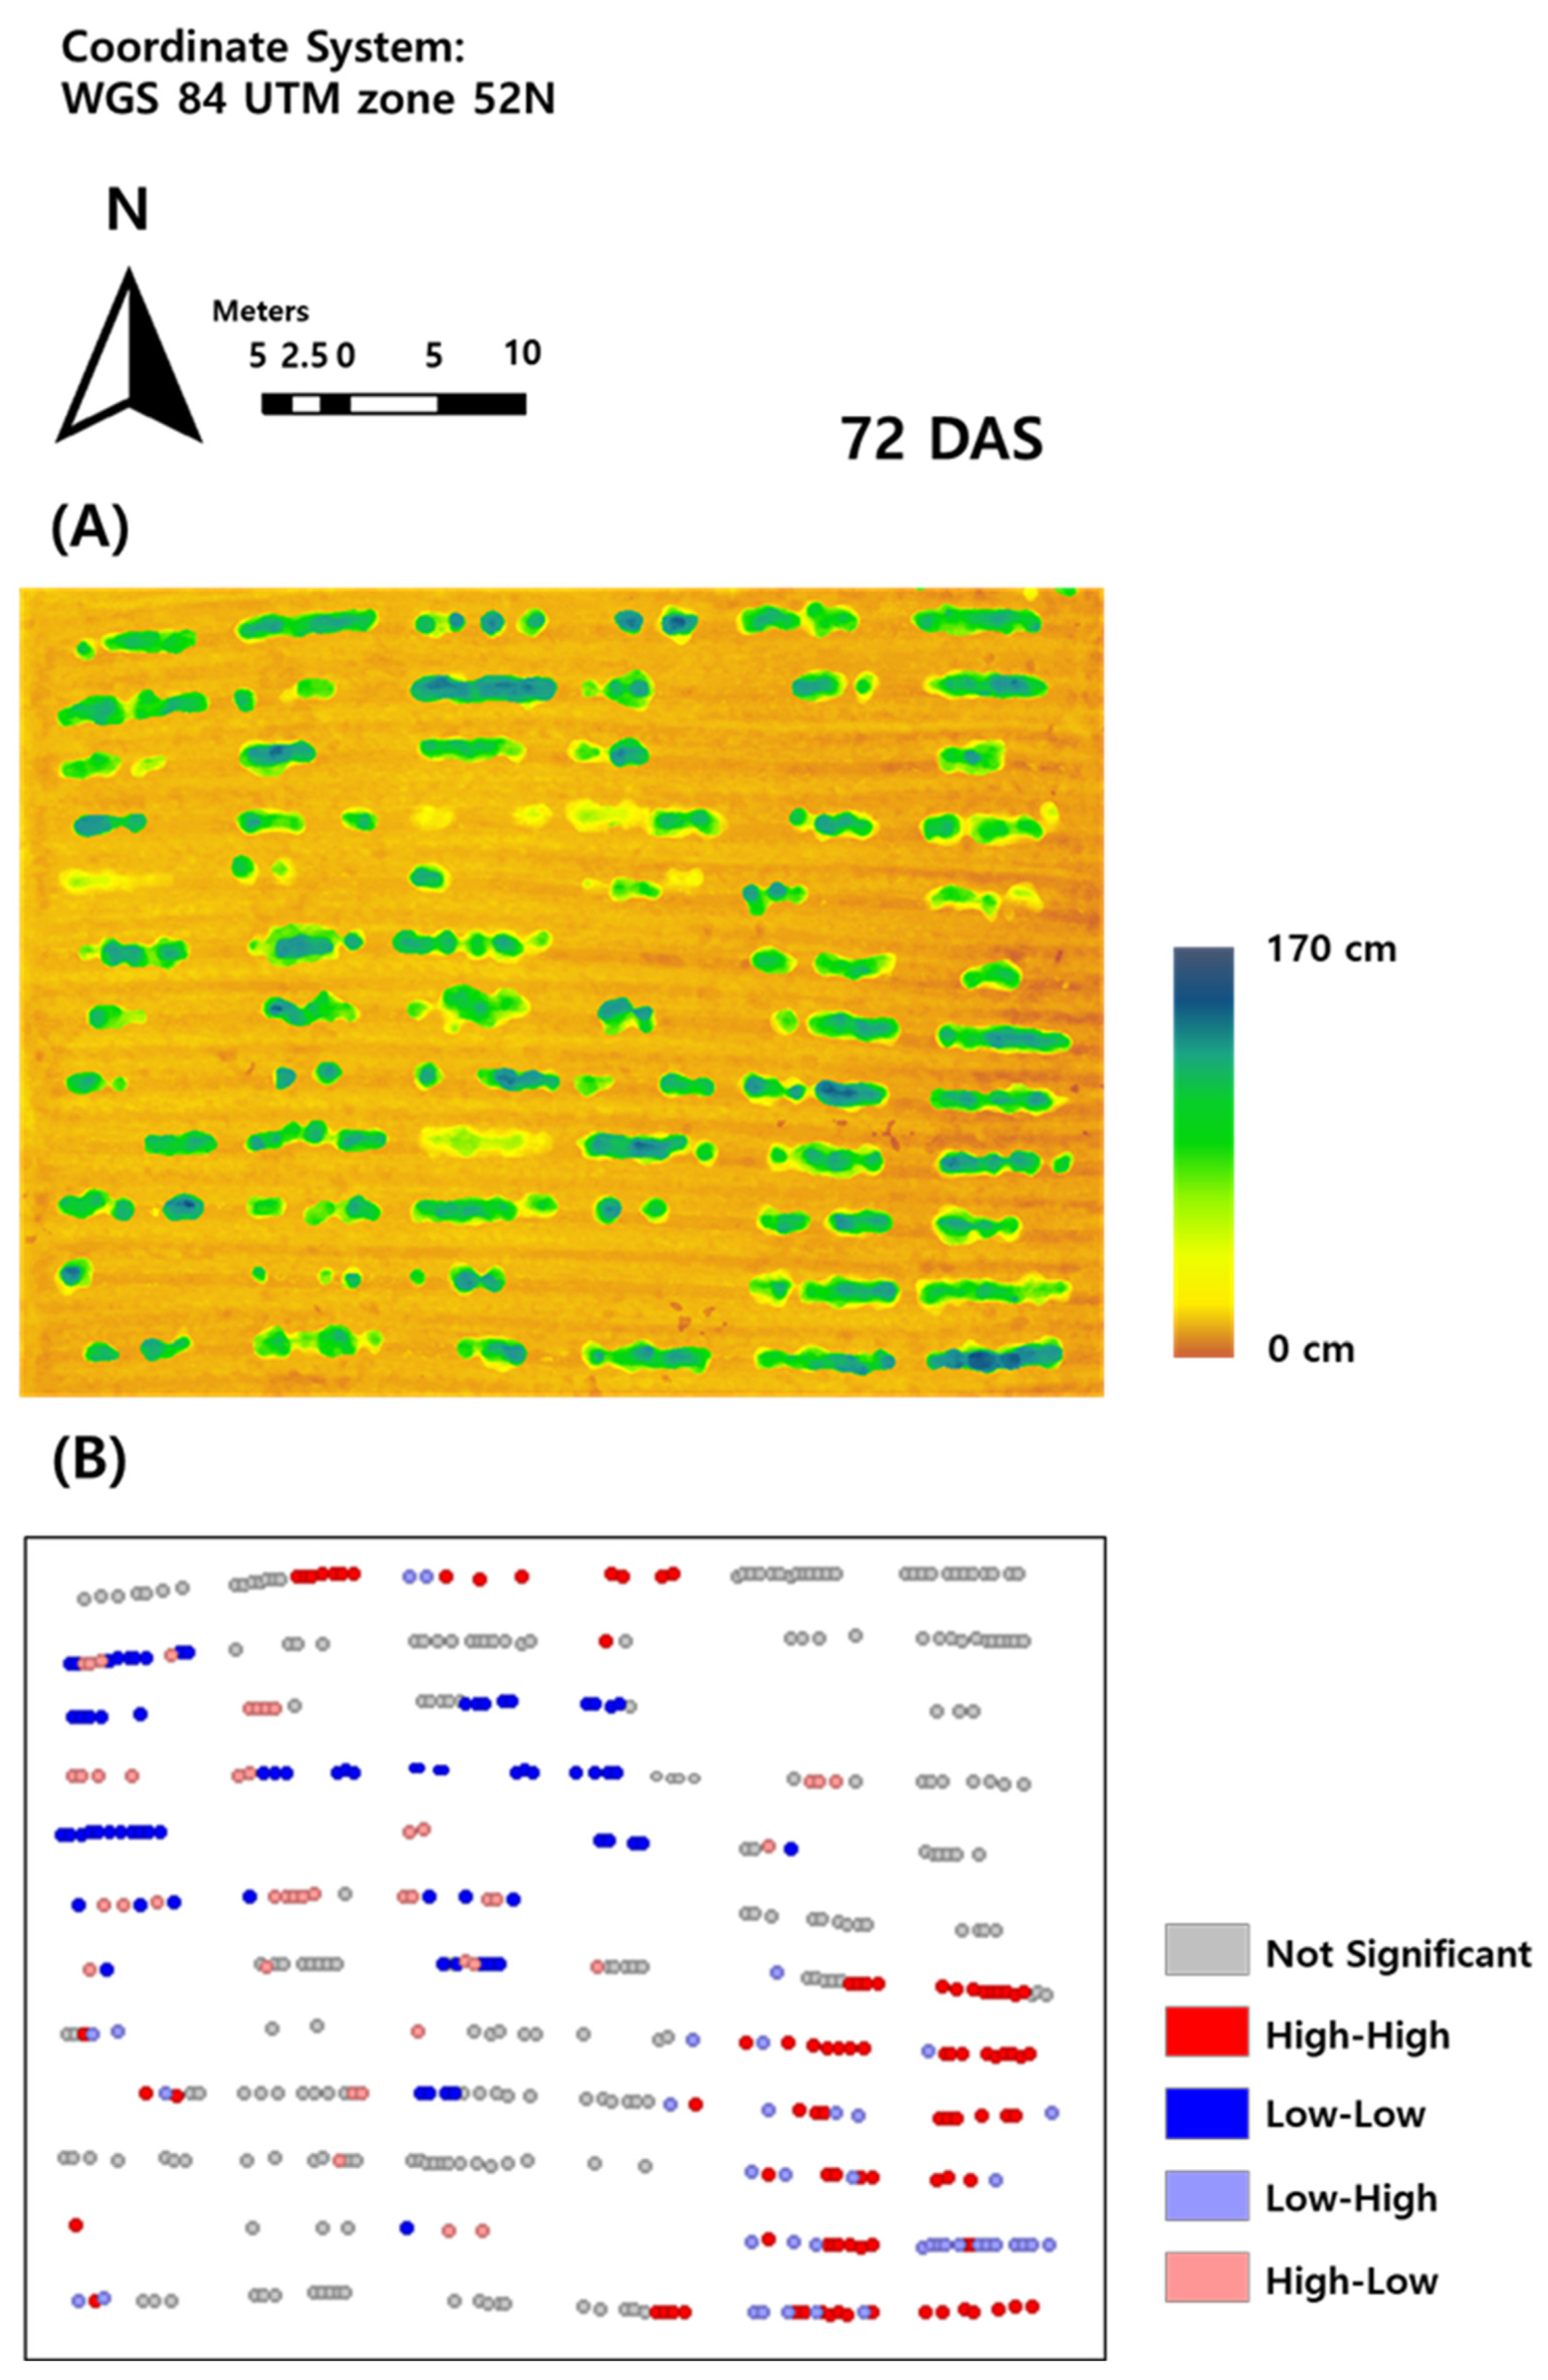
2.2. Crop Growth Status Survey in Breeding Field

Plant height is critical in the determination of kenaf growth status [25,26]. Thus, a kenaf height map was generated for the crop field survey in this study. A MAVIC Zoom 2 (SZ DJI Technology Company, Shenzhen, China) was used to obtain overlapped images across the field with RGB sensors providing 12 megapixels (4000 × 3000) of resolution. The flight altitude and overlap ratio were set at 40 m and 85%, respectively. Acquired RGB images were processed in image stitching software, Pix4Dmapper (Pix4D SA, Lausanne, Switzerland), for 3-D position map generation. In order to generate the plant height map, two 3-D maps were generated by processing the images acquired when there were crops (85 days after sowing) and no crops (immediately after sowing), and the height map was obtained by the differences of altitude values between the two 3-D maps (Figure 1).
In the height map, circles of 40 cm radius centered on each individual kenaf were drawn with reference to the RGB orthoimages generated from the Pix4Dmapper process. Then, individual height data tagged GPS positions were extracted from the height map using GIS software, ENVI (L3 HARRIS Geospatial, Boulder, CO, USA). Acquired individual kenaf height tagged positions were utilized for uneven crop growth analysis.

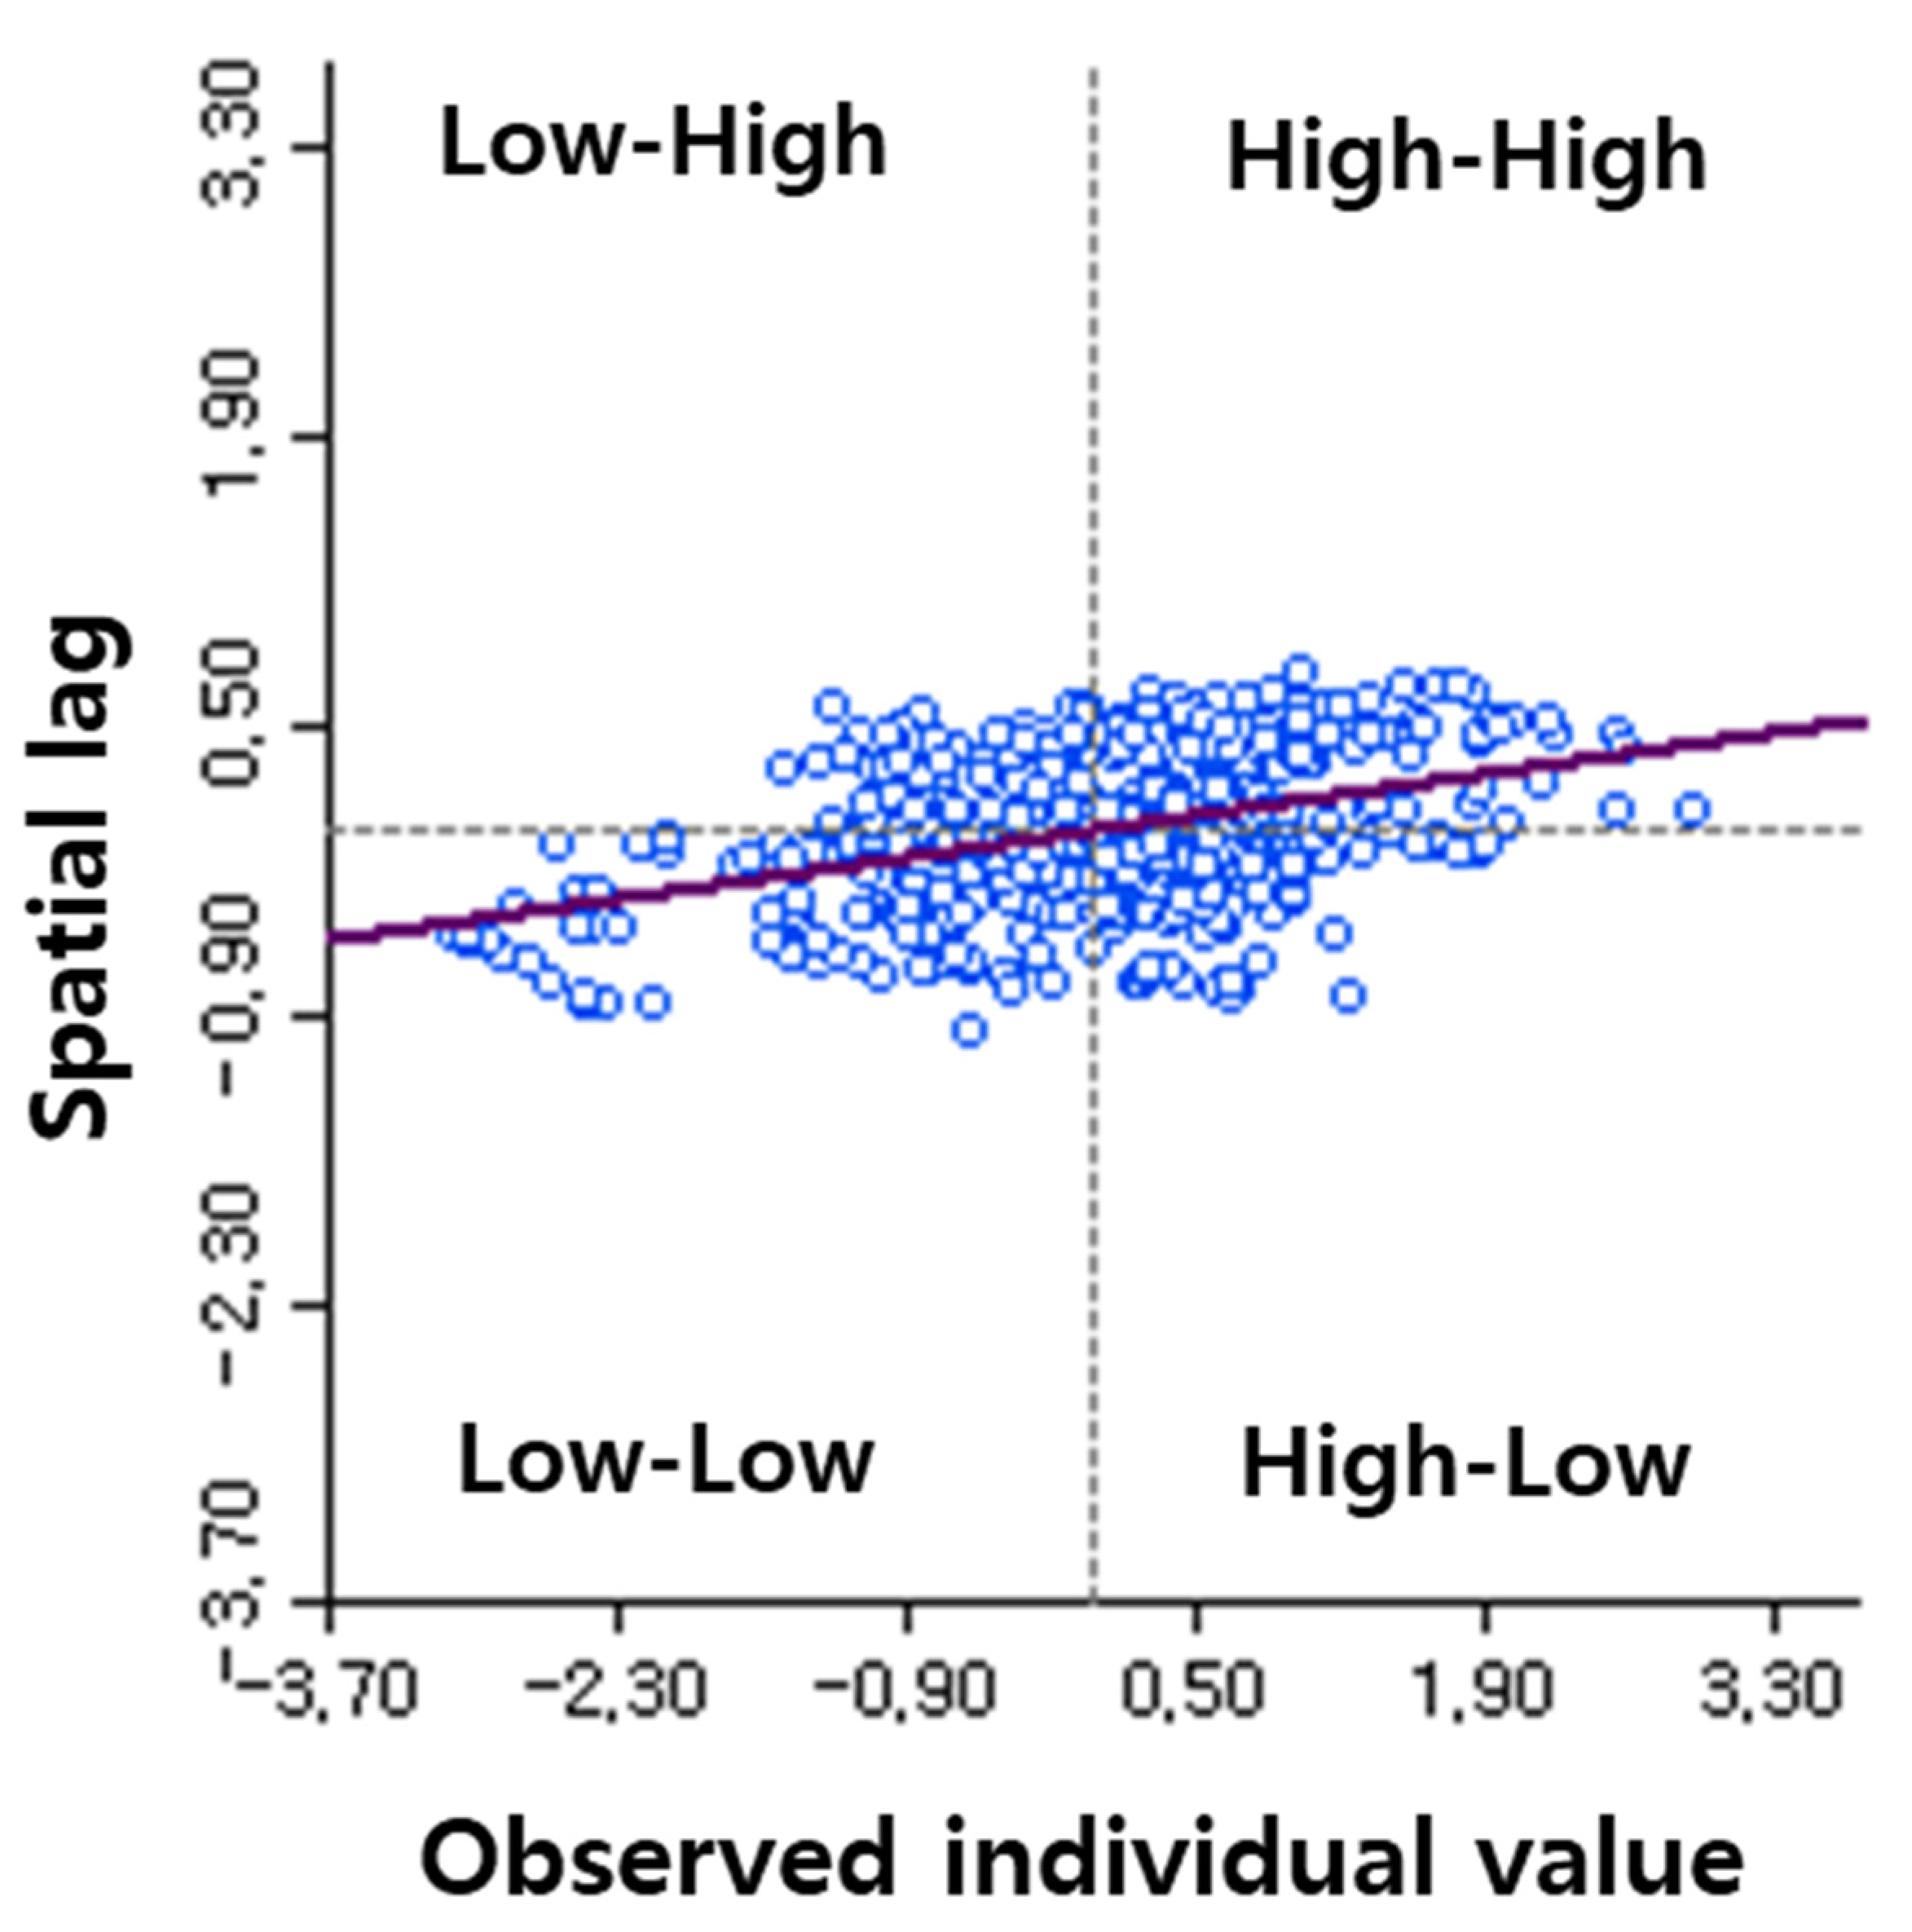
2.3. Spatial Dependence Analysis
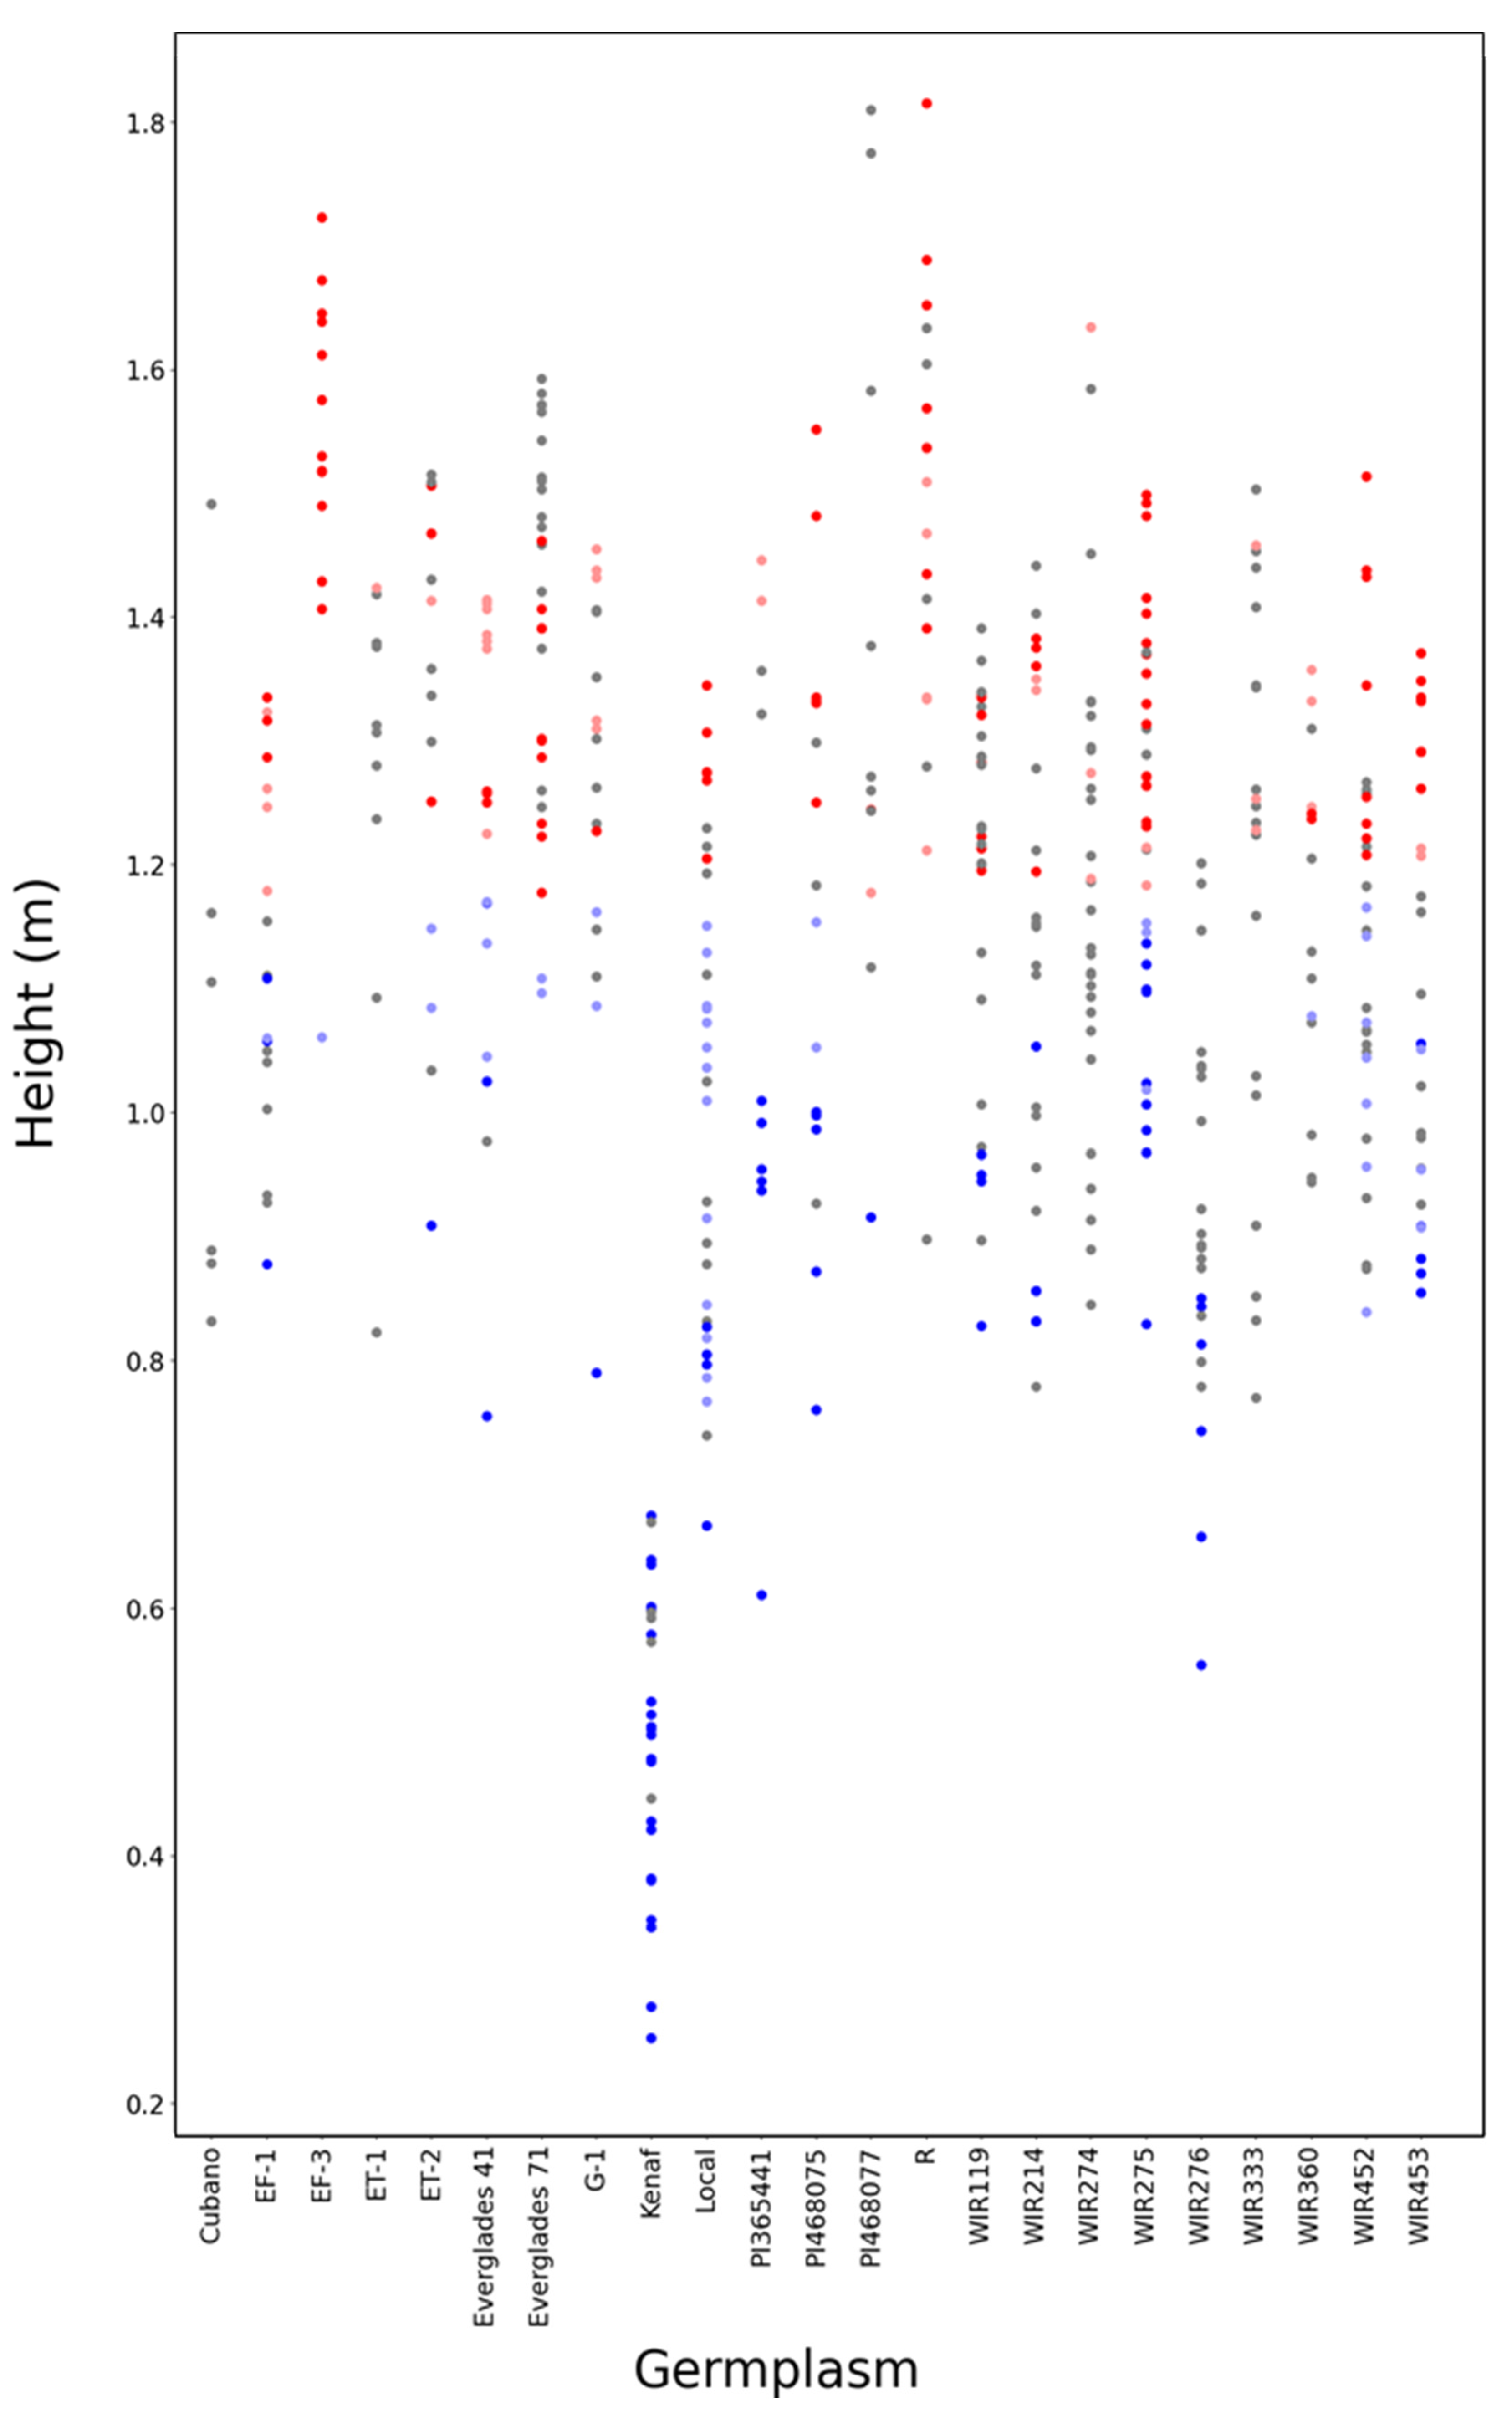
In this study, local indicators of spatial autocorrelation (LISA), a type of spatial autocorrelation statistics, was utilized for spatial dependence analysis. LISA analysis provides a spatial pattern based on the degree of spatial association among the observed individual values [27]. The spatial pattern was acquired by scatter plot between the normalized individual value of one position and the spatial lag, a degree of spatial association with neighboring individual values, as shown by Equation (1).
I i = Z i m i   j W i j Z j , where   m i = Z i 2 N
where, Wij indicates the spatial weights matrix between location i and j, and Zi is the normalization of the observed individual variable.
Each quadrant on the scatter plot indicated a spatial class (Figure 2), namely: (a) high observed individual value neighboring individual values (Quadrant 1, H-H), (b) low observed individual value neighboring low individual values (Quadrant 3, L-L), (c) low observed individual value neighboring high individual values (Quadrant 2, L-H), (d) high observed individual value neighboring low individual values Quadrant 4, H-L).
The attribution of the observed value of one position to these spatial classes was determined through a significance test, by conducting Monte Carlo random permutations among the values. Each permutation test resulted in a pseudo p-value, which assessed the significance of the spatial pattern existence. In conclusion, the spatial pattern class (H-H, L-L, L-H, H-L, and randomness) of one position was determined by combining the location within the scatter plot and the pseudo p-value by the significance test.
LISA analysis was conducted using GeoDa software (Ver 1.20, Chicago University, Chicago, IL, USA). In the Geoda software, the significance cut-off was set as p-value < 0.01 with 999 random permutations, and the inverse distance method was applied and set as 1.75 m, considering the maximum distance among the cultivar plots. Through LISA analysis, H-H, L-L, H-L, and L-H, which were not filtered by significance cut-off, were marked as red, blue, pale red and pale blue dots, respectively, and a LISA map was generated. Additionally, gray dots indicated significant non-clustering points (randomness).

3. Results

Variations in plant heights were found across the kenaf field, which contained 23 germplasms, each with three replications (Figure 3A). It is natural to have such variations since there were 23 different germplasms. However, the field plots were grouped into five types, with plant heights in each plot analyzed with spatial autocorrelation (Figure 3B); notably, the blue and red colors were separated in the upper left area and lower right area, respectively. To visualize this phenomenon, the plant heights of each plant replicated three times in each germplasm across the field, were plotted (Figure 4). Interestingly, all plants shown as red were taller than those in blue, while those in gray, a color which was not significant in spatial autocorrelation, had no such tendency. This indicated that the replications which had two groups, blue and red, were not “random”. As a next step, the Kruskal–Wallis test was used to determine if those plants across replications in each germplasm, were different or not (Table 1). Remarkably, those germplasms such as Everglades 41 and Local, shown as red and blue, had significant differences among the replications.

4. Discussion

There are many forms of field heterogeneity including sporadic diseases incidence, uneven soil types, and microenvironments [20,21,22,23,24,28], as mentioned above. Given that more replications would decrease the experimental error in the heterogeneous field condition, the number of replications should be decided depending on how heterogeneous the field is [29]. However, it is difficult to increase the number of replications to as many as required as resources are limited, leading researchers to compromise with a small number of replications. Thus, various statistical concepts such as outlier have been developed to deal with this problem. Nevertheless, field heterogeneity can cause a large standard error, and has been a challenge to deal with [30,31].
With the development of remote sensing technologies, there have been attempts to incorporate high throughput phenotyping into breeding programs and even precision agriculture [7,8,13,14,15]. For precision agriculture, the method proposed in the current study could be applied for field monitoring for better field management. As is already well known, most fields are not homogeneous in terms of soil character, soil nutrients, diseases, etc. These complex factors often lead to uneven conditions for crops in a given field. In these cases, the detected heterozygosity could be utilized to decide the target area for proper treatment.
Proper analysis and interpretation of the data are essential, no matter how precise and large the sets of obtained data are. In this sense, the introduction of special dependence analysis into the research area of high throughput phenotyping can lead to a better interpretation of the phenomenon in field experiments.

Author Contributions

Conceptualization, Y.S.C.; methodology, G.J.; validation, D.-W.K.; formal analysis, G.J.; investigation, G.J.; data curation, G.J.; writing—original draft preparation, G.J.; writing—review and editing, H.-J.K. and Y.S.C.; visualization, G.J.; supervision, H.-J.K. and Y.S.C.; project administration, H.-J.K. and Y.S.C.; funding acquisition, Y.S.C. All authors have read and agreed to the published version of the manuscript.

Funding

Cooperative Research Program for Agriculture Science & Technology Development (Development of an approach to analyze timing and locality of migratory pests occurrence for rice using information derived from an automated surveillance system: PJ01562003)” Rural Development Administration, Republic of Korea.

Institutional Review Board Statement

Not applicable.

Informed Consent Statement

Not applicable.

Data Availability Statement

Not applicable.

Acknowledgments

This research was carried out with the support of “Cooperative Research Program for Agriculture Science & Technology Development (Development of an approach to analyze timing and locality of migratory pests occurrence for rice using information derived from an automated surveillance system: PJ01562003)” Rural Development Administration, Republic of Korea.

Conflicts of Interest

The authors declare no conflict of interest.

References

  1. Philip, J. Field heterogeneity: Some basic issues. Water Resour. Res. 1980, 16, 443–448. [Google Scholar] [CrossRef]
  2. Rodriguez-Alvarez, M.X.; Boer, M.P.; van Eeuwijk, F.A.; Eilers, P.H. Correcting for spatial heterogeneity in plant breeding experiments with P-splines. Spat. Stat. 2018, 23, 52–71. [Google Scholar] [CrossRef] [Green Version]
  3. Patzold, S.; Mertens, F.M.; Bornemann, L.; Koleczek, B.; Franke, J.; Feilhauer, H.; Welp, G. Soil heterogeneity at the field scale: A challenge for precision crop protection. Precis. Agric. 2008, 9, 367–390. [Google Scholar] [CrossRef]
  4. Ball, S.T.; Mulla, D.J.; Konzak, C.F. Spatial heterogeneity affects variety trial interpretation. Crop Sci. 1993, 33, 931–935. [Google Scholar] [CrossRef]
  5. Karve, A.A.; Alexoff, D.; Kim, D.; Schueller, M.J.; Ferrieri, R.A.; Babst, B.A. In vivo quantitative imaging of photoassimilate transport dynamics and allocation in large plants using a commercial positron emission tomography (PET) scanner. BMC Plant Biol. 2015, 15, 1–11. [Google Scholar] [CrossRef] [Green Version]
  6. Yang, W.; Feng, H.; Zhang, X.; Zhang, J.; Doonan, J.H.; Batchelor, W.D.; Xiong, L.; Yan, J. Crop phenomics and high-throughput phenotyping: Past decades, current challenges, and future perspectives. Mol. Plant 2020, 13, 187–214. [Google Scholar] [CrossRef] [Green Version]
  7. Araus, J.L.; Cairns, J.E. Field high-throughput phenotyping: The new crop breeding frontier. Trends Plant Sci. 2014, 19, 52–61. [Google Scholar] [CrossRef]
  8. Tattaris, M.; Reynolds, M.P.; Chapman, S.C. A direct comparison of remote sensing approaches for high-throughput phenotyping in plant breeding. Front. Plant Sci. 2016, 7, 1131. [Google Scholar] [CrossRef]
  9. Song, P.; Wang, J.; Guo, X.; Yang, W.; Zhao, C. High-throughput phenotyping: Breaking through the bottleneck in future crop breeding. Crop J. 2021, 9, 633–645. [Google Scholar] [CrossRef]
  10. Hein, N.T.; Ciampitti, I.A.; Jagadish, S.K. Bottlenecks and opportunities in field-based high-throughput phenotyping for heat and drought stress. J. Exp. Bot. 2021, 72, 5102–5116. [Google Scholar] [CrossRef]
  11. Fukatsu, T.; Watanabe, T.; Hu, H.; Yoichi, H.; Hirafuji, M. Field monitoring support system for the occurrence of Leptocorisa chinensis Dallas (Hemiptera: Alydidae) using synthetic attractants, Field Servers, and image analysis. Comput. Electron. Agric. 2012, 80, 8–16. [Google Scholar] [CrossRef]
  12. Sadeghi-Tehran, P.; Sabermanesh, K.; Virlet, N.; Hawkesford, M.J. Automated method to determine two critical growth stages of wheat: Heading and flowering. Front. Plant Sci. 2017, 8, 252. [Google Scholar] [CrossRef] [PubMed] [Green Version]
  13. Chawade, A.; van Ham, J.; Blomquist, H.; Bagge, O.; Alexandersson, E.; Ortiz, R. High-throughput field-phenotyping tools for plant breeding and precision agriculture. Agronomy 2019, 9, 258. [Google Scholar] [CrossRef] [Green Version]
  14. Bauer, A.; Bostrom, A.G.; Ball, J.; Applegate, C.; Cheng, T.; Laycock, S.; Rojas, S.M.; Kirwan, J.; Zhou, J. Combining computer vision and deep learning to enable ultra-scale aerial phenotyping and precision agriculture: A case study of lettuce production. Hortic. Res. 2019, 6. [Google Scholar] [CrossRef] [PubMed] [Green Version]
  15. Mahlein, A.-K. Plant disease detection by imaging sensors–parallels and specific demands for precision agriculture and plant phenotyping. Plant Dis. 2016, 100, 241–251. [Google Scholar] [CrossRef] [Green Version]
  16. Young, S.N.; Kayacan, E.; Peschel, J.M. Design and field evaluation of a ground robot for high-throughput phenotyping of energy sorghum. Precis. Agric. 2019, 20, 697–722. [Google Scholar] [CrossRef] [Green Version]
  17. Mahmud, M.A.; Abidin, M.Z.; Mohamed, Z. Crop identification and navigation design based on probabilistic roadmap for crop inspection robot. In Proceedings of the International Conference on Agricultural and Food Engineering (Cafei2016), Kuala Lumpur, Malaysia, 23–25 August 2016; p. 25. [Google Scholar]
  18. Chivasa, W.; Mutanga, O.; Biradar, C. UAV-based multispectral phenotyping for disease resistance to accelerate crop improvement under changing climate conditions. Remote Sens. 2020, 12, 2445. [Google Scholar] [CrossRef]
  19. Yang, G.; Liu, J.; Zhao, C.; Li, Z.; Huang, Y.; Yu, H.; Xu, B.; Yang, X.; Zhu, D.; Zhang, X. Unmanned aerial vehicle remote sensing for field-based crop phenotyping: Current status and perspectives. Front. Plant Sci. 2017, 8, 1111. [Google Scholar] [CrossRef] [PubMed] [Green Version]
  20. Wang, X.; Sun, H.; Tan, C.; Wang, X.; Xia, M. Effects of Film Mulching on Plant Growth and Nutrients in Artificial Soil: A Case Study on High Altitude Slopes. Sustainability 2021, 13, 11026. [Google Scholar] [CrossRef]
  21. Yuan, M.; Fernández, F.G.; Pittelkow, C.M.; Greer, K.D.; Schaefer, D. Tillage and fertilizer management effects on phosphorus runoff from minimal slope fields. J. Environ. Qual. 2018, 47, 462–470. [Google Scholar] [CrossRef]
  22. Li, S.-X.; Wang, Z.-H.; Malhi, S.; Li, S.-Q.; Gao, Y.-J.; Tian, X.-H. Nutrient and water management effects on crop production, and nutrient and water use efficiency in dryland areas of China. Adv. Agron. 2009, 102, 223–265. [Google Scholar]
  23. Chen, A.; Orlov-Levin, V.; Meron, M. Applying high-resolution visible-channel aerial imaging of crop canopy to precision irrigation management. Agric. Water Manag. 2019, 216, 196–205. [Google Scholar] [CrossRef]
  24. Malecka, I.; Blecharczyk, A.; Sawinska, Z.; Dobrzeniecki, T. The effect of various long-term tillage systems on soil properties and spring barley yield. Turk. J. Agric. For. 2012, 36, 217–226. [Google Scholar] [CrossRef]
  25. Ochi, S. Mechanical properties of kenaf fibers and kenaf/PLA composites. Mech. Mater. 2008, 40, 446–452. [Google Scholar] [CrossRef]
  26. Webber, C.L., III. Yield components of five kenaf cultivars. Agron. J. 1993, 85, 533–535. [Google Scholar] [CrossRef]
  27. Anselin, L. Local indicators of spatial association—LISA. Geogr. Anal. 1995, 27, 93–115. [Google Scholar] [CrossRef]
  28. Mohammad, W.; Shah, S.; Shehzadi, S.; Shah, S. Effect of tillage, rotation and crop residues on wheat crop productivity, fertilizer nitrogen and water use efficiency and soil organic carbon status in dry area (rainfed) of north-west Pakistan. J. Soil Sci. Plant Nutr. 2012, 12, 715–727. [Google Scholar] [CrossRef] [Green Version]
  29. Zystro, J.; Colley, M.; Dawson, J. Alternative experimental designs for plant breeding. Plant Breed. Rev. 2018, 42, 87–117. [Google Scholar]
  30. Casanoves, F.; Macchiavelli, R.; Balzarini, M. Error variation in multienvironment peanut trials: Within-trial spatial correlation and between-trial heterogeneity. Crop Sci. 2005, 45, 1927–1933. [Google Scholar] [CrossRef]
  31. Gezan, S.A.; White, T.L.; Huber, D.A. Accounting for spatial variability in breeding trials: A simulation study. Agron. J. 2010, 102, 1562–1571. [Google Scholar] [CrossRef]
Figure 1. The field utilized in this study. The letters in each box indicate the names of the cultivars.
Agronomy 13 00428 g001
Figure 2. An example of a scatter plot with local indicators of spatial autocorrelation (LISA) applied. The X-axis and Y-axis indicate the observed value of each individual and spatial lag calculated by Equation (1), respectively.
Agronomy 13 00428 g002
Figure 3. The result of the crop growth variable survey: plant height map (A), and LISA map applied with spatial autocorrelation analysis (B). In (A), the height of kenaf is represented by a color scale. Moreover, the spatial class identified through LISA analysis with the cut-off set to p-value < 0.01 was plotted on the LISA map as dots marked with five colors.
Agronomy 13 00428 g003
Figure 4. The height distribution of each germplasm including the result from spatial autocorrelation analysis (LISA).
Agronomy 13 00428 g004
Table 1. The results of the Kruskal–Wallis test.
Germplasmp-Value within Replication
Cubano0.37
EF-10.08
EF-30.39
ET-10.34
ET-20.08
Everglades 41***
Everglades 710.91
G-10.77
Kenaf0.31
Local***
PI365441*
PI468075*
PI4680770.05
R0.82
WIR119***
WIR2140.21
WIR2740.16
WIR275**
WIR2760.81
WIR3330.28
WIR3600.10
WIR4520.08
WIR4530.06
*, **, and *** indicate significance at 0.05, 0.01 and 0.001 in p-value, respectively.
Disclaimer/Publisher’s Note: The statements, opinions and data contained in all publications are solely those of the individual author(s) and contributor(s) and not of MDPI and/or the editor(s). MDPI and/or the editor(s) disclaim responsibility for any injury to people or property resulting from any ideas, methods, instructions or products referred to in the content.

