Article

Development Trends in Precision Agriculture and Its Management in China Based on Data Visualization

1
The Center for Economic Research, Shandong University, Jinan 250100, China
2
School of Education and Cultural Information Development, Woosuk University, Anju 55338, Republic of Korea
3
School of Public Administration, Yanshan University, Qinhuangdao 066004, China
4
Hebei Public Policy Evaluation and Research Center, Qinhuangdao 066004, China
*
Author to whom correspondence should be addressed.
Agronomy 2022, 12(11), 2905; https://doi.org/10.3390/agronomy12112905
Submission received: 6 October 2022 / Revised: 10 November 2022 / Accepted: 18 November 2022 / Published: 21 November 2022
(This article belongs to the Special Issue Precision Agriculture Monitoring Using Remote Sensing)

Abstract

:
Recent innovations are increasingly recognizing applications in precision agricultural systems that use data science techniques as well as so-called machine learning techniques. Big data analytics have created various data-intensive decision-making opportunities. This study reviews the big data analysis practices in the agriculture industry to resolve various problems to provide prospects and exciting fields of application in China. In the successful implementation of precise farming, the high-volume and complicated data generated present challenges for the economic growth of China. Emerging deep learning techniques seem promising and must be reinvented to meet current challenges. Thus, this paper suggests a big data analytics agriculture monitoring system (BDA-AMS) to ensure the highly accurate prediction of crop yield in precision agriculture and economic management using a deep learning algorithm. The convolution neural network gathers the raw images from UAVs and performs early predictions of crop yield. The simulation analysis using an open-source agricultural dataset resulted in a high parameter–precision ratio (98.8%), high accuracy (98.9%), a better performance ratio (95.5%), an improved data transmission rate (97.8%), a reduced power consumption ratio (18.8%), and an enhanced weather forecasting ratio (94.8%), production density ratio (98.8%), and reliability ratio (98.6%) compared to the baseline models.

1. Introduction

1.1. Background and Origin of the Research

As the specific sector of economic growth develops, agriculture creates jobs in the largely rural communities in China. Agriculture is the most consistent word used to indicate the various ways in which plants and domestic animals are provided with food and through which other goods are produced for the global human population. The agriculture system complements a very broad range of agriculturally integral and descriptive activities, such as cultivation, domestication, crops, farming, and vegetation, and proper handlings such as mixed food production, deforestation, and new competition [1]. Agricultural analysis and actual farming production systems rely on and generate a host of internal and external data information system resources as well as control economic management in China. Agriculture manufacturing provides possibilities in developed countries to pull people out of poverty and offers job options and food as well as other raw materials [2]. Agriculture provides more employment from agricultural machinery manufacturers, food processing plants, logistics, utilities, and production, playing an important part in the support and promotion of China’s economic management and representing the backbone of everything [3,4].
Precision agriculture has now improved and might continue to change farming management, as farmers take the mixture of resources, search lands, and inputs into account regarding how they use conservation techniques, how they should price their crops, and how they consider the long-term scale of their activities [5]. Several scientific contributions involve precision agriculture (PA), particularly in terms of data collection strategies, data analysis, high-sensitivity identification, field activity, and accurate agriculture evaluation. Precision agriculture has resulted in significant data development in agriculture, which has challenged researchers and farmers to find new ways to analyze and use data for improved decision-making [6,7]. Precision agriculture uses data, web data, and stream data from different sources, such as crop growth monitors, agro-informatics websites, and satellite images, for decision-making and to predict agricultural big data interactions [8]. The function of unmanned aerial vehicles (UAVs) is essential for fostering large-scale monitoring and data-acquiring applications in precision agriculture. They reduce the dependence on non-existence or on the increased costs of third-party accessibility and computing resources [9,10].
Big data is an emerging concept that describes any structured data, sub-data, and unstructured data that are capable of being exploited. Big data are generated at the intersection between geoprocessing, field development, climate, and consumer knowledge [11]. A combination of technologies and analytics are involved in big data applications in agriculture [12]. Big data applications involve collecting, compiling, and promptly analyzing new data to enhance and guide analysts and farmers in making choices [13]. Geographic data details are site-specific information that is historically correlated with precise cultivation, such as land-specific properties and crop yields. Big data are always referred to as the next big thing in many agriculture circles [14]. Increasing information gathered on crop production at the farm level (big soil data) and detailed weather data (big climate data) are forming the backbone of precision agriculture technology and will help to develop the agricultural economic management of China [15]. The design of big data technology in agriculture can either guide farmers in helping long-organized supply chains to become efficient or can lead farmers to execute short production processes along with distributors and the government [16,17]. Scale-neutral big data technologies are being developed to prevent farmers from choosing one form of agricultural production over another [18]. As large amounts of data are collected to inform individual agriculture and fields, the expansion of technology makes them possible to be applied to different proportions of farmers [19]. Big data analytics aims to create an effective decision-making framework that functions as a guide to agricultural production. The present research will collect focused categories that will allow different types of consumers to obtain their data [20,21]. The study of the varying factors affecting crop yield can be based on big econometric data [22]. While UAV contributions are well-known and significant for the development of sustainable agricultural production, incorporating these components into the perception layer is expected to considerably boost solutions for tracking, production analysis, forecasting, and decision-making [23,24].

1.2. Literature Works

Ma Li et al. [25] proposed Agricultural Economic Development (AED) in China. AED analyzes the coupling properties and spatial–temporal trends of agrarian labor shifts and rapidly urbanized economic growth through empirical and structural analytical techniques centered on framing regional-level information from 1991, 2000, and 2010 collected in China. In conclusion, several suggestions for developing the central, secondary, and primary economies and the vitality of rural economies are made that are centered on combined types and spatially distributed features of economic–labor friction correlations.
Long Liang et al. [26] developed the agricultural subsidies assessment of cropping system (ASACS). ASACS was used to evaluate lifecycle assessment (LCA) to determine the environmental effects in Huantai County, which experiences high-density and high-intensity cultivation when implementing the winter/summer corn replacement method. Over the period from 1996 to 2012, there was a reduced energy capacity, climate change potential acidification ecotoxicity, and turbid possibility.
Wenjing Li et al. [27] discussed a hybrid modeling approach (HMA). Their proposed HMA aims to investigate factors that decide the acceptance of precision agriculture innovations in Chinese farming in crop structures and makes suggestions for potential technology developments. The requirements that make it easier for farmers to implement such technologies were the best indicators. These factors must be taken into consideration by policymakers and utility companies to promote innovations
Keswani, B. et al. [27] initialized the IoT and big data-based decision support (IoT-DSS) to produce appropriate valve control commands. Precision agriculture requires production changes in the region, sales growth, resource support, and environmental impact according to an automated processor’s range of information and documentation. The collection of information in real time is performed using the proposed implementation technique of the IoT node tested in the region. An IoT-DSS system is proposed to accumulate 17 global and environmental parameters when predicting the possible impact on soil MC within 1 h. This article discusses the system’s entire architecture, the implementation approach, and the proposed IoT-based DSS framework’s performance.
Sieverding, H., M. et al. [28] introduced an LCA primer for the agricultural community. The term LCA is commonly used to describe several methods and analytical resources. Lifecycle analysis provides a transdisciplinary method where teams with various competencies and experiences can better use all occupations. This paper aims to provide the agricultural population and the agriculturists associated with LCAs with an initial treatment. Agricultural LCAs can differ greatly because agricultural products have multiple end uses, are complex, and can be produced by various practices, resources, and production systems. Crop LCAs are subject to different data points, aggregation methods, production processes and facilities, yields, and analytical assumptions.
Mohapatra, A. G. et al. [29] deliberated smart data-based decision support (SDSS) by considering the temperature, soil, water, crop information, and agriculture quality and uniformity from the challenging information-based systems currently being maintained. This work (SDSS) was carried out alongside DSS to produce accurate SMS alerts using interfaces between the GPS module and an efficient heating irrigation control method. The farm data that are aggregated in real time are introduced to the radial basis model’s neural network function. The soil data are supported by the DSS model for the appropriate generation of SMS notifications to the farmer’s mobile device. The proposed smart DSS system reduces the amount of wastewater resulting from precipitation by considering temperature, land, water, and crop data.
Pham, T. N et al. [30] indicated that many diseases affect the quality of fruits and grains and pose a serious threat to global food security, while convolutional neural networks (CNN) and artificial neural networks (ANN) provide fast and accurate tools for identifying plant diseases. A list of multiple measurement-related features representing blobs was chosen and then sorted using a wrapper-based feature selection method based on a hybrid technique based on the model’s effectiveness. They preferred the application that used an ANN input, and their findings were compared to those from a different methodology that successfully used CNN models that had been improved by transfer learning. The results showed that their methodology can be applied to reduced devices such as smartphones to support farmers on the land.
Bhat, S. A et al. [31] introduced the current big data applications used in smart agriculture and some of the challenges of big data technology in the agricultural sector. This work compared and discussed the computational characteristics and limitations of different machine learning (ML) techniques in precision agriculture. Most of these big data applications are applicable to large industrial farms, and very little work has been carried out on small farms in the developing world.
Based on this literature review, there are some issues with existing methods. Hence, in this paper, BDA-AMS has been proposed to identify the crop growth level and to improve production. Big data can be used to create various data-intensive decision-making opportunities.
Big data analysis has become an integral part of agricultural economic management and has played an important role in crop production, agricultural product processing, transportation and storage, and safety prevention, and has largely improved the efficiency of management in precision agriculture. Through big data analysis, management departments are able to quickly integrate resources, improving the efficiency of the management of the agricultural economy and laying a good foundation for agricultural development.

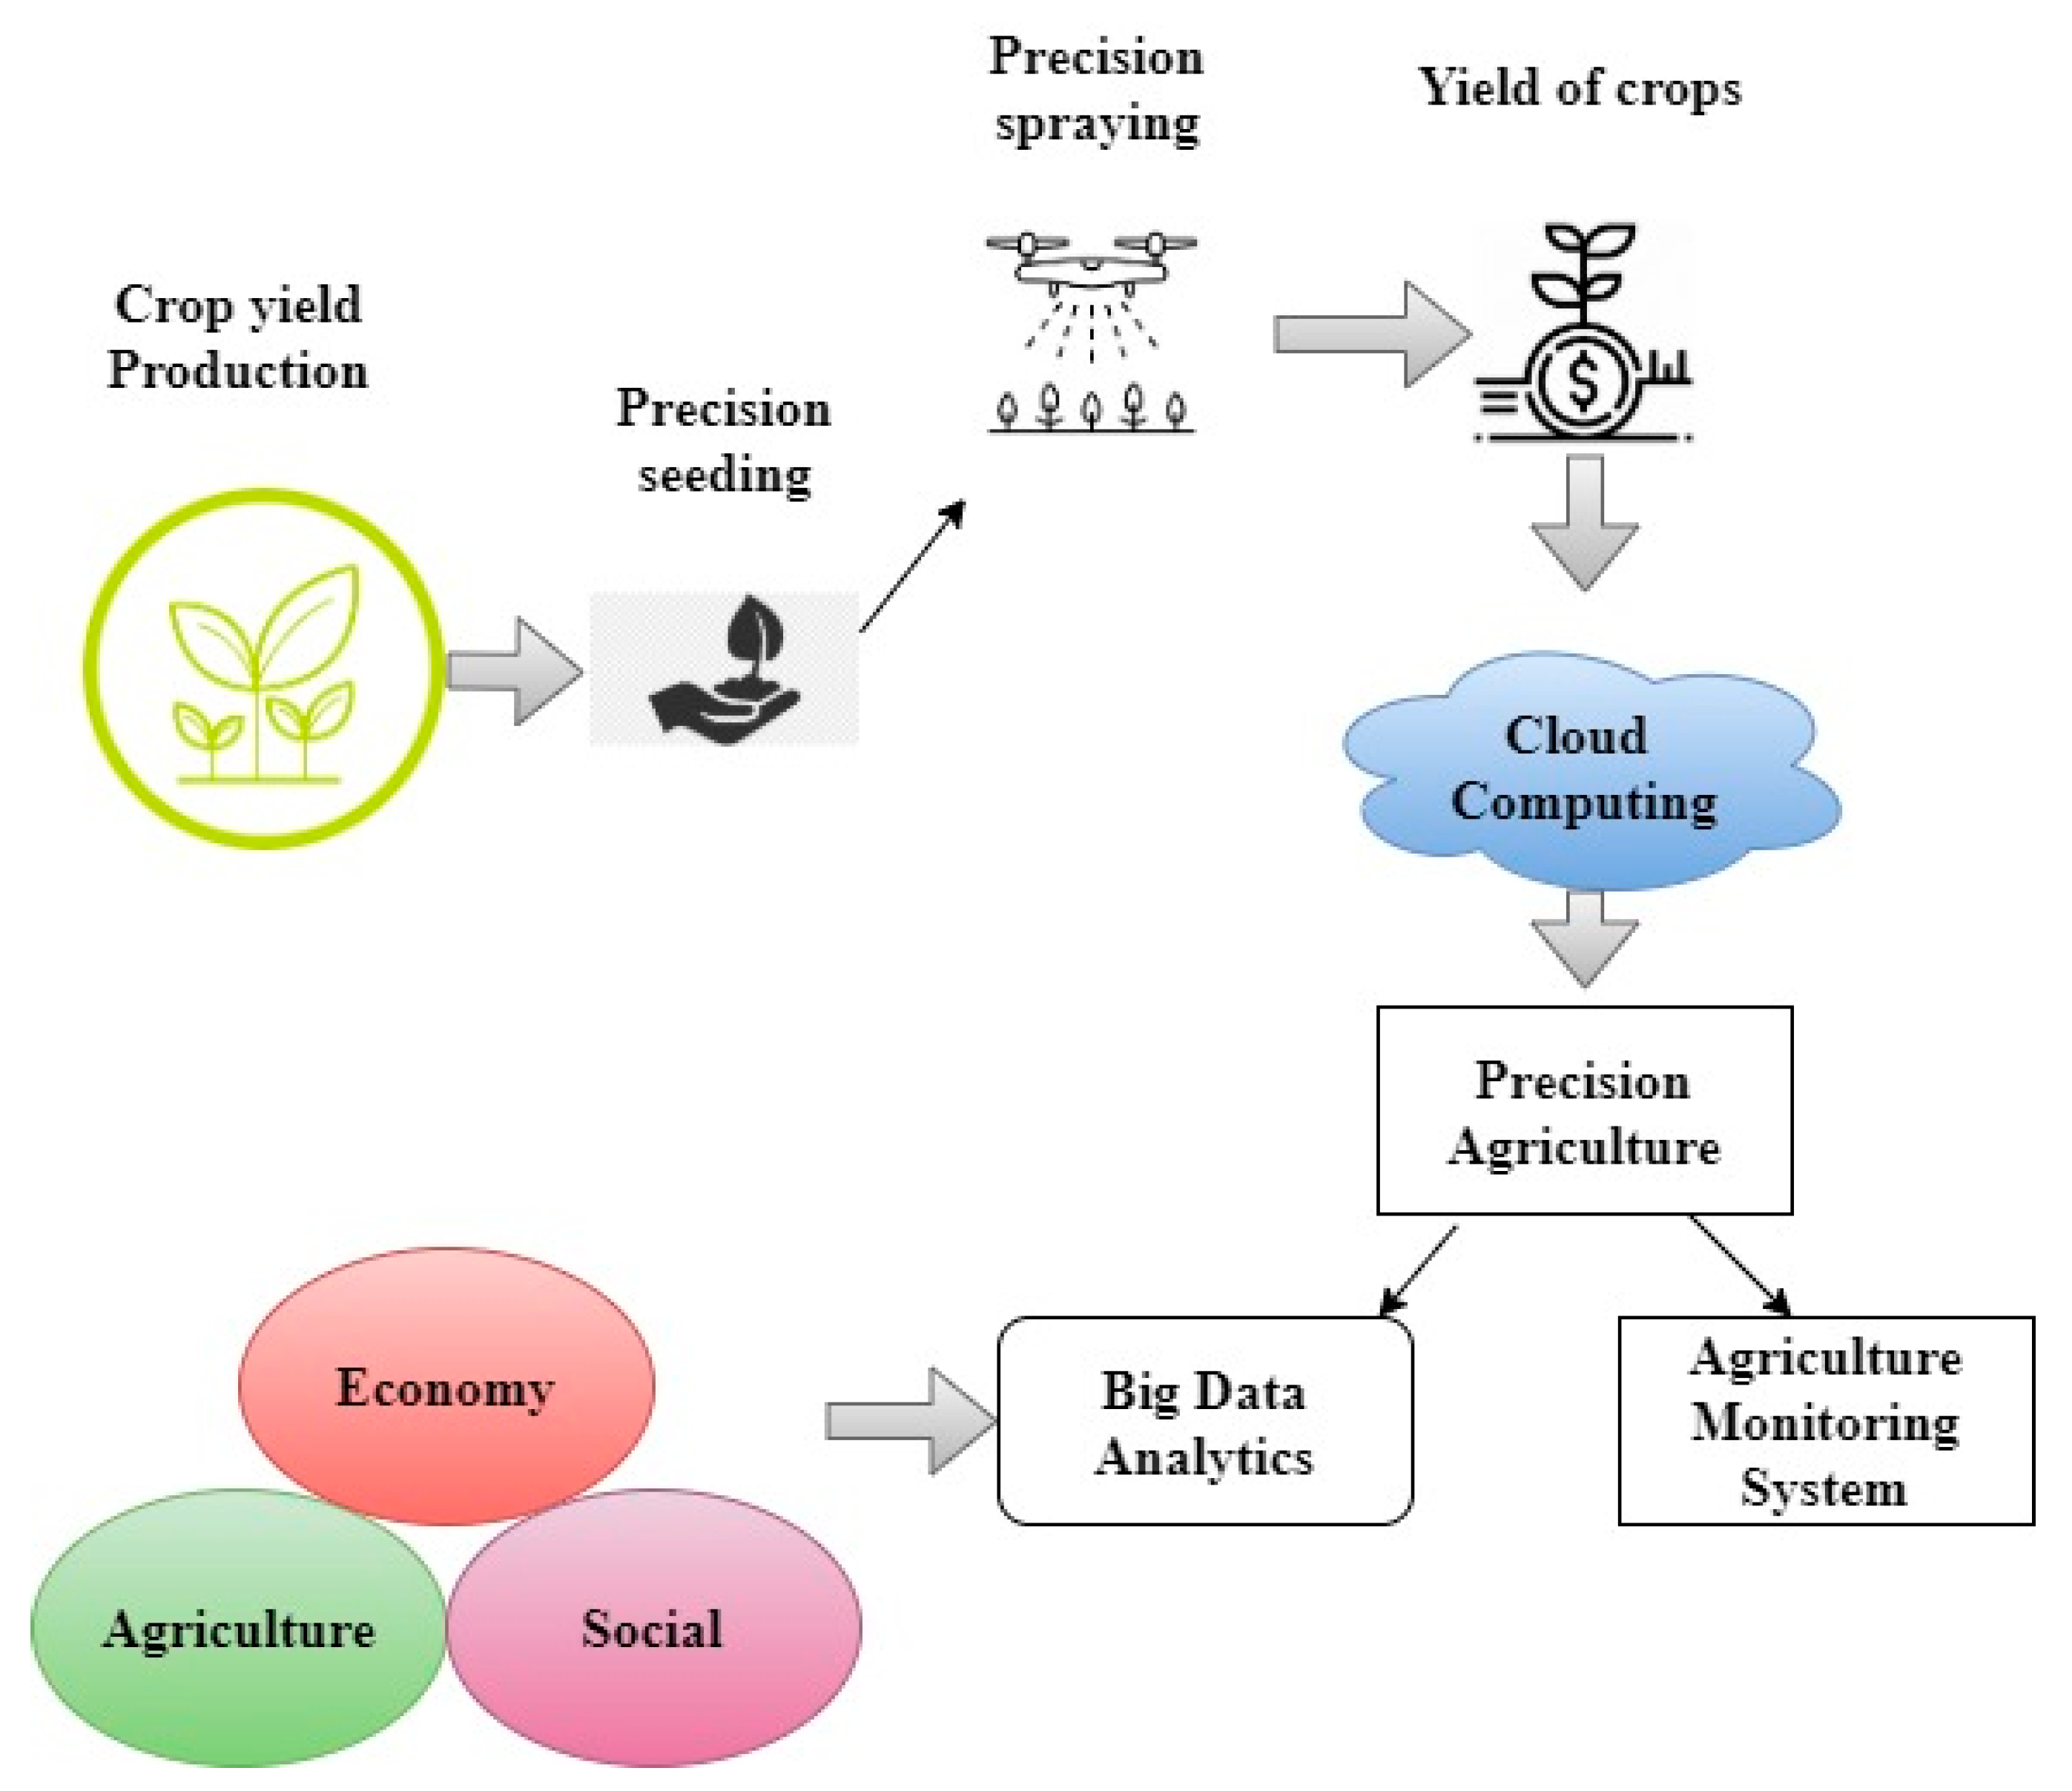
2. Big Data Analytics-Initiated Agriculture Monitoring System (BDA-AMS)

2.1. Reasons for System Design

This paper discusses precision agriculture using big data analysis for crop yield prediction, reducing labor, and improving agriculture monitoring systems to enhance China’s economic management. Big data analytics in agriculture provide meaningful insight to advance weather decisions, improve crop efficiency, and reduce the possible usage of fertilizers and pesticide costs. The management of the social and economic growth of China mainly depends on precision agriculture and crop yield production. The details of agriculture regarding precision spraying and the details of crop yield are stored on a cloud platform in which precision agriculture and agriculture monitoring systems are used to develop China’s economic management.
Various big data sources in precision agriculture use UAV components with organized and unstructured data types. In agriculture, big data applies to the huge amount of data generated from social and measured agricultural work. The processing and management of big data is a difficult challenge across the traditional platforms and methodologies used to manage China’s economic condition. Big data analysis and UAV solutions can support farm production companies and departments in carrying out agricultural growth and productivity analyses, supporting expected agriculture trends, and identifying social status. Big data analysis and ICT applications can take real-time management measures in precision agriculture. Knowledge of big historical information can be mined, and trends can be discovered to forecast harmful agriculture events. This paper suggests a big data analytics-initiated agriculture monitoring system (BDA-AMS) to ensure high-precision crop yield predictions using a deep learning algorithm based on the social and economic background.

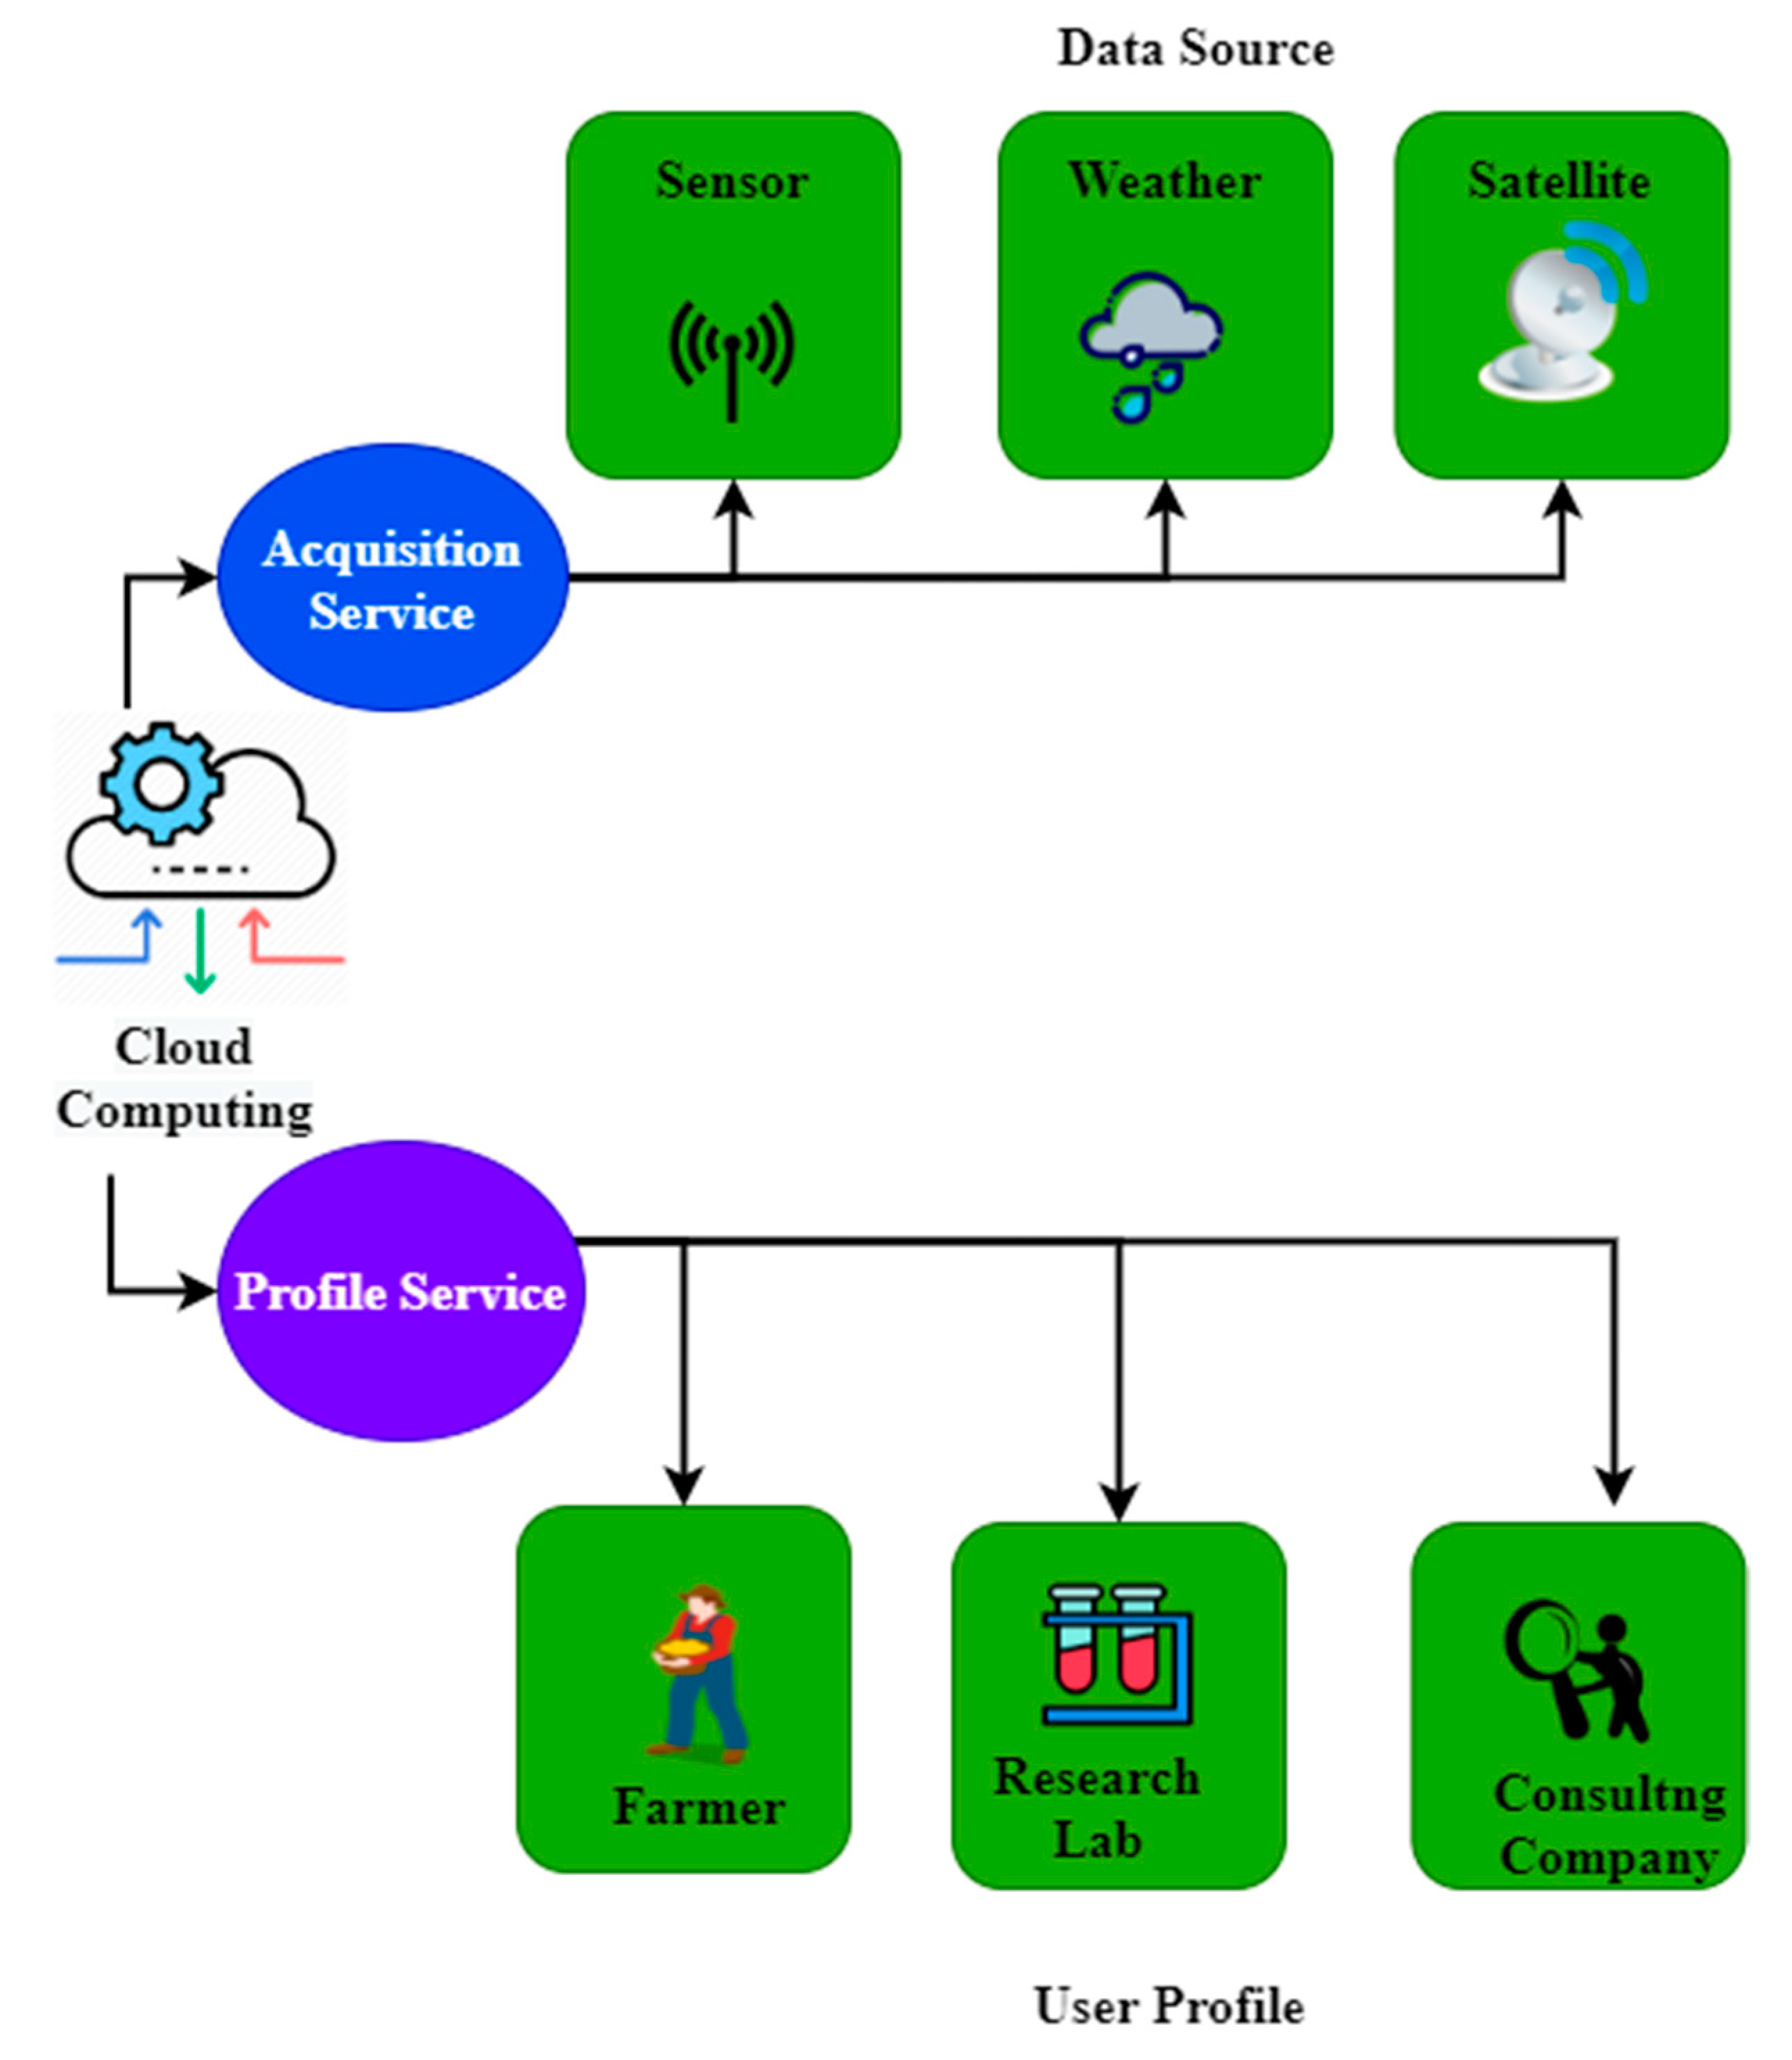
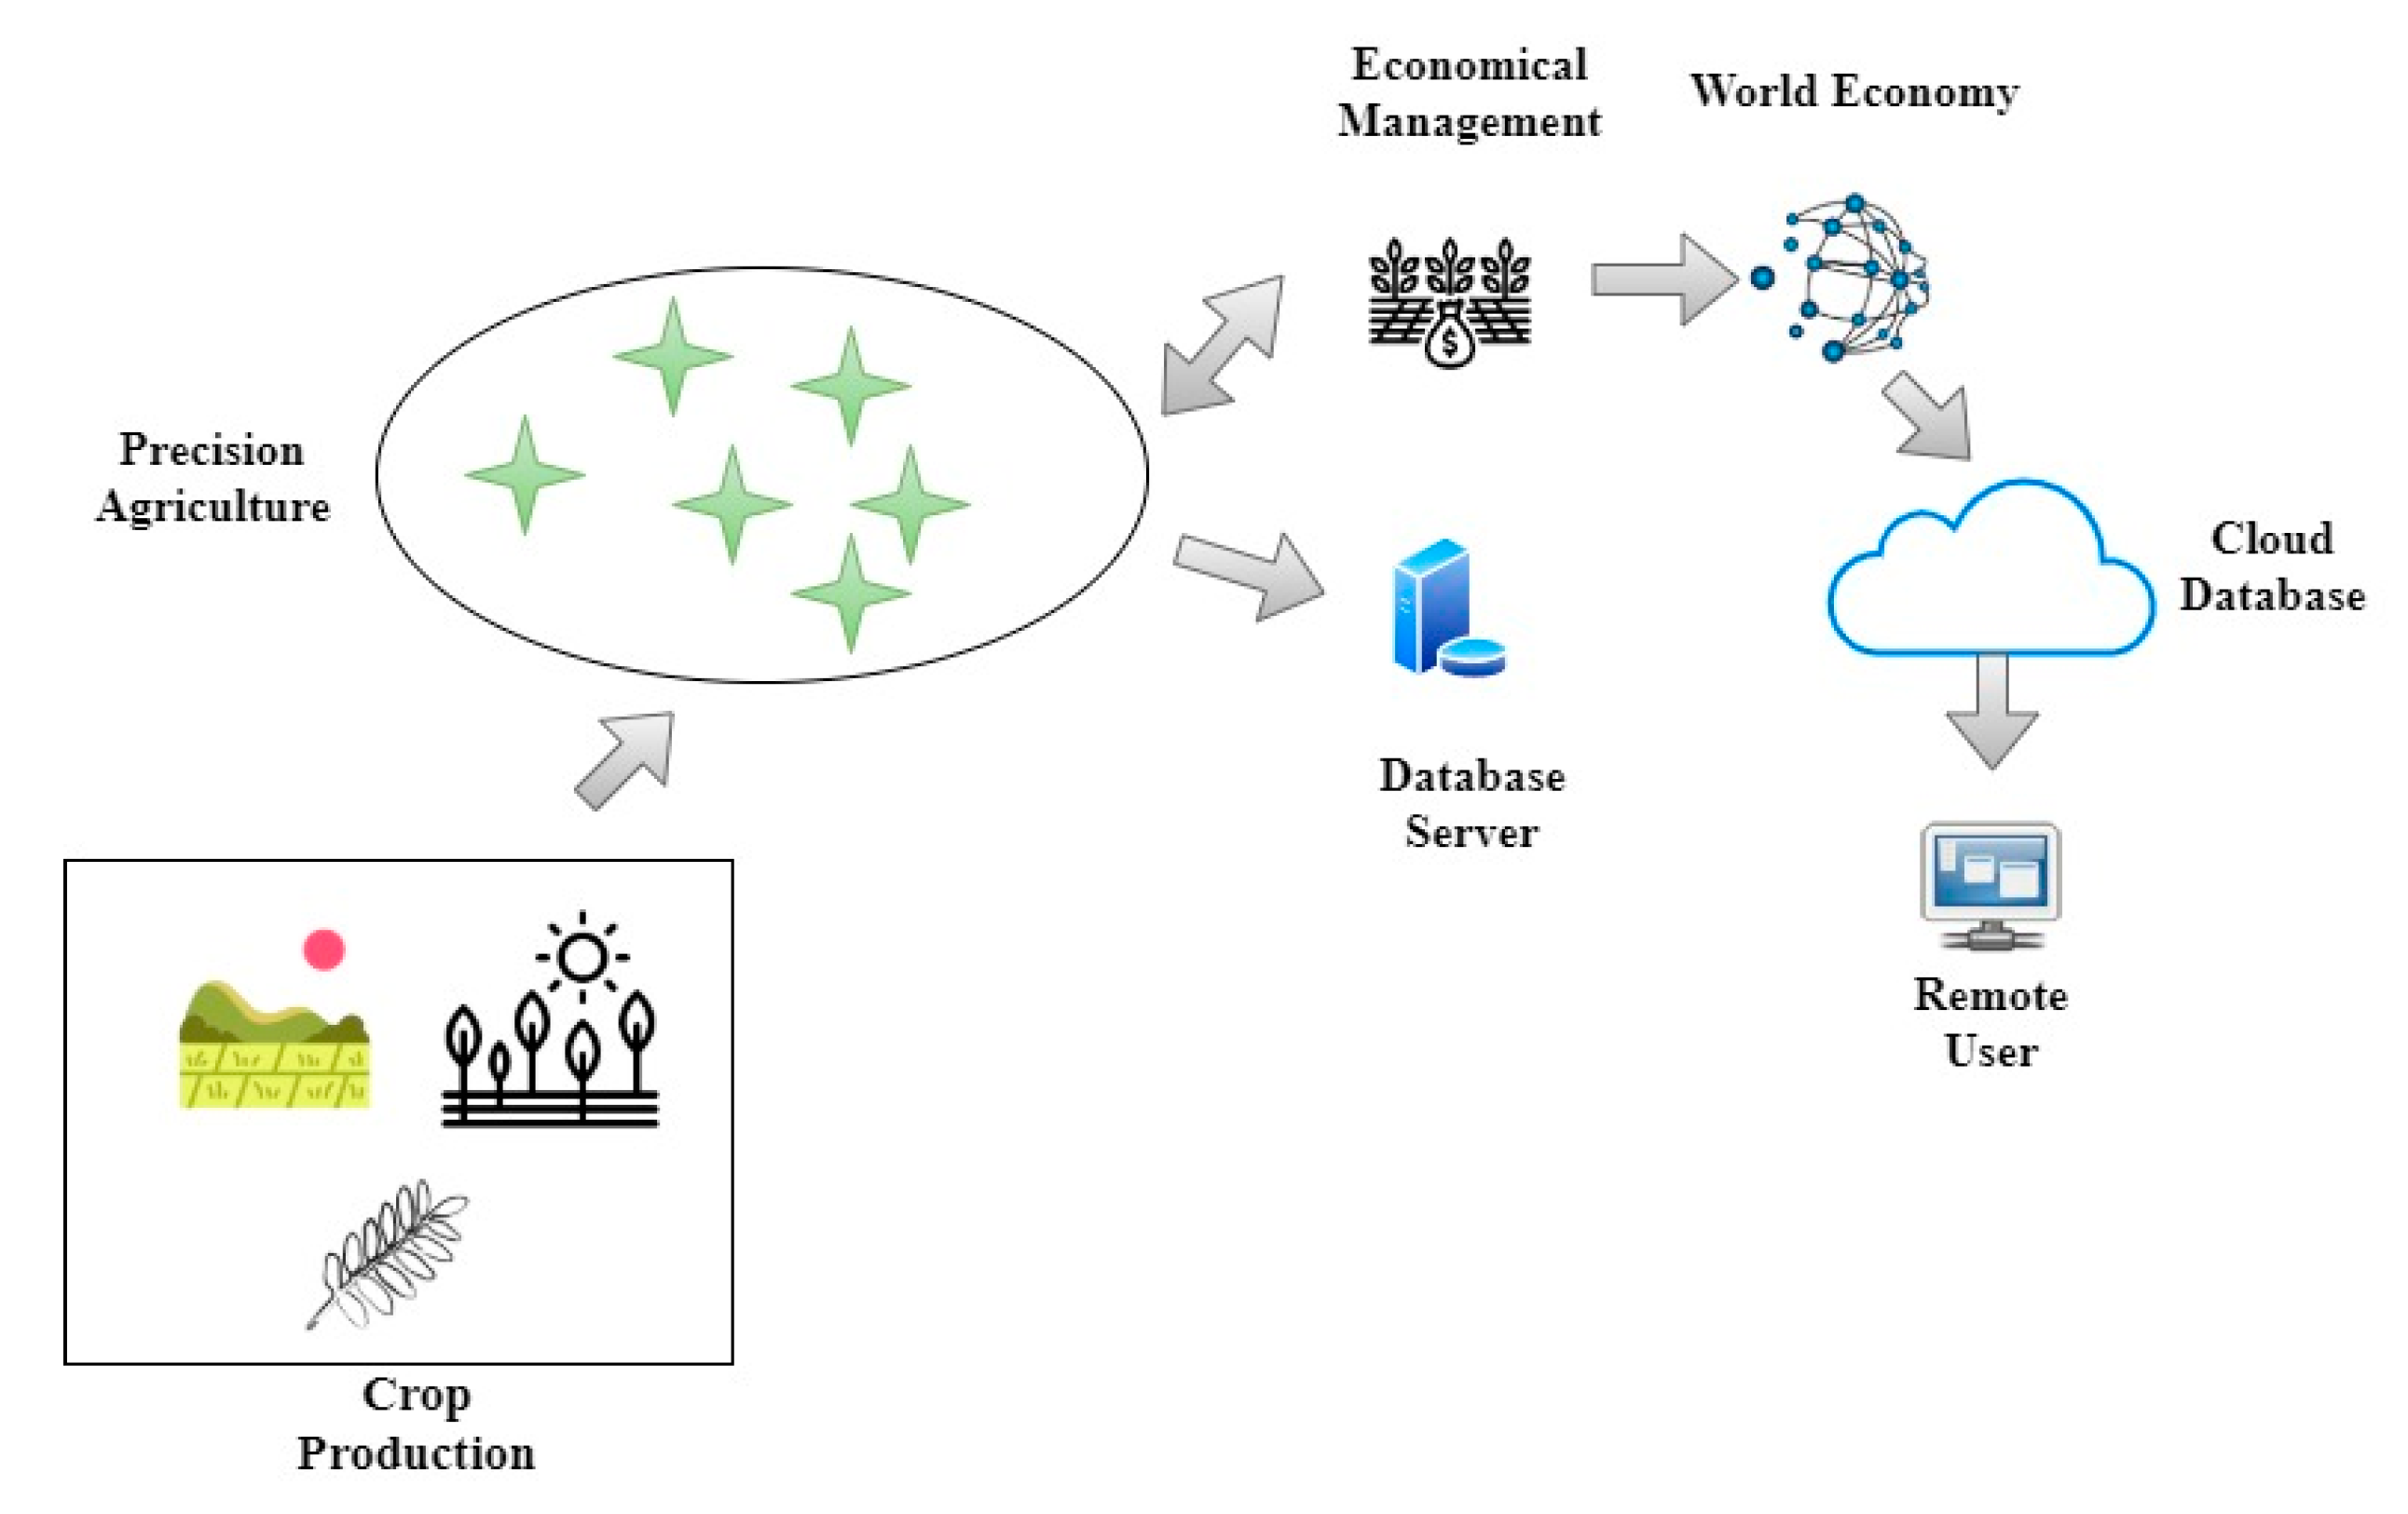
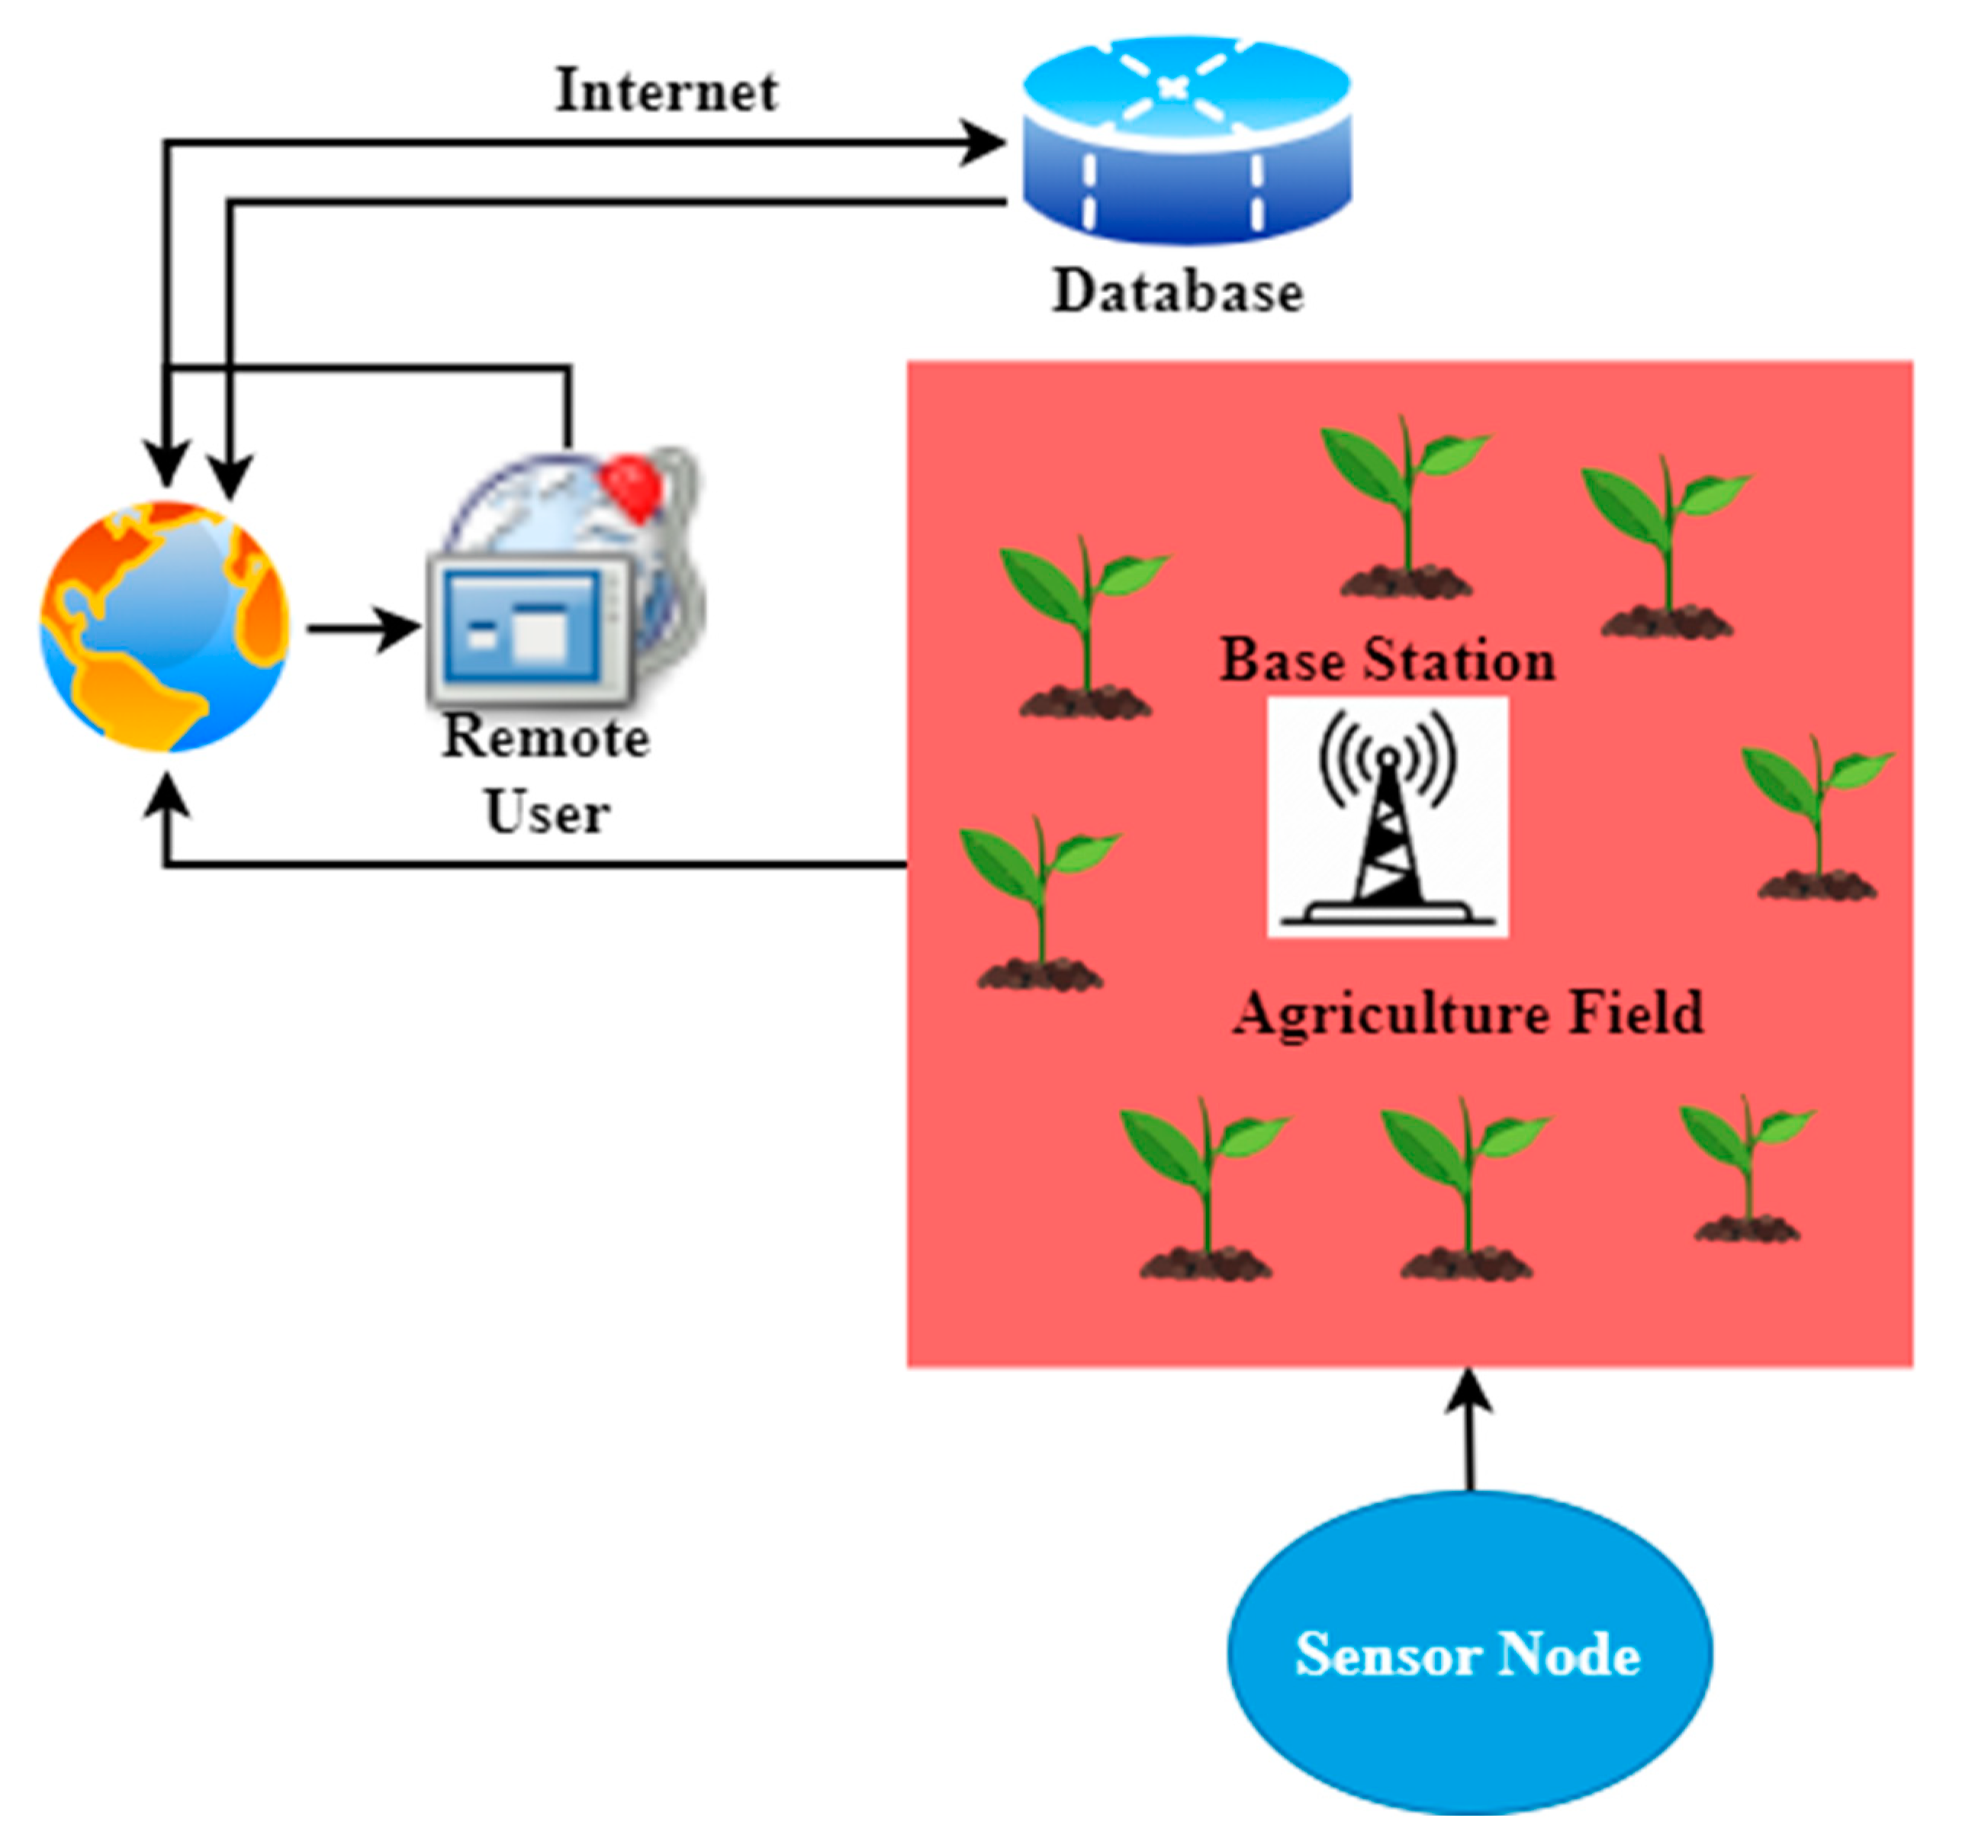
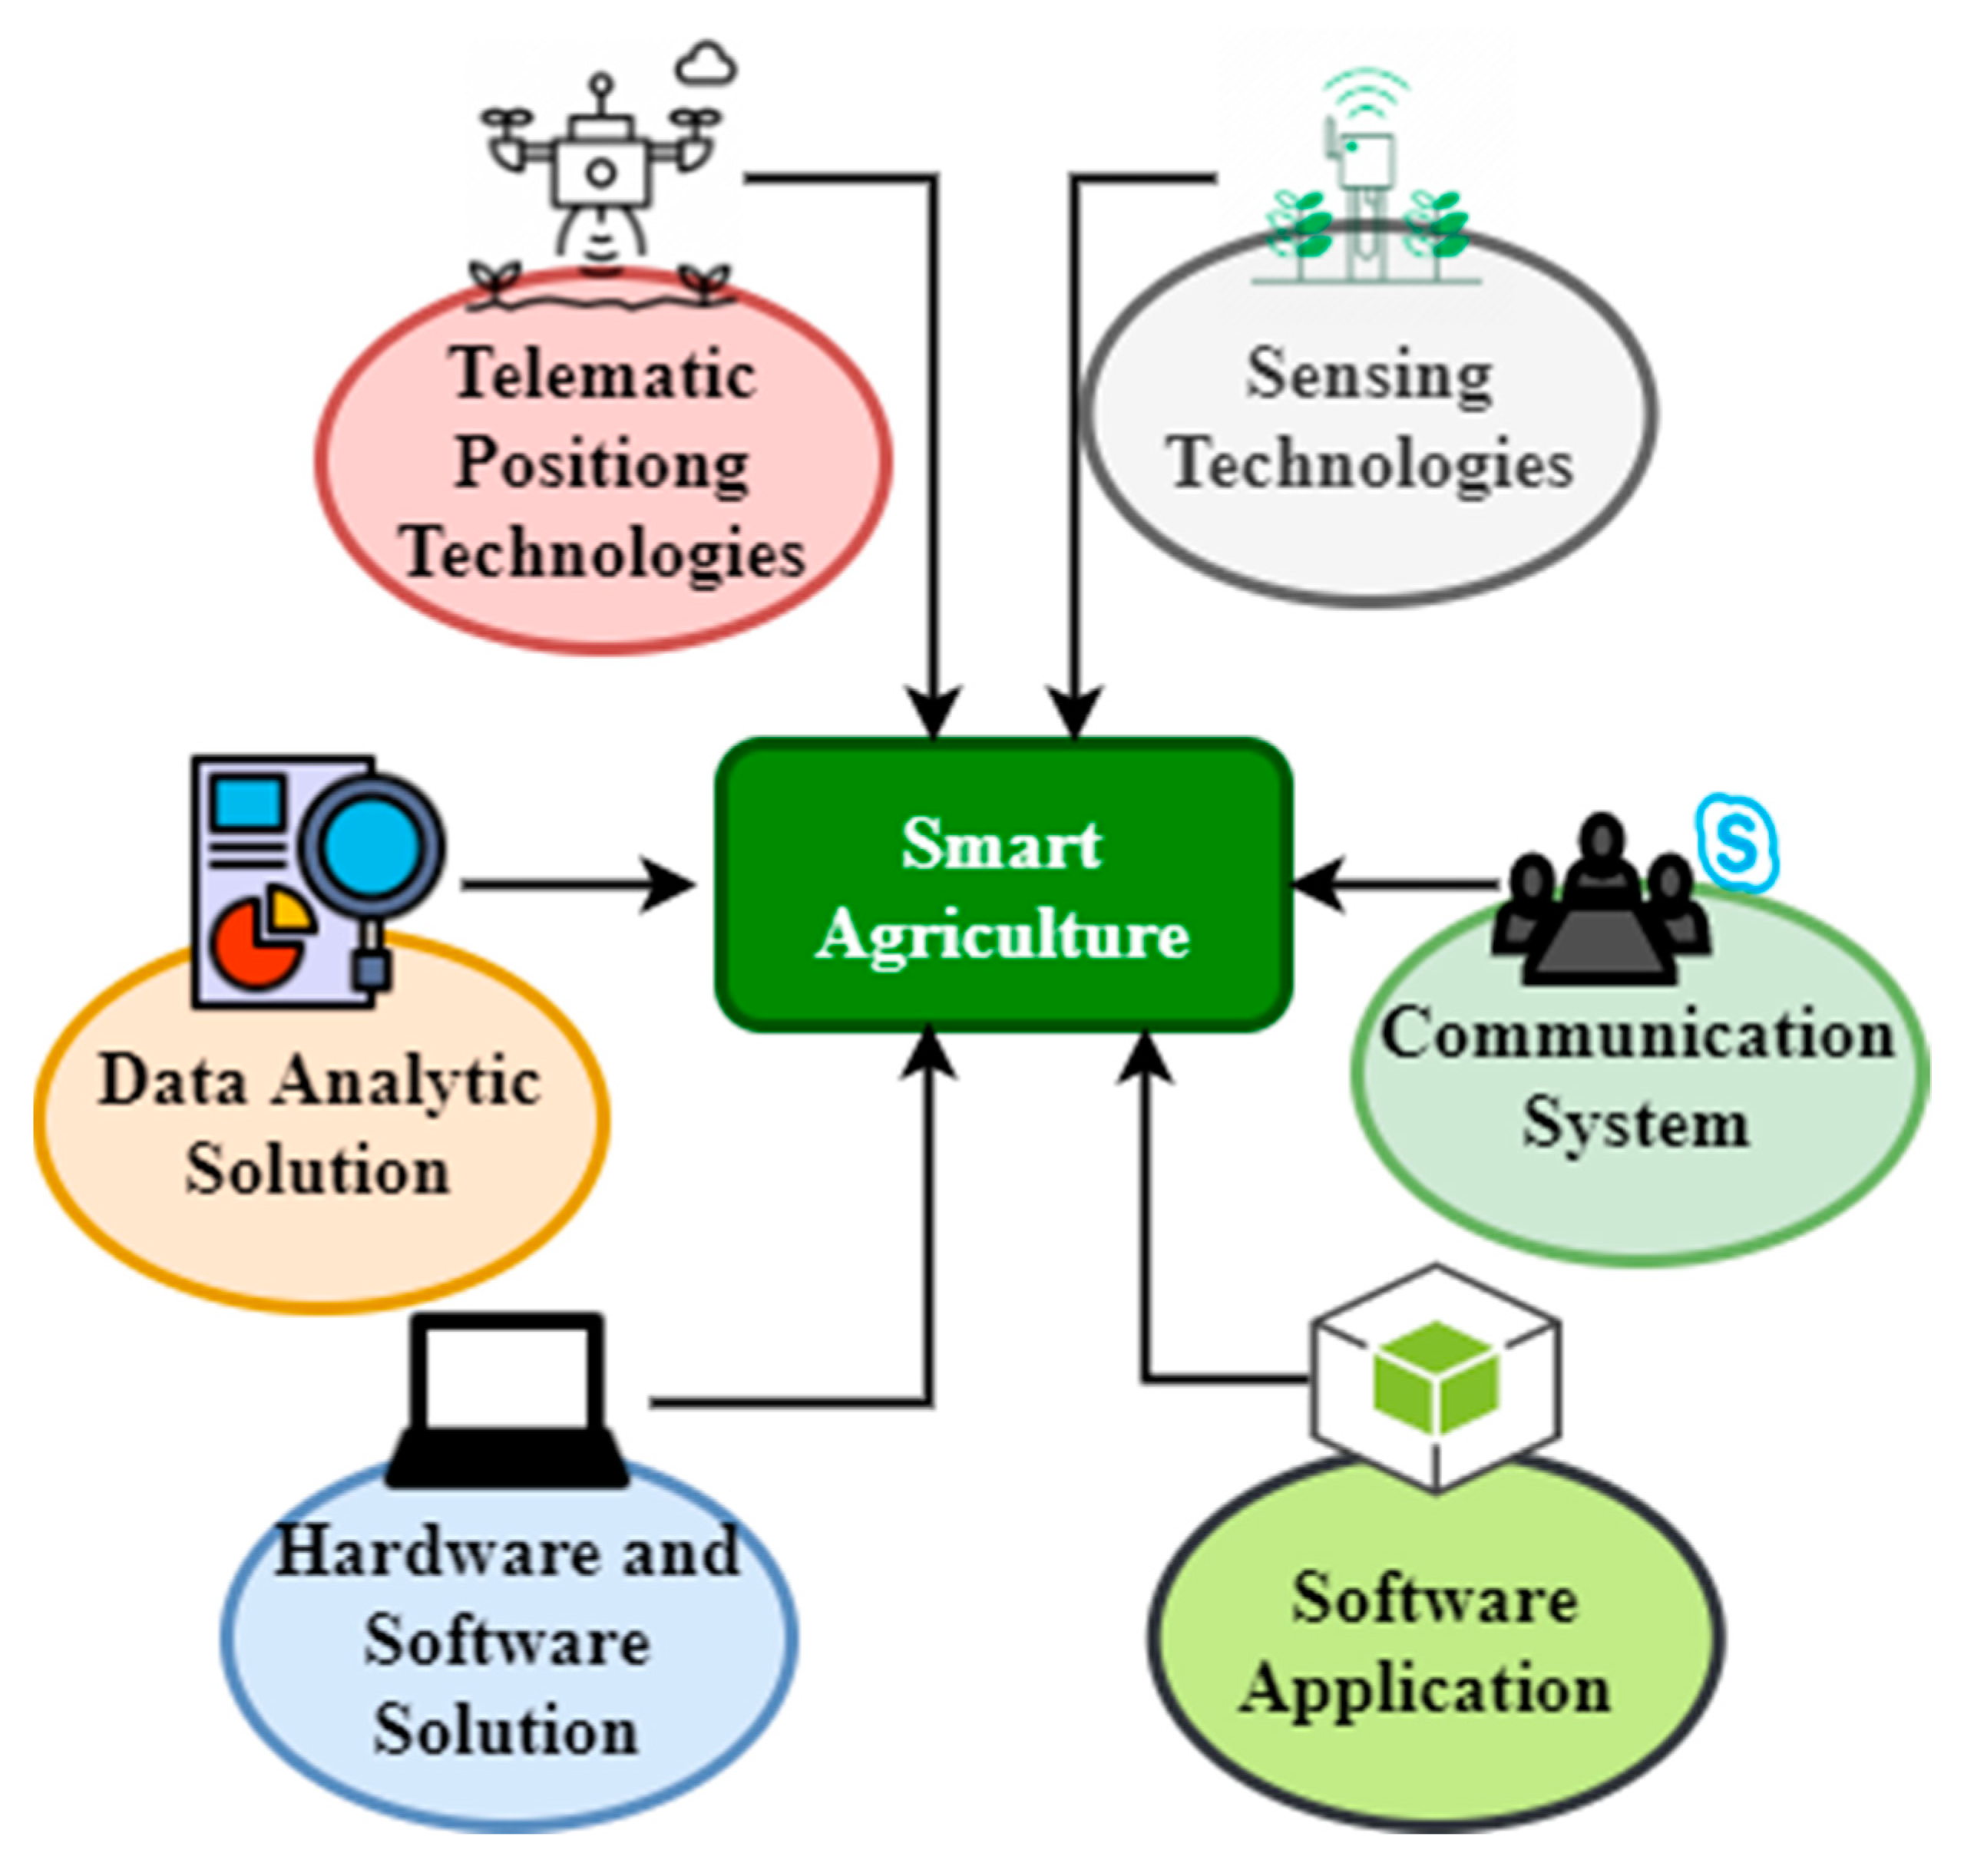
2.2. BDA-AMS’ Basic Framework and Main Principles

BDA-AMS’ basic framework is roughly expressed in Figure 1 and Figure 2.
Figure 1 demonstrates cloud computing-based precision agriculture. In all ways, agricultural activities are responsible for a substantial amount of data input/production as well as remote sensing data and use much of their external information to direct farmers’ decisions through the use of weather data and satellite images. Usually, three features of large agricultural concept data, including volume, variation, and velocity, are employed. In other words, the variety of data obtained in massive quantities due to high speed from agricultural activities can be called big data. In the interest of big agricultural data, the data produced from distributed resources and constrained sources to be extracted, processed, and analyzed to cloud computing in agriculture can provide analysts and decision-makers with massive solutions to solve economic problems. The benefit of the cloud is that it is capable of gathering and centering complete data independent of their origin from special blocks during extensive data management processes for detailed processing, such that valuable information is recorded to maintain the related economic issues. This can be achieved using new database architectures, including research methods, databases, and distributed storage, when processing extensive information to spread loads across several nodes using the maximum abstraction of the parallel mechanism. Using precision agriculture and the crop production to predict the agricultural economic management is utilized with the data obtained from the database server and the remote user, as illustrated in Figure 2.
Agricultural economic management comes from agricultural production, not only for the process, or for the result, and strives to achieve fine management. In the information age, agricultural economic management based on information technology can be roughly represented as in Figure 3.
The virtualization network provider is an integral part of the architecture. It is responsible for developing the user profile to question the system and to design the required big data resources to achieve the user’s requirements. The datasets are generated from different sources, including sensors, weather and climate stations, satellites, and government entities, to enhance China’s economic management. Data collection is an essential task, as it can keep the data streams together before the storage process is complete. This work focuses more on the composition of excellent data and profile services, while their proposed development will discuss the transaction service. Important technological advances have been made in big data, data collection, decision-making systems, and agricultural information technology, and many farmers use integrated crop management technology to reduce waste and to increase the value of the economic background of crops.
Figure 4 shows an agricultural field using a sensor node and a database system. The WSNs in the agricultural field can contribute to farm precision and to various parameters, such as temperature, soil condition, precipitation, air pressure, and precision agriculture, to develop economic management. Big data must develop automated tools or techniques for decision-making that can apply the appropriate amount of input at the right moment and at the right locations to increase the output quality of crops (water, fertilizers, pesticides, etc.). Farmers do not need to continually monitor agricultural economic management to acquire information from new automated irrigation systems in modern agriculture. The proposed monitoring system can be performed by gathering real-time soil, temperature, and air quality data using sensors in a more accurate approach that utilizes agricultural economic management. The proposed use protocol is a resource method in which a field observation can be taken out automatically using sensors and the requirements defined by users to save farmers’ energy and time in continuous field monitoring to determine where irrigation is required in general. In addition to making more intelligent decisions, predictive analysis is needed such that irrigation can occur automatically when a rising water requirement exists to meet the needs of economic problems.
The primary issue when developing communication protocols is energy conservation for wireless sensor networks (WSNs), which requires consistent data from network field applications (such as military applications, healthcare applications, and traffic management), while some applications, such as agriculture and industrial applications with efficient precision, require network information when appropriate. The proposed communication protocol uses a regionally dependent static clustering method to provide adequate coverage across an extensive area in agriculture economic management. The whole network area is divided into fixed regions, where various types of interacting sensor nodes are accessible. The communication network allows aggregated sensor nodes, and there is less energy in specific nodes than in other nodes, sending data directly to the base station (BS). Other highly powered nodes use IoT sensor node technology to transmit data into the BS. This reduces the consumption of sensor node energy in any data transmission cycle and improves the system capacity. A protocol for adequate irrigation in the agricultural sector is proposed for efficient, energy-efficient, periodic threshold-sensitive regional basis-based integrated routing to improve economic management. The proposed communication protocol for precision agriculture is the most effective energy-efficient routing protocol.
Figure 5 explores smart agriculture-based system technologies for farmers. Smart farming is a new concept that includes managing farms using national information technology to increase the quantity and efficiency of products while reducing the number of human workers required. IoT systems implemented on a farm can gather and process data in a repetitive process that allows farmers to rapidly respond to analytical challenges and environmental conditions to improve economic management. Precision farming is a prime factor for IoT methods that can increase the control and precision in farming. Simply added, plants and bovine animals are precisely controlled, with perfect precision determined by the devices used in modern agriculture. The main difference between precision farming and the classical approach is that it allows for one square meter per plant/animal rather than per field. As with precision agriculture, intelligent farming techniques enable farmers to better monitor each animal’s needs and to change their food to avoid symptoms and improve health. In precision agriculture, smart sensors provide data for farmers to monitor and maximize crops and to deal with changing environmental factors. By placing sensors, farmers can micro-detect their crops, maintain energy levels, and reduce their impact on the environment.
Smart agriculture research aims to determine a farm management decision-making system. Smart farming considers these systems essential, from seed planting and watering to health in the harvested sector, and these systems can solve population development problems, climate change, and functions, gaining technological attention. Telematics systems enable farmers to closely follow their sets of vehicles and trucks using GPS trackers, which allows agricultural managers to know exactly where all the tractors and cars are at any given time. The collected user data analyses can be used to collect data that farmers can use to refine their farming, allowing farmers to make smart agricultural decisions regarding production density, from preparation to cultivation, and smart objects identify themselves by their ability to record and analyze information. Smart agriculture uses both hardware (IoT) and software for data collection and provides actionable insight into all farming agriculture economies before and after planting.
Figure 6 depicts a crop yield prediction system based on smart agriculture and data storage. Smart agriculture is an adaptive concept that refers to the management of farmers using precision IT technologies to increase product quantity and quality while minimizing the number of human workers required. Smart farming is an alternative method for the efficient use of water to grow crops, and the addition of imaginative farming approaches to conventional agriculture limits real-time control, reducing human resources, time, and precise estimates of the required irrigation water while protecting crops against disasters such as diseases and floods. These developments help farmers to reduce the costs of growing and maintaining yields and increase farmers’ income by producing a large number of crops using modern agriculture to improve economic management. The resulting papers compare traditional and intelligent agricultural activities, smart farming technologies, and WSNs in the farming realm as well as autonomous water application.

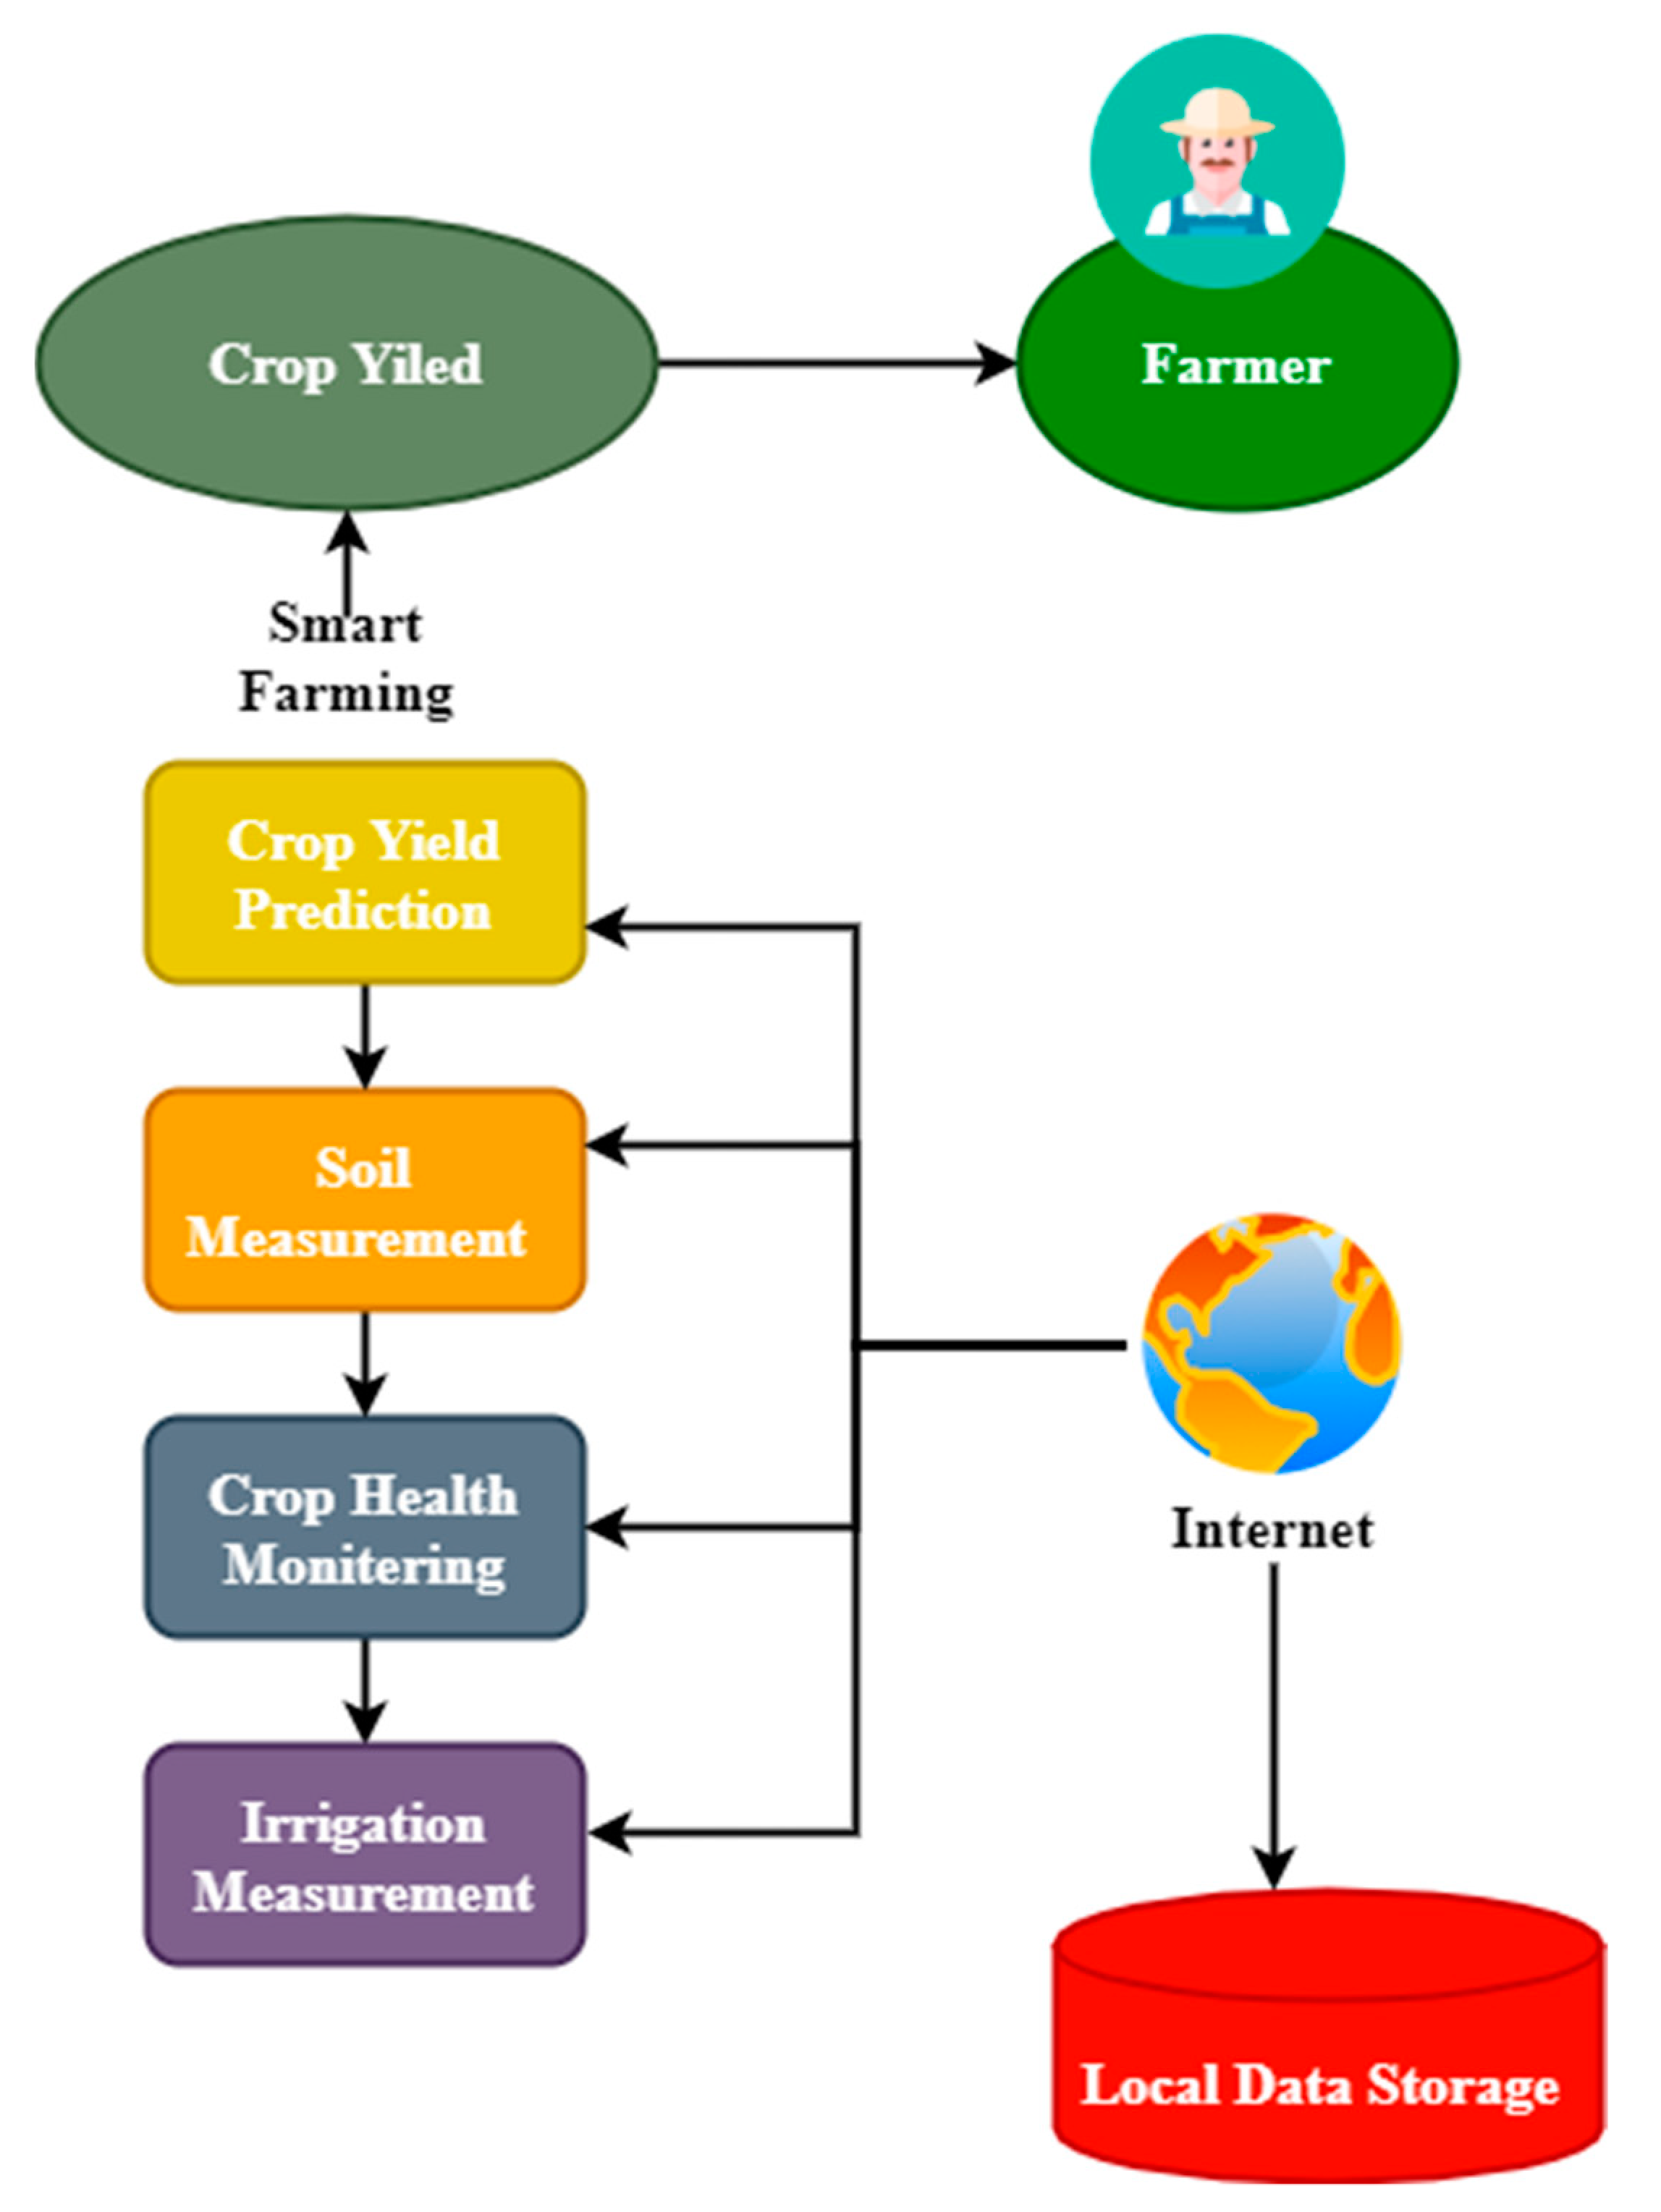
2.3. Operation of System

The loss of WSN data transfer happens due to environmental implications. When transmitted by data, most wireless sensor communication technologies cover a short range of sensors or routers within the WSN. Multi-tire, ad hoc, and mesh network topologies will prolong connectivity within the network. Some of the critical problems in WSNs are the scale and location of a sensor node. The performance and life of a WSN primarily depend on sensor node deployment. The deployment system for a WSN covers two groups—random and determinist deployments—with haphazard approaches being used for deployment in expansive open environments and deterministic point-by-point strategies being used for small-scale deployments.
The automated WSN and GPRS irrigation system was established, and this device transmits soil moisture and temperature information to the sensors throughout the root area of a plant’s wireless communication system. The sensor information is gathered at a gateway and sent to a webpage. This algorithm sets the temperature and soil moisture threshold values programmed for a microcontroller-based gateway to control irrigation measurements. This paper highlights the advantages of intelligent agriculture over conventional framing and numerous technologies and implementations. By installing smart agriculture systems, farmers will benefit from higher profits, better yields, easier land monitoring, and productive water use. Finally, numerous WSM and different approaches have been proposed for independent irrigation in agriculture. The whole agriculture system can be automated to create sustainable agriculture through technologies such as the Internet of Things, fog computation, and cloud computing, which reduce the waste of time and reliable resources. Table 1 shows the symbols and descriptions.
σ Z = N j = 1 k λ 1     O 1   |   U j   |
According to Equation (1), the limiting molar conductivity is calculated. In this equation, N is a cell-constant that accounts for the geometrical electrodes due to the geometry of the time field, σ is the limiting ion molar conductivity, O is the molar concentrations (mol O−3), and Uj is the absolute value of the ion charge.
F B 25     = e q · F B q
According to Equation (2), Figure 7 shows how the temperature consumption is formulated. For comparison purposes, FB is represented by the reference temperature traction of the electric current and the volume of 25 μC. The calculation of FB depends on the separation between the electrodes. The greater the distance, the deeper the calculation and reference are at a specific temperature (q, FBq), and eq is a translation factor in the temperature assigned in Equation (2)
F B a = 1 2   π a G
According to Equation (3), the measuring volume for field collection is calculated. In all plant trials to determine heat tolerance, FBa is traditionally the standard test and uses approximately two inner potential salinity electrodes. G is measured by resistance, and FBa is the inverse of G. A relationship between FBa and FBq is required for the soil surface spacing at a depth of approximately that of the interelectrode results obtained in Equation (4):
F B y = F B a j a j 1   ( F B a j   .   a j ) ( F B a j 1 · a j 1 ) ( a j   a j 1 )
As determined in Equation (4), the fixed electrode is updated. FBa can be used to determine the discrete plant depth range, FBy by calculating FBa in successive levels by increasing the distance between the electrodes from one electrode to another. The current source is calculated according to the idea that it can be superseded using Equation (4), where aj is the inter-place that is equivalent to the sampling depth, and aj−1 is the inter-place that is equivalent to the previous sample depth in Equation (5):
x   ^ = e ( y ) + ξ
x j   ^   = a 0     + a 1 y j     + ξ
The linear regression and data processing calculated using Equations (5) and (6) are evaluated. This is the supervised learning approach to forecast possible trends of historical data objects. In this case, Y is the number-dependent variable, and the numerical value of x is approximated. Equation (6) indicates the difference between the real value and the forecasted value. Y is estimated to be e ( y ) , and x   ^ is implied symbolically. When there is a linear dependence between x and y, linear regression can be used. In this case, the algorithm used in model y as a function of x demonstrates Equation (7):
E ( T ) = 1 K   j = 1 K ξ j 2
According to Equation (7), MapReduce is calculated. MapReduce is used to measure the mean absolute percentage error values and to compute the patterns in the data predicted in the regression model. In this case, the x vector consists of k digits (×1, ×2, ×3 to 1, 1 K n), and k is the number of the data object attribute values in the dataset in Equation (8):
a 1   =   y x ¯ y ¯   x ¯ x 2       x 2 ¯
Using Equations (8) and (9), the regression coefficients are evaluated. The equations are used to calculate regression coefficients a 0 and a 1 . The sum of the vectors of y ¯ and a 1 is proportional to the number of dimensions in functional space and in the error word—the real and expected values differentiate the target variable. The symbol is used to denote the target variable’s expected value using the model and x ¯ + a 1 + y ¯ . Algorithms are used for learning, and a1 is used in the dataset objects. The aim is to decrease the difference between the real and forecasted values for all the data objects. This difference may be determined by decreasing the square amount of the difference between the actual and the forecasted targeted values in Equation (9):
a 0 = x ¯ a 1 y ¯
R ( O n + E ) = R ( O n )   T ( E | O n ) R ( E )
Figure 8 shows the low computational cost of Equation (10). As this algorithm functions with the assumption that each class system is nonlinear, a closed form was used to identify the highest probability of training, and computational costs were low. The training datasets include a series of E-tuples composed of n properties, and tuples were tested for the different classes: R ( O n + E ) . The BDA-AMS has been proposed to achieve a precision ratio, high accuracy, a better performance ratio, an improved data transmission rate, a reduced power consumption ratio, and an enhanced weather forecasting ratio, production density ratio, mean absolute percentage ratio, and reliability ratio.

3. Results and Discussion

The BDA-AMS method has been proposed to improve agricultural and efficiency performance based on the following parameters: the precision ratio, accuracy ratio, improved data transmission rate, reduced power consumption ratio, and enhanced weather forecasting ratio, production density ratio, mean absolute percentage ratio, and reliability ratio.

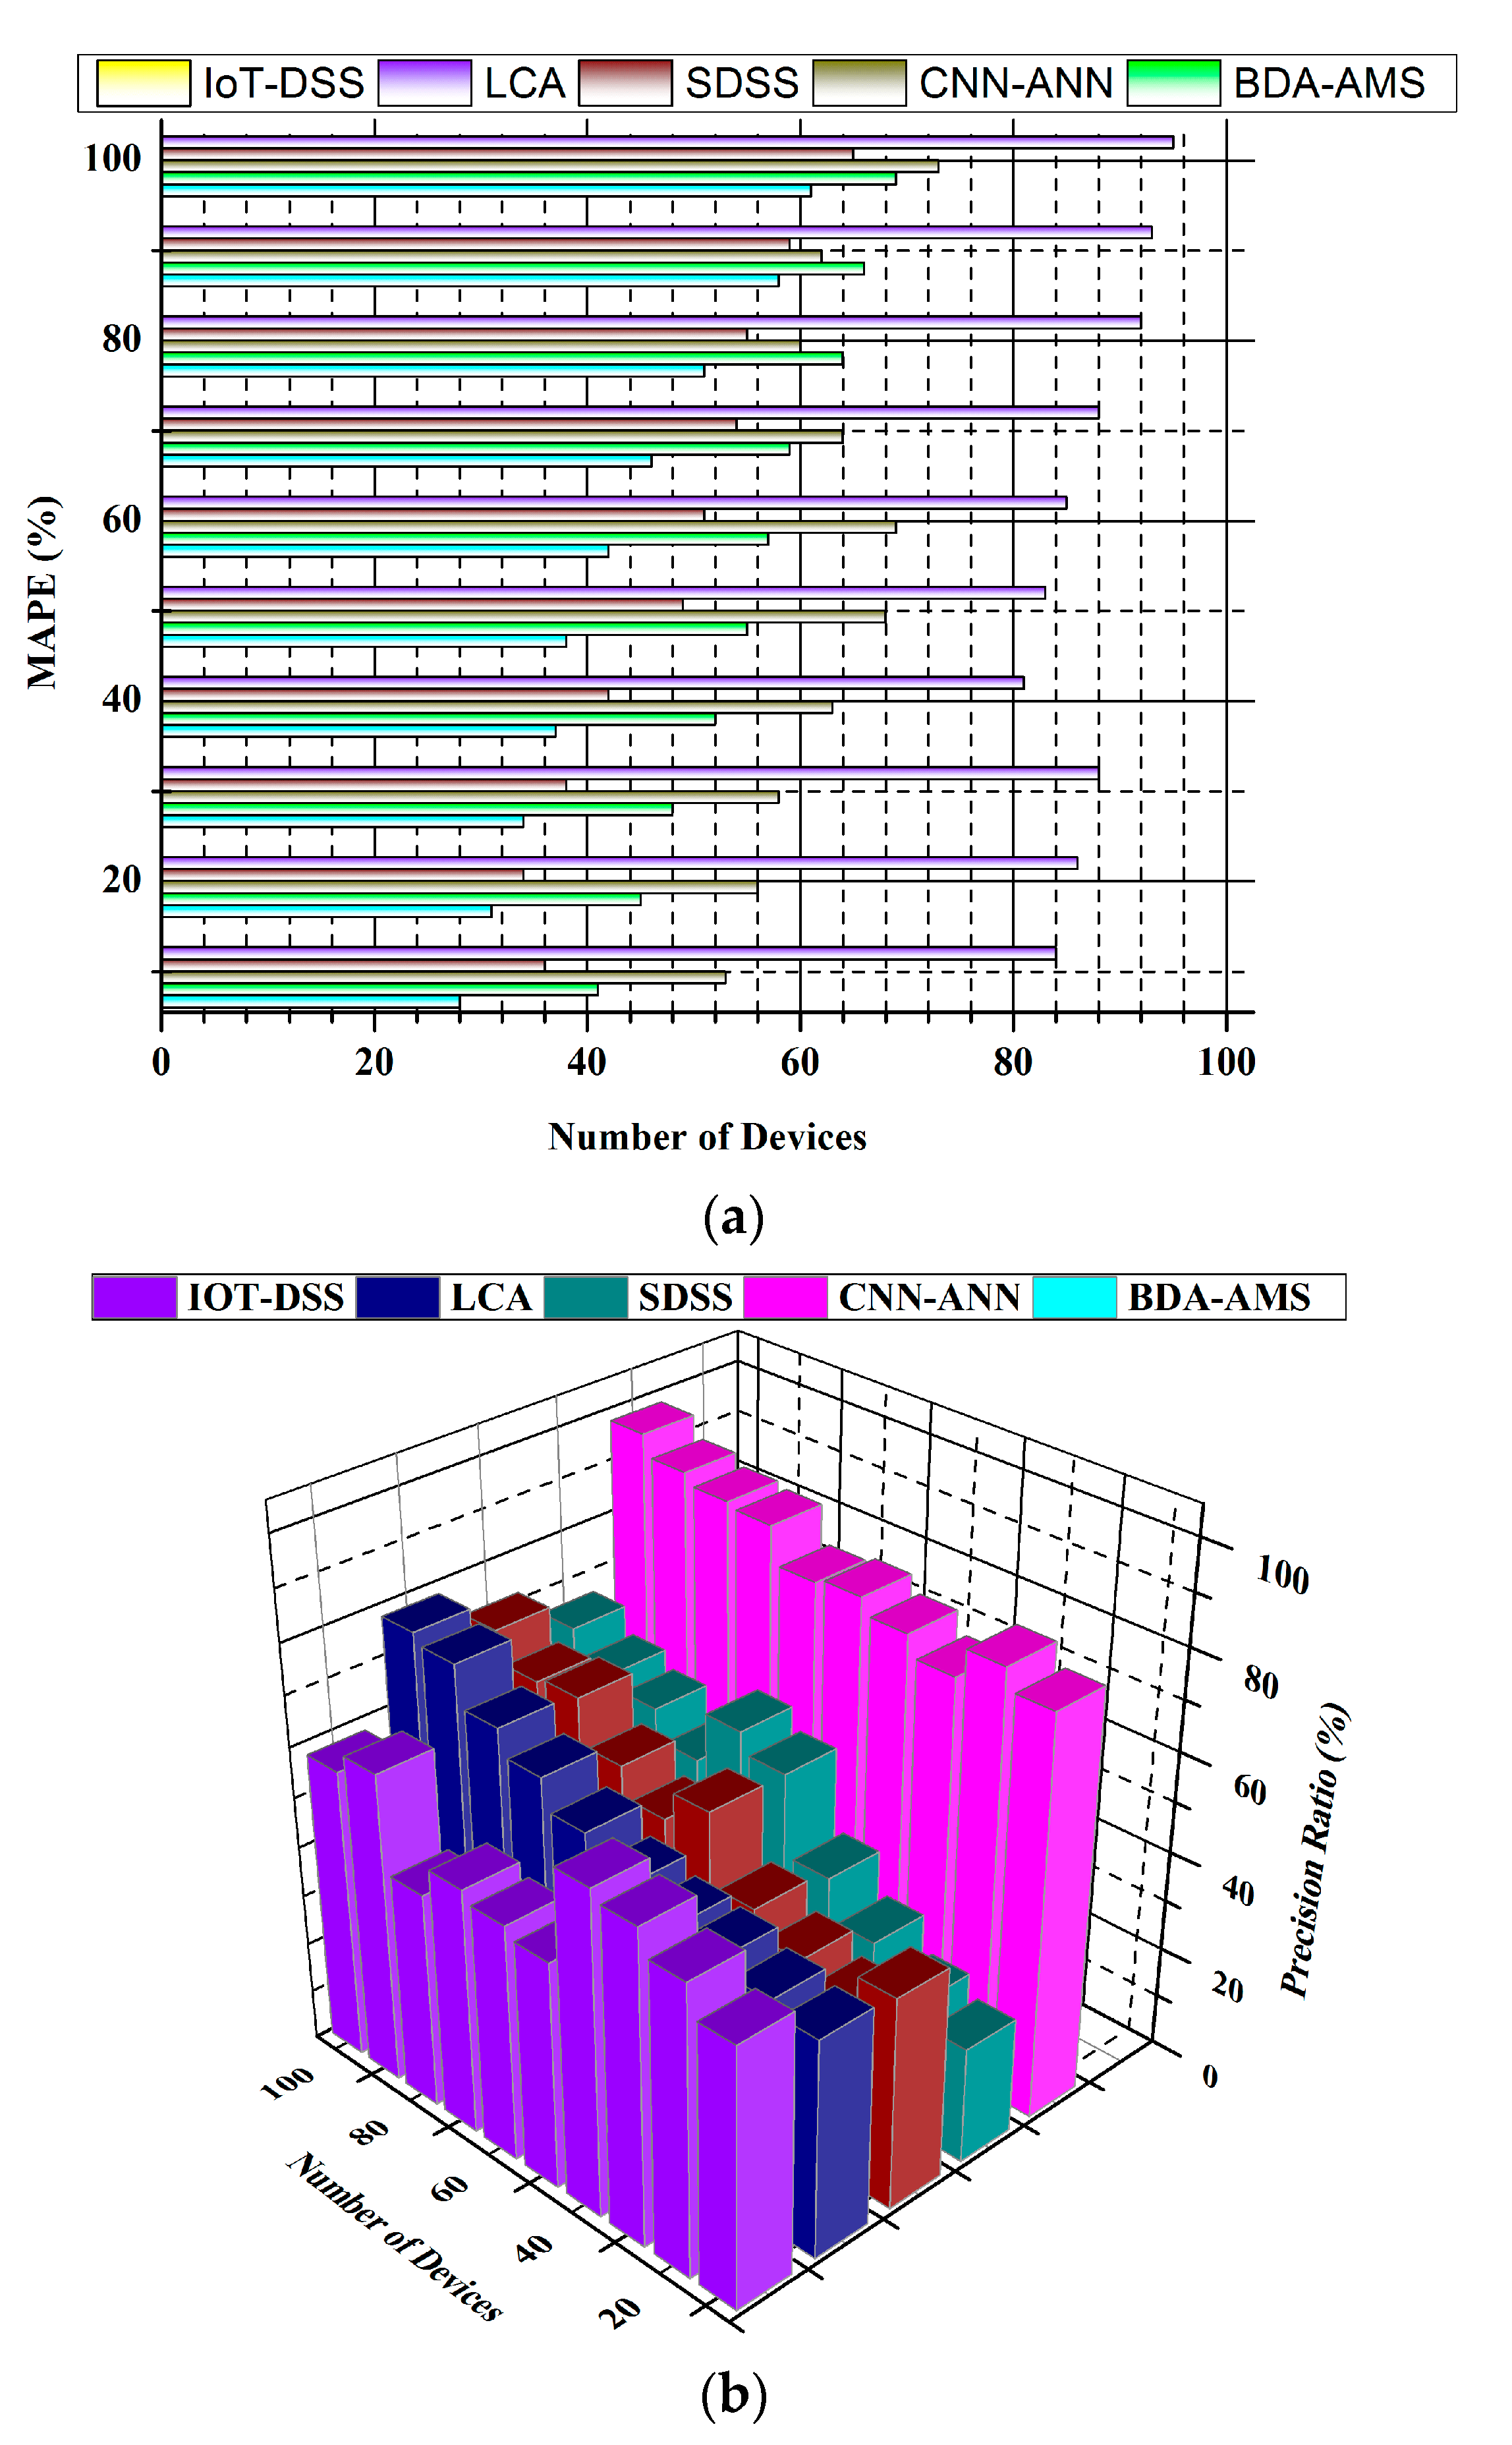
3.1. Precision Ratio (%) and Mean Absolute Percentage Ratio (%)

Precision agriculture is a technical method for improving communication between agricultural produce, normal food, and input land, electricity, water, fertilizers, and pesticides, and agricultural products that are used in modern agriculture. Precision agriculture can improve simplified methods and massively develop an area’s status, improving China’s economic management. Farmers are informed of advanced technologies that can contribute to creative and precise agriculture, agricultural production is clever, thorough, and data-centered, and multi-storage systems are used in big data analytics. The productive and accurate extent and appropriate implementation of irrigation in agriculture and in farming water management are designed to respond to crop requirements, reducing mistakes and adverse environmental impacts. Figure 9 shows the precision ratio (%) and the mean absolute ratio (%).
In conclusion, farmer’s age, farm size, farmer perceptions of the provision of the required information for precision agriculture in the case of the sample tested, and attendance in workshops and exhibitions have essential effects on the acceptance of intelligent agriculture. The error rate reduction obtained from the proposed model is used for economic management in agriculture. The mean absolute error must be as low as possible, and the mean square error ratio should be equal to one if a simple method has been used. The mean absolute regression error and the linear regression of simple public information for the tested concentrations were obtained from jack-knife procedures.

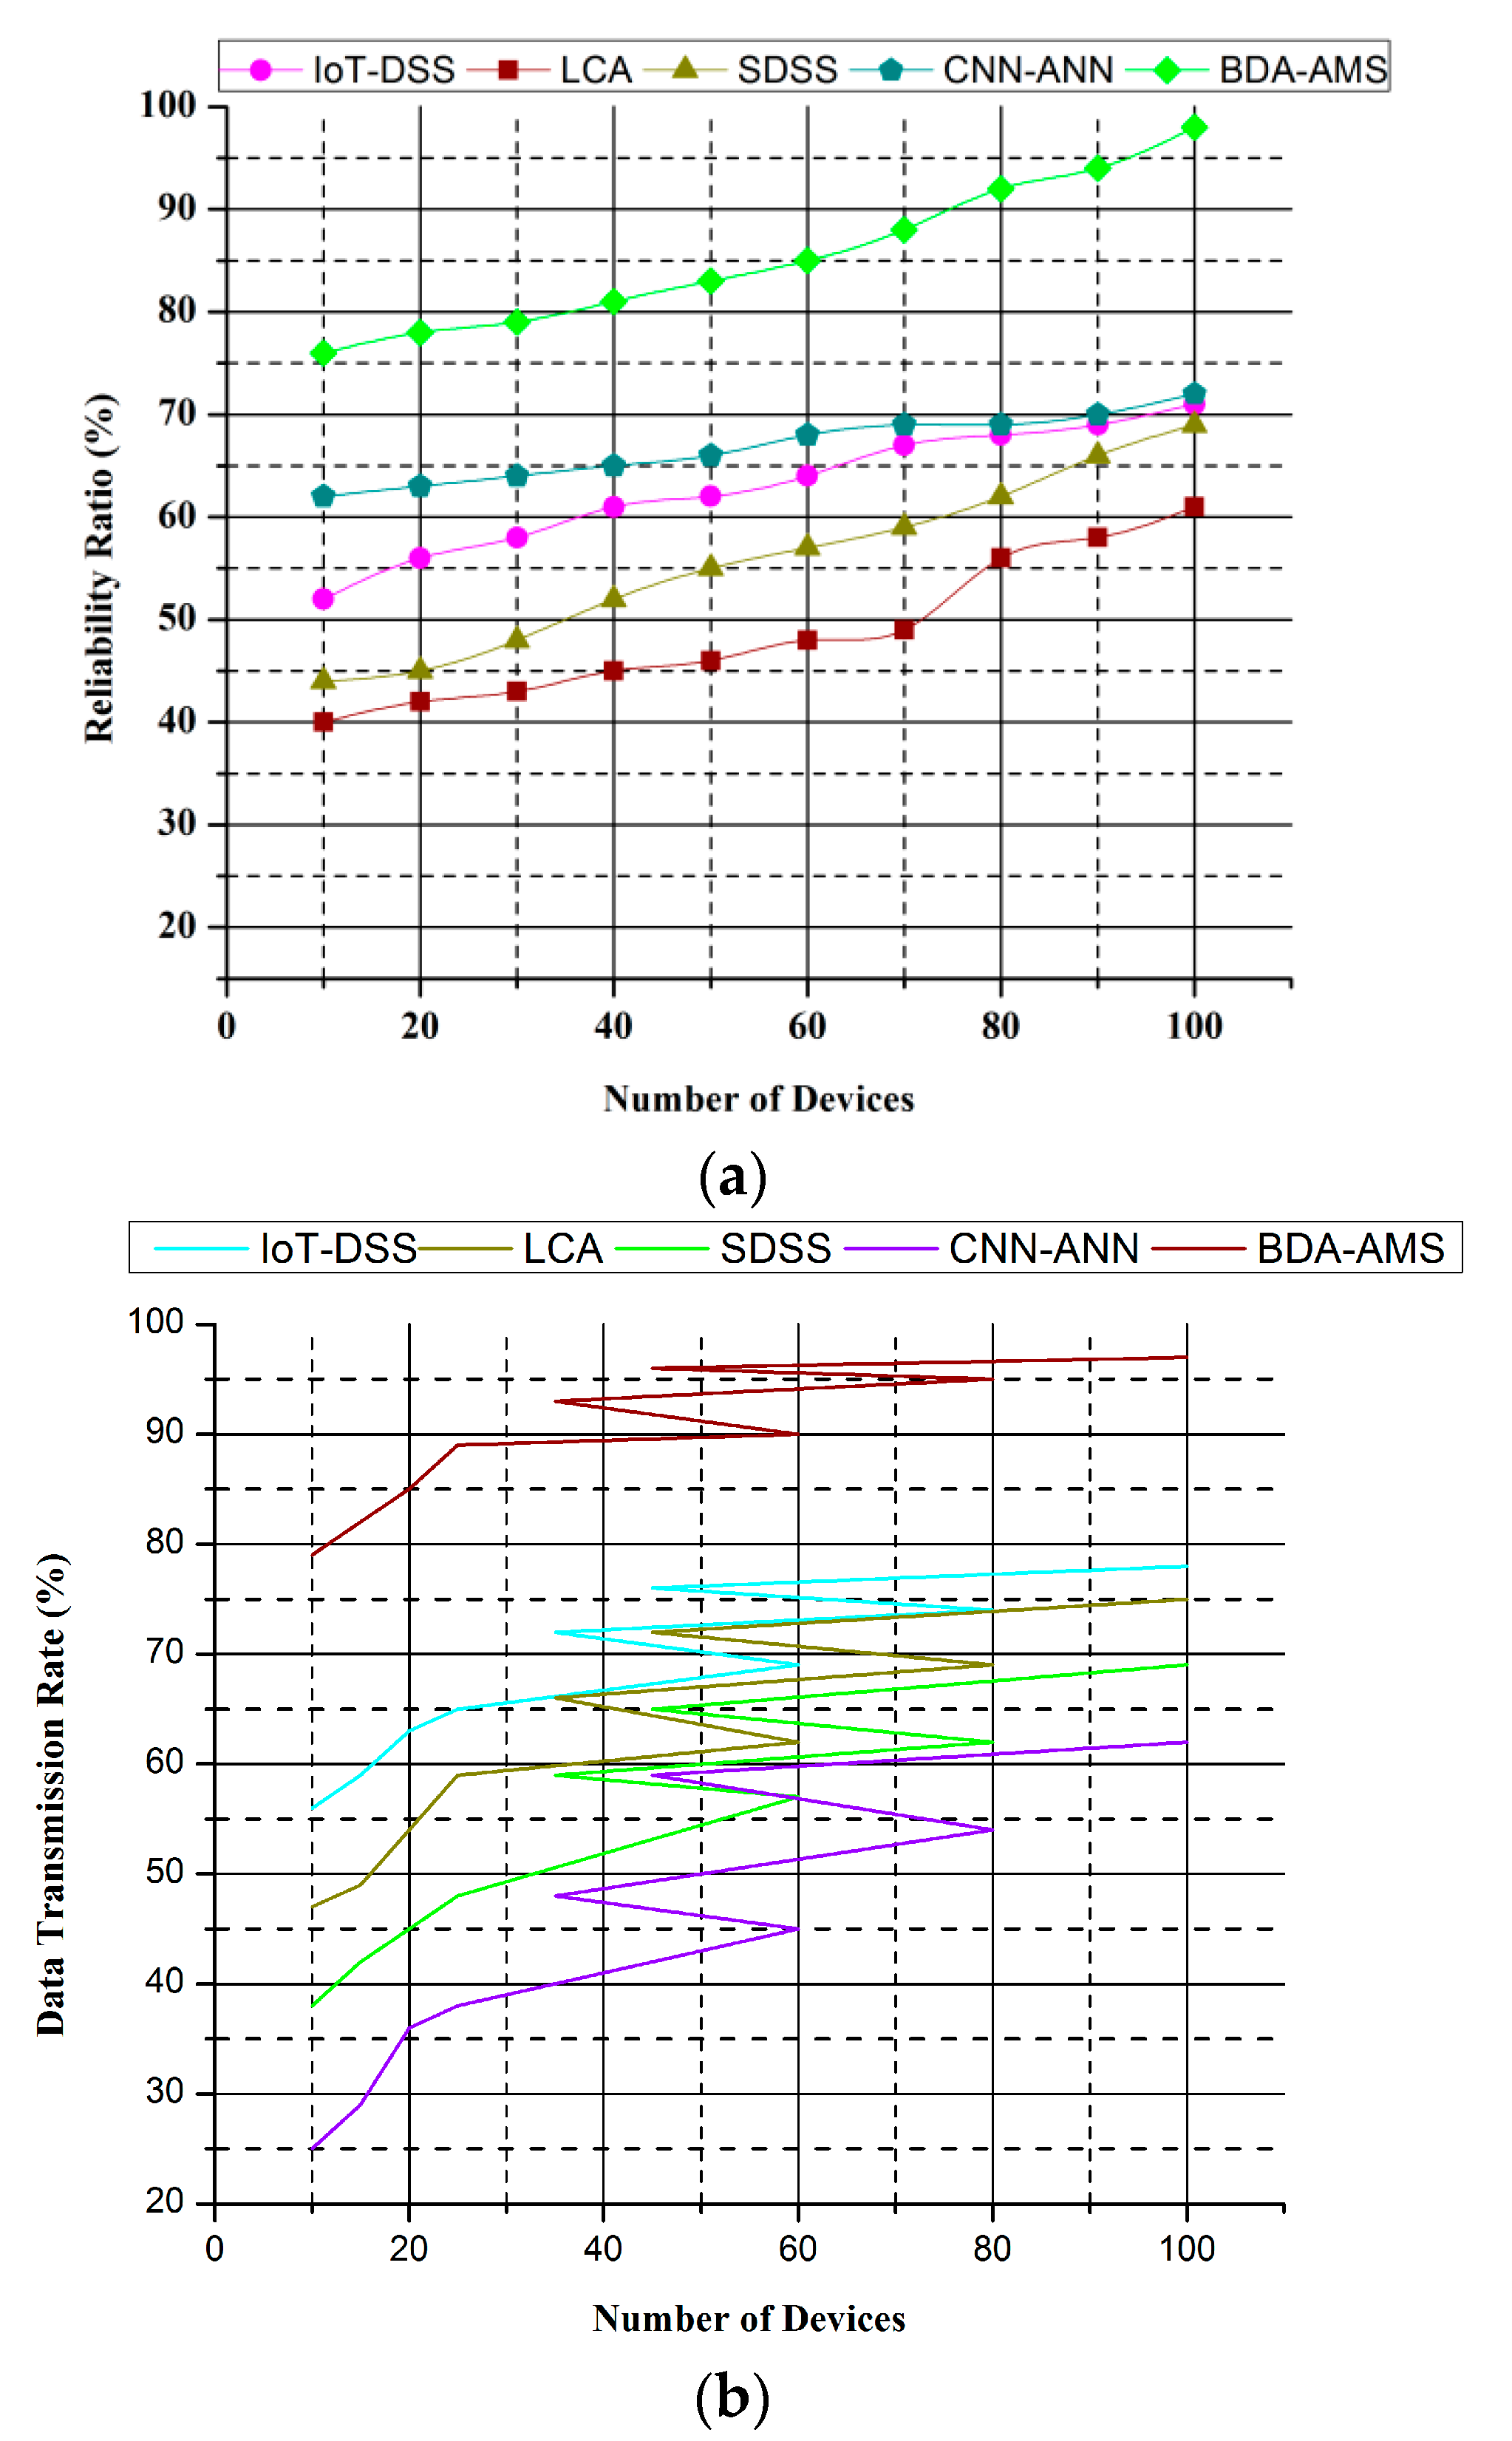
3.2. Data Transmission Rate (%) and Reliability Ratio (%)

The high volume and the need for an efficient and practical analysis of real-time data for agricultural production have resulted in the creation of new technologies and frameworks to acquire, store, process, interpret, and analyze extensive datasets for decision-making based on future predictions to improve economic management. On small farms, precision agriculture is appropriate, and it protects various GPS and GIS sensors in a specific cultivable area for up to several hundred meters. In terms of the environment for manufacturing plants, these systems handle datasets that include satellite imagery, sensors, and weather data, and propose a collection of techniques based on the user’s specification, type of data, and processing requirements, including characteristics to consider for the efficient processing of agricultural information. Figure 10 explores the data transmission rate (%) and the reliability ratio (%).
This paper proposes a profile-based approach for managing farm data in a cloud architecture. Smart agriculture provides enormous amounts of agricultural data and information, improving economic management for farms in modern agriculture systems. Methodologies and implications have been created as appropriate to reduce harmful effects and to improve the process’ reliability and accuracy. The sensor node has been shown to operate reliably in the field and to collect information from over 100 hectares, and the device has a revolving radius of 3 m. A data processing interface would later replace this device. The data design should be analyzed with a simple case A/D processor to increase the reliability.

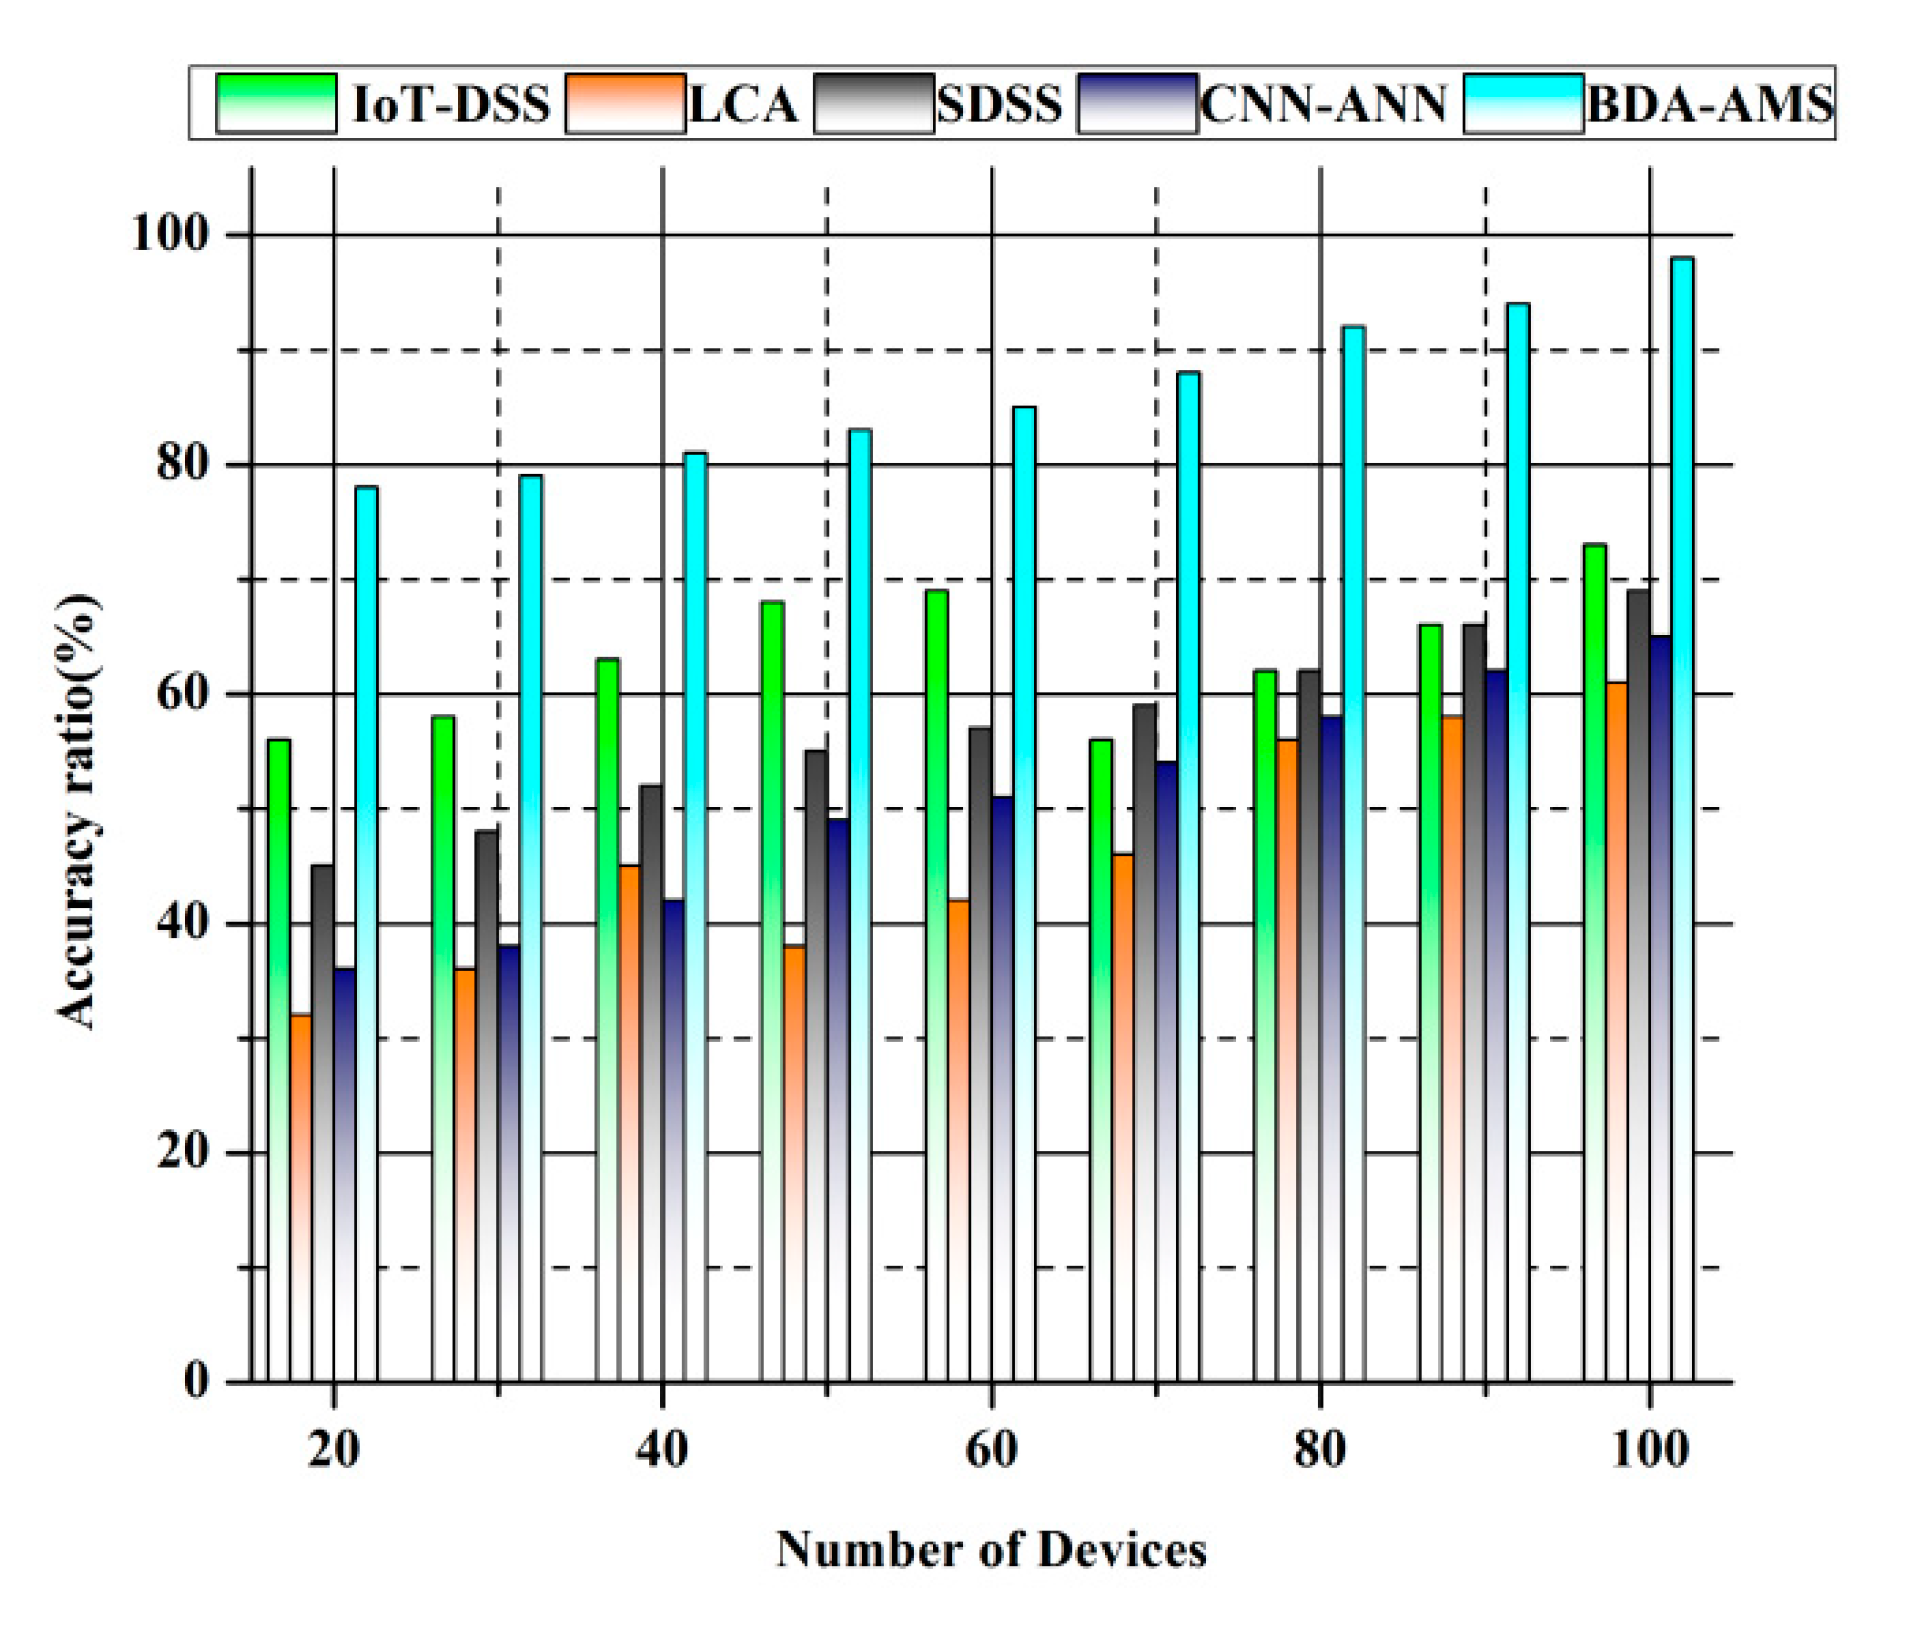
3.3. Accuracy Ratio (%)

Through monitoring in real time, smart agriculture reduces power and time expenses and accurately estimates the water needed for irrigation, solving traditional farming disadvantages based on economic management. The approach uses ontology to concentrate on stability and system adaptability by integrating the machine learning algorithms used by analyzing logged datasets to accurately identify critical thresholds for plant-based parameters and to derive new information and expand system ontology. A WSN can accomplish this objective by acquiring approximate values from the available data and rendering accurate values. To consider the optimum agreement between the calculated data accuracy, the estimated energy to perform the task, and the price, elements must be chosen, thus prioritizing sensor use. The accuracy measurements of sensors on the LCD screen were seen and verified. Finally, before the evaluation, the sensors were configured to guarantee data accuracy and to allow users to overcome challenges during the system’s calculation process. Figure 11 shows the accuracy ratio (%).

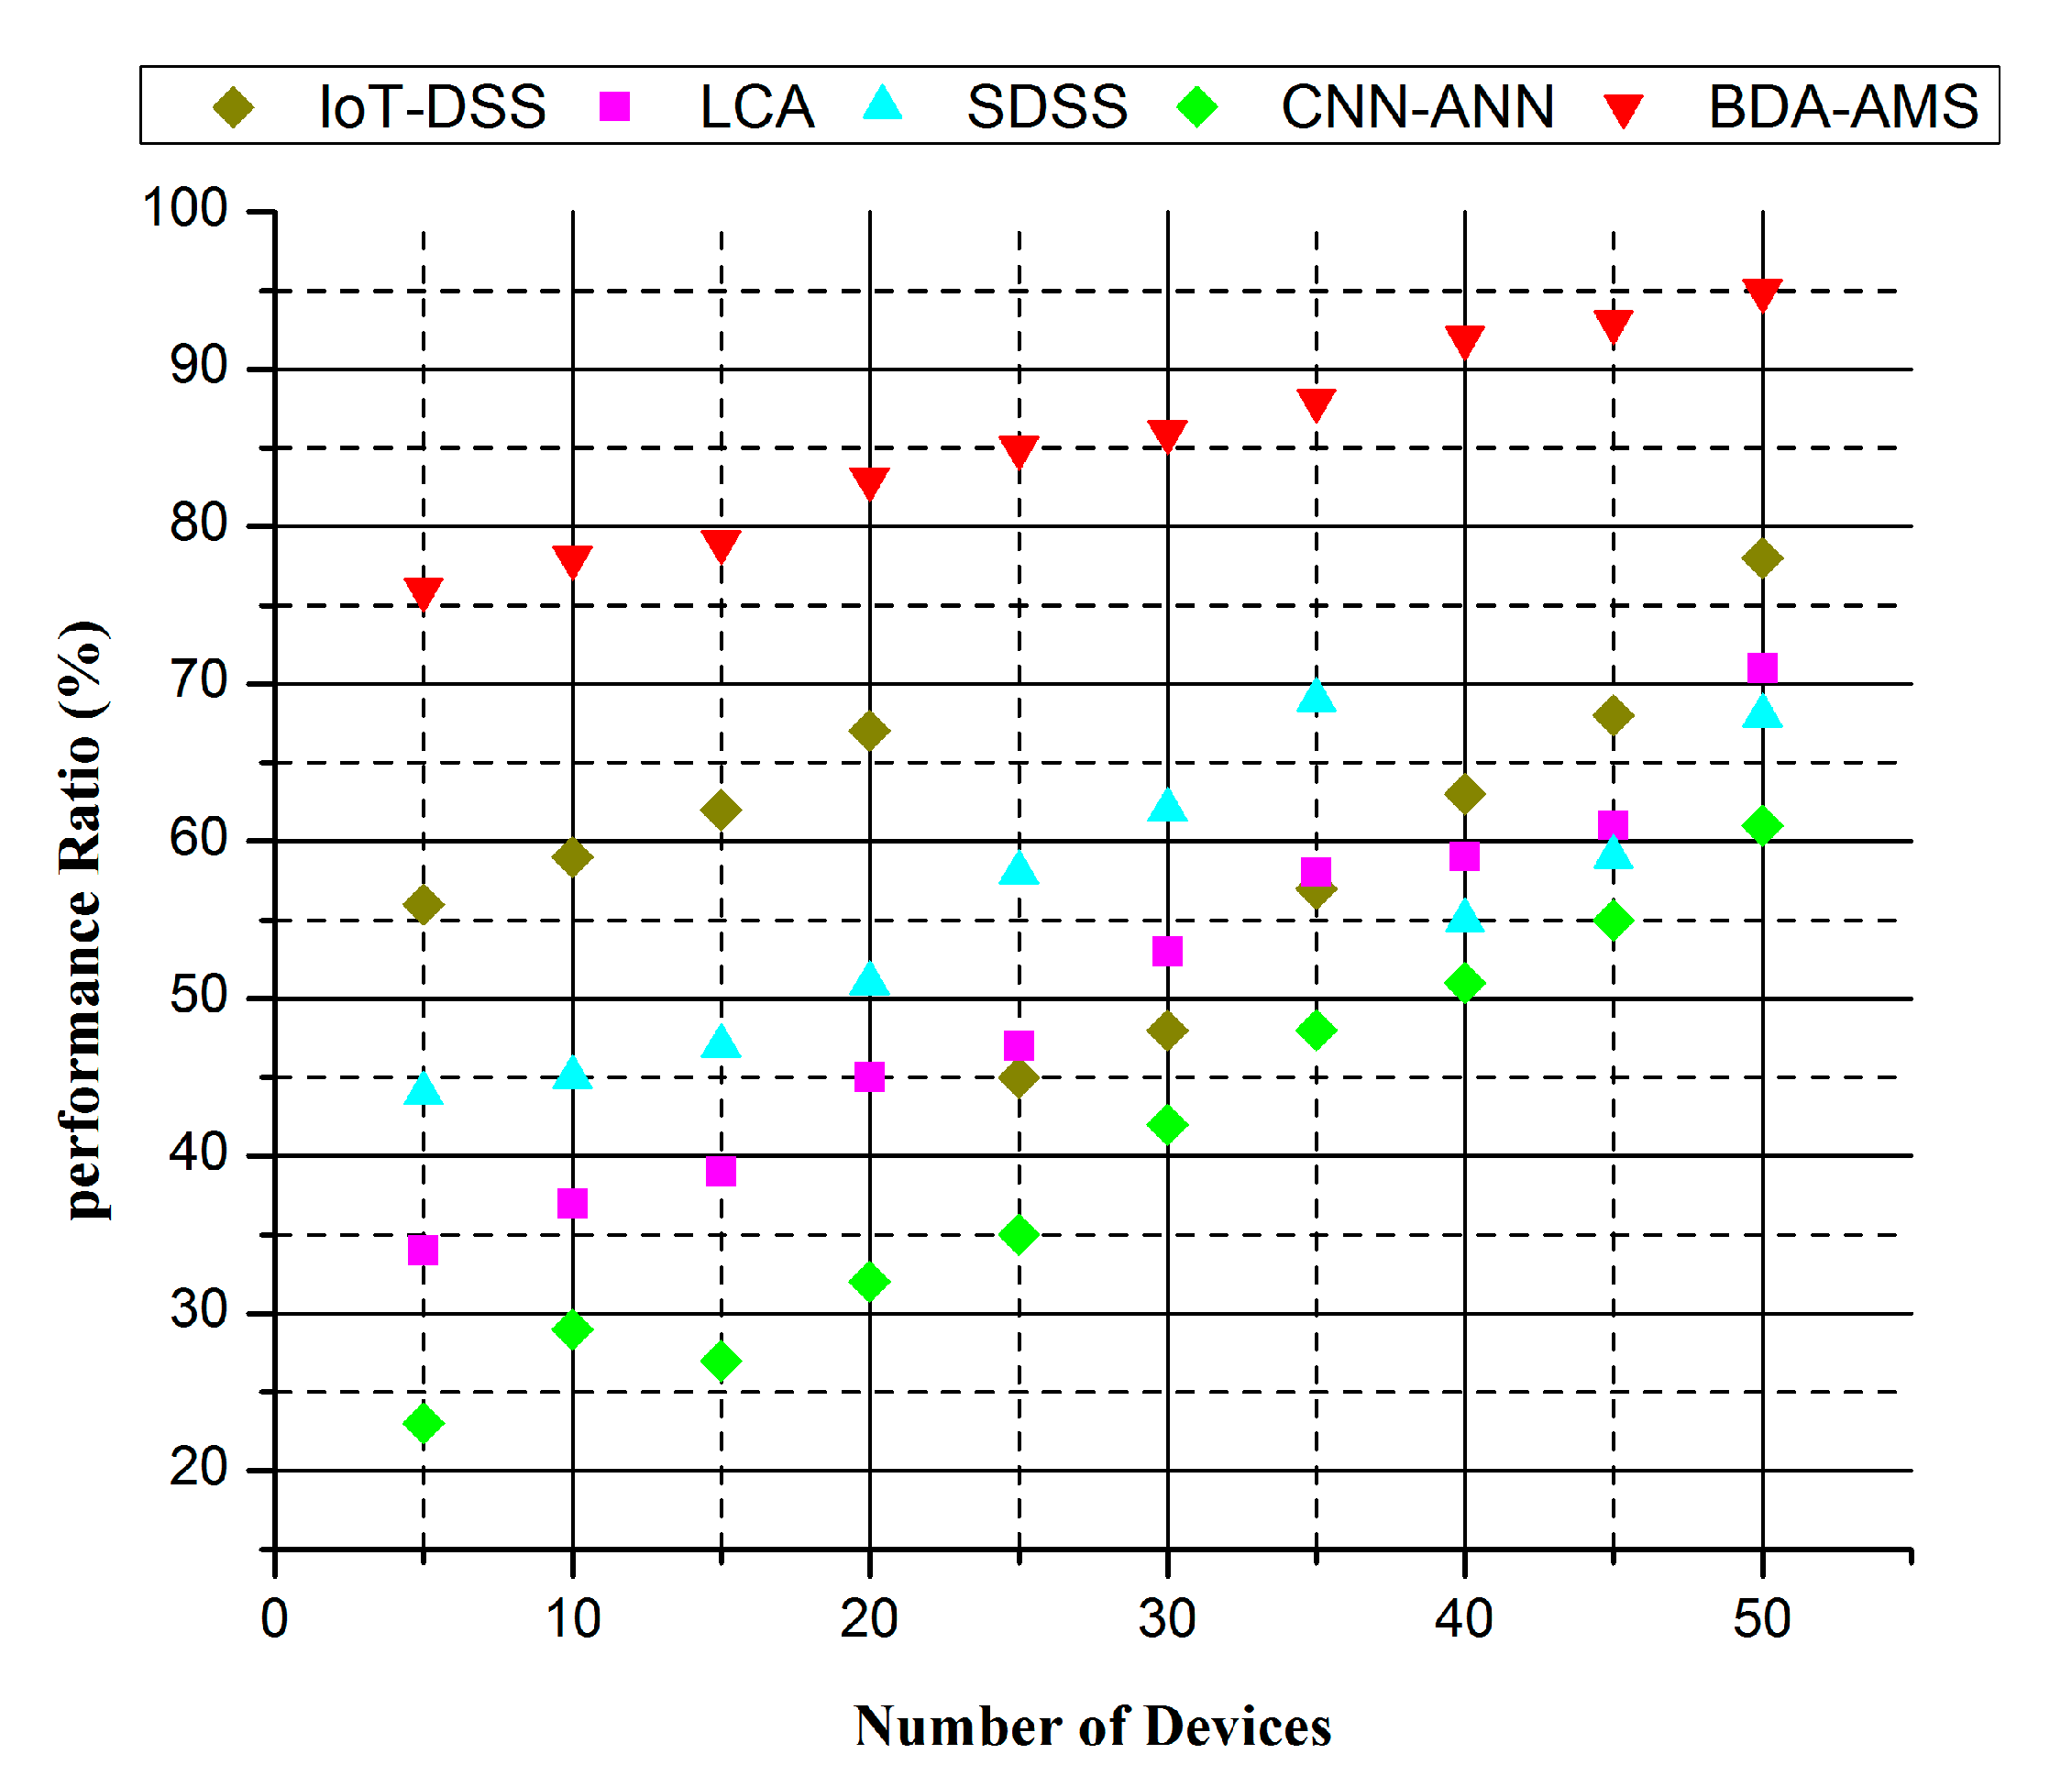
3.4. Performance Ratio (%)

To develop and improve economic management, the measurements need to be evaluated with the standard system goal, quantitative and efficiency results, lead time aspects, and signal variations, and the appropriate approach for extracting signal distractions and for designing and managing the action selected to correct the performance of agricultural processes needs to be determined. This implies that critical performance and result measurements can be quickly evaluated upon access to update data sources for the successful planning and management of the economy. Enhanced technology enables a system to learn its performance through interaction with an external environment from the point of view of data processing. The proposed preferred system for analytical data processing and improved technologies are selected for general decision-making problems in agricultural economic management. In this design, the best-performing different data sources were combined with data pre-processing technology to improve the accuracy of the resources, developing an efficient and personalized working environment to increase agricultural production. Figure 12 explores the performance ratio (%).

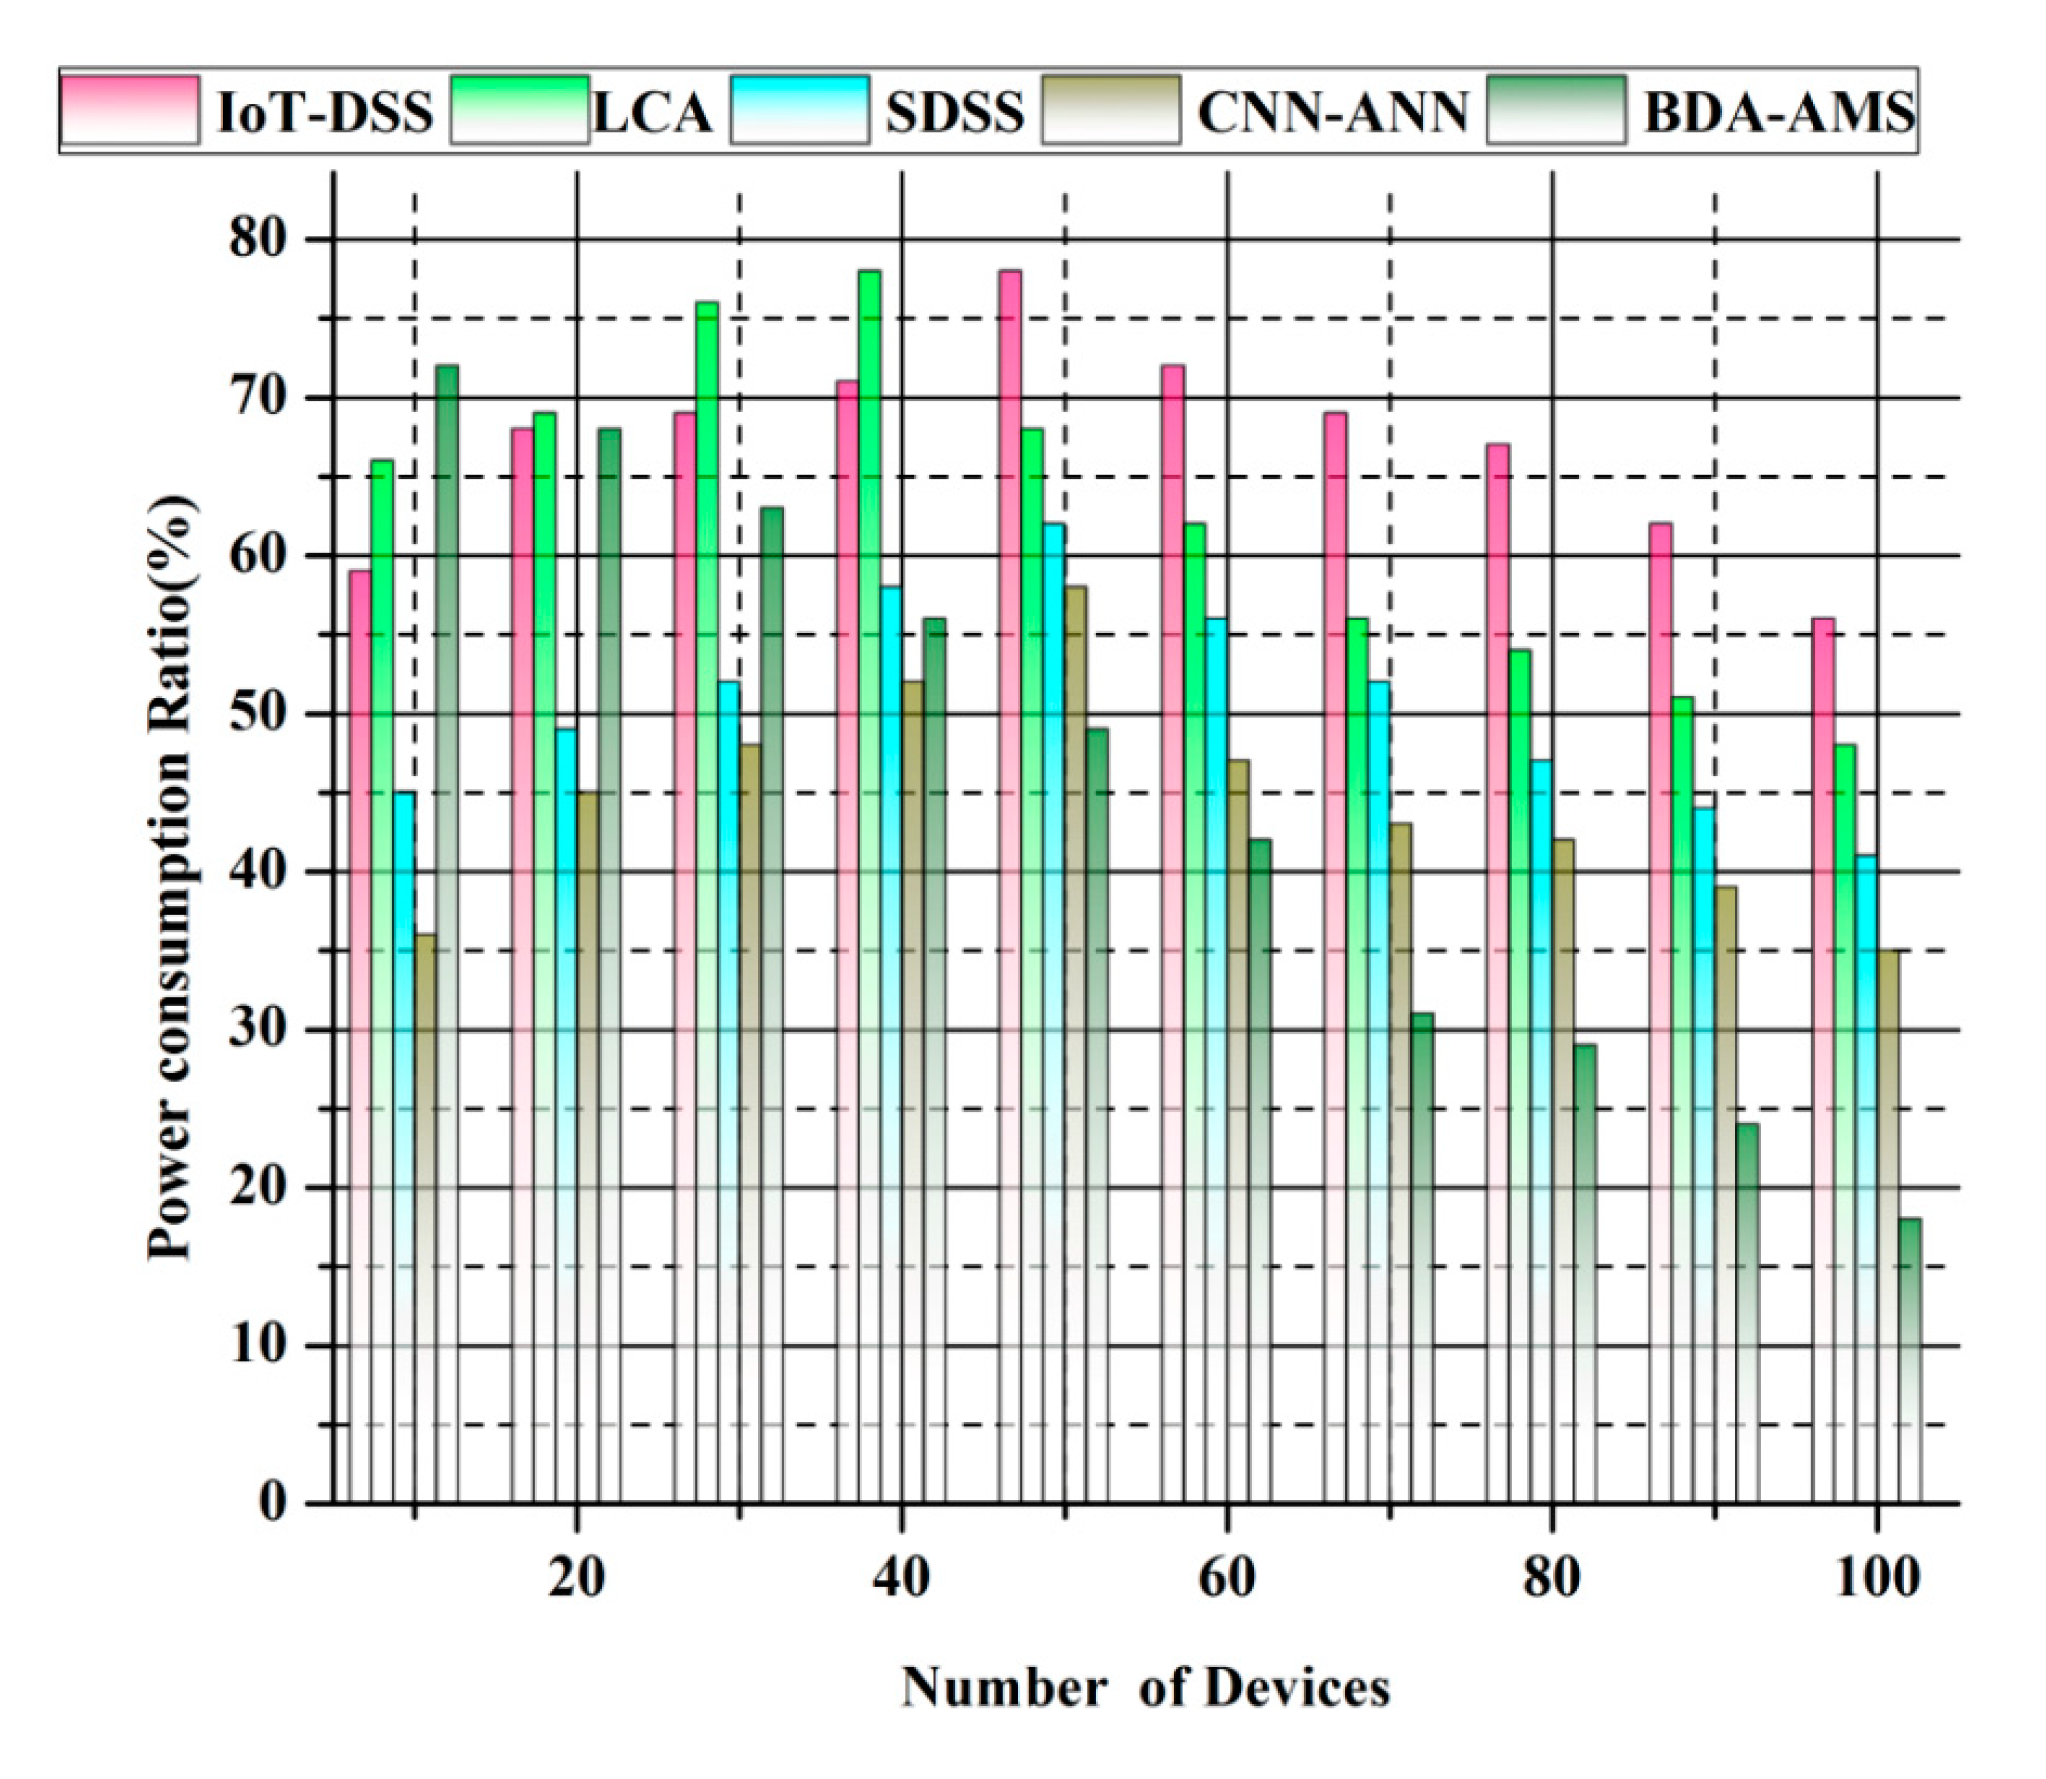
3.5. Power Consumption Ratio (%)

Source node data dissemination allows the operating parameters for nodes such as power transmission, sample frequency, service ratio, and period duration to be monitored. Deep usage is a mighty challenge, because as that premium period mechanism is implemented at a node, power consumption is not optimal. The proposed system introduces time monitoring with low power consumption. This program identifies the nodes with a higher and lower packet loss ratio to transmit the sync code. Finally, with good time precision, the program implements low power consumption, allowing modern agriculture to enhance the economy. An effective management method uses the power of plant photosynthesis to power down by reducing the process to develop land quality, crop resistance, and nutrient density. Figure 13 shows the power consumption ratio (%).

3.6. Weather Forecasting Ratio (%)

The weather forecast affects the success of a farmer’s decisions, and forecasts can help us to make confident choices every day. These choices include crop irrigation, implantation time, and days appropriate for fieldwork, and farmers’ decisions can lead to viable crops or failures. In agriculture, the climate is the most influential factor, and no crop model can be created without considering the atmosphere. Various weather forecasts evaluate agriculture and predict yield, disaster management, and various other fields. In weather forecasting, different machine learning algorithms, including support vector machines and soft computing methods, have been used for all the above reasons. Table 2 shows the weather forecasting ratio (%).

3.7. Production Density (%)

The effects of climate change on crop production have been proposed, and an enforced facts system for agriculture is essential for sustainable development. The production density determines the accessible amount of product used to encourage increased food safety and crop production and creates a wealth of alternative crop options. There are multiple advantages of the nutritious food advice from big data for the end-users of the method, and various analyses are precious for nutritionally based vegetable production and delivery systems that are completely dependent on economic management. Plant input and crop values have made it necessary for farmers to use the information and to make difficult choices regarding agriculture for the existing crop, soil, and environmental data. The analysis of the new production data shows optimized production and farming that is more vulnerable to climate change. Table 3 shows the production density ratio (%).
The BDA-AMS ensures high-precision crop yield predictions using a deep learning algorithm to achieve the following parameters: a precision ratio, high accuracy, a better performance ratio, an improved data transmission rate, a reduced power consumption ratio, an enhanced weather forecasting ratio, and an improved production density ratio and mean absolute ratio, when compared to the initialized IoT and big data-based decision support (IoT-DSS), lifecycle analysis (LCA), smart data-based decision support (SDSS), and convolutional neural network (CNN) and artificial neural network (ANN) methods.

4. Conclusions and Future Work

Predictive analyses can be utilized for making smart agricultural decisions by gathering data on temperature, soil and air quality, crop growth, equipment, labor costs, and availability in real-time. This is called precision agriculture. Big data can play an essential role in managing the real-time data collection of massive streaming data in precision agriculture. With the growing demands for the scale of big data, data analysis reliability and performance are challenges. Farmers must move away from traditional agricultural methods to precision agriculture to improve farm productivity and to maintain healthier food supplies. Precision agriculture operates in collaboration with information technologies to improve agricultural techniques. This paper proposed BDA-AMS to ensure high-precision predictions for crop yield to improve the economic management of China by utilizing a deep learning algorithm. The neural network gathers raw images from UAVs and predicts crop yield at an early point. Thus, the experimental results show that the proposed BDA-AMS is able to predict crop yield, reduce labor, and improve agriculture monitoring systems. The convolutional neural network gathers the raw images from the UAVs and performs early predictions of crop yield to achieve the following parameters: a high parameter precision ratio (98.8%), high accuracy (98.9%), a better performance ratio (95.5%), an improved data transmission rate (97.8%), a reduced power consumption ratio (18.8%), and an enhanced weather forecasting ratio (94.8%), production density ratio (98.8%), mean absolute percentage ratio (96.2%), and reliability ratio (98.6%), when compared to other methods.

Author Contributions

C.S. and W.M. designed and wrote the paper. C.S. and B.L. supervised the writing of the paper. B.Q. and W.M. collected and collated materials and conducted field data collection. C.S. was responsible for the conception and design of the manuscript. B.L. and J.L. provided financial support. All authors have read and agreed to the published version of the manuscript.

Funding

This research was funded by the Hebei Social Science Foundation project “Research on the implementation of policies to curb agricultural land conversion in the development of new agriculture in Hebei Province” (Grant No. HB19Gl015), and by the Hebei Provincial Department of Education Science research project of Humanities and Social Sciences “Research on the promotion path of industrial chain of Hebei coastal counties (districts and cities) from the perspective of coordinated development of Beijing, Tianjin and Hebei” (Grant No. ZD202104).

Data Availability Statement

The data used to support the findings of this study are available from the corresponding author upon request.

Conflicts of Interest

We declare that we do not have any commercial or associative interests that represent any conflicts of interest in connection with the work submitted.

References

  1. Mekonnen, Y.; Namuduri, S.; Burton, L.; Sarwat, A.; Bhansali, S. Machine learning techniques in wireless sensor network-based precision agriculture. J. Electrochem. Soc. 2019, 167, 037522. [Google Scholar] [CrossRef]
  2. Sankar, S.; Srinivasan, P.; Luhach, A.K.; Somula, R.; Chilamkurti, N. Energy-aware grid-based data aggregation scheme in routing Protocol for agricultural internet of things. Sustain. Comput. Inform. Syst. 2020, 28, 100422. [Google Scholar] [CrossRef]
  3. Nie, X.; Fan, T.; Wang, B.; Li, Z.; Shankar, A.; Manickam, A. Big data analytics and IoT in operation safety management in underwater management. Comput. Commun. 2020, 154, 188–196. [Google Scholar] [CrossRef]
  4. Tantalaki, N.; Souravlas, S.; Roumeliotis, M. Data-driven decision making in precision agriculture: The rise of big data in agricultural systems. J. Agric. Food Inf. 2019, 20, 344–380. [Google Scholar] [CrossRef]
  5. Varatharajan, R.; Manogaran, G.; Priyan, M.K. A big data classification approach using LDA with an enhanced SVM method for ECG signals in cloud computing. Multimed. Tools Appl. 2018, 77, 10195–10215. [Google Scholar] [CrossRef]
  6. Elhoseny, M.; Abdelaziz, A.; Salama, A.S.; Riad, A.M.; Muhammad, K.; Sangaiah, A.K. A hybrid model of the internet of things and cloud computing manages big data in health services applications. Future Gener. Comput. Syst. 2018, 86, 1383–1394. [Google Scholar] [CrossRef]
  7. Manogaran, G.; Vijayakumar, V.; Varatharajan, R.; Kumar, P.M.; Sundarasekar, R.; Hsu, C.H. Machine learning-based big data processing framework for cancer diagnosis using a hidden Markov model and GM clustering. Wirel. Pers. Commun. 2018, 102, 2099–2116. [Google Scholar] [CrossRef]
  8. Reddy Maddikunta, P.K.; Hakak, S.; Alazab, M.; Bhattacharya, S.; Reddy Gadekallu, T.; Zada Khan, W.; Pham, Q.V. Uncrewed Aerial Vehicles in Smart Agriculture: Applications, Requirements, and Challenges. IEEE Sens. J. 2021, 21, 17608–17619. [Google Scholar] [CrossRef]
  9. Perakis, K.; Lampathaki, F.; Nikas, K.; Georgiou, Y.; Marko, O.; Maselyne, J. CYBELE–Fostering precision agriculture livestock farming through secure access to large-scale HPC-enabled virtual industrial experimentation environments fostering scalable big data analytics. Comput. Netw. 2020, 168, 107035. [Google Scholar] [CrossRef]
  10. Manogaran, G.; Hsu, C.H.; Rawal, B.S.; Muthu, B.A.; Mavromoustakis, C.X.; Mastorakis, G. ISOF: Information Scheduling and Optimization Framework for Improving the Performance of Agriculture Systems Aided by Industry 4.0. IEEE Internet Things J. 2020, 8, 3120–3129. [Google Scholar] [CrossRef]
  11. Anbarasan, M.; Muthu, B.; Sivaparthipan, C.B.; Sundarasekar, R.; Kadry, S.; Krishnamoorthy, S.; Dasel, A.A. Detection of flood disaster system based on IoT, big data, and convolutional deep neural network. Comput. Commun. 2020, 150, 150–157. [Google Scholar] [CrossRef]
  12. Chen, J.; Ramanathan, L.; Alazab, M. Holistic, big data integrated artificial intelligent modeling to improve privacy and security in smart cities’ data management. Microprocess. Microsyst. 2021, 81, 103722. [Google Scholar] [CrossRef]
  13. Peters, E.; Kliestik, T.; Musa, H.; Durana, P. Product decision-making information systems, real-time big data analytics, and deep learning-enabled smart process planning in sustainable industry 4.0. J. Self-Gov. Manag. Econ. 2020, 8, 16–22. [Google Scholar]
  14. Kuch, D.; Kearnes, M.; Gulson, K. The promise of precision: Datafication in medicine, agriculture, and education. Policy Stud. 2020, 41, 527–546. [Google Scholar] [CrossRef]
  15. Alazab, M.; Hong, S.H.; Ng, J. Louder bark with no bite: Privacy protection through the regulation of mandatory data breach notification in Australia. Future Gener. Comput. Syst. 2021, 116, 22–29. [Google Scholar] [CrossRef]
  16. Kumar, N. Call for Special Issue Papers: Internet of Things Data Visualization for Business Intelligence: Deadline for Manuscript Submission: September 12, 2020. Big Data 2020, 8, 249–250. [Google Scholar] [CrossRef]
  17. Jindal, A.; Kumar, N.; Singh, M. A unified framework for big data acquisition, storage, and analytics for demand response management in smart cities. Future Gener. Comput. Syst. 2020, 108, 921–934. [Google Scholar] [CrossRef]
  18. Garg, S.; Singh, A.; Kaur, K.; Aujla, G.S.; Batra, S.; Kumar, N.; Obaidat, M.S. Edge computing-based security framework for big data analytics in VANETs. IEEE Netw. 2019, 33, 72–81. [Google Scholar] [CrossRef]
  19. Niu, H.; Hollenbeck, D.; Zhao, T.; Wang, D.; Chen, Y. Evapotranspiration Estimation with Small UAVs in Precision Agriculture. Sensors 2020, 20, 6427. [Google Scholar] [CrossRef]
  20. Guillén, M.A.; Llanes, A.; Imbernón, B.; Martínez-España, R.; Bueno-Crespo, A.; Cano, J.C.; Cecilia, J.M. Performance evaluation of edge-computing platforms for the prediction of low temperatures in agriculture using deep learning. J. Supercomput. 2021, 77, 818–840. [Google Scholar] [CrossRef]
  21. Balfe, É.L.; Jorge, L.A.D.C.; Sanches, I.D.A.; Luchiari Júnior, A.; da Costa, C.C.; Victoria, D.D.C.; Ramirez, A.R. Precision and Digital Agriculture: Adoption of Technologies and Perception of Brazilian Farmers. Agriculture 2020, 10, 653. [Google Scholar] [CrossRef]
  22. Afzaal, H.; Farooque, A.A.; Abbas, F.; Acharya, B.; Esau, T. Computation of evapotranspiration with artificial intelligence for precision water resource management. Appl. Sci. 2020, 10, 1621. [Google Scholar] [CrossRef] [Green Version]
  23. Popescu, D.; Stoican, F.; Stamatescu, G.; Ichim, L.; Dragana, C. Advanced UAV–WSN system for intelligent monitoring in precision agriculture. Sensors 2020, 20, 817. [Google Scholar] [CrossRef] [Green Version]
  24. Escamilla-Garcia, A.; Soto-Zarazúa, G.M.; Toledano-Ayala, M.; Rivas-Araiza, E.; Gastélum-Barrios, A. Applications of Artificial Neural Networks in Greenhouse Technology and Overview for Smart Agriculture Development. Appl. Sci. 2020, 10, 3835. [Google Scholar] [CrossRef]
  25. Ma, L.; Long, H.; Zhang, Y.; Tu, S.; Ge, D.; Tu, X. Agricultural labor changes and agricultural economic development in China and their implications for rural vitalization. J. Geogr. Sci. 2019, 29, 163–179. [Google Scholar] [CrossRef] [Green Version]
  26. Liang, L.; Wang, Y.; Ridoutt, B.G.; Lal, R.; Wang, D.; Wu, W.; Zhao, G. Agricultural subsidies assessment of cropping system from environmental and economic perspectives in North China based on LCA. Ecol. Indic. 2019, 96, 351–360. [Google Scholar] [CrossRef]
  27. Li, W.; Clark, B.; Taylor, J.A.; Kendall, H.; Jones, G.; Li, Z.; Frewer, L.J. A hybrid modeling approach to understanding adoption of precision agriculture technologies in Chinese cropping systems. Comput. Electron. Agric. 2020, 172, 105305. [Google Scholar] [CrossRef]
  28. Sieverding, H.; Kebreab, E.; Johnson, J.M.; Xu, H.; Wang, M.; Grosso, S.J.D.; Stone, J.J. A life cycle analysis (LCA) primer for the agricultural community. Agron. J. 2020, 112, 3788–3807. [Google Scholar] [CrossRef]
  29. Mohapatra, A.G.; Lenka, S.K.; Keswani, B. Neural network and fuzzy logic-based smart DSS model for irrigation notification and control in precision agriculture. Proc. Natl. Acad. Sci. India Sect. A Phys. Sci. 2019, 89, 67–76. [Google Scholar] [CrossRef]
  30. Pham, T.N.; Van Tran, L.; Dao, S.V.T. Early Disease Classification of Mango Leaves Using Feed-Forward Neural Network and Hybrid Metaheuristic Feature Selection. IEEE Access 2020, 8, 189960–189973. [Google Scholar] [CrossRef]
  31. Bhat, S.A.; Huang, N.F. Big Data and AI Revolution in Precision Agriculture: Survey and Challenges. IEEE Access 2021, 9, 110209–110222. [Google Scholar] [CrossRef]
Figure 1. The agricultural monitoring system.
Agronomy 12 02905 g001
Figure 2. Cloud computing-based precision agriculture.
Agronomy 12 02905 g002
Figure 3. Economic management developed from crop production.
Agronomy 12 02905 g003
Figure 4. Agricultural field using sensor nodes and database system.
Agronomy 12 02905 g004
Figure 5. Smart agriculture-based system technologies.
Agronomy 12 02905 g005
Figure 6. Crop yield prediction-based smart agriculture and data storage.
Agronomy 12 02905 g006
Figure 7. Temperature consumption.
Agronomy 12 02905 g007
Figure 8. Low computational cost.
Agronomy 12 02905 g008
Figure 9. (a) Precision ratio (%). (b) Mean absolute ratio (%).
Agronomy 12 02905 g009
Figure 10. (a) Data transmission rate (%). (b) Data reliability ratio (%).
Agronomy 12 02905 g010
Figure 11. Accuracy ratio (%).
Agronomy 12 02905 g011
Figure 12. Performance ratio (%).
Agronomy 12 02905 g012
Figure 13. Power consumption ratio (%).
Agronomy 12 02905 g013
Table 1. Symbols and descriptions.
SymbolDescription
GMeasured resistance
σMolar conductivity
FBTemperature traction
OMolar
NCell-constant
UjValue of the ion charge
eqTranslation factor of temperature
qTemperature
a0a1Regression coefficients
YNumber-dependent variable
Table 2. Weather forecasting ratio (%).
Number of DevicesWeather Forecasting Ratio (%)
IoT-DSSLCASDSSCNN-ANNBDA-AMS
1021.83615.93717.85219.23184.622
2020.40116.76517.72719.34285.711
3019.09414.65717.49419.65986.315
4018.02414.92217.57123.98787.318
5018.88216.34217.79023.56788.724
6017.85212.21218.23423.45990.648
7017.72714.25418.34525.67191.727
8015.97413.08418.67530.22292.922
9015.57116.14518.87933.56793.321
10015.12814.12419.11134.98794.864
Table 3. Production density ratio (%).
Number of DevicesProduction Density (%)
IoT-DSSLCASDSSCNN-ANNBDA-AMS
1031.83665.93777.85284.23191.622
2030.40166.76577.72784.34292.711
3039.09464.65777.49485.65992.315
4038.02464.92278.57186.98793.318
5038.88266.34278.79086.56794.724
6047.85272.21279.23487.45994.648
7047.72774.25480.34588.67195.727
8045.97463.08481.67589.22296.922
9055.57166.14582.87990.56797.321
10055.12864.12483.11190.98798.864
Publisher’s Note: MDPI stays neutral with regard to jurisdictional claims in published maps and institutional affiliations.

