
Characteristics and Impacts of Water–Thermal Variation on Grain Yield in the Henan Province, China, on Multiple Time Scales

Abstract
:1. Introduction
2. Data and Methods
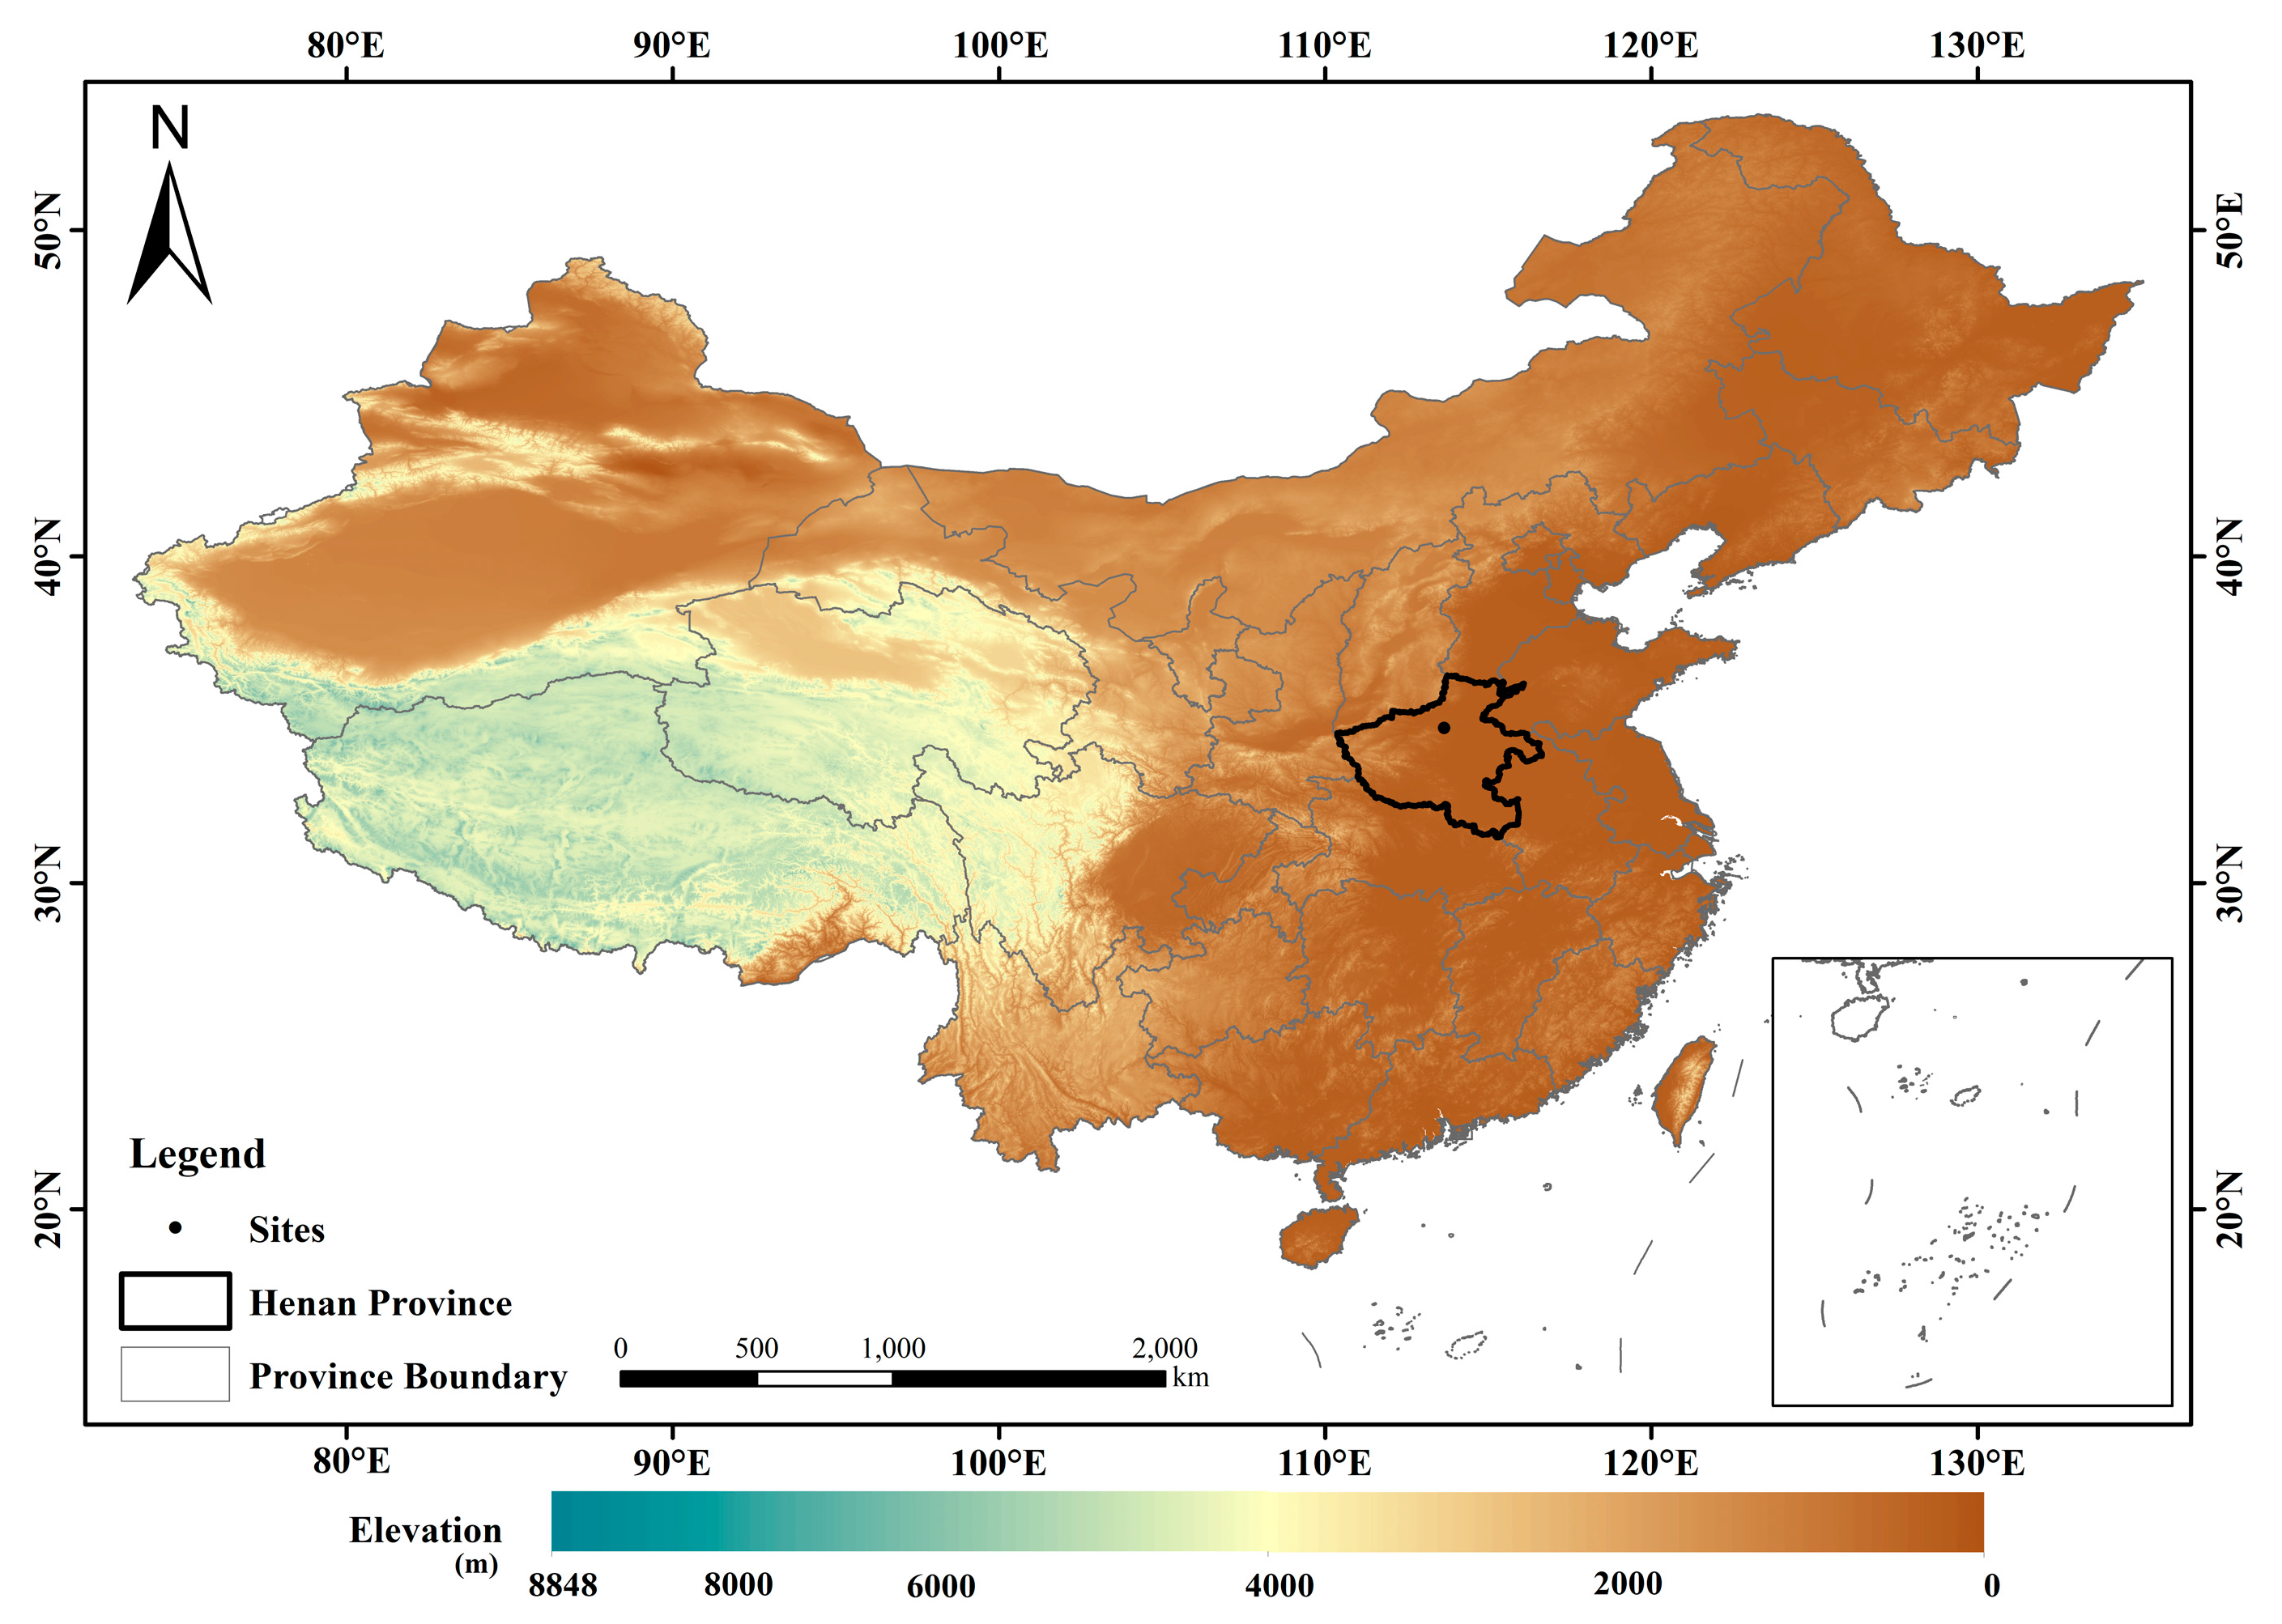
2.1. Study Area
2.2. Data
2.3. Methods
2.3.1. Indicators Used for Water and Thermal Elements
2.3.2. Calculation of Changing Water and Thermal Trends
2.3.3. Wavelet Analysis
2.3.4. Climate Yield
2.3.5. Gray Correlation Analysis
3. Results
3.1. Variation Characteristics of the Accumulated Temperature from 1978–2021
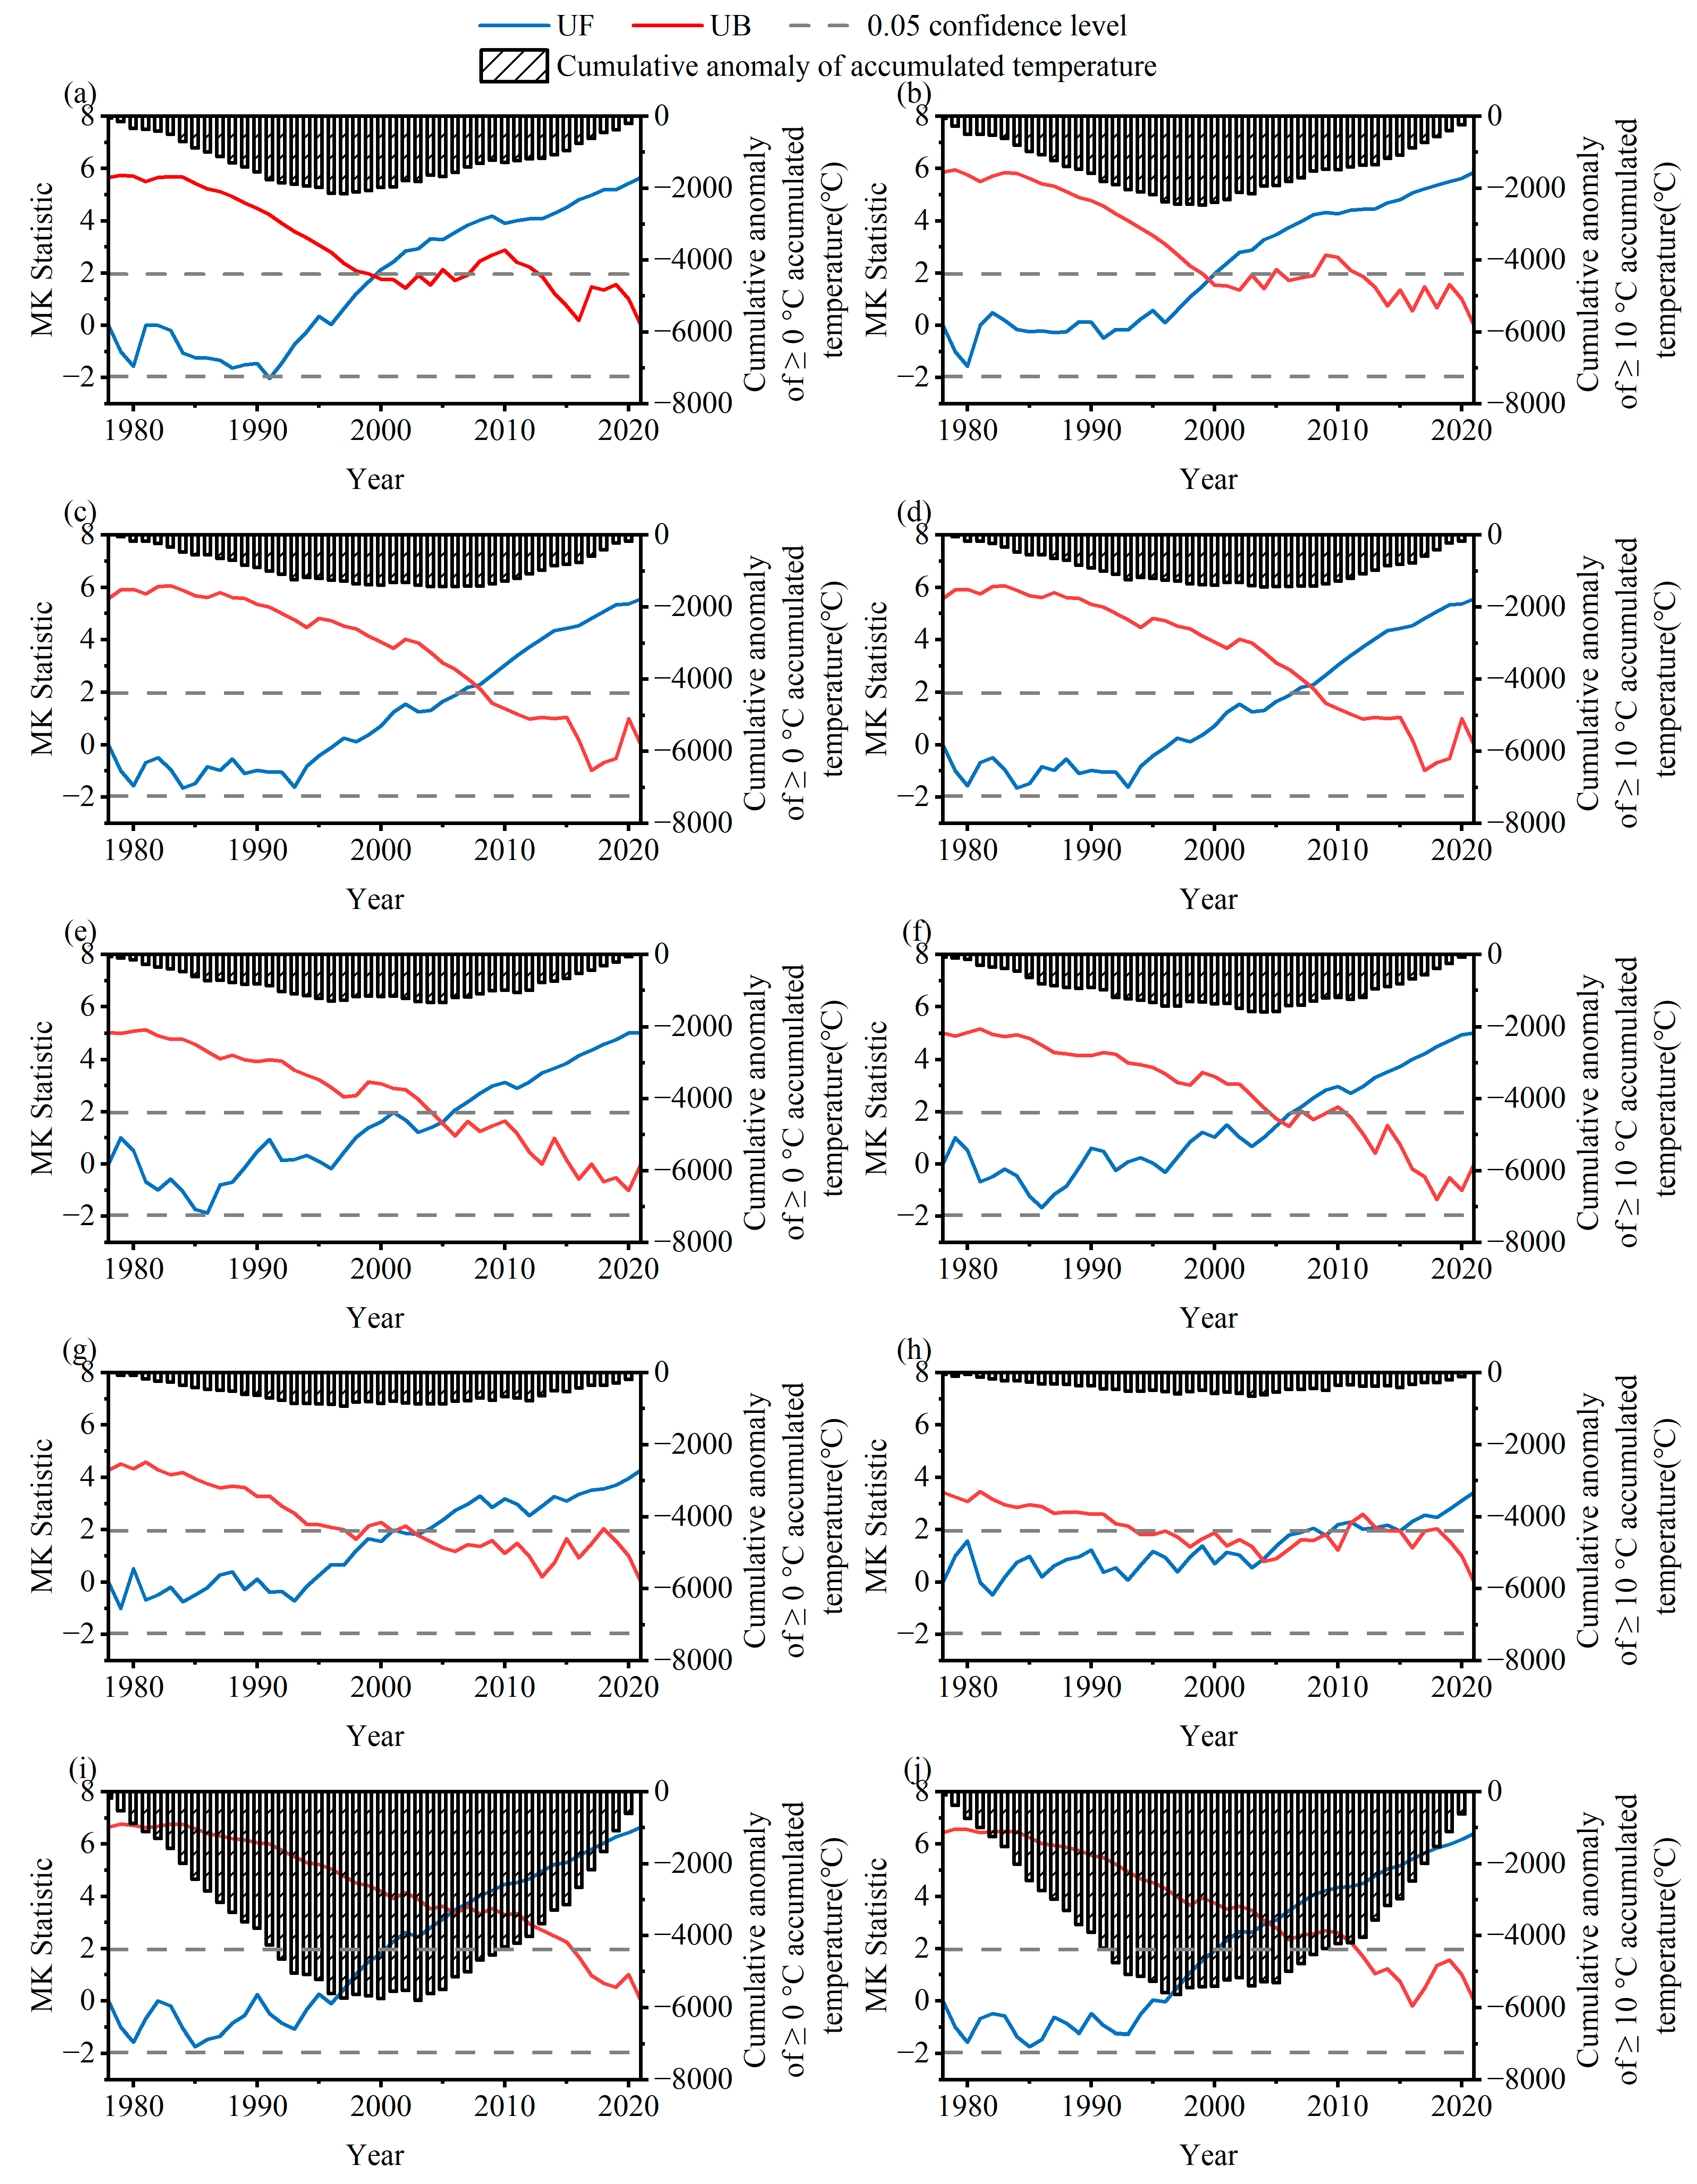
3.1.1. Variation Trends
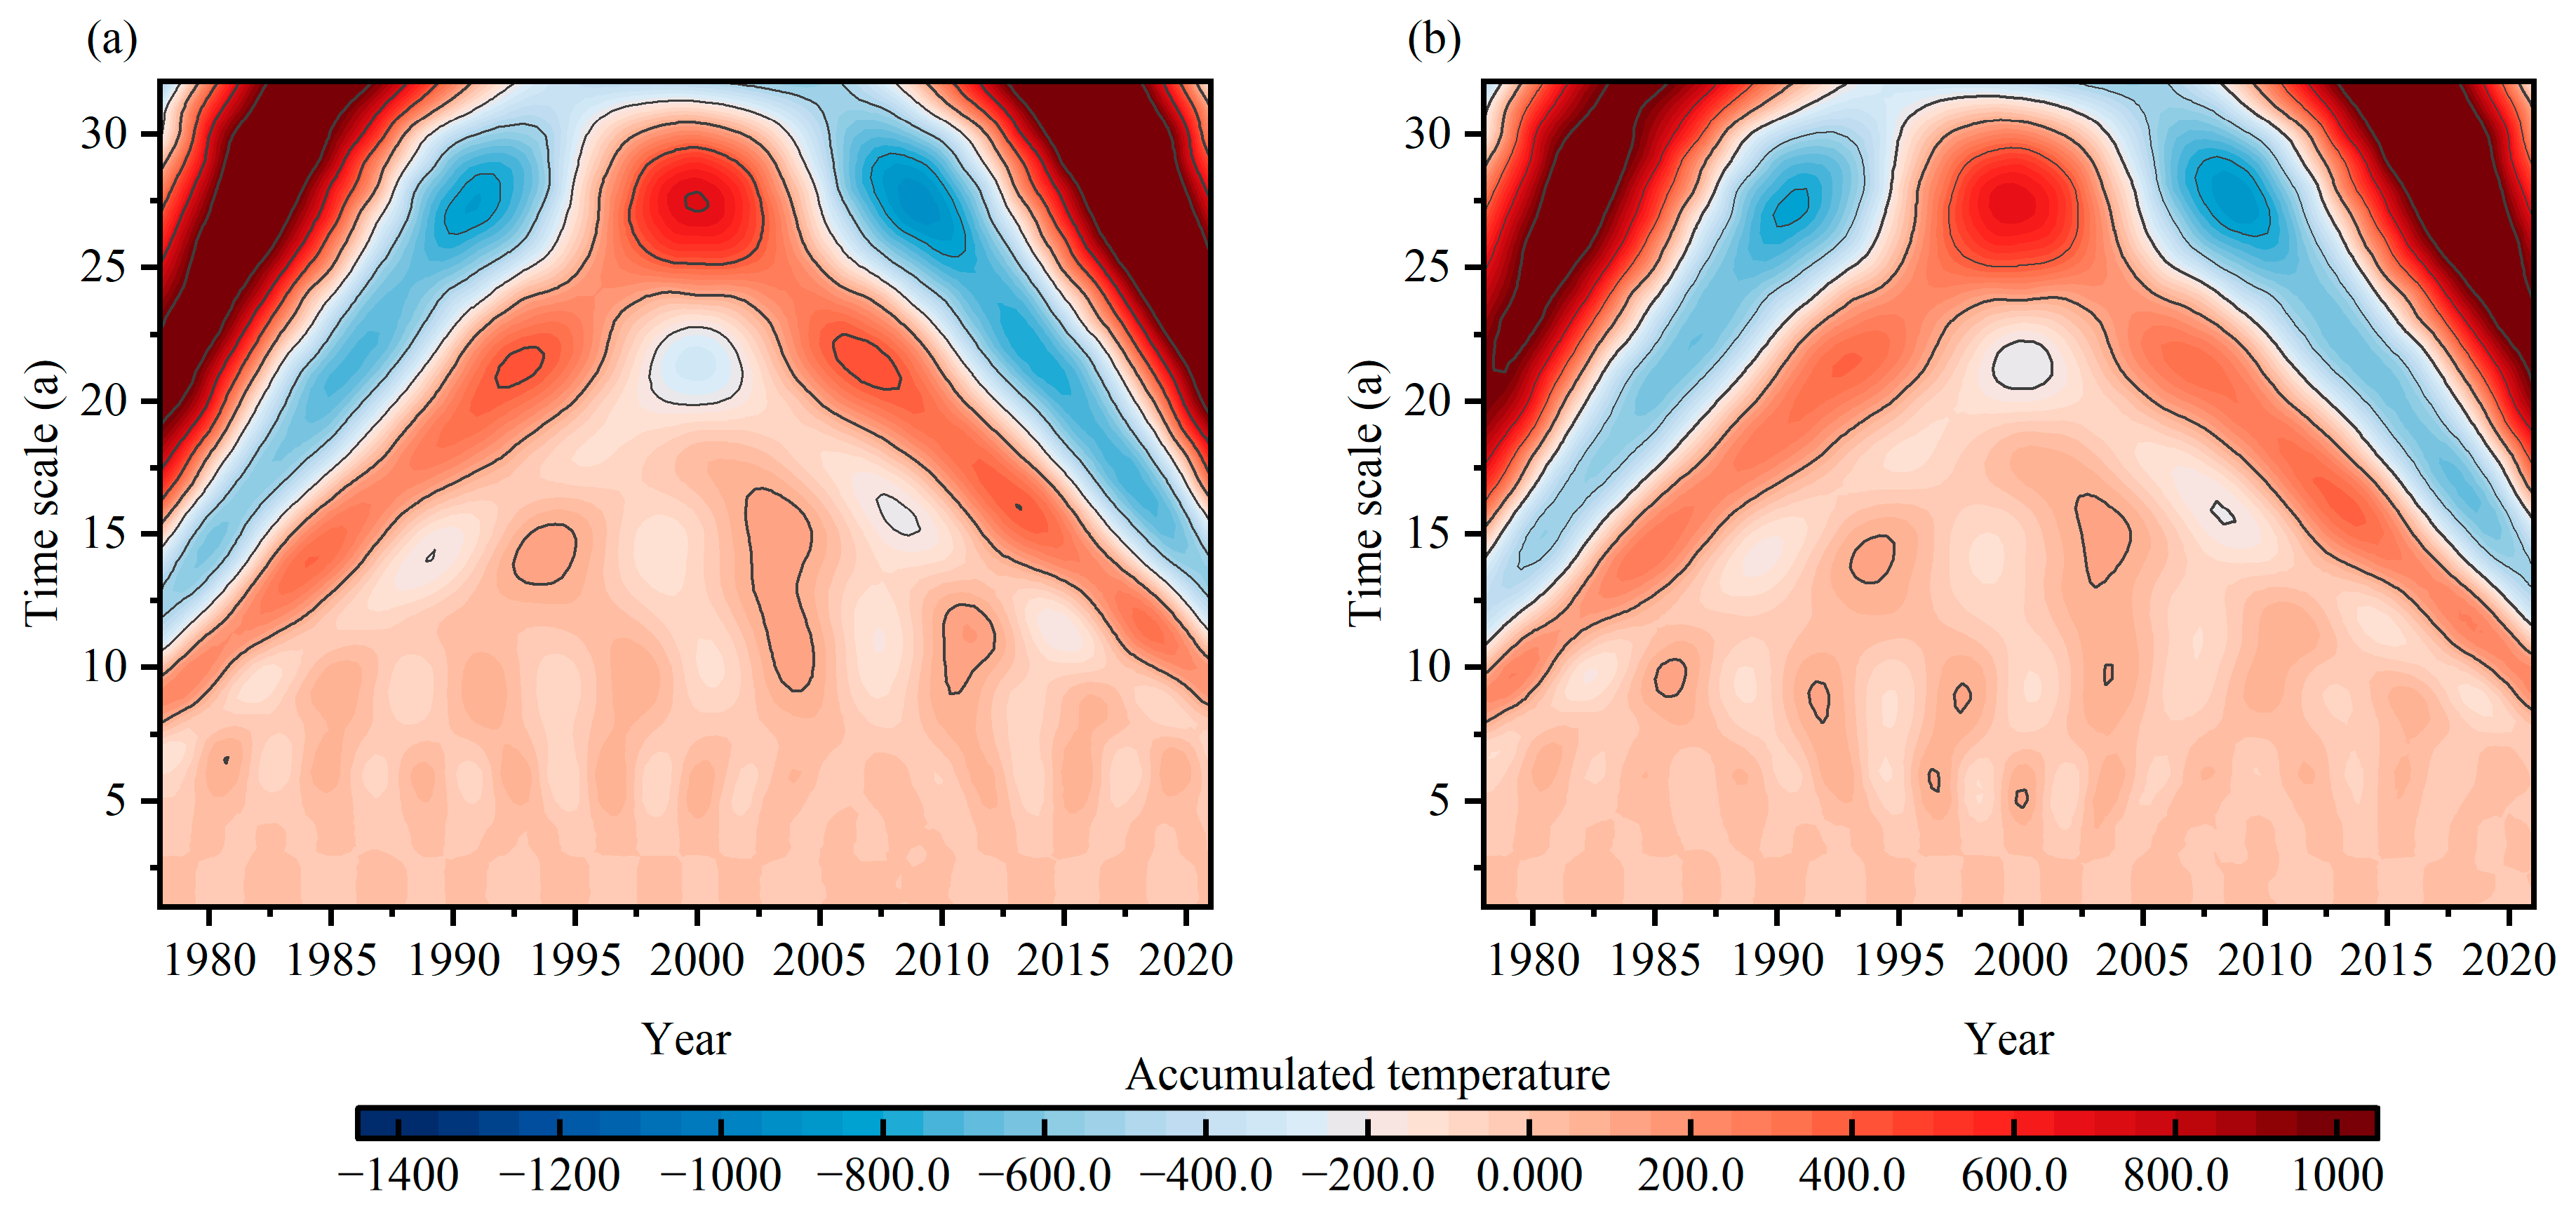
3.1.2. Variation Cycles
3.2. Variation Characteristics of Precipitation from 1978–2021
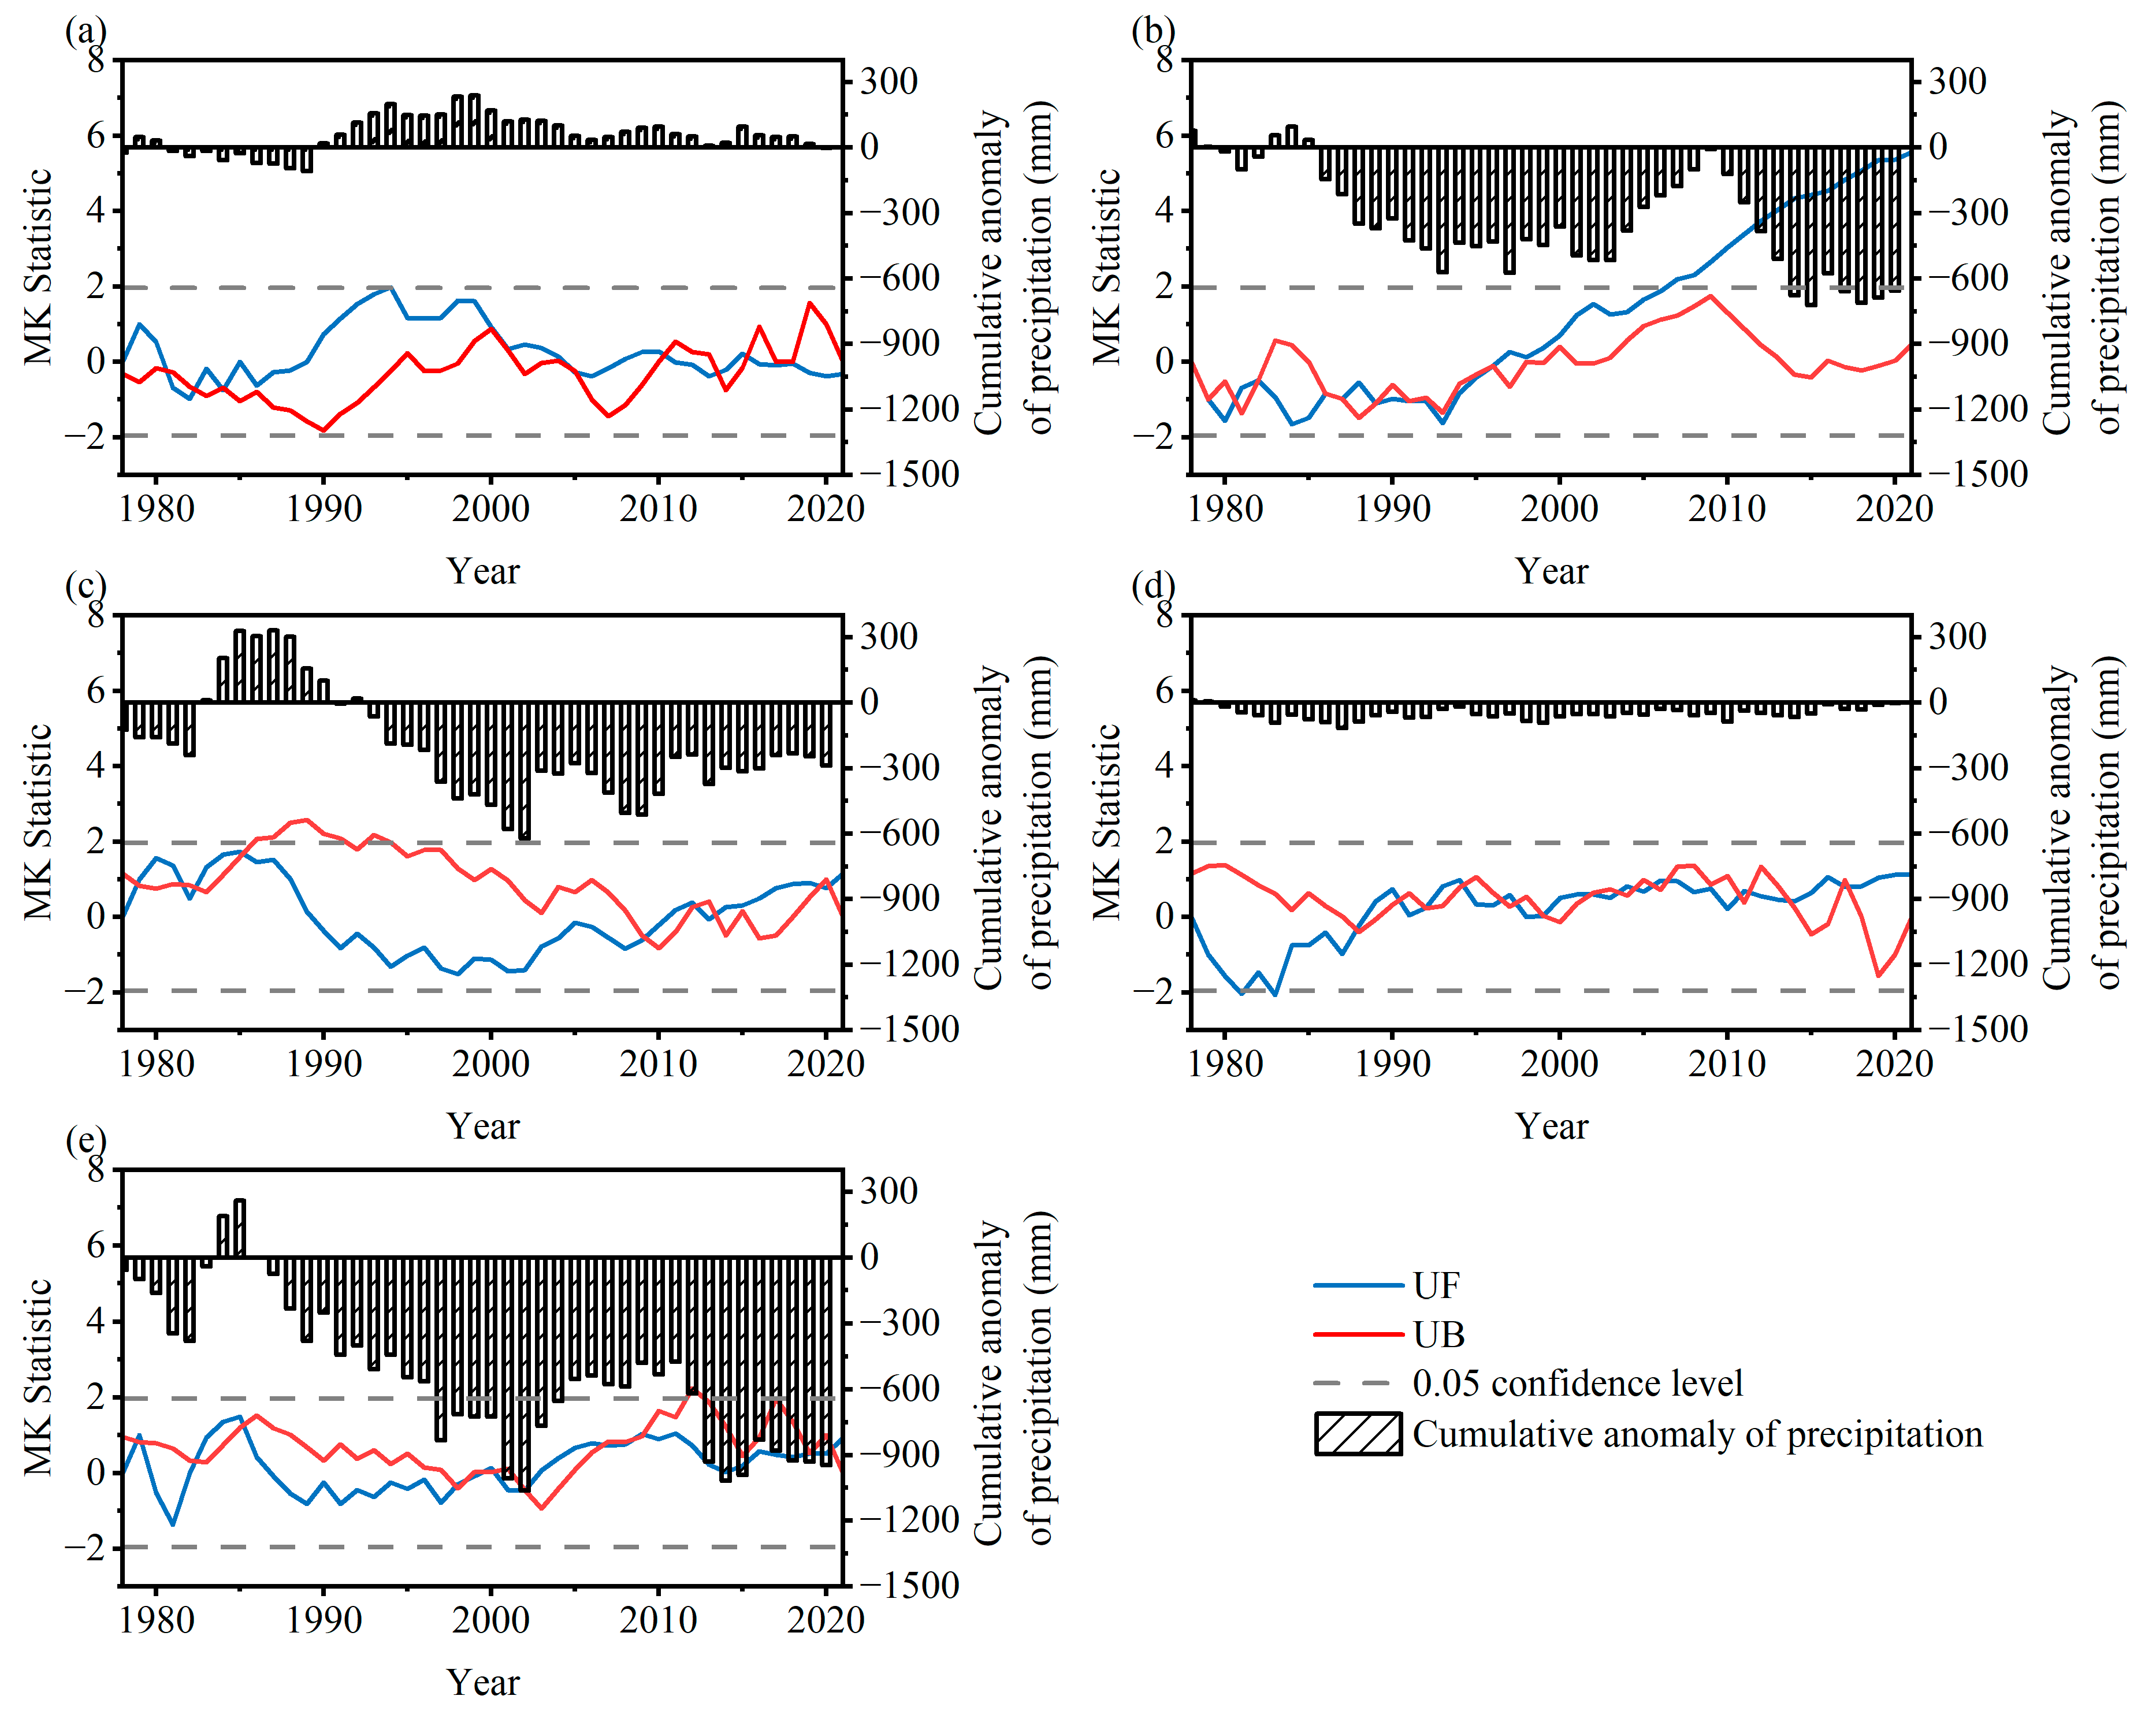
3.2.1. Variation Trends
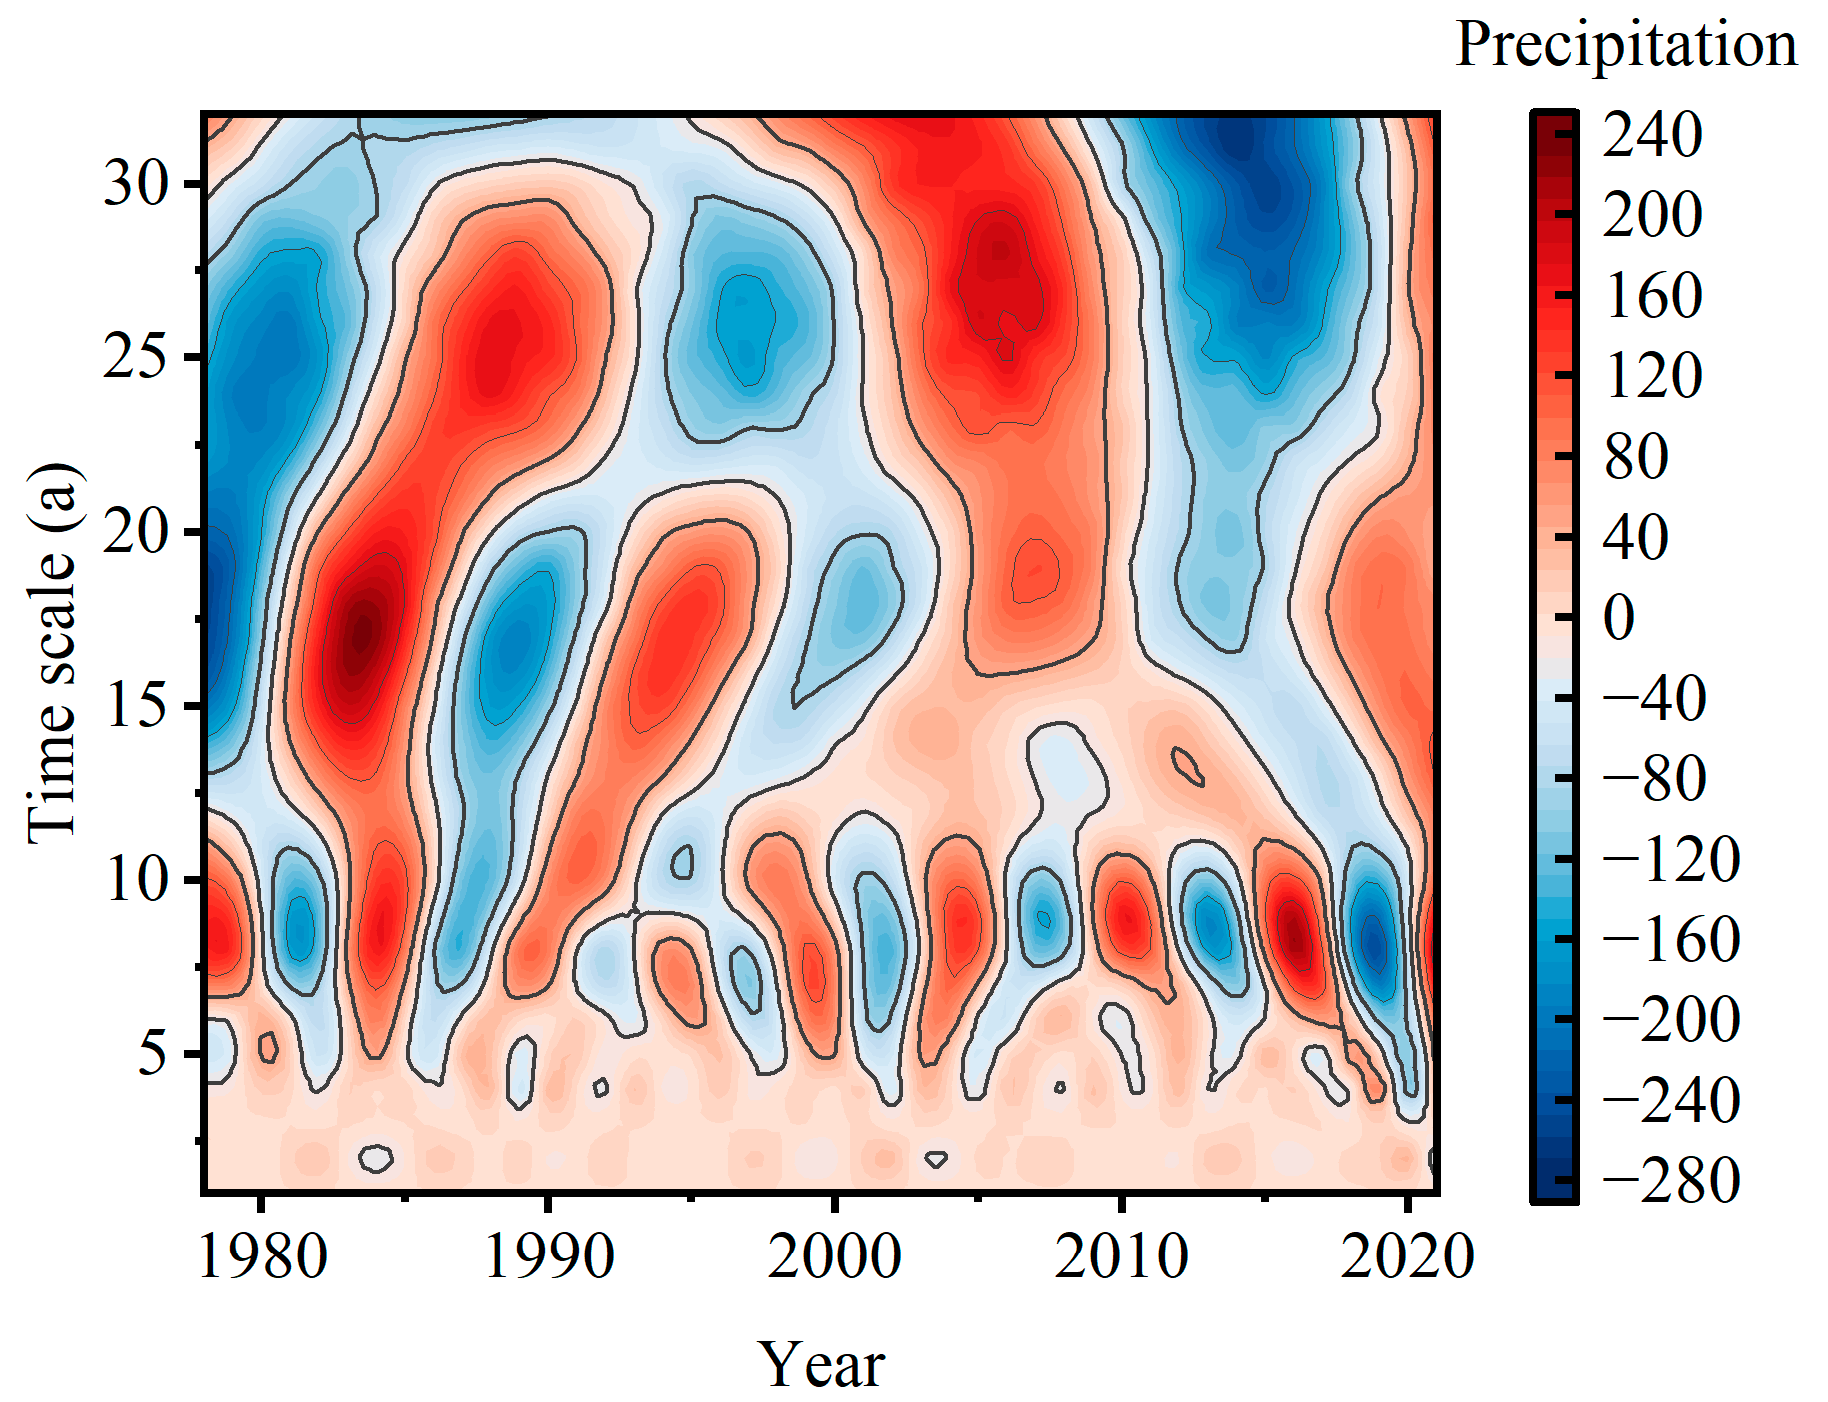
3.2.2. Variation Cycles
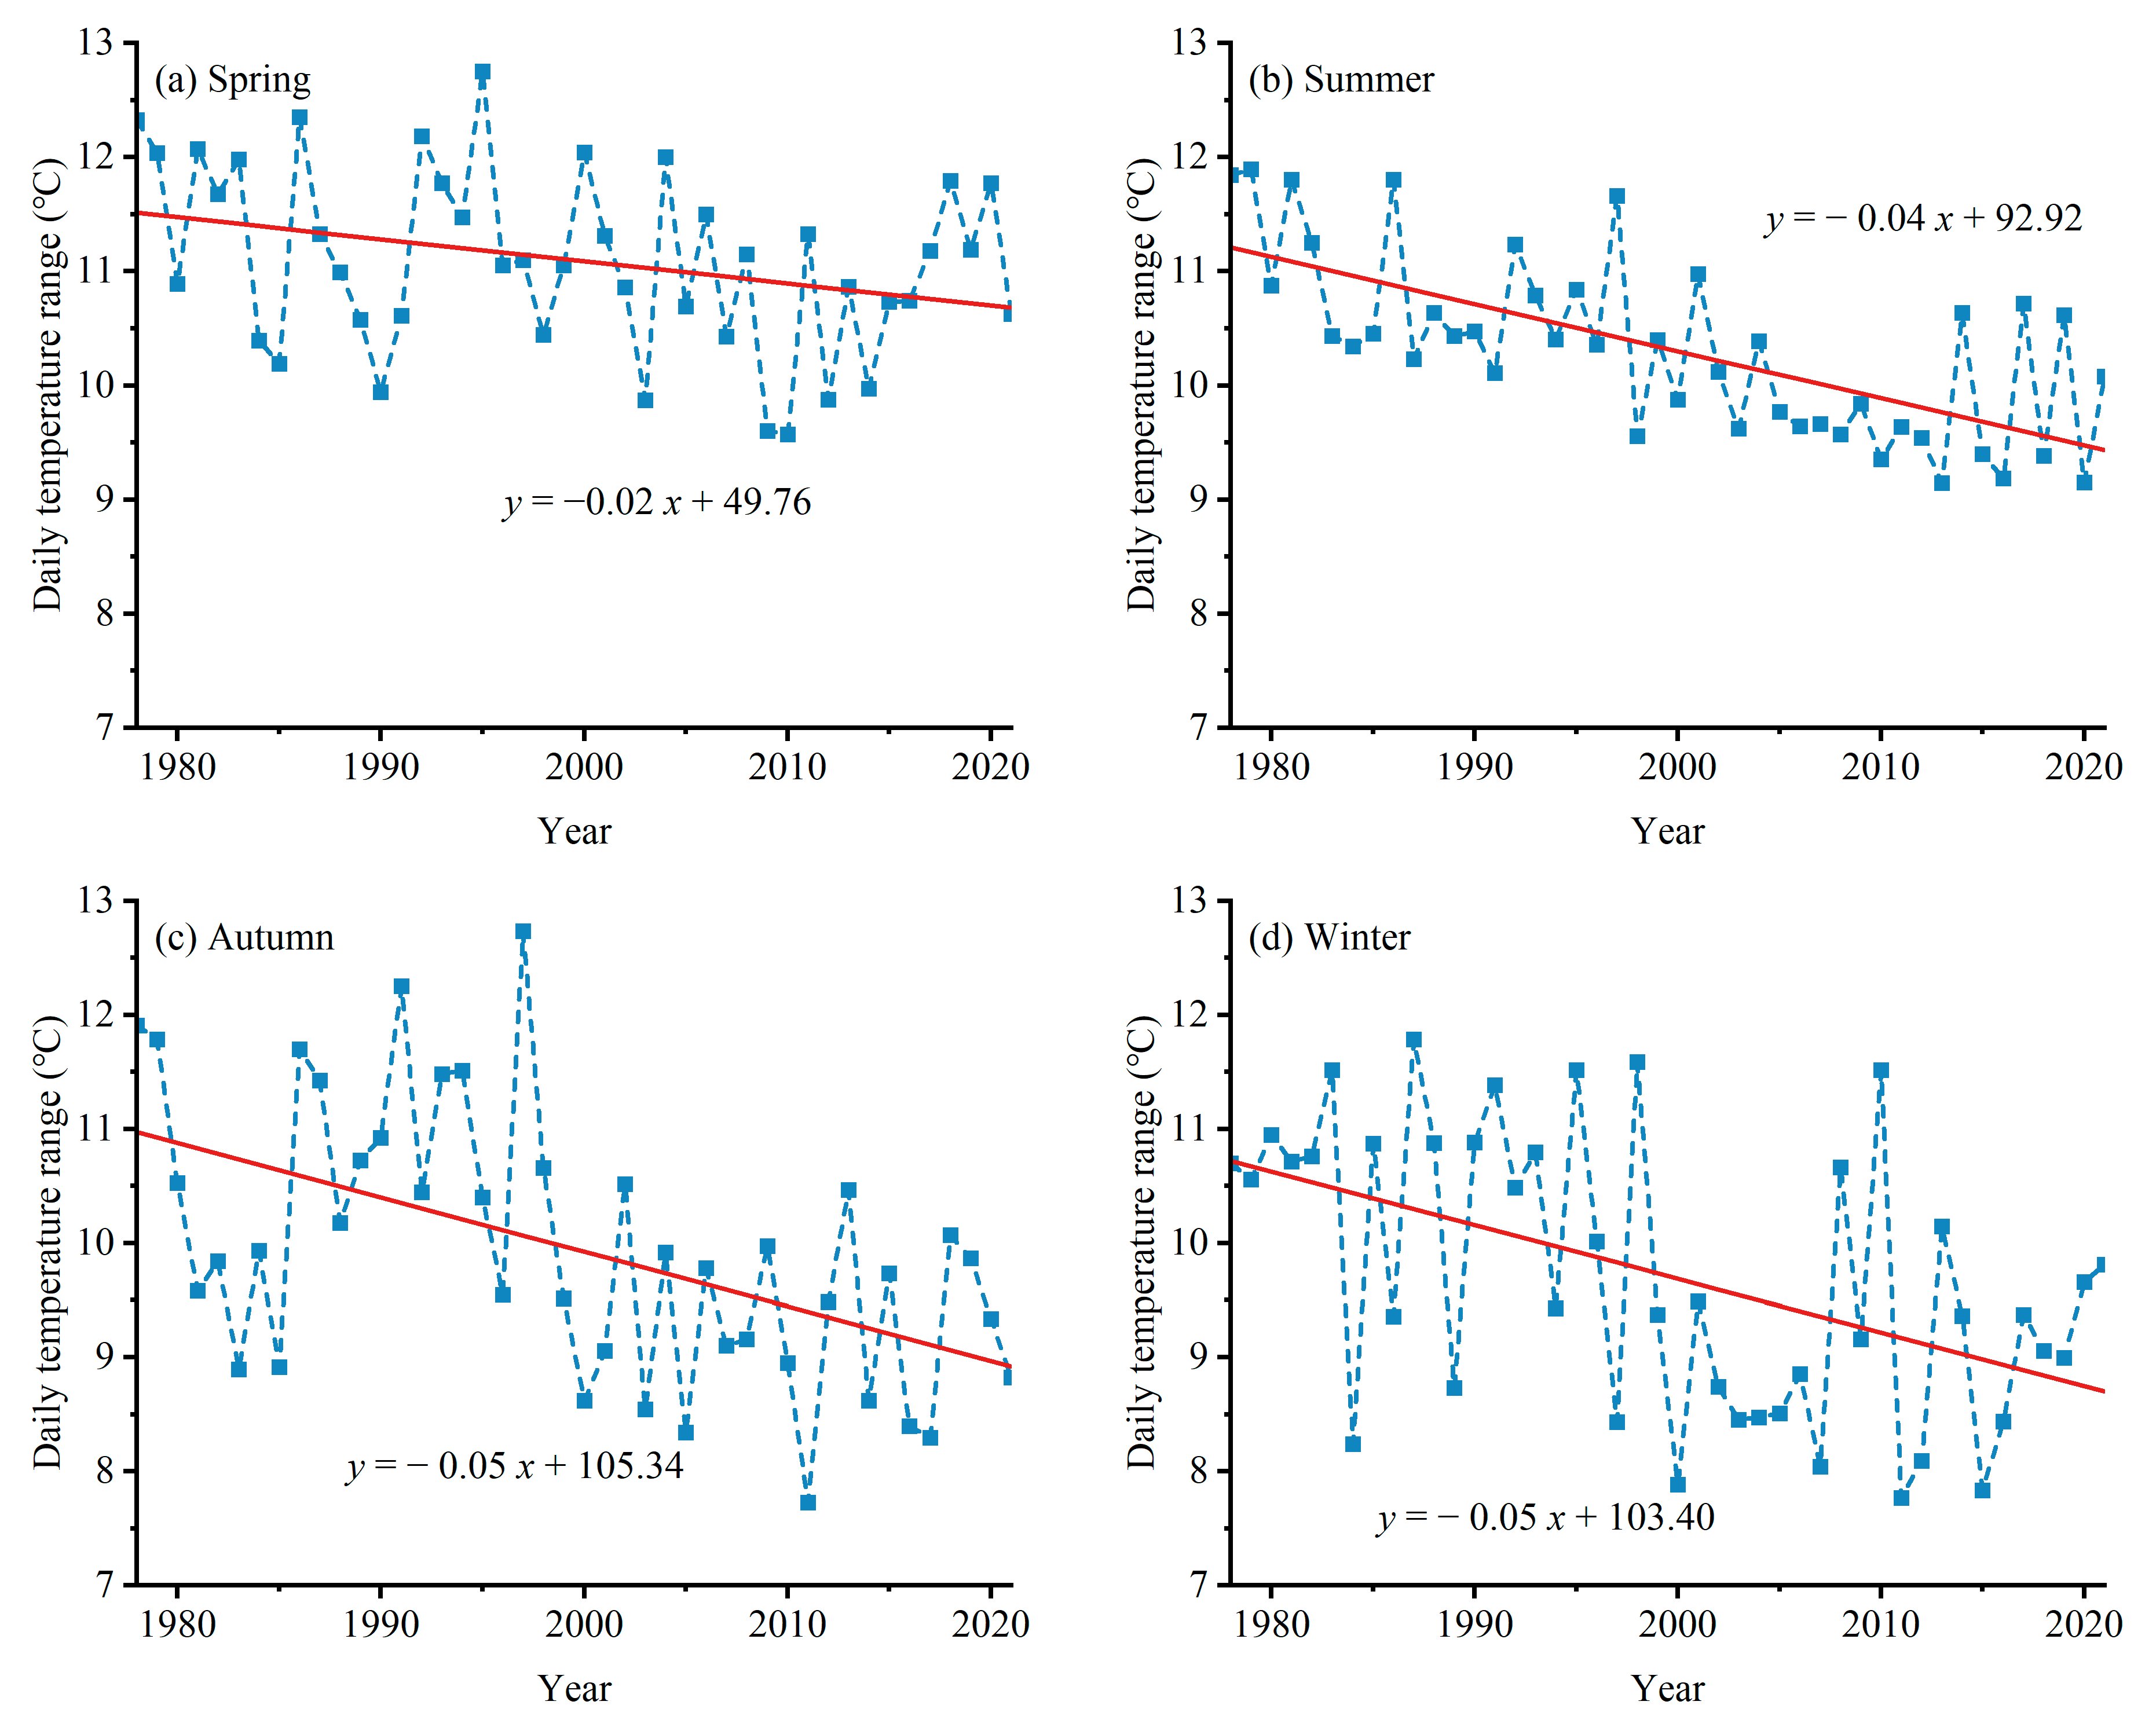
3.3. Variation Characteristics of the Extreme Temperature and Precipitation from 1978–2021
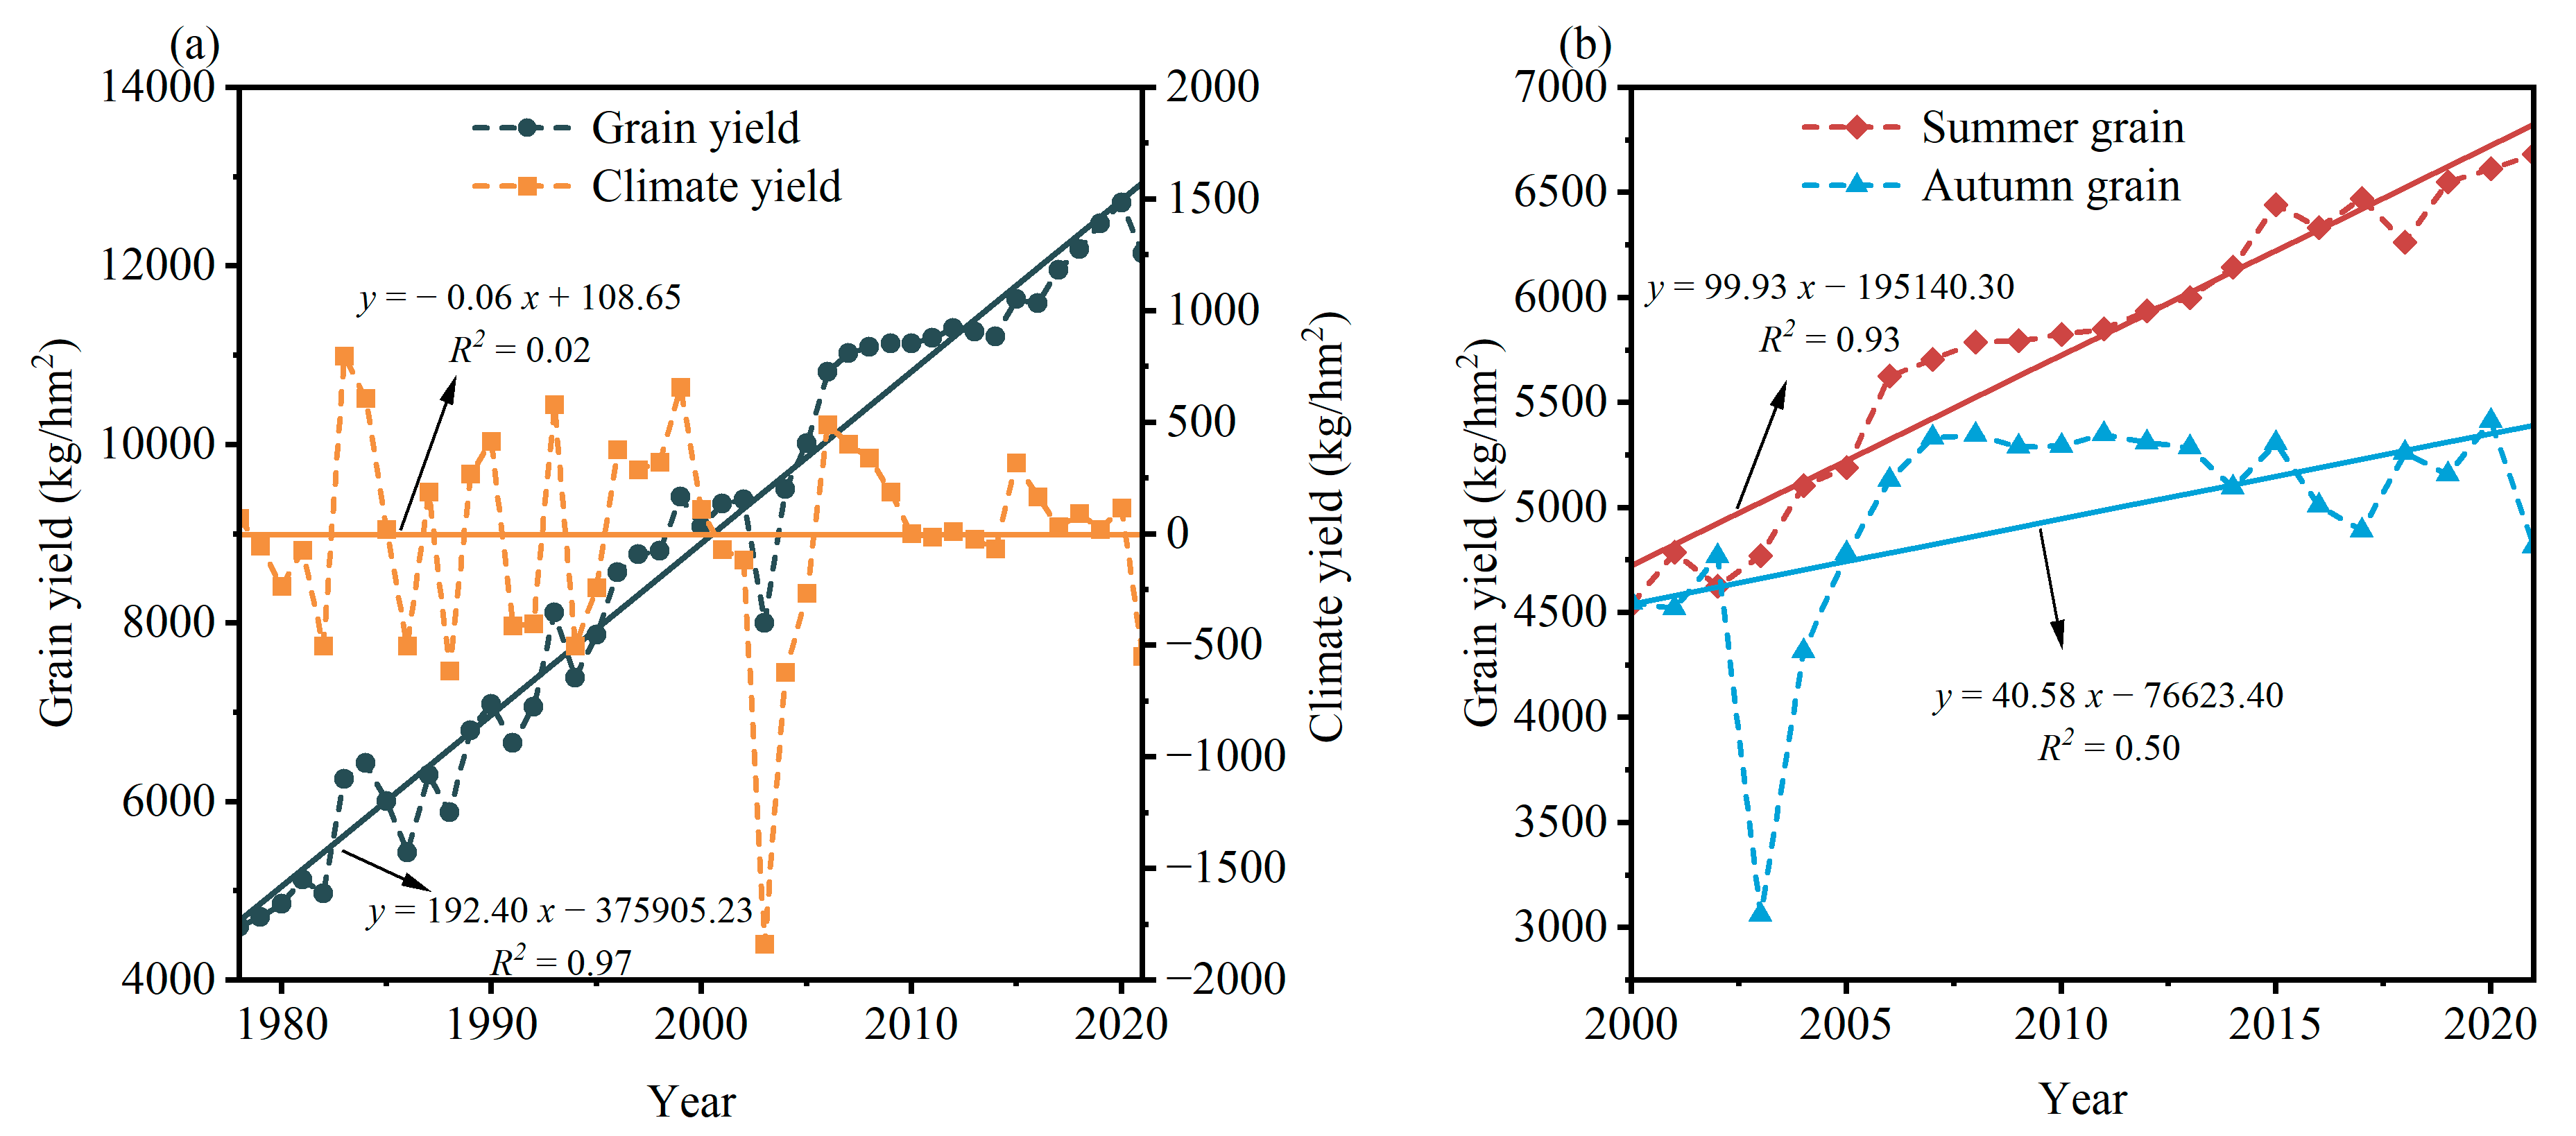
3.4. Variation Characteristics in the Grain Yield from 1978–2021
3.5. Correlation Analysis
4. Discussion
4.1. Variation Characteristics of Water and Thermal Elements
4.2. Effect of Climate Change on Grain Yield
4.3. Measures to Respond the Climate Change
5. Conclusions
Author Contributions
Funding
Institutional Review Board Statement
Informed Consent Statement
Data Availability Statement
Acknowledgments
Conflicts of Interest
References
- IIPCC. Climate Change 2021: The Physical Science Basis. Contribution of Working Group I to the Sixth Assessment Report of the Intergovernmental Panel on Climate Change; Masson-Delmotte, V., Zhai, P., Pirani, A., Connors, S., Péan, C., Berger, S., Caud, N., Chen, Y., Goldfarb, L., Gomis, M., et al., Eds.; Cambridge University Press: Cambridge, UK; New York, NY, USA, 2021. [Google Scholar]
- IPCC. Climate Change and Land: An IPCC Special Report on Climate Change, Desertification, Land Degradation, Sustainable Land Management, Food Security, and Greenhouse Gas Fluxes in Terrestrial Ecosystems; Shukla, P., Skea, J., Buendia, E.C., Masson-Delmotte, V., Pörtner, H.-O., Roberts, D.C., Zhai, P., Slade, R., Connors, S., van Diemen, R., et al., Eds.; Cambridge University Press: Cambridge, UK, 2019. [Google Scholar]
- Chen, T.; Bao, A.; Jiapaer, G.; Guo, H.; Zheng, G.; Jiang, L.; Chang, C.; Tuerhanjiang, L. Disentangling the relative impacts of climate change and human activities on arid and semiarid grasslands in Central Asia during 1982–2015. Sci. Total Environ. 2019, 653, 1311–1325. [Google Scholar] [CrossRef] [PubMed]
- Sui, Y.; Lang, X. Projected signals in climate extremes over China associated with a 2 °C global warming under two RCP scenarios. Int. J. Climatol. 2018, 38, e678–e697. [Google Scholar] [CrossRef]
- Huang, J.; Yu, H.; Han, D.; Zhang, G.; Wei, Y.; Huang, J.; An, L.; Liu, X.; Ren, Y. Declines in global ecological security under climate change. Ecol. Indic. 2020, 117, 106651. [Google Scholar] [CrossRef]
- Gay, C.; Estrada, F.; Conde, C.; Eakin, H.; Villers, L. Potential impacts of climate change on agriculture: A case of study of coffee production in Veracruz, Mexico. Clim. Chang. 2006, 79, 259–288. [Google Scholar] [CrossRef]
- Kumilachew, Y.; Hatiye, S. The dual impact of climate change on irrigation water demand and reservoir performance: A case study of Koga irrigation scheme, Ethiopia. Sustain. Water Resour. Manag. 2022, 8, 25. [Google Scholar] [CrossRef]
- Rudolf, R. The impact of maize price shocks on household food security: Panel evidence from Tanzania. Food Policy 2019, 85, 40–54. [Google Scholar] [CrossRef]
- Xu, D.; Li, Y.; Gong, S.; Zhang, B. Impacts of climate change on agricultural water management and its coping strategies. Trans. Chin. Soc. Agric. Eng. 2019, 35, 79–89. [Google Scholar]
- FAO; IFAD; UNICEF; WHO. Transforming Food Systems for Affordable Healthy Diets. In The Atate of Food Security and Nutrition in the World 2021; Food and Agriculture Organization of the United Nations: Rome, Italy, 2021. [Google Scholar]
- Dong, B.; Hu, Q.; Pan, X.; He, Q.; Jiang, H.; Qiao, Y.; Wang, X.; Wei, P.; Zhao, H.; Zhang, X. Spatiotemporal distribution and variation of heat resources in the Twenty-Four Solar Terms in North China Plain over the period 1961–2014. Chin. J. Agrometeorol. 2017, 38, 131–140. [Google Scholar]
- Hao, C.; Li, M. Spatio-temporal characters of ≥0 °C and ≥10 °C accumulated temperatures from 1960 to 2009 in Henan Province. Chin. J. Agric. Resour. Reg. Plan. 2019, 40, 89–95. [Google Scholar]
- He, W.; Bu, R.; Xiong, Z.; Hu, Y. Characteristics of temperature and precipitation in Northeastern China from 1961 to 2005. Acta Ecol. Sin. 2013, 33, 519–531. [Google Scholar] [CrossRef]
- Wang, F.; Liu, H.; Wu, D.; Wang, C.; Yao, S. Variation of effective accumulated temperature for winter wheat in North China Plain over the Past 30 years. Meteorol. Environ. Sci. 2017, 40, 20–27. [Google Scholar] [CrossRef]
- Zhang, Y.; Wu, B.; Guo, B. Characteristics of agro-meteorological climate resource during maize growing season under global climate change in Sichuan Province. Southwest China J. Agric. Sci. 2020, 33, 2102–2111. [Google Scholar] [CrossRef]
- Yu, Z.; Fan, G.; Hua, W.; Zhou, D.; Lai, X.; Liu, Y. Variation characteristics of season start dates over China under the global warming. Clim. Environ. Res. 2010, 15, 73–82. [Google Scholar]
- Huang, J.; Zhang, G.; Yu, H.; Wang, S.; Guan, X.; Ren, Y. Characteristics of climate change in the Yellow River basin during recent 40 years. J. Hydraul. Eng. 2020, 51, 1048–1058. [Google Scholar] [CrossRef]
- Lin, H.; Wang, J.; Huang, J.; Jiang, C. Climate drought in Huai River Basin under climate change. China Rural. Water Hydropower 2020, 6, 21–26+35. [Google Scholar]
- Dong, G.; Li, L.; Zheng, G. Changing trends of winter temperature in recent 53 years in Ningxia and impact for agriculture. Adv. Earth Sci. 2016, 31, 1172–1181. [Google Scholar]
- Hu, Q.; Dong, B.; Pan, X.; Jiang, H.; Pan, Z.; Qiao, Y.; Shao, C.; Ding, M.; Yin, Z.; Hu, L. Spatiotemporal variation and causes analysis of dry-wet climate over period of 1961-2014 in China. Trans. Chin. Soc. Agric. Eng. 2017, 33, 124–132+315. [Google Scholar]
- Hu, Q.; Pan, X.-B.; Shao, C.; Zhang, D.; Wang, X.; Wei, X. Distribution and variation of China agricultural heat resources in 1961–2010. Chin. J. Agrometeorol. 2014, 35, 119–127. [Google Scholar]
- Ren, G.; Ren, Y.; Zhan, Y.; Sun, X.; Liu, Y.; Chen, Y.; Wang, T. Spatial and temporal patterns of precipitation variability over mainland China: II Recent trends. Adv. Water Sci. 2015, 26, 451–465. [Google Scholar] [CrossRef]
- Duan, J.; Yuan, J.; Xu, X.; Ju, H. Interpretation of the IPCC AR6 report on agricultural systems. Clim. Chang. Res. 2022, 18, 422–432. [Google Scholar]
- Tao, F.; Zhang, Z.; Zhang, S.; Rötter, R.P.; Shi, W.; Xiao, D.; Liu, Y.; Wang, M.; Liu, F.; Zhang, H. Historical data provide new insights into response and adaptation of maize production systems to climate change/variability in China. Field Crops Res. 2016, 185, 1–11. [Google Scholar] [CrossRef]
- Zhang, Y.; Niu, H.; Yu, Q. Impacts of climate change and increasing carbon dioxide levels on yield changes of major crops in suitable planting areas in China by the 2050s. Ecol. Indic. 2021, 125, 107588. [Google Scholar] [CrossRef]
- Shaffril, H.; Krauss, S.; Samsuddin, S.F. A systematic review on Asian’s farmers’ adaptation practices towards climate change. Sci. Total Environ. 2018, 644, 683–695. [Google Scholar] [CrossRef] [PubMed]
- Zhao, R.; Wang, H.; Dong, Y. Impact of climate change on grain yield and its trend across Guanzhong region. Chin. J. Eco-Agric. 2020, 28, 467–479. [Google Scholar] [CrossRef]
- Gao, J.; Chu, B.; Yan, J.; Zhao, G. Estimation of climate production potential of corn and optimization of planting space in Henan Province from 1960. Trans. Chin. Soc. Agric. Mach. 2019, 50, 245–254. [Google Scholar]
- Zhang, R.; Ning, X.; Qin, Y.; Zhao, K.; Li, Y. Analysis of sensitivity of main grain crops yield to climate change since 1980 in Henan Province. Resour. Sci. 2018, 40, 137–149. [Google Scholar]
- Pang, Y.; Chen, C.; Guo, X.; Xu, F. Analysis of annual climate types and potential yield for single cropping rice in Southwest China during 1961–2015. J. Nat. Resour. 2021, 36, 476–489. [Google Scholar] [CrossRef]
- Yang, C.; Shen, W.; Li, H. Response of grain yield in Tibet to climate and cultivated land change during 1985–2010. Trans. Chin. Soc. Agric. Eng. 2015, 31, 261–269. [Google Scholar]
- Zai, S.; Feng, X.; Wu, F.; Li, L. Effect of time scales on probability of irrigation water requirement of farmland. Trans. Chin. Soc. Agric. Eng. 2018, 34, 96–102. [Google Scholar]
- Lu, S.; Liu, Y.; Long, H.; Guan, X. Agricultural Production Structure Optimization: A Case Study of Major Grain Producing Areas, China. J. Integr. Agric. 2013, 12, 184–197. [Google Scholar] [CrossRef]
- Kuang, B.; Lu, X.; Han, J.; Zhang, Z. Regional differences and dynamic evolution of cultivated land use efficiency in major grain producing areas in low carbon perspective. Nongye Gongcheng Xuebao/Trans. Chin. Soc. Agric. Eng. 2018, 34, 1–8. [Google Scholar] [CrossRef]
- Henan Provincial Bureau of Statistics. Henan Statistical Yearbook-2021; China Statistics Press: Beijing, China, 2021. [Google Scholar]
- Jiang, H. Agricultural Meteorology; Science Press: Beijing, China, 2008. [Google Scholar]
- Chang, Q.; Wang, J.; Yu, W.; Zhang, N.; Li, M.; Li, W.; Huang, M. Spatiotemporal variation and potential of heat use efficiency of wheat-maize rotation system in Henan Province. Resour. Sci. 2019, 41, 1176–1187. [Google Scholar]
- Zhou, B. Study on the Distribution and High Efficient Utilization of Resources for Double Cropping System in the Huang-Huai-Hai Plain. Ph.D. Thesis, China Agricultural University, Beijing, China, 2015. [Google Scholar]
- Li, Y.; Zhou, M. Variation trends in water requirement of cotton and sugar beet in Xinjiang under climate change scenarios. Trans. Chin. Soc. Agric. Eng. 2015, 31, 121–128. [Google Scholar]
- Wang, W.; Ding, J.; Li, Y. Hydrological Wavelet Analysis; Chemical Industry Press: Beijing, China, 2005. [Google Scholar]
- Liu, S.; Zhang, M.; Lan, H. Crop Yield Forecasting Methods; Meteorological Press: Beijing, China, 1987. [Google Scholar]
- Li, H.; Mao, L.; Mei, X.; Liu, Y.; Hao, W. Analysis on influencing factors of grain production fluctuation during the last 30 years in China. Chin. J. Agric. Resour. Reg. Plan. 2018, 39, 1–10+16. [Google Scholar]
- Mise, E.; Kim, T.-H.; Newbold, P. On suboptimality of the Hodrick–Prescott filter at time series endpoints. J. Macroecon. 2005, 27, 53–67. [Google Scholar] [CrossRef] [Green Version]
- Liu, S. Gray System Theory and Its Applications; Science Press: Beijing, China, 2017. [Google Scholar]
- Wang, Y.; Bo, Y.; Wang, C. Relations of cloud amount to asymmetric diurnal temperature change in Central and Eastern Qinghai-Xizang Plateau. Plateau Meteorol. 2016, 35, 908–919. [Google Scholar]
- Tao, F.; Zhang, Z. Adaptation of maize production to climate change in North China Plain: Quantify the relative contributions of adaptation options. Europ. J. Agron. 2010, 33, 103–116. [Google Scholar] [CrossRef]
- Xiao, D.; Liu, D.L.; Feng, P.; Wang, B.; Waters, C.; Shen, Y.; Qi, Y.; Bai, H.; Tang, J. Future climate change impacts on grain yield and groundwater use under different cropping systems in the North China Plain. Agric. Water Manag. 2021, 246, 106685. [Google Scholar] [CrossRef]
- Qiu, X.; Wang, J.; Zeng, Y.; Shi, G. Spatial and temporal variation characteristics of ≥10 °C accumulated temperature and their dominant factors from 1960 to 2013 in China. Jiangsu Agric. Sci. 2017, 45, 220–225. [Google Scholar] [CrossRef]
- Tan, J.; Piao, S.; Chen, A.; Zeng, Z.; Ciais, P.; Janssens, I.; Mao, J.; Myneni, R.; Peng, S.; Penuelas, J.; et al. Seasonally different response of photosynthetic activity to daytime and night-time warming in the Northern Hemisphere. Glob. Chang. Biol. 2014, 21, 377–387. [Google Scholar] [CrossRef]
- Zhao, Y.; Xiao, D.; Tang, J.; Bai, H. Effects of climate change on the yield of major grain crops and its adaptation measures in China. Reaearch Soil Water Conserv. 2019, 26, 317–326. [Google Scholar] [CrossRef]
- Asseng, S.; Martre, P.; Maiorano, A.; Rötter, R.P.; O’Leary, G.; Fitzgerald, G.; Girousse, C.; Motzo, R.; Giunta, F.; Babar, M.; et al. Climate change impact and adaptation for wheat protein. Glob. Chang. Biol. 2018, 25, 155–173. [Google Scholar] [CrossRef] [Green Version]
- Holst, R.; Yu, X.; Grün, C. Climate change, risk and grain yields in China. J. Integr. Agric. 2013, 12, 1279–1291. [Google Scholar] [CrossRef]
- Wu, J.; Zhang, J.; Ge, Z.; Xing, L.; Han, S.; Shen, C.; Kong, F. Impact of climate change on maize yield in China from 1979 to 2016. J. Integr. Agric. 2021, 20, 289–299. [Google Scholar] [CrossRef]
- Rosenzweig, C.; Elliott, J.; Deryng, D.; Ruane, A.C.; Muller, C.; Arneth, A.; Boote, K.J.; Folberth, C.; Glotter, M.; Khabarov, N.; et al. Assessing agricultural risks of climate change in the 21st century in a global gridded crop model intercomparison. Proc. Natl. Acad. Sci. USA 2014, 111, 3268–3273. [Google Scholar] [CrossRef] [Green Version]
- Wiebe, K.; Robinson, S.; Cattaneo, A. Climate change, agriculture and food security. In Sustainable Food and Agriculture; Elsevier: Amsterdam, The Netherlands, 2019; pp. 55–74. [Google Scholar] [CrossRef]
- Chen, X.; Wang, L.; Niu, Z.; Zhang, M.; Li, C.a.; Li, J. The effects of projected climate change and extreme climate on maize and rice in the Yangtze River Basin, China. Agric. For. Meteorol. 2020, 282–283, 107867. [Google Scholar] [CrossRef]
- Bai, Y.; Deng, X.; Jiang, S.; Zhao, Z.; Miao, Y. Relationship between climate change and low-carbon agricultural production: A case study in Hebei Province, China. Ecol. Indic. 2019, 105, 438–447. [Google Scholar] [CrossRef]
- Xiao, D.; Liu, D.L.; Wang, B.; Feng, P.; Bai, H.; Tang, J. Climate change impact on yields and water use of wheat and maize in the North China Plain under future climate change scenarios. Agric. Water Manag. 2020, 238, 106238. [Google Scholar] [CrossRef]
- Hardelin, J.; Lankoski, J. Climate change, water and agriculture: Challenges and adaptation strategies. EuroChoices 2015, 14, 10–15. [Google Scholar] [CrossRef]
- Rasmussen, L.; Coolsaet, B.; Martin, A.; Mertz, O.; Pascual, U.; Corbera, E.; Dawson, N.; Fisher, J.; Franks, P.; Ryan, C. Social-ecological outcomes of agricultural intensification. Nat. Sustain. 2018, 1, 275–282. [Google Scholar] [CrossRef] [Green Version]
- Hossain, A.; Skalicky, M.; Brestic, M.; Maitra, S.; Ashraful Alam, M.; Syed, M.A.; Hossain, J.; Sarkar, S.; Saha, S.; Bhadra, P.; et al. Consequences and Mitigation Strategies of Abiotic Stresses in Wheat (Triticum aestivum L.) under the Changing Climate. Agronomy 2021, 11, 241. [Google Scholar] [CrossRef]


| Time Scale | ≥0 °C Accumulated Temperature (°C/a) | ≥10 °C Accumulated Temperature (°C/a) | Precipitation (mm/a) |
|---|---|---|---|
| Spring | 7.516 * | 8.591 | −0.345 |
| Summer | 5.488 * | 5.497 * | 2.043 * |
| Autumn | 4.992 * | 5.785 * | 1.199 |
| Winter | 3.574 | 2.301 * | 0.306 |
| Year | 21.570 * | 22.175 * | 3.202 |
| Treatments | Time Scale | The First Main Cycle (a) | The Second Main Cycle (a) | The Third Main Cycle (a) |
|---|---|---|---|---|
| ≥0 °C accumulated temperature | Spring | 28 | 10 | |
| Summer | 28 | |||
| Autumn | 28 | |||
| Winter | 28 | |||
| Year | 28 | |||
| ≥10 °C accumulated temperature | Spring | 28 | 11 | |
| Summer | 28 | |||
| Autumn | 28 | |||
| Winter | 28 | |||
| Year | 28 | |||
| Precipitation | Spring | 8 | 21 | 13 |
| Summer | 18 | 30 | 9 | |
| Autumn | 29 | 15 | 6 | |
| Winter | 22 | 6 | 8 | |
| Year | 27 | 18 | 8 |
| Treatments | Extreme Temperature | Extreme Precipitation | |
|---|---|---|---|
| The Maximum Value of Daily Maximum Temperature | The Minimum Value of Daily Minimum Temperature | ||
| Spring | 0.07 * | 0.12 * | −0.12 |
| Summer | 0.03 * | 0.09 * | 1.69 |
| Autumn | 0.02 * | 0.09 * | −0.19 |
| Winter | 0 | 0.1 * | 0.15 * |
| Year | 0.03 * | 0.1 * | 1.69 |
| Time Scale | Yield Type | ≥0 °C Accumulated Temperature | ≥10 °C Accumulated Temperature | Precipitation | Daily Temperature Range | Extreme Precipitation |
|---|---|---|---|---|---|---|
| Year | Grain yield | 0.606 | 0.611 | 0.636 | 0.577 | 0.475 |
| Climate yield | 0.786 | 0.786 | 0.788 | 0.787 | 0.779 | |
| Spring-autumn-winter | Summer grain yield | 0.924 | 0.901 | 0.911 | 0.976 | 0.588 |
| Summer | Autumn grain yield | 0.959 | 0.964 | 0.926 | 0.946 | 0.901 |
Disclaimer/Publisher’s Note: The statements, opinions and data contained in all publications are solely those of the individual author(s) and contributor(s) and not of MDPI and/or the editor(s). MDPI and/or the editor(s) disclaim responsibility for any injury to people or property resulting from any ideas, methods, instructions or products referred to in the content. |
© 2023 by the authors. Licensee MDPI, Basel, Switzerland. This article is an open access article distributed under the terms and conditions of the Creative Commons Attribution (CC BY) license (https://creativecommons.org/licenses/by/4.0/).
Share and Cite
Feng, X.; Wu, F.; Zai, S.; Wang, D.; Zhang, Y.; Chai, Q. Characteristics and Impacts of Water–Thermal Variation on Grain Yield in the Henan Province, China, on Multiple Time Scales. Agronomy 2023, 13, 429. https://doi.org/10.3390/agronomy13020429
Feng X, Wu F, Zai S, Wang D, Zhang Y, Chai Q. Characteristics and Impacts of Water–Thermal Variation on Grain Yield in the Henan Province, China, on Multiple Time Scales. Agronomy. 2023; 13(2):429. https://doi.org/10.3390/agronomy13020429
Chicago/Turabian StyleFeng, Xuefang, Feng Wu, Songmei Zai, Donglin Wang, Yuzhong Zhang, and Qihui Chai. 2023. "Characteristics and Impacts of Water–Thermal Variation on Grain Yield in the Henan Province, China, on Multiple Time Scales" Agronomy 13, no. 2: 429. https://doi.org/10.3390/agronomy13020429